Article

GRACE/GFO and Swarm Observation Analysis of the 2023–2024 Extreme Drought in the Amazon River Basin

1
School of Architecture and Civil Engineering, Chengdu University, Chengdu 610106, China
2
National Precise Gravity Measurement Facility, Huazhong University of Science and Technology, Wuhan 430074, China
3
Key Laboratory of Polar Environment Monitoring and Public Governance (Wuhan University), Ministry of Education, Wuhan 430079, China
4
College of Natural Resources and Environment, South China Agricultural University, Guangzhou 510642, China
5
Key Laboratory of Earthquake Geodesy, Institute of Seismology, China Earthquake Administration, Wuhan 430071, China
6
Gravitation and Earth Tide, National Observation and Research Station, Wuhan 430071, China
*
Author to whom correspondence should be addressed.
Remote Sens. 2025, 17(16), 2765; https://doi.org/10.3390/rs17162765
Submission received: 12 June 2025 / Revised: 30 July 2025 / Accepted: 8 August 2025 / Published: 9 August 2025
(This article belongs to the Special Issue New Advances of Space Gravimetry in Climate and Hydrology Studies)

Abstract

The Amazon River Basin (ARB) experienced an extreme drought from summer 2023 to spring 2024, driven by complex interactions among multiple climatic and environmental factors. A detailed investigation into this drought is crucial in understanding the entire process of the drought. Here, we employ drought indices derived from the Gravity Recovery and Climate Experiment (GRACE), GRACE Follow-On (GFO), and Swarm missions to reconstruct the drought’s progression, combined with reanalysis datasets and extreme-climate indices to analyze atmospheric and hydrological mechanisms. Our findings reveal a six-month drought from September 2023, reaching a drought peak of −1.29 and a drought severity of −5.62, with its epicenter migrating systematically from the northwestern to southeastern basin, spatially mirroring the 2015–2016 extreme drought pattern. Reduced precipitation and abnormal warming were the direct causes, which were closely linked to the 2023 El Niño event. This event disrupted atmospheric vertical movements. These changes led to abnormally strong sinking motions over the basin, which interacted synergistically with anomalies in land cover types caused by deforestation, triggering this extreme drought. This study provides spatiotemporal drought diagnostics valuable for hydrological forecasting and climate adaptation planning.

1. Introduction

Droughts persist as a critical threat to global water security, ecosystems, and human societies, with their impacts escalating under climate change [1]. Amplified by global warming and escalating anthropogenic activities, the natural hydrological equilibrium has been disrupted, rendering climate–hydrological systems more fragile and complex. This transformation has triggered more frequent extreme climatic events, leading to droughts that are now more intense, frequent, and destructive than ever [2,3].
The Amazon River Basin (ARB) faced an unprecedented extreme drought in 2023. Starting in June, the basin experienced a pronounced precipitation (PRE) deficit, with rainfall levels plummeting to a 40-year low between July and September [4]. Concurrently, a sequence of heat waves from August to November drove sustained temperature surges, peaking at a record 41 °C during Brazil’s winter–spring transition, with maximum temperatures from mid-August to mid-November surpassing historical norms [5]. As the drought unfolded, its spatial extent expanded rapidly: initial impacts were confined to the northern region, but by September, aridity had spread across nearly the entire basin. Tributaries such as the Solimões, Negro, and Madeira rivers saw water levels plummet to 120-year lows [6], triggering cascading consequences: reservoir power generation halted, water scarcity emerged, hundreds of river-dependent communities were isolated, and massive aquatic organism die-offs occurred [7]. This event exemplified the interplay between natural climate phenomena and human-induced factors: while closely linked to the 2023 El Niño event, anthropogenic activities exacerbated its severity [8]. Given the ARB’s role as the world’s largest tropical rainforest—often termed the “lungs of the planet”—understanding this extreme drought offers critical insights into global climate change mechanisms and the teleconnections linking large-scale climate patterns to regional hydrological extremes.
Drought is typically a deficit caused by a reduction in the net input of terrestrial water storage due to climatic anomalies. Therefore, accurately quantifying changes in terrestrial water storage is a key indicator for precise drought assessment. Field observations, hydrological models, and satellite remote sensing are commonly used methods for drought monitoring. While ground-based observations can directly measure meteorological and hydrological variables, they are constrained by their point-based measurement nature and lack large-scale coverage. Additionally, observation stations are scarce in sparsely populated regions, particularly in the ARB [9]. Hydrological models can simulate various hydrometeorological variables, but their accuracy depends on the precision of input physical data and the rationality of mathematical models, resulting in significant uncertainties in simulation results [10]. Satellite remote sensing can provide observations with large coverage and high spatiotemporal resolution; however, it typically measures only water levels and shallow soil moisture (SM) [11,12]. Therefore, accurately quantifying changes in terrestrial water storage has long been a challenge in drought monitoring. The Gravity Recovery and Climate Experiment (GRACE) and GRACE Follow-On (GFO) satellites are highly sensitive to changes in the Earth’s gravitational field caused by terrestrial water storage changes induced by droughts. They can relatively precisely capture such subtle changes, thereby achieving the goal of accurately quantifying terrestrial water storage changes [13,14,15]. They also features all-weather and full-coverage capabilities, overcoming the limitations of traditional monitoring methods, and thus are well-suited for drought monitoring in medium- and large-scale river basins
The GRACE/GFO satellites detected a significant water storage deficit (WSD) in the central ARB in 2005 that was 10% below normal, and the results were validated by the PRE data based on satellite remote sensing and water level data from local hydrological stations [16]. This demonstrated the unique advantage of satellite gravity technology in monitoring large-scale droughts. Thomas et al. [17] proposed a quantitative methodology to assess drought occurrence and severity based on GRACE TWSC data and applied this approach to evaluate drought-induced WSD in the ARB from 2003 to 2014. Their results were corroborated by the Global Meteorological Drought Database. Niu et al. [18] used GRACE data to track the entire 2010 extreme drought event in the ARB, finding a strong correlation between the drought and the El Niño–Southern Oscillation (ENSO). Panisset et al. [19] compared three extreme droughts in the ARB (2005, 2010, and 2015), showing that the anomalous PRE deficit in 2015 exceeded previous drought events in both intensity and spatial extent, affecting more than 80% of the ARBPRE, with the eastern region being particularly severely impacted.
However, the GRACE/GFO mission ended in June 2017, and the GFO mission did not launch until April 2018, creating an 11-month gap (from July 2017 to May 2018) in the TWSC time series, which posed challenges for hydrological research [20]. The Swarm satellites, which cover this gap, have attracted interest due to their ability to detect Earth’s time-variable gravity signals through payloads like accelerometers and global navigation satellite system receivers [21,22]. Several studies have explored the potential and accuracy of using Swarm satellite data to monitor regional TWSCs. These studies found that Swarm satellites are particularly sensitive to long-wave components of gravity signals, making them capable of monitoring regional TWS changes [23,24,25,26,27]. Li et al. [28] applied Swarm data to assess TWS deficits from the 2015–2016 drought in the ARB, validating their findings against hydrological models and local station data. Cui et al. [29] identified 11 drought events in the ARB between 2003 and 2020 by integrating GRACE/GFO and Swarm observations. They found that the most severe droughts occurred in 2005, 2010, and 2015–2016, with low PRE being the direct cause and plains areas being more vulnerable to drought than mountain regions. Although the spatial resolution of Swarm satellites is lower than that of GRACE/GFO data and their background noise is higher than that of GRACE/GFO data, previous studies have shown that the spatial resolution of Swarm satellites does not affect the results of drought monitoring in large-scale river basins such as the Amazon River Basin. The impact of background noise can be greatly reduced by using 1000 km fan filtering [28,29].
When analyzing the impact of ENSO events on droughts, most previous studies simply calculated the correlation between the ENSO index and GRACE/GFO TWSC or drought indices, without elaborating on the operational mechanism. However, this requires interdisciplinary knowledge backgrounds and data integration [30,31]. Therefore, this study attempted to analyze the atmospheric vertical movement and water vapor transport in the ARB during the 2023–2024 extreme drought by combining vertical velocity data, wind speed, and relative humidity data and to explore the connection with ENSO events. Based on this, the main objectives and scopes of this study were as follows: (1) to integrate multi-source satellite gravity observation data to examine the spatiotemporal evolution characteristics of the 2023–2024 extreme drought in the ARB; (2) to quantify the terrestrial water storage (TWS) deficit during this drought and evaluate its impact; (3) to analyze the propagation path of the drought through the terrestrial water cycle by studying changes in TWS components; and (4) to investigate the impacts of atmospheric vertical movement and water vapor transport on drought events, as well as their connection with ENSO events, through vertical velocity and its anomalies, and vertically integrated water vapor flux and its divergence derived from wind speed and relative humidity data.

2. Study Area

The Amazon River (Figure 1), located in northern South America, is the world’s second-longest river and has the world’s highest river flow rate. Its river flow reaches 219,000 m3/s, accounting for 20% of the world’s river flow, and the basin area is 6,915,000 km2, accounting for 40% of the total area of South America. It flows through Peru, Ecuador, Colombia, Venezuela, Guyana, Suriname, Bolivia, and Brazil, and finally into the Atlantic Ocean off Brazil. Most of the ARB has a tropical rainforest climate, while the upper reaches have a highland mountainous climate. The average annual temperature is 27–28 °C and the average annual PRE is between 1500 and 2500 mm [32]. The ARB has the largest tropical rainforest in the world, with a great variety of plants, endemic species, and animals, especially arboreal ones. It is sparsely populated, with a total population of about 15 million, including 100,000 Indians living in the dense forests [33].

3. Data and Methods

3.1. Data

3.1.1. GRACE/GFO Data

Currently, GRACE/GFO solutions are available in two types: spherical harmonic (SH) coefficients and Mascon. Preprocessing is required to obtain 1° × 1° TWSC gridded data from the SH solution, which includes steps such as coefficient replacement, filter smoothing, de-striping correction, and glacier isostatic adjustment [15,34,35]. Additionally, the scale factor approach is applied to recover signal loss caused by coefficient truncation and error processing [36]. In contrast, the 1° × 1° TWSC gridded data from the Mascon solution can be directly extracted without any additional processing.
In our study, we used three SH solutions and two Mascon solutions. The three SH solutions were derived from the Center for Space Research at the University of Texas at Austin (CSR), the Helmholtz Centre Potsdam–German Research Centre for Geosciences (GFZ), and the Jet Propulsion Laboratory (JPL), labeled CSR-SH, GFZ-SH, and JPL-SH, respectively. The two Mascon solutions were provided by CSR and JPL, labeled CSR-M and JPL-M, respectively.

3.1.2. Swarm Data

In our study, the Swarm SH solution was provided by the International Combination Service for Time-Variable Gravity, which combines Swarm solutions from different institutions using variance component estimation to achieve the optimal solution. This combination includes solutions from four institutions: the Astronomical Institute at the Czech Academy of Sciences, the University of Bern, the Institute of Geodesy at the Graz University of Technology, and Ohio State University [37]. The process for calculating regional 1° × 1° TWSC gridded data using the Swarm SH solution is the same as that for the GRACE/GFO solution. The only difference is that the GRACE/GFO SH solution uses a 300 km Gaussian filter and a P3M6 polynomial filter, whereas the Swarm solution uses a 1000 km fan filter [29].

3.1.3. Global Precipitation Measurement (GPM) Data

GPM is a collaborative international satellite mission between the National Aeronautics and Space Administration and Japan Aerospace Exploration Agency that utilizes multiple sensors, satellites, and algorithms in combination with a satellite network and rain gauge inversion to obtain more accurate PRE data, which provides a global grid of half-hourly, daily, and monthly average PRE. Integrated multi-satellite retrievals for GPM is an algorithm for generating tertiary products for GPM that combines data from all passive microwave instruments in GPM to provide rainfall estimates [38]. In this study, we used 0.1° × 0.1° monthly total PRE gridded data to analyze the 2023 extreme drought in the ARB.

3.1.4. ERA5-Land Data

ERA5-Land is an enhanced reanalysis dataset of the global land component provided by medium-range weather forecasts based on ERA5, covering the period from January 1950 to the present. Reanalysis used the laws of physics to combine modeled data with observations from around the world to form a globally complete and consistent dataset. This provides a consistent view of water and energy cycles on land at a higher spatial resolution than ERA5 [39]. In this study, we extracted 0.1° × 0.1° monthly evapotranspiration (ET), SM, surface runoff and subsurface runoff gridded data from this dataset. ET data were used to calculate the natural net recharge (P-ET) and analyze the causes of drought, while SM, surface runoff, and subsurface runoff data were normalized to analyze the propagation of drought across different components of terrestrial water storage.

3.1.5. Drought Index Data

The standardized precipitation evapotranspiration index (SPEI) and the self-calibrating Palmer drought severity index (SCPDSI) are two commonly used drought indices in drought monitoring. Therefore, we calculated the correlation coefficients between these two drought indices and the GRACE-DSI drought index. The SPEI is a meteorological index used to monitor and analyze drought conditions. It combines PRE and potential ET data to provide a standardized measure of moisture deficit or excess [40]. The SCPDSI is an improvement on the original PDSI and is proposed to provide a more accurate and consistent measure of drought conditions in different regions. It takes into account SM, PRE, temperature and other meteorological factors, and through a self-calibration process, it adapts to changes in different climatic regions, overcoming the limitations of the original PDSI in its application to different climatic regions [41,42].
In addition to the two commonly used drought indices mentioned above, we also employed the comprehensive meteorological index (CMI), which is a multi-scalar drought monitoring tool based on the vine copula theory designed to capture the complex interactions among meteorological, agricultural, and hydrological droughts. Unlike traditional indices, it integrates multiple drought dimensions to quantify “super droughts”—extreme events where the superposition of different types of droughts amplifies negative impacts [43].
In this study, the monthly 0.5° × 0.5° SPEI and SCPDSI gridded data were from the Consejo Superior de Investigaciones Científicas and the Climate Research Unit at University of East Anglia, respectively, and the monthly 0.5° × 0.5° CMI gridded data were provided by Wang et al.’s team.

3.1.6. Climate Index

ENSO is a natural climate phenomenon in the tropical Pacific Ocean. The ENSO cycle consists of two major phases: El Niño and La Niña [44]. El Niño is a phenomenon of abnormally high sea surface temperature (SST) in the eastern equatorial Pacific Ocean that causes global climate anomalies, such as increased PRE along the west coast of South America, increased drought in the Indian Ocean and Australia, and warmer winters in North America [45]. In our study, the Niño3.4 index came from the National Oceanic and Atmospheric Administration. We undertook a 3-month averaging process on the Niño3.4 index.

3.1.7. ERA5 Data

ERA5 is the fifth-generation global climate reanalysis dataset released by the European Centre for Medium-Range Weather Forecasts, and it is one of the most widely used reanalysis products worldwide. Built on the latest version of ECMWF’s Integrated Forecasting System, it integrates massive global observational data (including satellite, ground stations, radiosondes, radars, etc.). Through four-dimensional variational assimilation technology, it achieves the optimal combination of observations and models, significantly improving the spatiotemporal consistency and accuracy of the data.
In our study, the monthly 0.5° × 0.5° vertical velocity (VV), specific humidity, u-wind and v-wind grid data were used to analyze atmospheric movement and water vapor transport during the drought. VV anomalies were obtained by subtracting the corresponding climatological mean value from the 30-year-based VV data.
The datasets in our study are listed in Table 1.

3.2. Method

3.2.1. Improvement in TWSC Uncertainty

The TWSC results based on different GRACE/GFO solutions exhibit some inconsistencies due to variations in data processing models and parameters [46]. These inconsistencies increased the uncertainty of our results, making it crucial to evaluate the uncertainties of the different GRACE/GFO solutions and improve the reliability of the GRACE/GFO TWSC data. Since there is no true value for TWSC, we applied the generalized three-cornered hat approach to assess the uncertainties of the five GRACE/GFO TWSC results. This approach is particularly useful, as it does not require any prior information [47]. Following this, the five GRACE/GFO TWSC results were integrated using a least-squares method weighted according to the uncertainty estimates. The specific methodological principles and steps were as follows [48].
1.
Uncertainty assessment of TWSC
Suppose there are N different observation series. If any one set of observation series is selected as the reference series, the difference series between the remaining observation series and the reference series can be expressed in matrix form as:
Y = y 11 y 12 y 1 N 1 y 21 y 22 y 2 N 1 y M 1 y M 2 y M N 1
where y i , j i = 1 , 2 , , M ; j = 1 , 2 , , N 1 indicates the difference between the elements of the reference series and the corresponding elements of the observation series and M indicates the number of elements in the observation series.
The covariance matrix corresponding to the difference matrix is:
S = s 11 s 12 s 1 N 1 s 21 s 22 s 2 N 1 s N 1 1 s N 1 2 s N 1 N 1
where s i , k indicates the covariance or variance in the corresponding difference elements. Introducing the N × N noise covariance matrix R, its relationship with S is:
S = J × R × J T
where the matrix J and R is:
J N 1 , N = 1 0 0 1 0 1 0 1 0 0 0 1
It can be obtained from Equation (3) that the following relationship holds:
r i j = s i j r N N + r i N + r j N
Since there are N × N + 1 / 2 unknown parameters, but only N × N 1 / 2 equations, Formula (5) cannot be solved. Therefore, the remaining N free parameters need to be obtained with a reasonable approach to derive a unique solution. The free parameters were estimated by minimizing the “global correlation” of all observation series while ensuring the positive definiteness of R . This involved introducing the mean-squared value of the sum of squares of the off-diagonal elements in the upper-right corner of R , defined as:
G r i N 2 = 1 N i < k N r i j 2
Substituting Equation (6) into Equation (7), we can obtain:
G r i N 2 = 1 N i < k N r i j 2 = 1 N i < k N r i N 2
Considering the constraint conditions, it is necessary to define an appropriate objective function and minimize it to determine the N free parameters. The objective function is as follows:
F r 1 N , r N N = 1 K 2 i < k N r i j 2
To satisfy the constraint that R is a positive definite matrix, the initial values for iterative calculation are set as:
r i N 0 = 0 , i < N r N N 0 = 1 2 s , s = 1 , , 1 S 1 1 , , 1 T
Minimizing Equation (9) under the constraint conditions (Equation (8)) yields a set of solutions for the free parameters, which are the variances in uncertainties for different observation series.
2.
TWSC fusion
Based on the uncertainty of each TWSC series calculated by GTCH, their weights were assigned to the TWSC series. Then, these TWSC series were fused according to their weights:
T W S C f u s e = i = 1 F p i × T W S C i
where T W S C i and p i denote the TWSC value and its corresponding weight, F , denotes the number of TWSC series. The weights were determined according to the following expression:
p i = 1 / r i i n = 1 F 1 / r n n
where r i i denotes the variance of the i th TWSC series estimated by the GTCH method. The above process was performed grid by grid until we had fused the six datasets on all the grid nodes.

3.2.2. GRACE-Based Drought Severity Index (GRACE-DSI)

The influence of human activities on TWSC is mainly concentrated in the long-term trend term and the seasonal term reflects the climatological state of TWSC [49,50]. Thus, we used multiple linear regression fitting to decompose the original signal into a long-term trend signal, a seasonal signal, and a reference signal. The expression is as follows:
T W S C t = a 0 + a 1 t + a 2 cos 2 π t + a 3 sin 2 π t + a 4 cos 4 π t + a 5 sin 4 π t + ε
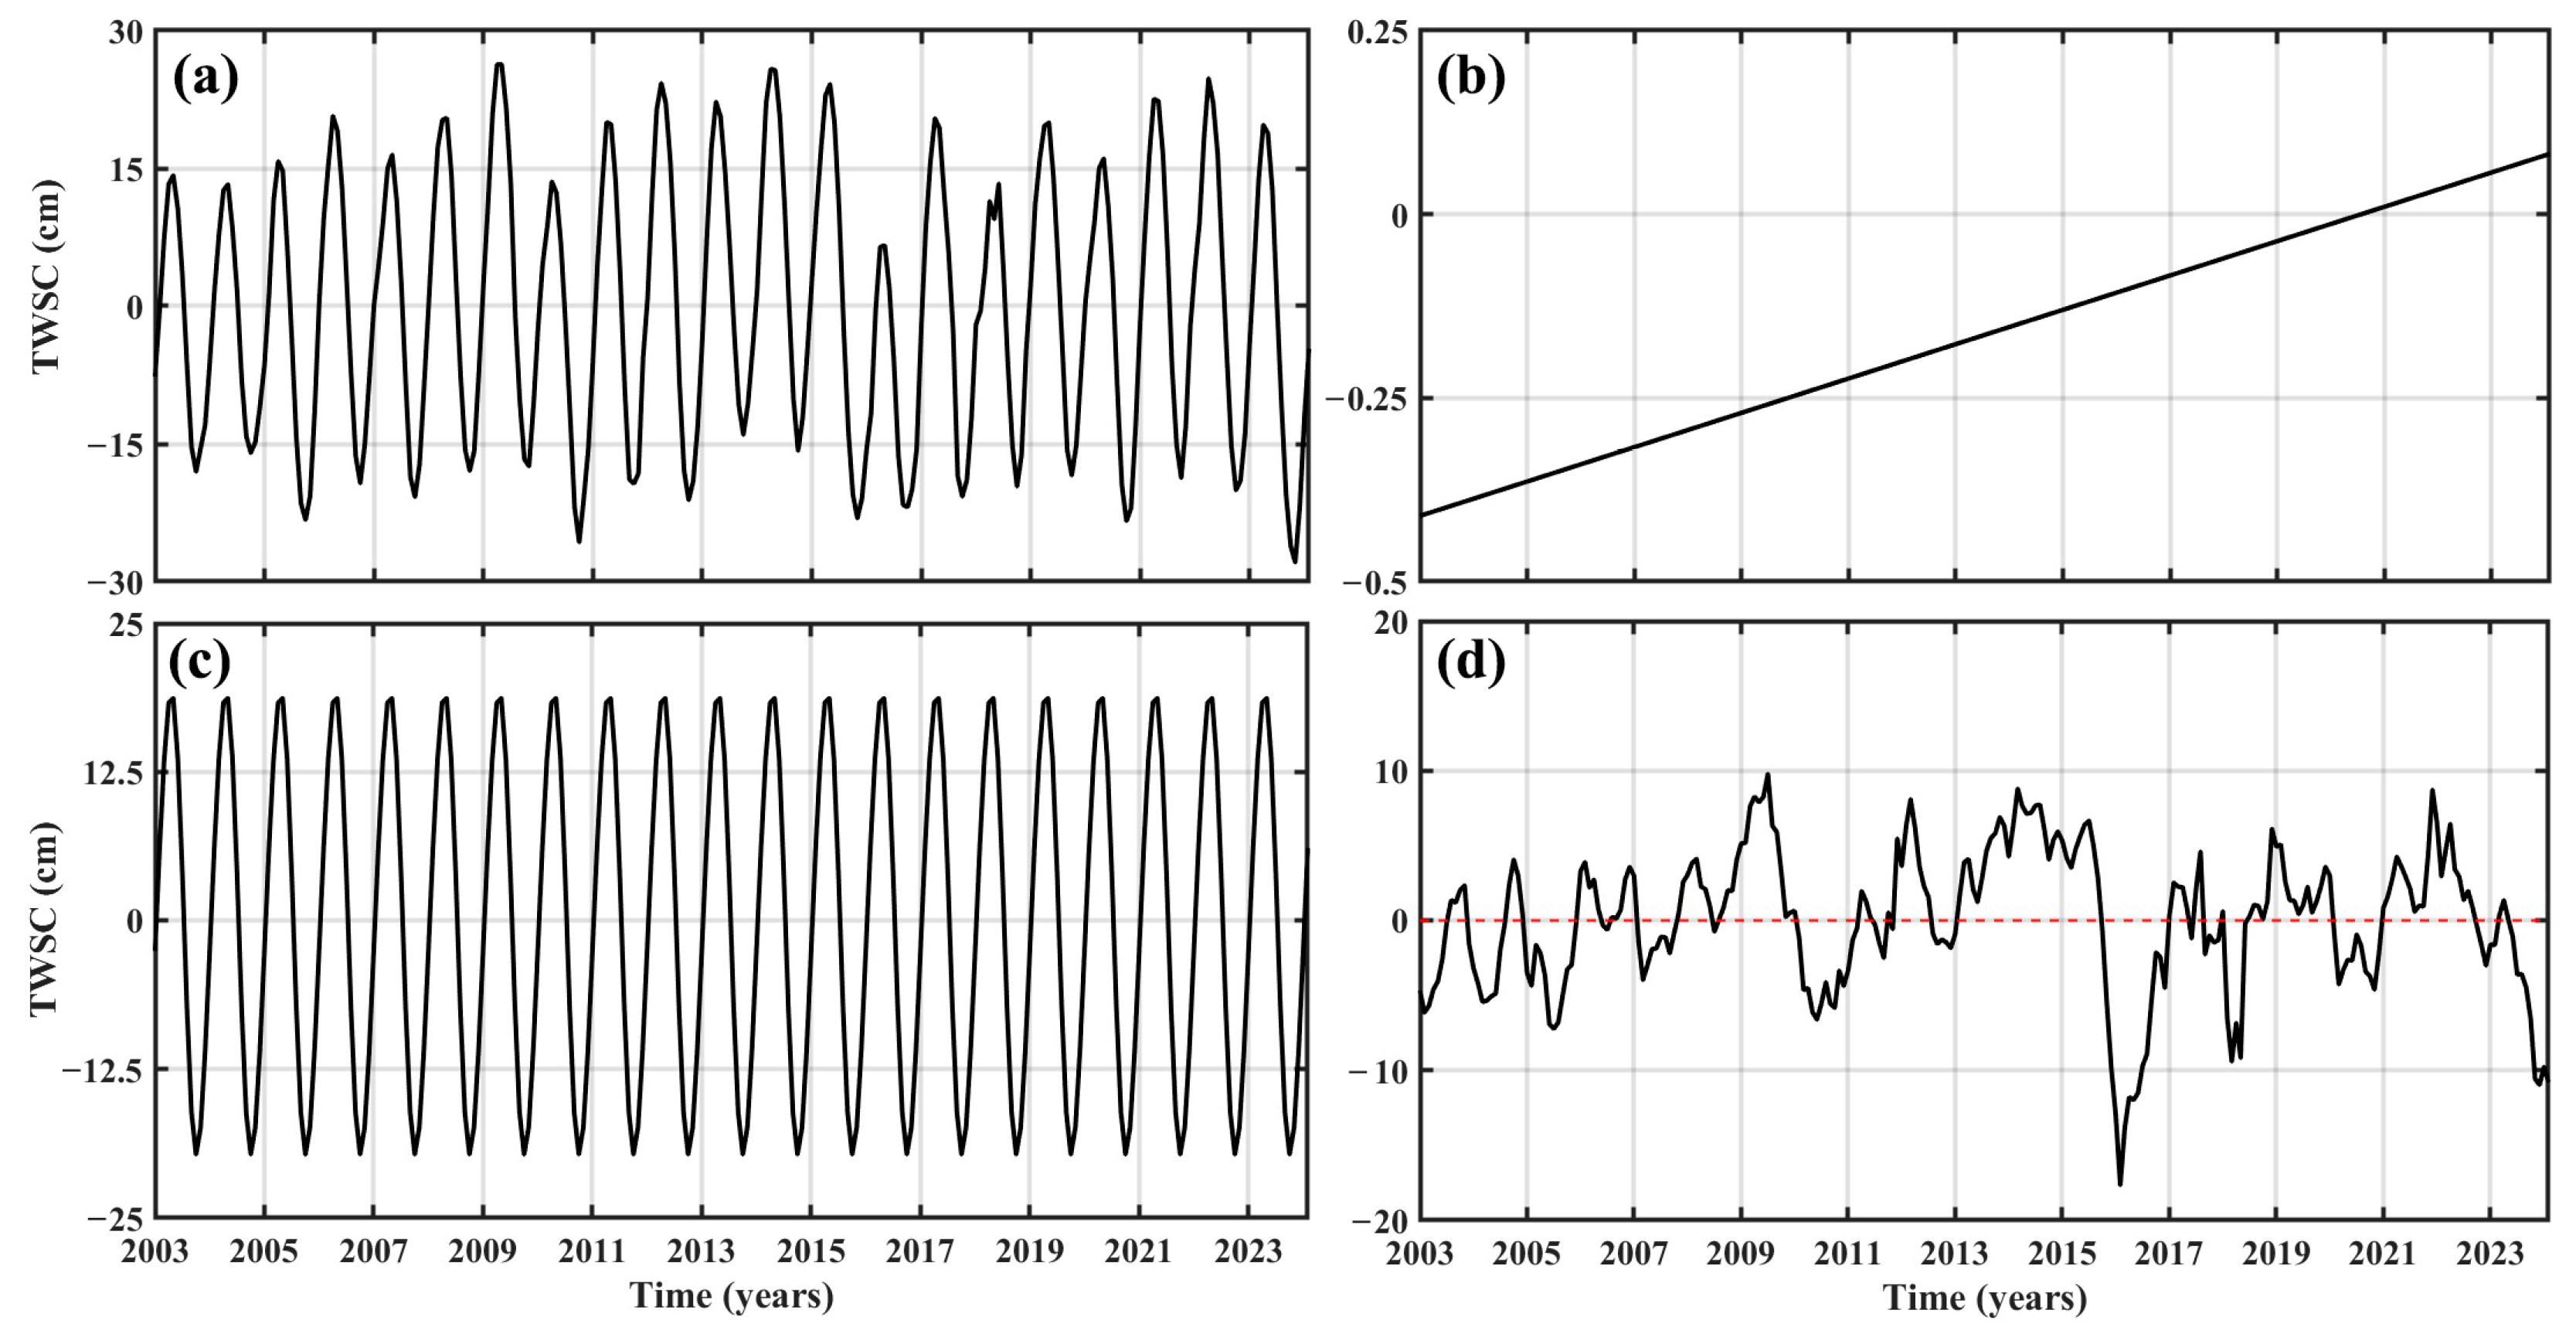
where T W S C t denotes the original signal, t denotes the time, ε denotes the residual signal, a 0 , a 1 , a 2 , a 3 , a 4 , a 5 denote the pending parameters, a 0 + a 1 t denotes the long-term trend signal, and a 2 cos 2 π t + a 3 sin 2 π t + a 4 cos 4 π t + a 5 sin 4 π t denotes the seasonal signal. The results of the time series decomposition are shown in Figure A1.
After decomposing TWSC using this method, the residual signal was obtained by subtracting the long-term trend signal and the seasonal signal from the original signal. We denoted this residual signal T W S C Re s i d u a l s . GRACE-DSI is an index that can be used to quantify droughts, whose expression is as follows [51]:
G R A C E D S I = T W S C Re s i d u a l s σ T W S C Re s i d u a l s
where σ T W S C Re s i d u a l s is the standard deviation of T W S C Re s i d u a l s . In our study, GRACE-DSI was used for monitoring and assessing the 2023 extreme drought in the ARB. We categorized drought into five classes based on GRACE-DSI values to quantify the degree of drought, and the details are shown in Table 2 [52]

3.2.3. Standardized Precipitation Index (SPI)

The SPI is an important indicator used in meteorological and hydrological fields to monitor droughts and precipitation anomalies. Based on the probability distribution of precipitation data, it quantitatively reflects the degree of deviation of precipitation from the long-term average by calculating the standardized value of cumulative precipitation over a certain period. Its specific calculation expression is as follows [53]:
S P I = W c 0 + c 1 W + c 2 W 2 1 d 1 W + d 2 W 2 + d 3 W 3
W = 2 ln P , P 0.5 2 ln 1 P , P > 0.5
where P is the cumulative probability of PRE exceeding the threshold value. c 0 , c 1 , c 2 , d 1 , d 2 , and d 3 are 2.52, 0.80, 0.01, 1.43, 0.19, and 0.0013, respectively.

3.2.4. Nash–Sutcliffe (NSE) Efficiency Coefficient

The NSE is a core evaluation index for hydrological models. It reflects the model’s ability to fit hydrological processes and is widely used to assess model accuracy. The closer its value is to 1, the higher the reliability of the model. In this study, it was used to evaluate the differences between TWSC results from Swarm and GRACE/GFO solutions. The specific calculation formula is as follows [26]:
N S E = 1 i = 1 n x i y i 2 i = 1 n x i x ¯ 2
where x and y represent the TWSC results from Swarm and GRACE/GFO solutions, respectively; n represents the number of x and y ; x i and y i represent the i th value of x and y , respectively; and x ¯ represent the average values of x .

3.2.5. Drought Characteristics

In this study, we based the definition of drought on GRACE-DSI, that is, a drought is considered to have occurred in a region if the monthly GRACE-DSI is less than −0.5 [31]. Drought assessment indicators include duration, drought severity, peak, and drought area ratio (DAR) [17]. Duration denotes the total number of months of a drought, peak denotes the maximum GRACE-DSI during the drought, and DAR denotes the ratio of area subject to drought to total area. Depending on the DAR, the drought can be divided into four categories, as shown in Table 3 [54,55].
The expression of drought severity is as follows [56]:
S = D ¯ × M
where S , D ¯ , and M denote the drought severity, the average GRACE-DSI during the drought, and the drought duration up to the calculation month, respectively

3.2.6. Migration of the Center of Gravity

The trajectory of the drought center of gravity through the spatiotemporal migration of the geometric center intuitively reflects the diffusion path and contraction trend of the drought range. By tracking the trajectory, researchers can identify the “hotspot paths” of drought propagation, and the spatiotemporal changes of the trajectory provide a mathematical basis for predicting the future expansion direction of drought [57]. The drought center of gravity formula is shown below [31]:
X = i = 1 n G R A C E D S I i · X i i = 1 n G R A C E D S I i , Y = i = 1 n G R A C E D S I i · Y i i = 1 n G R A C E D S I i
where X and Y are the latitude and longitude of the center of gravity of the drought, respectively, and X i , Y i , and G R A C E D S I i , are the latitude, longitude, and GRACE-DSI value of grid points, respectively.

3.2.7. Vertical Integrated Water Vapor Flux (VIWVF) and Water Vapor Flux Divergence

VIWVF refers to the mass of water vapor passing through a vertical air column of unit width (from the surface to the top of the atmosphere, such as 1000–300 hPa) per unit time, which reflects the direction and intensity of atmospheric moisture transport [58]. Its calculation formula is as follows:
f u = 1 g p t o p p s u r f q · u d p , f v = 1 g p t o p p s u r f q · v d p
where f u and f v are zonal and meridional VIWVF, respectively, g is gravitational acceleration, with a value of 9.81 m/s2, q is specific humidity, and p s r u f and p t o p are the air pressure from the surface to the top of the atmosphere, with values of 1000 hPa and 100 hPa, respectively.
Water vapor flux divergence refers to the rate of water vapor convergence (negative divergence) or divergence (positive divergence) within an air column, which directly determines the potential for PRE [59]. The expression is as follows:
d i v W V F = f u x + f v y
where d i v W V F is the water vapor flux divergence and x and y correspond to the longitude and latitude directions, respectively.

4. Results

4.1. Continuous TWSC Time Series Construction

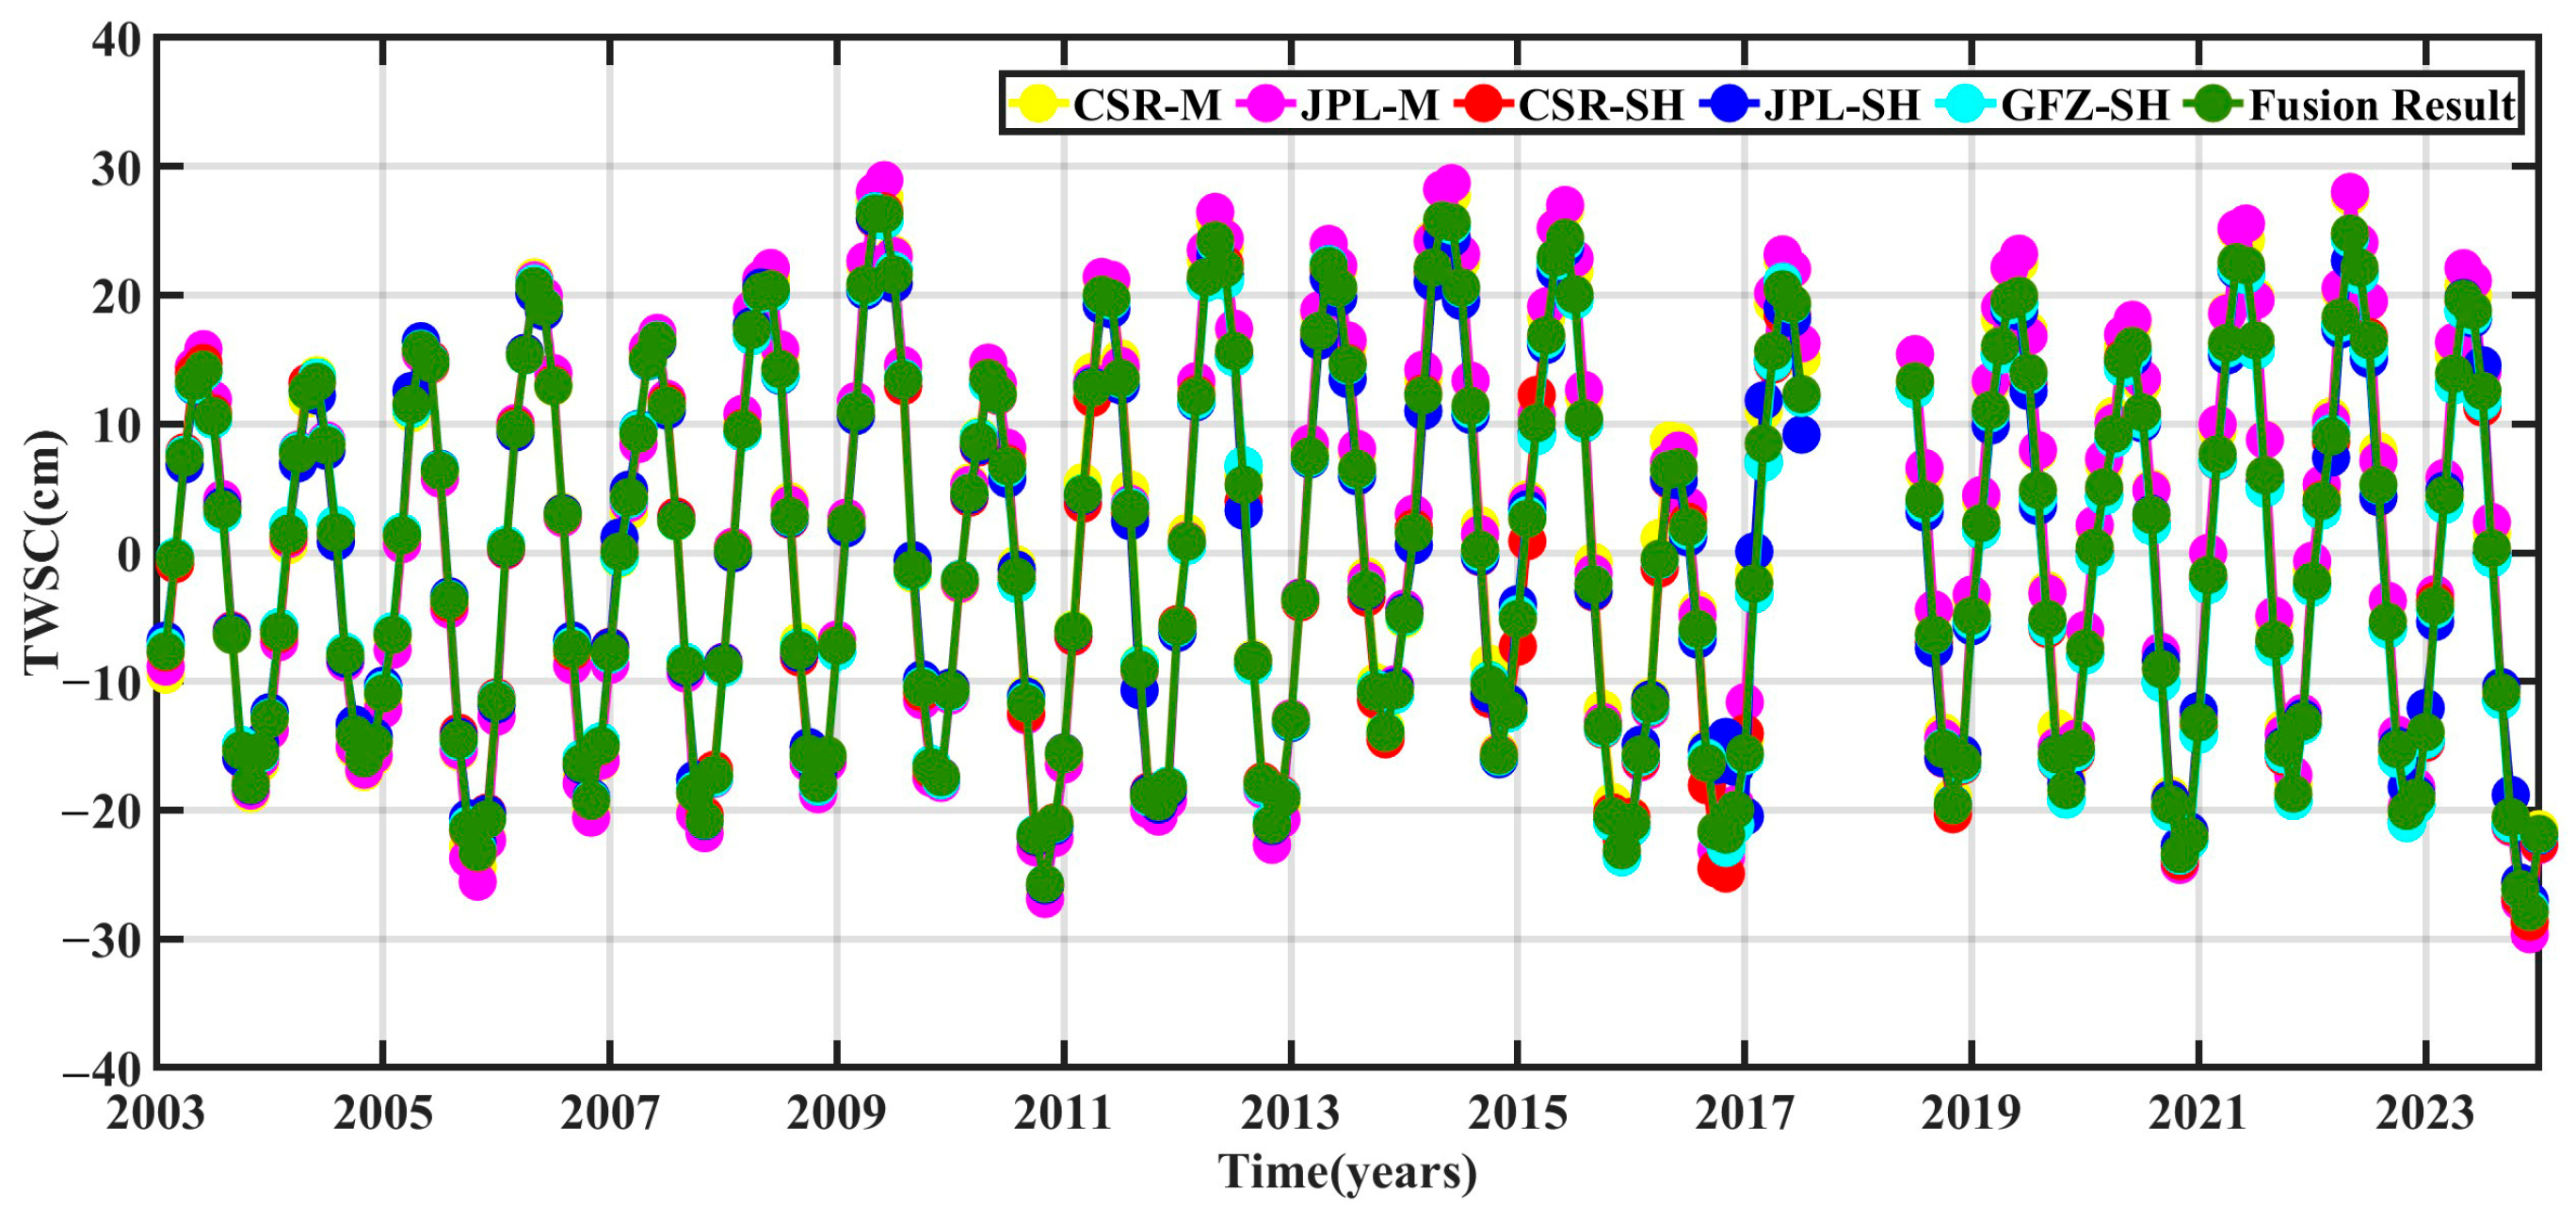
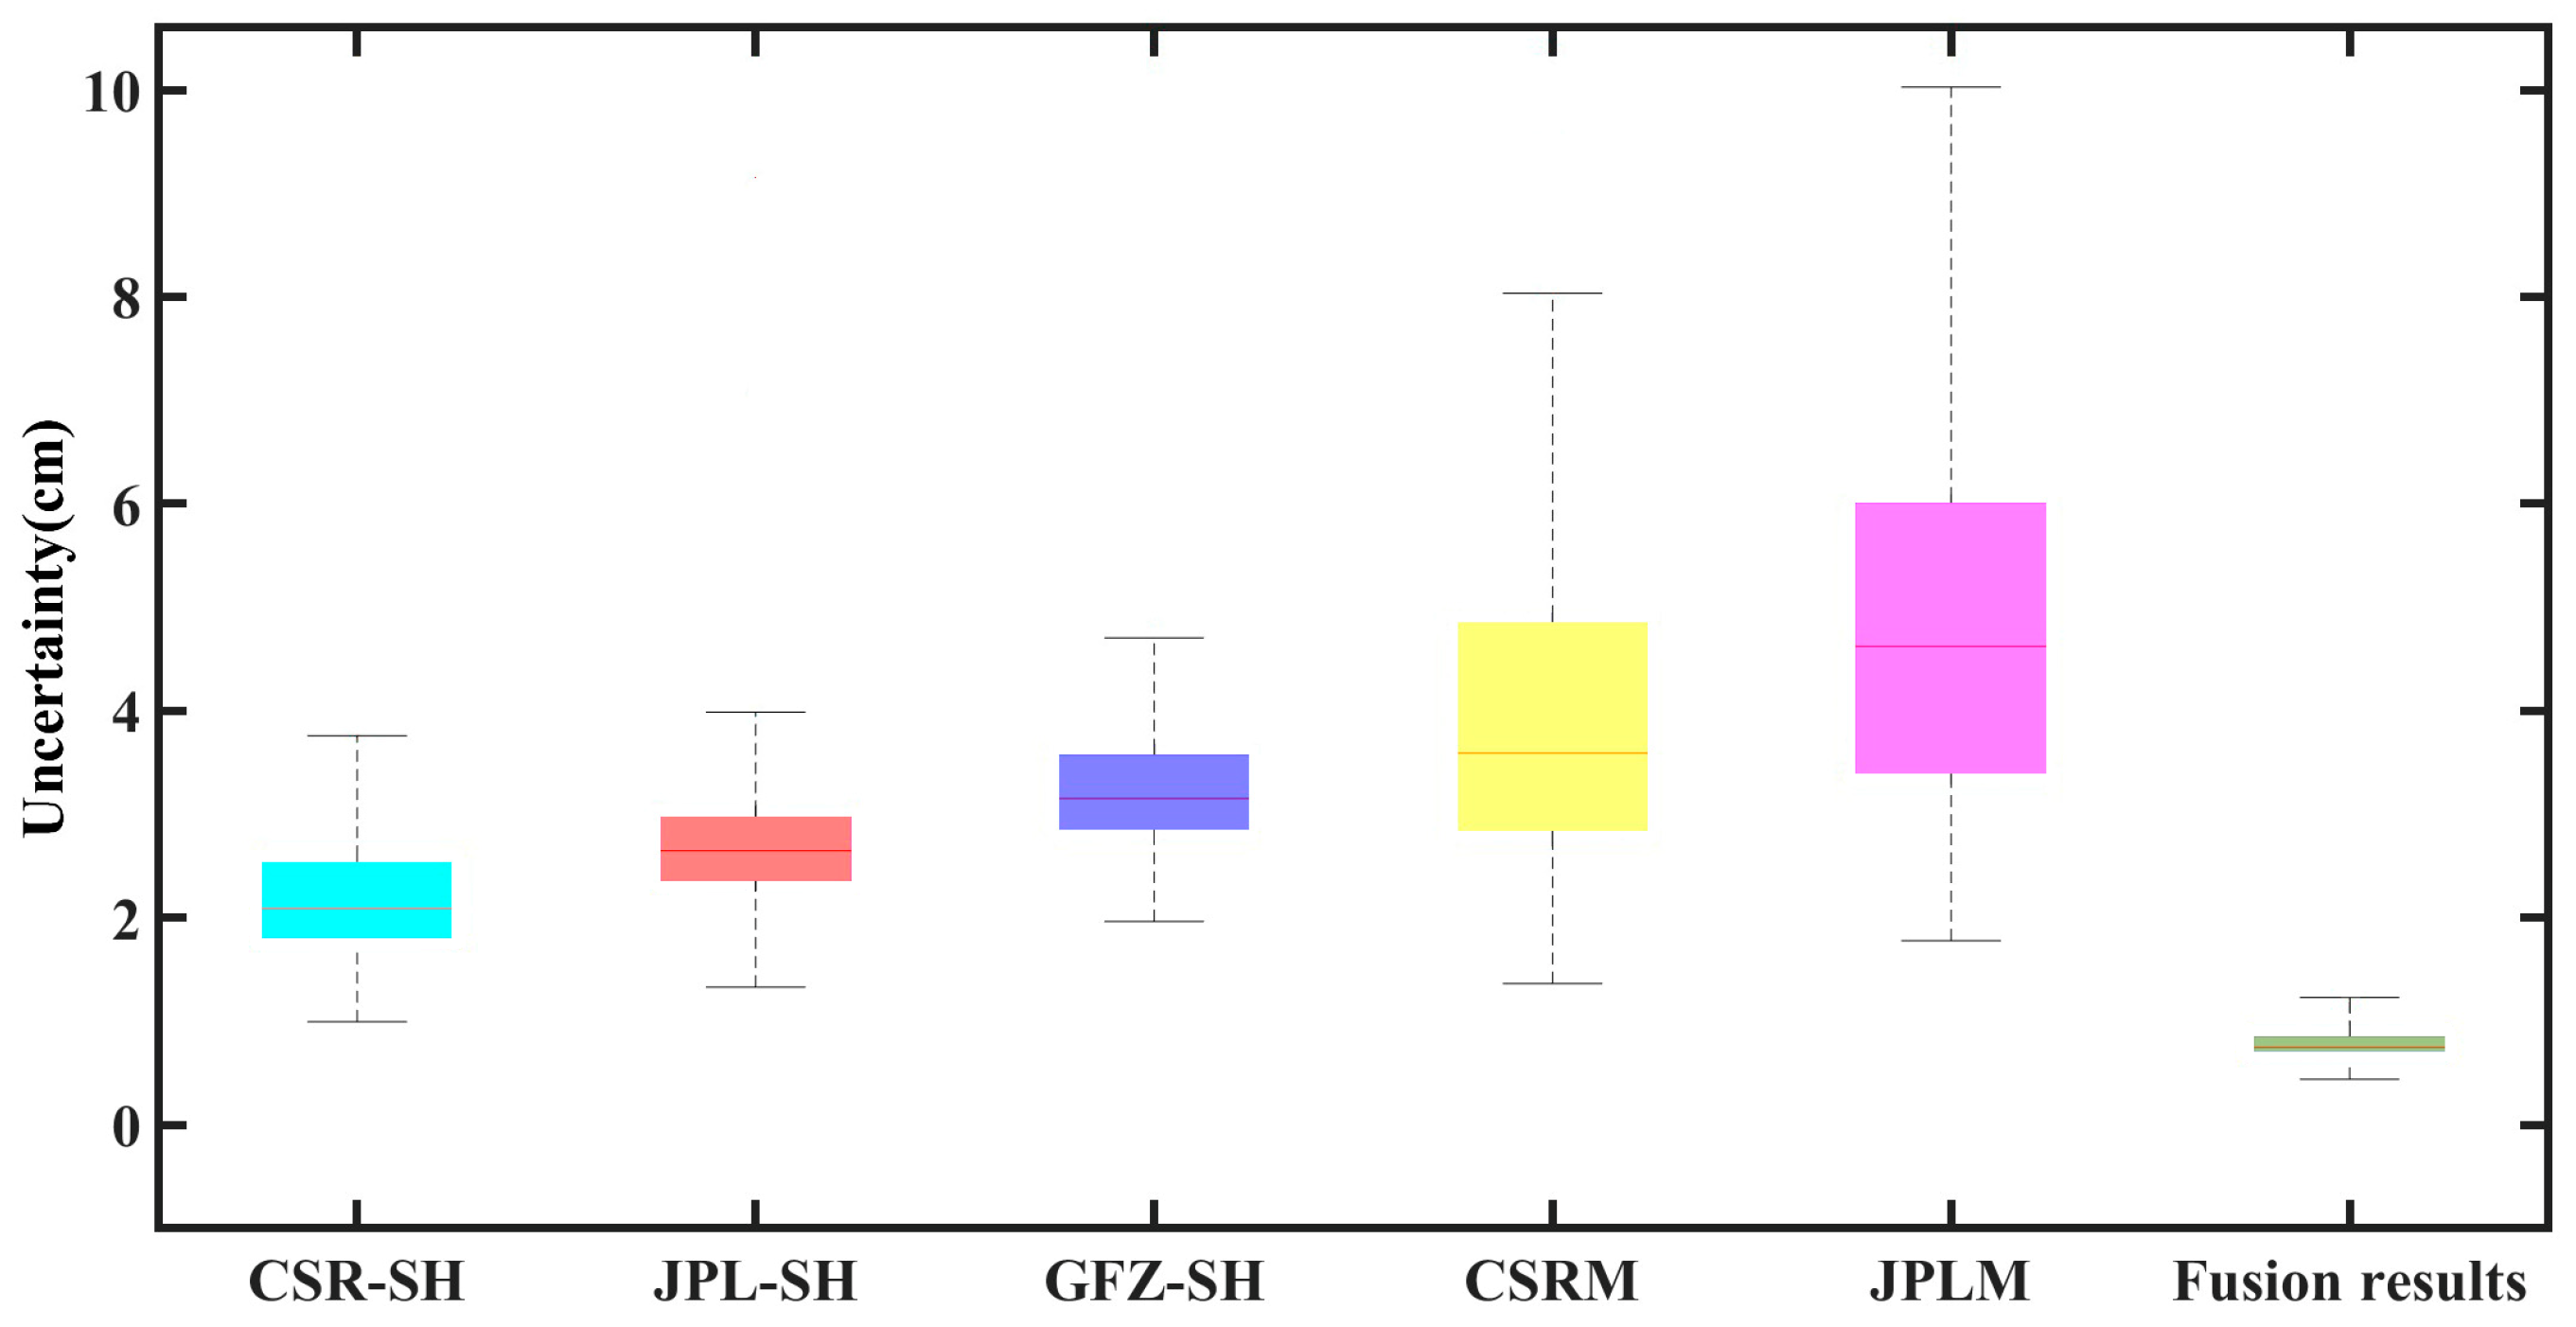
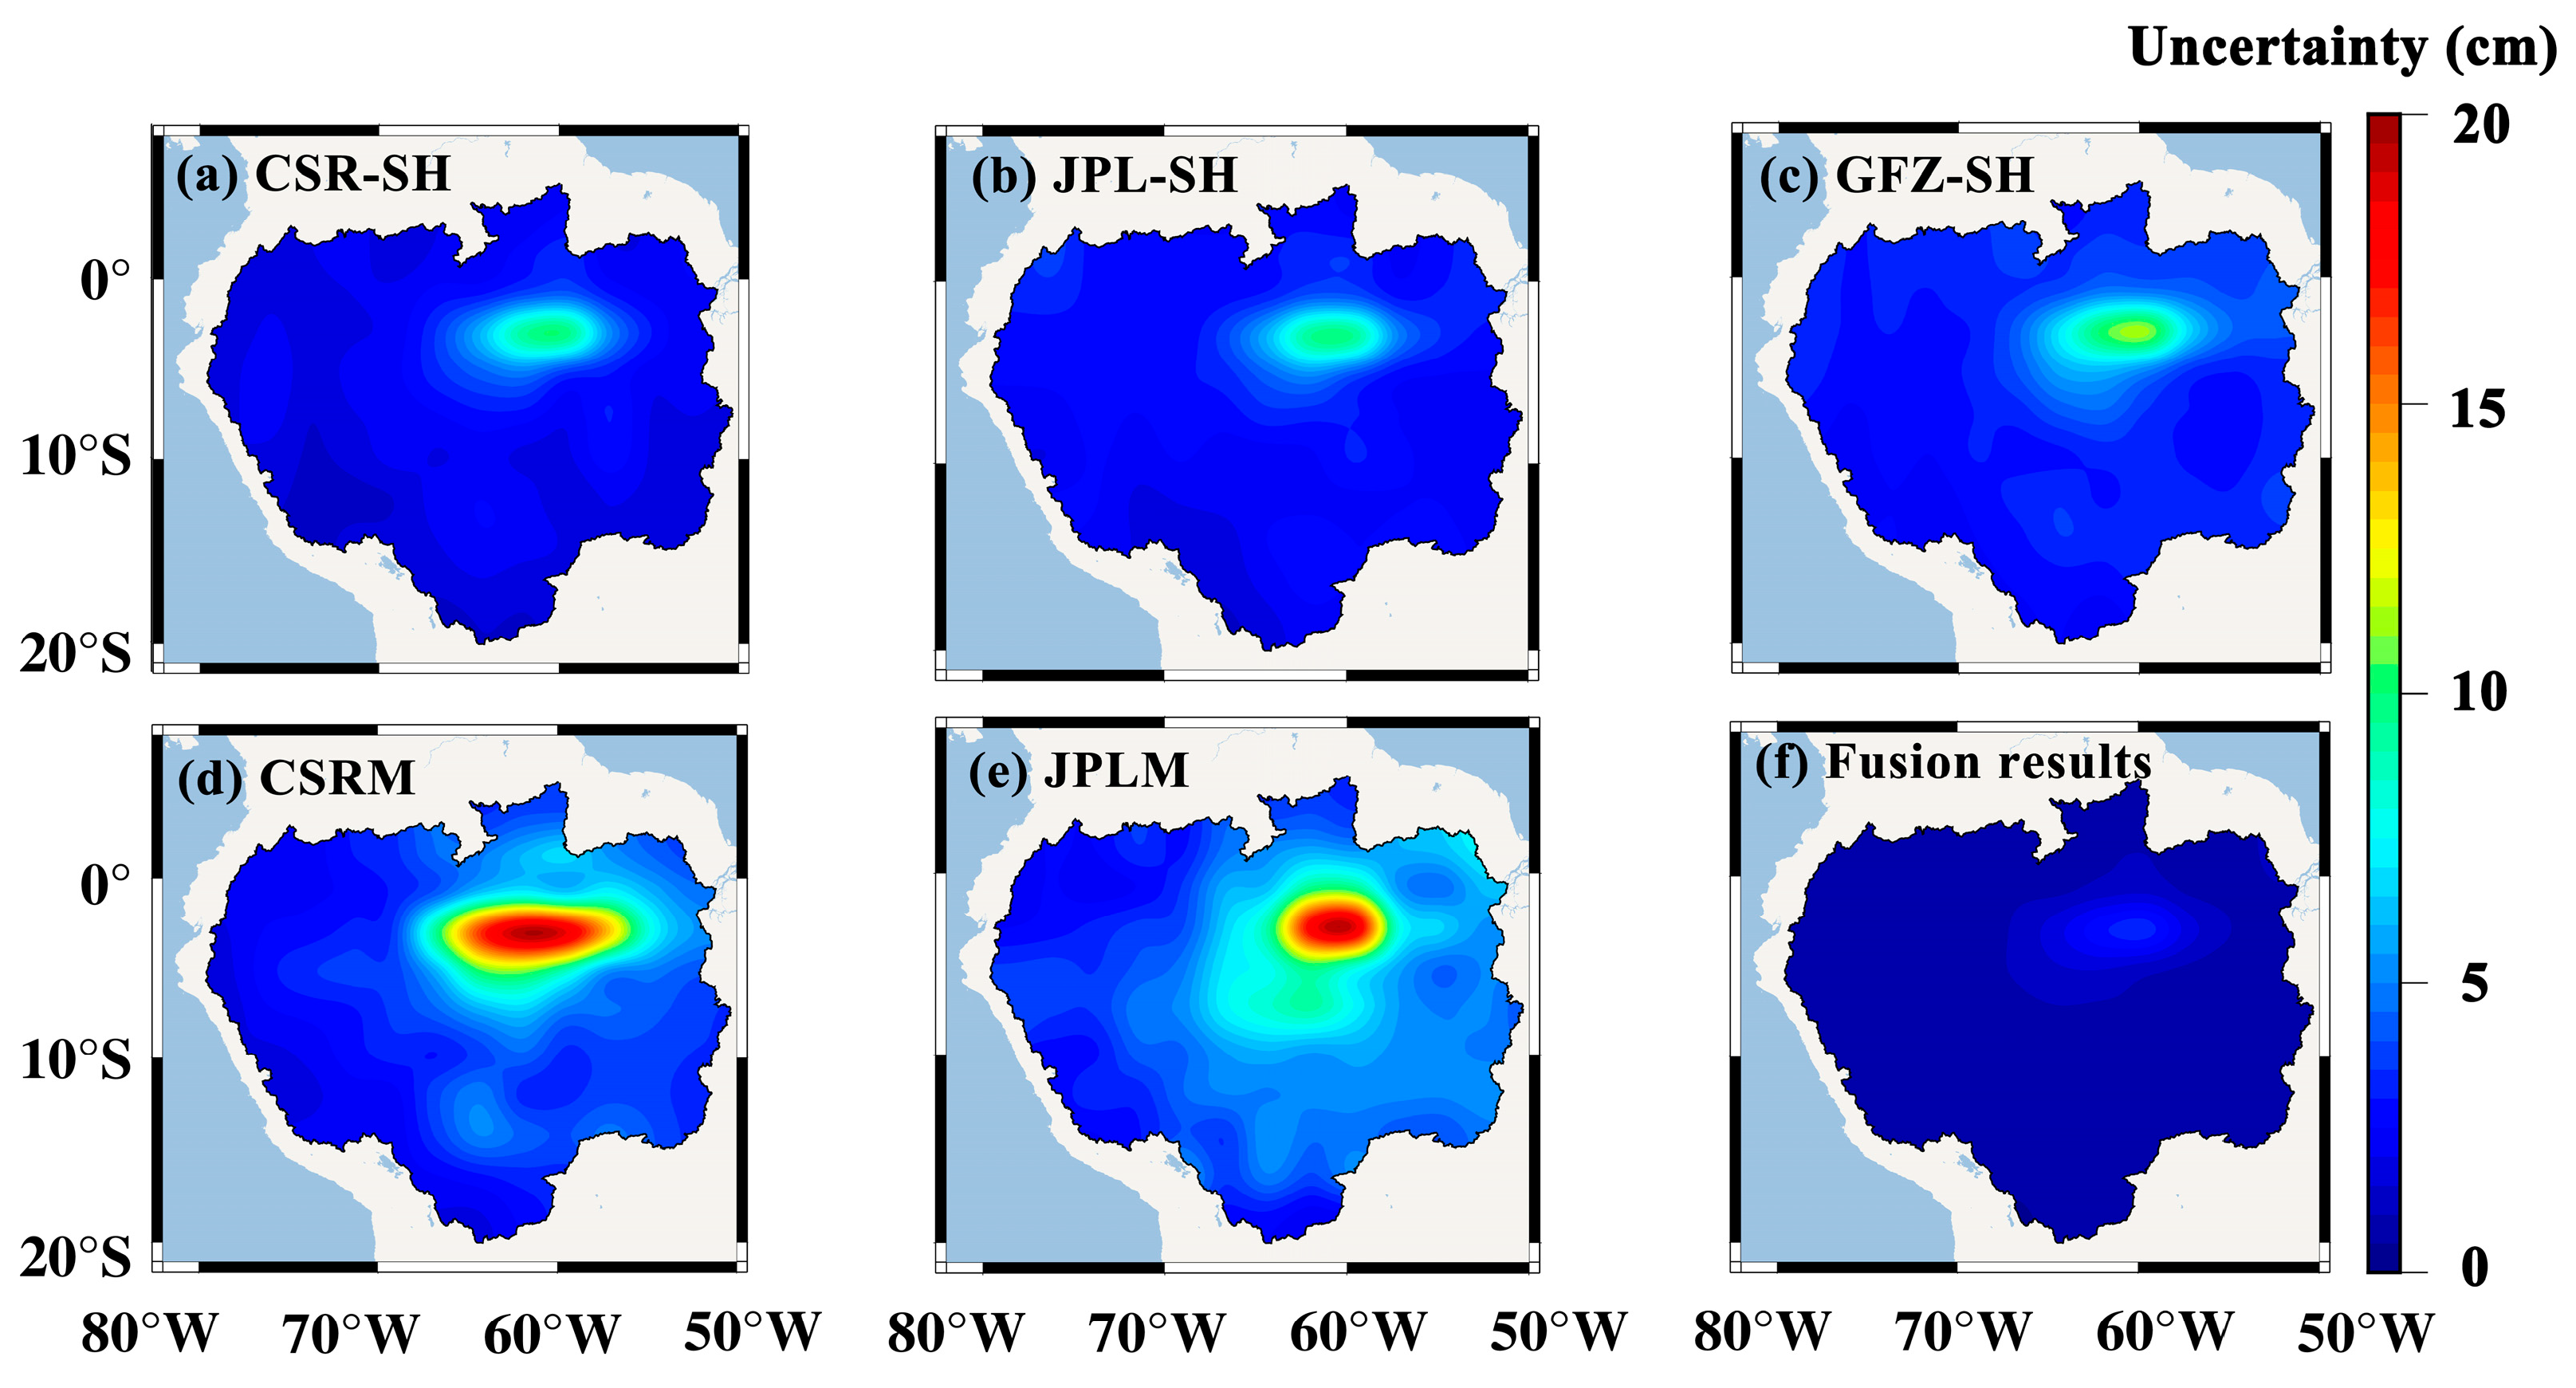
Although five TWSC results had the same peaks, troughs, and change trends (Figure 2), they had different uncertainties (Figure 3). This indicated that different GRACE/GFO solutions were discrepant. Therefore, it was necessary to fuse the five TWSC results to reduce the uncertainties. Figure 2 and Figure 3 show that the fused TWSC result completely overlapped with the other five TWSC results and its uncertainty is much smaller than any single solution. This suggests that the fused TWSC results substantially reduce the uncertainty of TWSC results while maintaining their consistency. We also plotted the spatial distribution maps of the uncertainties of the five GRACE/GFO TWSC and the fused TWSC result (Figure 4). From Figure 4a–e, the uncertainties in most regions are less than 5 cm, and only in the central and eastern regions are the uncertainties relatively high. The fused TWSC results also exhibit similar spatial distribution characteristics, but the uncertainty values are all less than 2 cm in the most affected region, and they are less than 4.5 cm in the central and eastern regions (Figure 4f). Combining Figure 3 and Figure 4, after the data fusion processing, the uncertainty of TWSC was significantly reduced. Hence, we used the fused TWSC results to detect and characterize the 2023 extreme drought in the ARB. Since GRACE and GFO are data of exactly the same nature, we denote the fused TWSC results GRACE TWSC in the following.
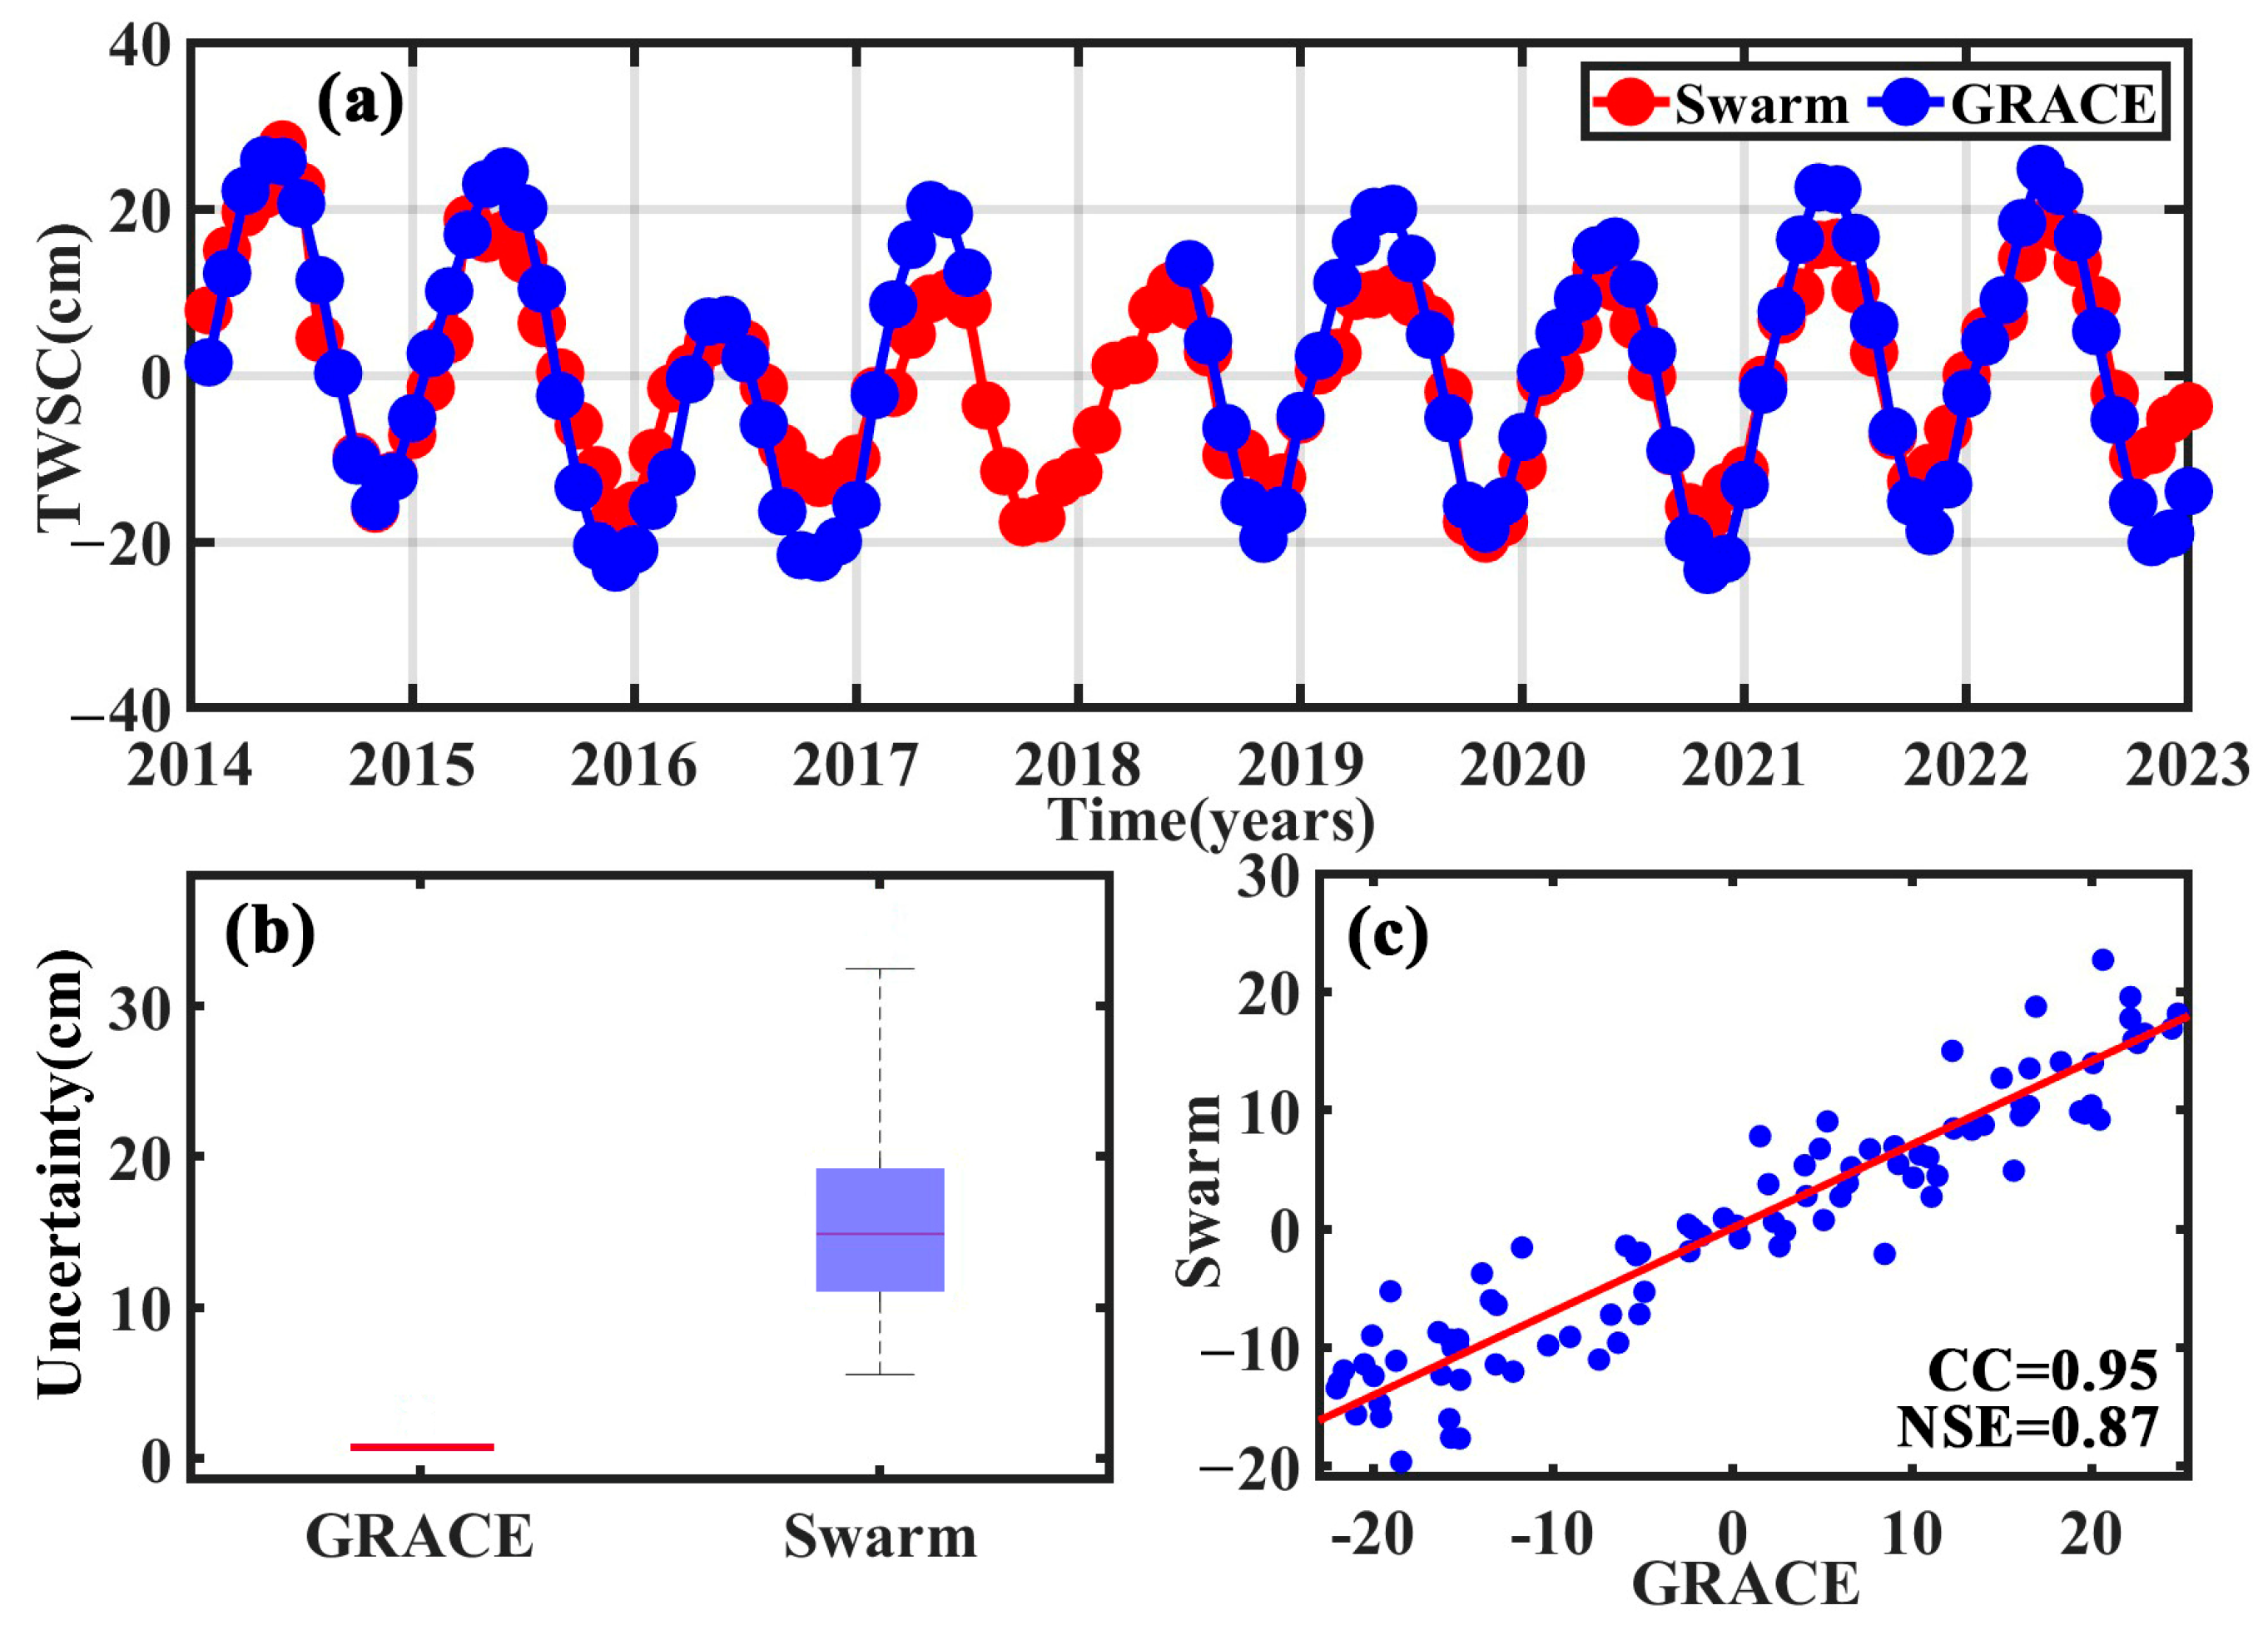
From Figure 3, the GRACE TWSC has a data gap from July 2017 to May 2018, which creates a discontinuity in the TWSC time series. In our study, Swarm TWSC results were used to fill this gap. We compared Swarm TWSC results with GRACE ones in the ARB during 2014 and 2022 (Figure 5). It is clear that the two time series have the same peaks, troughs and trends (Figure 5a). However, the amplitude of the GRACE result is significantly larger than that of the Swarm result, which is attributed to the larger uncertainty of the Swarm result (Figure 5b). The correlation coefficient (CC) and NSE between GRACE and Swarm results were 0.95 and 0.86, respectively (Figure 5c). This demonstrated that the Swarm TWSC result had similar performance to the GRACE one and has the potential to detect TWSC in the ARB. Therefore, it was feasible to fill the gap between the GRACE and GFO missions using Swarm solutions.
We constructed a continuous 21-year TWSC series based on GRACE/GFO and Swarm solutions in the ARB (Figure 6). To verify the reliability of this series, we compared it with the Global Land Data Assimilation System (GLDAS) TWSC for the same time period. We found that these two series have peaks or troughs at the same time points and similar trends. This indicated that the two have strong consistency, which was also confirmed by the correlation coefficient results (0.88). However, the positions of the peaks and fluctuations in the two time series do not overlap, showing obvious differences. These differences are caused by multiple factors. Firstly, the GRACE results include TWSC caused by both natural factors and human activities, while the GLDAS results only consider natural factors. Secondly, neither the GRACE results nor the GLDAS results directly obtain TWSC: instead, they are estimated through calculation formulas or mathematical models, which involve errors in the formulas or models. Finally, the quality of input variables in the GLDAS model also has a certain impact on the final results [60]. Therefore, this 21-year continuous TWSC series has high reliability and applicability in the ARB.

4.2. Drought Process

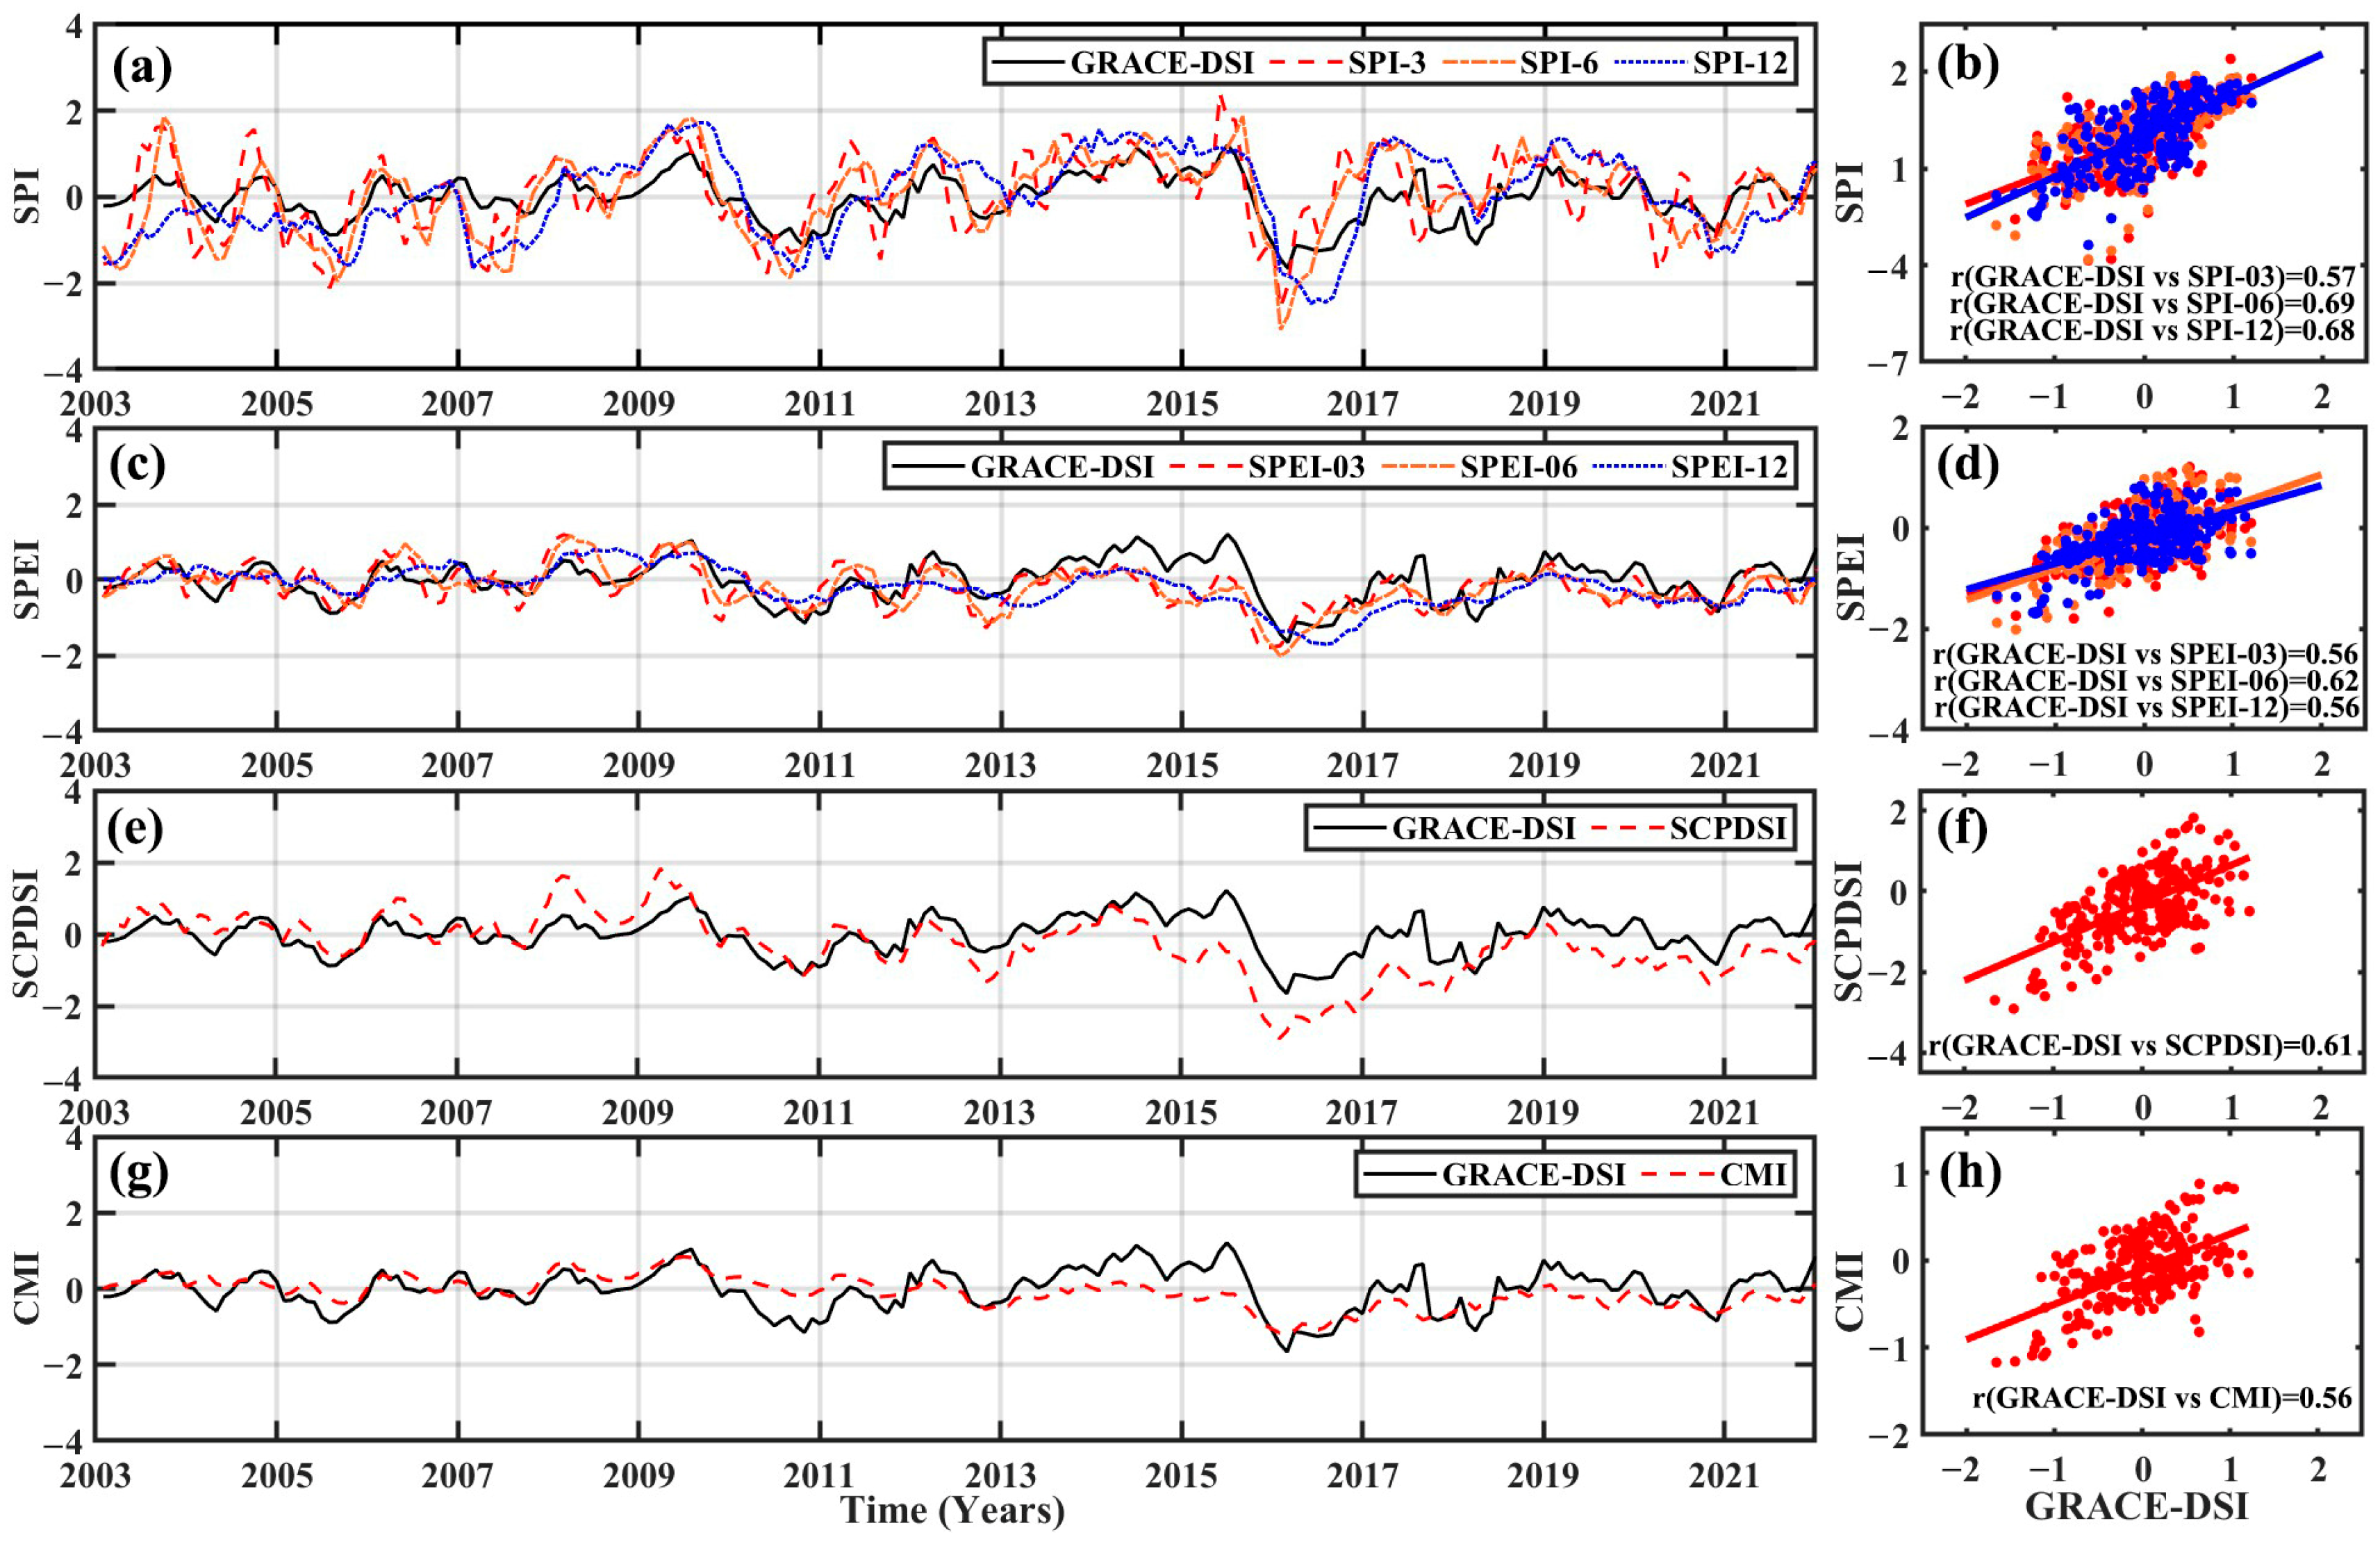
We used the 254-month continuous time series of TWSC in Figure 6 to generate the GRACE-DSI series from January 2003 to February 2024 for monitoring the 2023–2024 extreme drought in the ARB. To verify the reliability of GRACE-DSI, we compared it with three traditional drought indices (SPEI, SPI, and SCPDSI) as well as the CMI (Figure 7). Since the SPEI dataset is only updated up to 2022, the data comparison was limited to the period from 2003 to 2022. In Figure 7, GRACE-DSI has similar variation characteristics to and strong correlations with the four drought indices (all correlation coefficients are greater than 0.52). The correlation with SPI-6 is the highest (0.69), the correlation with SPEI-3 is the lowest (0.52), the correlation coefficient with SCPDSI is 0.61, and the correlation coefficient with CMI is 0.56. These results indicate a significant positive correlation between GRACE-DSI and the four drought indices. However, the four drought indices are mainly calculated based on meteorological data and cannot reflect terrestrial water storage anomalies during droughts. In contrast, GRACE-DSI was constructed based on TWSC, giving it a natural advantage in this regard. In summary, GRACE-DSI is capable of implementing drought monitoring in the ARB.
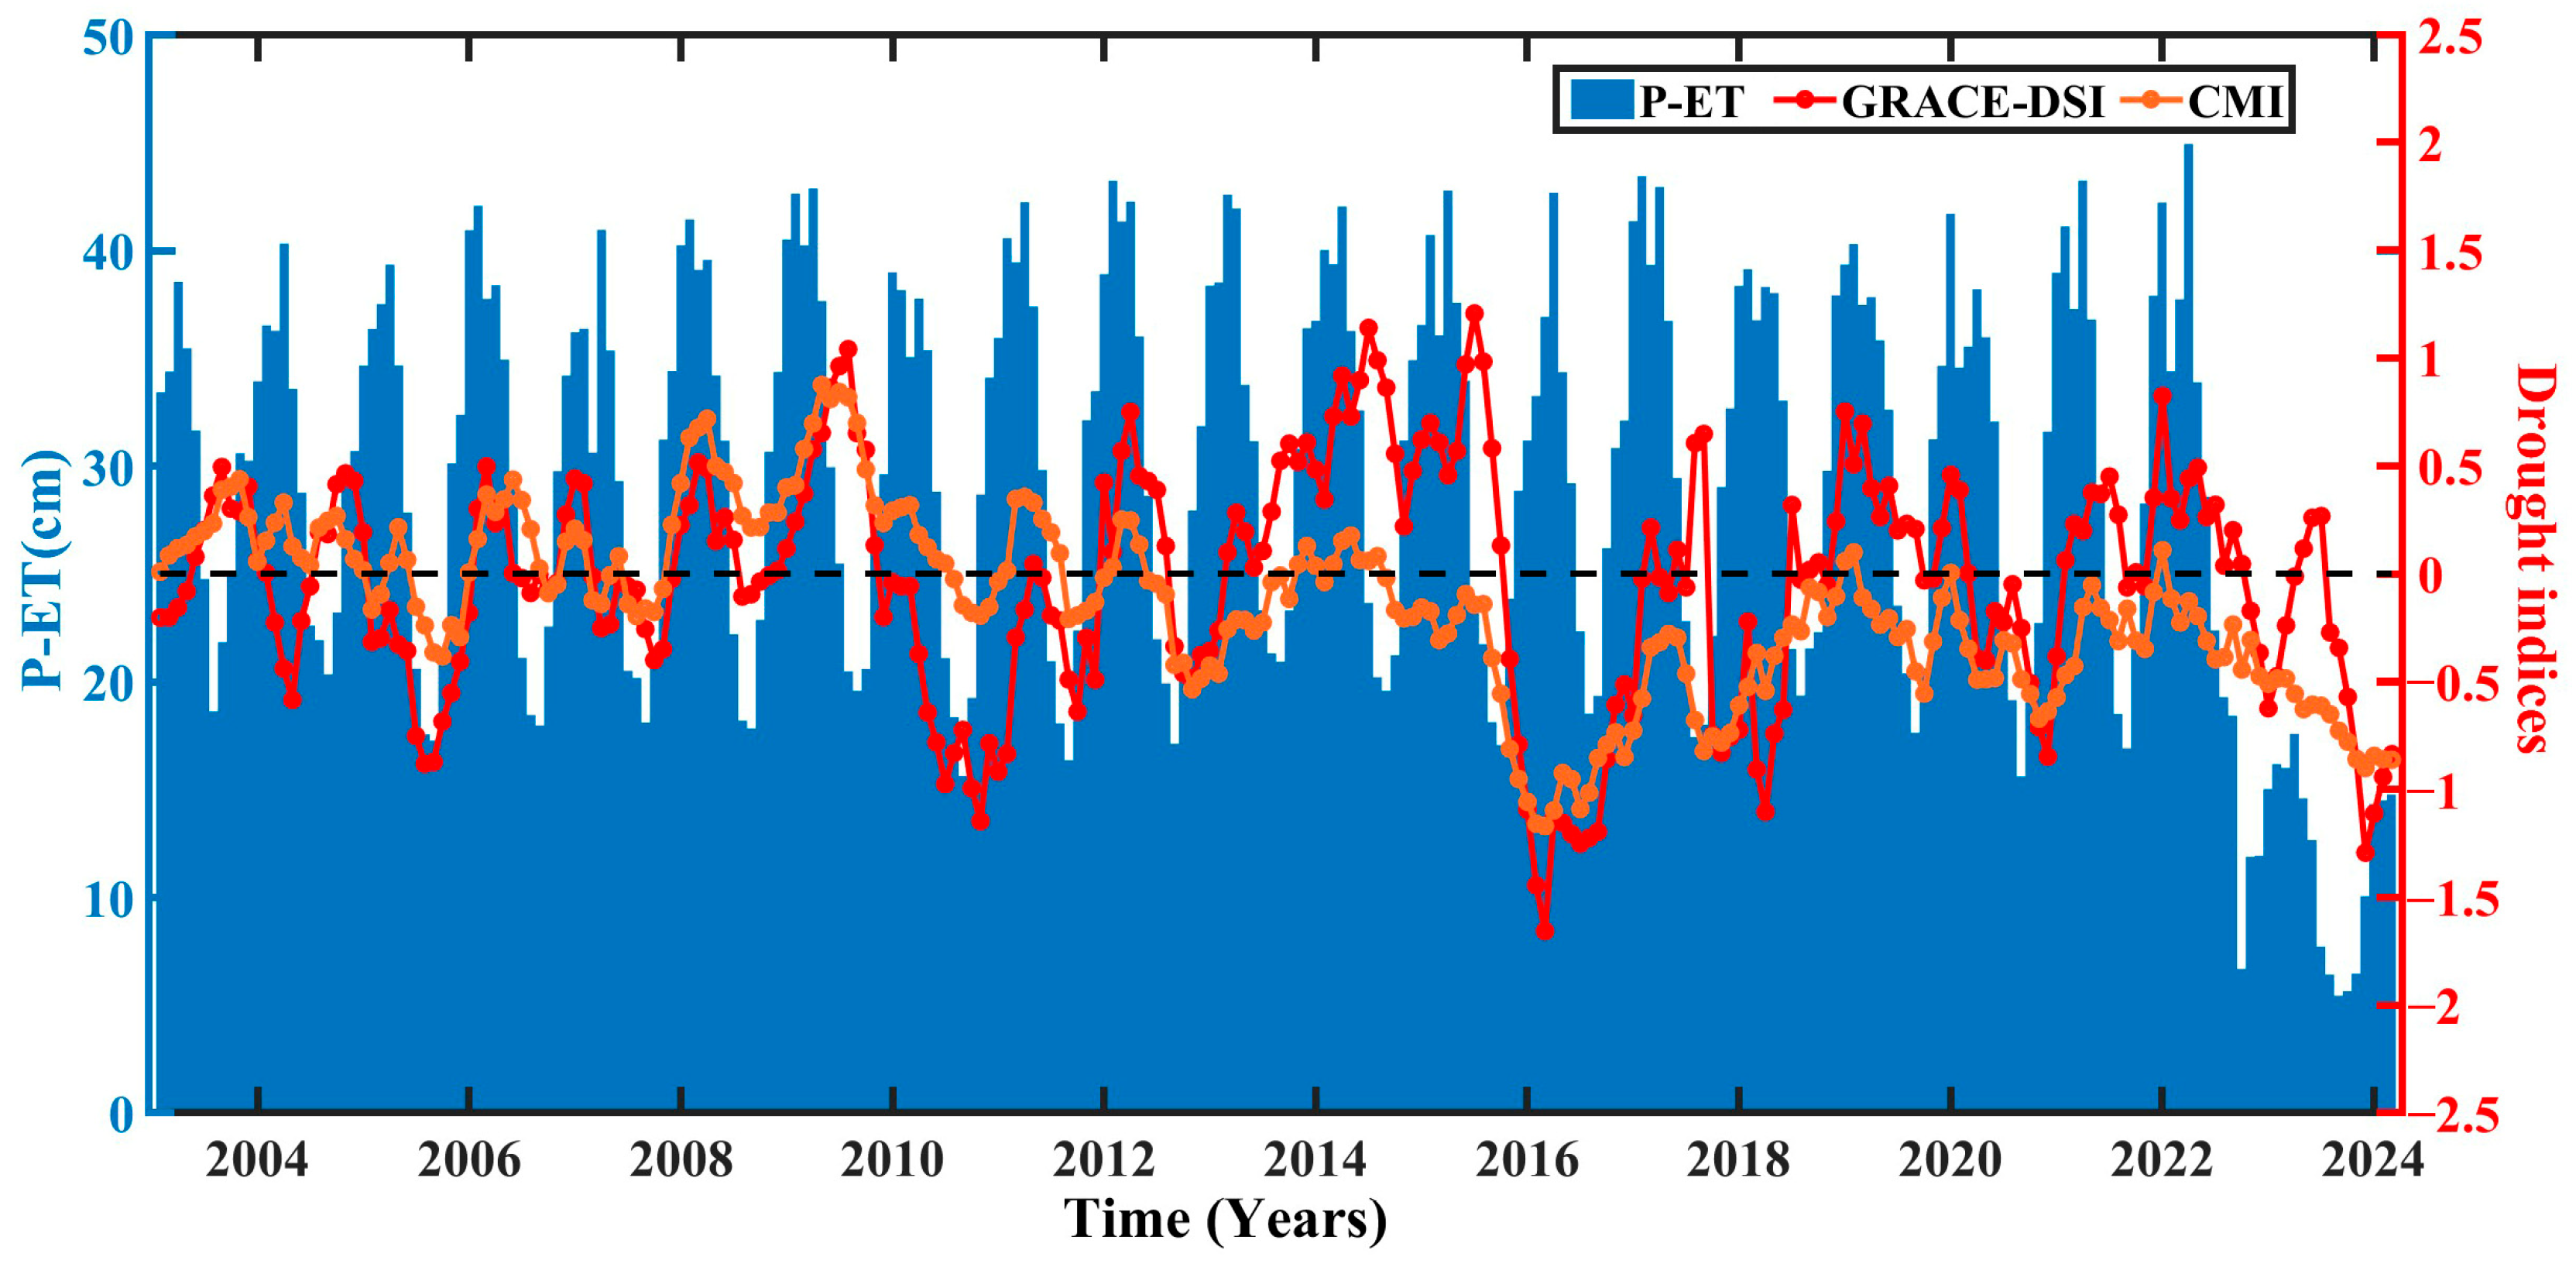
We used the difference between PRE and ET as the natural net recharge (P-ET) to assess the impact of natural factors on the 2023–2024 extreme drought in the ARB (Figure 8). P-ET shows significant seasonal variations, and there is a similar changing trend between GRACE-DSI and CMI. According to GRACE-DSI, the 2023–2024 extreme drought began in September 2023, after which GRACE-DSI continued to decline, with the peak occurring in November 2023. By February 2024, the drought was in the recovery stage. P-ET started to show a significant downward trend from March 2023 (19 cm) and continued until August 2023 (8 cm), after which it began to rise gradually. GRACE-DSI, however, showed a significant decline in June. By comparing the time points of the occurrence of the decline and the peak, we found that there was a 3-month lag effect in the response of GRACE-DSI to P-ET. CMI showed negative values from January 2022 and a downward trend until November 2023 (consistent with GRACE-DSI). This indicates that this drought started as a meteorological drought (CMI) and then propagated to form a hydrological drought (GRACE-DSI). Based on the comparison between CMI and GRACE-DSI, it can be seen that the duration of the meteorological drought was significantly longer than that of the hydrological drought. This may be related to human activities. Drought prevention and mitigation measures such as reservoir water storage and regional water resource scheduling have interfered with the propagation between meteorological droughts and hydrological droughts, resulting in significant differences in drought characteristics between meteorological droughts and hydrological droughts [56].
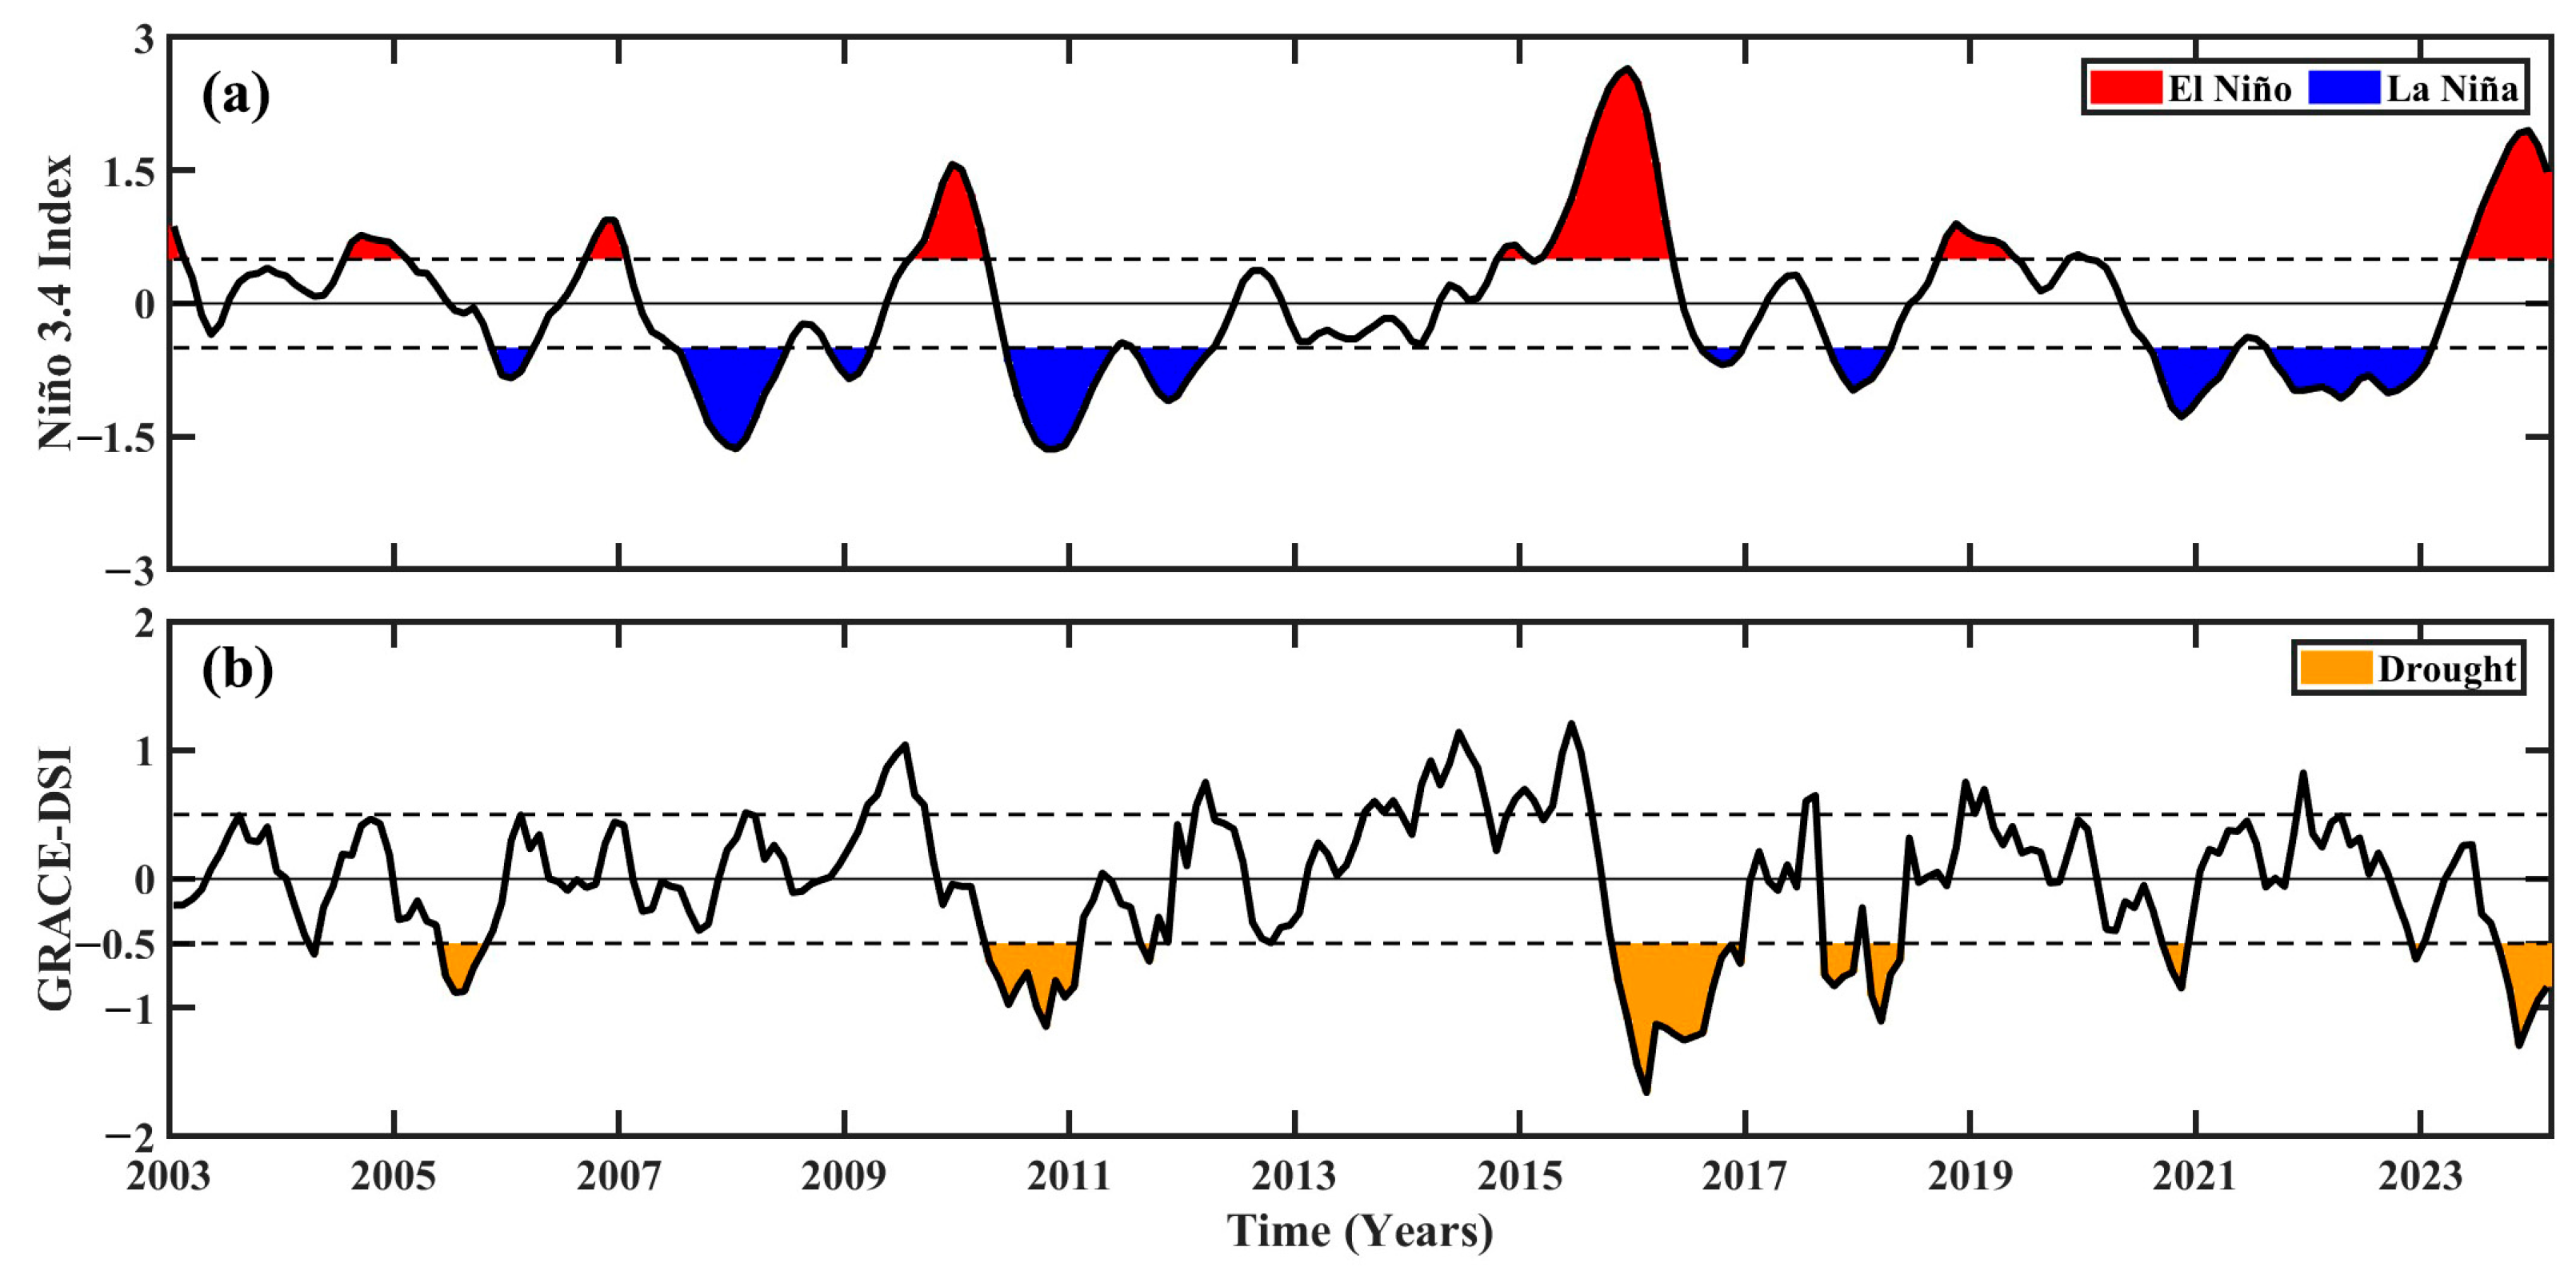
From Figure 8, a total of six drought events occurred in the ARB during January 2003 to February 2024, which are in 2005, 2010–2011, 2015–2016, 2017–2018, 2020 and 2023–2024, respectively. We counted the characteristics of these six droughts (Table 4). Comparing the six droughts, although the duration of the 2023 extreme drought (6 months) is not long, its peak and average GRACE-DSI (−1.29 and −0.94) are second only to the 2015 extreme drought, and its drought severity (−5.62) was not high and ranked only fourth.
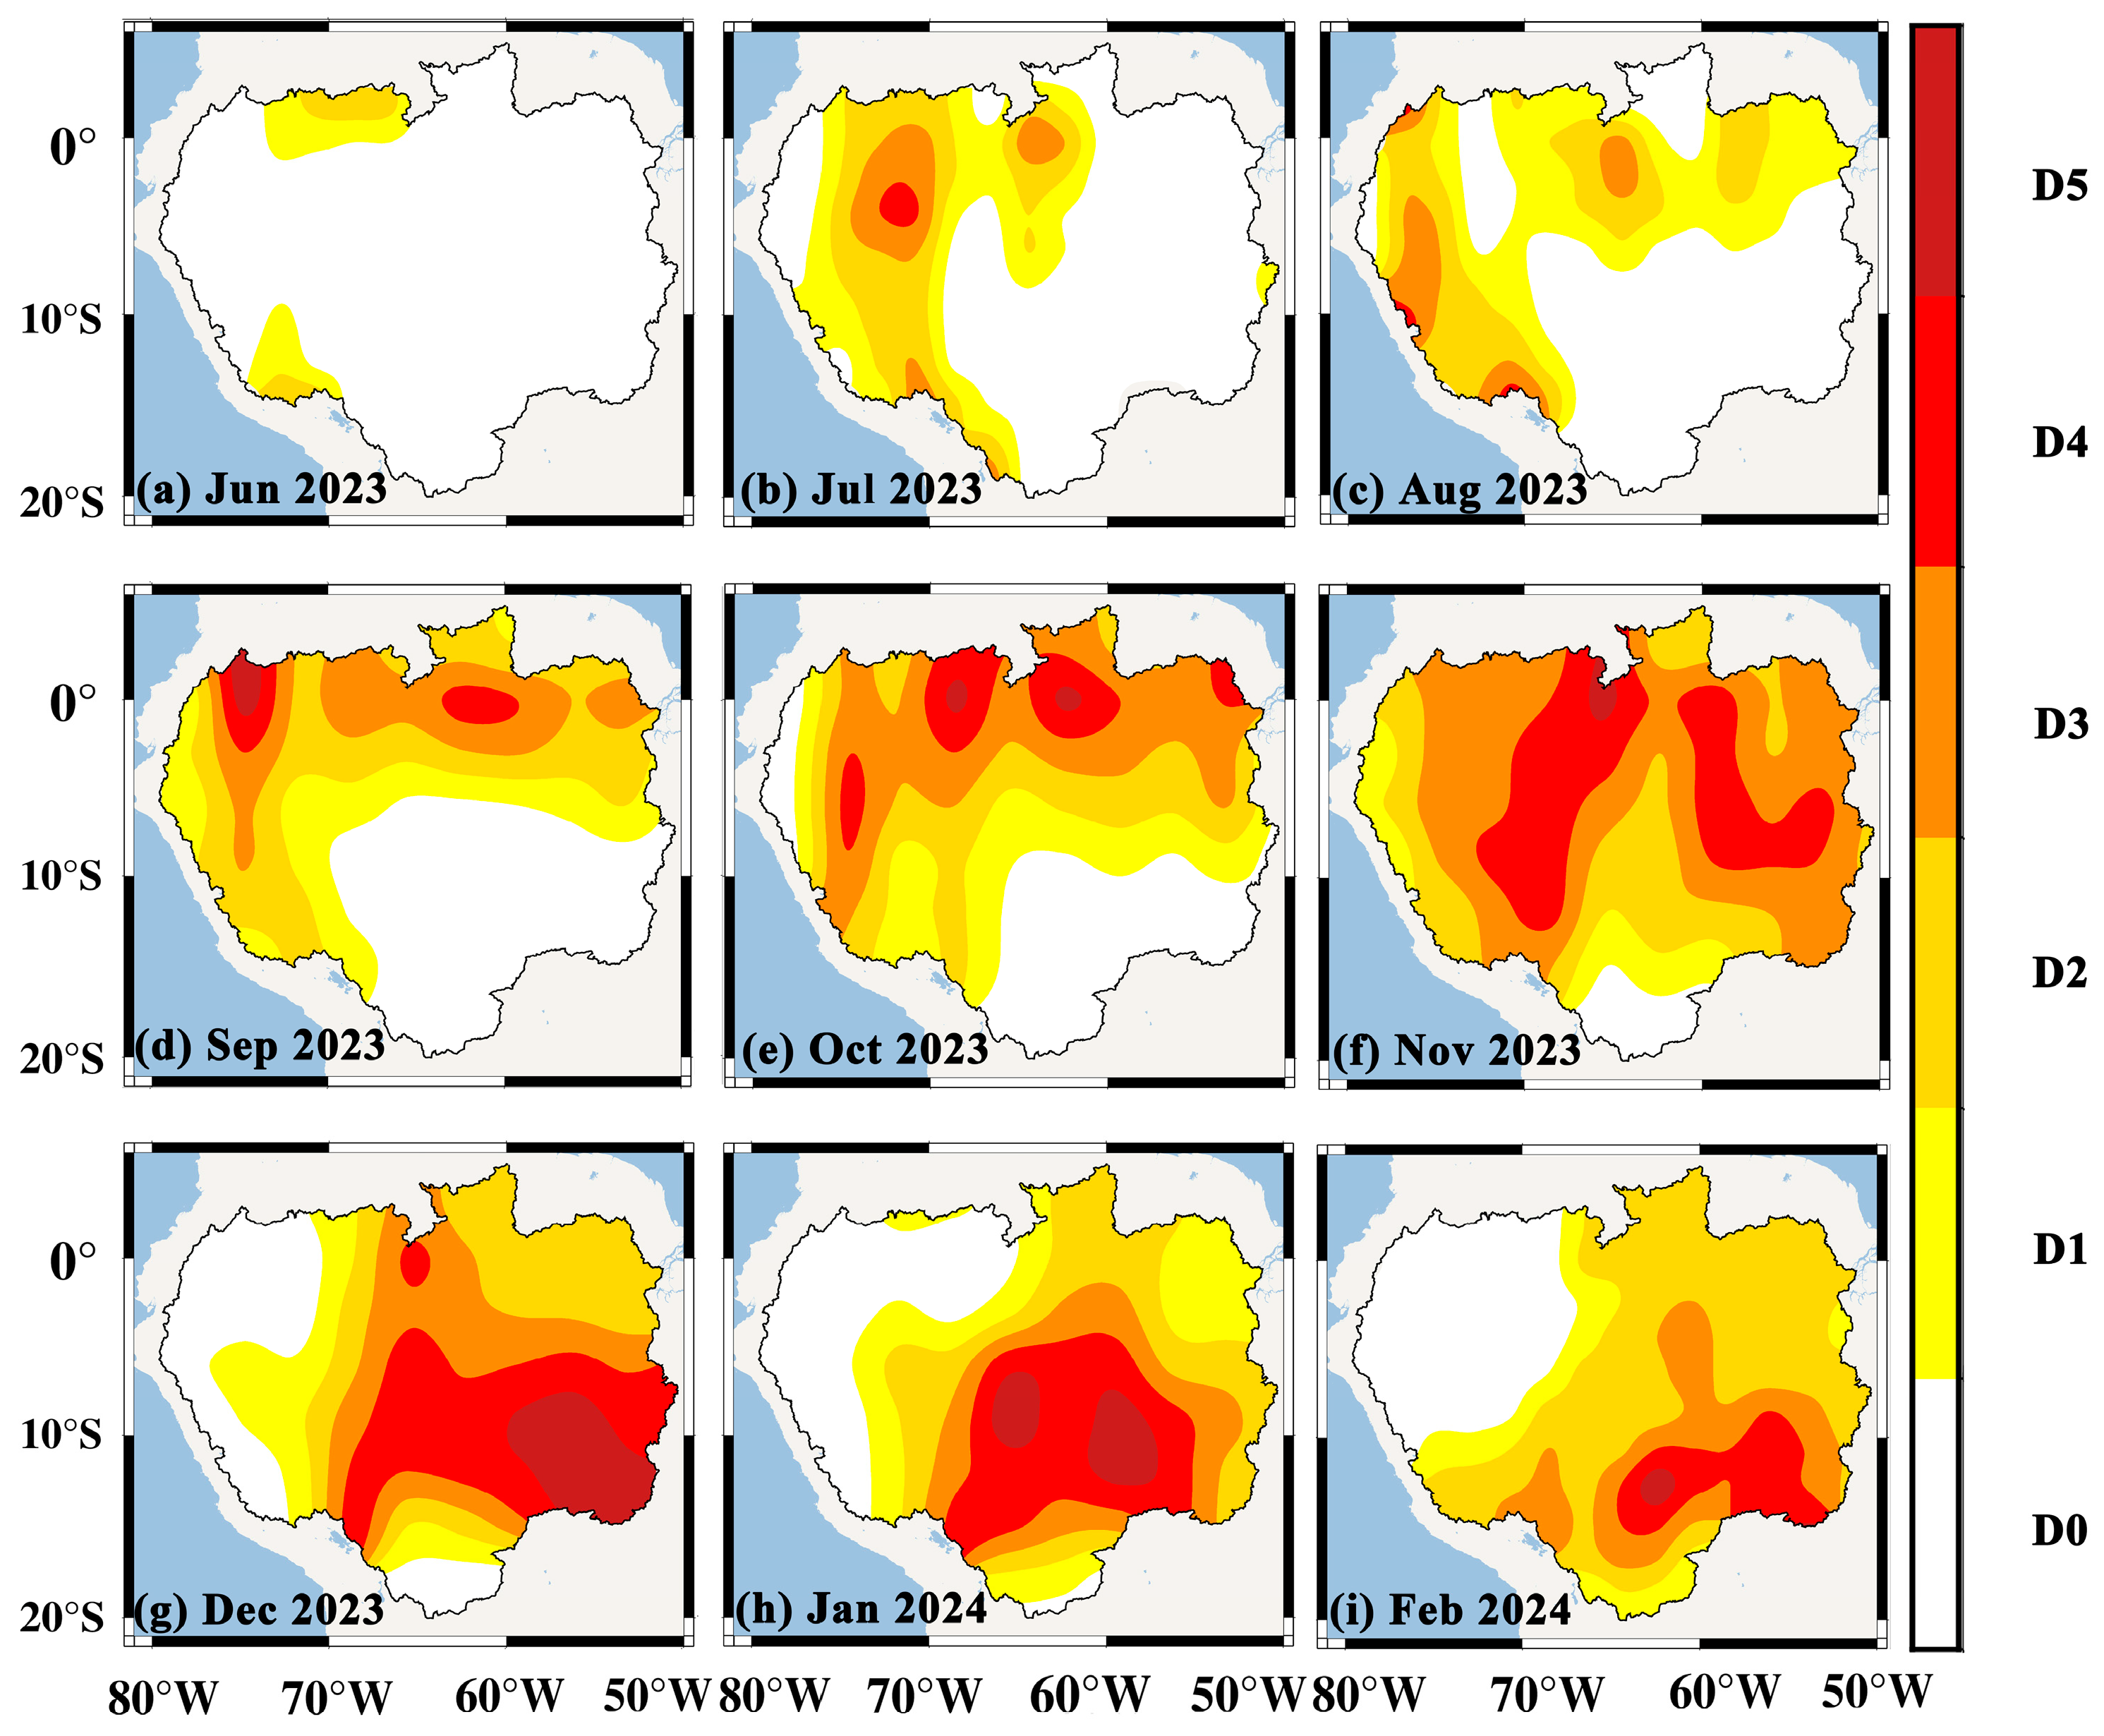
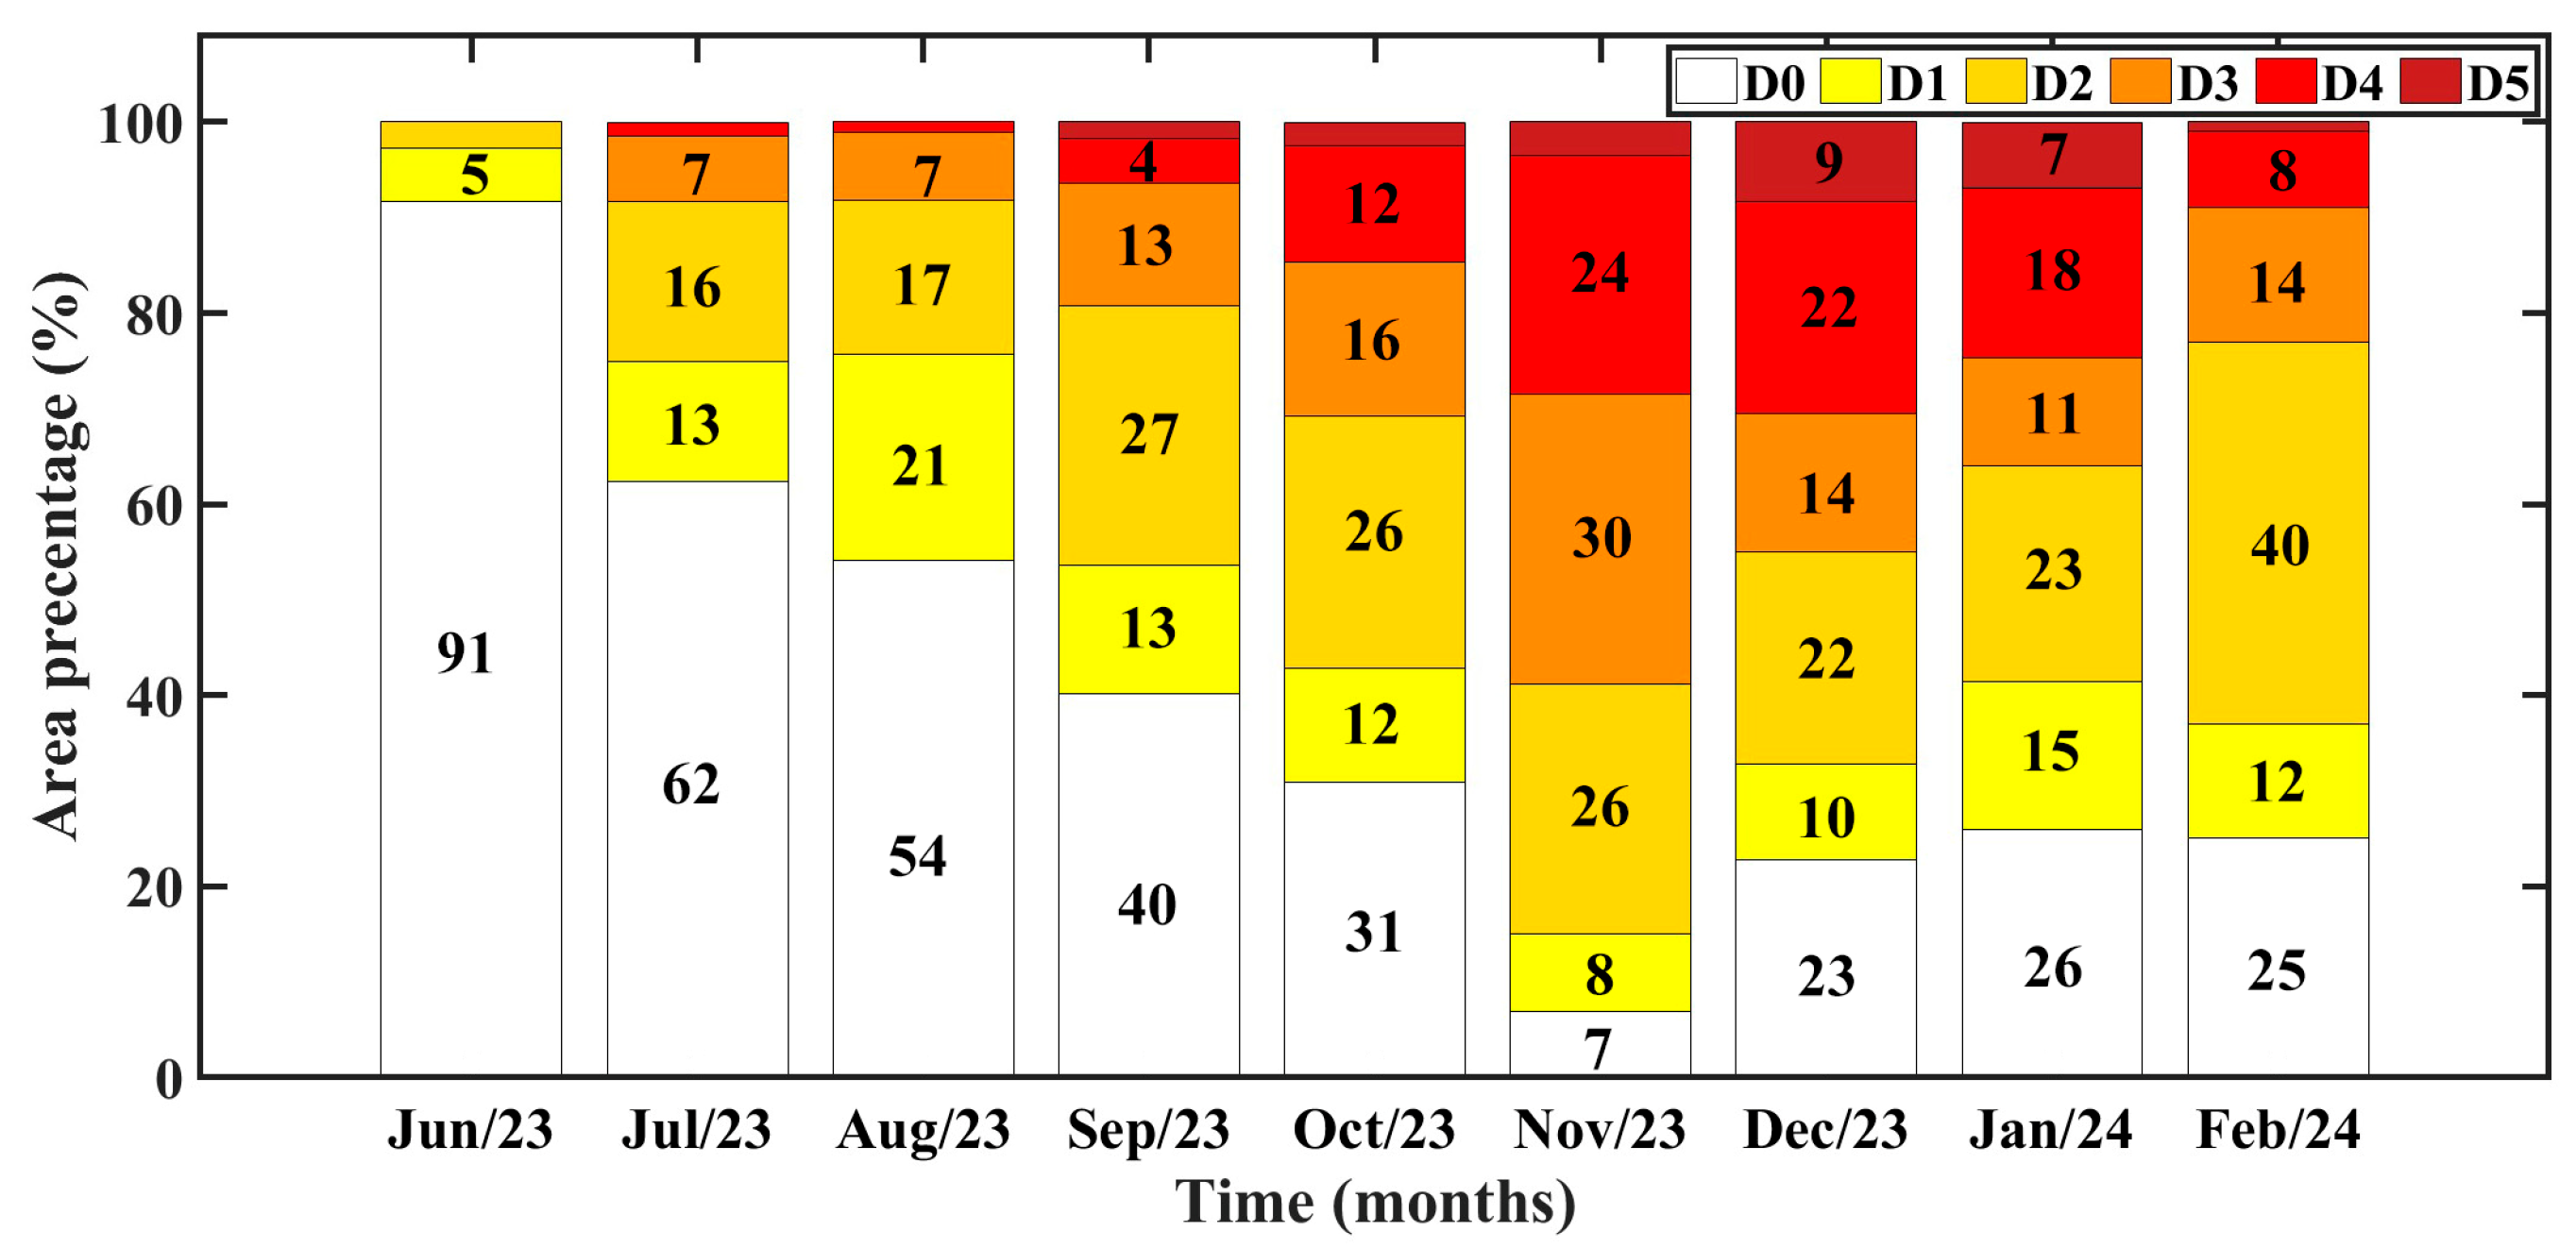
Figure 9 and Figure 10 show the whole process of the spatiotemporal evolution of this extreme drought and the area percentage, respectively, of the droughts at different levels. In June 2023, most regions in the ARB were in non-drought, and only a few regions in the north and south were in drought, but most of them were light drought (D1, Figure 9a). Starting from July 2023, large regions of drought appeared in the east and north. The DAR had reached 38% (regional drought), and it was mainly composed of light and moderate droughts (D1 and D2, Figure 9b). In August 2023, the drought continued to develop, and the DAR expanded to 45.82%, which was close to the critical point (50%, territorial drought). Its influence had almost covered most of the east and north (Figure 9c). By September 2023, this drought finally evolved into a territorial drought (60%), covering all regions except the southeast. The exceptional drought (D5, 1.67%) occurred in the northwest (Figure 9d).
In October 2023, the drought area continued to expand (69%, territorial drought) and the drought severity regions began to shift from the east to the west (Figure 9e). In November 2023, the DAR of drought reached its peak (93%), and only a very small region in the south was not affected by the drought. The drought severities in the north were still higher than that in the south, and the extreme and exceptional droughts (D4 and D5) had begun to spread to the south: their area percentages were 4% and 25%, respectively (Figure 9f). In December 2023, the region severely affected by the drought had obviously shifted. The drought in the east began to gradually subside and the drought severity in the north began to weaken, while the drought severity in the southeastern suddenly increased. The exceptional drought (D5) was mainly concentrated here, and its area percentage reached 8% (Figure 9g). In January 2024, both the DAR and drought severity had subsided to varying degrees. The DAR decreased by 3%. The area percentage of the extreme and exceptional droughts (D4 and D5) decreased by 18% and 7%, respectively, and they were shrinking to the south (Figure 9h). In February 2024, the DAR shrunk further (74%), and the drought was dominated by moderate drought (D2). The extreme and exceptional droughts (D4 and D5) had shrunk significantly, but they were still concentrated in the southeast (Figure 9i).
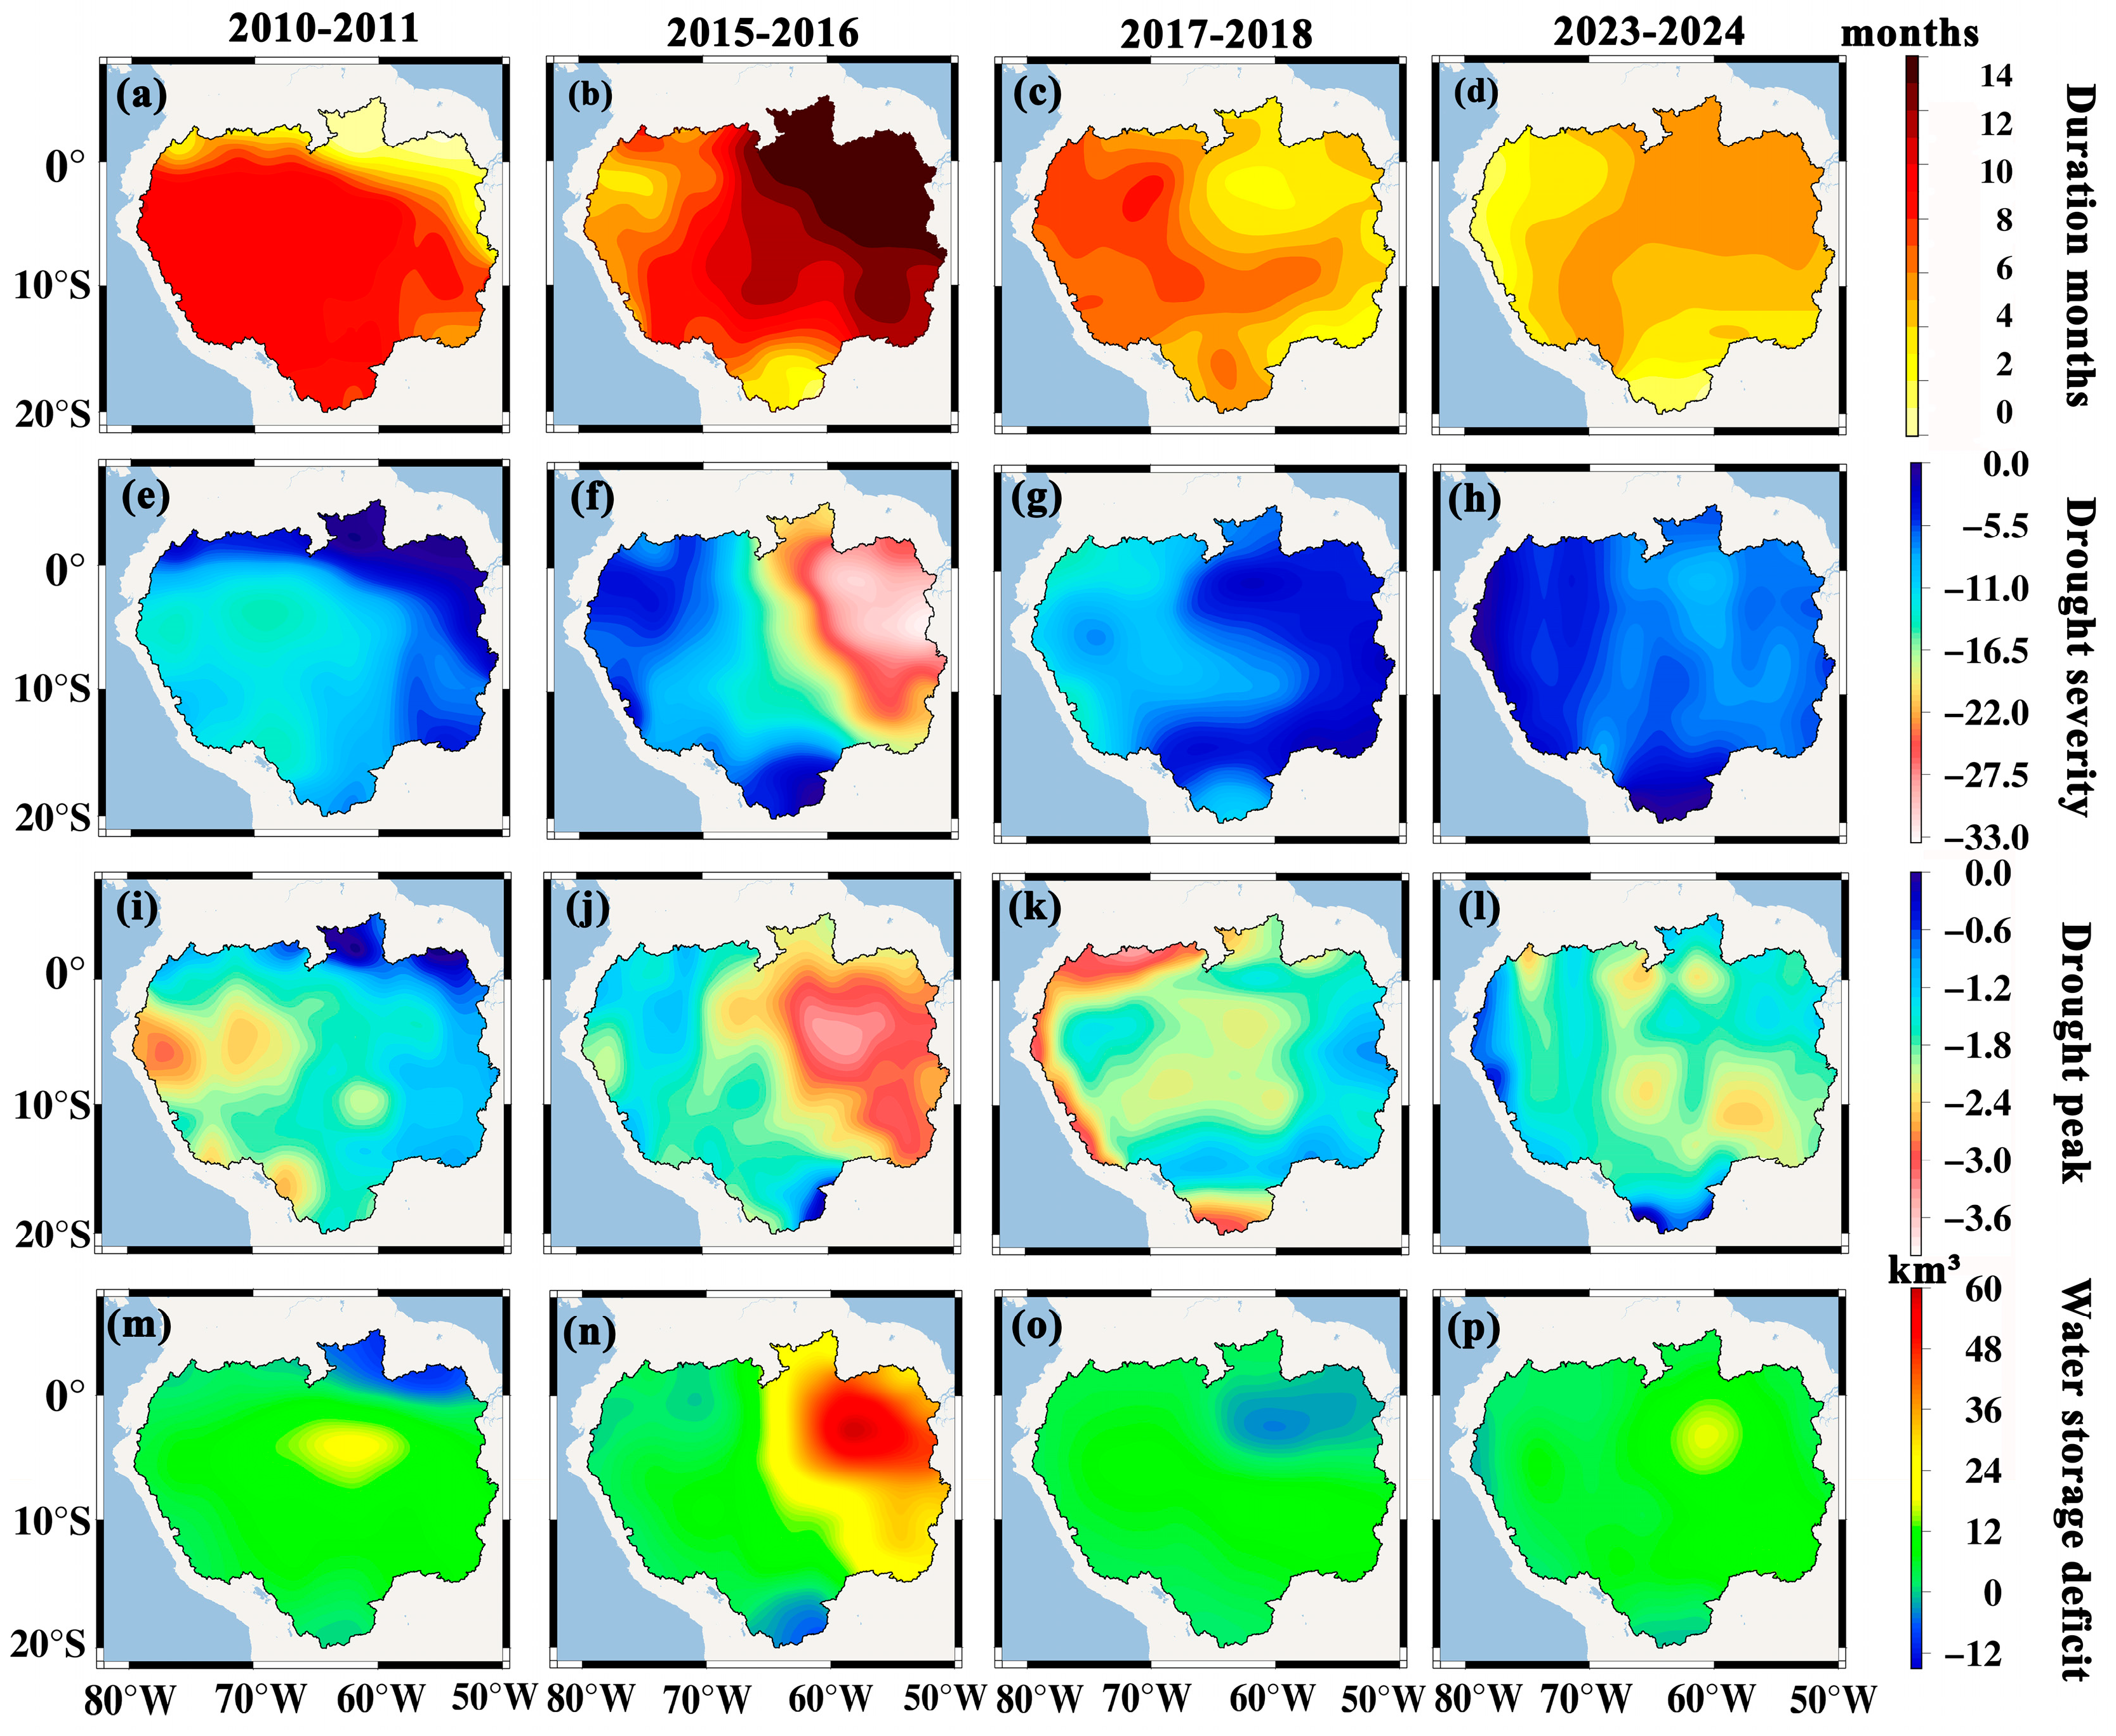
We compared the drought characteristics of the three extreme droughts in the study period with those of the current drought (Figure 11). In this drought, the drought duration shows a spatial distribution characterized by a long duration in the northeast and a short one in the southwest, with the longest drought duration in the northeast and parts of southwest (6 months) and only 1 month in a small part of the south (Figure 11d). This is similar to the spatial distribution of drought duration for the 2015–2016 drought, but the 2015–2016 drought had a longer duration (Figure 11b). In contrast, the spatial distribution of drought durations for the 2010–2011 and 2017–2018 droughts were just the opposite of the current drought, that is, long in the southeast and the short in the northwest. The spatial distributions of drought severity were essentially the same as those of drought duration (Figure 11e–h). Figure 8 shows that the peak of this drought has a discrete distribution. The larger peaks are mainly concentrated in the east, while the smallest peaks are distributed in the east and parts of the south. However, the peak distributions of the other three droughts are more concentrated, and the maximum peaks are higher than the current drought (Figure 11i–k). Comparing Figure 11m,n,p, the regions with the largest water storage deficit for these three droughts are in the northeast.
In summary, this drought is most similar to the characteristics of the 2015–2016 drought, but the drought severity is much lower. Moreover, the most severely affected regions in this drought are mainly concentrated in the northeast, while the eastern alpine region and the southern plains region are the least affected.
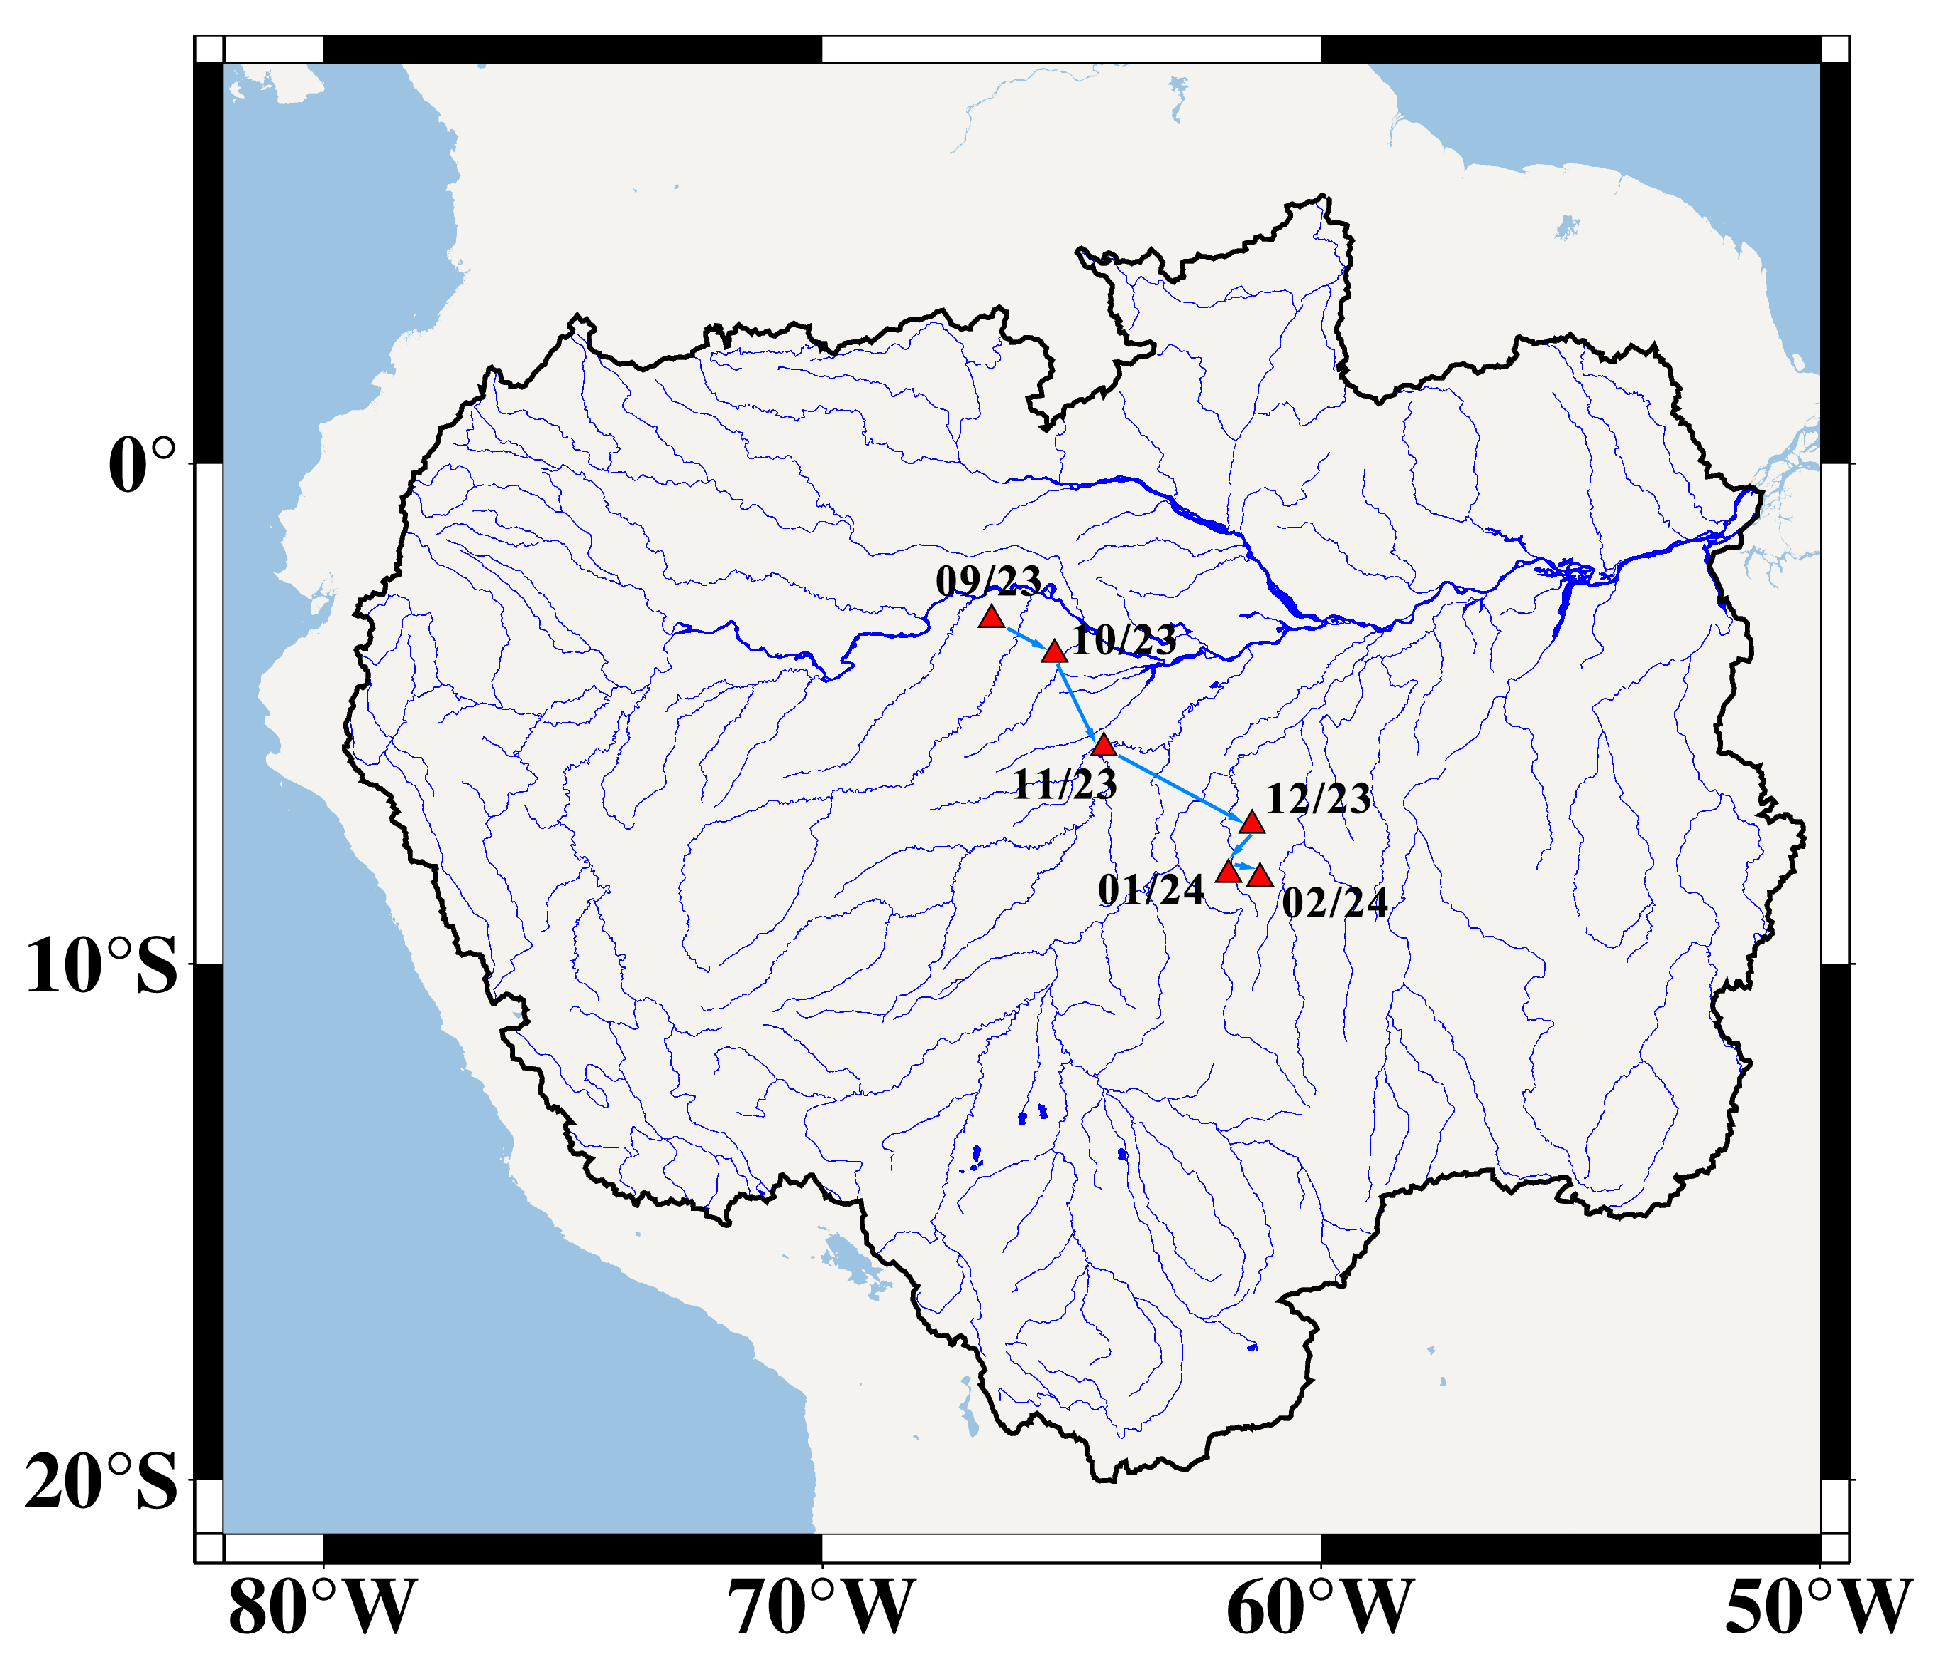
Figure 12 plots the trajectory of the center of gravity of this extreme drought. Initially, the center of gravity of the drought was in the central north. Subsequently, the center of gravity of the drought shifted to the southwest month by month over time. After December 2023, the location of the center of gravity of the drought was basically fixed with only minor changes. Essentially, this southwestward movement is a process of redistributing drought intensity driven by anomalies in tropical atmospheric circulation. During the Southern Hemisphere winter of 2023, the subtropical high over the South Atlantic strengthened abnormally, causing the path of water vapor transport from the Atlantic carried by the southeast trade winds to shift southward [63]. This resulted in the dominance of descending air currents in the north-central part of the ARB. The orographic lifting effect on the eastern slope of the Andes in the southwest prompted the remaining water vapor to form local PRE there. However, this PRE was still insufficient to offset the long-term ET loss, leading to the migration of the drought core area to ecologically fragile regions with low PRE response.

4.3. Drought Propagation

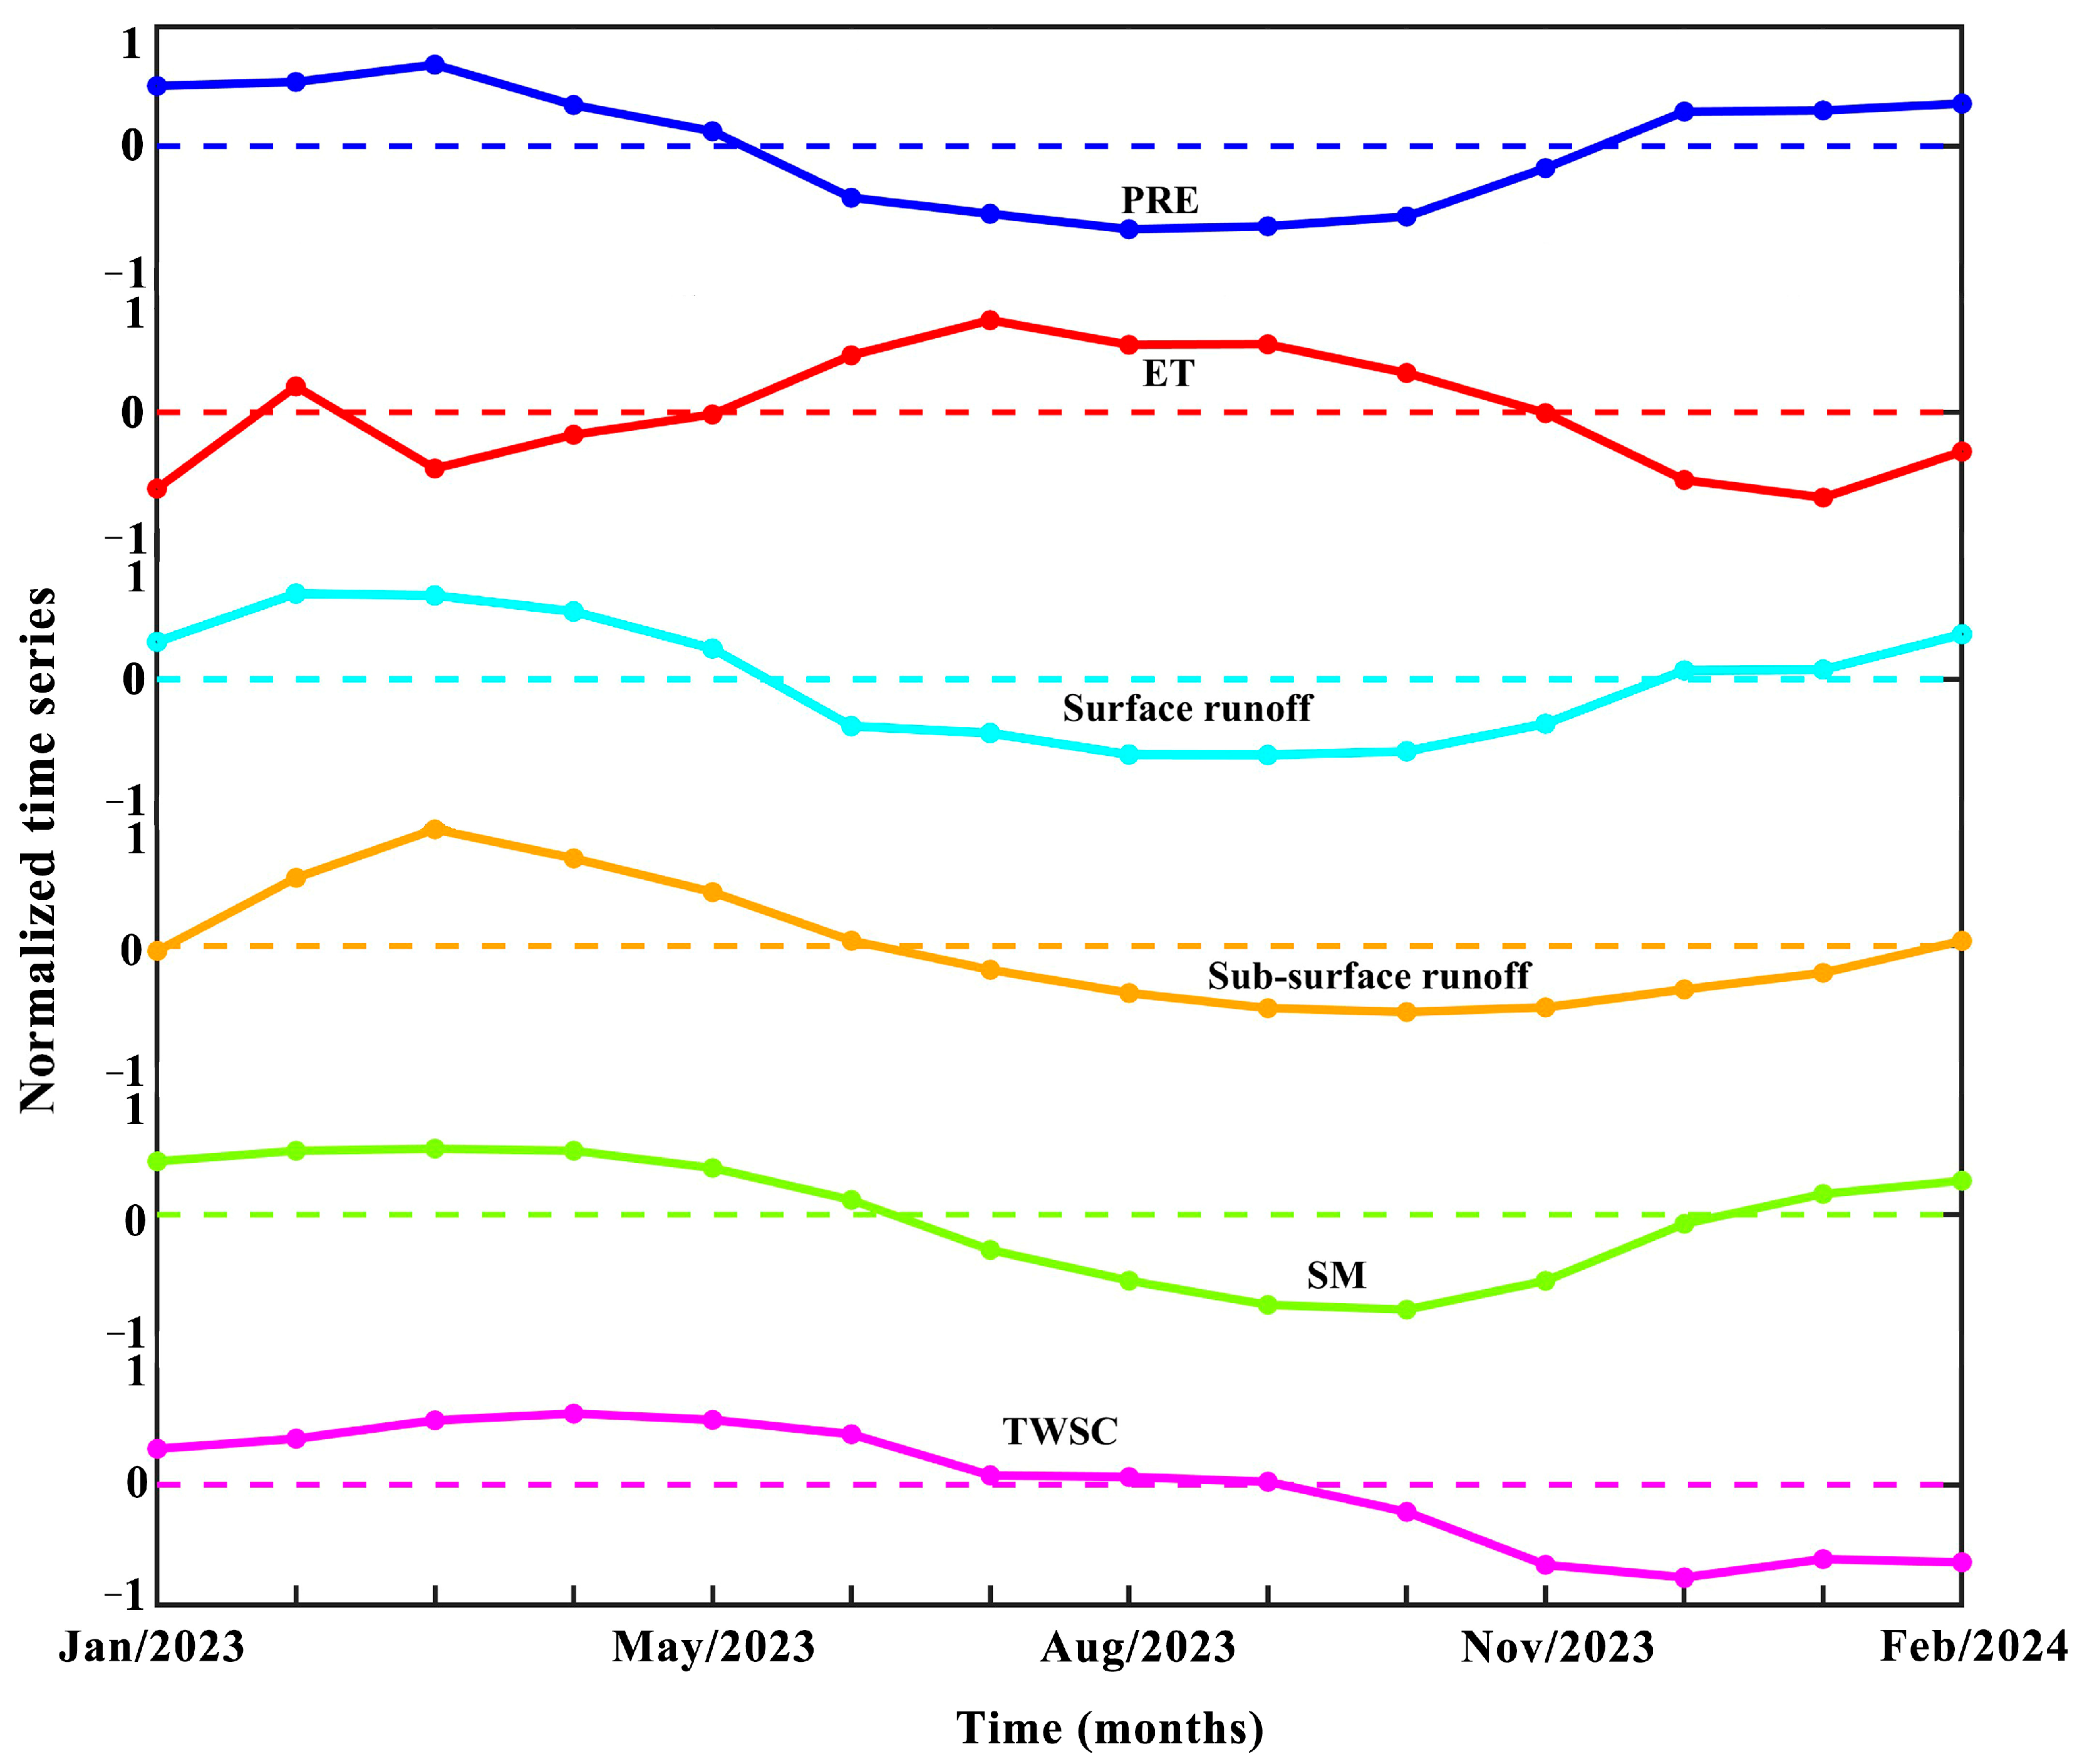
To analyze the propagation process of the extreme drought in the terrestrial water cycle, we normalized the time series of six meteorological and hydrological elements (PRE, ET, surface runoff, subsurface runoff, SM, and TWSC). In Figure 13, starting from June 2023, PRE and ET were low and high, respectively, compared to the normal years. The study region was in meteorological drought at this time. This indicates that this extreme drought was triggered by the combined effect of low PRE and high ET.
As low PRE and high ET persisted, surface runoff was the first to be affected, with a rapid deficit emerging, marking the onset of surface water drought. The maximum correlation coefficients between surface runoff and PRE and between surface runoff and ET were 0.96 and −0.78, respectively, with lag periods of 0 months and 1 month. Meteorological drought is a combined effect of PRE and ET. Surface water is highly sensitive to precipitation deficits and responds significantly faster to ET than to PRE. Therefore, in the same month that precipitation deficits occurred, surface water deficits also emerged, indicating that meteorological drought and surface water drought occurred simultaneously. In July 2023, the continuous reduction in surface runoff led to deficits in subsurface runoff and SM, thereby triggering groundwater drought and agricultural drought. The maximum correlation coefficients between PRE and subsurface runoff and between PRE and SM were 0.89 and 0.99, respectively, with a lag period of 1 month for both. For ET, the maximum correlation coefficients with subsurface runoff and SM were −0.73 and −0.83, respectively, with a lag period of 2 months for both. Combined with the results of surface runoff, the responses of subsurface runoff and SM to PRE and ET lagged significantly by 1 month. Thus, the propagation of meteorological drought to groundwater drought and soil water drought occurred 1 month later than that to surface water drought. As surface hydrological drought, groundwater drought, and agricultural drought continued to intensify, TWSC finally showed a deficit in October 2023, triggering a comprehensive hydrological drought. It is evident that this extreme drought transitioned from meteorological drought to hydrological drought within 5 months. The maximum correlation coefficients between PRE and TWSC and between ET and TWSC were 0.94 and −0.92, respectively, with a lag period of 5 months for both. These results also confirm the timeline of the transition from meteorological drought to hydrological drought.

4.4. Associated SST and Atmospheric Anomalies

To study the impact of El Niño events on this drought, we compared the time series of the Niño 3.4 index and GRACE-DSI from 2003 to 2024 and marked the El Niño events and droughts within the study period (Figure 14). By comparing Figure 14a,b, we found that El Niño events occurred before all drought events within the study period. A total of six droughts happened during the study period. The 2005 drought occurred from June to October 2005, preceded by an El Niño event from August 2004 to January 2005, and similar patterns were observed for the remaining five droughts. Prior to the 2023–2024 extreme drought, an El Niño event began in June 2023 and persisted until February 2024, with its peak reaching 1.95, second only to the 2014–2016 El Niño event. There is a certain correlation between the peak of drought and that of El Niño events: the higher the peak of an El Niño event, the higher the peak of the subsequent drought. For example, the 2014–2016 El Niño event had a peak value of 2.65 and the subsequent 2015–2016 drought reached a peak of −1.66, both of which were the highest in the study period. Similarly, the peak of the 2023–2024 drought was −1.29, the second-highest during the study period, and the preceding El Niño event also had the second-highest peak (1.95). The above phenomena indicate a teleconnection between El Niño events and droughts in the Amazon Basin. The calculation results show that the maximum correlation coefficient between the GRACE-DSI of the ARB and the Niño 3.4 index is 0.48, with a lag of 6 months.
A previous study showed that in El Niño years, PRE in the northern region may be reduced by 30% to 50% compared to normal years, and some areas even experience prolonged drought [64]. At the same time, due to the adjustment of atmospheric circulation, the transport of warm and humid air is affected, the distribution of solar radiation energy received by the ARB changes, and the temperature rises. A previous study showed that in years with strong El Niño, the average temperature in the ARB may increase by 1–2 °C [4].
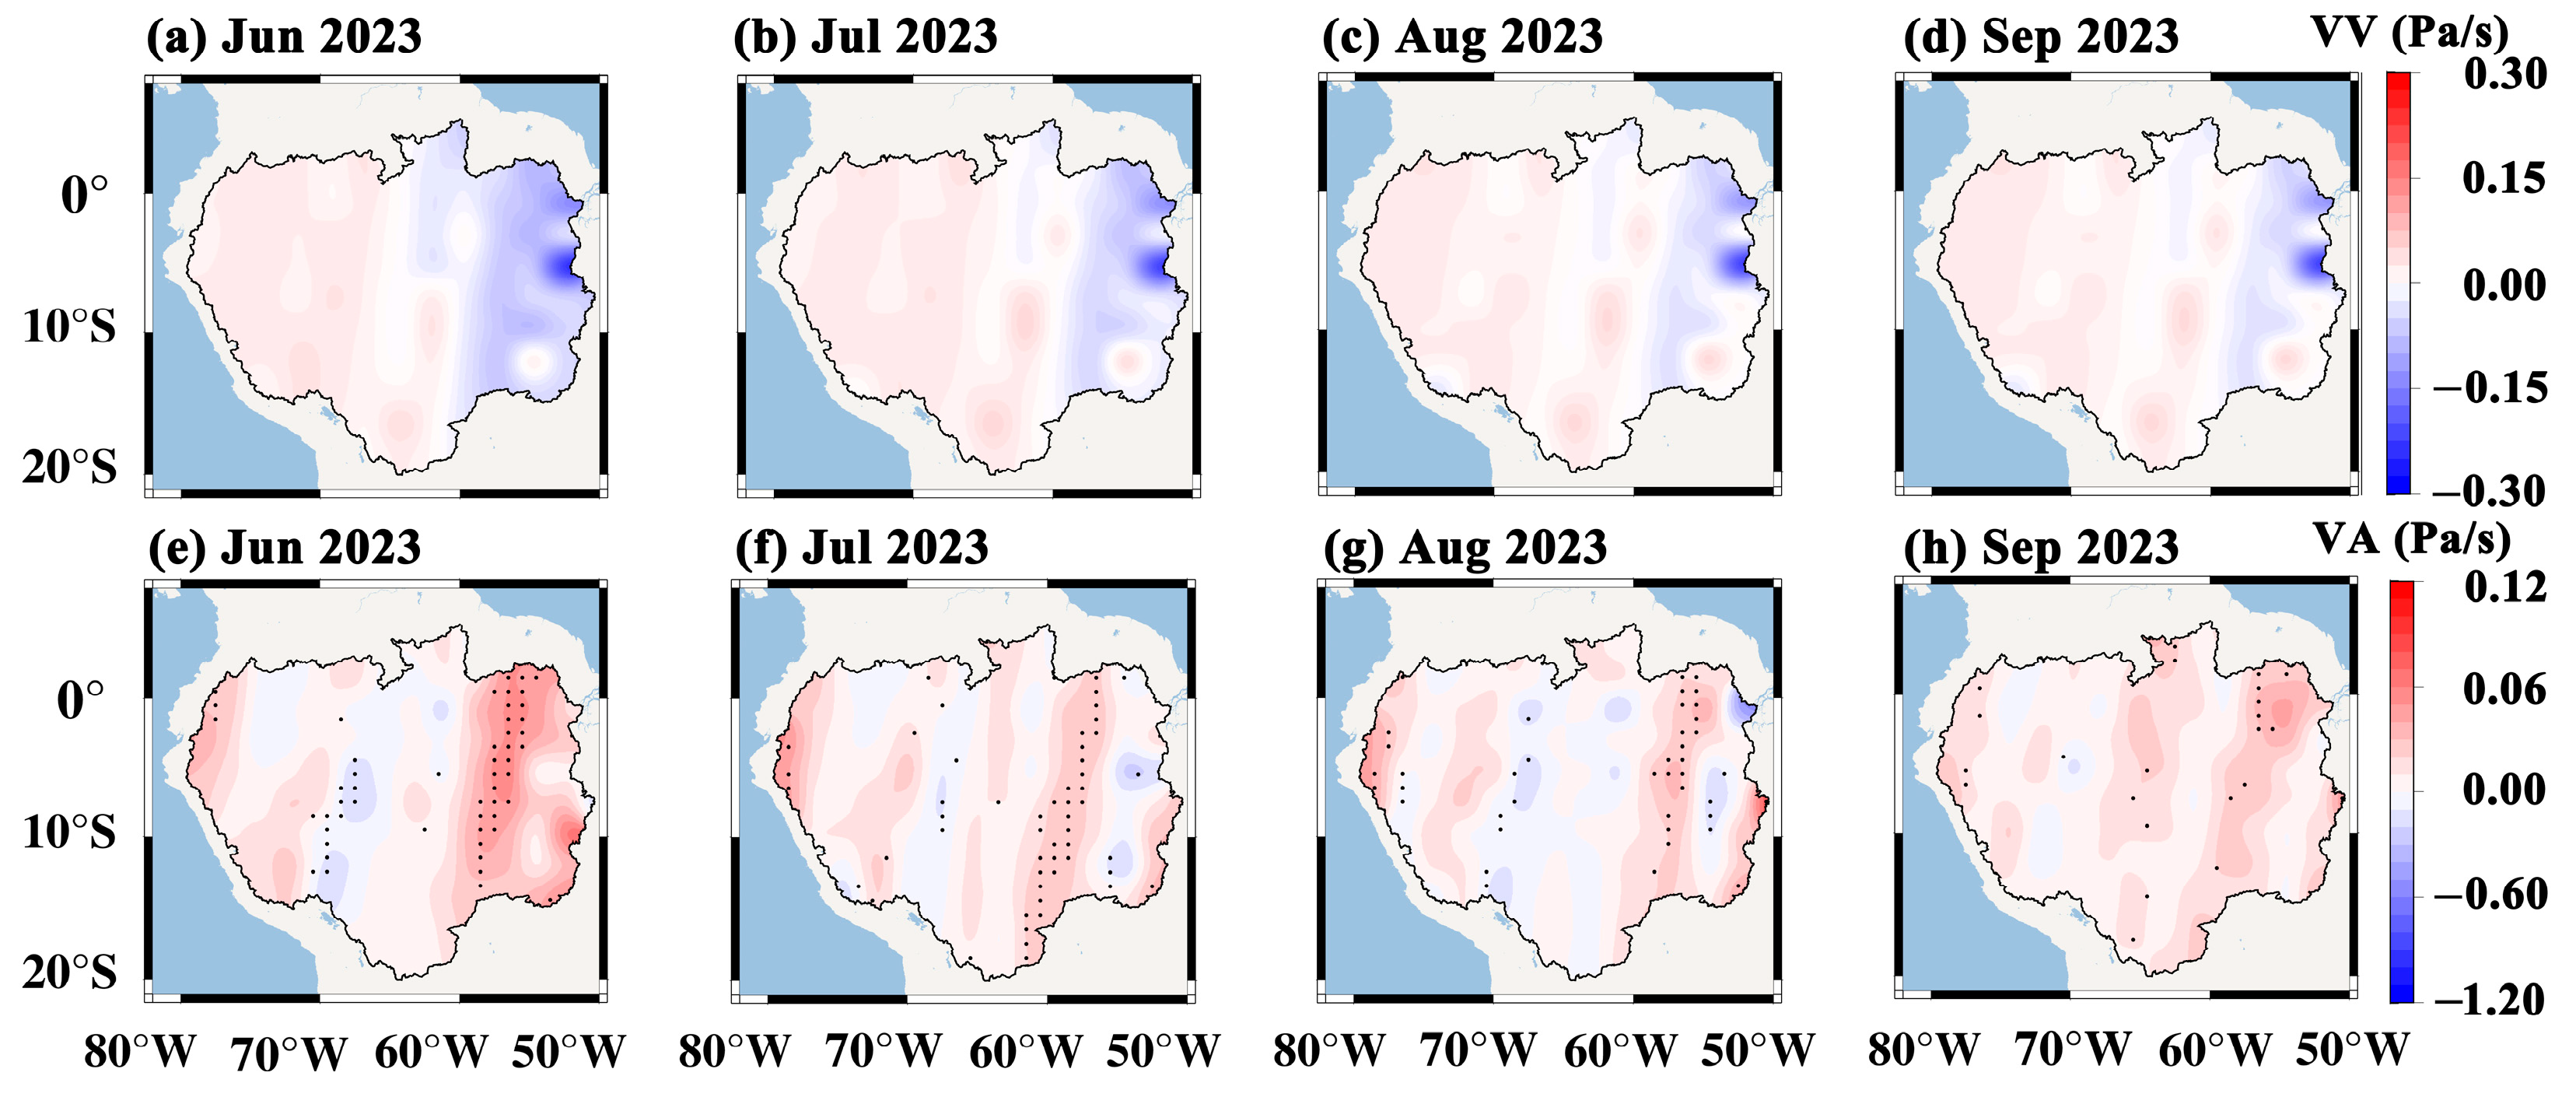
Atmospheric vertical motion is a key factor influencing PRE. Upward air currents promote the condensation of water vapor, leading to cloud formation and PRE, which are important conditions for the generation of PRE. In contrast, downward air currents cause adiabatic warming of the air, making it difficult for water vapor to condense and suppressing PRE formation. VV anomalies reflect the extent to which this motion deviates from the average state. The regions with significant anomalies indicate that the deviation in vertical motion from the climatic average state reaches a statistically significant level, and their impact on weather and climate is more pronounced. Therefore, we plotted the spatiotemporal evolution of VV and its anomalies in the ARB from June to September 2023. We used the Z-test to conduct a significance test on the anomalies.
As shown in Figure 15a–d, most regions of the ARB were under the control of downward motion from June to September 2023, with only a few regions in the east experiencing upward motion. Downward motion causes adiabatic compression and warming of the air, inhibits water vapor condensation, and leads to reduced cloud cover and scarce PRE [65]. For every 100 m the air sinks, the temperature rises by approximately 0.6 °C, resulting in a significant increase in near-surface air temperature [66]. June to September each year is the winter season in the ARB, during which the region is affected by the edge of the subtropical high-pressure system, with enhanced downward motion, thus forming the dry season [67].
Based on Figure 14, we can observe that positive anomalies of VV existed in most areas of the ARB from June to July 2023, mainly concentrated in the western and eastern regions. In June, the positive anomalies in the eastern region were relatively strong. Combined with Figure 15a, the upward motion in the eastern region was restricted and suppressed in June, which led to less PRE in the eastern region compared to normal years. The western region itself was under the control of downward motion, and the positive anomalies indicate that the downward motion in this region was enhanced, meaning that the PRE in this region was less and the temperature was higher than in normal years. Therefore, the western region was more prone to drought than the eastern region. The results in Figure 9a–c show that the drought started precisely from the western region. In July, the range of positive anomalies of VV expanded. Analysis combined with Figure 15b reveals that the downward motion in the central and western regions was stronger than in previous years, causing the drought to gradually spread from the western to the central region. Although the range of positive anomalies of VV contracted briefly in August, by September, the positive anomalies almost controlled most areas of the ARB. Figure 10 shows that the DAR reached 60% in September, after which the drought gradually spread to the entire basin.
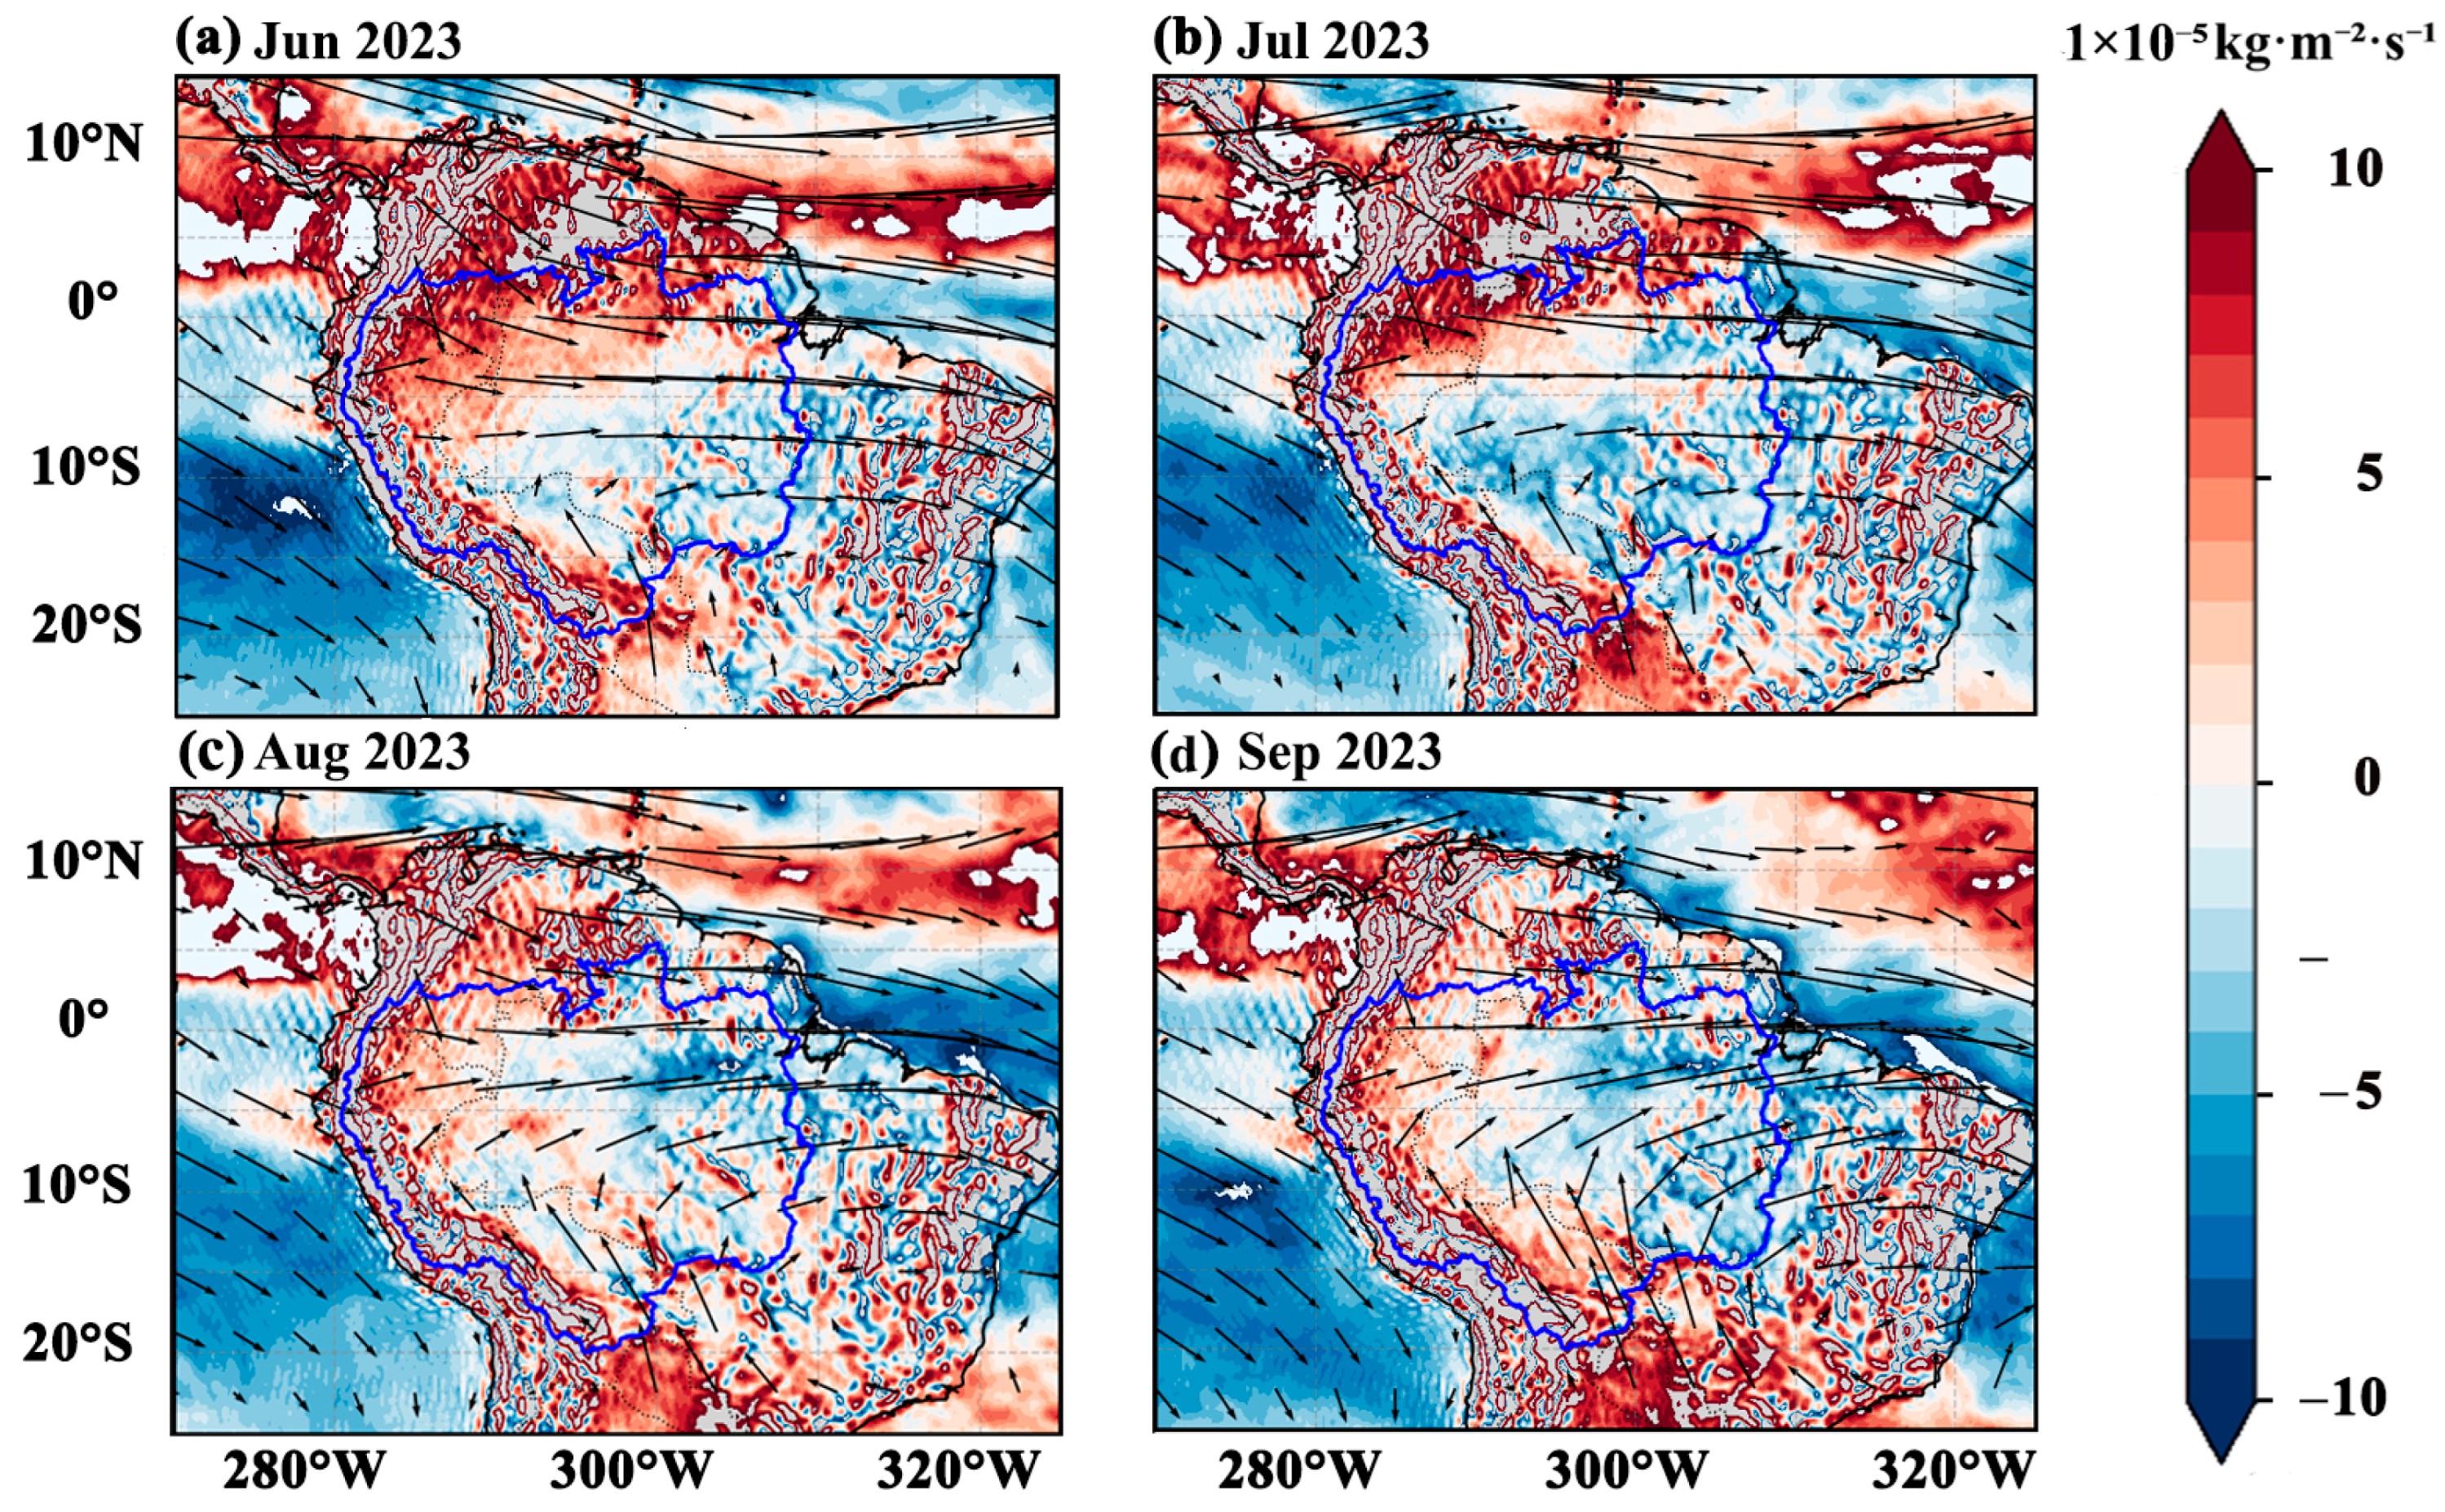
The positive and negative values of moisture flux divergence are closely related to PRE. Negative divergence (water vapor convergence) indicates a net inflow of water vapor in the region. The sufficient accumulation of water vapor provides the material basis for PRE, and when combined with upward motion, it significantly promotes the formation and enhancement of PRE. Positive divergence (water vapor divergence) indicates a net outflow of water vapor from the region. The loss of water vapor leads to insufficient water vapor supply in the region, making it difficult to form effective PRE even if upward motion exists [68,69].
By comparing Figure 15 and Figure 16, we found that the spatial distribution of divergence and VV is similar: the western part is dominated by positive divergence, corresponding to downward motion, while the eastern part is dominated by negative divergence, corresponding to upward motion. In Figure 16, positive divergence is mainly concentrated in the northwestern and southern parts of the ARB (in June). At this time, the VIWVF shows a west-to-east movement trend, with arrows in the northern part deflecting toward the Caribbean Sea and those in the southern part deflecting toward the Brazilian Plateau (Figure 16a). This causes the water vapor in the ARB to be transported from inland to the ocean. Contrary to the usual water vapor transport from the ocean to inland, this leads to a reduction in water vapor over the ARB. This is caused by the stronger-than-normal subtropical high in the South Atlantic and the development of anticyclones around the ARB, which result in the weakening of the easterlies. From July to September (Figure 16b–d), the transport direction of the VIWVF generally maintains this trend, while the western and southern parts remain under the control of positive divergence. This makes it difficult for water vapor to condense, resulting in a persistent lack of PRE. This is consistent with the fact that the drought in the ARB shown in Figure 9 is mainly concentrated in the western and southern parts.

5. Discussion

5.1. Connection Between Atmospheric Vertical Movement and El Niño

The VV anomalies show a significant positive correlation with the Niño 3.4 index (CC = 0.46, p < 0.05). The impact of an El Niño event on atmospheric vertical movement in the ARB is mainly achieved by altering the Walker circulation pattern in the tropical Pacific [70]. During an El Niño event, the abnormal warming of sea surface temperatures in the central and eastern equatorial Pacific causes the weakening of the Walker circulation. The ascending airflow originally in the western Pacific shifts eastward to the central Pacific, while the western Pacific (including the ARB) turns into abnormally descending airflow [71]. This circulation adjustment directly inhibits convective activities in the ARB, leading to a significant reduction in PRE. From June to October 2023, the average VV anomaly in the ARB was 0.08 Pa/s (descending), which was a 60% increase in descending intensity compared to the climatological mean (0.05 Pa/s) [8]. There was a significant positive correlation between VV anomalies and the reduction in PRE (CC = 0.50, p < 0.05). In 2023, the PRE in the ARB was about 60% less than the normal level. The adiabatic warming caused by the enhanced descending airflow exacerbated the high-temperature drought. In September 2023, the average temperature in the ARB was 1.5–2 °C higher than normal [72].

5.2. Impact of Human Activities

The ARB is home to the world’s largest tropical rainforest. Its dense vegetation releases massive amounts of water into the atmosphere through transpiration: it is estimated that the Amazon rainforest releases up to billions of cubic meters of water into the atmosphere each day via this process. The moisture entering the atmosphere increases air humidity, providing sufficient water vapor conditions for precipitation formation. However, human activities in the ARB have become increasingly frequent in recent decades, particularly deforestation, which has led to a sharp reduction in the area of the Amazon rainforest. Data from Brazil’s National Space Agency show that between August 2018 and July 2019, the deforested area of the Amazon rainforest reached 13,235 square kilometers, a year-on-year increase of 22%, marking the highest figure since the same period in 2005–2006 (14,286 km2) [73]. From 2019 to 2022, the situation of forest loss in the ARB deteriorated drastically, with the deforested area increasing by 75% compared to the average of the previous decade [74]. The disappearance of large areas of tropical rainforest has significantly weakened vegetation transpiration, leading to a substantial reduction in the amount of water released into the atmosphere by the Amazon rainforest through transpiration. This in turn has lowered atmospheric humidity, hindering precipitation formation and thereby exacerbating the severity of the drought.

6. Conclusions

In this study, we employed comprehensive data comprising satellite gravity measurements, extreme climate, and atmosphere movement to conduct a holistic analysis of the 2023 extreme drought in the ARB. Our investigation dissected the drought’s formation through multifaceted lenses: extreme climatic, atmospheric movement, water vapor transport dynamics, and anthropogenic influences. The key findings are summarized as follows.
(1)
This extreme drought, ranked as the fourth-most severe in the ARB since 2003, exhibited a six-month duration with a drought peak of −1.29 and a drought severity index of −5.62. Initiating in the northwestern subregion, the drought propagated eastward and southward, eventually encompassing the entire basin. The eastern sector suffered the most pronounced impacts, characterized by the largest depletion of TWS.
(2)
Spatially, the 2023 drought’s footprint mirrored that of the 2015–2016 event, yet featured distinct temporal-severity metrics: it had the longest duration and highest severity in the basin’s eastern domain alongside the most significant water storage deficit in that region. While the 2015–2016 drought exhibited greater overall severity, both events recorded comparable peak drought indices: the former endured for 14 months, contrasting with the 2023 drought’s six-month duration.
(3)
The direct causes of the drought are reduced PRE and increased temperatures. However, this drought is closely linked to the El Niño event that occurred in June 2023. The El Niño event led to an abnormal intensification of atmospheric descending movements in the ARB by altering the Walker circulation, thereby resulting in reduced PRE and rising temperatures. Additionally, extensive deforestation of the Amazon rainforest due to human activities has also contributed to and exacerbated drought severity.
The GRACE/GFO satellites, which monitor TWSC via gravity field variations, have a spatial resolution of ~330 km. This coarse resolution hinders their ability to resolve fine-scale hydrological dynamics in the ARB’s complex topography, including Andean slopes, alluvial plains, and floodplains, where groundwater recharge, soil moisture, and transpiration exhibit heterogeneous drought responses. Additionally, the 21-year data (2002–present) are insufficient to characterize multi-decadal climate modes (e.g., the 60- to 80-year Atlantic Meridional Mode), limiting our ability to distinguish long-term drought trends from short-term anomalies. To address these constraints, future research will focus on two key initiatives: (1) spatial downscaling: employ deep learning to integrate high-resolution hydrometeorological data, enhancing GRACE TWSC resolution from 330 km to <50 km to capture subregional drought processes; and (2) temporal extension: use deep learning algorithms with long-term precipitation and temperature records to reconstruct pre-2002 TWSC data, extending the data to better resolve climate mode cycles. Additionally, quantifying the contributions of individual drought drivers—an unresolved challenge in hydrology—will be a critical focus for subsequent studies, bridging gaps in mechanistic understanding and predictive capabilities.
Our research results have transformed the previous simple analysis of observational data. By integrating multidisciplinary data, we have achieved a closed-loop study of drought events encompassing observation verification, mechanism analysis, and process reconstruction. This provides a multidimensional evidence chain for understanding the dynamics of terrestrial water storage under extreme climate events and also offers a new perspective and method for drought research based on satellite gravity data.

Author Contributions

Conceptualization, L.C. and J.Z.; methodology, L.C.; data curation, J.Z.; writing—original draft preparation, L.C.; writing—review and editing, L.C. and C.Y.; visualization, Y.L. (Yu Li); supervision, J.M.; project administration, Y.L. (Yuheng Lu); funding acquisition, Z.Z. All authors have read and agreed to the published version of the manuscript.

Funding

This research was funded by the National Center for Precision Gravity Measurement Science Open Subject (grants PGMF-2024-P001 and PGMF-2024-Q003), National Natural Science Foundation of China (grant 42474045), Guangdong Basic and Applied Basic Research Foundation (grant 2022A1515010469), and Scientific Research Fund of Institute of Seismology, China Earthquake Administration (grant IS202456376).

Data Availability Statement

The original data presented in the study are included in the article. Further inquiries can be directed to the corresponding author.

Acknowledgments

We are grateful to CSR., GFZ., and JPL. for providing the monthly GRACE gravity field solution, the Goddard Space Flight Center for providing the monthly GLDAS-2.2 data, the Copernicus Climate Change Service for providing the monthly ERA5-land data, and the NOAA for providing the monthly extreme climate index and atmospheric circulation data.

Conflicts of Interest

The authors declare no conflicts of interest.

Abbreviations

The following abbreviations are used in this manuscript:
ARBAmazon River Basin
PREprecipitation
TWSterrestrial water storage
SMsoil moisture
TWSCterrestrial water storage change
GRACEGravity Recovery and Climate Experiment
GFOGRACE Follow-On
WSDwater storage deficit
ENSOEl Niño–Southern Oscillation
SHspherical harmonic
CSRCenter for Space Research at the University of Texas at Austin
GFZHelmholtz Centre Potsdam—German Research Centre for Geosciences
JPLJet Propulsion Laboratory
GPMglobal precipitation measurement
ETevapotranspiration
SPEIstandardized precipitation evapotranspiration index
SCPDSIself-calibrating palmer drought severity index
SSTsea surface temperature
NOAANational Oceanic and Atmospheric Administration
NCEP–DOENational Centers for Environment Prediction–Department of Energy
GRACE-DSIGRACE-based drought severity index
DARdrought area ratio
CCcorrelation coefficient
NSENash–Sutcliffe efficiency coefficient
SEWCsouth equatorial warm current
SHPSsubtropical high pressure system
GLDASGlobal Land Data Assimilation System
VIWVFvertical integrated water vapor flux

Appendix A

Figure A1. Temporal evolution of the original signal (a), long-term trend signal (b), seasonal signal (c), and residual signal (d) of TWSC in the ARB from January 2003 to February 2024.
Remotesensing 17 02765 g0a1

References

  1. Chris, F. Ethiopia, Somalia and Kenya face devastating drought. Nature 2020, 586, 645–646. [Google Scholar] [CrossRef]
  2. Dai, A. Drought under global warming: A review. WIREs Clim. Change 2011, 2, 45–65. [Google Scholar] [CrossRef]
  3. Cui, L.; Zhang, C.; Yao, C.; Luo, Z.; Wang, X.; Li, Q. Analysis of the influencing factors of drought events based on GRACE data under different climatic conditions: A case study in Mainland China. Water 2021, 13, 2575. [Google Scholar] [CrossRef]
  4. Climate Change Made 2023 Amazon Drought 30 Times More Likely, Scientist Say. Available online: https://news.mongabay.com/2024/01/climate-change-made-2023-amazon-drought-30-times-more-likely-scientists-say/ (accessed on 8 June 2025).
  5. Record Temperatures and Heatwaves Bring Unprecedented Drought to the Amazon Basin. Available online: https://joint-research-centre.ec.europa.eu/jrc-news-and-updates/record-temperatures-and-heatwaves-bring-unprecedented-drought-amazon-basin-2023-12-20_en (accessed on 8 June 2025).
  6. Amazons. Record Drought Driven by Climate Change. Available online: https://www.bbc.com/news/science-environment-68032361 (accessed on 11 June 2025).
  7. Drought Parches the Central Amazon in October 2023. Available online: https://www.climate.gov/news-features/event-tracker/drought-parches-central-amazon-october-2023 (accessed on 11 June 2025).
  8. Espinoza, J.; Jimenez, J.; Marengo, J.; Schongart, J.; Ronchail, J.; Lavado-Casimiro, W.; Ribeiro, J. The new record of drought and warmth in the Amazon in 2023 related to regional and global climatic features. Sci. Rep. 2024, 14, 8107. [Google Scholar] [CrossRef] [PubMed]
  9. Gouweleew, B.; Kvas, A.; Gruber, G.; Gain, A.; Mayer-Gürr, T.; Flechtner, F.; Güntner, A. Daily GRACE Field solutions track major flood events in the Ganges-Brahmaputra Delata. Hydrol. Earth Syst. Sci. 2018, 22, 2867–2880. [Google Scholar] [CrossRef]
  10. Scanlon, B.; Zhang, Z.; Save, H.; Sun, A.; Schrnied, H.; van Beek, L.; Wiese, D.; Wada, Y.; Long, D.; Reedy, R.; et al. Global models underestimate large decadal declining and rising water storage trends relative to GRACE satellite data. Proc. Natl. Acad. Sci. USA 2018, 115, E1080–E1089. [Google Scholar] [CrossRef]
  11. Mu, Q.; Zhao, M.; Running, S. Improvements to a MODIS global terrestrial evapotranspiration algorithm. Remote Sens. Environ. 2011, 115, 1781–1800. [Google Scholar] [CrossRef]
  12. Chawla, I.; Karthikeyan, L.; Mishra, A. A review of remote sensing applications for water security: Quantity, quality, and extremes. J. Hydrol. 2020, 585, 124826. [Google Scholar] [CrossRef]
  13. Reager, J.; Thomas, B.; Famiglitti, J. River basin flood potential inferred using GRACE gravity observations at several months lead time. Nat. Geosci. 2014, 7, 588–592. [Google Scholar] [CrossRef]
  14. Tapley, B.; Watkins, M.; Flechtner, F.; Reigber, C.; Bettadpur, S.; Rodell, M.; Sasgen, I.; Famiglietti, J.; Landerer, F.; Chambers, D.; et al. Contributions of GRACE to understanding climate change. Nat. Clim. Change 2019, 9, 358–369. [Google Scholar] [CrossRef]
  15. Cui, L.; Meng, J.; Li, Y.; An, J.; Zou, Z.; Zhong, L.; Mao, Y.; Wu, G. Spatiotemporal evolution characteristics of 2022 Pakistan severe flood event based on multi-source satellite gravity observations. Remote Sens. 2024, 16, 1601. [Google Scholar] [CrossRef]
  16. Chen, J.; Wilson, C.; Tapley, B.; Yang, Z.; Niu, G. 2005 drought event in the Amazon River basin as measured by GRACE and estimated by climate models. J. Geophys. Resear. Solid Earth 2009, 114, B05404. [Google Scholar] [CrossRef]
  17. Thomas, A.; Reager, J.; Famiglietti, J.; Rodell, M. A GRACE-based water storage deficit approach for hydrological drought characterization. Geophys. Resear. Lett. 2014, 41, 1537–1545. [Google Scholar] [CrossRef]
  18. Nie, N.; Zhang, W.; Guo, H.; Ishwaran, N. 2010-2012 drought and flood events in the Amazon basin inferred by GRACE satellite observations. J. Appl. Remote Sens. 2015, 9, 096023. [Google Scholar] [CrossRef]
  19. Panisset, J.; Libonati, R.; Gouveia, C.; Machado-Silva, F.; França, D.; França, J.; Peres, L. Contrasting patterns of the extreme drought episodes of 2005, 2010 and 2015 in the Amazon basin. Int. J. Climatol. 2018, 38, 1096–1104. [Google Scholar] [CrossRef]
  20. Da Encarnação, T.; Arnold, D.; Bezděk, A.; Dahle, C.; Doornbos, E.; van den IJssel, J.; Jäggi, A.; Mayer-Gürr, T.; Sebera, J.; Visser, P.; et al. Gravity field models derived from Swarm GPS data. Earth Planets Space 2016, 68, 127. [Google Scholar] [CrossRef]
  21. Zangerl, F.; Griesaucr, F.; Sust, M.; Montenbruck, O.; Buckert, B.; Garcia, A. SWARM GPS Precise Orbit Determination Receiver Initial In-Orbit Performance Evaluation. In Proceedings of the 27th International Technical Meeting of the Satellite Division of the Institute of Navigation, Tampa, FL, USA, 8–12 September 2014; pp. 1459–1468. [Google Scholar]
  22. Teixeira da Encarnação, J.; Visser, P.; Arnold, D.; Bezdek, A.; Doornbos, E.; Ellmer, M.; Guo, J.; van den IJssel, J.; Iorfida, E.; Jäggi, A.; et al. Description of the multi-approach gravity field models from Swarm GPS data. Earth Syst. Sci. Data 2020, 12, 1385–1417. [Google Scholar] [CrossRef]
  23. Bezdĕk, A.; Sebera, J.; Teixeira da Encarnação, J.; Klokocnik, J. Time-variable gravity fields derived from GPS tracking of Swarm. Geophys. J. Int. 2016, 205, 1665–1669. [Google Scholar] [CrossRef]
  24. Jäggi, A.; Dahle, C.; Arnold, D.; Bock, H.; Meyer, U.; Beutler, G.; van den Ijssel, J. Swarm kinematic orbits and gravity fields from 18 months of GPS data. Adv. Space Res. 2016, 57, 218–233. [Google Scholar] [CrossRef]
  25. Lück, C.; Kusche, J.; Rietbroek, R.; Löcher, A. Time-variable gravity fields and ocean mass change from 37 months of kinematic Swarm orbits. Solid Earth 2018, 9, 323–339. [Google Scholar] [CrossRef]
  26. Cui, L.; Meng, J.; Zhong, B.; An, J.; Li, Y.; Guo, H.; Lu, Y. Spatiotemporal evolution of 1998 extreme flood event in the Yangtze River basin from the perspective of the reconstructed GRACE/GRACE-FO data. J. Hydrol. Regional Studies 2025, 60, 102551. [Google Scholar] [CrossRef]
  27. Cui, L.; Song, Z.; Luo, Z.; Zhong, B.; Wang, X.; Zou, Z. Comparison of terrestrial water storage changes derived from GRACE/GRACE-FO and Swarm: A case in the Amazon River basin. Water 2020, 12, 3128. [Google Scholar] [CrossRef]
  28. Li, F.; Wang, Z.; Chao, N.; Feng, J.; Zhang, B.; Tian, K. 2015–2016 drought event in the Amazon River basin as measured by Swarm constellation. Geomat. Inf. Sci. Wuhan Univ. 2020, 45, 595–603. (In Chinese) [Google Scholar]
  29. Cui, L.; Yin, M.; Huang, Z.; Yao, C.; Wang, X.; Lin, X. The drought events over the Amazon River basin from 2003 to 2020 detected by GRACE/GRACE and Swarm satellites. Remote Sens. 2020, 14, 2887. [Google Scholar] [CrossRef]
  30. Yuan, D.; Lu, E. Severe drought in Northeast China during summer 2014: Anomalies in atmospheric circulation and humidity. Int. J. Climatol. 2020, 42, 7532–7544. [Google Scholar]
  31. Cui, L.; Zhong, L.; Meng, J.; An, J.; Zhang, C.; Li, Y. Spatiotemporal evolution features of the 2022 compound hot and drought event over the Yangtze River basin. Remote Sens. 2024, 16, 1367. [Google Scholar] [CrossRef]
  32. Duffy, P.; Brando, P.; Asner, G.; Field, C.; Christopher, B. Projections of future meteorological drought and wet periods in the Amazon. Proc. Natl. Acad. Sci. USA 2015, 112, 13172–13177. [Google Scholar] [CrossRef] [PubMed]
  33. Papastefanon, P.; Zang, C.; Angelov, Z.; de Castro, A.; Jimenez, J.; de Rezande, L.; Ruscica, R.; Sakschewski, B.; Sörensson, A.; Thonicke, K.; et al. Recent extreme drought events in the Amazon rainforest: Assessment of different precipitation and evapotranspiration datasets and drought indicators. Bioeosciences 2022, 19, 3843–3861. [Google Scholar]
  34. Cheng, M.; Tapley, B. Variances in the Earth’s oblateness during the past 28 years. J. Geophys. Resear. Solid Earth 2004, 109, B09402. [Google Scholar]
  35. Swenson, S.; Chambers, D.; Whar, J. Estimating geocenter variations from a combination of GRACE and ocean model input. J. Geophys. Resear. Solid Earth 2008, 113, B08410. [Google Scholar]
  36. Landerer, F.; Swenson, S. Accuracy of scaled GRACE terrestrial water storage estimates. Water Resour. Resear. 2012, 48, W04531. [Google Scholar] [CrossRef]
  37. Jean, Y.; Meyer, U.; Jäggi, A. Combination of GRACE monthly gravity field solutions from different processing strategies. J. Geod. 2018, 92, 1313–1328. [Google Scholar] [CrossRef]
  38. Huffman, G.; Stocker, E.; Bolvin, D.; Nelkin, E.; Tan, J. GPM IMERG Final Precipitation L3 1 Day 0.1 Degree × 0.1 Degree V06; Savtchenko, A., Ed.; Goddard Earth Sciences Data and Information Services Center (GES DISC): Greenbelt, MD, USA, 2019. [Google Scholar]
  39. Muñoz-Sabater, J.; Dutra, E.; Agusti-Panareda, A.; Albergel, C.; Arduini, G.; Balsamo, G.; Boussetta, S.; Choulga, M.; Harrigan, S.; Hersbach, H.; et al. ERA-land: A state-of-the-art global reanalysis dataset for land applications. Earth Syst. Sci. Data 2021, 13, 4349–4383. [Google Scholar] [CrossRef]
  40. Tegos, A.; Stefanidis, S.; Cody, J.; Koutsoyiannis, D. On the Sensitivity of Standardized-Precipitation-Evapotranspiration and Aridity Indexes Using Alternative Potential Evapotranspiration Models. Hydrology 2023, 10, 64. [Google Scholar] [CrossRef]
  41. Dai, A.; Trenberth, K.; Qian, T. A global dataset of Palmer Drought Severity Index for 1870–2002: Relationship with soil moisture and effects of surface warming. J. Hydrometeorol. 2004, 5, 1117–1130. [Google Scholar] [CrossRef]
  42. Wells, N.; Goddard, S.; Hayes, M. A self-calibrating palmer drought severity index. J. Clim. 2004, 17, 2335–2351. [Google Scholar] [CrossRef]
  43. Wang, L.; Huang, G.; Chen, W.; Wang, T. Super drought under global warming: Concept, monitoring index and validation. Bull. Am. Meteorol. Soc. 2023, 104, E943–E969. [Google Scholar] [CrossRef]
  44. Trenberth, K. The definition of El Niño. Bull. Amer. Meteorol. Soc. 1997, 78, 2771–2777. [Google Scholar] [CrossRef]
  45. L’Heureux, M.; Thompson, D. Observed relationships between the El Niño-Southern Oscillation and the extratropical zonal-mean circulation. J. Clim. 2006, 19, 276–287. [Google Scholar] [CrossRef]
  46. Sakumura, C.; Bettadpur, S.; Bruinsma, S. Comparison of GRACE gravity field models. Geophys. Res. Lett. 2014, 41, 2638–2645. [Google Scholar]
  47. Long, D.; Pan, Y.; Zhou, J.; Chen, Y.; Hou, X.; Hong, Y.; Scanlon, B.; Longuevergne, L. Global analysis of spatiotemporal variability in merged total water storage changes using multiple GRACE products and global hydrological models. Remote Sens. Environ. 2017, 192, 198–216. [Google Scholar] [CrossRef]
  48. Cui, L.; Luo, C.; Yao, C.; Zou, Z.; Wu, G.; Li, Q.; Wang, X. The influence of climate change on forest fires in Yunnan province, Southwest China detected by GRACE satellites. Remote Sens. 2022, 14, 712. [Google Scholar] [CrossRef]
  49. Lu, J.; Jia, L.; Zhou, J. Quantification and assessment of global terrestrial water storage deficit caused by drought using GRACE satellite data. IEEE J. Sel. Top. Appl. Earth Obs. Remote Sens. 2022, 15, 5001–5012. [Google Scholar] [CrossRef]
  50. Cleveland, R.; Cleveland, W.; Terpenning, I. STL: A seasonal-trend decomposition procedure based on loess. J. Off. Stat. 1990, 6, 3–73. [Google Scholar]
  51. Duan, A.; Zhong, Y.; Xu, G.; Yang, K.; Tian, B.; Wu, Y.; Bai, H.; Hu, E. Quantifying the 2022 extreme drought in the Yangtze River basin using GRACE-FO. J. Hydrol. 2024, 630, 130680. [Google Scholar] [CrossRef]
  52. Zhao, M.; Geruo, A.; Velicogna, I.; Kimball, J. A global gridded dataset of GRACE drought severity index for 2002-14: Comparison with PDSI and SPEI and a case study of the Australia millennium drought. J. Hydrometeorol. 2017, 18, 2117–2129. [Google Scholar] [CrossRef]
  53. Vicente-Serrano, S. Differences in spatial patterns of drought on different time scales: An analysis of the Iberian Peninsula. Water Resour. Manag. 2006, 20, 37–60. [Google Scholar] [CrossRef]
  54. Liu, Y.; Hu, K.; Huang, G. Effect of the Tropical Sea Surface Temperature on the Interannual Rainfall Variability and Its Mechanism over the Amazon in the Dry Season. Clim. Environ. Res. 2020, 27, 263–275. (In Chinese) [Google Scholar]
  55. Chen, Z.; Li, J.; Xiang, B.; Duan, Q.; Li, S.; Wang, S. Spatiotemporal variation of drought in Yunnan province calculated using the standardized precipitation index. J. Irrig. Drain. 2023, 42, 92–99. (In Chinese) [Google Scholar]
  56. Cui, L.; Chen, X.; An, J.; Yao, C.; Su, Y.; Zhu, C.; Li, Y. Spatiotemporal variation characteristics of drought and their connection to climate variability and human activity in the Pearl River basin, South China. Water 2023, 15, 1720. [Google Scholar] [CrossRef]
  57. Li, P.; Hu, Z.; Liu, Y. Shift in the trend of browning in Southwestern Tibetan Plateau in the past two decades. Agric. For. Meteorol. 2020, 287, 107950. [Google Scholar] [CrossRef]
  58. Ren, H.; Li, A.; Xie, P.; Hu, Z.; Xu, J.; Huang, Y.; Li, X.; Zhong, H.; Tian, X.; Ren, B.; et al. Estimation of the Precipitable Water and Water Vapor Fluxes in the Coastal and Inland Cities of China Using MAX-DOAS. Remote Sens. 2021, 13, 1675. [Google Scholar] [CrossRef]
  59. Ma, S.; Cao, J.; Zhao, H.; Zhou, X.; Ran, L. Decomposition of water vapor flux divergence and its application to a blizzard event over Ili Valley in Central Asia during 30 Nov to 1 Dec 2018. Atmos. Res. 2022, 270, 106079. [Google Scholar] [CrossRef]
  60. Syed, T.; Tajdar, H.; Famigglietti, M.R.; Chen, J.; Wilson, C. Analysis of terrestrial water storage changes from GRACE and GLDAS. Water Resour. Res. 2008, 44, WR005779. [Google Scholar] [CrossRef]
  61. Frapppart, F.; Papa, F.; da Silva, S.; Ramillien, G.; Prigent, C.; Seyler, S. Surface freshwater storage and dynamics in the Amazon basin during the 2005 exceptional drought. Environ. Res. Lett. 2021, 7, 044010. [Google Scholar] [CrossRef]
  62. Woodwell Climate Research Center (WCRC). Amazon Deforestation and Fire Update: November 2020. Available online: https://www.woodwellclimate.org/2020-amazondeforestation-and-fire-outlook-november (accessed on 25 July 2025).
  63. Jimenez, J.; Mattar, C.; Baichivich, J.; Santamaria-Artigas, A.; Takahashi, K.; Malhi, Y.; Sobrino, J.; Schrier, G. Record-breaking warming and extreme drought in the Amazon rainforest during the course of El Niño 2015–2016. Sci. Rep. 2016, 6, 33130. [Google Scholar] [CrossRef] [PubMed]
  64. De Brito, M.R.; Wahnfried, I. Groundwater dynamics and hydrogeological processes in the Alter do Chao Aquifer: A case study in Manaus, Amazonas—Brazil. Groundw. Sustain. Dev. 2025, 29, 101441. [Google Scholar] [CrossRef]
  65. Matsui, T.; Hernandez-Deckers, D.; Glangrande, S.; Biscaro, T.; Fridlind, A. A thermal-driven graupel generation process to explain dry-season convective vigor over the Amazon. Atmos. Chem. Phys. 2024, 24, 10793–10814. [Google Scholar] [CrossRef]
  66. Agudelo, J.; Arias, P.; Vieira, S.; Martinez, J. Influence of longer dry seasons in the Southern Amazon on patterns of water vapor transport over northern South America and the Caribbean. Clim. Dyn. 2018, 52, 2647–2665. [Google Scholar] [CrossRef]
  67. Ferreira, L.; Marotta, G.; Madden, E.; Horbe, A.; Santos, R.; Costa, J. Vertical displacement caused by hydrological influence in the Amazon Basin. J. Geophys. Res. Solid Earth 2021, 126, e2020JB020691. [Google Scholar] [CrossRef]
  68. Li, L.; Schmitt, R.; Ummenhofer, C.; Karnauskas, K. North Atlantic salinity as a predictor of Sahal rainfall. Sci. Adv. 2016, 2, e1501588. [Google Scholar] [CrossRef] [PubMed]
  69. Kebede, T.; Kebede, A.; Ayele, K. Identification of Water Vapor Flux Convergence Layers and Estimation of Precipitation over Ethiopia. Res. Sq. 2023, 10, 21203. [Google Scholar]
  70. Marengo, J.; Cunha, A.; Espinoza, J.; Fu, R.; Schongart, J.; Jimenez, J.; Costa, M.; Ribeiro, J.; Wongchuig, S.; Zhao, S. The drought of Amazonia in 2023–2024. Amer. J. Clim. Change 2024, 13, 26. [Google Scholar] [CrossRef]
  71. Wang, R.; He, J.; Luo, J.; Chen, L. Atlantic Warming Enhances the Influence of Atlantic Niño on ENSO. Geophys. Res. Lett. 2024, 51, e2023GL108013. [Google Scholar] [CrossRef]
  72. Posada-Marin, J.; Arias, P.; Jaramillo, F.; Salazar, J. Global Impacts of El Niño on Terrestrial Moisture Recycling. Geophys. Res. Lett. 2023, 50, e2023GL103147. [Google Scholar] [CrossRef]
  73. Ferrante, L.; Fearnside, P. The Amazons Road to deforestation. Science 2020, 369, 634. [Google Scholar] [CrossRef] [PubMed]
  74. Deforestation in the Amazon: Past, Present and Future. Available online: https://infoamazonia.org/en/2023/03/21/deforestation-in-the-amazon-past-present-and-future/nino-main-driver-of-exceptional-drought-in-highly-vulnerable-amazon-river-basin/ (accessed on 11 June 2025).
Figure 1. (a) Topographic map of the ARB and (b) sea temperature anomaly regions represented by NINO indices.
Remotesensing 17 02765 g001
Figure 2. Time series of TWSC from five single GRACE/GFO solutions and fused results in the ARB during January 2003 and February 2024.
Remotesensing 17 02765 g002
Figure 3. Uncertainties of TWSC from five single GRACE/GFO solutions and fused results in the ARB.
Remotesensing 17 02765 g003
Figure 4. Spatial distribution of uncertainties of TWSC from five single GRACE/GFO solutions and fused results in the ARB during January 2003 and February 2024.
Remotesensing 17 02765 g004
Figure 5. Time series of TWSC results from GRACE and Swarm solutions in the ARB during 2014 and 2022 (a), uncertainties in TWSC results (b), and scatterplots (c).
Remotesensing 17 02765 g005
Figure 6. Time series of TWSC results from satellite gravity (GRACE and Swarm solutions) and GLDAS model in the ARB during January 2003 and February 2024 (a) and scatterplots (b).
Remotesensing 17 02765 g006
Figure 7. Time series of the monthly GRACE-DSI, CMI and three kinds of traditional drought indices in the ARB during 2003 and 2022 (a,c,e,g) and their scatterplots (b,d,f,h).
Remotesensing 17 02765 g007
Figure 8. Time series of the monthly GRACE-DSI and P-ET in the ARB during January 2003 and February 2024.
Remotesensing 17 02765 g008
Figure 9. Spatiotemporal distribution of drought in the ARB during June 2023 and February 2024.
Remotesensing 17 02765 g009
Figure 10. Percentages of different drought severity in the ARB during June 2023 and February 2024.
Remotesensing 17 02765 g010
Figure 11. Spatial distribution of drought characteristics of four extreme droughts in the ARB during January 2003 and February 2024.
Remotesensing 17 02765 g011
Figure 12. The center of gravity of the extreme drought movement trajectory maps.
Remotesensing 17 02765 g012
Figure 13. The normalized time series of different meteorological and hydrological variable during January 2023 and February 2024. Navy blue line: PRE; red line: ET; light line: surface runoff; orange line: subsurface runoff; green line: SM; purple line: TWSC; the five dotted lines are all 0 scale lines.
Remotesensing 17 02765 g013
Figure 14. Temporal evolution of Nino 3.4 index (a) and GRACE-DSI (b) during January 2003 and February 2024.
Remotesensing 17 02765 g014
Figure 15. Spatial and temporal evolution of 500 Pha VV (ad) and its anomalies (eh) in the ARB from June to September 2023. Positive values indicate downward motion, and negative values indicate upward motion. Black dots indicate the presence of significant anomalies.
Remotesensing 17 02765 g015
Figure 16. VIWVF and water vapor flux divergence in the ARB and its surroundings during June and September 2023. The length of the arrows indicates the magnitude of the VIWVF, and the direction of the arrows indicates its transport direction. The color scale indicates water vapor flux divergence.
Remotesensing 17 02765 g016
Table 1. Summary of data used in this study.
Variable NameData SourceTime SpanSpatial ResolutionTemporalData Source
GRACE/GFO TWSCCSR200301–2024021° × 1°Monthlyhttps://icgem.gfz-potsdam.de/sl/temporal, accessed on 25 July 2025
JPL
GFZ
CSR Mascon0.25° × 0.25°https://www2.csr.utexas.edu/grace/RL05_mascons.html. accessed on 25 July 2025
JPL Mascon0.5° × 0.5°https://grace.jpl.nasa.gov/data/get-data/jpl_global_mascons/, accessed on 25 July 2025
PREGPM200301–2024020.1° × 0.1°Monthlyhttps://disc.gsfc.nasa.gov/datasets/GPM_3IMERGM_07/summary?keywords=GPM, accessed on 25 July 2025
ETERA5-Land200301–2024020.1° × 0.1°Monthlyhttps://cds.climate.copernicus.eu/datasets/reanalysis-era5-land-monthly-means?tab=overview, accessed on 25 July 2025
SM
Surface runoff
Subsurface runoff
SPEI-2003–20220.5° × 0.5°Monthlyhttps://spei.csic.es/database.html, accessed on 25 July 2025
SCPDSI-2003–20220.5° × 0.5°Monthlyhttps://crudata.uea.ac.uk/cru/data/drought/, accessed on 25 July 2025
CMI 200301–2024020.5° × 0.5°Monthlyhttps://superdrought.com/data.html, accessed on 25 July 2025
Niño3.4 indexNOAA200301–202402-Monthlyhttps://www.cpc.ncep.noaa.gov/data/indices/, accessed on 25 July 2025
VVERA51994–20240.5° × 0.5°Monthlyhttps://cds.climate.copernicus.eu/datasets/reanalysis-era5-pressure-levels-monthly-means?tab=overview, accessed on 25 July 2025
Specific Humidity2003–2024
u-wind2003–2024
v-wind2003–2024
Table 2. Drought category according to GRACE-DSI.
CategoryDescriptionGRACE-DSI
D0Near normalGRACE-DSI > −0.5
D1Light drought−0.8 ≤ GRACE-DSI < −0.5
D2Moderate drought−1.3 ≤ GRACE-DSI < −0.8
D3Severe drought−1.6 ≤ GRACE-DSI < −1.3
D4Extreme drought−2.0 ≤ GRACE-DSI < −1.6
D5Exceptional droughtGRACE-DSI < −2.0
Table 3. Drought category according to DAR.
DescriptionDAR
Territorial droughtDAR ≥ 50%
Regional drought33% ≤ DAR < 50%
Partial regional drought25% ≤ DAR < 33%
Localized drought10% ≤ DAR < 25%
Near normalDAR < 10%
Table 4. Summary table of drought events.
EventTime SpanDuration
(Months)
GRACE-DSIPrevious Studies Validation (Y/N)
Peak MagnitudeAverage MagnitudeDrought Severity
1200506–2005105−0.88−0.75−3.75Y [61]
2201004–20110110−1.15−0.86−8.64Y [18]
3201511–20161214−1.66−1.06−14.79Y [28]
4201709–2018059−1.10−0.74−6.67Y [29]
5202009–2020113−0.85−0.69−2.07Y [62]
6202309–2024026−1.29−0.94−5.62Y
Disclaimer/Publisher’s Note: The statements, opinions and data contained in all publications are solely those of the individual author(s) and contributor(s) and not of MDPI and/or the editor(s). MDPI and/or the editor(s) disclaim responsibility for any injury to people or property resulting from any ideas, methods, instructions or products referred to in the content.