Article

XCH4 Spatiotemporal Variations in a Natural-Gas-Exploiting Basin with Intensive Agriculture Activities Using Multiple Remote Sensing Datasets: Case from Sichuan Basin, China

1
State Key Laboratory of Deep Earth Processes and Resources, Guangzhou Institute of Geochemistry, Chinese Academy of Sciences, Guangzhou 510640, China
2
University of Chinese Academy of Sciences, Beijing 100049, China
*
Author to whom correspondence should be addressed.
Remote Sens. 2025, 17(15), 2695; https://doi.org/10.3390/rs17152695
Submission received: 4 May 2025 / Revised: 23 July 2025 / Accepted: 31 July 2025 / Published: 4 August 2025

Abstract

The Sichuan Basin is a natural-gas-exploiting area with intensive agriculture activities. However, the spatial and temporal distribution of atmospheric methane concentration and the relationships with intensive agriculture and natural gas extraction activities are not well investigated. In this study, a long-term (2003–2021) dataset of column-averaged dry-air mole fraction of methane (XCH4) over the Sichuan Basin and adjacent regions was built by integrating multi-satellite remote sensing data (SCIAMACHY, GOSAT, Sentinel-5P), which was calibrated using ground station data. The results show a strong correlation and consistency (R = 0.88) between the ground station and satellite observations. The atmospheric CH4 concentration of the Sichuan Basin showed an overall higher level (around 20 ppb) than that of the whole of China and an increasing trend in the rates, from around 2.27 ppb to 10.44 ppb per year between 2003 and 2021. The atmospheric CH4 concentration of the Sichuan Basin also exhibits clear seasonal changes (higher in the summer and autumn and lower in the winter and spring) with a clustered geographical distribution. Agricultural activities and natural gas extraction contribute significantly to atmospheric methane concentrations in the study area, which should be considered in carbon emission management. This study provides an effective way to investigate the spatiotemporal distribution of atmospheric CH4 concentration and related factors at a regional scale with natural and human influences using multi-source satellite remote sensing data.

1. Introduction

As one of the most important greenhouse gases, methane has a significant impact on climate change [1]. The Greenhouse Gas Bulletin published by the World Meteorological Organization (WMO) shows that the warming effect on climate by greenhouse gases increased by almost 50 percent between 1990 and 2021 [2]. CH4 is the second most abundant greenhouse gas after CO2, its radiative forcing is more than 80 times higher than that of carbon dioxide [3], and its radiative efficiency is about 27 times higher than that of carbon dioxide [4]. As a trace gas, even small increases in methane emissions can lead to a significant rise in methane concentrations in the atmosphere [4]. The lifetime of atmospheric methane is about 9.1 ± 0.9 years, which is shorter than that of CO2 [5,6]. The reasons for methane’s short atmospheric lifetime are complex. About 70–90% of methane is removed by reaction with hydroxyl radicals (OH) [6,7]. Although OH oxidation is dominant, photolysis and oxidation in the stratosphere, microbial oxidation in the soil, and other processes also contribute to the removal of methane. Reducing methane concentrations is therefore likely to be more cost-effective in mitigating the greenhouse effect in the short term than reducing CO2 concentrations.
The concentration of methane in the atmosphere can be measured using a variety of methods, which are generally divided into three categories: ground-based measurements, aircraft-based, and satellite-based remote sensing. Since 1989, the WMO has established a global ground-based monitoring network for the atmospheric background, with which long time series and high-precision observation data can be obtained [8]. However, due to the limited number of stations, the network cannot provide comprehensive information on the global and regional characteristics of spatial and temporal variations in methane concentrations [9,10]. For aerial observations, samplers are installed on airplanes and sampling and measurements are carried out during the flight. As early as 1994, Gallagher et al. used airborne concentration measurements [11]. Wratt et al. collected methane concentration data and estimated regional emissions using a Piper Cherokee aircraft [12]. Aircraft observations can obtain real-time data, but it is difficult to obtain continuous data over a large area. Atmospheric modeling can be used to assimilate and simulate methane data, providing a continuous spatial and temporal distribution of atmospheric methane and facilitating the qualitative and quantitative analysis of the gas transport process [13]. However, it requires a large amount of computational effort, precise calibration, and complex parameters. The advantages of satellite remote sensing data include stability, extensive spatial coverage, long time series, and three-dimensional spatial monitoring [14]. Many nations and organizations have launched various satellites to measure methane concentrations. Thermal infrared hyperspectral sensors such as AIRS are used in global climate studies, enhancing the accuracy of tropospheric temperature profile measurements [15]. Zhang et al. report that AIRS satellite data provide better spatial coverage and stability [16]. Compared to the thermal infrared band, the near-infrared band is better suited to detect near-surface CH4 and the dynamic changes in methane sinks at the surface [14,17]. Near-infrared hyperspectral sensors such as SCIAMACHY on the Envisat satellite, TANSO on the GOSAT satellite, and TROPOMI on the Sentinel-5P satellite are frequently used. Chen et al. used SCIAMACHY and GOSAT data to study CH4 concentrations in China from 2003 to 2020 [18]. Zhang et al. collected methane data from TROPOMI for the years 2018–2021 to investigate the spatial and temporal characteristics of regional methane concentrations in China [19]. Feng et al. analyzed the distribution characteristics of atmospheric methane concentration in the Qinghai–Tibet Plateau from 2003 to 2015 using AIRS data [20]. However, previous studies have mainly focused on global and national scales, while there have been fewer studies on satellite observations of methane concentrations at regional scales [10,21].
The Sichuan Basin is used for intensive agriculture and has abundant natural gas resources. The main types of natural gas include conventional gas, tight gas, shale gas and high-sulfur gas [22]. The region is characterized by the significant superposition of the dual attributes of oil and gas development and agricultural activities. However, current research on the spatiotemporal evolution of atmospheric methane concentration in this region and the associated factors is still weak. The aim of this study was to analyze the spatial and temporal distribution of regional methane concentration in the Sichuan Basin and the influence of agricultural and oil- and natural-gas-exploiting factors based on the CH4 concentration retrieved from SCIAMACHY, GOSAT, and TROPOMI. First, satellite data from multiple sources were compared with ground observation data to test whether the XCH4 data observed by satellite can accurately represent the temporal variation and spatial distribution of CH4 in the atmosphere. Subsequently, the temporal and spatial distributions of CH4 concentration in the Sichuan Basin were analyzed, and, finally, the effects of agricultural development and oil and gas production on CH4 concentration in the Sichuan Basin were investigated.

2. Materials and Methods

2.1. Study Area

This study focused on the Sichuan Basin and its peripheral areas (26°02′N~34°32′N, 97°20′E~111°34′E), which are shown in Figure 1. The area is about 791,400 square kilometers in size. It is located in southwest China and has large elevation differences (62–7334 m above sea level). The terrain of the region is higher in the northwest and the peripheral areas and lower in the basin. As China’s most prolific natural gas region, it has a long history of resource exploitation, with production reaching 70 billion m3 in 2024 [23]. In addition, it is also an important agricultural production area in China, with large-scale production of agricultural products, aquaculture, livestock, and poultry farming [24].

2.2. Data

2.2.1. Satellite-Observed Methane Concentration Data

To investigate the long-term trend of atmospheric methane concentration in the Sichuan Basin, it is necessary to construct a long-term satellite dataset. At present, there are many satellites that can observe atmospheric methane concentration, but each of them has its own advantages and disadvantages.
The satellite-observed methane data used in this study include SCIAMACHY, GOSAT, and Sentinel-5P TROPOMI data. SCIAMACHY is a passive remote sensing spectrometer mounted on the Envisat satellite, which was launched in March 2002 [25]. The revisit period of the Envisat satellite is 35 days and the spatial resolution of the SCIAMACHY data is 30 × 60 km. The working wavelength range of SCIAMACHY is 214–2386 nm, and the spectral range of channel 8 at 2360–2385 nm is used to determine the CH4 concentration with a spectral resolution of 0.2 nm [26]. Its main objective is to measure trace gases in both the troposphere and the stratosphere. The SCIAMACHY data selected for this study were the daily scaled L2 XCH4 v4.0 data from 2003–2010, which were generated using the WFM-DOAS algorithm of the University of Bremen, Germany (https://www.iup.uni-bremen.de/sciamachy/NIR_NADIR_WFM_DOAS/products/XCH4_WFMDv4.0/download.html) (accessed on 2 May 2023).
Launched on 23 January 2009, GOSAT is the first satellite specifically designed to detect greenhouse gases. The satellite has a revisit period of 3 days and a spatial resolution of 10.5 km. It is equipped with thermal infrared and near-infrared detectors known as TANSO. TANSO-FTS mainly detects greenhouse gases in shortwave infrared (SWIR) and thermal infrared (TIR) and achieves an observation accuracy of 10–34 ppb for CH4, while TANSO-CAI is used to correct for cloud and aerosol interference [27,28,29]. For this study, the daily FTS-SWIR L2 v02.95 product of the GOSAT satellite from 2011–2018 was selected (https://data2.gosat.nies.go.jp/GosatDataArchiveService/usr/download/DownloadPage/view) (accessed on 2 May 2023).
Sentinel-5P, a satellite launched by the European Space Agency (ESA) in October 2017, is the first satellite of the Copernicus program to monitor the atmosphere for air pollution, with the main objective of monitoring the atmosphere with a high temporal resolution. The Tropospheric Monitoring Instrument (TROPOMI) on board provides CH4 level 2 data with a spatial resolution of about 7 × 7 km2 and 5.5 × 7 km2 and a temporal resolution of 1 day. It can provide CH4 column concentrations with high sensitivity, good spatial and temporal coverage, and good precision (5.6 ppb) [30]. Compared to the ENVISAT and GOSAT satellites, Sentinel-5P has a wider swath and a shorter revisit period, with a swath width of 2700 km and a revisit period of 16 days [17]. In this study, monthly XCH4 products for the Sichuan Basin from January 2019 to December 2021 were obtained from the European Space Agency (ESA) (https://dataspace.copernicus.eu/) (accessed on 1 June 2025).

2.2.2. Ground-Level Observed Methane Concentration Data

To validate the accuracy of satellite-based XCH4 data in the Sichuan Basin, observations from the World Data Centre for Greenhouse Gases (WDCGG) ground station were used in this study. The WDCGG is responsible for collecting, archiving, and distributing observational data on greenhouse gas concentrations. The WLG station is located at the Waliguan Mountain in the northwestern area near the Sichuan Basin (100°54′E, 36°17′N) on the Qinghai–Tibet Plateau in western China, at an altitude of approximately 3816 m. The monthly CH4 concentration measurements from January 2003 to December 2021 from the Waliguan Ground Station (WLG) were downloaded from the website of WDCGG.

2.2.3. Land Cover Data

The land cover data used in this study are derived from NASA’s MODIS product MCD12Q1 v6.1, which has provided annual global land cover types derived by supervised classification using MODIS Terra and Aqua reflectance data since 2001. The International Geosphere-Biosphere Programme (IGBP) classification scheme was chosen as the land cover type.

2.3. Data-Processing Methods

2.3.1. Satellite Data Integration

In this study, we used satellite data from different sources. The three sets of satellite data have different data structures. The satellite data were converted to GeoTIFF format using ENVI-IDL (version 5.3) and MATLAB (version R2014b) programming. There are significant differences in the spatial resolution of the data from these three satellites. Therefore, the data of the three satellites were aligned to a common grid by a resampling method, and a uniform spatial resolution and coordinate reference system were established. In terms of temporal coordination, the final temporal resolution of the integrated dataset was defined as monthly. The data with different acquisition times were aligned to this common time scale by calculating the average value of the valid pixels of each grid. When processing missing data, the inverse distance weighted interpolation method was used to fill in the missing values in the spatial sampling data, as the IDW method is simple and fast in calculation. Finally, the monthly average continuous grid data were generated with a resolution of 0.1° × 0.1°. The multi-year average XCH4 data were constructed by averaging the valid pixels of the annual average data from 2003 to 2021. An overview of the data processing in this study is shown in Figure 2.

2.3.2. Mann–Kendall Test and Theil–Sen Estimation

In order to analyze the long-term trend of XCH4 in the Sichuan Basin, the Theil–Sen estimation and Mann–Kendall test were used. The Mann–Kendall test is a widely used nonparametric statistical methodology, and Theil–Sen estimation is a robust non-parametric statistical approach for trends. Combining Theil–Sen estimation and Mann–Kendall test is considered a more effective approach for determining trends in long time series data [31,32,33]. For time series variables XCH4  ( x 1 , x 2 , , x n ) , determine the relationship between the magnitudes of x i and x j in all pairs of values (set to S). The statistic S for the test is calculated as follows:
S = i = 1 n 1 j = i + 1 n s g n ( x j x i )
where n 8 , the statistic S approximately obeys a normal distribution with mean 0, and variance V a r ( S ) = n ( n 1 ) ( 2 n + 5 ) / 18 without considering the presence of equivalent data points in the series. The standardized test statistic Z is calculated as follows:
Z = S 1 V a r ( S ) , S > 0 0 , S = 0 S + 1 V a r ( S ) , S < 0
Z > 0 indicates an increasing trend in XCH4 concentration in this time series data, while Z < 0 suggests a decreasing trend. Additionally, the larger the absolute value of Z, the more pronounced the trend [34,35]. Regarding the confidence level, the time series data exhibit a statistically significant increasing or decreasing trend.

2.3.3. Generation of Agricultural Activity Intensity Index Assessment Model

Referring to the human activity intensity index proposed in another article [36], we propose an agricultural activity intensity index, which is calculated by the following formula:
A A I = A S
where AAI is the agricultural activity intensity index, A is the area of the agricultural land use type, and S is the total area. This index provides an indicator to quantify the impact of agricultural activities in the study area by type of land use.

3. Results

3.1. Validation of the Satellite Observation Data

To investigate whether satellite data can indicate changes in near-surface methane concentrations, the satellite-observed XCH4 concentrations were compared with the CH4 concentrations observed on the ground WLG (100°54′E, 36°17′N), the closest ground station of the WDCGG (Figure 3). The monthly satellite observation dataset of XCH4 concentrations of the WLG site was built by averaging the eight neighboring pixels corresponding to the monthly ground-observed CH4 concentrations from 2003 to 2021. The Pearson coefficient was obtained by linear correlation analysis between these two datasets. The scatter plot showed that the correlation coefficient at the WLG site was 0.78. The strong correlation and consistency between the ground station observations and the satellite observations indicates that it is feasible to use satellite-observed XCH4 to reflect the spatiotemporal distribution of local CH4 concentrations. Table 1 shows that Sentinel-5P showed the highest agreement with the ground observations, while GOSAT showed a correlation with the ground observations between the other two satellites, and SCIAMACHY showed the lowest correlation.
The good agreement between the satellite-observed XCH4 values and the CH4 concentration observed at the WLG site suggests that the satellite dataset may provide a better indication of the variations in atmospheric CH4 at this site. Therefore, the patterns of temporal and spatial variations in atmospheric methane concentration in the Sichuan Basin region need to be further explored.

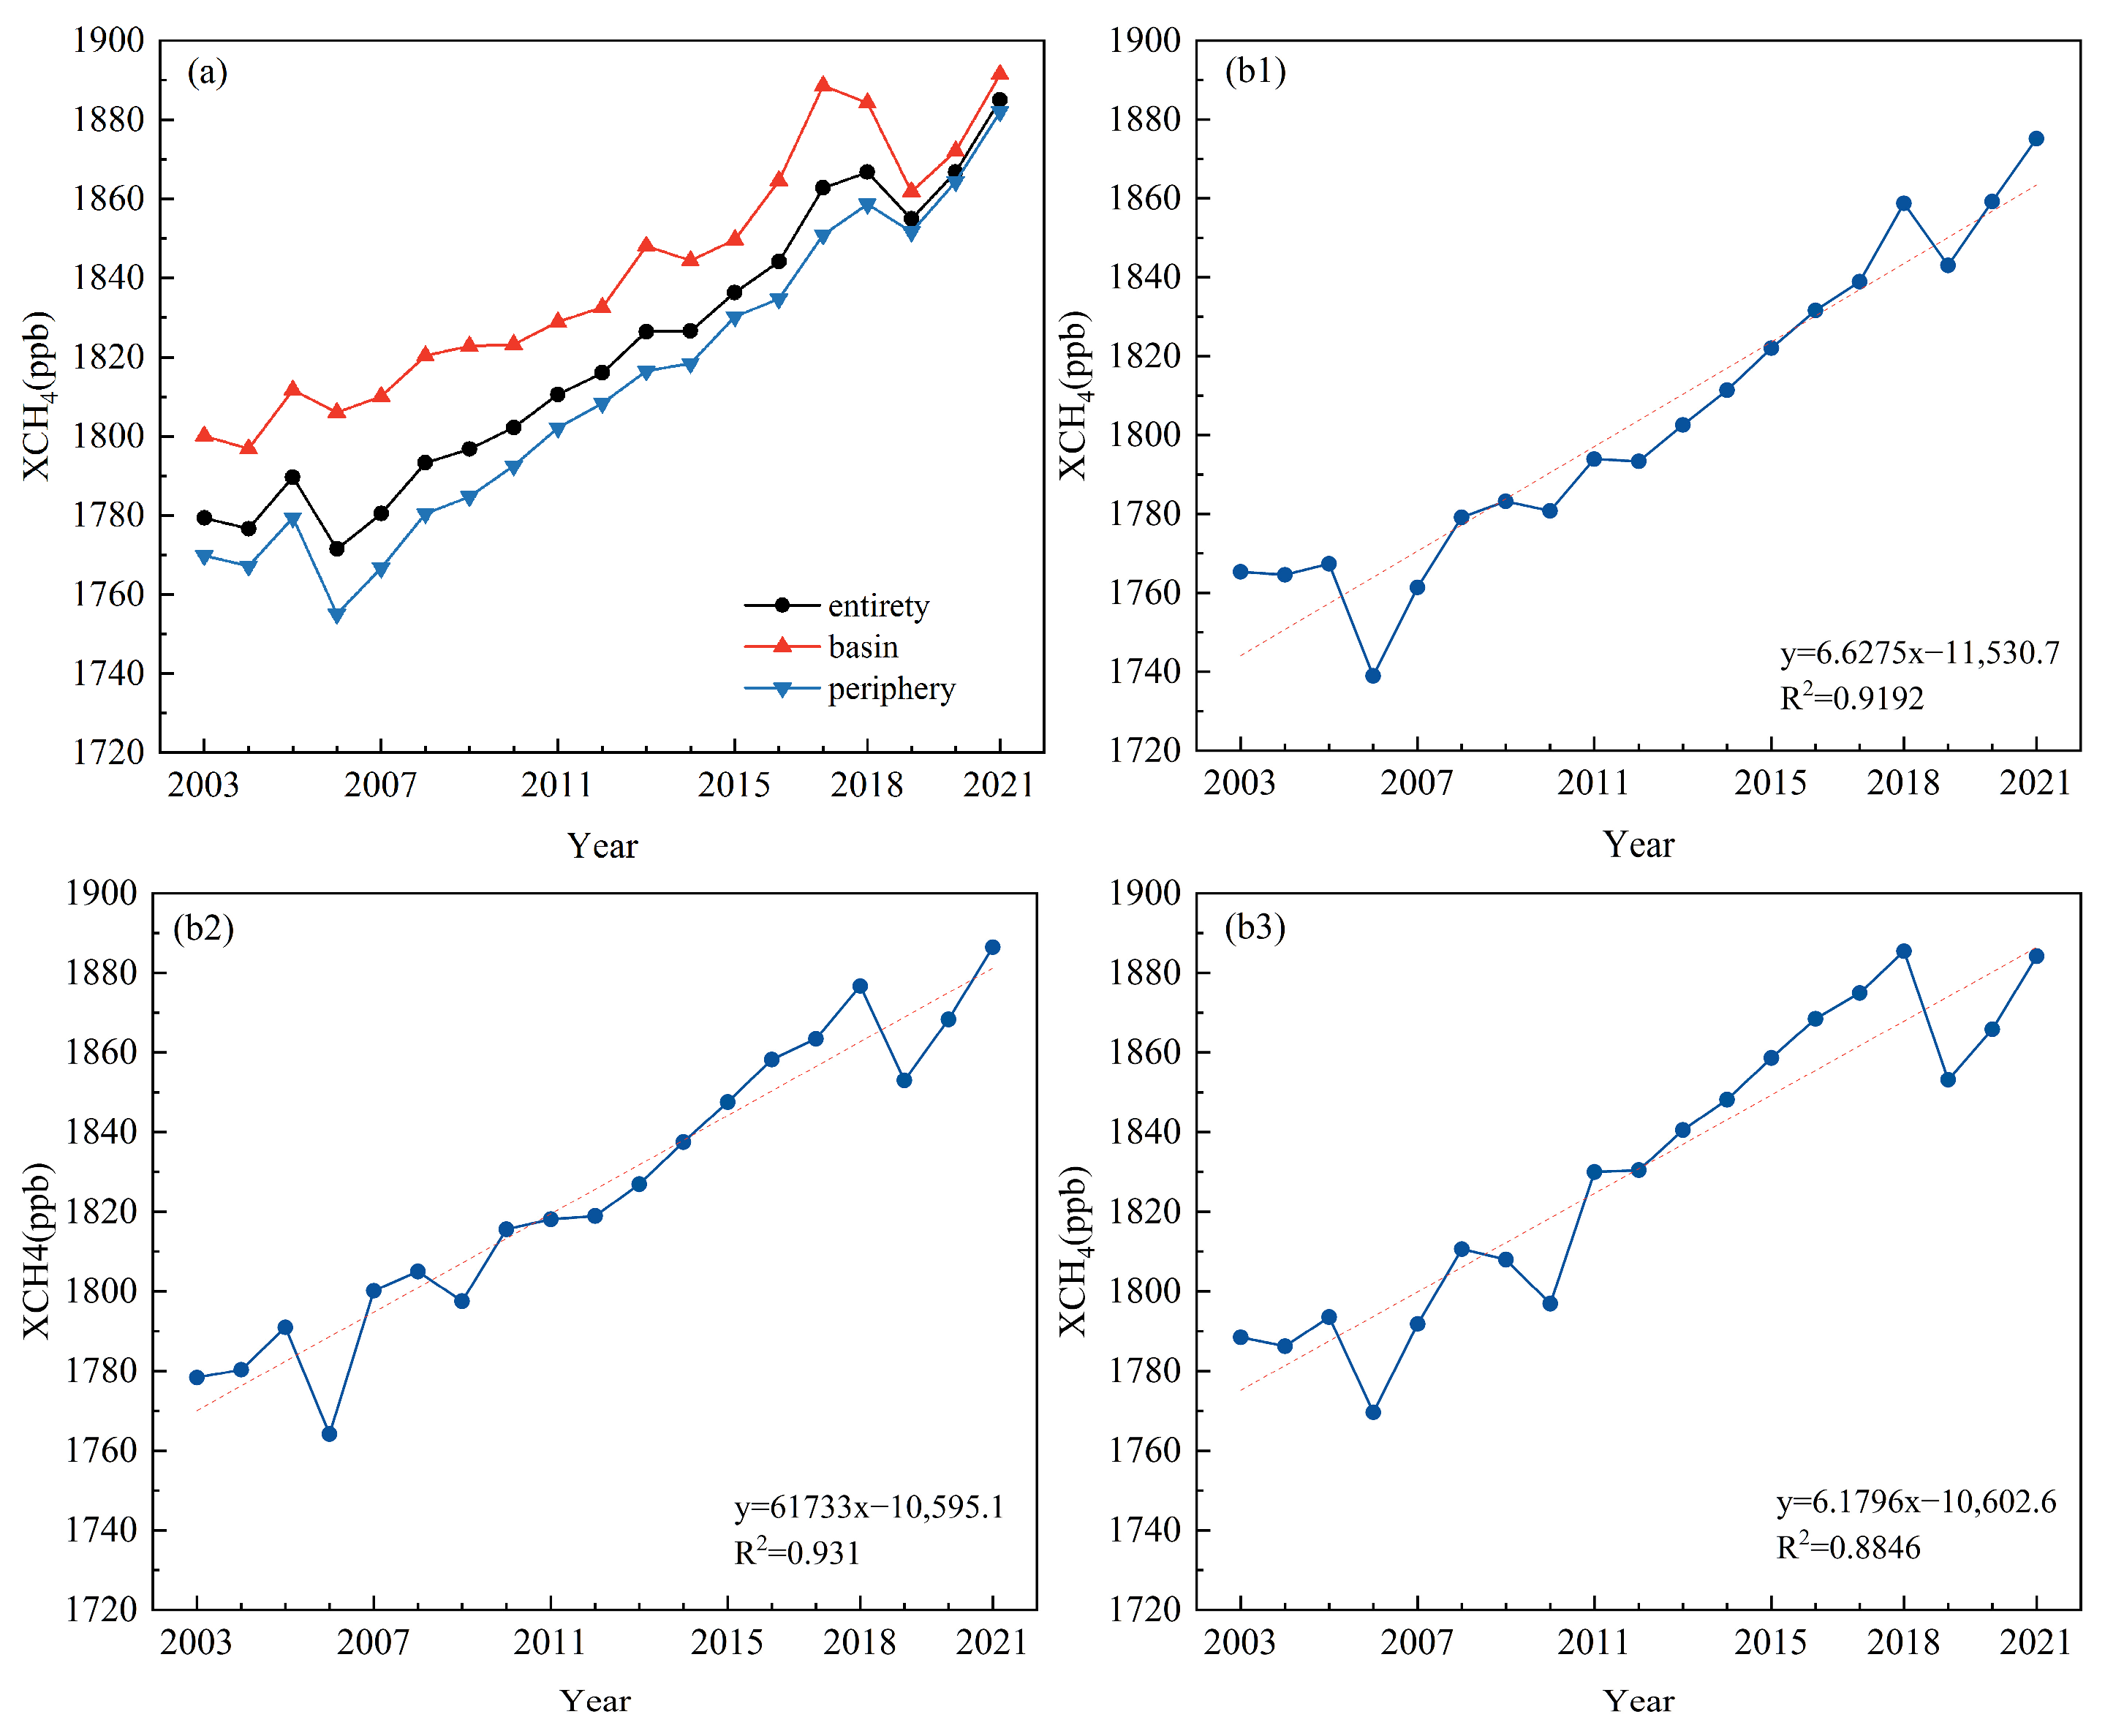
3.2. Temporal Variation in XCH4 in the Sichuan Basin

The multi-year average of XCH4 in the Sichuan Basin from 2003 to 2021 is shown in Figure 4. The regional concentration reached its lowest point in 2006 (1771.50 ppb) and its highest point in 2021 (1885.02 ppb), with an overall increasing trend of 6.138 ppb. It is clear that the Sichuan Basin region has a higher value of XCH4 than China throughout the study period. Here, XCH4 data over the whole of China come from the research of Xu et al. [37]. The global atmospheric CH4 concentration started to increase in 2006 [38], which coincided with the increase in regional atmospheric CH4 concentration in 2006, which is similar to the global atmospheric methane concentration. In addition, the regional XCH4 concentration decreased in 2006, possibly due to lower methane concentrations from reduced oil and gas emissions and fossil fuel combustion [39]. In addition, studies that include methyl chloroform measurements indicate that OH sinks have increased, counteracting the increase in methane emissions [40,41].
The multi-year monthly average XCH4 revealed that the regional methane concentration in the Sichuan Basin reached its highest value in August (1843.54 ppb) and its lowest value in March (1804.81 ppb) (Figure 5). Atmospheric methane concentrations increased from March to August, followed by a decrease after August. The highest methane concentrations occurred in August and September, which was attributed to the higher methane emissions from rice paddies in the Sichuan Basin during the summer and fall. A clear seasonal fluctuation can be seen in the Sichuan Basin (Table 2). The mean value of concentration is highest in fall (1832.21 ppb), followed by summer (1832.04 ppb), spring (1810.02 ppb), and winter (1810.00 ppb), showing a pattern of higher values in summer and fall and lower values in winter and spring. This pattern is similar to the seasonal mean of XCH4 concentration in the whole Chinese region [37,42].
The seasonal distribution of XCH4 in the Sichuan Basin from 2003 to 2021 is shown in Figure 6. Methane concentrations were lower throughout the spring in the west of the basin and higher in the inner areas. Areas of high methane concentrations progressively spread southeastward and into the basin from summer to autumn. In addition, concentrations were higher in the western part of the basin in summer and autumn. In winter, concentrations were also lower in the western part of the basin but higher near the cities of Ziyang and Neijiang.
The long-term trend of annual atmospheric CH4 concentration in the Sichuan Basin region from 2003 to 2021 was analyzed using Theil–Sen trend analysis and Mann–Kendall test methods developed with MATLAB (version R2014b) coding. Then, the annual growth rate map of XCH4 of the Sichuan Basin was constructed by calculating the Theil–Sen slopes of the grids and the Z values of the MK test (Figure 7). Almost all pixels in the region show a significant increase in XCH4 concentration, with growth rates ranging from 2.27 to 10.44 ppb per year. The relative growth rate in the basin area of the study area is low, while the growth rate in the peripheral areas (such as Liangshan, Ganzi and Aba areas) is high. This distribution may be caused by methane release from permafrost areas, wetlands, and livestock farming [43]. As global warming prolongs the thawing season, wetland methane emissions increase [44]. The significant increase in CH4 concentrations in the western Sichuan Plateau is related to permafrost thawing and geological emissions [20,45].

3.3. Spatial Distribution Characteristics of XCH4 in the Sichuan Basin

The XCH4 concentration in the Sichuan Basin region exhibited divergence in the time series, and the spatial distribution also showed considerable variation. To analyze the characteristics of spatial distribution, we plotted the spatial distribution of average XCH4 concentrations from 2003 to 2021 (Figure 8). XCH4 concentrations ranged from 1780.5 to 1873.64 ppb, with a mean value of 1820.32 ppb. Xu et al. demonstrated that the multi-year average of XCH4 in China from 2003 to 2019 ranged from 1763 to 1845.28 ppb, with a mean of 1799.12 ppb [37]. In general, the methane concentration in the Sichuan Basin area was around 20 ppb higher. If we compare strictly with the result from Xu et al., the multi-year average of XCH4 concentrations in Sichuan from 2003 to 2019 is 1813.78 ppb, which is around 15 ppb higher than that of the whole of China.
The area with high XCH4 values in the study area is mainly located in the interior of the basin. The areas with high methane concentrations are located in the cities of Zigong and Neijiang, which coincide with the locations of natural gas production areas. Although the area under rice cultivation in the Sichuan Basin is not very large, the methane emission coefficient is relatively high, resulting in a large amount of methane emissions from rice cultivation [46]. In contrast, the average atmospheric CH4 concentration in the western plateau of the basin from 2003 to 2021 is low, and the possible reasons for this might include the higher altitude, lower levels of human activity, and less vegetation cover [47]. The spatial distribution of average atmospheric CH4 concentrations from the long-term satellite data with satellite coverage time shows that the ranges of atmospheric CH4 concentrations in the Sichuan Basin region in 2003–2010, 2011–2018, and 2019–2021 were 1723.26–1872.8 ppb, 1788.98–1874.94 ppb, and 1831.29–1889.29 ppb, with mean values of 1786.23 ppb, 1836.20 ppb, and 1868.9 ppb, respectively (Figure 9).
Based on ArcGIS (version 10.2), spatial autocorrelation analysis, clustering analysis, and cold hotspot analysis were used to further investigate the characteristics of the spatial distribution of XCH4 in the Sichuan Basin. The Moran I index was 0.58 and the Z-score was 16.43 (p < 0.01), indicating that there was a clustering of the spatial distribution of XCH4 in the study area. Figure 10 demonstrates that there are high-high clusters in the basin and the southern part of the basin and low-low clusters in the western Sichuan Plateau. In addition, we conducted a more scientific verification of the spatial distribution of regional XCH4 through hotspot analysis. With a confidence level of 99%, we believe that the basin and the southeastern part of the basin are hot spots and the western Sichuan Plateau is a cold spot. In summary, XCH4 in the Sichuan Basin has clustering characteristics. High-level hot spots are located in the basin and the south, and low-level cold spots are located in the western Sichuan Plateau.
In order to further analyze the spatial distribution characteristics of XCH4 in the Sichuan Basin area, we partitioned the Sichuan Basin area according to elevation. Annual averages were calculated for each region of the Sichuan Basin for each year from 2003 to 2021 (Figure 11). The trend of XCH4 within the basin is similar to the trend in the surrounding areas, but the XCH4 levels within the basin are approximately 30 ppb higher. All regions exhibited a different upward trend. While the rate in region e (i.e., the basin) was comparatively slower at 5.1853 ppb yr−1, regions a and d achieved faster rates at 6.6275 ppb yr−1 and 6.6668 ppb yr−1, respectively. XCH4 levels fluctuated in all regions, with a decrease observed in 2006 and 2010. In contrast to other regions, which peaked in 2018, XCH4 in the basin region (region e) peaked in 2017, indicating a significant lag. As mentioned above, the topography of the Sichuan Basin may hinder methane spreading. There was less human and agricultural activity in area a but more in area e. The increase in XCH4 in area e compared to area a reached 67.08 ppb, 45.54 ppb, and 49.72 ppb in 2006, 2013, and 2017, respectively. This shows that human and agricultural activities influenced the increase in XCH in area e to some extent.
The monthly average XCH4 values for each region of the Sichuan Basin from 2003 to 2021 show that XCH4 values in the basin area are about 20 ppb higher than in the surrounding areas (Figure 12). The trend of monthly XCH4 averages was similar in regions b and e, both peaking in September and reaching a minimum in May. In contrast, the remaining regions exhibited low levels in February–March, with peaks in August–September. This pattern can be attributed to releases from natural sources, which are strong in summer and fall when biogenic CH4 emissions are strong, while they are weaker in winter and spring. Region c differs from the other regions in having a smaller peak in June, which is characterized by bimodal seasonal fluctuations.

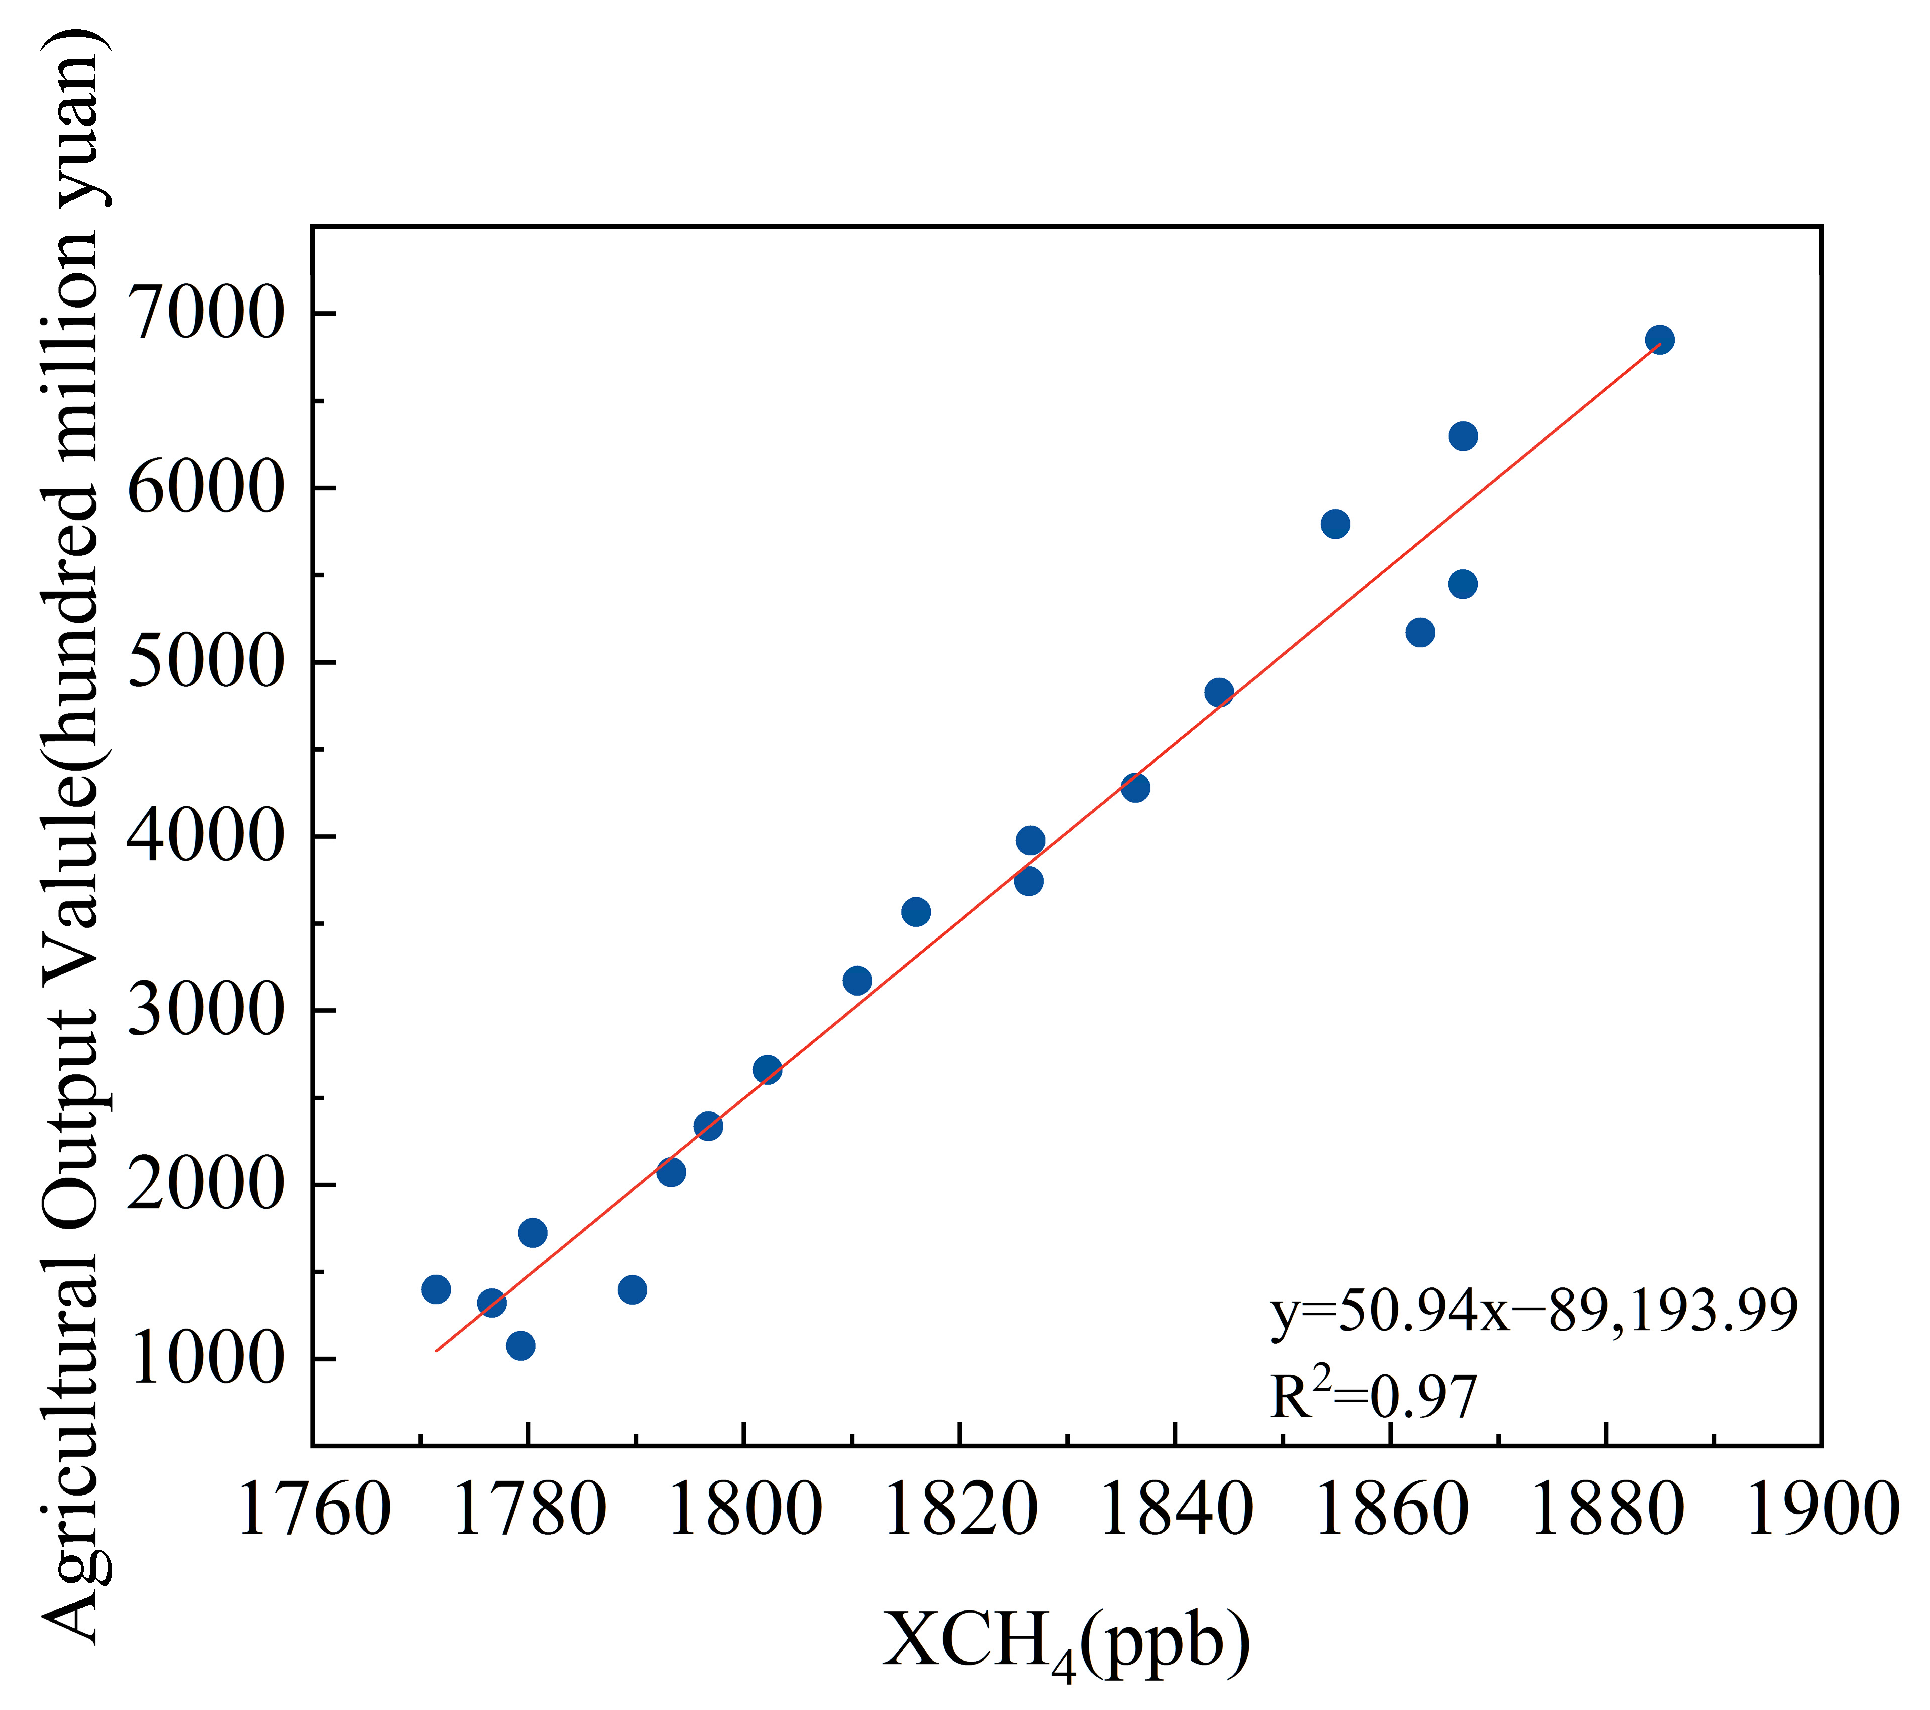
3.4. Impact of Agricultural Activity on XCH4 in the Sichuan Basin

Generally, the source of atmospheric CH4 is closely related to agricultural activities. In addition, soil also has the function of oxidizing and absorbing CH4 due to the existence of CH4-oxidizing bacteria. Figure 13 depicts the correlation between regional agricultural production value and XCH4 within the Sichuan Basin, exhibiting a strong positive correlation (R = 0.99). The AAI of the Sichuan Basin revealed that agricultural activity was concentrated in the basin and a few peripheral areas to the north and south. Figure 14 depicts the spatial distribution of the correlation between XCH4 and AAI in the Sichuan Basin from 2003 to 2021 using an image scale. The results showed that there was a significant positive correlation between XCH4 and agricultural activities within the basin, suggesting that the increased XCH4 levels in these areas are related to agricultural activities. These results further emphasize the importance of agriculture as a determinant of XCH4 in the Sichuan Basin. However, it should be noted that AAI only takes into account the share of agricultural land and not the emission differences of specific agricultural activities (such as rice cultivation and livestock farming), which should be assessed in detail in the future.

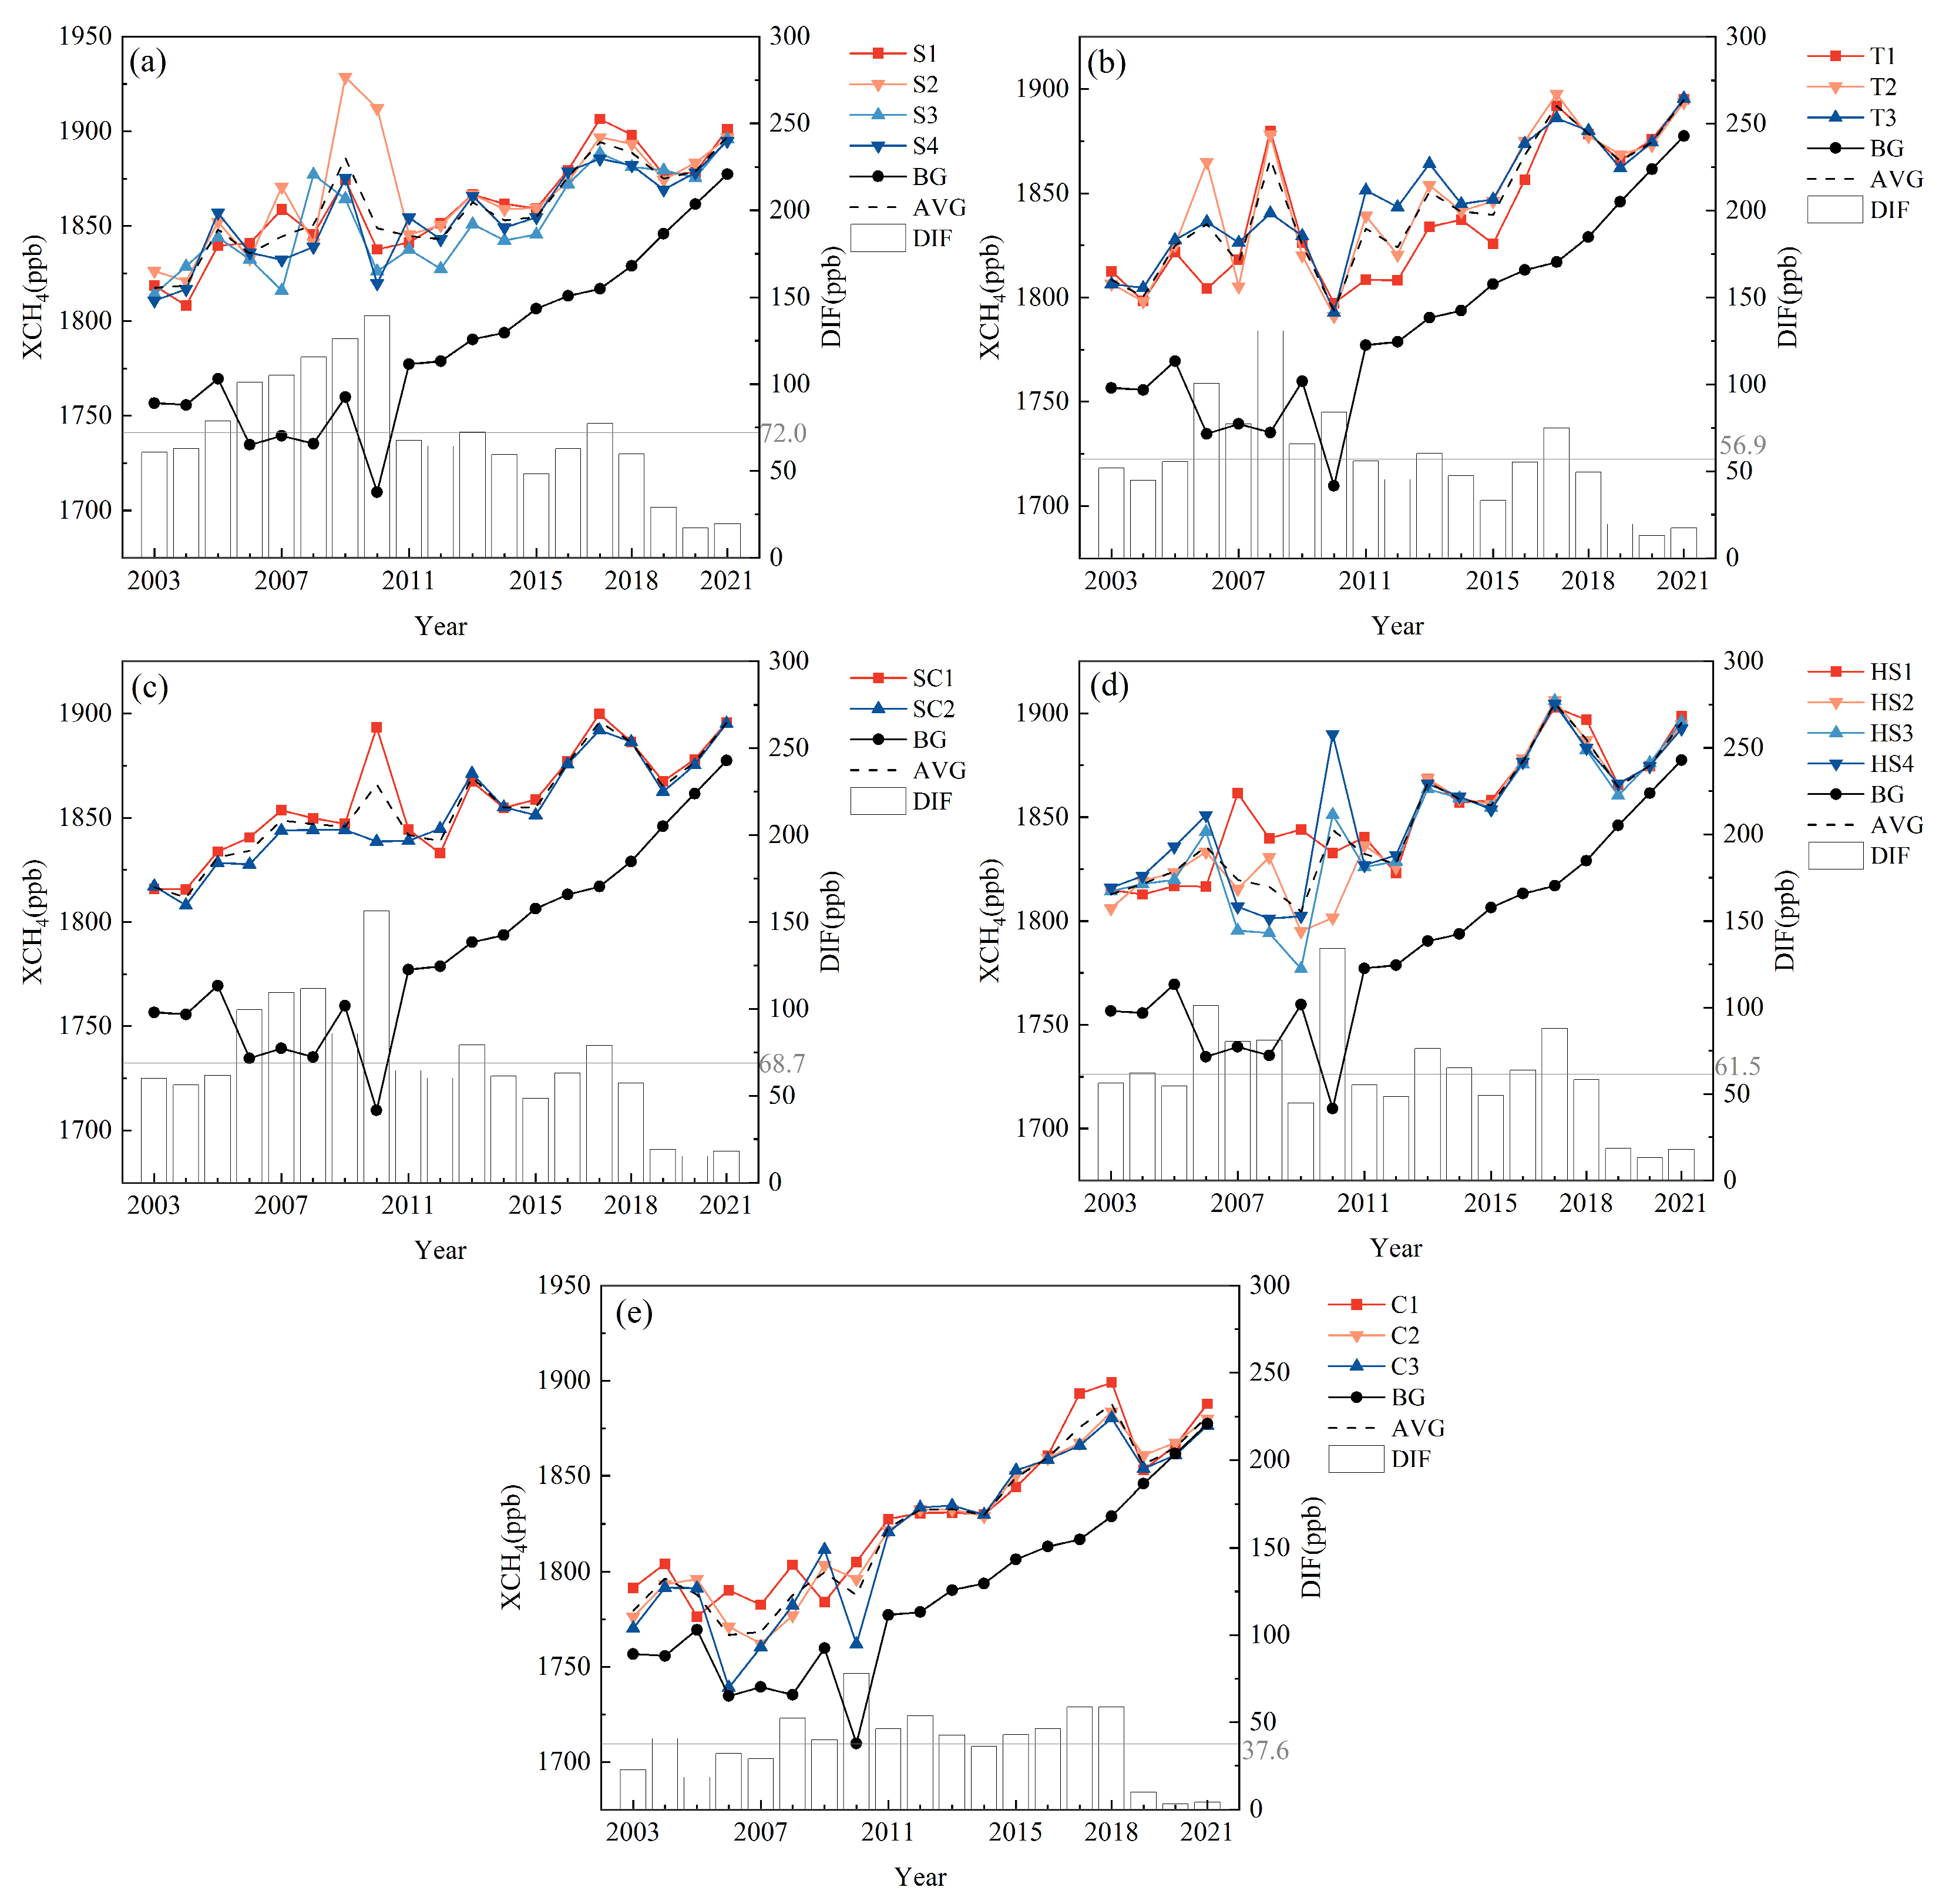
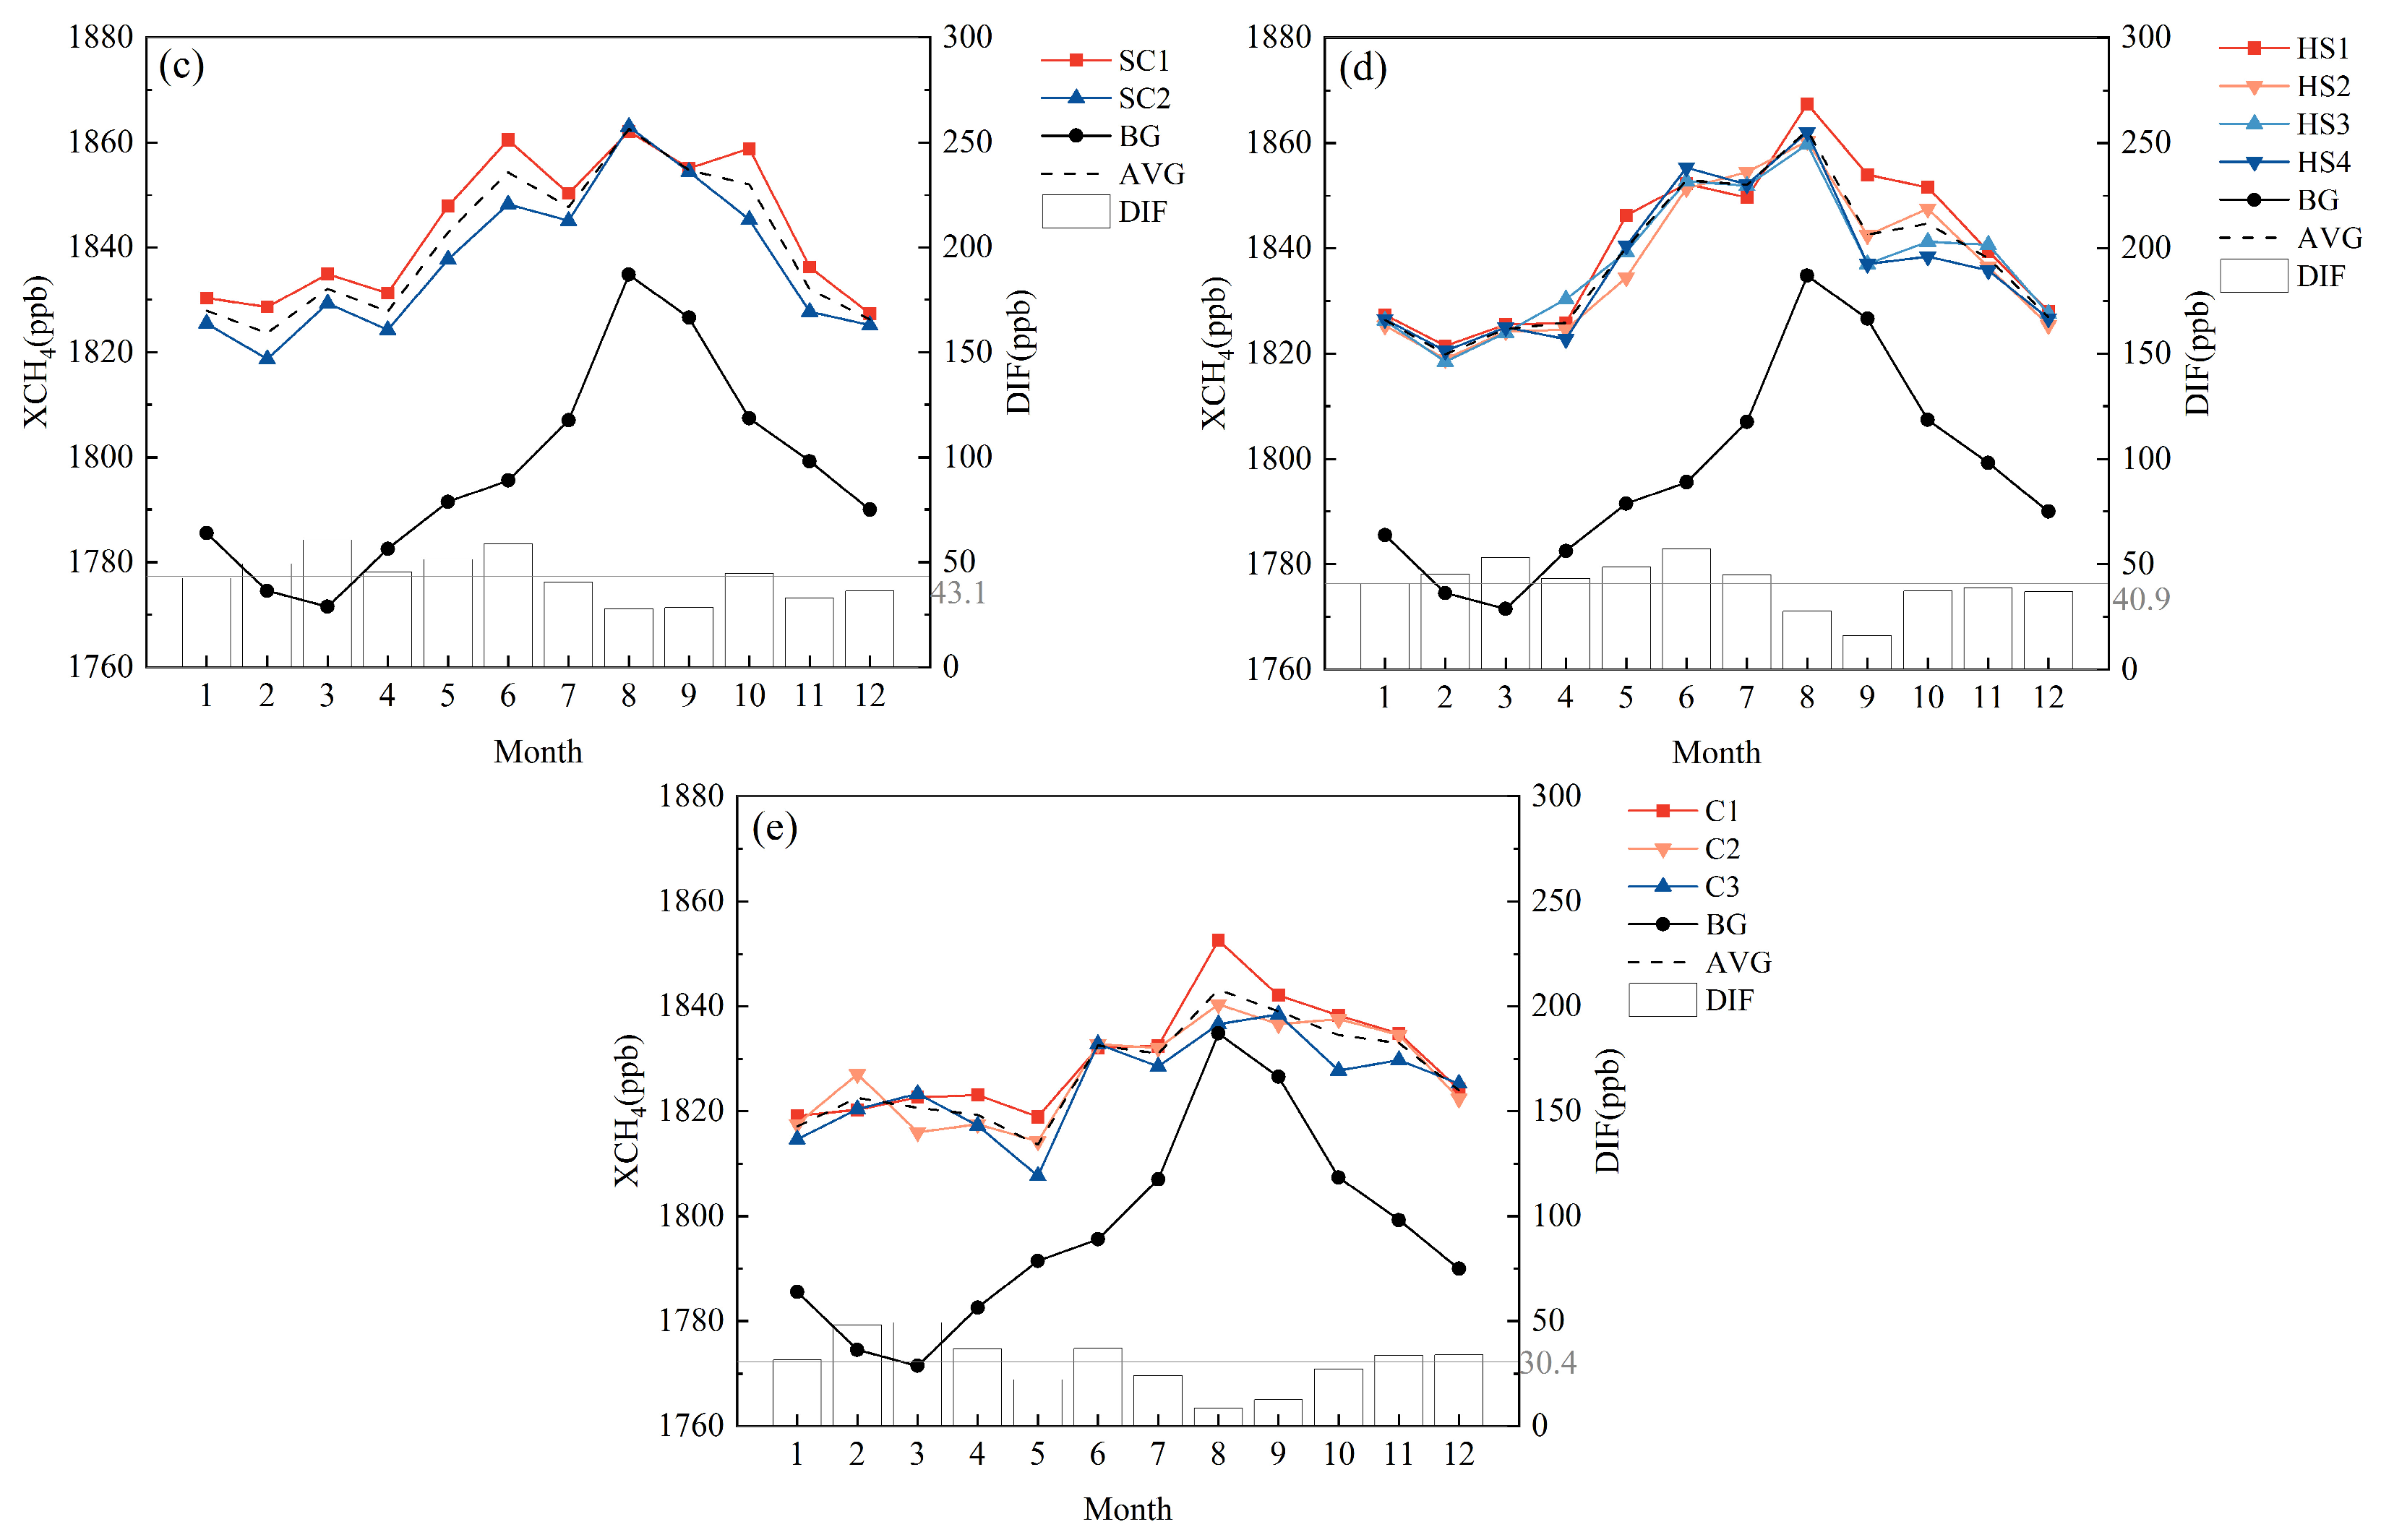
3.5. Impact of Natural Gas Exploiting on XCH4 in the Sichuan Basin

The Sichuan Basin is a large composite oil- and gas-bearing basin with long history of development and utilization of natural gas [48,49]. To further analyze the impact of oil and gas distribution on atmospheric methane concentration in this area, the Sichuan Basin is divided into five zones according to the natural gas type and geological structural features: shale gas zone, western Sichuan tight gas zone, shale gas and conventional gas zone, sulfur-rich natural gas zone, and conventional gas zone (Figure 15) [22,50].
In this study, atmospheric methane concentrations in areas with low agricultural and oil and gas activity were used as background values. The monthly and annual profiles of each region in relation to these background values are shown in Figure 16 and Figure 17. Areas with a higher distribution of oil and gas and lower agricultural activity have multi-year average XCH4 levels 37.6 ppb higher than the background. In the areas with more agricultural activities and less oil and gas exploitation, atmospheric methane levels were about 57.9 ppb higher than background levels on a multi-year average, indicating that agriculture plays an important role in elevating atmospheric methane concentration in the Sichuan Basin. Atmospheric methane levels in the shale gas zone, the West Sichuan tight gas zone, the shale gas and conventional gas zone, and the high sulfur natural gas zone were all higher than background levels to some degree. These zones are influenced by both agricultural and oil and gas production factors, suggesting that both contribute to the relatively high XCH4 concentrations in the Sichuan Basin.

4. Discussion

  • Validation and Consistency with Multi-Satellite Data
Satellite remote sensing technology is an effective method for monitoring atmospheric methane concentrations. However, the lifetime of a single satellite limits long-term research. Satellite data from multiple sources can provide long-term, spatially continuous data on methane concentration. However, validation of multi-source satellite data using ground observed data is a key process in testing uncertainty for application.
The strong correlation (R = 0.88) between satellite-observed XCH4 and ground observations in the Sichuan Basin reinforces the reliability of multi-satellite fusion for regional methane monitoring. This finding resonates with previous studies by Qin et al. [3] and Xu et al. [37], who reported robust satellite–ground consistency (R = 0.72–0.84) between satellite and ground measurements across China using similar methods.
2.
Spatiotemporal Patterns: Regional Uniqueness and Commonalities
The Sichuan Basin exhibits persistently higher levels of XCH4 (∼20 ppb above the national mean), which is consistent with the national “hotspots” identified in previous works (Qin et al. [3]; Xu et al. [37]). These studies attributed the high concentrations in eastern China to anthropogenic sources (e.g., rice cultivation, energy production), but our analysis quantifies the dual increase in the Sichuan Basin from agriculture and fossil fuel extraction—a combination less emphasized in most previous studies.
The annual increase we report (2.27–10.44 ppb per year) exceeds China’s average growth rate (6.64–7.87 ppb per year1; Xu et al. [37]; Qin et al. [3]). This acceleration could be due to the rapid industrialization and intensification of agriculture in the basin, factors less pronounced in regions with declining emissions sectors (e.g., reduced coal use in northern China; Xu et al. [37]).
3.
Anthropogenic Drivers: Agriculture vs. Fossil Fuel Extraction
Previous studies suggest that rice paddies determine the seasonal cycle of methane in the basin, which is consistent with the results in Central/Eastern China (Qin et al. [3]; Xu et al. [37]). However, the higher emission intensity of the Sichuan Basin is likely due to its status as an important rice-growing region with flooded fields in summer, enhancing anaerobic methanogenesis. Our results show that agricultural activity in the basin is an important factor for the increase in atmospheric methane concentration in this area.
Natural gas operations contribute to the year-round XCH4 increase in the basin—a pattern also observed in the Tarim Basin (Qin et al. [3]) and Shanxi coal fields (Zhang et al. [19]). However, our work quantifies the dominance of this source in clustered zones of high XCH4 near extraction sites that can be traced via satellite anomalies (cf. Zhang et al.’s use of TRO-POMI to identify point sources [19]).
4.
The Transport and Absorption Mechanisms of Atmospheric Methane
The transport and absorption mechanisms of atmospheric methane are complex. The transport of atmospheric methane involves diffusion and migration caused by pressure and temperature gradients, while the absorption of atmospheric methane includes photochemical oxidation and absorption by soil microorganisms.
XCH4 in the Sichuan Basin shows a phenomenon of high levels in the basin and low levels at the periphery, which might be caused by the special topographic and climatic conditions of the Sichuan Basin, including static winds, which hinder the diffusion of methane in the atmosphere. The high atmospheric methane concentration in the Sichuan Basin might be related to the unique topographical environment and meteorological conditions such as static winds, which hinder the diffusion of atmospheric methane.
The studies by Vermeulen et al. (1999) and Tang et al. (2008) showed that methane in oil and gas from deep oil and gas reservoirs can easily migrate to the surface through micro-seepage and permeation, and some of the migrated methane is emitted into the atmosphere without oxidation [51,52]. Oil and gas activities have an impact on the atmospheric methane concentration in the study area, which is caused by micro-seepage in sedimentary basins and the exploitation of oil and gas fields [53].

5. Conclusions

In this study, the XCH4 concentration products synthesized by SCIAMACHY, GOSAT, and Sentinel-5P were processed into monthly average products, and a long-term XCH4 dataset for the Sichuan Basin and its adjacent areas from 2003 to 2021 was established. The spatial and temporal distribution of XCH4 over the Sichuan Basin and the relationships with natural gas extraction and agricultural activities were analyzed. The following conclusions were drawn.
The fusion of multi-satellite data showed high agreement with ground measurements (R = 0.88), demonstrating the reliability of cross-platform remote sensing for regional methane monitoring. This approach overcomes the limitations of single-sensor studies and establishes a reproducible framework for long-term trend analysis in topographically complex regions. It is possible to detect changes in regional atmospheric methane concentrations using satellite data.
The methane concentration in the Sichuan Basin is higher than that in the whole of China, and the increase rate of XCH4 concentration in the Sichuan Basin is 6.14 ppb yr−1. On the pixel scale, the XCH4 concentration across the Sichuan Basin showed an upward trend with a growth rate of 2.27 to 10.44 ppb per year, exceeding the national average (6.64 to 7.87 ppb per year). In addition, it shows a pronounced seasonality (high in summer and autumn, low in winter and spring). The atmospheric methane concentration in the Sichuan Basin showed a clustering characteristic. The high-methane area was mainly concentrated within the basin, while the low-methane area was located on the plateau in the west of the basin. The atmospheric methane concentration within the Sichuan Basin was about 30 ppb higher than in areas with less human activities, but the growth rate of methane concentration was relatively low.
Correlation analysis showed that agricultural activity in the basin was a significant factor for the increase in atmospheric methane concentration in the region.
After analyzing the impact of oil and gas exploitation on atmospheric methane concentration in the Sichuan Basin, it was found that the methane concentration in shale gas, conventional gas, tight gas, and high-sulfur natural gas areas was on average 56.9–72.0 ppb higher than the background value. The exploitation of oil and gas extraction shows a considerable influence on regional methane concentrations.
This study provides a way to investigate the spatiotemporal variation in regional atmospheric methane concentration and the associated natural and anthropogenic factors. However, the change in atmospheric methane concentration and the influencing factors are complex and need to be further investigated in the future.

Author Contributions

Conceptualization, T.W. and Y.W.; methodology, T.W.; investigation, Y.W. and T.W.; data curation, T.W.; writing—original draft preparation, T.W.; writing—review and editing, Y.W.; visualization, T.W.; funding acquisition, Y.W. All authors have read and agreed to the published version of the manuscript.

Funding

This study was funded by the Natural Science Foundation of China (grant No. 42203002 and U1901215), the Theory of Hydrocarbon Enrichment under Multi-Spheric Interactions of the Earth (grant No. THEMSIE04010104), and the Natural Science Fund of Guangdong Province (2021A1515011375).

Data Availability Statement

The data that support the findings of this study are available on public domain resources. The relevant data in this paper can be found in the following links. The SCIAMACHY XCH4 concentration data were provided by Bremen University in Germany (https://www.iup.uni-bremen.de/sciamachy/NIR_NADIR_WFM_DOAS/products/) (accessed on 2 May 2023). The GOSAT XCH4 data were obtained via the GOSAT Data Archive Service (GADS) (https://www.gosat.nies.go.jp/en/index.html) (accessed on 2 May 2023). The S5P XCH4 concentration data were obtained from the European Space Agency (ESA) (https://dataspace.copernicus.eu/) (accessed on 1 June 2025). The ground observations of CH4 concentrations were from the World Data Centre for Greenhouse Gases (WDCGG) (https://gaw.kishou.go.jp/) (accessed on 3 March 2024). The land cover data from MODIS were provided by Google Earth Engine.

Acknowledgments

The authors sincerely acknowledge the science teams of SCIAMACHY, TROPOMI, and GOSAT satellites for the provision of XCH4 data. We are also very grateful to the World Data Centre for Greenhouse Gases (WDCGG) for providing the data. The authors also acknowledge the grants from the Project of Theory of Hydrocarbon Enrichment under Multi-Spheric Interactions of the Earth (THEMSIE04010104) and the National Natural Science Foundation of China under grant No. 42203002 and U1901215. This is contribution No.IS-3684 from GIGCAS.

Conflicts of Interest

The authors declare no conflicts of interest.

References

  1. Marmier, A.; Schosger, J. Methane as Greenhouse Gas; European Commission: The Hague, The Netherlands, 2020. [Google Scholar]
  2. Ak-Bhd, M. WMO Greenhouse Gas Bulletin; World Meteorological Organization: Geneva, Switzerland, 2021. [Google Scholar]
  3. Qin, J.Y.; Zhang, X.Y.; Zhang, L.J.; Cheng, M.M.; Lu, X.H. Spatiotemporal Variations of XCH4 across China during 2003–2021 Based on Observations from Multiple Satellites. Atmosphere 2022, 13, 1362. [Google Scholar] [CrossRef]
  4. Lelieveld, J.; Crutzen, P.J.; Dentener, F.J. Changing concentration, lifetime and climate forcing of atmospheric methane. Tellus B 1998, 50, 128–150. [Google Scholar] [CrossRef]
  5. Legg, S. IPCC, 2021: Climate change 2021-the physical science basis. Interaction 2021, 49, 44–45. [Google Scholar]
  6. He, J.; Naik, V.; Horowitz, L.W. Hydroxyl radical (OH) response to meteorological forcing and implication for the methane budget. Geophys. Res. Lett. 2021, 48, e2021GL094140. [Google Scholar] [CrossRef]
  7. Staniaszek, Z.; Griffiths, P.T.; Folberth, G.A.; O’Connor, F.M.; Abraham, N.L.; Archibald, A.T. The role of future anthropogenic methane emissions in air quality and climate. npj Clim. Atmos. Sci. 2022, 5, 21. [Google Scholar] [CrossRef]
  8. Liu, L.Y.; Chen, L.F.; Liu, Y.; Yang, D.X.; Zhang, X.Y.; Lu, N.M.; Ju, W.M.; Jiang, F.; Yin, Z.S.; Liu, G.H.; et al. Satellite remote sensing for global stocktaking: Methods, progress and perspectives. Natl. Remote Sens. Bull. 2022, 26, 243–267. [Google Scholar]
  9. Jin, Z.; He, J.; Wang, W. Monitoring Methane Concentrations with High Spatial Resolution over China by Using Random Forest Model. Remote Sens. 2024, 16, 2525. [Google Scholar] [CrossRef]
  10. Frankenberg, C.; Meirink, J.; van Weele, M.; Platt, U.; Wagner, T. Assessing methane emissions from global space-borne observations. Science 2005, 308, 1010–1014. [Google Scholar] [CrossRef]
  11. Gallagher, M.; Choularton, T.; Bower, K.; Stromberg, I.; Beswick, K.; Fowler, D.; Hargreaves, K. Measurements of methane fluxes on the landscape scale from a wetland area in North Scotland. Atmos. Environ. 1994, 28, 2421–2430. [Google Scholar] [CrossRef]
  12. Wratt, D.; Gimson, N.; Brailsford, G.; Lassey, K.; Bromley, A.; Bell, M. Estimating regional methane emissions from agriculture using aircraft measurements of concentration profiles. Atmos. Environ. 2001, 35, 497–508. [Google Scholar] [CrossRef]
  13. Law, A.M.; Kelton, W.D.; Kelton, W.D. Simulation Modeling and Analysis; Mcgraw-Hill: New York, NY, USA, 2007; Volume 3. [Google Scholar]
  14. Chen, L.; Zhang, Y.; Zou, M.; Xu, Q.; Li, L.; Li, X.; Tao, J. Overview of atmospheric CO2 remote sensing from space. J. Remote Sens. 2015, 19, 1–11. [Google Scholar]
  15. Aumann, H.H.; Chahine, M.T.; Gautier, C.; Goldberg, M.D.; Kalnay, E.; McMillin, L.M.; Revercomb, H.; Rosenkranz, P.W.; Smith, W.L.; Staelin, D.H. AIRS/AMSU/HSB on the Aqua mission: Design, science objectives, data products, and processing systems. IEEE Trans. Geosci. Remote Sens. 2003, 41, 253–264. [Google Scholar] [CrossRef]
  16. Zhang, L.; Wei, C.; Liu, H.; Jiang, H.; Lu, X.; Zhang, X.; Jiang, C. Comparison analysis of global methane concentration derived from SCIAMACHY, AIRS, and GOSAT with surface station measurements. Int. J. Remote Sens. 2021, 42, 1823–1840. [Google Scholar] [CrossRef]
  17. Liu, Y.; Wang, J.; Che, K.; Cai, Z.N.; Yang, D.X.; Wu, L. Satellite remote sensing of greenhouse gases: Progress and trends. Natl. Remote Sens. Bull. 2021, 25, 53–64. [Google Scholar]
  18. Chen, D.; Chen, A.; Hu, X.Y.; Guo, L.Y.; Yang, Y.; Fang, X.K. Historical trend of China’s CH4 concentrations and emissions during 2003–2020 based on satellite observations, and their implications. Atmos. Pollut. Res. 2022, 13, 5. [Google Scholar] [CrossRef]
  19. Zhang, J.X.; Han, G.; Mao, H.Q.; Pei, Z.P.; Ma, X.; Jia, W.J.; Gong, W. The Spatial and Temporal Distribution Patterns of XCH4 in China: New Observations from TROPOMI. Atmosphere 2022, 13, 177. [Google Scholar] [CrossRef]
  20. Feng, D.; Gao, X.; Yang, L.; Hui, X.; Zhou, Y. Analysis of long-term (2003–2015) spatial-temporal distribution of atmospheric methane in the troposphere over the Qinghai-Xizang Plateau based on AIRS data. Theor. Appl. Climatol. 2019, 137, 1247–1255. [Google Scholar] [CrossRef]
  21. Ehret, G.; Bousquet, P.; Pierangelo, C.; Alpers, M.; Millet, B.; Abshire, J.B.; Bovensmann, H.; Burrows, J.P.; Chevallier, F.; Ciais, P.; et al. MERLIN: A French-German space lidar mission dedicated to atmospheric methane. Remote Sens. 2017, 9, 1052. [Google Scholar] [CrossRef]
  22. Jiang, S.; Peng, Y.; Gao, B.; Zhang, J.; Cai, D.; Xue, G.; Bao, S.; Xu, Z.; Tang, X.; Dahdah, N. Geology and shale gas resource potentials in the Sichuan Basin, China. Energy Explor. Exploit. 2016, 34, 689–710. [Google Scholar] [CrossRef]
  23. Zhao, W.; Wang, Z.; Jiang, H.; Fu, X.; Xie, W.; Xu, A.; Shen, A.; Shi, S.; Huang, S.; Jiang, Q. Exploration status of the deep Sinian strata in the Sichuan Basin: Formation conditions of old giant carbonate oil/gas fields. Nat. Gas Ind. B 2020, 7, 462–472. [Google Scholar] [CrossRef]
  24. Zhang, D.; Dong, H. Understanding Arable Land Change Patterns and Driving Forces in Major Grain-Producing Areas: A Case Study of Sichuan Province Using the PLUS Model. Land 2023, 12, 1443. [Google Scholar] [CrossRef]
  25. Bovensmann, H.; Buchwitz, M.; Frerick, J.; Hoogeveen, R.W.; Kleipool, Q.; Lichtenberg, G.; Noël, S.; Richter, A.; Rozanov, A.; Rozanov, V.V. SCIAMACHY on ENVISAT: In-flight optical performance and first results. In Proceedings of the Remote Sensing of Clouds and the Atmosphere VIII, Barcelona, Spain, 16 February 2004; pp. 160–173. [Google Scholar]
  26. Bovensmann, H.; Burrows, J.P.; Buchwitz, M.; Frerick, J.; Noël, S.; Rozanov, V.V.; Chance, K.V.; Goede, A.P.H. SCIAMACHY: Mission objectives and measurement modes. J. Atmos. Sci. 1999, 56, 127–150. [Google Scholar] [CrossRef]
  27. Yokota, T.; Yoshida, Y.; Eguchi, N.; Ota, Y.; Tanaka, T.; Watanabe, H.; Maksyutov, S.J.S. Global concentrations of CO2 and CH4 retrieved from GOSAT: First preliminary results. Sola 2009, 5, 160–163. [Google Scholar] [CrossRef]
  28. Yokota, T.; Oguma, H.; Morino, I.; Higurashi, A.; Aoki, T.; Inoue, G. Test measurements by a BBM of the nadir-looking SWIR FTS aboard GOSAT to monitor CO2 column density from space. In Proceedings of the Passive Opl Remote Sensing of the Atmosphere and Clouds IV, Honolulu, HI, USA, 30 December 2004; pp. 182–188. [Google Scholar]
  29. Hamazaki, T.; Kaneko, Y.; Kuze, A.; Suto, H. Greenhouse gases observation from space with TANSO-FTS on GOSAT. In Proceedings of the Fourier Transform Spectroscopy, Santa Fe, NM, USA, 11–15 February 2007; p. FWB1. [Google Scholar]
  30. Veefkind, J.P.; Aben, I.; McMullan, K.; Förster, H.; de Vries, J.; Otter, G.; Claas, J.; Eskes, H.J.; de Haan, J.F.; Kleipool, Q.; et al. TROPOMI on the ESA Sentinel-5 Precursor: A GMES mission for global observations of the atmospheric composition for climate, air quality and ozone layer applications. Remote Sens. Environ. 2012, 120, 70–83. [Google Scholar] [CrossRef]
  31. Tucker, C.J.; Newcomb, W.W.; Los, S.O.; Prince, S.D. Mean and Inter-Year Variation of Growing-Season Normalized Difference Vegetation Index for The Sahel 1981–1989. Int. J. Remote Sens. 1991, 12, 1133–1135. [Google Scholar] [CrossRef]
  32. Lunetta, R.S.; Knight, J.F.; Ediriwickrema, J.; Lyon, J.G.; Worthy, L.D. Land-cover change detection using multi-temporal MODIS NDVI data. In Geospatial Information Handbook for Water Resources and Watershed Management; CRC Press: Boca Raton, FL, USA, 2022; Volume II, pp. 65–88. [Google Scholar]
  33. Cai, B.; Yu, R. Advance and evaluation in the long time series vegetation trends research based on remote sensing. J. Remote Sens. 2009, 13, 1170–1186. [Google Scholar]
  34. Xu, Z.X.; Takeuchi, K.; Ishidaira, H. Monotonic trend and step changes in Japanese precipitation. J. Hydrol. 2003, 279, 144–150. [Google Scholar] [CrossRef]
  35. Wu, X.D.; Zhang, X.Y.; Chuai, X.W.; Huang, X.J.; Wang, Z. Long-Term Trends of Atmospheric CH4 Concentration across China from 2002 to 2016. Remote Sens. 2019, 11, 538. [Google Scholar] [CrossRef]
  36. Li, L.; Zhu, L.Q.; Zhu, W.B.; Xu, S.B.; Li, Y.H.; Ma, H. The correlation between ecosystem service value and human activity intensity and its trade-offs—Take Qihe River basin forexample. China Environ. Sci. 2020, 40, 365–374. [Google Scholar]
  37. Xu, J.; Li, W.; Xie, H.; Wang, Y.; Wang, L.; Hu, F. Long-term trends and spatiotemporal variations in atmospheric XCH4 over China utilizing satellite observations. Atmosphere 2022, 13, 525. [Google Scholar] [CrossRef]
  38. Kirschke, S.; Bousquet, P.; Ciais, P.; Saunois, M.; Canadell, J.G.; Dlugokencky, E.J.; Bergamaschi, P.; Bergmann, D.; Blake, D.R.; Bruhwiler, L.; et al. Three decades of global methane sources and sinks. Nat. Geosci. 2013, 6, 813–823. [Google Scholar] [CrossRef]
  39. Schaefer, H.; Fletcher, S.E.M.; Veidt, C.; Lassey, K.R.; Brailsford, G.W.; Bromley, T.M.; Dlugokencky, E.J.; Michel, S.E.; Miller, J.B.; Levin, I.; et al. A 21st-century shift from fossil-fuel to biogenic methane emissions indicated by 13CH4. Science 2016, 352, 80–84. [Google Scholar] [CrossRef]
  40. Turner, A.J.; Frankenbergb, C.; Wennberg, P.O.; Jacob, D.J. Ambiguity in the causes for decadal trends in atmospheric methane and hydroxyl. Proc. Natl. Acad. Sci. USA 2017, 114, 5367–5372. [Google Scholar] [CrossRef]
  41. McNorton, J.; Chipperfield, M.P.; Gloor, M.; Wilson, C.; Feng, W.H.; Hayman, G.D.; Rigby, M.; Krummel, P.B.; O’Doherty, S.; Prinn, R.G.; et al. Role of OH variability in the stalling of the global atmospheric CH4 growth rate from 1999 to 2006. Atmos. Chem. Phys. 2016, 16, 7943–7956. [Google Scholar] [CrossRef]
  42. Wang, H.; Li, J.; Zhang, Y.; Li, S.; Zhang, L.; Chen, L. Spatial and temporal distribution of near-surface methane concentration over China based on AIRS observations. J. Remote Sens. 2015, 19, 827–835. [Google Scholar]
  43. Li, M.; Liu, S.; Sun, Y.; Liu, Y. Agriculture and animal husbandry increased carbon footprint on the Qinghai-Tibet Plateau during past three decades. J. Clean. Prod. 2021, 278, 123963. [Google Scholar] [CrossRef]
  44. Liu, Z.; Chen, B.; Wang, S.; Xu, X.; Chen, H.; Liu, X.; He, J.-S.; Wang, J.; Wang, J.; Chen, J. More enhanced non-growing season methane exchanges under warming on the Qinghai-Tibetan Plateau. Sci. Total Environ. 2024, 917, 170438. [Google Scholar] [CrossRef] [PubMed]
  45. Jin, H.; Wu, J.; Cheng, G.; Nakano, T.; Sun, G. Methane emissions from wetlands on the Qinghai-Tibet Plateau. Chin. Sci. Bull. 1999, 44, 2282–2286. [Google Scholar] [CrossRef]
  46. Yue, Q.; Zhang, G.J.; Wang, Z. Preliminary estimation of methane emission and its distribution in China. Geogr. Res. 2012, 31, 1559–1570. [Google Scholar]
  47. He, Q.; Yu, T.; Gu, X.F.; Cheng, T.H.; Zhang, Y.; Xie, D.H. Global Atmospheric Methane Variation and Temporal-Spatial Distribution Analysis Based on Ground-based and Satellite Data. Remote Sens. Inf. 2012, 27, 34–39+43. [Google Scholar]
  48. Sarg, J. The sequence stratigraphy, sedimentology, and economic importance of evaporite–carbonate transitions: A review. Sediment. Geol. 2001, 140, 9–34. [Google Scholar] [CrossRef]
  49. Zhang, D. Development prospect of natural gas industry in the Sichuan Basin in the next decade. Nat. Gas Ind. B 2022, 9, 119–131. [Google Scholar] [CrossRef]
  50. Dai, J.X.; Ni, Y.Y.; Liu, Q.Y.; Wu, X.Q.; Gong, D.Y.; Hong, F.; Zhang, Y.L.; Liao, F.R.; Yan, Z.M.; Li, H.W. Sichuan super gas basin in southwest China. Pet. Explor. Dev. 2021, 48, 1251–1259. [Google Scholar] [CrossRef]
  51. Vermeulen, A.; Eisma, R.; Hensen, A.; Slanina, J. Transport model calculations of NW-European methane emissions. Environ. Sci. Policy 1999, 2, 315–324. [Google Scholar] [CrossRef]
  52. Tang, J.H.; Bao, Z.Y.; Xiang, W.; Gou, Q.H. Geological emission of methane from the Yakela condensed oil/gas field in Talimu Basin, Xinjiang, China. J. Environ. Sci. 2008, 20, 1055–1062. [Google Scholar] [CrossRef] [PubMed]
  53. Ma, X.; Zheng, G.; Liang, S.; Fan, C.; Wang, Z.; Liang, M. Contributions of geologic methane to atmospheric methane sources and sinks. Bull. Mineral. Petrol. Geochem. 2012, 31, 139–145. [Google Scholar]
Figure 1. Sichuan Basin and peripheral area and its sub-regions (a: the western Sichuan plateau; b: the southern edge red bed zone; c: the eastern Sichuan ridge valley zone; d: the northern foothill transition zone; e: the basin area).
Remotesensing 17 02695 g001
Figure 2. Overview of data processing in this study.
Remotesensing 17 02695 g002
Figure 3. Scatter plot of satellite-observed XCH4 versus ground-observed CH4 concentrations.
Remotesensing 17 02695 g003
Figure 4. Reflections of annual mean XCH4 values in the Sichuan Basin area and China.
Remotesensing 17 02695 g004
Figure 5. Monthly average XCH4 from 2003 to 2021 observed by three satellites over the Sichuan Basin.
Remotesensing 17 02695 g005
Figure 6. Seasonal distribution of XCH4 in the Sichuan Basin during 2003–2021: (a) spring; (b) summer; (c) autumn; (d) winter.
Remotesensing 17 02695 g006
Figure 7. Spatial distribution of XCH4 annual growth rate in the Sichuan Basin from 2003 to 2021: (a) plot of XCH4 Theil–Sen slope trend in the Sichuan Basin; (b) plot of XCH4 Mann–Kendall trend test in the Sichuan Basin.
Remotesensing 17 02695 g007
Figure 8. Spatial distribution of average atmospheric CH4 concentration over the Sichuan Basin during 2003–2021.
Remotesensing 17 02695 g008
Figure 9. Annual average spatial distribution of XCH4 data from three satellites/sensors in the Sichuan Basin from 2003 to 2021: (a) XCH4 during 2003–2010; (b) XCH4 during 2011–2018; (c) XCH4 during 2019–2021.
Remotesensing 17 02695 g009
Figure 10. XCH4 cluster analysis and hotspot analysis in the Sichuan Basin: (a) cluster analysis; (b) hotspot analysis.
Remotesensing 17 02695 g010
Figure 11. Line chart of the mean value of each region in the Sichuan Basin from 2003 to 2021: (a) XCH4 of basin versus periphery; (b1) region a; (b2) region b; (b3) region c; (b4) region d; (b5) region e.
Remotesensing 17 02695 g011aRemotesensing 17 02695 g011b
Figure 12. Line chart of monthly mean values of each region in the Sichuan Basin from 2003 to 2021; (a) XCH4 of basin versus periphery; (b1) region a; (b2) region b; (b3) region c; (b4) region d; (b5) region e.
Remotesensing 17 02695 g012aRemotesensing 17 02695 g012b
Figure 13. Scatterplot of XCH4 and agricultural production value in the Sichuan Basin area.
Remotesensing 17 02695 g013
Figure 14. (a) Agricultural activity intensity index; (b) spatial distribution of correlation coefficients (down) between atmospheric methane concentration in the Sichuan Basin from 2003 to 2021.
Remotesensing 17 02695 g014
Figure 15. Distribution of oil and gas fields in the Sichuan Basin.
Remotesensing 17 02695 g015
Figure 16. Changes in annual atmospheric methane concentrations in the oil and gas distribution area of the Sichuan Basin: (a) the shale gas zone; (b) the tight gas zone in western Sichuan; (c) the shale gas and conventional gas zone; (d) the high-sulfur natural gas zone; (e) the conventional gas zone.
Remotesensing 17 02695 g016
Figure 17. Changes in monthly atmospheric methane concentrations in the oil and gas distribution area of the Sichuan Basin: (a) the shale gas zone; (b) the tight gas zone in western Sichuan; (c) the shale gas and conventional gas zone; (d) the high-sulfur natural gas zone; (e) the conventional gas zone.
Remotesensing 17 02695 g017aRemotesensing 17 02695 g017b
Table 1. Correlation between XCH4 observed by satellite and CH4 concentration observed by ground station.
SatellitesRegressionR2RpN
Envisaty = 0.73x + 418.340.050.22<0.0196
GOSATy = 1.13x − 336.240.640.80<0.0196
Sentinel-5Py = 1.02x − 142.760.730.85<0.0136
Table 2. Seasonal XCH4 in the Sichuan Basin.
SeasonTotal (ppb)SCIAMACHY (ppb)GOSAT (ppb)TROPOMI (ppb)
spring1810.021772.401829.761857.69
summer1832.041805.951843.121872.07
autumn1832.211792.671854.351878.62
winter1810.001775.591827.221857.72
Disclaimer/Publisher’s Note: The statements, opinions and data contained in all publications are solely those of the individual author(s) and contributor(s) and not of MDPI and/or the editor(s). MDPI and/or the editor(s) disclaim responsibility for any injury to people or property resulting from any ideas, methods, instructions or products referred to in the content.

