1. Introduction
Since the 1970s, Earth Observation data have been used in the mining sector to map the distribution of different lithologies, to explore new sites, and to monitor environmental critical issues. Recently, remote sensing by various satellite and airborne platforms, multi and hyperspectral, has been increasingly applied in the characterization of several material deposit types in active and abandoned mines [
1,
2,
3,
4,
5]. In particular, the availability of open-access satellite imagery with higher spectral and spatial resolutions makes remote sensing techniques even more exploitable in all phases of mining activities. Typical spectral features in different regions of the electromagnetic spectrum (reflectance spectroscopy) have also been applied to characterize and identify the mineralogy and speciation of critical raw materials in a rapid and cost-effective manner [
3,
6]. In recent years, raw materials have become increasingly crucial and indispensable for ecological transition, industrial competitiveness, and the health and safety of citizens [
7]. Recently, uncertainty in the supply of raw materials to global production networks has pushed private and non-corporate actors such as the European Union (EU) and the United Nations (UN) to act in the global race to detect and extract critical raw materials. Because of this, action plans and initiatives improving circularity and sustainability began to strengthen the resilience and strategic autonomy that depend on the availability of raw materials [
8,
9]. The UN Secretary-General’s Panel on Critical Energy Transition Minerals highlights the need to reconcile the acceleration of mineral extraction for energy transition requirements with the well-being of countries and local communities that have these resources and addresses issues of equity, transparency, investment, sustainability, and human rights. The Working Group on Extractive Industries Transformation for Sustainable Development, in its flagship initiative “Harnessing Critical Minerals of the Energy Transition for Sustainable Development”, highlights the need to census and protect critical raw material deposits to facilitate sustainable measures and critical raw material value chains in global production networks.
The raw material demand is expected to increase in the future, and the development of new strategies is currently needed to meet the expectations of strategic sectors and technologies [
7,
10,
11,
12]. Earth Observation can help address the growing demand for critical minerals for production systems towards a sustainable energy transition [
1,
13,
14]. In recent years, historic mining sites with abandoned stockpiles have attracted scientific interest because they potentially contain minerals of economic importance. Such deposits represent novel resources since original strategies for the industry were not targeted at the time of the initial mining activity [
15].
Hyperspectral imaging systems, with high spectral resolutions, are valuable tools for the accurate characterization of key pathfinder minerals [
16,
17,
18] and for distinguishing between mining residues according to extraction and mineral resource processing, such as in overburden, waste rock, mine spoils, and tailings [
19,
20,
21,
22]. The classification of raw materials depends on attributes such as grain size, residual economic value, and potential risk after storage [
23]. These novel sensors are nowadays available in situ, airborne even on unmanned vehicles, and onboard on spacecrafts. Referring to spaceborne platforms, hyperspectral sensors are included in several satellite missions (Italy’s PRISMA, Germany’s EnMap, China’s GF-5, USA’s EMIT, and Japan’s HISUI), which are under investigation for mining purposes [
20,
21,
22,
24]. Particular attention of the community is focused on the Hyperspectral Precursor of the Application Mission (PRISMA) satellite, launched on 22 March 2019. The mission has been developed, owned, and operated by Agenzia Spaziale Italiana (ASI), and it is aimed at providing observations and data about land surface, agriculture and forestry, regional geology, land use studies, water resources, vegetation studies, coastal studies, and soils. The PRISMA hyperspectral platform carries VNIR-SWIR imaging spectrometers operating in the 400–2500 nm spectral range with 30 m spatial resolution and a high-resolution panchromatic camera (PAN), with 5 m spatial resolution [
25]. The use of such data is a promising tool for exploiting mining activities [
19], but further missions will be launched in the near future, significantly increasing the EO capabilities. Such novel sensors, together with additional geophysical technologies, positioning systems, autonomous trucks, and drones, will be the frontier for exploration and mining in the framework of Mining 4.0 [
26].
Since a large amount of mining residues has been produced in recent decades worldwide, the lack of detailed data (i.e., exact positioning, chemical and mineralogical composition, and minerals yet to be exploited) about materials, considered below the cut-off grade at the time of initial mining activity, is a major gap. Currently, several national databases exist, but they only concern the period of mining activity; indeed, there are no data on where and how the residues were placed [
23]. This information is now valuable because we want to use the residues with modern extraction techniques, improving recovery, remediation, and creating value chains of critical raw materials.
Nowadays, the development of advanced technologies enables us to fill data gaps concerning the distribution patterns of minerals in ore deposits and in the waste material of nearby areas. Novel approaches will support the reusing of mining residues as a potential source of raw materials. In this context, remote sensing and reflectance spectroscopy can play a fundamental role in exploiting the spectral characteristics of waste generated by the mining, processing, and disposal phases. These methods are less expensive, eco-friendly, and faster compared to traditional techniques used to identify minerals of interest in the valuable reserves of resources present in easily accessible mining residues [
27].
The study area is part of the complex geological framework of the Rehamna region in central Morocco, where tectono-magmatic activity has led to the presence of hydrothermal fluids [
28]. Significant Paleozoic and Permo-Carboniferous magmatism, particularly granite intrusions, occurred in the Rehamna Massif [
29]. These magmatic bodies function as heat sources, heating groundwater and enabling them to interact with nearby rocks, thus driving the circulation of hydrothermal fluids [
30]. The region is intersected by numerous faults and fractures, especially those trending NW–SE and NE–SW, which allow deeply seated fluids to move upward. These faults were reactivated during tectonic events, creating pathways for mineralization and fluid migration. Hydrothermal fluids in Rehamna were also enriched by regional metamorphic processes and incompatible elements (W, Sn, and Cu above all), and other ore deposits [
31]. When these fluids encountered variations in temperature, pressure, or chemical composition, they often precipitated minerals, forming veins and alteration halos. The Sidi Bou Azzouz mining site was closed due to a complex interplay of social challenges, environmental degradation, and economic pressures [
32]. These factors collectively made it unfeasible to continue mining operations at the site, leading to its closure.
The main objective of this research is to evaluate the contribution of multi-source data integration regarding satellite hyperspectral imaging. Different spaceborne platforms are nowadays available, but, adding a stratified approach, we defined a multi-scale solution for the identification of spectral endmembers. Combining in situ ground truthing through field surveys, sampling, and laboratory analysis, we are presenting an intermediate level of knowledge between satellite data and field evidence. Particular attention was focused on selecting a small and abandoned mining site where stockpiles of mining waste and tailings differentiate such an application from state-of-the-art regional studies, concerned with mineral exploration on lithologies. To achieve this, this study adopts an interdisciplinary approach that integrates the Laboratory VIS-NIR-SWIR spectroscopy (LS) of raw material samples with their petrographic, mineralogical, and chemical analyses and satellite hyperspectral imaging (HSI) of the sampling sites extracted from PRISMA images. The most advanced techniques, including Laser-Induced Breakdown Spectroscopy (LIBS), X-ray Fluorescence (XRF), X-ray Powder Diffraction (XRPD), and Scanning Electron Microscopy with Energy Dispersive X-ray Spectroscopy (SEM-EDS), were used to confirm the presence of minerals in the mining residues. As mining residues are increasingly recognized as potential sources of raw materials worldwide, these technologies can play a critical role in evaluating and exploiting such materials. The interdisciplinary methodology developed in this research aims to assess the feasibility of detecting valuable raw materials in the study area by leveraging the unique strengths of these analytical tools.
2. Study Site, Materials, and Methods
The multidisciplinary approach presented in this study is based on the geological framework of the region of interest, which serves as the foundation for defining the sampling strategy. Hyperspectral data, both obtained in the laboratory and acquired by a satellite platform, function as a gap-filling tool between the spatial distribution of mining residues and traditional geochemical and mineralogical techniques.
2.1. The Geological Framework of the Study Area
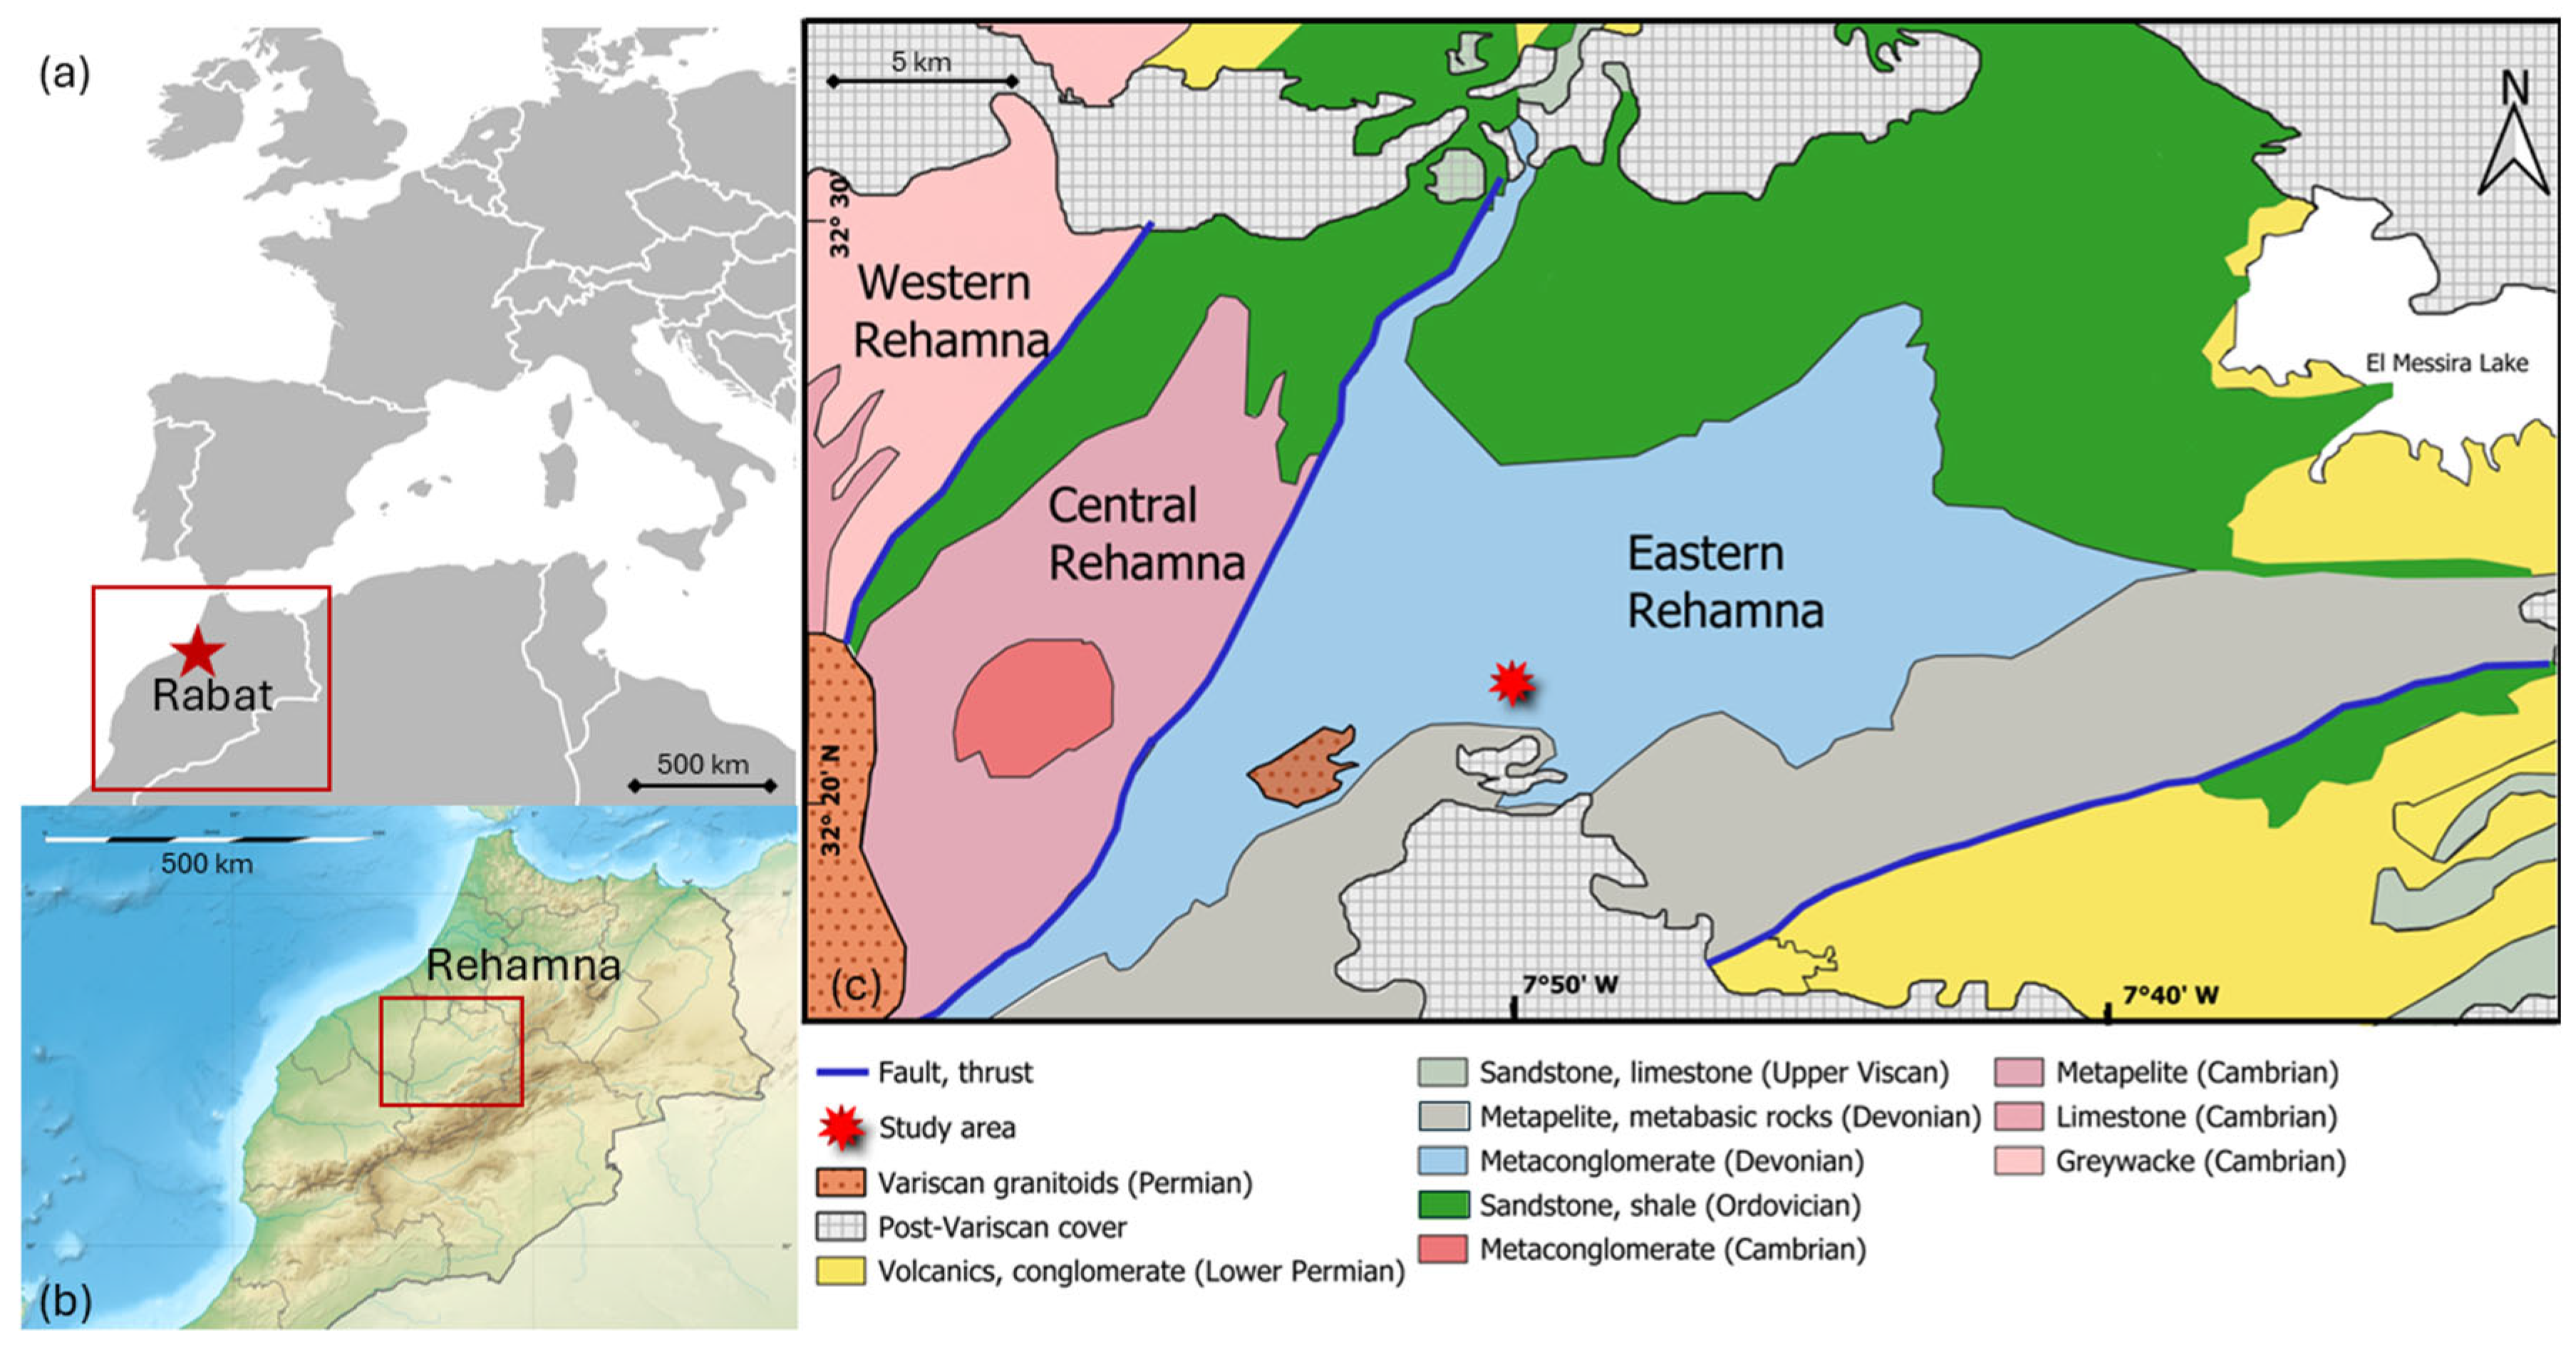
The Sidi Bou Azzouz closed and abandoned mine in the eastern Rehamna (Morocco) represents a significant geological and economic resource, having previously been exploited in the 1980s as a tungsten ore mine [
33]. The tungsten deposits are hosted within a hydrothermal quartz vein system and continue to hold potential for future extraction. Studying them offers insight into the broader geological history of the Rehamna massif, located 90 km north of Marrakech within the western Meseta Domain. This massif is divided into septentrional and meridional sections and is characterized by distinct structural and metamorphic units [
28]. In particular, the southern Rehamna region, where Sidi Bou Azzouz is situated, is categorized into three structural units related to the Variscan orogeny, namely, the western, central, and eastern Rehamna (
Figure 1).
The Massif also features lower Permian magmatic intrusions (
Figure 1), such as the Ras el Abiod and Koudiat er Ramel granitoids, which are part of an expansive batholith impacting the Oulad Hassine and Lalla Tittaf formations [
28,
29]. This magmatism has influenced mineralization patterns, linking granitoids with mineralized veins that host tungsten, lead, lithium, beryllium, and other metals. Tungsten deposits are limited in extent and abundance, as they are generated by fluids in the magmatic–hydrothermal transition phases often associated with highly fractionated alkali-granites and fluid–rock interactions [
30,
31]. Tungsten precipitation is controlled by the availability of cations such as Fe, Mn, and Ca, which are necessary for the formation of W-bearing minerals such as wolframite and scheelite. These fluids of the magmatic–hydrothermal transition processes are therefore associated with rocks of alkaline–granite composition that are distinguished by the presence of muscovite, lepidolite, alkali feldspars, quartz, wolframite, and scheelite minerals that are characteristic spectral signatures or ore minerals fingerprints. Furthermore, hydrothermal fluids of magmatic origin transported through faults or other permeable structures can react with carbonate rocks (marbles), favoring the precipitation of scheelite (CaWO
4), for which W mineralization is associated with spectral signatures indicating high-calcium concentrations in the calcium-poor granite rocks.
In the eastern part of the Rehamna massif, where the study area is located, the metamorphic units belong to the Oulad Hassine Formation. These metamorphic units exhibit varied mineral assemblages and microstructural features. The greenschist facies rocks are characterized by fine-grained, dark gray-blue schists with quartz lenses and quartzite [
34,
35]. These rocks are rich in biotite and chlorite, indicating low-grade metamorphic conditions. The amphibolite facies rocks, which represent a higher metamorphic grade, are characterized by alternating layers of muscovite and biotite with late-stage chlorite, along with quartz boudins. Together, these facies reflect a complex metamorphic history influenced by various pressure and temperature conditions [
28,
29,
30,
31]. The Sidi Bou Azzouz abandoned mine sits on the metaconglomerate (
Figure 1) and covers an area of about 920 km
2. The major deposits are in the smallest sector, which extends to approximately 0.3 km
2. This zone includes two major tunnels and one processing facility. The outcropping residues consist of materials with different extraction ages.
2.2. The Sampling Strategy
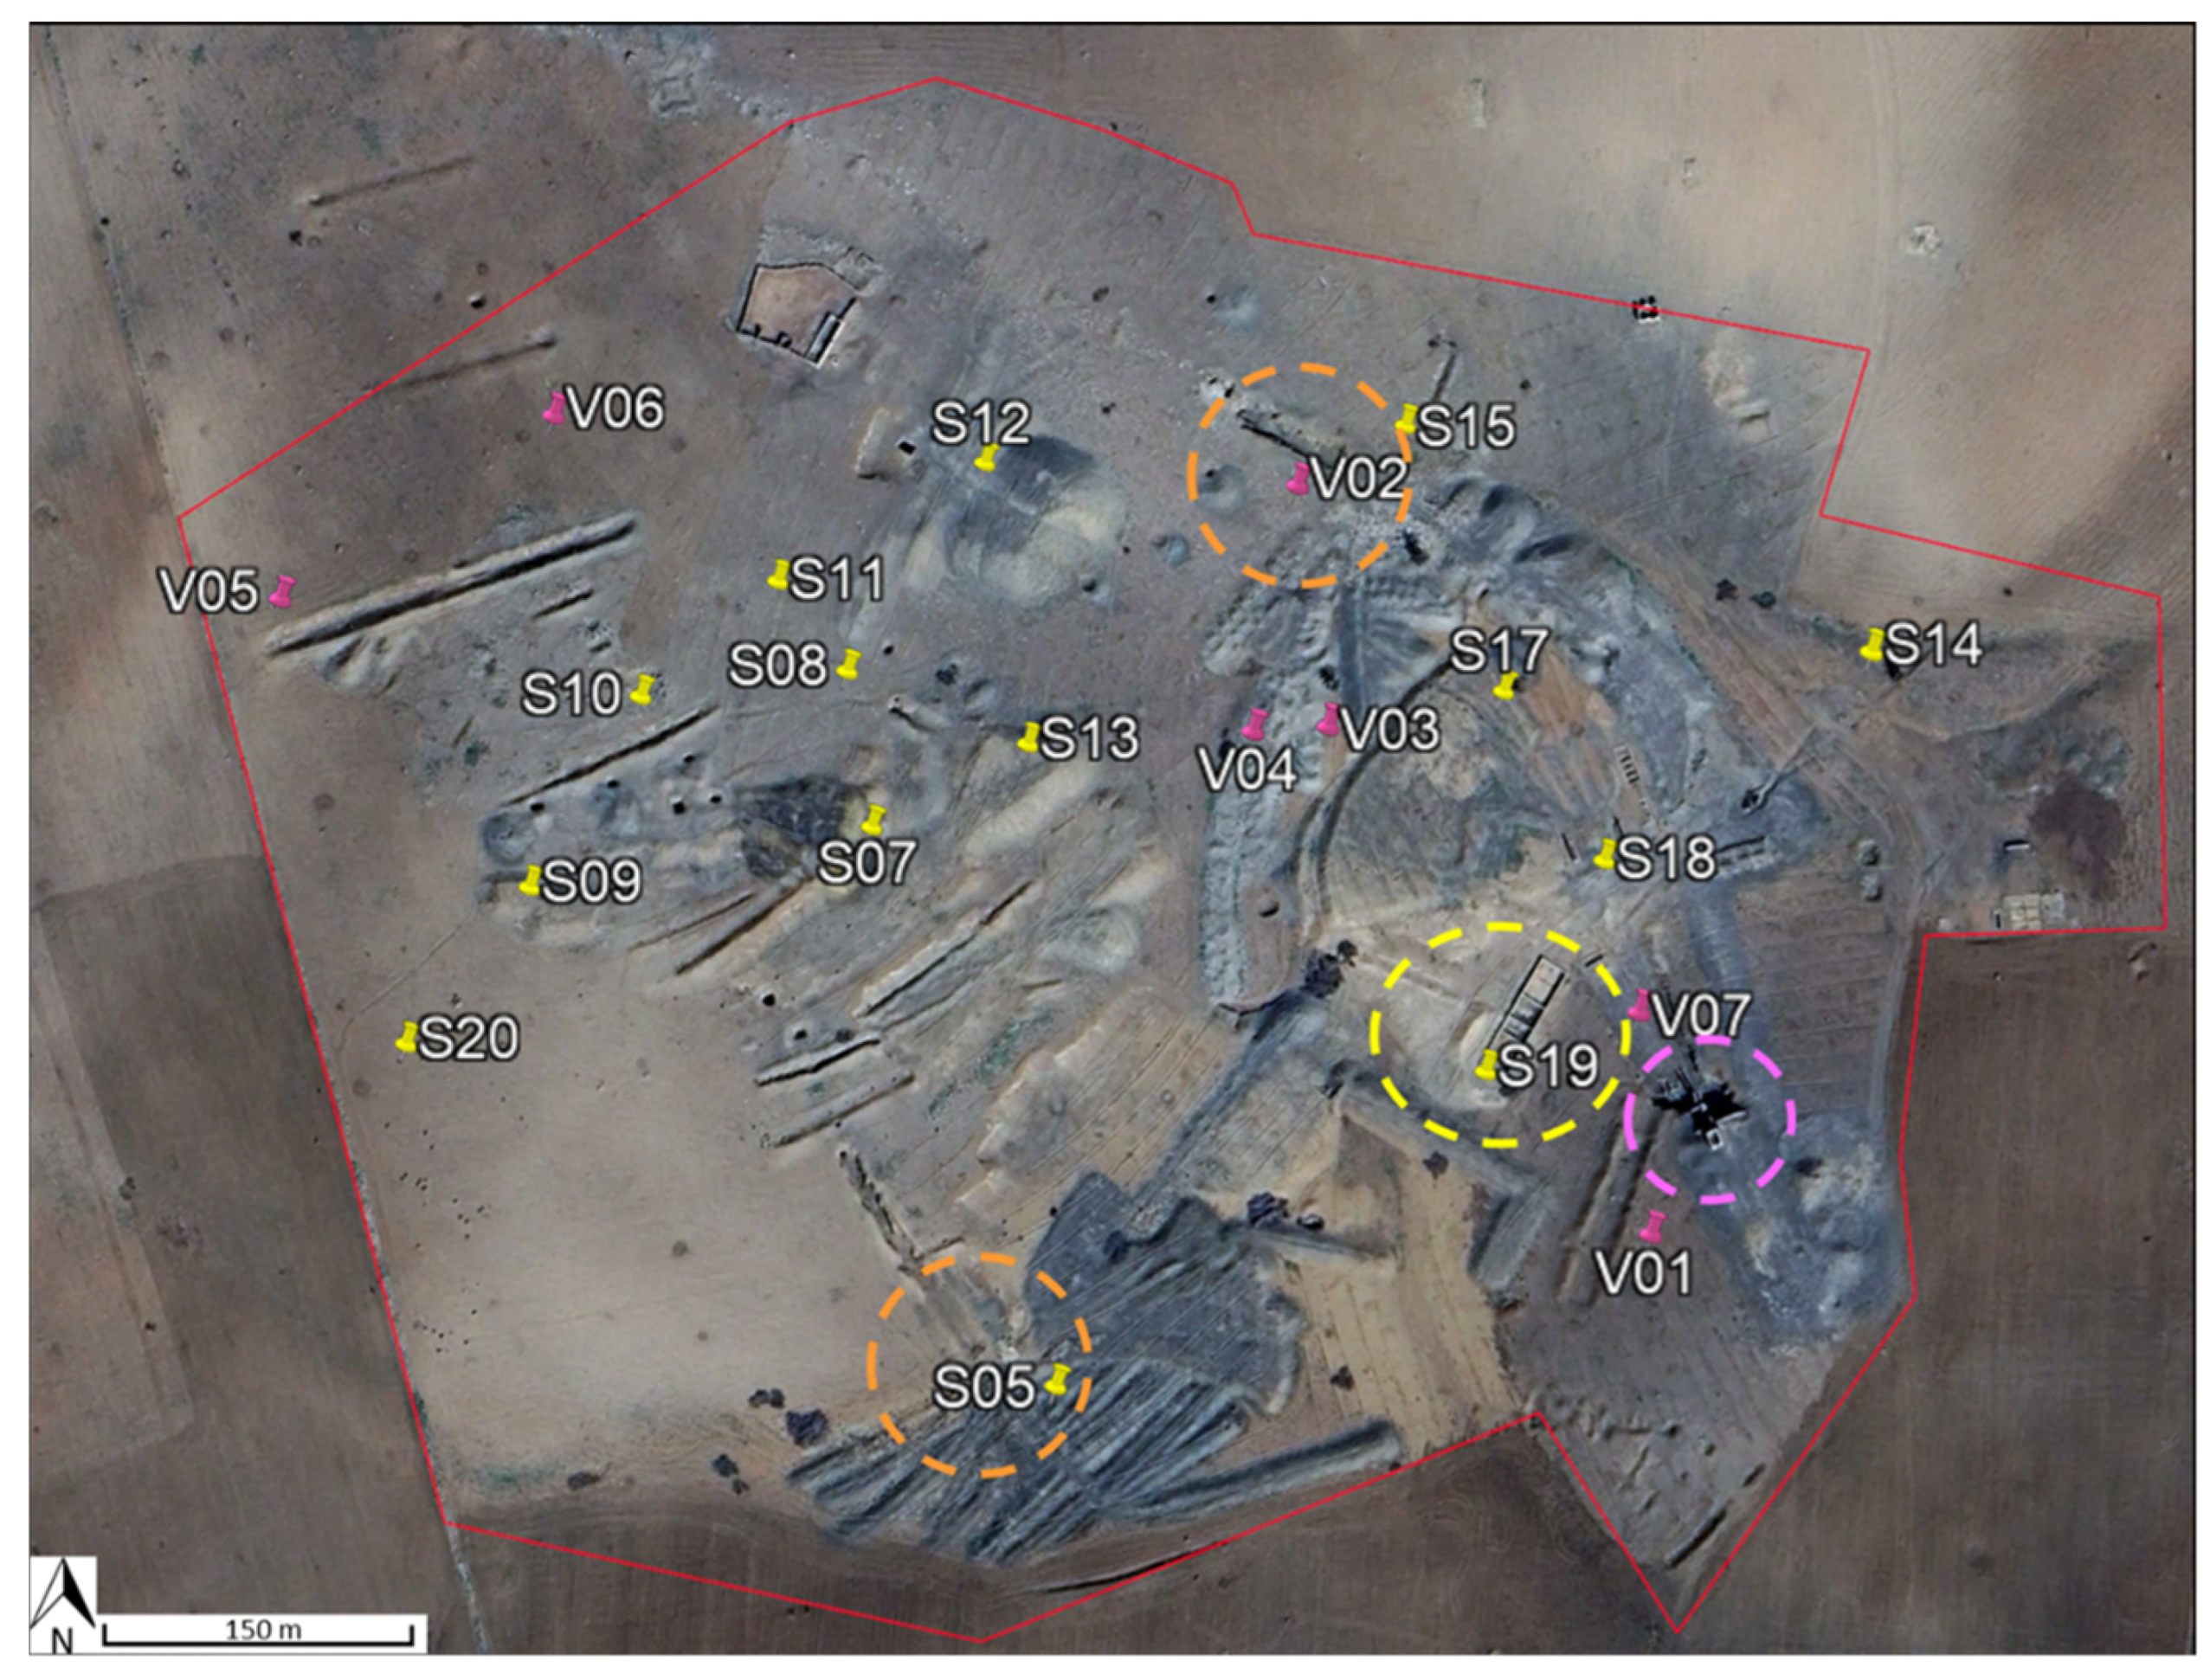
The study site was characterized by two different field surveys. During the first in situ campaign conducted in May 2022, a total of 14 samples were collected (
Figure 2).
Following the collection of GPS coordinates, a total of three to five spatially distributed samples were collected from each stockpile within 10 m.
The sampling strategy was aimed at collecting mining residues from different stockpiles, including, at the same time, the largest heterogeneity occurring in the study area. Stockpiles were first identified matching photointerpretation and knowledge provided by local authorities. During the fieldwork, samples were collected across the whole mining site to consider all unidentified stockpiles. Samples, without any pretreatment, were considered for laboratory reflectance measurements. Samples for subsequent chemical and mineralogical analyses were ground in an agate mortar, passed through a 0.150 mm sieve, and pelletized. Finally, a second sampling campaign was conducted in June 2023, when additional 7 samples were collected with the aim of validating the identification and classification achieved by satellite data, combined with chemical compositional and mineralogical data. The second survey was completed with 18 ground control points, where only field observations were used to validate the photo-interpreted sketch map.
2.3. Hyperspectral Data
Hyperspectral data were used for the identification of CRMs and for assessing the spatial distribution of those deposits. The first task was approached with spectral acquisitions obtained under laboratory conditions on sampled materials. The second task was developed differently, analyzing imagery provided by satellite platforms.
2.3.1. Laboratory VIS-NIR-SWIR Spectroscopy
Spectroscopy is a non-destructive technique used to measure the relative absorption of photons as they interact with minerals across a specific wavelength range, compared to a reference standard [
3,
36,
37,
38,
39,
40]. Hyperspectral signatures are useful for the detailed identification and characterization of materials, exploiting the large amount of data from the visible to short infrared range of the electromagnetic spectrum. In particular, the visible–near-infrared–shortwave infrared (VNIR-SWIR) range yields spectral features that provide valuable insights into the composition and properties of different minerals, as they exhibit characteristic absorption, reflectance, or transmission in these spectral regions.
The spectral signature of each air-dried mining residue sample collected in the abandoned mine, during two different field surveys, has been recorded in the laboratory by reflectance spectroscopy using a field hyperspectral spectrometer (FieldSpec 3, Analytical Spectral Devices—ASD, Boulder, CO, USA) in the VNIR-SWIR spectral domain (350–2500 nm), with a sampling resolution ranging between 1.4 nm in the visible domain and 2 nm in the SWIR domain. In this range, the absorption features are primarily caused by electronic processes occurring between 350 nm and 1300 nm, and vibrational processes occurring above 900 nm [
3,
36,
37,
38,
39,
40]. The measurements were performed using a sensor with a field of view of 25° (bare optic fiber probe) placed approximately 10 cm above the sample, facing vertically downward over the sample, and spanning a surface area of about 15 cm
2. The halogen light source (ASD-Lowel Pro-Lamp) was placed approximately 35 cm from the sample (45° viewing). Fifty acquisitions were acquired and integrated for each measurement. A white Spectralon
® panel (a Lambertian reflector) was used as a reference to calculate the reflectance of the sample. The reference panel was therefore measured at the beginning and end of each measurement session, achieving an estimated error of approximately 2% for the absolute reflectance. Finally, shadow effects on each sample were minimized by performing four series of ten measurements, rotating the sample by 90°. Reflectance spectra were then averaged and analyzed using the Savitzky–Golay filter associated with the continuum removal approach, enhancing the detection of spectral absorption features [
3]. Furthermore, laboratory spectra were processed to obtain a homogenized dataset coherent with spectral libraries available for minerals and rocks, provided by the United States Geological Survey (USGS) [
41] and the Jet Propulsion Laboratory (JPL) [
42].
2.3.2. Satellite Hyperspectral Imaging
Data were acquired using two different sensors onboard the PRISMA hyperspectral satellite platform. The VNIR spectrometer yields 66 spectral bands (from 400 nm to 1010 nm) with a nominal spectral sampling interval lower than 11 nm and a bandwidth lower than 15 nm, whereas the SWIR detector acquires 174 spectral bands in the region between 920 and 2500 nm with a bandwidth lower than 15 nm [
25].
In this study, a PRISMA L2D image, orthorectified and atmospherically corrected (PRS_L2D_STD) [
43] of the abandoned mine area under study was acquired on 28 August 2022 (the overpass closest to the field sampling date). Imagery was downloaded from the PRISMA website (
http://prisma-i.it, accessed on 4 May 2025), and the image was processed and analyzed using ENVI 5.6.3 software. Before merging the VNIR and SWIR datasets into a single image file, the overlapping reflectance bands (930–998 nm spectral range) were removed, as well as regions affected by atmospheric interferences [
6]. The same identification of spectral features used for laboratory observations was combined with additional statistical analysis aimed at assessing the spatial distribution of the defined spectral endmembers. The dimensionality reduction obtained by the Principal Component Analysis (PCA) was coupled to the Spectral Angle Mapper (SAM) classification, which is a physically based spectral classification that uses an n-D angle to match pixels to reference spectra [
27,
44]. The algorithm determines the spectral similarity between two spectra by calculating the angle between the spectra and treating them as vectors in a space with dimensionality equal to the number of bands. This technique, when used on calibrated reflectance data, is insensitive to illumination and albedo effects [
44]. SAM compares the angle between the endmember spectrum vector and each pixel vector in n-D space. Smaller angles represent closer matches to the reference spectrum. Pixels further away than the specified maximum angle threshold in radians are not classified. The maximum angle threshold applied in the SAM analysis was set to 0.1 radians for each training set [
27,
44].
The spectral similarity algorithm supported the identification of spectral endmembers, which were considered for the selection of representative region of interest in the available satellite imagery. The obtained spectra were used with a Linear Spectral Unmixing model (LSU), obtaining the relative occurrence of each endmember in the considered pixel. The quality of this result was assessed using the produced error map obtained by using the procedure available in ENVI [
45].
2.3.3. Satellite High Spatially Resolved Imagery
Photointerpretation was carried out using the PRISMA panchromatic imagery with a spatial resolution of 5 m per pixel [
43], combined with images obtained by Google Earth Pro-Image © Airbus 2025, acquired on 2 February 2022.
2.4. Bulk Mineralogical and Chemical Composition
The identification of mineral phases (iron oxides, calcite, phyllosilicates, silicates), in terms of volumetric percentage, was carried out by XRPD (X-ray Powder Diffractometry) using a Brucker D500 diffractometer with CuKα radiation (n = 1.5418 Å), operating at 40 kV and 40 mA with a step size of 0.0250°. The software used for qualitative analyses was WinPLOTR FullProf Suite (version date October 2006) [
46].
The chemical analyses, concerning major elements (SiO2, Al2O3, Fe2O3, TiO2, CaO, MgO, K2O), were performed using the SPECTRO XEPOS ED-XRF elemental analyzer, optimized for heavy elements with a maximum power of 50W and a voltage of 50 kV. The X-ray EDS fluorescence spectrometer features a Pd/Co alloy anode X-ray tube with air cooling, an adaptive excitation system, and optimized filters. It includes an HAPG (Highly Annealed Pyrolytic Graphite) polarizer for enhanced sensitivity for elements in the Na-Cl range and a bandpass filter for improved performance in the K-Mn range. Signal detection is carried out with an SDD detector cooled by a Peltier system, with a 30 mm2 detector fiarea and a 20 mm2 active area. It offers a spectral resolution (FWHM) of 130 eV for Mn Kα and can handle an input count rate of up to 1,000,000 counts per second. Calibration nuilcurves were constructed using international standards and the Lukas-Tooth and Price linear model. Results were compared with those obtained via the TurboQuant method and SPECTRO’s calibration model, combining the Fundamental Parameter approach with the Extended Compton scattering model and mass attenuation coefficient calibration. The best calibration curve for each element was selected based on alignment with the given concentrations of international standards.
The estimation of the Loss on Ignition (LOI) was performed at 1000 °C with the final aim of assessing the organic carbon content [
47].
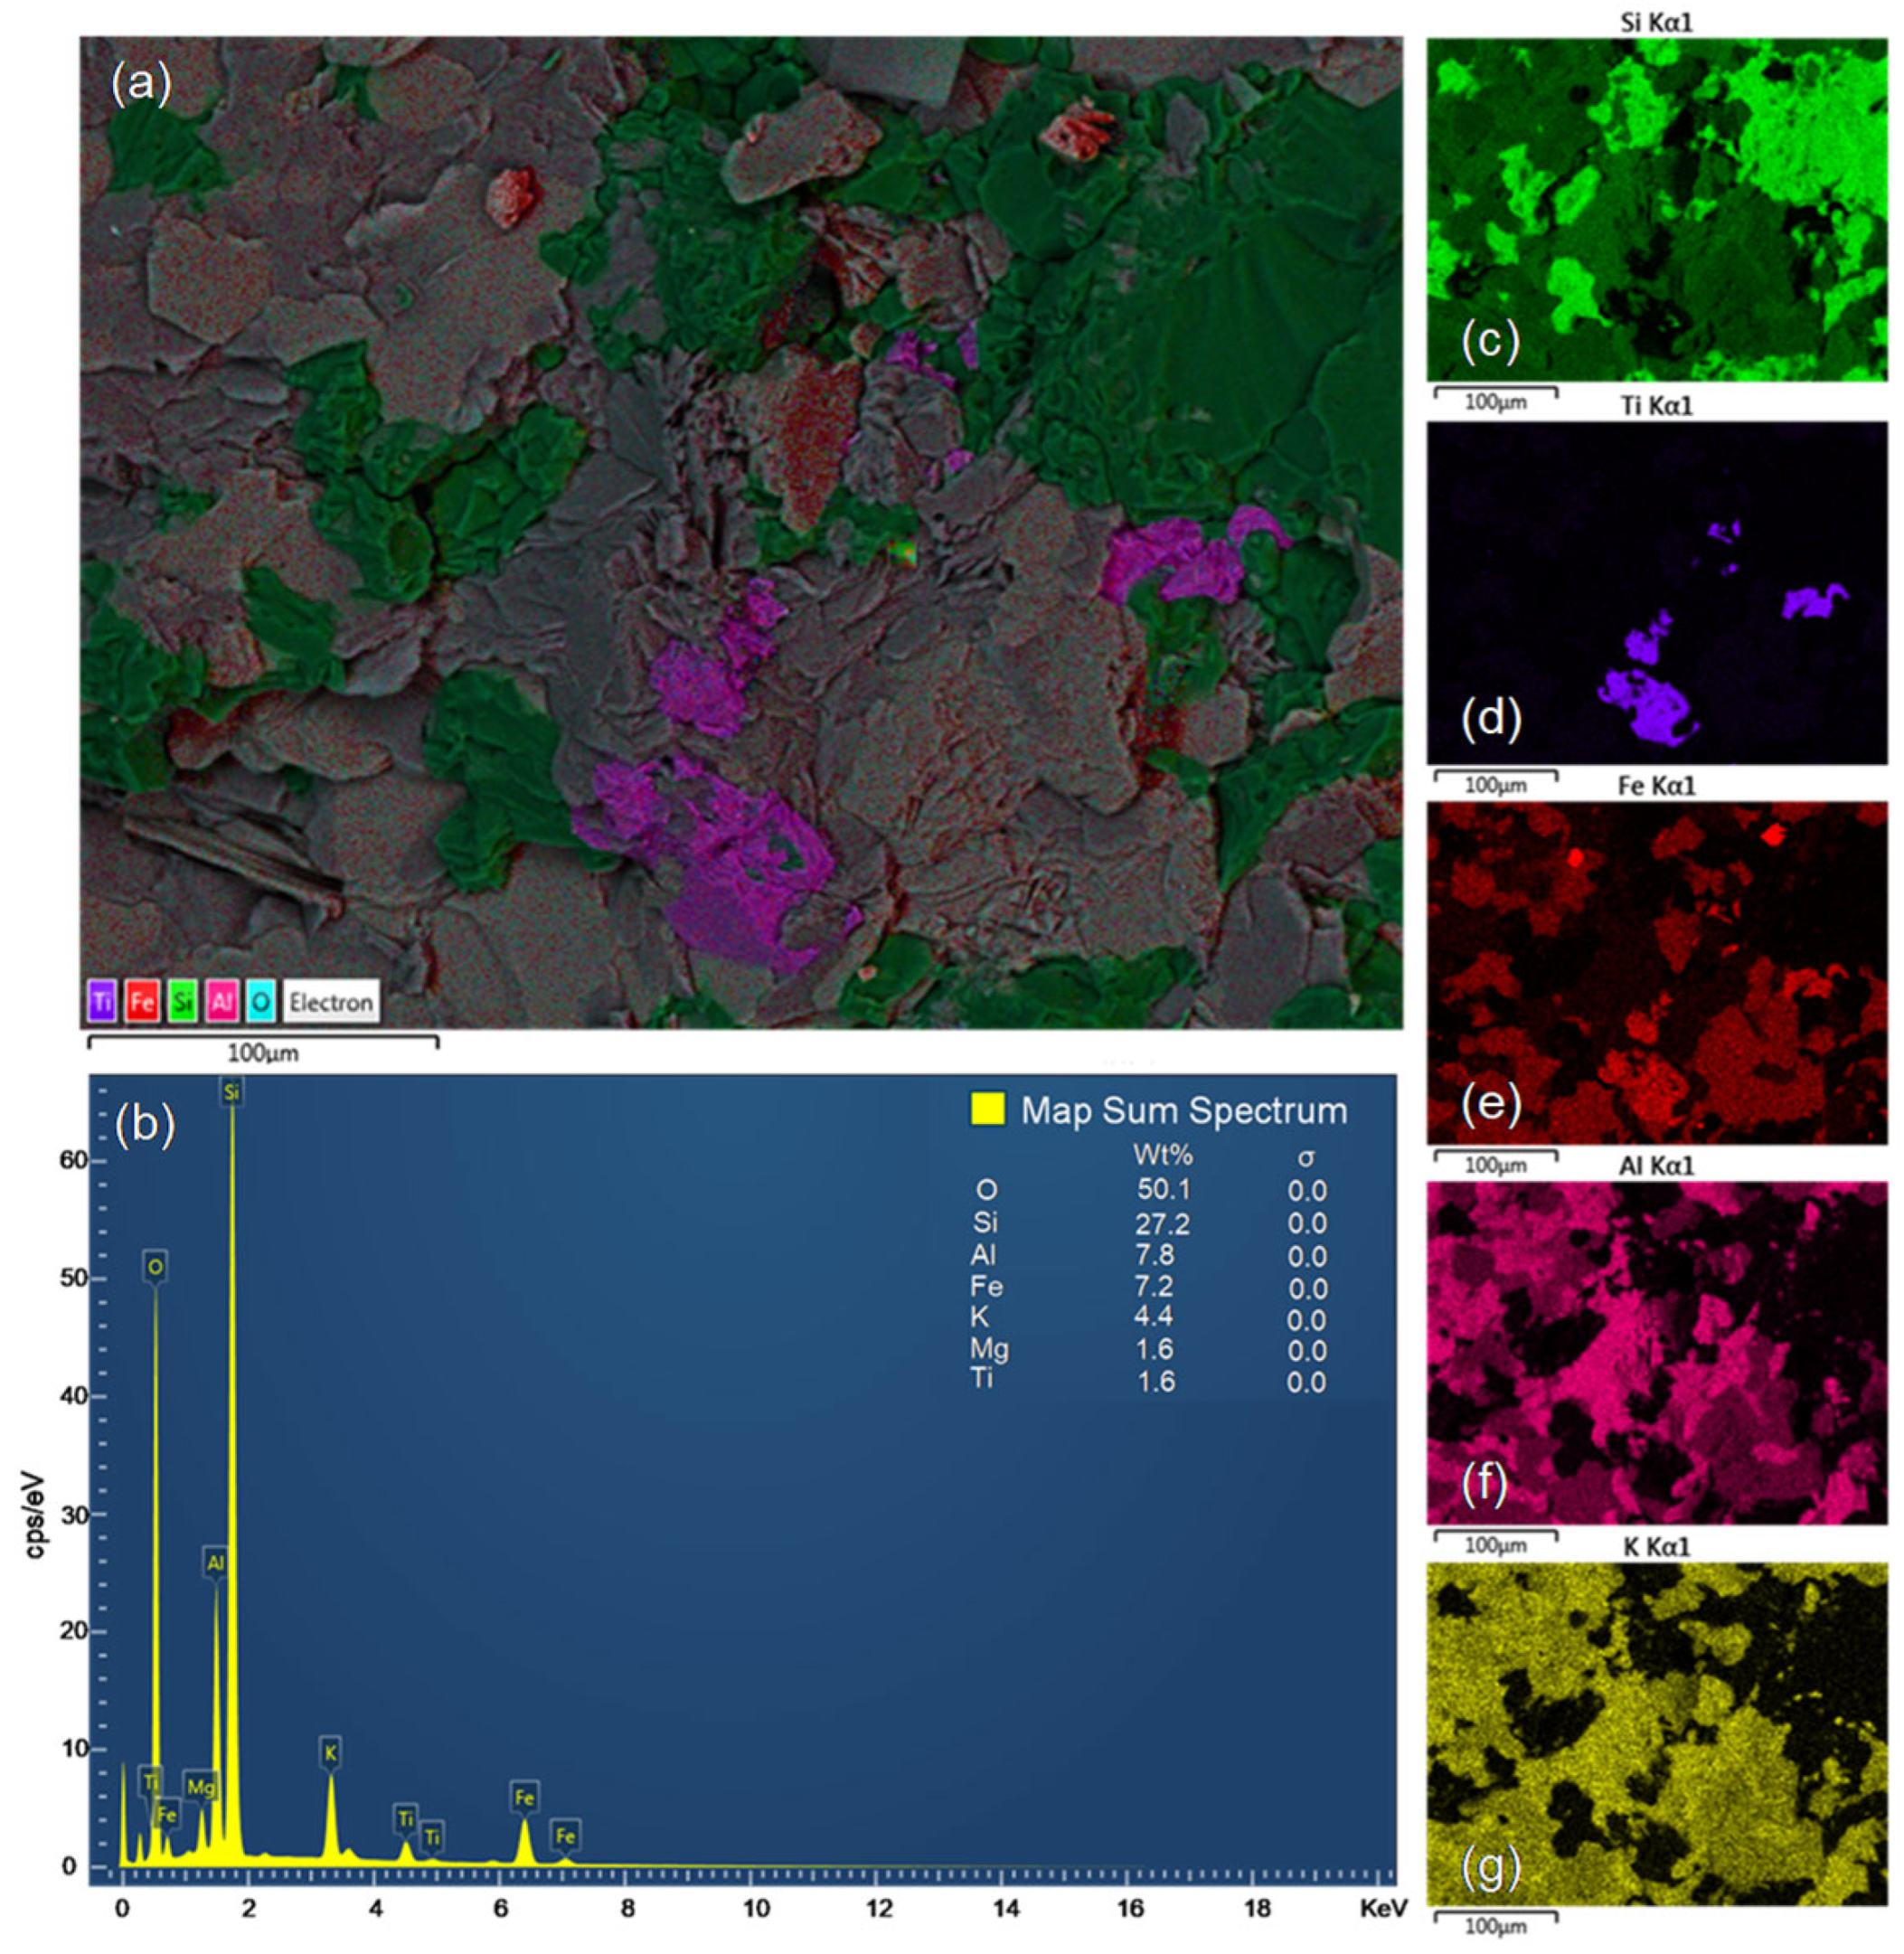
2.5. Petrographic Features and Mineral Composition
The microscopic distribution of elements and, consequently, the identification of mineralogic patterns were obtained by SEM back-scattered-electron (BSE) images, energy dispersive X-ray (EDS) spectra, and X-ray maps. Data were acquired on selected portions of samples coated with a conductive layer (about 200 Å thick) of graphite using a ZEISS EVO MA10 SEM. This SEM was equipped with an Oxford X-Max detector for EDS analysis, operating at a 20 kV acceleration voltage and using a LaB6 crystal source, which enabled high-quality imaging and semi-quantitative elemental analysis [
48].
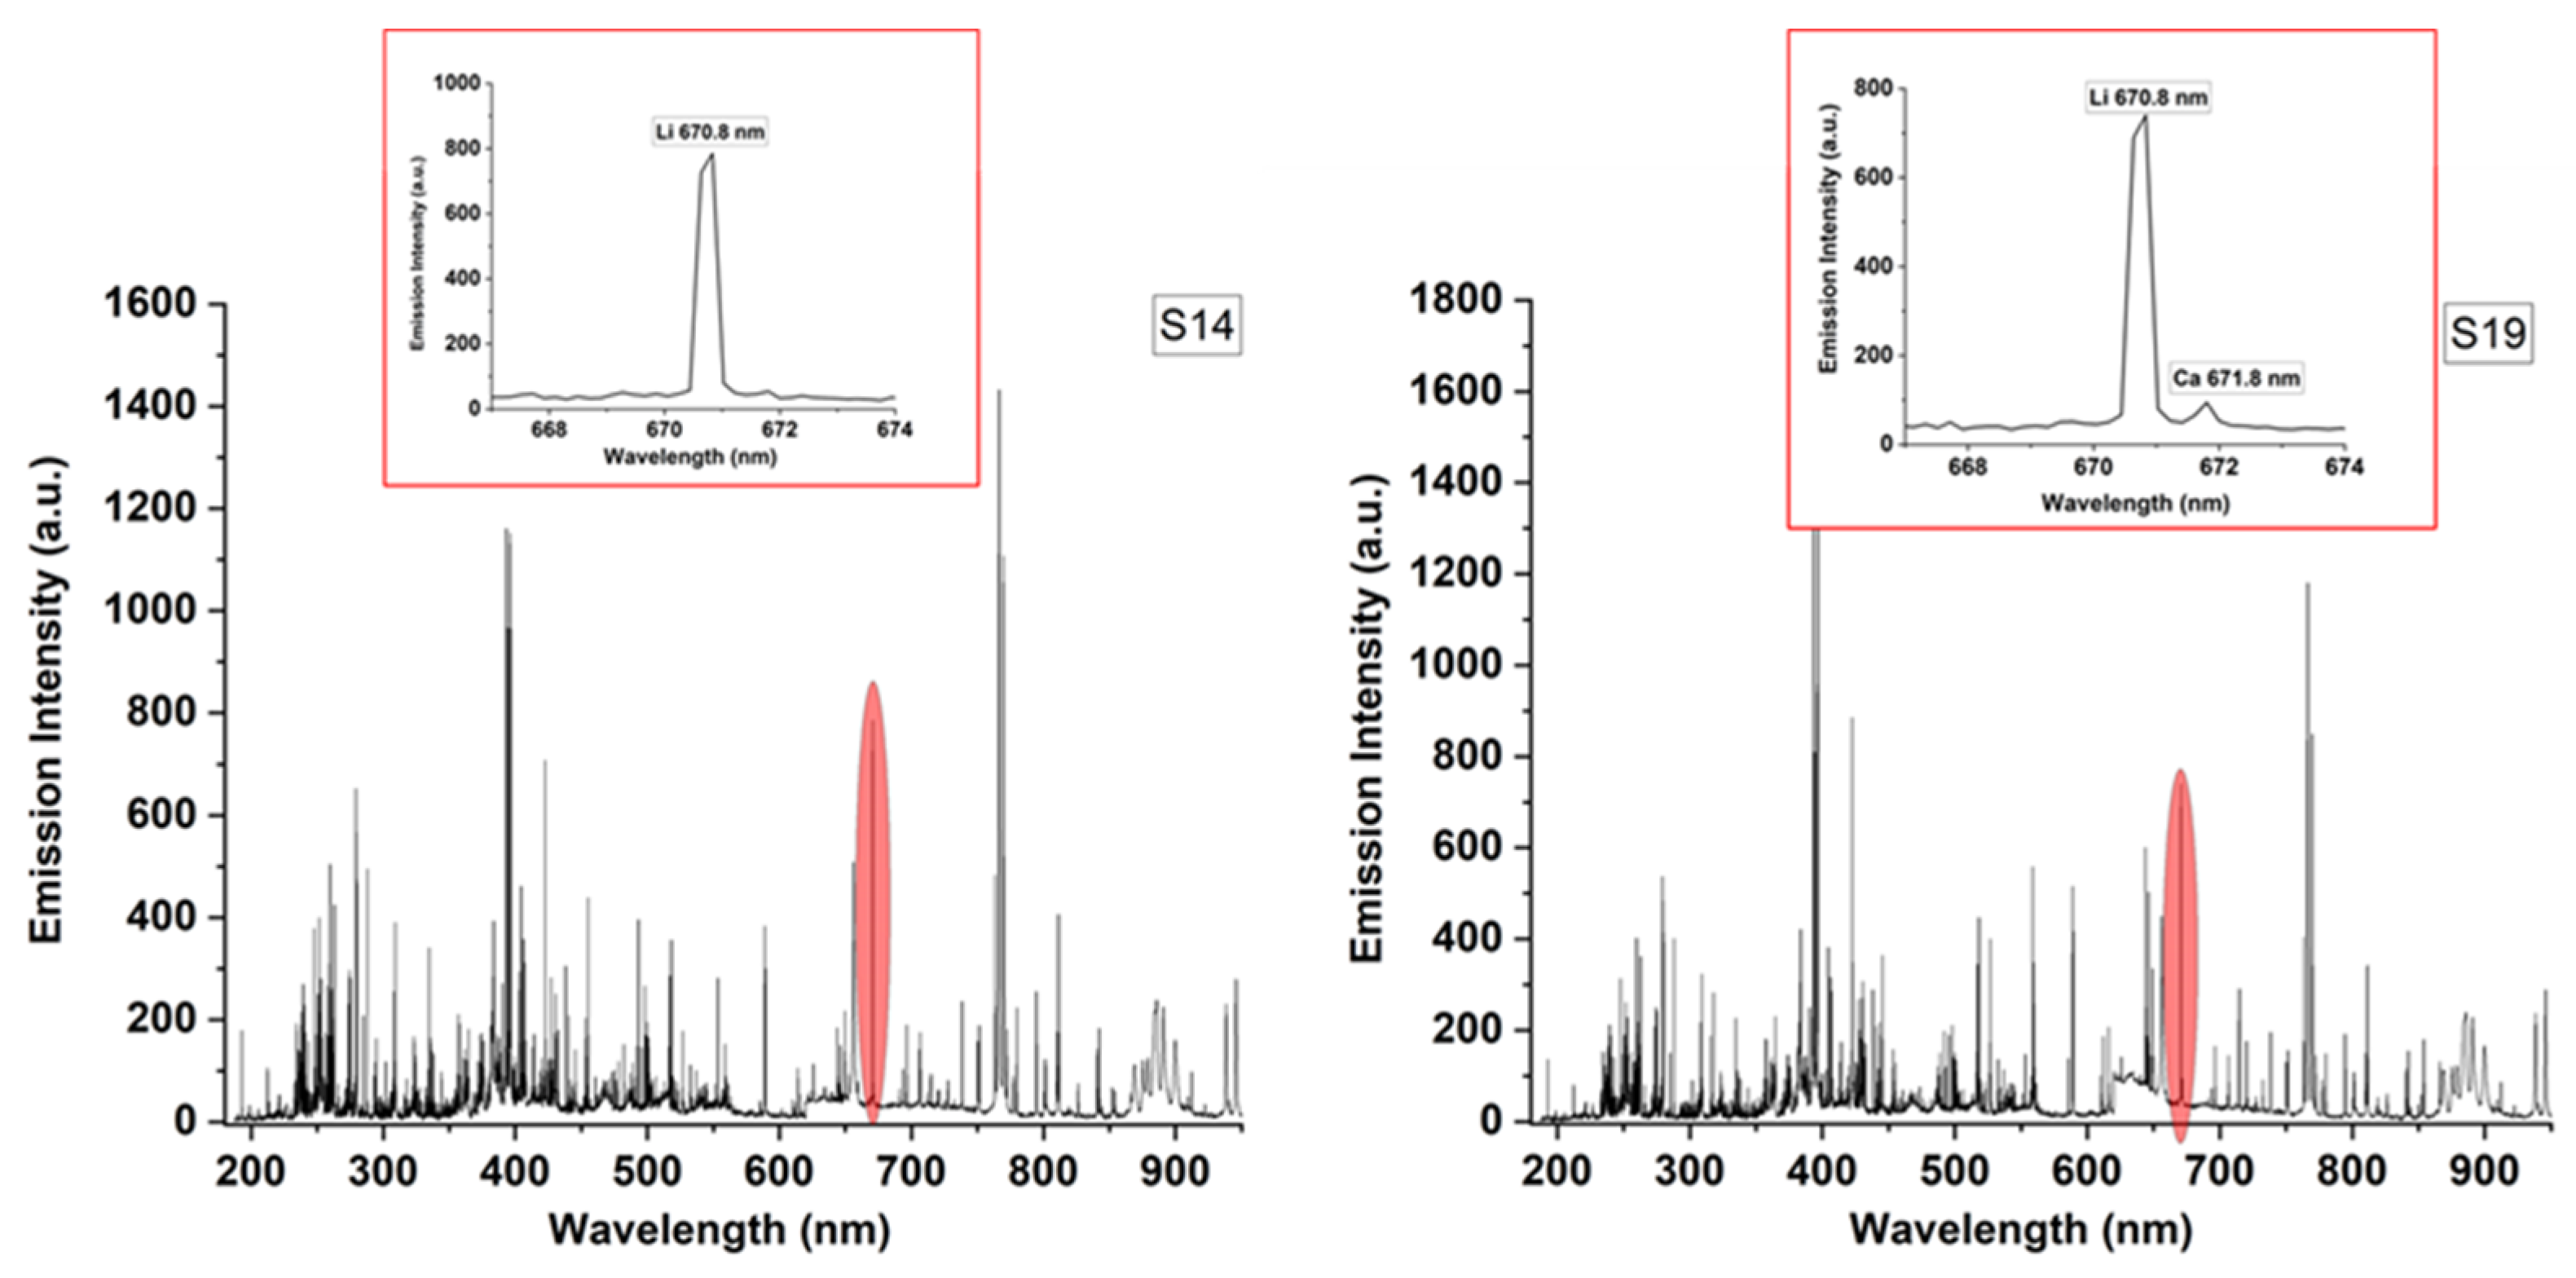
2.6. Laser-Induced Breakdown Spectroscopy
Laser-Induced Breakdown Spectroscopy (LIBS) is a type of atomic emission spectroscopy, which is a chemical analysis method that measures the light emitted by plasma. The lightest elements, such as H, He, Li, Be, B, C, N, O, Na, and Mg, which can be present in geomaterials at high concentrations but are challenging to measure using other analytical techniques (e.g., XRF), are exceptionally sensitive to LIBS [
49]. About 20 years ago, handheld (hLIBS) instruments were introduced, creating the opportunity to perform on-site geochemical analysis in the field.
The SciAps Z-903 (Woburn, MA, USA) hLIBS instrument used in this study was described in detail by previous research [
50]. Briefly, the instrument includes a proprietary Nd-YAG diode-pumped solid-state pulsed nanosecond laser operating at a wavelength of 1064 nm that delivers a 5–6 mJ laser pulse of 1 ns duration with a nominal 100 μm beam size at a 10 Hz firing rate. The plasma light was collected and transferred by fiber optic cables to three spectrometers equipped with time-gated, charge-coupled detectors (CCDs), which record the spectra in a wavelength acquisition range from 190 to 950 nm, covering the ultraviolet (UV) to visible and near-infrared (VNIR) range.
All hLIBS analyses were performed in ambient air under a constant Ar purge, with a delay time fixed at 650 ns at the beginning of the acquisition of the LIBS emission and an acquisition time window fixed at 3 ms. The qualitative composition analysis of the samples was performed by firing one prior laser cleaning shot and then four measuring laser shots on twelve points located in three randomly selected rectangular areas where the LIBS grid pattern was positioned on the sample surface. In this way, a total of 144 LIBS spectra were measured, and 36 average LIBS spectra were recorded for each sample.
4. Discussion
The interpretation of produced results supported the answer to two major questions: which mining residues are potentially reusable? What is the spatial distribution of those deposits?
4.1. Characterization of Residues
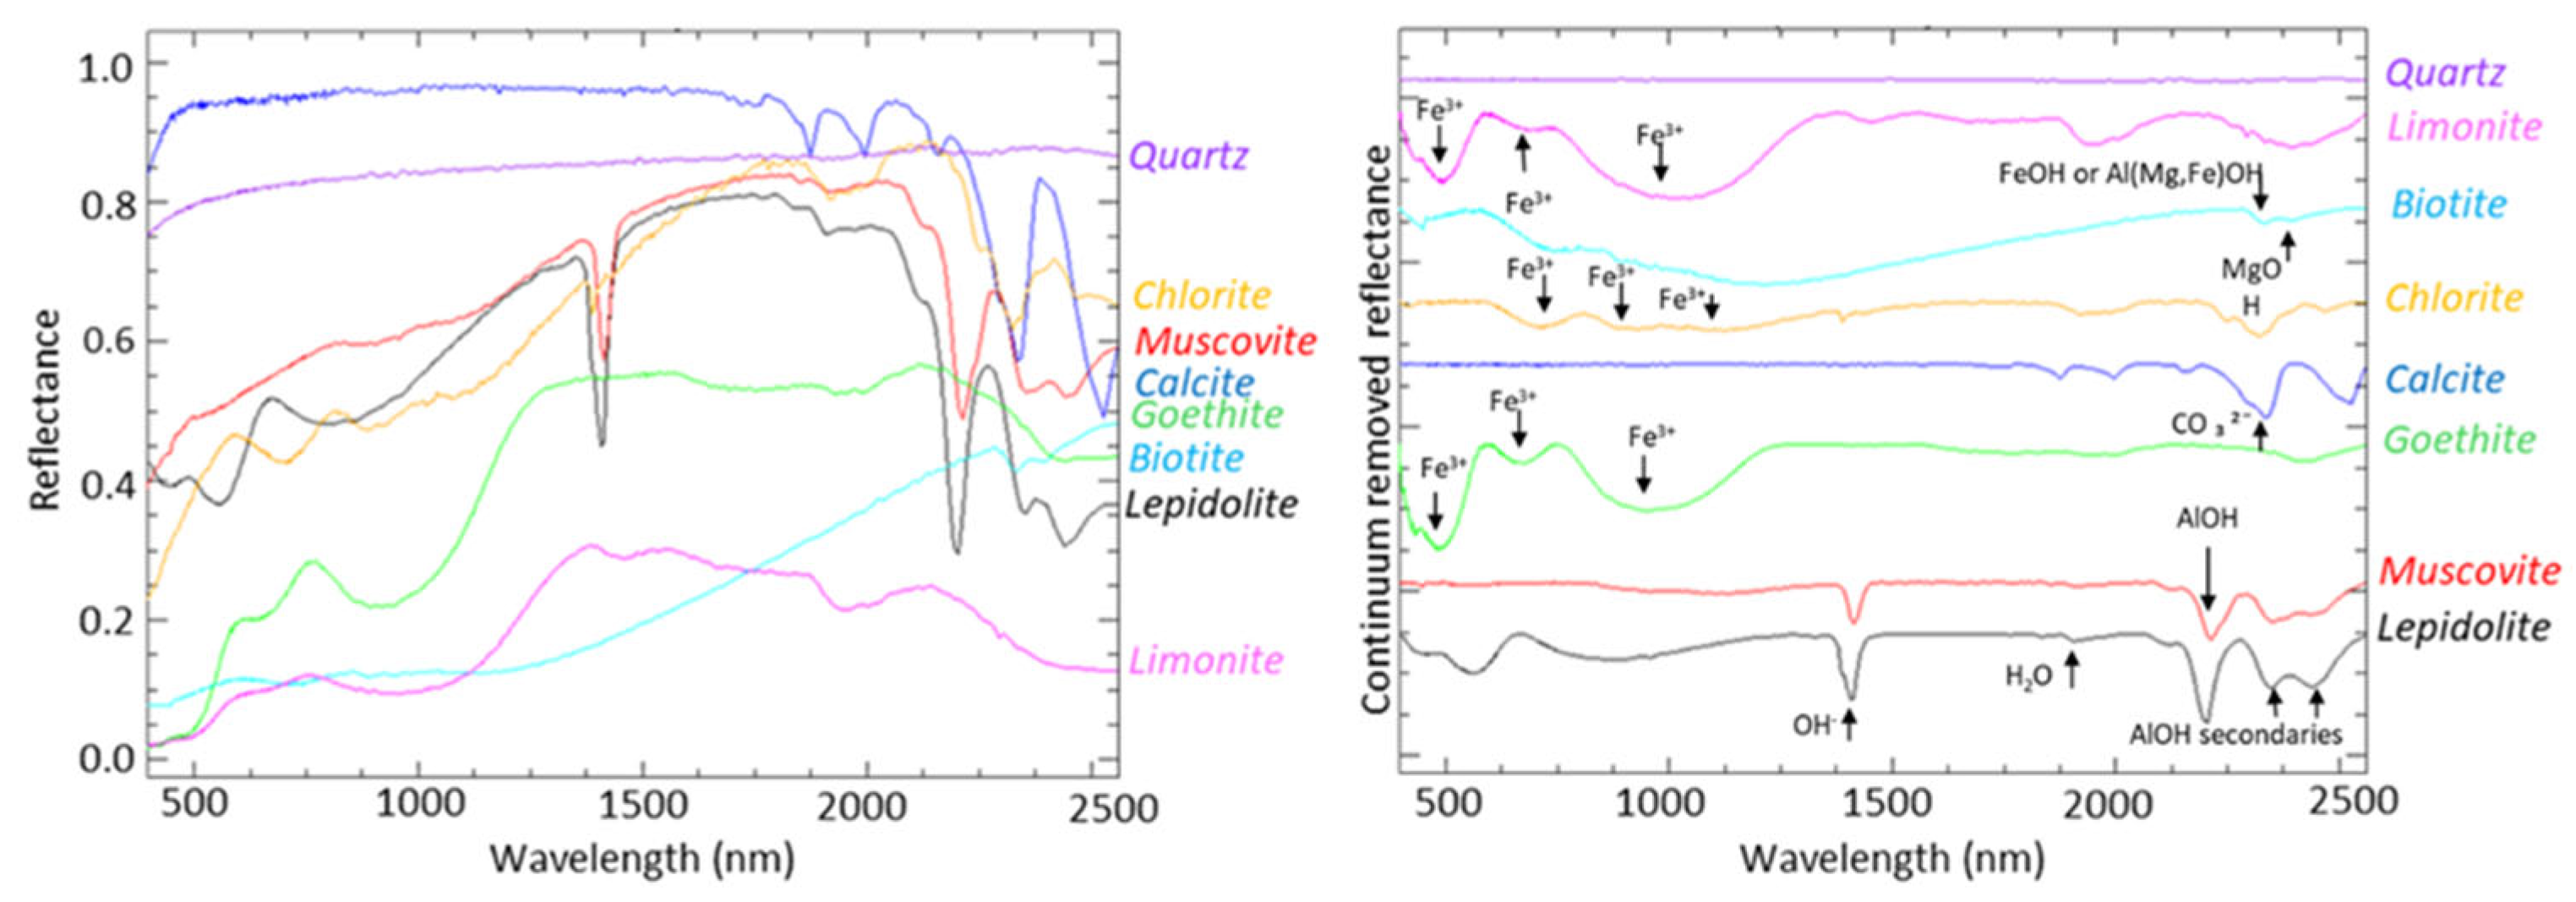
The first question was approached considering the spectral behavior of minerals (
Figure 9) provided by the USGS spectral library under laboratory conditions. Such spectral signatures supported the interpretation of data obtained on sampled materials characterized in the laboratory using the Fieldspec instrument.
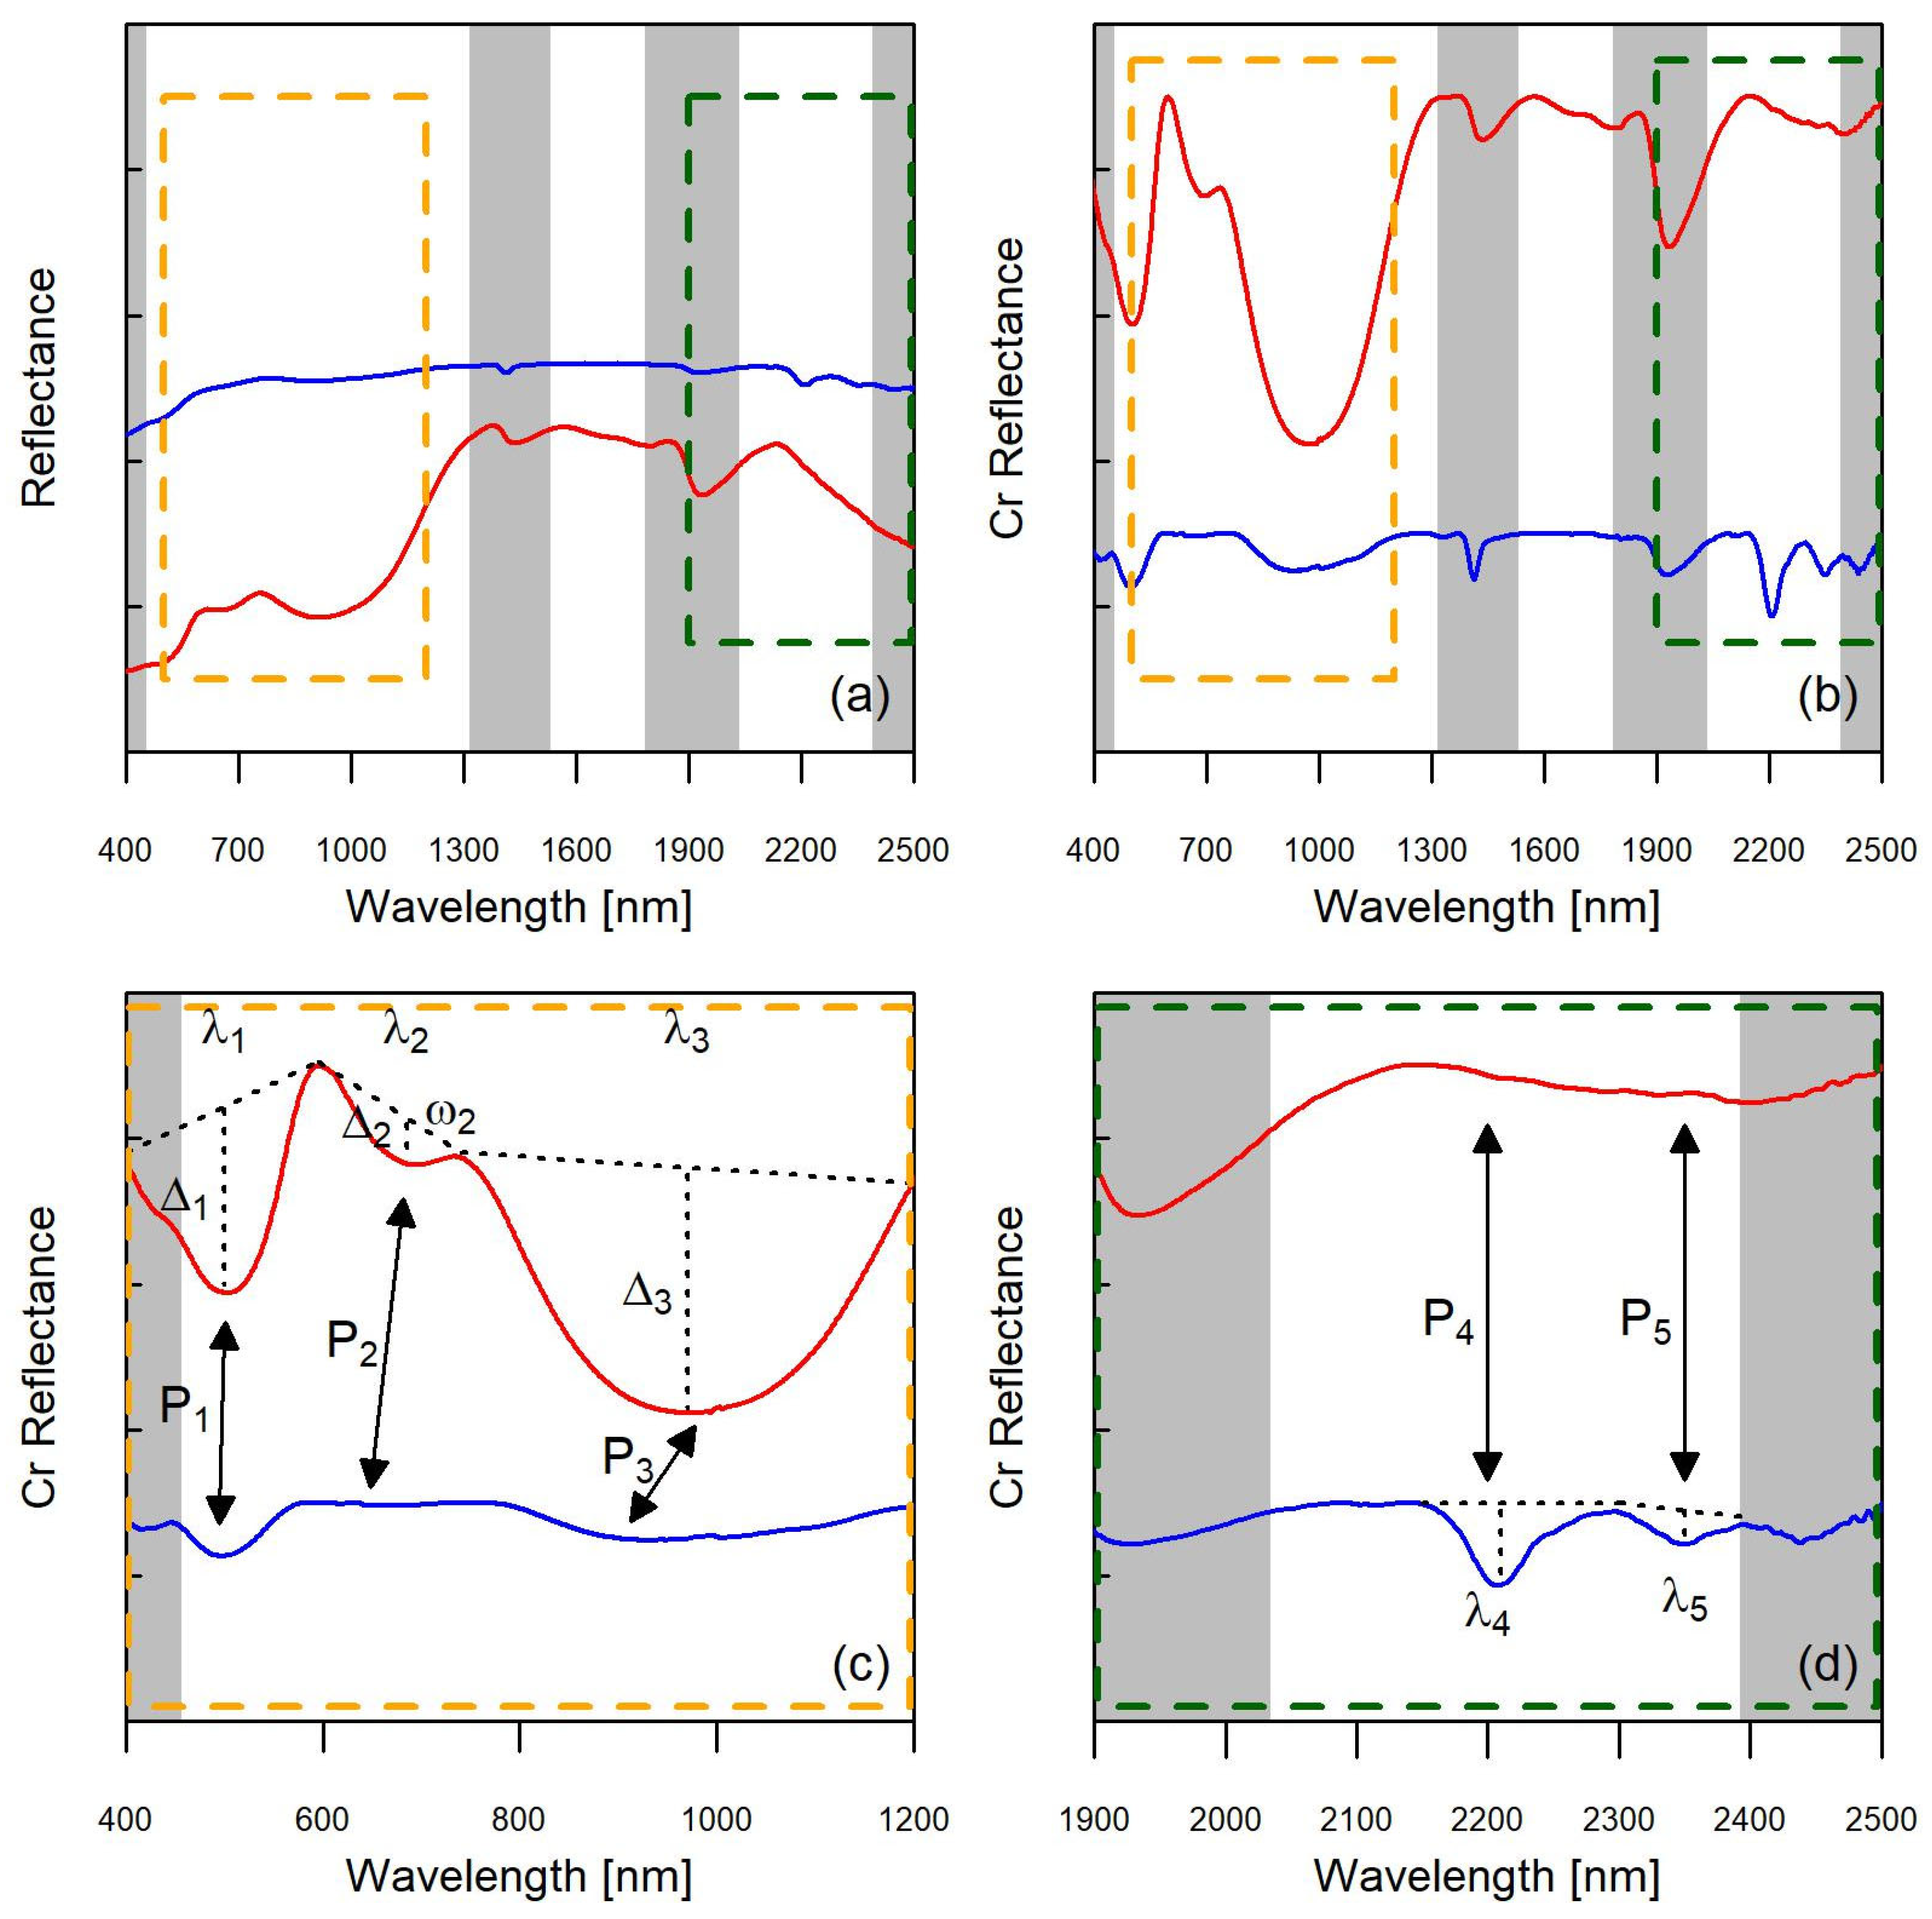
While spectral features in the VNIR domain, with reference to Fe3+-related peaks, supported the identification of goethite-like minerals, Al-OH absorption peaks highlighted the occurrence of white mica. All these features evidence the potential occurrence of lepidolite, which is confirmed only by the detection of Li in the mineral structure. From the hyperspectral point of view, field, and remote sensing observations, even if associated with high values of quartz (from ~51% to ~93%) in the samples, presented spectral behaviors where diagnostic minerals were clearly evidenced by their main absorption features.
Starting from the average spectrum of class A1, obtained under laboratory conditions and presented in
Table 1, continuum-removal highlighted the distinctive VNIR features at ~485 nm, ~670 nm, and ~950 nm associated with ferric iron (Fe
3+). While the NIR domain was characterized by a wide spectral width of a 950 nm Fe
3+-related peak, typical of iron hydroxide phases, the SWIR region was affected by a limited contribution of Al-OH peaks. Such a peculiar pattern suggested the contribution of two minerals, such as goethite and muscovite [
3,
53,
54], with different proportions. XRPD confirmed a quartz-dominated framework where LIBS neglected the occurrence of Li minerals.
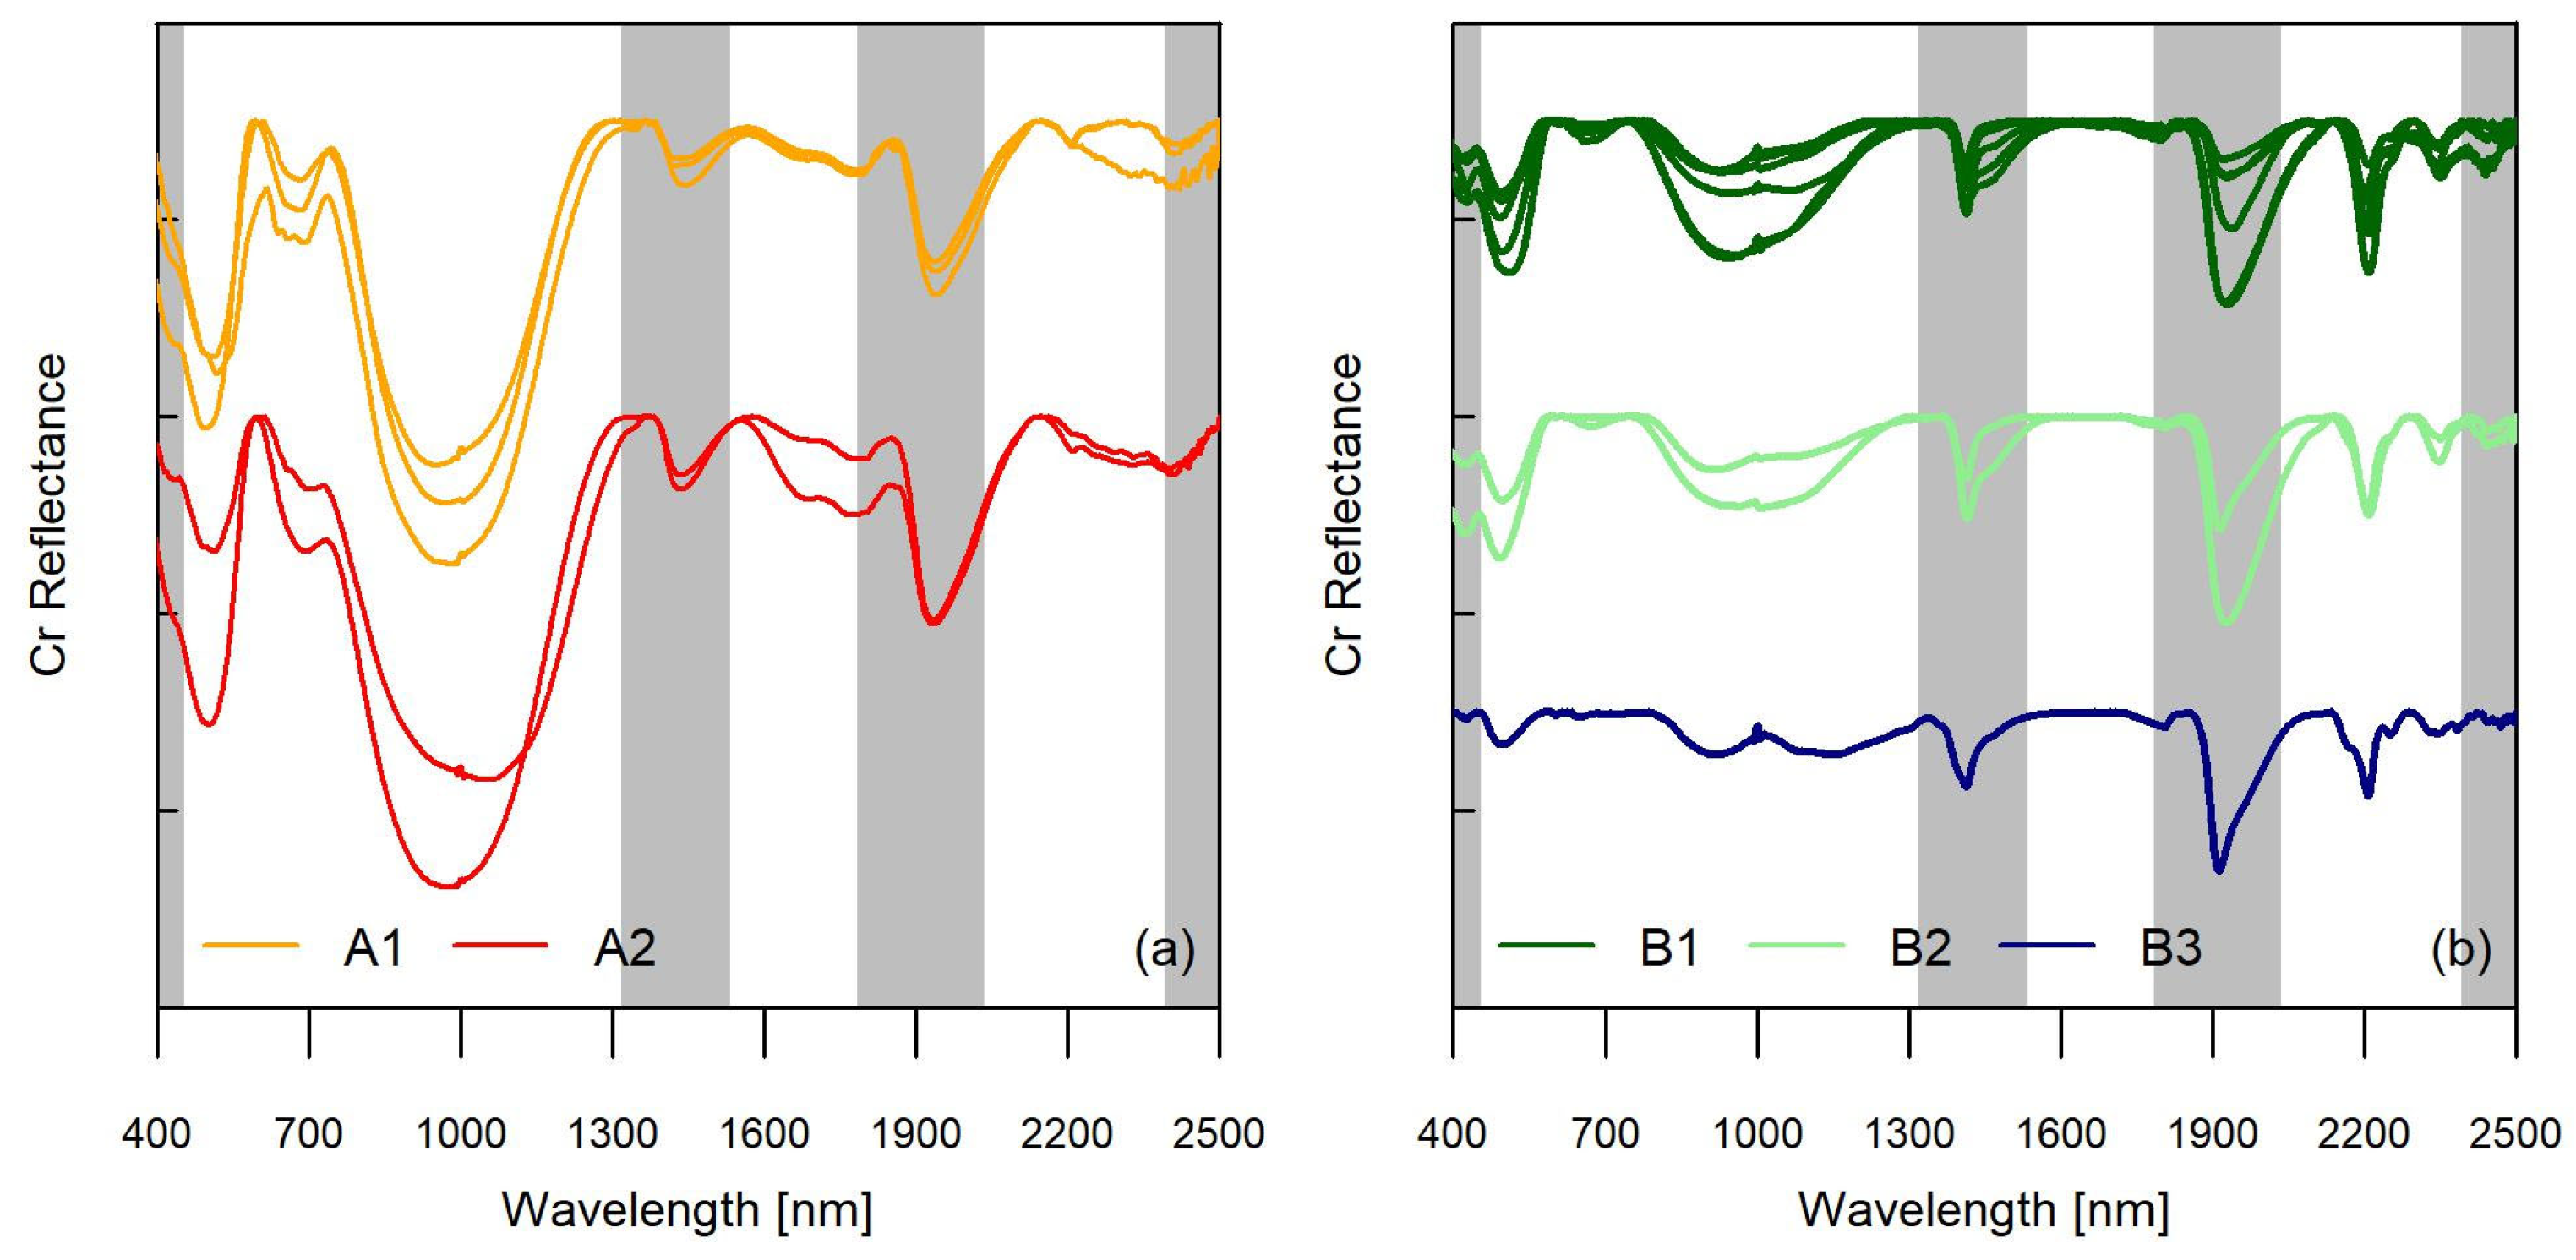
Reflectance and continuum-removed spectra of the A2 class evidenced weak absorption in the SWIR region but marked spectral features associated with the presence of limonite (
Table 1). Limonite was originally considered as a species but now is described as an iron oxyhydroxide with a poor crystalline character, and it consists of cryptocrystalline goethite [
16,
17]. The absorption peaks of limonite are evidenced by its specific VNIR features (~490 nm, ~690 nm, and ~980 nm due to ferric iron absorptions).
From a general point of view, traditional analyses were more efficient in detecting the occurrence of tiny amounts of calcite (<10 wt%), compared to results obtained by hyperspectral measurements. This behavior was associated with differences in sample pretreatment, where calcite was present in the finest size component of samples, contributing less to the spectral behavior of samples.
The spectra of class B1 showed (
Table 1) in the SWIR region the typical white mica features in the continuum-removed curves. In particular, the main absorptions have been identified in the spectrum: peak around ~1409 nm due to OH
− (hydroxide ion) associated with the main sharp Al-OH peak (between 2195 nm and 2205 nm) and the shallow Al-OH secondary features at ~2348 nm and ~2435 nm [
3,
16,
17,
53,
54]. The VNIR region was characterized by multiple absorption peaks at ~430, ~485, ~670 nm, and ~950 nm, together with the drop off to extreme blue in the reflectance curves, which are related to ferric iron and manganese [
3] overtones. Such features were interpreted with the occurrence of goethite and a negligible presence of white mica. Spectral measurements highlighted a significant probability of having Li-bearing minerals, and results obtained by LIBS analysis confirmed the Li-rich behavior of such deposits. However, the discrimination between lepidolite from Li-bearing white mica is out of the scope of this work, and further in-depth chemical and mineralogical analyses will be carried out to support the identification of additional opportunities for characterizing these mineral phases in selected samples.
Regarding the average spectra of class B2 (
Table 1), the VNIR absorptions related to ferric iron (Fe
3+) at ~430, ~485, ~670 nm, and ~950 nm evidence the presence of goethite. In the SWIR region, even the diagnostic features of white mica characterized the continuum-removed curve of class B2 with a peak around ~1409 nm due to OH
− (hydroxide ion) associated with the main sharp Al-OH peak between 2195 nm and 2205 nm and the shallow Al-OH secondaries features at ~2348 nm and ~2435 nm [
3,
53]. The occurrence of Li was also confirmed in this case by LIBS.
Finally, the sample of type B3 showed a slightly different spectral behavior, where a shallower and broader peak in the NIR region can be associated with biotite (
Table 1) [
3,
16,
17,
53,
54]. Secondary and less inflected peaks can be potentially observed, but further investigations must be conducted to detect additional phases identified with traditional mineralogical techniques (chlorite).
The occurrence of the main mineralogical phases marked by absorption spectral features is reported in
Table 5, and it summarizes the mineralogical composition of five groups.
The mining residues of class B1 and B2 are characterized by the presence of the white mica with Li, and they are the most interesting deposits considering that lithium is involved in the Critical Raw Materials Act, 2023 [
7].
4.2. Spatial Distribution of Residues with Li-Bearing White Mica
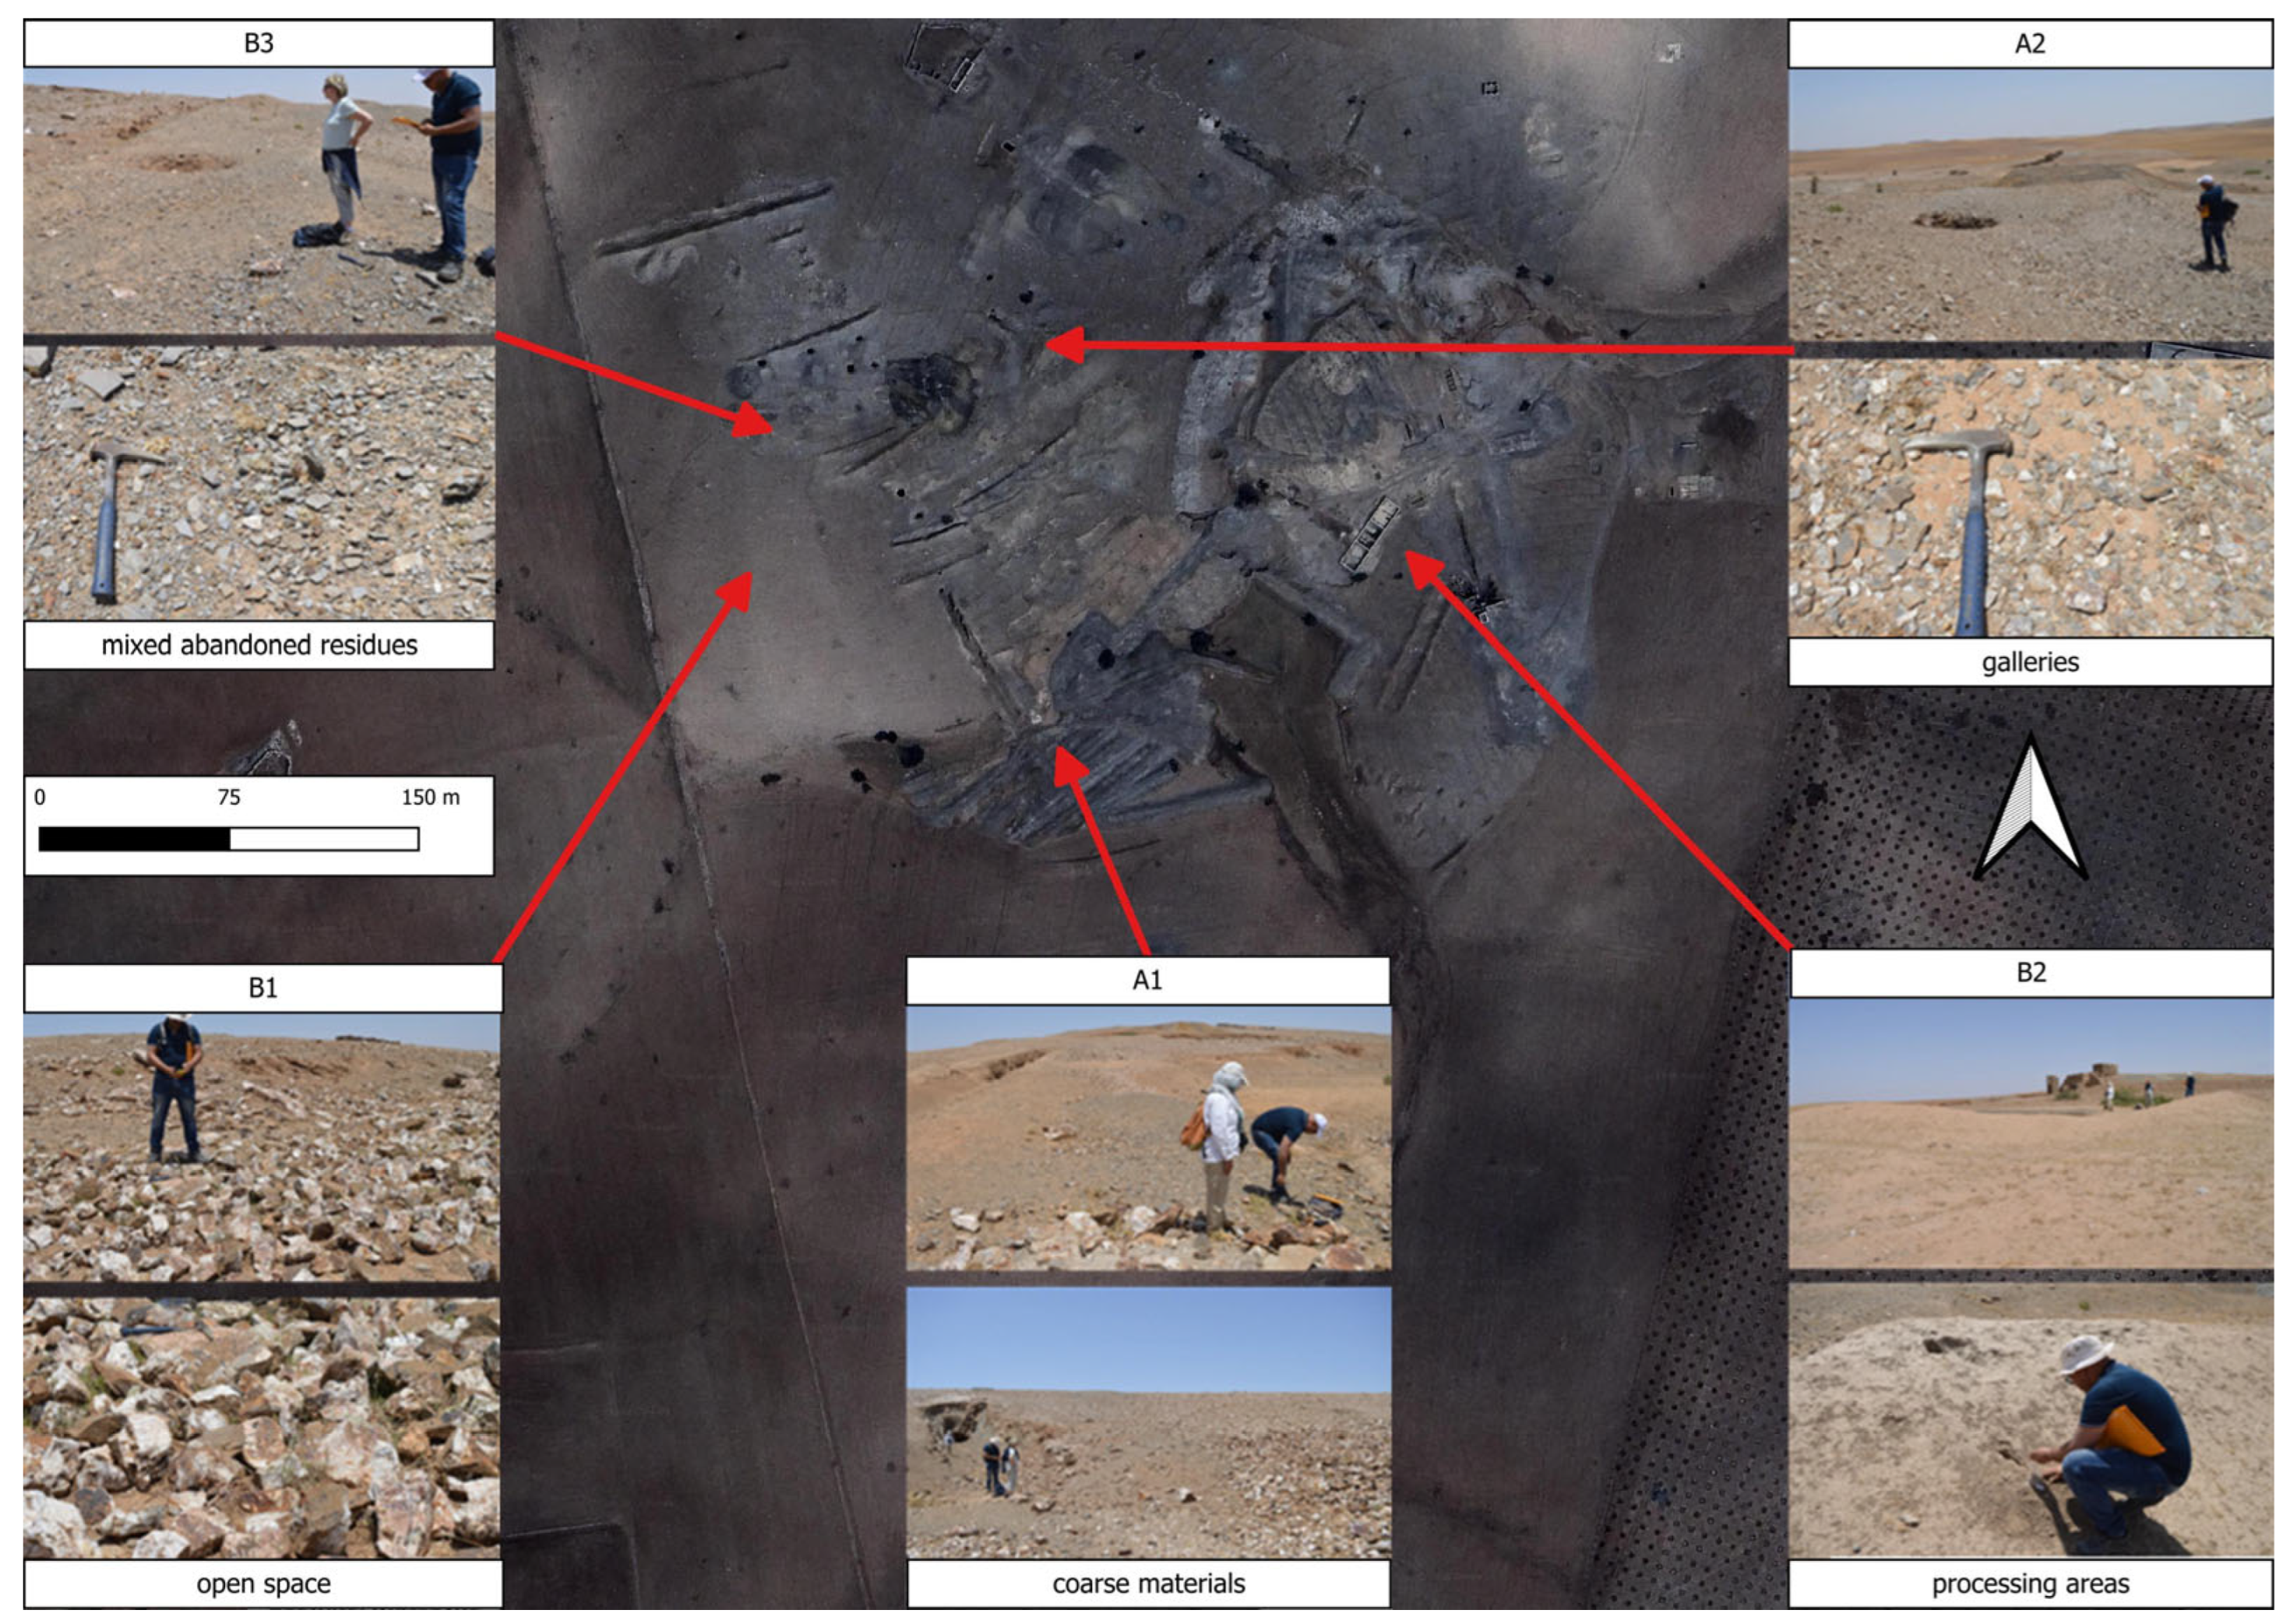
Matching geochemistry, mineralogy, and hyperspectral measurements, it was possible to identify a zone associated with A1 samples where mining residues were coarse materials containing goethite and muscovite. Class A2 included pixels located near galleries, and deposits were strongly dominated by limonite. The class related to B1 samples included stockpiles accumulated in open areas, where goethite and Li-bearing white mica were significantly present. Mining residues identified as class B2 represented the oldest stockpiles associated with mining activities that ceased approximately 40 years ago; they were characterized by the occurrence of goethite, white mica with Li, and chlorite. Finally, class B3, which was identified as a separate category with a unique mineralogical composition, was dominated by biotite and accessory mineral phases. Coupling such a description to the LIBS evidence, it was possible to highlight the potential occurrence of deposits of interest by a significant amount of Li. Furthermore, classes B1 and B2 exhibited the highest content of white mica with Li and cover the largest areas (47% with more than 60% of type B materials and 16% of dominated deposits with more than 30% of those residues). In contrast, classes A1 and A2 occupy smaller areas (less than 26% of the total mining area) but are distinctly separate from each other. These smaller classes represented the oldest mining residual deposits in the mine. The presence of limonite in class A2 suggested that these stockpiles have been exposed for a longer time compared to the more extensive B1 and B2 classes. Notably, 11% of the surface in the mining site showed a significant uncertainty in the identification of a clear dominant component.
The validation of the obtained classification was carried out using data provided by a second field campaign conducted in 2023, where field observations were combined with high spatially resolved imagery. Considering nine samples and six control points of tailings with an interesting content of CRMs, it was possible to identify stockpiles exclusively constituted by Al-bearing materials correctly. Such areas represented locations where mining activities processed exploited materials by grinding and crushing. Stockpiles were characterized by finer size distributions, from 90% of gravel near preprocessing facilities to less than 10% around the separation basins. Although six points were correctly associated with materials dominated by type B residues, five quartz-dominated samples were collected close to exploited areas, within 5 m of the observed features (galleries or trenches). Pixels in this case were classified as Type B-dominated deposits with mixed materials, with Al-bearing materials occurring between 30% and 60%. Those areas were characterized by larger fractions of surfaces with gravel deposits (where type B materials were detected), with patches of debris adjacent to excavations. This behavior represented a limitation for the use of 30m resolution hyperspectral data, but additional in situ or airborne hyperspectral surveys will surely fill such a gap. While the identification of a dominant composition was possible, a significant fraction of the mining site, about 11% of the area, was affected by uncertain mixing issues that satellite data were not able to solve. Two control points and one type A deposit were observed in the uncertain mixed area where stockpiles were topographically elevated, and spectral observations made from spaceborne platforms were strongly affected by surface roughness. Finally, less interesting deposits and undisturbed soils were detected in the peripheral zones of the mining site, with 10 control points where materials were poor in terms of potential CRMs.
Considering the image classification, the geological survey carried out during the second field campaign allowed the creation of a sketch map of the mining residues accumulation zones for the identification of white mica with Li contents (
Figure 10). Zones with accumulated B1 and B2 deposits are therefore the areas with mining residues whose content can be considered of interest such as raw materials.
5. Summary and Conclusions
The Sidi Bou Azzouz abandoned mine still holds significant potential as a resource for raw materials. This area, like other mining areas of the southern Rehamna massif of the western Meseta region of Morocco, hosts hydrothermal deposits in lithological outcrops devoid of vegetation and is therefore well exposed, making it a privileged site for the application of an integrated approach of petrographic and geochemical investigations with advanced hyperspectral exploration techniques using satellite imagery and therefore ideal for testing the ability of PRISMA spectral data to identify mining areas in a strategic region for the supply of CRM. Therefore, this research presents an interdisciplinary approach aimed at exploring the capability of PRISMA hyperspectral satellite imagery to identify, classify, and map mining residues with different chemical composition and mineralogical content.
Hyperspectral data highlighted the occurrence of stockpiles where exploitable CRMs are present; for instance, Li-bearing white mica is a potential source of interest. These spectral data agreed with chemical and mineralogical results, which confirmed that the PRISMA satellite data were appropriate to assess the spatial distribution of different minerals present in the mining residues of the study area. This result underscored the potential of hyperspectral remote sensing as a tool for mineral exploration and environmental monitoring, especially in areas where ground-based sampling may be difficult or impractical. The proposed approach considered two different layers of spectral observations, which included two completely different spatial scales (satellite-based and laboratory). Additional intermediate observations, provided by different satellite or airborne sensors, will fill the gap between coarse and in situ measurements.
This interdisciplinary approach offers a promising method for resource exploration and environmental assessment, with applications that can extend to both the mining industry and environmental monitoring. Spatial resolution was surely a limiting factor, but additional in situ hyperspectral surveys (ground-based or airborne) will surely complete the proposed preliminary picture.


 ,
, 


