Article

Geometry and Kinematics of the North Karlik Tagh Fault: Implications for the Transpressional Tectonics of Easternmost Tian Shan

1
State Key Laboratory of Earthquake Dynamics and Forecasting, Institute of Geology, China Earthquake Administration, Beijing 100029, China
2
China Railway Design Corporation, Tianjin 300251, China
3
Department of Earth Science and Technology, Institute of Disaster Prevention, Langfang 065201, China
*
Author to whom correspondence should be addressed.
Remote Sens. 2025, 17(14), 2498; https://doi.org/10.3390/rs17142498
Submission received: 23 May 2025 / Revised: 26 June 2025 / Accepted: 1 July 2025 / Published: 18 July 2025
(This article belongs to the Section Environmental Remote Sensing)

Abstract

Quantifying the slip rate along geometrically complex strike-slip faults is essential for understanding kinematics and strain partitioning in orogenic systems. The Karlik Tagh forms the easternmost terminus of Tian Shan and represents a critical restraining bend along the sinistral strike-slip Gobi-Tian Shan Fault System. The North Karlik Tagh Fault (NKTF) is an important fault demarcating the north boundary of the Karlik Tagh. While structurally significant, it is poorly understood in terms of its late Quaternary tectonic activity. In this study, we analyze the offset geomorphology based on interpretations of satellite imagery, field survey, and digital elevation models derived from structure-from-motion (SfM), and we provide the first quantitative constraints on the late-Quaternary slip rate using the abandonment age of deformed fan surfaces and river terraces constrained by the 10Be cosmogenic dating method. Our results reveal that the NKTF can be divided into the Yanchi and Xiamaya segments based on along-strike variations. The NW-striking Yanchi segment exhibits thrust faulting with a 0.07–0.09 mm/yr vertical slip, while the NE-NEE-striking Xiamaya segment displays left-lateral slip at 1.1–1.4 mm/yr since 180 ka. In easternmost Tian Shan, the interaction between thrust and sinistral strike-slip faults forms a transpressional regime. These left-lateral faults, together with those in the Gobi Altai, collectively facilitate eastward crustal escape in response to ongoing Indian indentation.

1. Introduction

Large strike-slip faults on the interiors of continents are prominent tectonic features of the Earth’s crust, such as the Xianshuihe Fault, Altyn Tagh Fault, East Anatolian Fault, and San Andreas Fault. These geomorphologically remarkable structures play a significant role in accommodating plate motion [1,2,3], modulating strain distribution [4,5], and controlling geomorphological evolution [6,7]. Moreover, such faults directly influence continental deformation patterns and seismic hazard potential through their capacity to generate destructive earthquakes [8,9].
Strike-slip faults generally display complex geometries along the fault strike, characterized by structural discontinuities such as stepovers, bifurcations, and bends [10,11,12]. Among these features, restraining bends are referred to the sites of crustal shortening and topographic uplift within transpressive regimes [13,14], which typically manifest as three of the primary configurations of fault terminations, contractional stepovers, and continuous fault bends [15,16]. Typically, at a restraining bend, strike-slip faults will split into multiple branches that may show divergent vergence directions but coalesce at depth to generate a positive flower structure [17,18,19], resulting in complex strain partitioning [4,20]. Determining the slip rate of an individual fault strand within a restraining bend is critical to understanding strain partitioning and fault interactions and conducting accurate regional seismic hazard assessments.
In Central Asia, restraining bends constitute fundamental structural elements along major strike-slip fault systems, particularly in the Altai, Gobi Altai, and easternmost Tian Shan regions [7]. These transpressional structures have generated prominent tectonic landforms, most notably the Karlik Tagh, Barkol Tagh, Nemegt Uul, and Gurvan Sayhan mountain ranges (Figure 1a,b) [7,21]. Such a type of restraining bend in this area has been studied, mainly focused on fault geometry, fault kinematics, and geomorphic characteristics [7,21,22,23,24]. While previous studies have examined fault geometry and kinematics in these regions [23,24], research on quantitative constraints on slip rates across individual fault strands within restraining bends remain notably lacking, particularly in easternmost Tian Shan.
The North Karlik Tagh Fault (NKTF) forms a major structural boundary in easternmost Tian Shan, delineating the northern margin of the Karlik Tagh. This fault displays a gently curved trace that changes azimuth from NW to NE, ultimately connecting with the left-lateral Gobi-Tian Shan Fault System (GTSFS) near the Mongolian border [23,28]. Although previous work has established its kinematic behavior through satellite image analysis [22], critical aspects of slip rates and fault interactions in this transpressional system remain unclear.
In this work, we utilize high-resolution digital topography from structure-from-motion (SfM) to characterize the deformation features of alluvial fan surfaces and terraces, thereby better constraining the offsets they recorded along the fault. By combining the observed displacements with the ages of geomorphic markers obtained using cosmogenic radionuclide samples from the fan surfaces, we constrain the slip rate of the fault over the late Quaternary. Finally, we assess the role of the North Karlik Tagh Fault in slip partitioning in the transpressional framework of the Gobi-Tian Shan Fault System.

2. Background

2.1. Geological Setting Easternmost Tian Shan

Tian Shan is one of the largest intracontinental mountain belts and is seismically active [29]. It is dominated by an approximately overall north–south crustal shortening related to the distant effect of the Indian-Eurasia collision [23,30,31,32]. Geodetic data show that the N-S shorting rate in western Tian Shan is ~20 mm/yr [27,33,34,35], and decreases rapidly to 2~5 mm/yr in eastern Tian Shan [36], which indicates that crustal shortening may not be the dominant deformation. Cunningham et al. [22] suggest that the strike-slip component gradually increased toward the east from thrust-related deformation in western Tian Shan into an overall left-lateral transpressional regime in easternmost Tian Shan and a nearly pure strike-slip deformation at the Mongolian border.
Easternmost Tian Shan, which comprises Barkol Tagh, Karlik Tagh, and several lower parallel mountains to the north, lies between the Junggar Basin to the north and the Turfan-Hami Basin to the south (Figure 1b). Barkol Tagh and Karlik Tagh span approximately 400 km in length and 50 km in width, appearing as an elongated, transverse “S” shape in plain view (Figure 1b). The highest relief in easternmost Tian Shan reaches 4928 m at Karlik Tagh. In contrast, to the east, the range eventually dies out into a relatively flat area and terminates in western China near the Gobi Desert (Figure 2).
Easternmost Tian Shan has experienced complex tectonic evolution since the Paleozoic. Low-temperature thermochronology studies reveal two major phases of rapid exhumation phases in the Mesozoic [37,38]. During the Cenozoic, easternmost Tian Shan was reactivated due to the ongoing India-Eurasia collision [39,40]. On the southern slope of Karlik Tagh and in a limited area of Barkol Tagh, remnant planation surfaces dating from the Late Cretaceous to the early Cenozoic are preserved, which are also well developed at mountain tops in many parts of western Mongolia and adjacent regions in China [22,41]. The presence of a staged peneplain indicates that easternmost Tian Shan had very subdued topography and little regional relief before the Late Cenozoic uplift [22] and was reactivated as a whole multiple times throughout the Cenozoic [37,42]. From Figure 2, it can be observed that easternmost Tian Shan is considered part of the Paleozoic Harlik Arc tectonically [43] and is mainly composed of Devonian-Carboniferous arc-related volcanic rocks. The intrusive rocks form large areas of Karlik Tagh and Barkol Tagh. Late Tertiary and Quaternary glacial, alluvial, and lacustrine sediments are prevalent in the piedmont and intermontane basins.

2.2. Active Tectonics

Easternmost Tian Shan is bounded by active faults, primarily NW-trending thrust faults and NE-trending sinistral strike-slip faults. Destructive historical earthquakes and prominent satellite imagery features indicate intense Quaternary activity. North of Barkol Tagh, the Jianquanzi-Barkon Fault (J-BF) comprises a NE-striking western segment displaying sinistral strike-slip motion at 2.4 mm/yr and a NW-striking thrust-dominated eastern segment [44]. Eastern of Barkol Basin, the shortening rate of the NW-trending fault-related fold is ~0.15 mm/yr [45]. North of Karlik Tagh, the NKTF is characterized by thrust movement with a vertical slip rate of 0.08 mm/yr in the NW-trending west segment and a sinistral strike-slip at the NE-trending east segment [42]. This curved fault trace ultimately merges with the GTSFS, forming a key structural transition in eastern Tian Shan (Figure 1b). The GTSFS is a prominent left-lateral strike-slip fault system in Central Asia that links easternmost Tian Shan in China to the west with several massifs of southern Gobi Altai to the east. The GTSFS comprises a complex fault system extending over 1200 km, with fault traces extremely visible on satellite images along many of its segments (Figure 1b) [28]. Geodetic studies show that the sinistral displacement slip rate of the GTSFS is 1.2 mm/yr [46]. North of Yiwu City, the Yiwu Fault is dominated by reverse motion, with a vertical slip rate of 1 mm/yr [47]. In the Adak Vally, several NW-trending active faults deform Quaternary alluvial deposits, which can be interpretated from satellite images (Figure 2). The Hami Basin North Fault (HMNF) is the bounding fault of easternmost Tian Shan and the Hami basin and is characterized by thrust with a vertical slip rate of 0.1–0.24 mm/yr. The asymmetric drainage patterns and slope gradients of Karlik Tagh and Barkol Tagh suggest more vigorous tectonic activity along the northern flank than along the southern side [22].

3. Methods

3.1. Geomorphological Mapping and Offset Measurements

To characterize tectonic geomorphology and identify displaced morphology along the fault trace, we first mapped the fault strands on the Late Quaternary geomorphology, based on interpretations of high-resolution satellite images and detailed field investigation. For key sites selected for precise displacement measurements, we employed high-resolution digital elevation models (DEMs) generated using structure-from-motion (SfM) photogrammetry [48]. A small uncrewed aerial vehicle (DJI RTK) was used to collect aerial pictures. Aerial images with an average forward overlap of 80% and a side overlap of 70% were collected from a 100–120 m height. Using the structure-from-motion method, Agisoft Photoscan Pro 1.5.0 software was used to generate point clouds, DEMs, and orthoimages sequentially with a centimeter ground resolution (<10 cm). The resulting high-resolution DEMs enabled detailed geomorphic analysis, including the generation of hillshade models, contour maps, and swath topographic profiles for accurate fault displacement measurements.
Vertical offsets of active faults, particularly thrust fault scarps on the alluvial fan surfaces, are quantified using high-resolution DEM-derived topographic profiles. We extracted topographic profiles across the scarp and visually fit straight lines to the footwall and hanging wall surfaces using the least squares method. Vertical offsets were determined using vertical separation as the elevation difference between the projected regressed surfaces at the fault scarp [30,49]. The uncertainty of the fault offset for each topographic profile was estimated from the range of permissible dips of these lines (Figure S1).
Horizontal displacements are obtained by realigning displaced piercing lines, such as channels, river terrace risers, and alluvial fan surfaces, based on interpretations of high-resolution DEMs and Ortho mosaic images. We choose sites where the original stream channels and river terraces are well preserved to extract topographic profiles parallel to the fault trace, and we measured the lateral cumulative offsets by matching piercing lines corresponding to the same marker on both sides of the fault using the MATLAB program Ladi-Caoz_v2.1 [50]. The lateral offsets of stream channels and risers were also reconstructed.

3.2. Cosmogenic Nuclide (10Be) Dating of Quaternary Surfaces

In the piedmont of eastern Tian Shan, numerous alluvial fans composed of quartz-rich boulders or clasts have developed, making it particularly suitable for the cosmogenic nuclide dating (10Be) method to determine the exposure ages of alluvial fan surfaces or fluvial terraces [51,52,53,54].
Different sampling strategies were employed for the selected sites due to the varied particle sizes of the deposited material. To date the river terrace surfaces, we preferred a depth profile strategy. This strategy can effectively avoid concentration inheritances accumulated before exhumation and during transport, which greatly impact age calculation [53]. For this method, five samples of quartz-rich clasts were collected from a 2 m deep pit excavated into a flat terrace. The samples were taken from a 10 cm wide swath at different depth intervals, with each sample containing approximately 2 kg of quartz and granite clasts.
To date the alluvial fan surfaces, which are scattered with 50 cm long boulders embedded in the matrix, we sampled exposed quartz-rich boulders rather than clasts, following established methodologies [51,55]. Zehfuss et al. [56] think that the probability of having a negligible inherited component of boulders is higher than that for cobbles. The reason for the negligible inheritance in boulders is that they are generated predominantly by bedrock in the steep catchment of the river. The inherited concentration of boulders before deposition is very low.
Preparation and chemical separation of 10Be were carried out at the National Institute of Natural Hazards, Ministry of Emergency Management, following the procedures detailed in [57,58]. Accelerator mass spectrometry (AMS) measurements of the final targets were conducted at the French Center National de la Recherche Scientifique (CNRS).
The 10Be production rate at sea level and high latitude is ~4.0 atoms/g/a [59]. The density of clasts on the terrace and boulders on the fan surface is 1.8–2.3 g/cm3 [52]. Nevertheless, due to the arid natural environment, the effect of erosion is assumed to be negligible when compared with the age calculation of the fan surface and depth profile. We consider relatively well-preserved, extremely flat surfaces to be an indication of negligible surface modification. The 10Be concentrations were converted to model ages using the CRONUS online calculator version 3 (https://hess.ess.washington.edu/, accessed on 4 January 2021) and the time-dependent scaling model from [60,61]. The exposure age of the depth profile is calculated using the Matlab code developed by [62].

4. Results

4.1. Overview of the North Karlik Tagh Fault

The NKTF sharply defines the northern margin of Karlik Tagh, separating the bedrock from alluvial sediments or bedrock inliers, and appears curved from a NW strike to a NE strike at the mountain front (Figure 2). This fault extends nearly 180 km from the southwest of Yanchi Town in the west to the southeast of Xiamaya Town in the east, and it can be divided into two segments—the Yanchi segment and the Xiamaya segment with a longitude of 94°37′E as the boundary, according to the change in the fault trend (Figure 2). To the south of Yanchi Town, the Yanchi segment of the NKTF strikes NW and extends nearly 70 km, with a NE-thrust nature. It gradually changes to NE, striking at the Xiamaya segment and linking with the GTSFS further east. The Xiamaya segment of this fault extends nearly 110 km and is characterized by sinistral strike-slip movement [44].

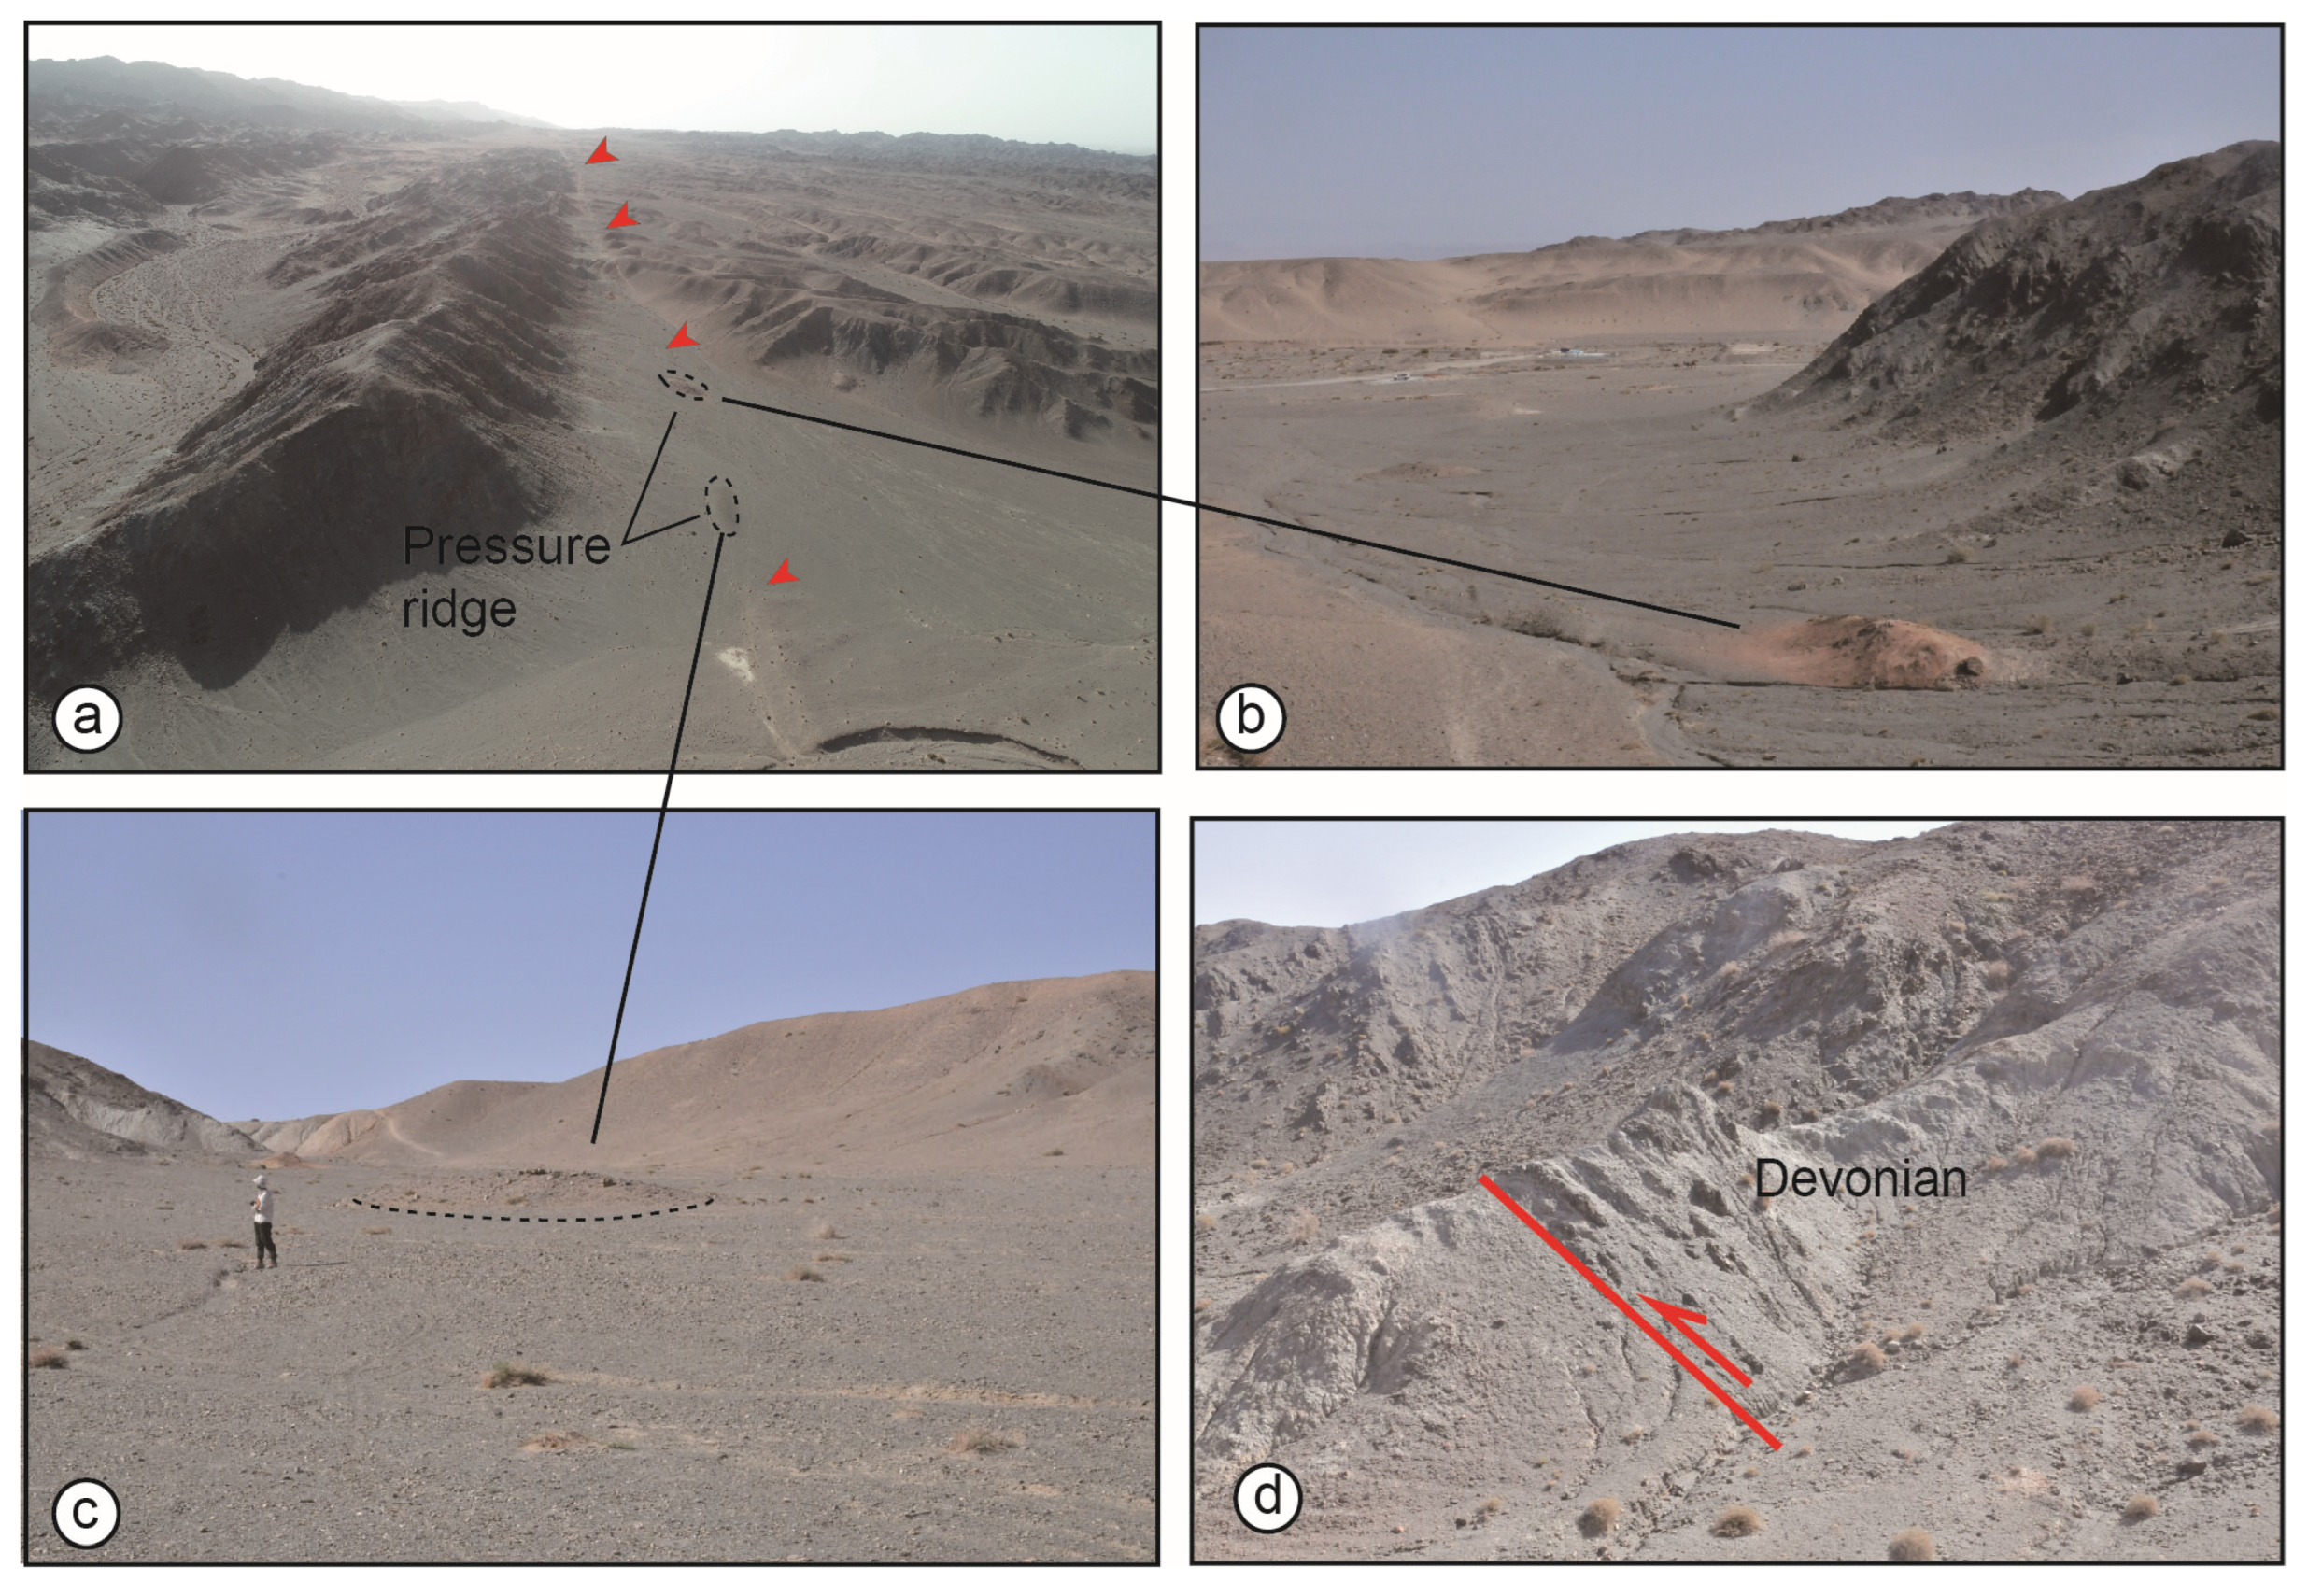
4.2. Deformation Geomorphic Characteristics

4.2.1. Yanchi Segment

The Yanchi segment of NKTF deformed the alluvial fan surfaces at the mountain piedmont and formed several continuous linear fault scarps, which can be identified from the satellite images (Figure 3a–d). We selected two sites (Site 1 and 2) to conduct field surveys and performed a detailed topographic analysis based on low-altitude aerial photography.
Site 1 is situated approximately 7.5 km southwest of Yanchi Town (Figure 3a), where the fault traverses Quaternary alluvial fan deposits, creating prominent geomorphic expressions of activity. The fault trace is manifested by a well-defined NW-striking scarp extending nearly 1800 m (Figure 4a–c). Topographic measurements across the fan surface reveal a vertical displacement of 2.5 ± 0.2 m (Profile Pa, Figure 4d), indicating significant cumulative slip. The alluvial fan surfaces exhibit intense fluvial dissection, with well-preserved channel terraces. These terraces are displaced by the fault, forming a scarp with a vertical offset of 1.3 ± 0.5 m (Profile Pb, Figure 4d). The fault’s kinematic character is further constrained by an outcrop exposure along the eastern bank of an incised channel, which clearly demonstrates NE-directed thrust motion along a 35° dipping fault plane (Figure 4c).
Site 2 is situated approximately 4 km south of Yanchi Town (Figure 3a). At this site, we identified two levels of alluvial surfaces, A1 and A2 (Figure 5a,b), based on surface texture patterns and relative topographic positions. The fault on its own displaces the A2 surface and has created a straight and continuous scarp on the surface (Figure 3b and Figure 5a), while no evident fault trace is observed on the A1 surface. The scarp is 3.5 km long, trending overall NNW and facing NE. In the middle part of the fan surface, the scarp becomes discontinuous due to artificial excavation, and a spring is exposed on the midsection of the steep slope (Figure 5a). We extracted five topographic profiles perpendicular to the fault scarp from the DEM (for profile locations see Figure 5a). The topographic profiles indicate that the maximum height of the fault scarp is 9.6 ± 0.9 m (see profile P1), and the minimum is 7.2 ± 0.3 m (see profile P3) (Figure 5c), resulting in an average vertical displacement of 8.3 ± 0.3 m. Both field observations and topographic profiles reveal multiple fault scarps, indicating that the scarp is the result of cumulative fault activity over multiple events. The A2 surface is deeply incised by multiple gullies, with a maximum incision depth of approximately 7.5 m, and local gully terraces have also developed (Figure 5b).

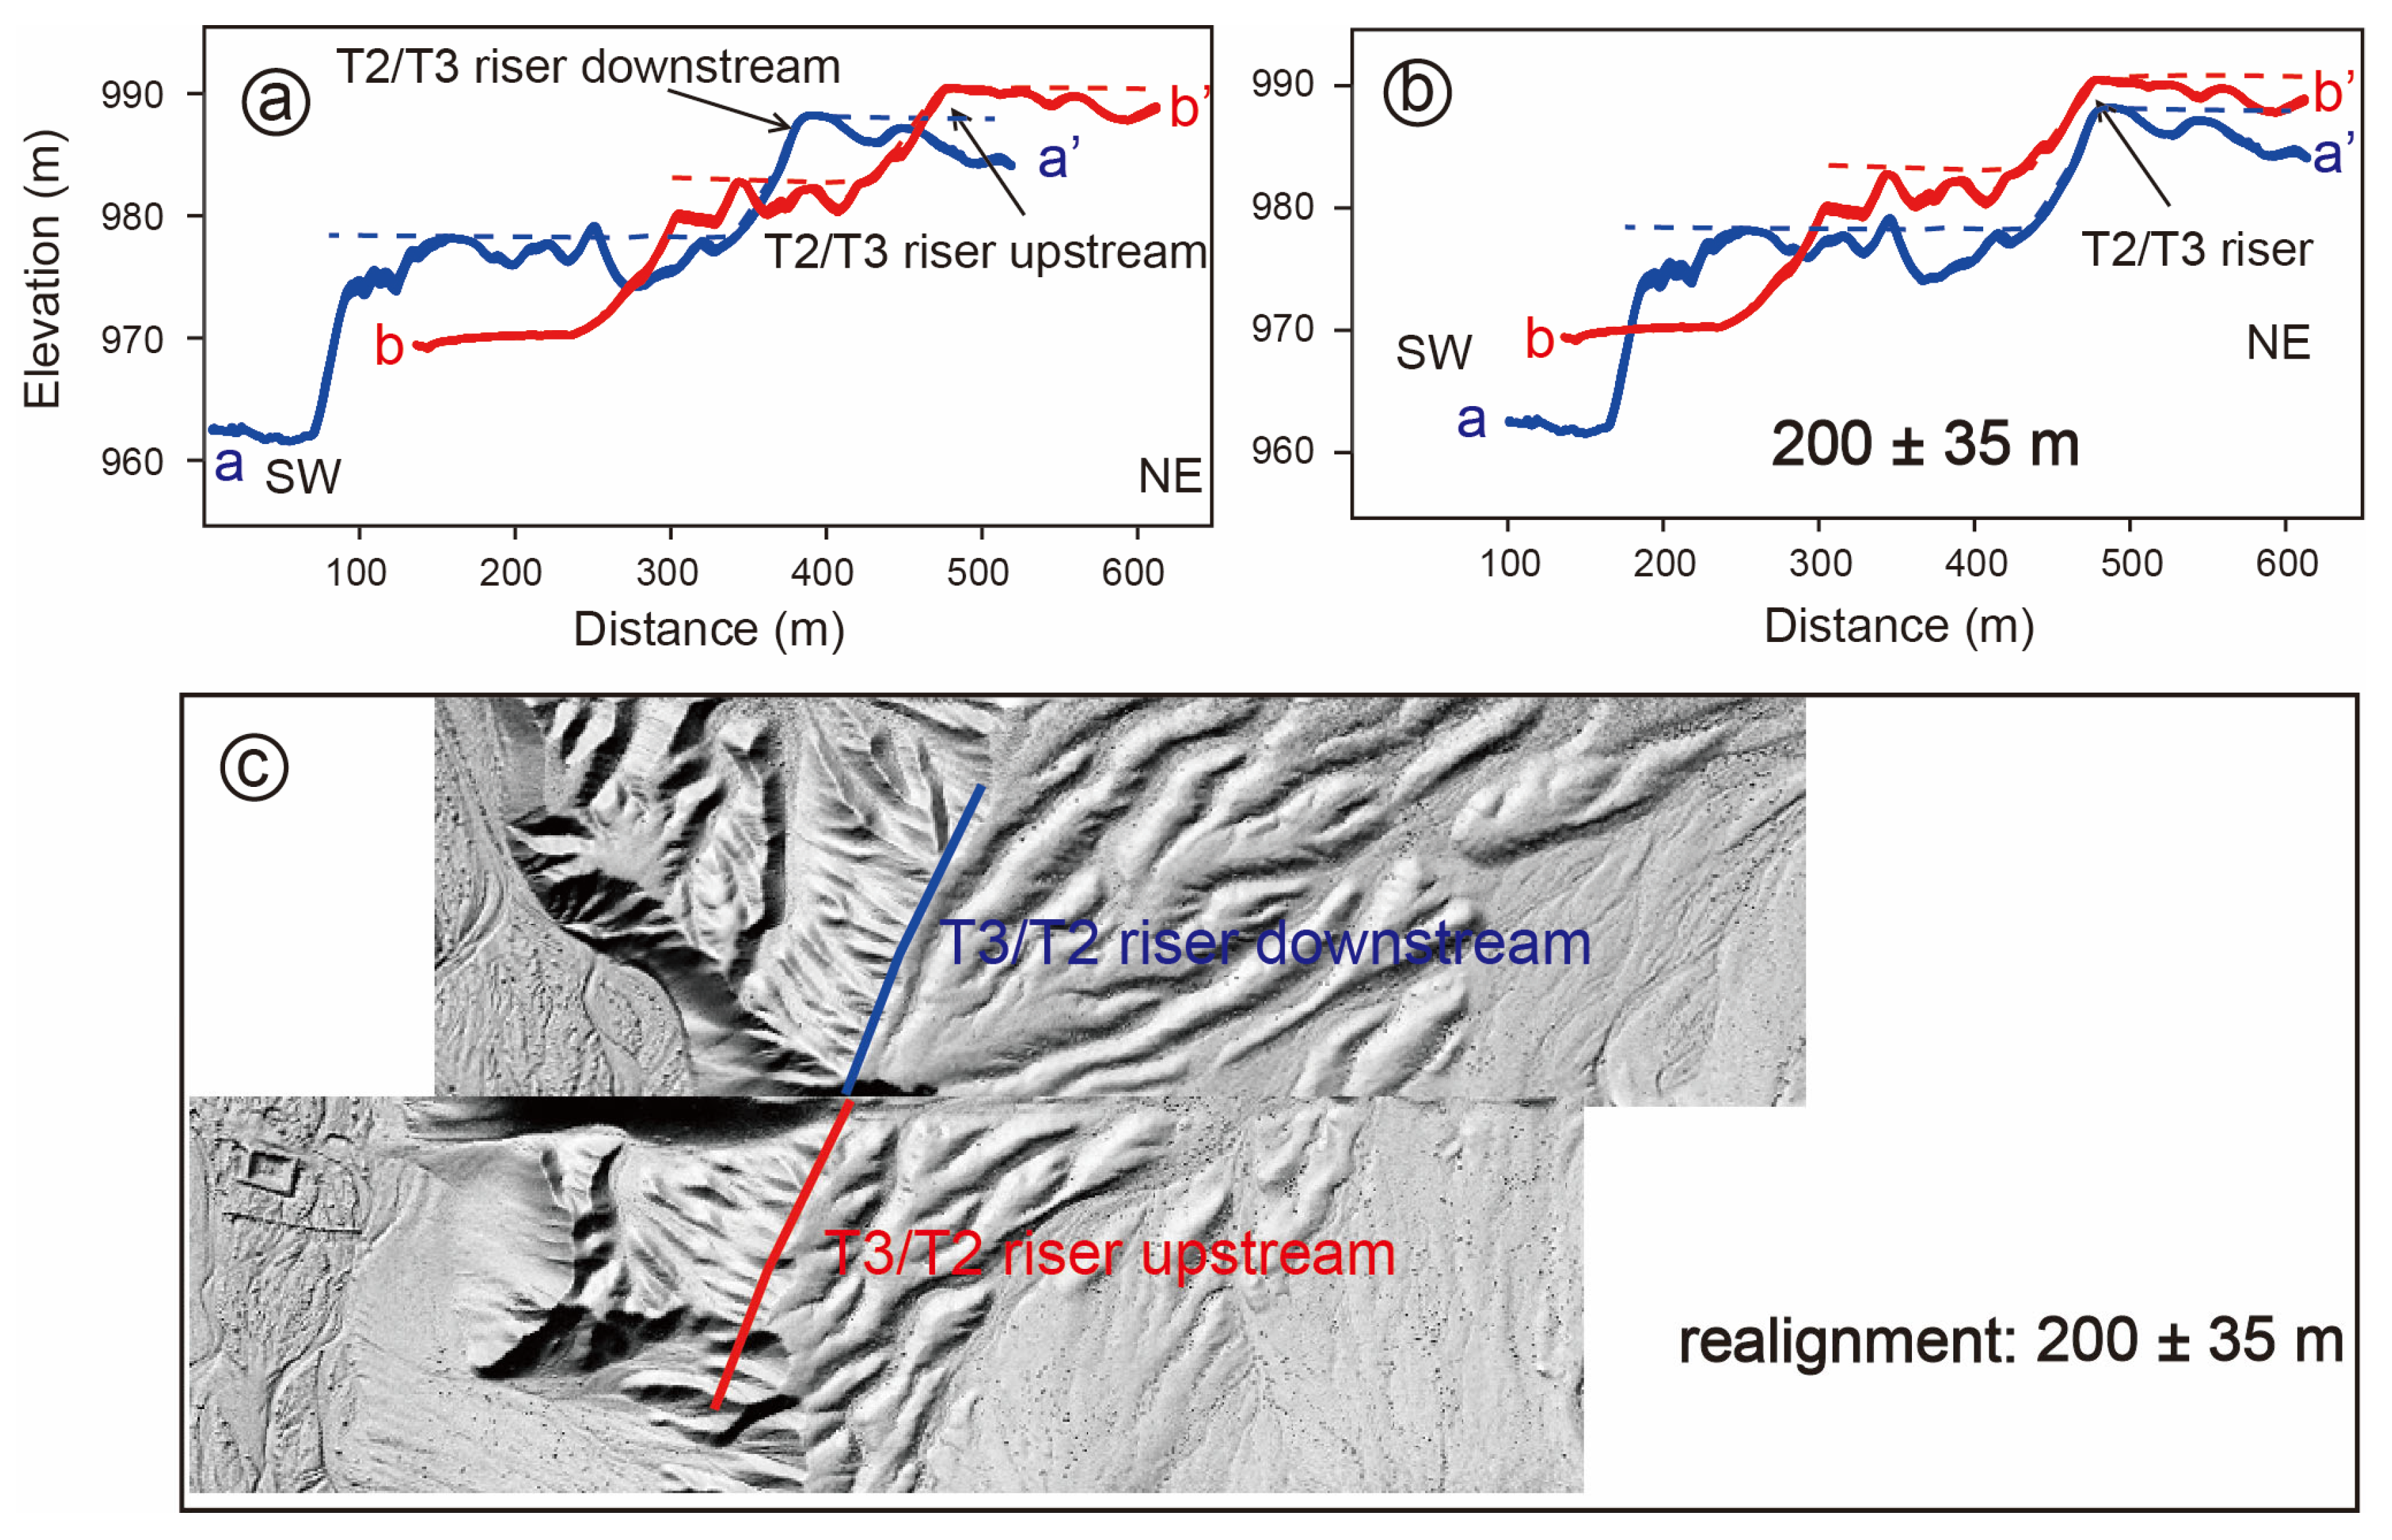
4.2.2. Xiamaya Segment

The Xiamaya segment of NKTF is significantly visible in the satellite images as a prominent linear trace on the Quaternary sediments. With the fault trending to the east, the uplift topography of Karlik Tagh was reduced (Figure 2). This fault segment displaced the Quaternary sediments and led to the left-lateral offset of stream channels, risers, and alluvial fans (Figure S2), as well as the formation of compressional ridges and linear scarps. We selected three sites (Sites 3–5) at which to perform detailed surveying and mapping.
Site 3 is located approximately 800 m east of Kuotuogayi Village (Figure 2). The fault cuts through a late Quaternary alluvial fan surface, forming two clear, nearly parallel fault branches (Figure 6a). The northern branch is the main branch, extending across the entire fan surface with a total length of approximately 1.25 km. The southern branch is only visible at the western end of the fan surface, with a length of 300 m (Figure 6a). The surface of the alluvial fan is relatively flat and is incised by several gullies. The relatively flat fan surface, incised by multiple gullies, preserves systematic sinistral offsets of these drainage features, as documented through combined field investigations and high-resolution DEM analysis. Notably, the absence of significant vertical displacement perpendicular to the fault trace suggests predominantly strike-slip motion with a minimal vertical component. Quantitative measurements of two representative gullies reveal sinistral displacements ranging from 6.5 to 55 m (Figure 6b,c), providing important constraints on the fault’s kinematic behavior and cumulative offset history. These observations collectively indicate that the fault at Site 3 accommodates primarily horizontal motion through left-lateral displacement of geomorphic markers.
Site 4 is 23 km southeast of Xiamaya Town along the north flowing Xiamaya River (Figure 2). The fault cuts through piedmont alluvial fans and river terraces, displaying exceptionally clear linear features (Figure 7a). On the eastern bank of the Xiamaya River, the fault traverses fluvial terraces, inducing conspicuous sinistral offset of the terrace surfaces (Figure 7b,c), which confirms the left-lateral strike-slip kinematic characteristics of this fault segment. Through detailed field identification and classification of fluvial terraces along both banks of the Xiamaya River, three levels of terraces were delineated in descending order as T3, T2, and T1 (Figure 7c). The T3 and T2 terraces are exclusively developed on the eastern bank, both being strath terraces with elevations of 26.5 m and 15.9 m above the modern riverbed (T0), respectively. The T1 terrace remnant is solely observed along the western bank, with a height of 2.1 m relative to the present riverbed (Figure 7d). The fault has sinistrally displaced the terrace scarps (T3/T2), with restoration analysis revealing a horizontal displacement of 200 ± 35 m (Figure 8a–c), the maximum offset value obtained through geomorphic markers along the eastern fault segment. The left scarp of the T2 terrace could not be obtained due to severe erosion (Figure 8c). Field investigations detected no horizontal displacement on the T1 terrace, likely due to complete removal by lateral river erosion.
On the alluvial fan surface of the east Xiamaya River, multiple pressure ridges aligned with the fault strike were observed (Figure 9a,b). These ridge structures run nearly parallel to the fault, extending tens of meters in length, with a maximum height of 1.5 m (Figure 9c). Compressional folding typically develops along restraining bends of strike-slip faults, manifesting morphologically as uplifted ridges or pressure ridges. We therefore interpret these bulges as pressure ridges related to strike-slip motion. Similarly, the fault also displaces small alluvial fans on the western bank, forming prominent mole tracks in the alluvial deposits (Figure 10a–c). On the western bank of the Xiamaya River, the fault extends through bedrock mountains, where Devonian dark-gray tuffaceous sandstone thrusts southward over Carboniferous sandstone (Figure 10d). The fault zone exhibits pronounced brecciation, and the Devonian tuffaceous sandstone displays distinct foliation structures with bedding attitudes of 170°∠53°. The consistent orientation between bedding planes and fault planes suggests the fault underwent ductile deformation before being exhumed through subsequent brittle deformation.
Site 5 is located approximately 4.5 km northeast of Site 4 (Figure 2), where the fault trace extends along the northern side of a roughly triangular massif (Figure 11a). This massif is about 670 m in length and 100–210 m in width, with a wider western end and a narrower eastern end. Topographically, the northern slope of the massif is gentle, while the southern slope is steep. The gullies on the northern slope are long and gentle, while those on the southern slope are short and steep, consistent with the topographic features of the uplift.
Northeast of this uplift, a large quarry pit was excavated due to engineering construction (Figure 11b). Within this quarry, several fault outcrops are observed, and the fault branches exhibit complex geometric structure in cross-section and significant variations in attitude. All of the field outcrops indicate that the fault exhibits thrust motion characteristics. In Figure 11c, thick gray-white gravel layers are thrust over black gravel layers, with a vertical offset of 1.4 m. The fault attitude in the lower strata is relatively gentle, at only 30–45° (Figure 11d), whereas near the surface the fault plane is nearly vertical.

4.3. Surface Exposure Ages

The results of the 10Be analysis are shown in Table 1. The detailed exposure dating analysis of the Yanchi segment and the Xiamaya segment is described below.

4.3.1. Geochronology of Yanchi Segment

The alluvial fan surfaces at Site 2 are scattered, with numerous boulders approximately 50 cm in length firmly embedded in the matrix. At this site, we collected three boulder samples from the A2 fan surface: KAR-01, KAR-02, and KAR-03 (Figure S3). The 10Be concentrations of KAR-01 and KAR-03 are 2.58 × 10⁶ atoms/g and 2.73 × 10⁶ atoms/g, yielding exposure ages of 103.9 ± 0.6 ka and 109.9 ± 0.7 ka, respectively. The 10Be concentration of KAR-Y02 is 1.9 × 10⁶ atoms/g, yielding an exposure age of 77.3 ka. The geochronological results show that the exposure age of KAR-Y02 is significantly younger than the other two samples. Two plausible explanations can account for this discrepancy. Firstly, 10Be concentration typically exhibits a positive correlation with burial depth. As illustrated in Figure S3, the KAR-Y02 boulder is more fragmented compared to KAR-Y01 and KAR-Y03, suggesting that this sample may have been buried for a longer duration before being exhumed by erosion. This interpretation is further supported by observations that cobbles sampled at the top of vertical profiles generally exhibit lower nuclide concentrations than boulders exposed well above the ground surface [54]. Alternatively, the boulders may have been deposited more recently, leading to less cosmic-ray exposure, and thus lower nuclide accumulation and a younger apparent age.
Taking these factors into consideration, the exposure ages of 103.9 ± 6.5 ka and 109.9 ± 6.8 ka likely represent the maximum formation age of the landform, while the younger age of 77.3 ± 4.8 ka may reflect a minimum estimate for the formation of the alluvial fan surface.

4.3.2. Geochronology of Xiamaya Segment

To determine the abandonment ages of the T3 and T2 terraces on the east bank of the Xiamaya River, we dug a 2 m pit on the T3 terrace, where the fluvial sediments are composed of clasts and sand.
Five samples are collected at depths of 0 cm, 30 cm, 60 cm, 90 cm, and 150 cm from this pit, and each sample contains approximately 2 kg of quartz and granite clasts. The 10Be concentration of these five samples from bottom to top are 8.1 × 10⁵, 1.1 × 10⁶, 1.3 × 10⁶, 1.6 × 10⁶, and 2.6 × 10⁶ atoms/g, respectively (Figure 12a–c). The results demonstrate that the 10Be concentration profile exhibits an exponential decay pattern with depth and shows strong normalization. Assuming there is no erosion, the optimal fitting yields an exposure age of 181.2 (+8.8/−11.2) ka and an inherited concentration of 7.04 × 10⁵ atoms/g (Figure 12a). According to the results, the inherited concentration represents 25% of the surface concentration.
Meanwhile, we collected an amalgamated surface sample from the lower T2 terrace of the river (Figure S3d). Each sample collected from this site consisted of approximately 3 kg of quartz clasts of 2–4 cm. The 10Be concentration of the amalgamated clasts is 2.1 × 10⁶ atoms/g.
Given that terraces T2 and T3 share identical sediment sources and transport pathways, the inherited 10Be concentration in quartz from T2 should approximate that of T3. We therefore applied this inherited concentration value to correct the measured 10Be concentration on the T2 surface. The corrected exposure age for terrace T2 is 140.9 ± 6.2 ka.

5. Discussion

5.1. Slip Rates of the North Karlik Tagh Fault

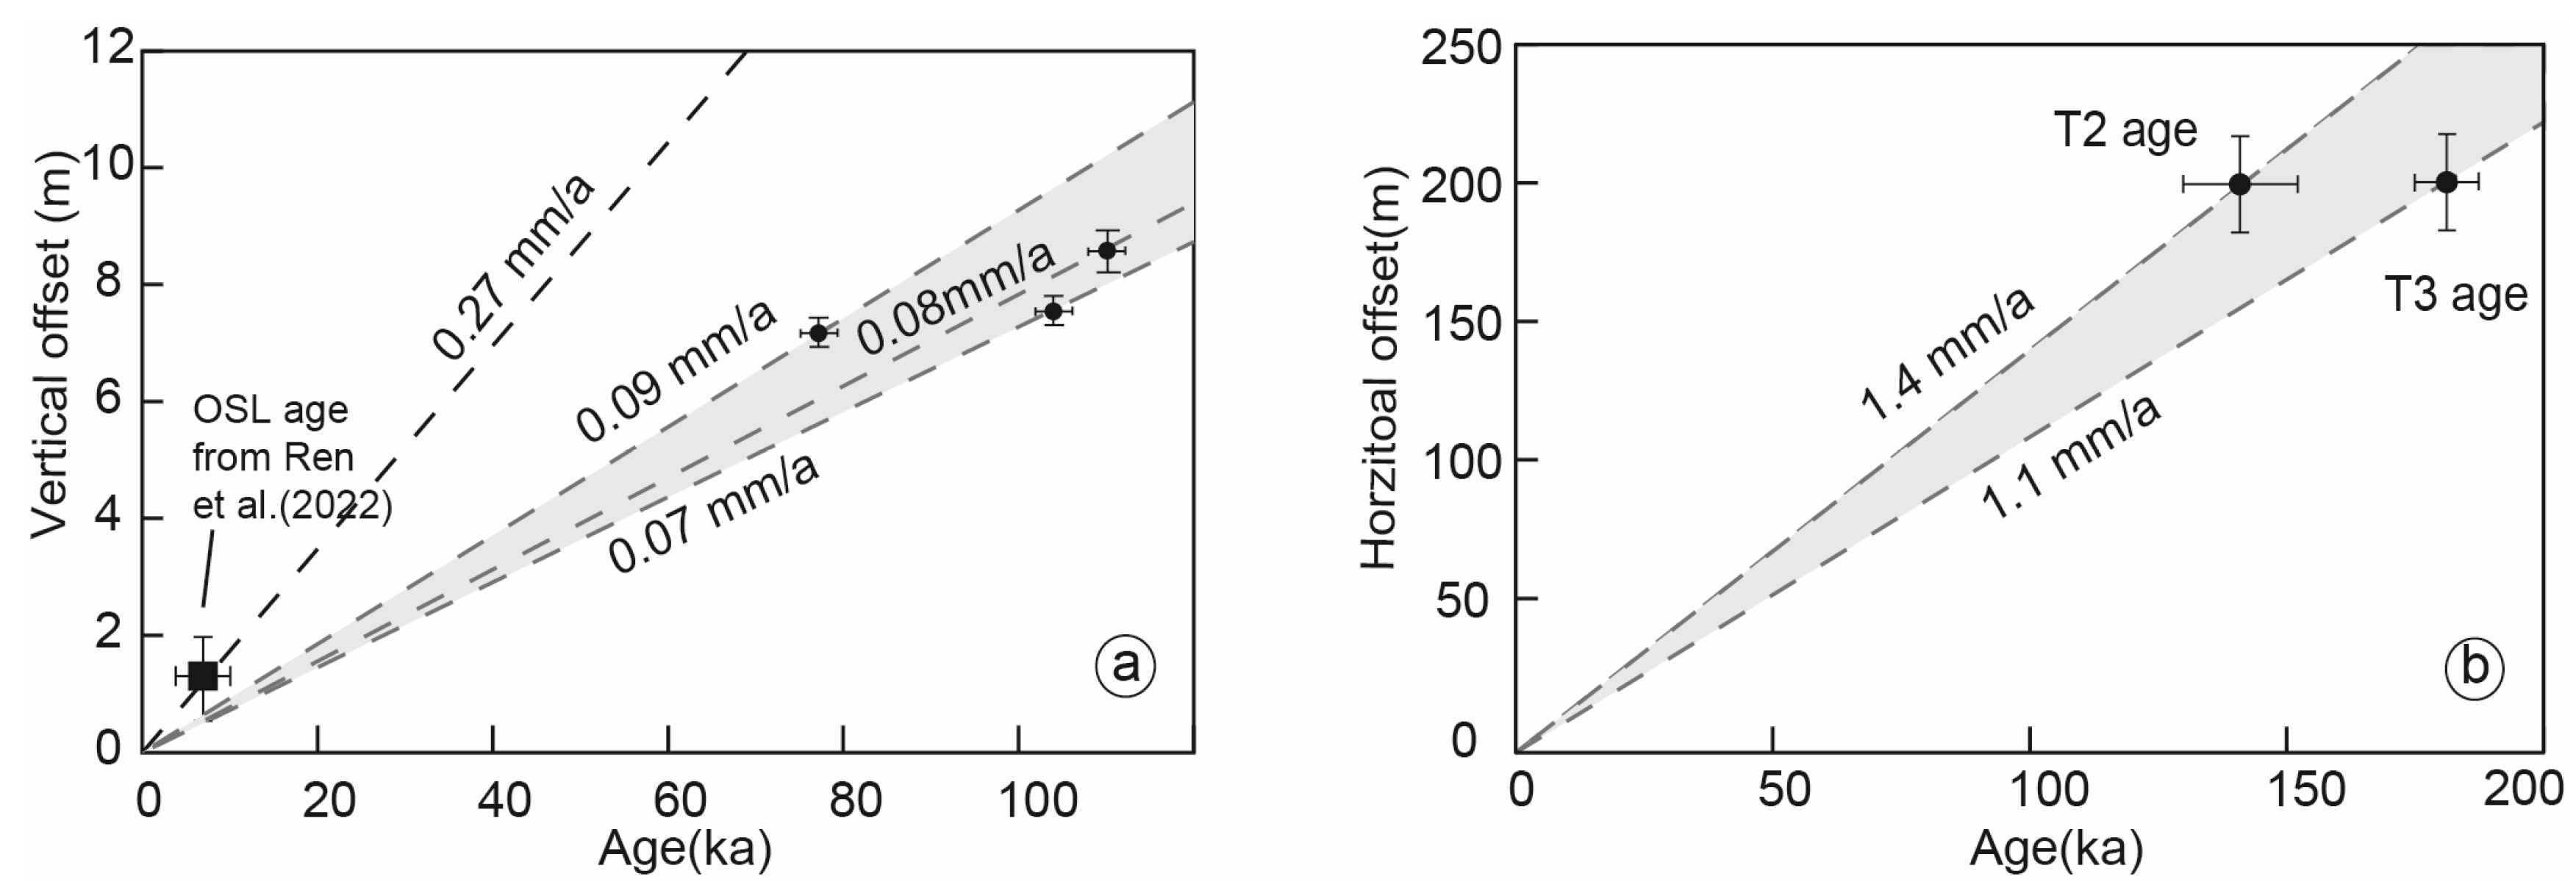
5.1.1. Vertical Slip Rate Along the Yanchi Segment

The slip rate is a crucial parameter in the quantitative study of active faults, as it not only reflects the intensity of faulting, but can also be directly applied to probabilistic seismic hazard assessments of the fault [63,64,65]. To derive the vertical slip rate along the Yanchi segment of the NKTF, we plotted the vertical offsets derived from scarp profiles on the A2 fan surface against the corresponding exposed 10Be ages at Site 2 (Figure 7).
At Site 2, topographic profiles across the scarp reveal an average vertical displacement of 8.4 ± 0.6 m. By integrating this displacement with the geomorphic surface’s mean exposure age of 106.9 ± 4.7 ka, we calculate a vertical slip rate of 0.07–0.09 mm/yr for the fault (Figure 13a). Ren et al. [42] determined a vertical slip rate of 0.19~0.35 mm/yr since 17 ka using luminescence dating and the vertical offset of a channel terrace at Site 1. This slip rate is two to three times greater than the rate at Site 2, which may represent the long-term slip rate of the fault. Furthermore, the late Quaternary vertical slip rate of the Yanchi segment of NKTF is slightly larger than the HMNF, which is consistent with the southward tilting topography of Karlik Tagh [22].

5.1.2. Left-Lateral Slip Rate Along the Xiamaya Segment

Offset river terrace risers are frequently observed linear geomorphic features that can effectively document tectonic activity. They are commonly utilized for assessing long-term slip rates along a strike-slip fault [66]. The timing of displacement accumulation on terrace risers is uncertain due to the non-synchronous formation of terraces and offsets [65]. One view holds that lateral erosion of a terrace riser occurs when a strike-slip fault displaces one side of the downstream terrace into the river course. Displacement accumulation on the riser is posited to occur only after formation of an adjacent lower terrace through incision and abandonment of the underlying floodplain below the riser [65]. Hence, the abandonment age of the upper terrace may be more appropriate according to this assumption. The ability of the river to incise laterally or vertically is related to changes in hydrodynamic conditions, which are affected by regional climate, sediment supply, tectonic forcing, and river gradient [67,68]. Yao et al. [69] think that the streamflow of ephemeral rivers is insufficient to thoroughly erode the lowest terrace risers in semiarid climates, because rivers incise only during infrequent strong storms and have lower power. This assumption indicates that the age of the upper terrace is closer to the time when the cumulative displacement begins. A notable example is the dating of upper and lower terraces, as demonstrated by Kirby et al. [70] along the Kunlun fault.
On the west bank of the Xiamaya River, the horizontal displacement T3/T2 riser is 200 ± 35 m, and the ages from T3 and T2 bracket the riser age of the displacement accumulation beginning from 181.2 ka to 140.9 ka. Combining the ages and displacement of T3/T2 riser yields a maximum rate of 1.4 ± 0.2 mm/yr using the T2 age (140.9 ka) and a minimum slip of 1.1 ± 0.3 mm/yr using the T3 age (181.2 ka) (Figure 13b).
To better characterize the geomorphic processes of landforms and determine accurate geologic slip rates, the sequence of displacement and accompanying development of terraces at Site 4 is illustrated in Figure 14a–g. Specifically, on the eastern riser of the Xiamaya river, the river has just incised into an alluvial fan. The remaining part of the fan formed the terrace T3. Subsequently, fault slip displaces the downstream terrace on the left side so that it lies in the path of the river, which in turn subjects the downstream riser to erosion. Because the ephemeral river is mostly dry, we think the riser experienced incomplete lateral erosion, which indicates that the upper terrace (T3) age is likely to approximate the onset time of displacement accumulation. Hence, we favor the minimum slip rate (1.1 ± 0.3 mm/yr) as providing the best estimate of the slip rate.
Overall, the left-lateral slip rate of the NKTF is approximately ten times greater than that of its thrust rate, indicating that strike-slip deformation predominates in easternmost Tian Shan.

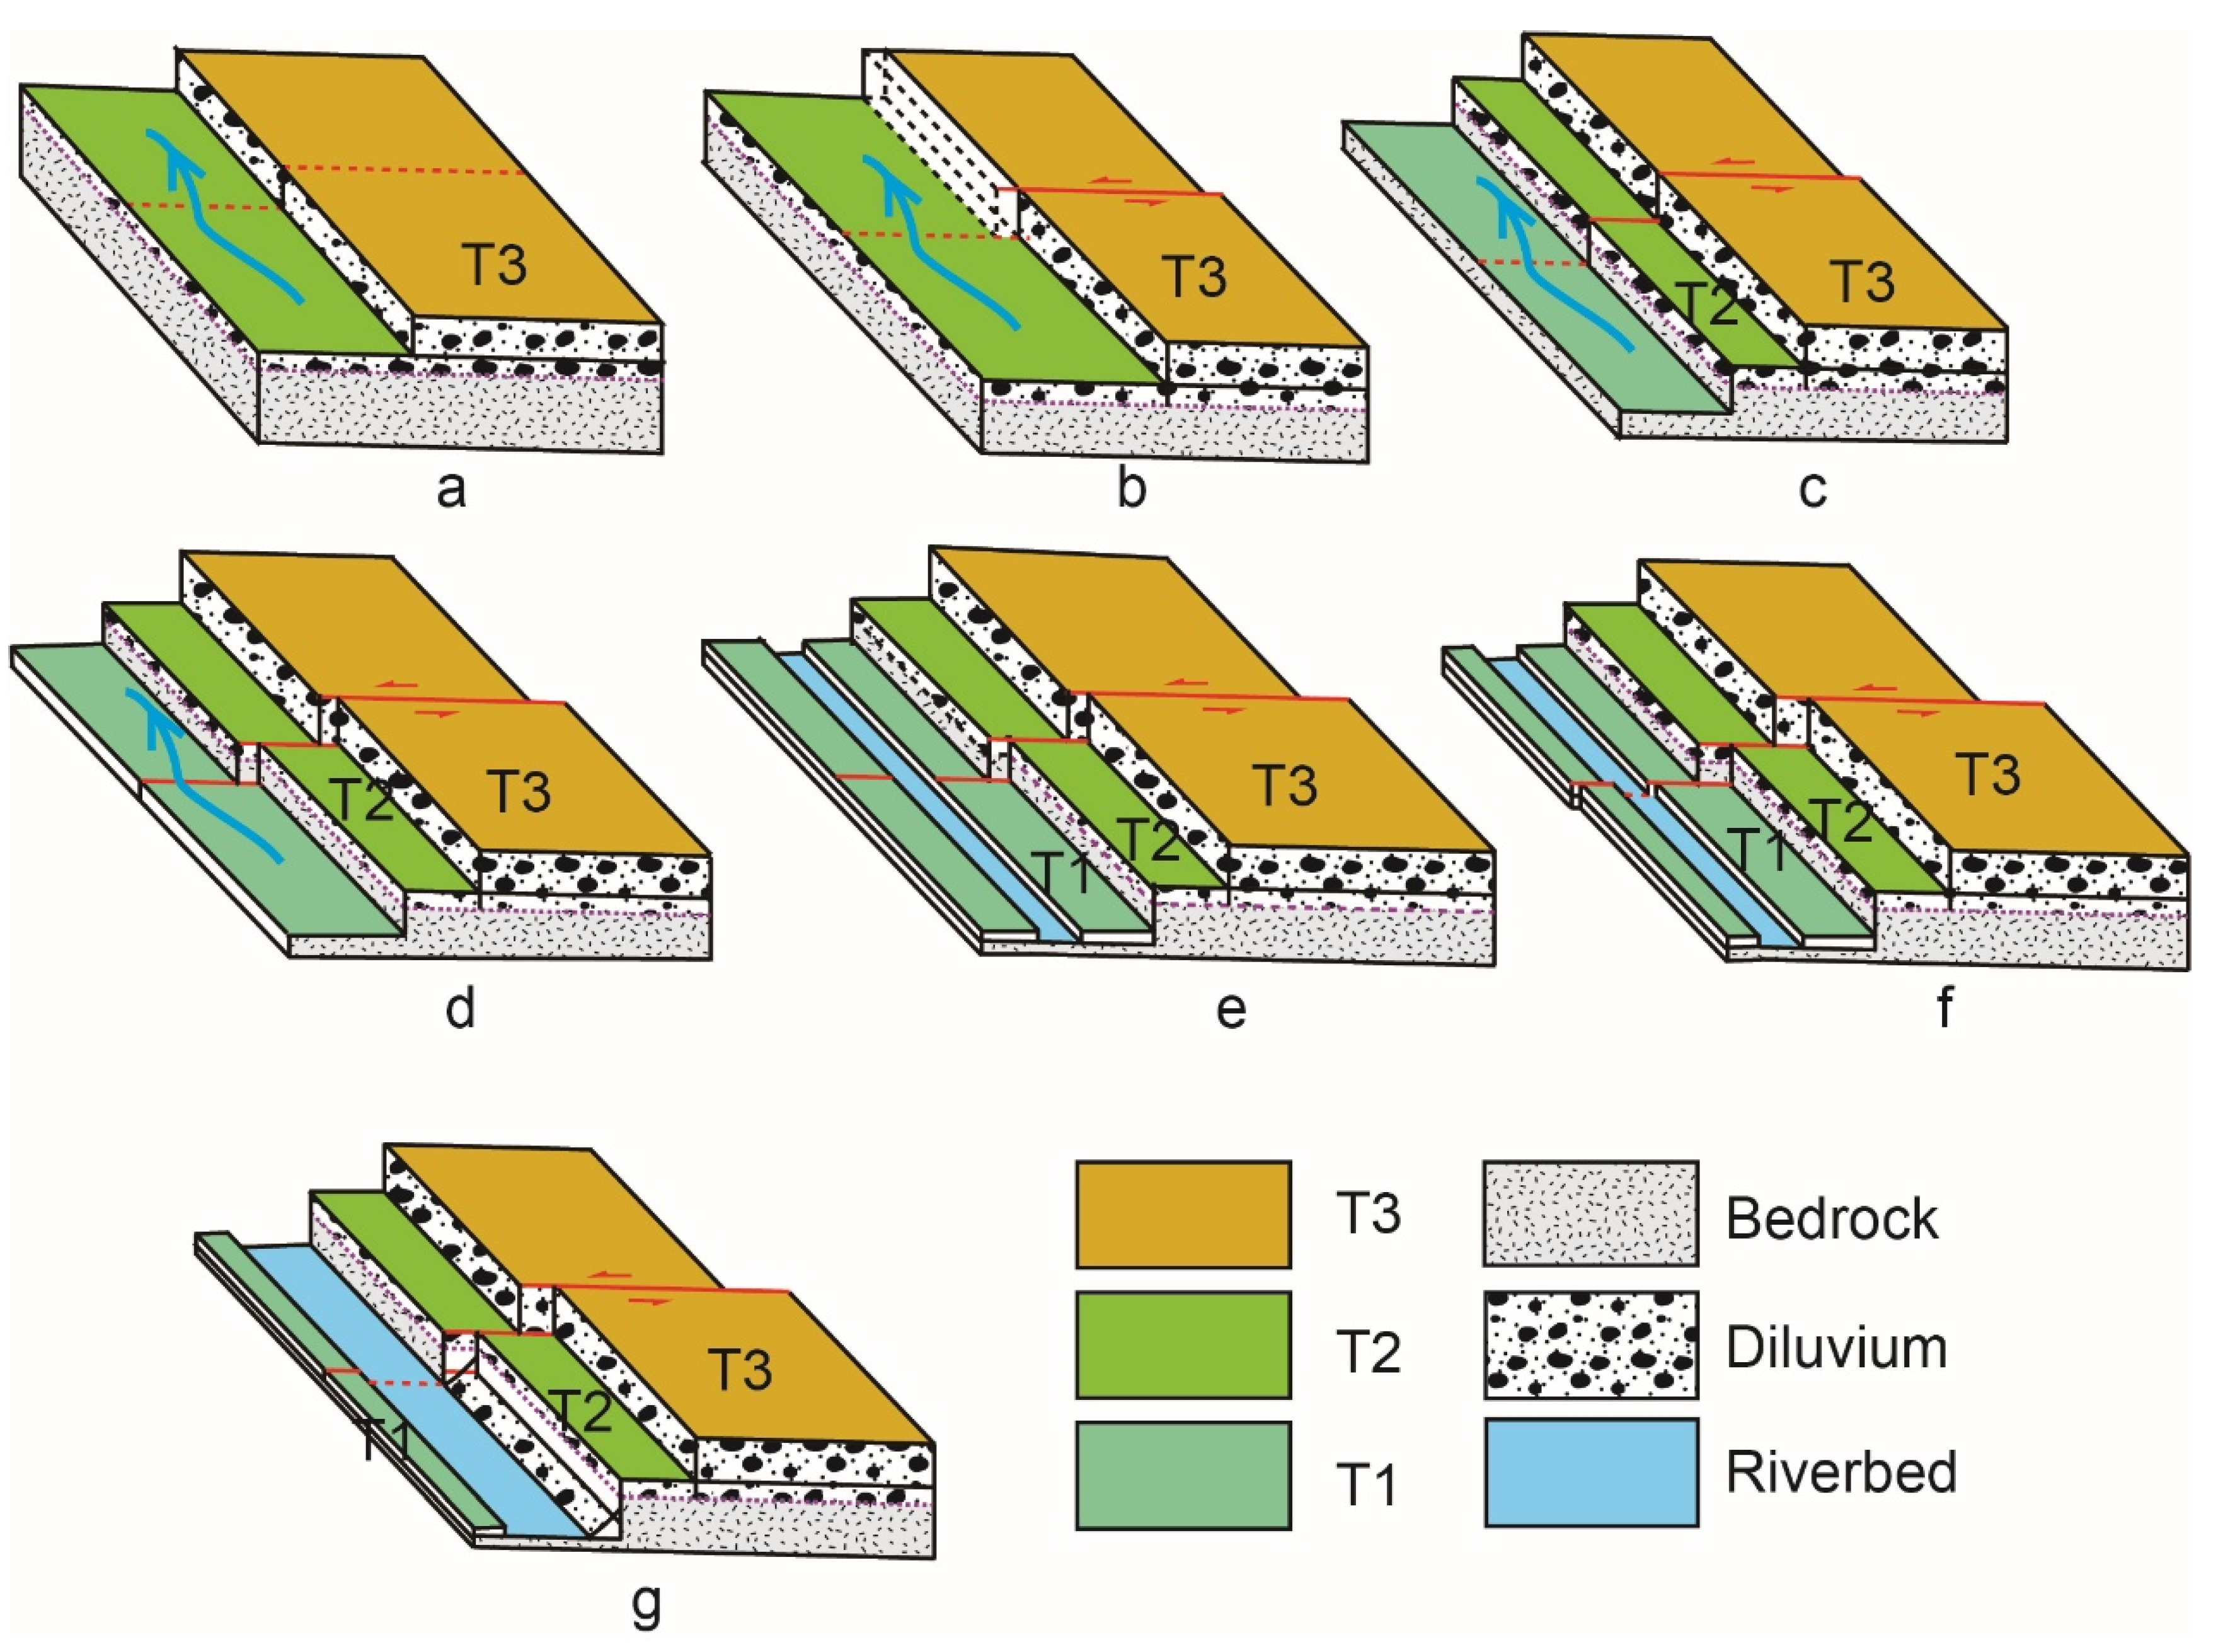
5.2. Fault Geometry and Kinematics in Easternmost Tian Shan

Field observations and interpretations of satellite images reveal that the northern and southern sides of the Barkol Tagh and Karlik Tagh mountains have widespread Cenozoic tectonic deformation (Figure 2) [22,42]. These active structures show different strikes and kinematic behaviors, such as thrusting and strike-slip, as well as spatially variable deformation along individual fault segments. Specifically, NE-NEE-trending faults exhibit sinistral strike-slip characteristics, including the western segment of the Jianquanzi-Barkol Fault (J-BF) and the eastern segment of the NKTF. In contrast, the presence of NW-trending faults is demonstrated by thrusting, such as the eastern segment of the J-BF, the western segment of the NKTF, and a series of secondary NE-striking faults in the Adak valley (Figure 15a). This deformation pattern is thought to relate to the angle between the fault orientation and the regional maximum compressive stress direction (NNE direction). In other words, when the fault orientation intersects the regional maximum compressive stress direction at a small angle, the fault primarily exhibits sinistral strike-slip motion. When the intersection angle is large, the fault is dominated by thrust deformation [22].
The connections between fault branches are relatively complex. These active faults at both the northern and southern sides of Karlik Tagh exhibit bidirectional tectonic orientation of the mountain range towards the basins. Specifically, the fault on the northern side of the mountain range dips southward and thrusts northward, while the fault on the southern side dips northward and thrusts southward. The Barkol Tagh and Karlik Tagh ranges present sigmoidal topography and display double structural vergence at depth, with thrust faults rooting into their center, forming an asymmetric “positive flower structure” in cross-section (Figure 15b,c).
A previous study thinks that the Barkol Tagh and Karlik Tagh ranges form the western horsetail termination of the GTSFS [22]. In terms of planar geometry, the western segment of the J-BF and the eastern segment of the NKTF are arranged in a sinistral right-step pattern, forming a rhombic compressional stepover zone between the two strike-slip fault branches. This stepover zone encompasses Barkol Tagh and Karlik Tagh, with an approximate 100 km length in the E-W direction and 90 km wide in the N-S direction, within which a series of NW-trending thrust faults or folds have developed (Figure 16a). The spatial relationship between the active faults and the topography suggests strongly that Barkol Tagh and Karlik Tagh are large double left-lateral restraining bend ranges between the J-BF and NKTF or GTSFS (Figure 16b).
Farther west, the Bogda Shan is similarly bounded by outward-verging thrust faults along both its northern and southern margins. Geomorphological evidence reveals pronounced asymmetric curvature in the structural configurations of both the Bogda Mountains and the Turpan Basin fold belts (Figure 16a). These asymmetries strongly support a left-lateral strike-slip component of deformation, indicating that Bogda Mountain constitutes the western termination of the Gobi-Tian Shan sinistral strike-slip fault system, just like the contractional horsetail splay Gurvan Sayhan in the east termination.

5.3. Slip Partitioning and Tectonic Implications for Easternmost Tian Shan

Strike-slip displacements along master faults that enter a restraining bend will be partially or wholly accommodated through bend-related deformation [4,11]. For instance, the Altyn Tagh fault’s eastern segment (east of 96°E) shows reduced slip rates (~4 mm/yr) as motion transfers to thrust faults splaying into the Tibetan Plateau [71]. The Haiyuan fault at the Hasi Shan restraining bend displays intricate deformation, with four subsidiary strands accommodating oblique slip. The left-lateral GTSFS in southern Gobi Altai generates NW-trending ranges in the east end while facilitating crustal shortening.
By analyzing the late Quaternary geometric and kinematic characteristics of the major active faults in the eastern Tian Shan mountains, we thoroughly studied the rate variations and tectonic transformation features among different faults, summarizing the tectonic deformation pattern of the eastern segment of easternmost Tian Shan.
The western segment of the J-BF exhibits a stable sinistral strike-slip rate of 2.4–2.8 mm/yr [44] (Figure 15a). The late Quaternary strike-slip rate of the eastern segment of the NKTF is 1.1–1.4 mm/yr, consistent with GPS-derived estimates of ~1.2 mm/yr [46], creating a 1.3–1.4 mm/yr E-W slip gradient.
In the NE-SW direction, the vertical slip rate of the Yanchi segment of the NKTF is 0.08 mm/yr, corresponding to a shortening rate of 0.14 mm/yr given the fault dip of 30°. Similarly, the shortening of the Hami Basin North Fault (HMNF) is 0.1–0.28 mm/yr [72], and the total shortening rate within the Barkol Basin is 0.29 mm/yr [45]. The shortening rate of the Yiwu Fault is 0.13–0.21 mm/yr [47]. The faults within the Adak Valley exhibit lower activity compared to the piedmont fault, as evidenced by their smaller scale and subdued geomorphic expression, with an estimated individual shortening rate of <0.1 mm/yr. In conclusion, the NW-trending thrust faults within the compressional stepover zone absorb a total shortening rate of >1.0 mm/yr, which aligns with the rate difference between the western segment of the J-BF and the eastern segment of the NKTF. This indicates that the sinistral strike-slip deformation along easternmost Tian Shan is transformed into NW-trending thrust faults within a restraining bend, while the residual strain is transferred to the eastern segment of the NKTF and the GTSFS further east and finally is gradually absorbed by some thrust faults in southern Mongolia (Figure 16b).
GPS-derived velocity fields reveal that easternmost Tian Shan moves northeastward, while there is a shift eastward in the Gobi region relative to Siberia. This kinematic pattern manifests far-field effects of India’s ongoing northward indentation through a broad sinistral shear zone that structurally links Tian Shan with SW Mongolia. Easternmost Tian Shan is comprised of a transitional zone from the thrust dominating central Tian Shan to a sinistral transpressional system.
The E-W strike-slip faults of the Gobi Corridor parallel larger sinistral systems to the south (e.g., Altyn Tagh and Kunlun faults) to collectively accommodate eastward Tibetan extrusion. Consequently, SW Mongolia and adjacent regions are displaced in an eastward direction relative to the Hangay Dome and Siberia. Tomographic evidence further supports the presence of ENE-directed mantle flow beneath the Gobi region [73], suggesting that the Gobi Corridor fault systems reflect upper-crustal responses to deeper lithospheric processes. These structures define a wide sinistral transpressional shear zone that mechanically couples the Tian Shan deformation with SW Mongolia [74] and ultimately accommodates eastward motion due to India’s ongoing indentation.

5.4. Seismic Hazard of the North Karlik Tagh Fault

Eastern Tian Shan has experienced intense tectonic activity and frequent seismicity since the late Cenozoic, as evidenced by conspicuous surface fault traces. Two major earthquakes (M 7.5) struck this region in 1842 and 1914, causing severe destruction to collapsing buildings in Barkol County and surrounding villages and resulting in significant casualties [25]. However, the seismic faults associated with these earthquakes remain debated; some researchers attribute them to the J-BF fault [75], while others argue that they occurred along the western segment of the NKTF [76]. Paleoseismic studies indicate that the recurrence interval of large earthquakes in Tian Shan seems to be over one thousand years [77].
Notably, an M 8.3 earthquake occurred along the Gurvan Bogda Fault System in the Gobi Altai in 1957 [26]. The GTSFS exhibits dimensions, slip rates, and tectonic settings similar to those of the Gurvan Bogda Fault System, suggesting that easternmost Tian Shan has the potential to generate significant earthquakes.
The Xiamaya segment of the NKTF displays clear linear traces in satellite imagery, with measured minimum displacements of 6.5 m. Despite the distinct Quaternary faulting morphology along the fault, no historical or instrumental records of large earthquakes exist. Quarry exposures reveal that the fault offsets the youngest surficial deposits, and the most recent alluvial fans were mainly generated during the transition from the last glaciation to the present interglacial period [78]. Thus, the latest activity of the Xiamaya segment likely occurred in the Holocene.
As previously mentioned, easternmost Tian Shan is dominated by sinistral strike-slip motion. According to the empirical formula Mw = 5.16 + 1.12 lg L [79], we have estimated the magnitude of potential earthquakes along the Xiamaya segment. Based on satellite imagery interpretation and field surveys, the most prominent surface rupture of 68 km corresponds to a magnitude of 7.2. A full-segment rupture could yield a magnitude of Mw 7.5.
Strike-slip faults often exhibit complex geometries along their trend, such as restraining bends that act as stress accumulation zones controlling rupture initiation and propagation [7]. Earthquakes may involve single-fault ruptures or multi-fracture ruptures, potentially generating larger events. For example, the Bogda Fault in the Gobi Altai ruptured both strike-slip and thrust faults, producing a 350 km long surface rupture zone [27]. Similarly, the 1889 Chilik earthquake (Mw 8.0–8.3) in central Tian Shan ruptured multiple faults with an oblique slip, creating a ~175 km rupture and causing severe damage in Almaty [8].
In easternmost Tian Shan, sinistral strike-slip and thrust faults form a large transpressional deformation zone. The NKTF, with a total length exceeding 100 km, could produce earthquakes exceeding Mw 8 if both thrust and strike-slip segments rupture simultaneously.
Our findings highlight that the seismic hazard along the North Karlik Tagh Fault should not be underestimated and that a detailed investigation of its paleoseismic history is still needed.

6. Conclusions

The North Karlik Tagh Fault is a major fault in easternmost Tian Shan, arcuately bounding the northern margin of Karlik Tagh. This fault can be divided into two segments––the NW Yanchi segment and the NE-NEE Xiamaya segment––according to its change in strike. Utilizing high-resolution digital topography from SfM, along with cosmogenic radionuclide dating constraints, we conclude that the Yanchi segment strikes NW and exhibits a thrust nature with a vertical slip of 0.07–0.09 mm/yr. The Xiamaya segment displays linear traces, displaced stream channels, and terraces, suggesting that the fault is a left-lateral with a vertical slip component, and the left-lateral slip rate is 1.1–1.4 mm/yr since 180 ka. Combined with the geometry and kinematics of faults in easternmost Tian Shan and Gobi Altai, we suggest that thrust faults linked with left-lateral slip faults form a transpressional deformation regime. The left-lateral faults accommodate the east-northeastward displacement of the Gobi Altai crust relative to the stable Siberian craton to the north, related to the India-Eurasia collision. Our findings also highlight that the North Karlik Tagh Fault could potentially generate a MW ~7.5 earthquake, indicating that a detailed investigation of its paleoseismic history is still needed.

Supplementary Materials

The following supporting information can be downloaded at: https://www.mdpi.com/article/10.3390/rs17142498/s1, Figure S1. Analysis of a faulted geomorphic surfaces. The gray solid lines represent topographic profiles perpendicular to the fault trace, dashed black lines indicate the best-fit trend of displaced geomorphic surfaces, reconstructed for both hanging-wall and footwall. And the vertical displacement is calcualted by V = V 1 + V 2 2 ± ( V V 1 + V 2 2 ) . Figure S2. (a) SfM-derived hillshade image showing the fault-related landform (b) Geomorphic interpretation of the alluvial fan, with vertical offsets of 44 ± 5 m (left bank) and 50 ± 8 m (right bank) along the active channel. Yellow surfaces denote fan deposits, while blue surfaces represent incised active channels. Figure S3. (a) Geochronology samples of KAR-Y01; (b) geochronology samples of KAR-Y02 (c) geochronology samples of KAR-Y03 in the Yanchi segment; (d) geochronology samples of KAR-04 in the Xiamay segment.

Author Contributions

Methodology, C.W. and Q.L.; Formal analysis, G.R. and X.Z.; Investigation, K.S.; Resources, B.Z.; Data curation, C.W. and X.Z.; Writing—original draft, G.R.; Writing—review & editing, Q.L.; Supervision, C.L.; Funding acquisition, C.L. All authors have read and agreed to the published version of the manuscript.

Funding

This study was funded by the National Natural Science Foundation of China (42072250), the Fundamental Research Funds in the Institute of Geology, and the China Earthquake Administration (IGCEA2508). We sincerely appreciate the insightful comments and constructive suggestions from the reviewers, which have greatly enhanced the quality of our manuscript.

Data Availability Statement

The original contributions presented in this study are included in the article/Supplementary Materials. Further inquiries can be directed to the corresponding author.

Conflicts of Interest

Authors Guangxue Ren, Xuanyu Zhang and Bowen Zou were employed by the company China Railway Design Corporation. The remaining authors declare that the research was conducted in the absence of any commercial or financial relationships that could be construed as a potential conflict of interest.

References

  1. Woodcock, N.H.; Fischer, M. Strike-slip duplexes. J. Struct. Geol. 1986, 8, 725–735. [Google Scholar]
  2. Marshak, S.; Nelson, W.; McBride, J. Phanerozoic strike-slip faulting in the continental interior platform of the United States: Examples from the Laramide orogen, mid-continent, and Ancestral Rocky Mountains. Geol. Soc. Lond. Spec. Publ. 2003, 210, 159–184. [Google Scholar]
  3. Rizza, M.; Abdrakhmatov, K.; Walker, R.; Braucher, R.; Guillou, V.; Carr, A.S.; Campbell, G.; McKenzie, D.; Jackson, J.; Aumaître, G.; et al. Rate of slip from multiple Quaternary dating methods and paleoseismic investigations along the Talas-Fergana Fault: Tectonic implications for the Tien Shan Range. Tectonics 2019, 38, 2477–2505. [Google Scholar] [CrossRef]
  4. Segall, P.; Pollard, D. Mechanics of discontinuous faults. J. Geophys. Res. Solid Earth 1980, 85, 4337–4350. [Google Scholar]
  5. Bennett, R.A.; Friedrich, A.M.; Furlong, K.P. Codependent histories of the San Andreas and San Jacinto fault zones from inversion of fault displacement rates. Geology 2004, 32, 961–964. [Google Scholar] [CrossRef]
  6. Molnar, P.; Tapponnier, P. Cenozoic tectonics of Asia: Effects of a continental collision. Science 1975, 189, 419–426. [Google Scholar]
  7. Cunningham, D. Structural and topographic characteristics of restraining bend mountain ranges of the Altai, Gobi Altai and easternmost Tien Shan. Geol. Soc. Lond. Spéc. Publ. 2007, 290, 219–237. [Google Scholar] [CrossRef]
  8. Abdrakhmatov, K.E.; Walker, R.T.; Campbell, G.E.; Carr, A.S.; Elliott, A.; Hillemann, C.; Hollingsworth, J.; Landgraf, A.; Mackenzie, D.; Mukambayev, A.; et al. Multisegment rupture in the 11 July 1889 Chilik earthquake (Mw 8.0–8.3), Kazakh Tien Shan, interpreted from remote sensing, field survey, and paleoseismic trenching. J. Geophys. Res. Solid Earth 2016, 121, 4615–4640. [Google Scholar] [CrossRef]
  9. Bayasgalan, A.; Jackson, J.; McKenzie, D. Lithosphere rheology and active tectonics in Mongolia: Relations between earthquake source parameters, gravity and GPS measurements. Geophys. J. Int. 2005, 163, 1151–1179. [Google Scholar]
  10. Blisniuk, K.; Rockwell, T.; Owen, L.A.; Oskin, M.; Lippincott, C.; Caffee, M.W.; Dortch, J. Late quaternary slip rate gradient defined using high-resolution topography and 10Be dating of offset landforms on the southern San Jacinto fault zone, California. J. Geophys. Res. 2010, 115, B08401. [Google Scholar] [CrossRef]
  11. Cunningham, W.D.; Mann, P. Tectonics of strike-slip restraining and releasing bends. Geol. Soc. Lond. Spéc. Publ. 2007, 290, 1–12. [Google Scholar] [CrossRef]
  12. Aydin, A.; Nur, A. The types and role of stepovers in strike-slip tectonics. In Strike-Slip Deformation, Basin Formation, and Sedimentation; Biddle, K.T., Christie-Blick, N., Eds.; SEPM Special Publications: Tulsa, OK, USA, 1985; Volume 37, pp. 35–44. [Google Scholar]
  13. Mann, P.; Gordon, M. Tectonic uplift and exhumation of blueschist belts along transpressional strike-slip fault zones. In Dynamics of Subduction Zones; Bebout, G., Scholl, D., Kirby, S., Platt, J., Eds.; American Geophysical Union: Washington, DC, USA, 1996; Volume 96, pp. 143–154. [Google Scholar]
  14. McClay, K.; Bonora, M. Analog models of restraining stepovers in strike-slip fault systems. AAPG Bull. 2001, 85, 233–260. [Google Scholar]
  15. Crowell, J.C. Sedimentation along the San Andreas fault, California. In Modern and Ancient Geosynclinal Sedimentation; Dott, R.H., Jr., Shaver, R.H., Eds.; SEPM Special Publications: Claremore, OK, USA, 1974; Volume 19, pp. 292–303. [Google Scholar]
  16. Biddle, K.T.; Christie-Blick, N. Glossary–strike-slip deformation, basin formation and sedimentation. SEPM Spec. Publ. 1985, 37, 375–384. [Google Scholar]
  17. Lowell, J.D. Spitsbergen Tertiary orogenic belt and the Spitsbergen Fracture Zone. Geol. Soc. Am. Bull. 1972, 83, 3091–3102. [Google Scholar]
  18. Bowman, D.; King, G.; Tapponnier, P. Slip partitioning by elastoplastic propagation of oblique slip at depth. Science 2003, 300, 1121–1123. [Google Scholar] [CrossRef]
  19. Dooley, T.; McClay, K.; Bonora, M. 4D evolution of segmented strike-slip fault systems: Applications to NW Europe. Geol. Soc. Lond. Pet. Geol. Conf. Ser. 1999, 5, 215–231. [Google Scholar] [CrossRef]
  20. Jones, R.R.; Tanner, P.W.G. Strain partitioning in transpression zones. J. Struct. Geol. 1995, 17, 793–802. [Google Scholar]
  21. Owen, L.A.; Cunningham, W.D.; Windley, B.F.; Badamgarov, J.; Dorjnamjaa, D. The landscape evolution of Nemegt Uul: A late Cenozoic transpressional uplift in the Gobi Altai, southern Mongolia. Geol. Soc. Lond. Spéc. Publ. 1999, 162, 201–218. [Google Scholar]
  22. Cunningham, D.; Owen, L.A.; Snee, L.W.; Li, J.L. Structural framework of a major intracontinental orogenic termination zone: The easternmost Tien Shan, China. J. Geol. Soc. 2003, 160, 575–590. [Google Scholar] [CrossRef]
  23. Tapponnier, P.; Molnar, P. Active faulting and Cenozoic tectonics of the Tien Shan, Mongolia, and Baykal Regions. J. Geophys. Res. Solid Earth 1979, 84, 3425–3459. [Google Scholar] [CrossRef]
  24. Bayasgalan, A.; Jackson, J.; Ritz, J.-F.; Carretier, S. Field examples of strike-slip fault terminations in Mongolia and their tectonic significance. Tectonics 1999, 18, 394–411. [Google Scholar]
  25. Seismological Bureau of Xinjiang Uygur Autonomous Region. Collection of Earthquake Information of Xinjiang Uygur Autonomous Region; Seismological Press: Beijing, China, 1985. (In Chinese) [Google Scholar]
  26. Kurushin, R.A.; Bayasgalan, A.; Olziybat, M.; Enkhtuvshin, B.; Molnar, P.; Bayasgalan, C.; Hudnut, K.W. The surface rupture of the 1957 Gobi-Altai, Mongolia, earthquake. Geol. Soc. Am. Spec. Pap. 1997, 320, 143. [Google Scholar]
  27. Wang, M.; Shen, Z.-K. Present-day crustal deformation of continental China derived from GPS and its tectonic implications. J. Geophys. Res. Solid Earth 2020, 125, e2019JB018774. [Google Scholar] [CrossRef]
  28. Cunningham, W.D.; Windley, B.F.; Dorjnamjaa, D.; Badamgarov, J.; Saandar, M. Late Cenozoic transpression in southwestern Mongolia and the Gobi Altai-Tien Shan connection. Earth Planet. Sci. Lett. 1996, 140, 67–81. [Google Scholar]
  29. Allen, M.B.; Windley, B.F.; Zhang, C. Palaeozoic collisional tectonics and magmatism of the Chinese Tianshan, Central Asia. Tectonophysics 1993, 220, 89–115. [Google Scholar]
  30. Thompson, S.C.; Weldon, R.J.; Rubin, C.M.; Abdrakhmatov, K.; Molnar, P.; Berger, G.W. Late Quaternary slip rates across the central Tien Shan, Kyrgyzstan, central Asia. J. Geophys. Res. Solid Earth 2002, 107, ETG 7-1–ETG 7-32. [Google Scholar] [CrossRef]
  31. Zhang, P.Z.; Deng, Q.D.; Yang, X.P.; Peng, S.Z.; Xu, X.W.; Feng, X.Y. Late Cenozoic tectonic deformation and mechanism along the Tianshan Mountain, Northwestern China. Earthq. Res. China 1996, 12, 127–140. (In Chinese) [Google Scholar]
  32. Deng, Q.D.; Feng, X.Y.; Zhang, P.Z.; Xu, X.W.; Peng, S.Z.; Li, J. Active Tectonics of Tianshan; Seismological Press: Beijing, China, 2000; p. 260. (In Chinese) [Google Scholar]
  33. Abdrakhmatov, K.Y.; Aldazhanov, S.A.; Hager, B.H.; Hamburger, M.W.; Herring, T.A.; Kalabaev, K.B.; Makarov, V.I.; Molnar, P.; Panasyuk, S.V.; Prilepin, M.T.; et al. Relatively recent construction of the Tien Shan inferred from GPS measurements of present-day crustal deformation rates. Nature 1996, 384, 450–453. [Google Scholar] [CrossRef]
  34. Wang, Q.; Zhang, P.-Z.; Freymueller, J.T.; Bilham, R.; Larson, K.M.; Lai, X.; You, X.; Niu, Z.; Wu, J.; Li, Y. Present-day crustal deformation in China constrained by global positioning system measurements. Science 2001, 294, 574–577. [Google Scholar] [CrossRef]
  35. Zubovich, A.V.; Wang, X.; Scherba, Y.G.; Schelochkov, G.G.; Reilinger, R.; Reigber, C.; Mosienko, O.I.; Molnar, P.; Michajljow, W.; Makarov, V.I.; et al. GPS velocity field for the Tien Shan and surrounding regions. Tectonics 2010, 29, TC6014. [Google Scholar] [CrossRef]
  36. Yang, S.; Li, J.; Wang, Q. The deformation pattern and fault rate in the Tianshan Mountains inferred from GPS observations. Sci. China Ser. D Earth Sci. 2008, 51, 1064–1080. [Google Scholar] [CrossRef]
  37. Gillespie, J.; Glorie, S.; Jepson, G.; Zhang, Z.Y.; Xiao, W.J.; Danišík, M.; Collins, A.S. Differential exhumation and crustal tilting in the easternmost Tianshan (Xinjiang, China), revealed by low-temperature thermochronology. Tectonics 2017, 36, 2142–2158. [Google Scholar] [CrossRef]
  38. Zhu, Z.H.; Ji, J.Q.; Xu, Q.Q.; Wang, L.N.; Sun, D.X.; Gong, J.F.; Zhao, L. The Late Cenozoic transpressional deformation and uplift of Bogda-Harlic Mountains. Chin. J. Geol. 2010, 45, 653–665. [Google Scholar]
  39. Bande, A.; Sobel, E.R.; Mikolaichuk, A.; Acosta, V.T. Talas–Fergana Fault Cenozoic timing of deformation and its relation to Pamir indentation. Geol. Soc. Lond. Spéc. Publ. 2015, 427, 295–311. [Google Scholar] [CrossRef]
  40. Bosboom, R.; Dupont-Nivet, G.; Huang, W.; Yang, W.; Guo, Z. Oligocene clockwise rotations along the eastern Pamir: Tectonic and paleogeographic implications. Tectonics 2014, 33, 53–66. [Google Scholar] [CrossRef]
  41. Devyatkin, E.V. Structures and Formational Complexes of the Cenozoic Activated Stage; Tectonics of the Mongolian People’s Republic; Nauka: Moscow, Russia, 1974; pp. 182–195. [Google Scholar]
  42. Ren, G.X.; Li, C.Y.; Sun, K. Late Quaternary activity and transpressinal deformation of the Karlik Tagh North Fault, easternmost Tianshan. Seismol. Geol. 2022, 44, 46–62. (In Chinese) [Google Scholar]
  43. Xiao, W.; Zhang, L.; Qin, K.; Sun, S.; Li, J. Paleozoic accretionary and collisional tectonics of the eastern Tianshan (China): Implications for the continental growth of central Asia. Am. J. Sci. 2004, 304, 370–395. [Google Scholar]
  44. Wu, F.Y.; Ran, Y.K.; Xu, L.X.; Cao, J.; Li, A. Paleoseismological Study of the Late Quaternary Slip-rate along the South Barkol Basin Fault and Its Tectonic Implications, Eastern Tian Shan, Xinjiang. ACTA Geol. Sin. (Engl. Ed.) 2017, 91, 429–442. [Google Scholar]
  45. Shen, T.; Ding, Y.; Wang, G.; Zhang, D.; Zhao, Z. Quaternary deformation along the Gobi-Tian Shan Fault in the Easternmost Tian Shan (Harlik Mountain), Central Asia. Remote Sens. 2024, 16, 3343. [Google Scholar] [CrossRef]
  46. Calais, E.; Vergnolle, M.; San’Kov, V.; Lukhnev, A.; Miroshnitchenko, A.; Amarjargal, S. GPS measurements of crustal deformation in the Baikal-Mongolia area (1994–2002): Implications for current kinematics of Asia. J. Geophys. Res. 2003, 108, 148–227. [Google Scholar] [CrossRef]
  47. Ma, J.; Chen, J.B.; Zhao, C.Q.; Liu, Z.J. Late Quaternary activity characteristics of YiWu fault in east Tianshan. Inland Earthq. 2021, 35, 87–92. [Google Scholar]
  48. Johnson, K.; Nissen, E.; Saripalli, S.; Arrowsmith, J.R.; McGarey, P.; Scharer, K.; Williams, P.; Blisniuk, K. Rapid mapping of ultrafine fault zone topography with structure from motion. Geosphere 2014, 10, 969–986. [Google Scholar] [CrossRef]
  49. Hanks, T.C. The age of scarplike landforms from diffusion-equation analysis. In Quaternary Geochronology: Methods and Applications; American Geophysical Union: Washington, DC, USA, 2000; Volume 4, pp. 313–338. [Google Scholar] [CrossRef]
  50. Zielke, O.; Arrowsmith, J.R. LaDiCaoz and LiDARimager-MATLAB GUIs for LiDAR data handling and lateral displacement measurement. Geosphere 2012, 8, 206–221. [Google Scholar] [CrossRef]
  51. Hetzel, R.; Hampel, A.; Gebbeken, P.; Xu, Q.; Gold, R.D. A constant slip rate for the western Qilian Shan frontal thrust during the last 200 ka consistent with GPS-derived and geological shortening rates. Earth Planet. Sci. Lett. 2019, 509, 100–113. [Google Scholar] [CrossRef]
  52. Hu, Z.; Yang, X.; Yang, H.; Huang, W.; Wu, G.; Miao, S.; Zhang, L. Slip rate and paleoseismology of the Bolokenu-Aqikekuduk (Dzhungarian) right-lateral strike-slip fault in the northern Tian Shan, NW China. Tectonics 2021, 40, e2020TC006604. [Google Scholar] [CrossRef]
  53. Nissen, E.; Walker, R.T.; Bayasgalan, A.; Carter, A.; Fattahi, M.; Molor, E.; Schnabel, C.; West, A.J.; Xu, S. The late Quaternary slip-rate of the Har-Us-Nuur fault (Mongolian Altai) from cosmogenic 10Be and luminescence dating. Earth Planet. Sci. Lett. 2009, 286, 467–478. [Google Scholar] [CrossRef]
  54. Vassallo, R.; Ritz, J.-F.; Braucher, R.; Carretier, S. Dating faulted alluvial fans with cosmogenic 10Be in the Gurvan Bogd mountain range (Gobi-Altay, Mongolia): Climatic and tectonic implications. Terra Nova 2005, 17, 278–285. [Google Scholar] [CrossRef]
  55. Vassallo, R.; Ritz, J.-F.; Carretier, S. Control of geomorphic processes on 10Be concentrations in individual clasts: Complexity of the exposure history in Gobi-Altay range (Mongolia). Geomorphology. 2011, 135, 35–47. [Google Scholar] [CrossRef]
  56. Zehfuss, P.H.; Bierman, P.R.; Gillespie, A.R.; Burke, R.M.; Caffee, M.W. Slip rates on the Fish Springs fault, Owens Valley, California, deduced from cosmogenic 10Be and 26Al and soil development on fan surfaces. Geol. Soc. Am. Bull. 2001, 113, 241–255. [Google Scholar]
  57. Nishiizumi, K. Preparation of 26Al AMS standards. Nucl. Instrum. Methods Phys. Res. Sect. B Beam Interact. Mater. Atoms 2004, 223, 388–392. [Google Scholar] [CrossRef]
  58. Huang, W.; Yang, X.; Jobe, J.A.T.; Li, S.; Yang, H.; Zhang, L. Alluvial plains formation in response to 100-ka glacial-interglacial cycles since the Middle Pleistocene in the southern Tian Shan, NW China. Geomorphology 2019, 341, 86–101. [Google Scholar] [CrossRef]
  59. Borchers, B.; Marrero, S.; Balco, G.; Caffee, M.; Goehring, B.; Lifton, N.; Nishiizumi, K.; Phillips, F.; Schaefer, J.; Stone, J. Geological calibration of spallation production rates in the CRONUS-Earth project. Quat. Geochronol. 2016, 31, 188–198. [Google Scholar] [CrossRef]
  60. Lal, D. Cosmic ray labeling of erosion surfaces: In situ nuclide production rates and erosion models. Earth Planet. Sci. Lett. 1991, 104, 424–439. [Google Scholar]
  61. Stone, J.O. Air pressure and cosmogenic isotope production. J. Geophys. Res. Solid Earth 2000, 105, 23753–23759. [Google Scholar]
  62. Hidy, A.J.; Gosse, J.C.; Pederson, J.L.; Mattern, J.P.; Finkel, R.C. A geologically constrained Monte Carlo approach to modeling exposure ages from profiles of cosmogenic nuclides: An example from Lees Ferry, Arizona. Geochem. Geophys. Geosyst. 2010, 11, 9. [Google Scholar] [CrossRef]
  63. Anderson, J.G. Estimating the seismicity from geological structure for seismic risk studies. Bull. Seismol. Soc. Am. 1979, 69, 135–158. [Google Scholar]
  64. Field, E. A summary of previous working groups on California earthquake probabilities. Bull. Seismol. Soc. Am. 2007, 97, 1033–1053. [Google Scholar] [CrossRef]
  65. Zhang, P.Z.; Molnar, P.; Xu, X. Late Quaternary and present-day rates of slip along the Altyn Tagh Fault, northern margin of the Tibetan Plateau. Tectonics 2007, 26, TC5010. [Google Scholar] [CrossRef]
  66. Sieh, K.E.; Jahns, R.H. Holocene activity of the San Andreas Fault at Wallace Creek, California. Geol. Soc. Am. Bull. 1984, 95, 883–896. [Google Scholar]
  67. Hancock, G.S.; Anderson, R.S. Numerical modeling of fluvial strath-terrace formation in response to oscillating climate. Geol. Soc. Am. Bull. 2002, 114, 1131–1142. [Google Scholar]
  68. Lague, D.; Hovius, N.; Davy, P. Discharge, discharge variability, and the bedrock channel profile. J. Geophys. Res. Earth Surf. 2005, 110, F04006. [Google Scholar] [CrossRef]
  69. Yao, W.Q.; Liu-Zeng, J.; Klinger, Y.; Wang, Z.J.; Shao, Y.X.; Han, L.F.; Wang, W.; Zhang, J.; Liu, Z. Late Quaternary slip rate of the Zihong Shan Branch and its implications for strain partitioning along the Haiyuan Fault, Northeastern Tibetan Plateau. J. Geophys. Res. Solid Earth 2022, 127, e2021JB023162. [Google Scholar] [CrossRef]
  70. Kirby, E.; Harkins, N.; Wang, E.; Shi, X.; Fan, C.; Burbank, D. Slip rate gradients along the eastern Kunlun fault. Tectonics 2007, 26, TC2010. [Google Scholar] [CrossRef]
  71. Meyer, B.; Tapponnier, P.; Bourjot, L.; Metivier, F.; Gaudemer, Y.; Peltzer, G.; Shunmin, G.; Zhitai, C. Crustal thickening in Gansu-Qinghai, lithospheric mantle subduction, and oblique strike-slip controlled growth of the Tibet plateau, Geophys. J. Int. 1998, 135, 1–47. [Google Scholar]
  72. Ren, G.X.; Li, C.Y.; Sun, K.; Zhou, C.; Luo, Q.X. Late Quaternary tectonic deformation characteristics of the Hami Basin North Fault, Eastern Tian Shan. Chin. J. Geophys. 2025, 68, 1315–1328. (In Chinese) [Google Scholar] [CrossRef]
  73. Gao, S.; Davis, P.M.; Liu, H.; Slack, P.D.; Zorin, Y.A.; Mordvinova, V.V.; Kozhavnikov, V.M.; Meyer, R.P. Seismic anisotropy and mantle flow beneath the Baikal rift zone. Nature 1994, 371, 149–151. [Google Scholar]
  74. Cobbold, P.R.; Davy, P.H. Indentation tectonics in nature and experiment II: Central Asia. Bull. Geol. Inst. Univ. Upps. 1988, 14, 143–162. [Google Scholar]
  75. Yang, Z.; Ding, D.X. The Balikun earthquake (M = 7.5) on June 11, 1842 in XinJiang. Northwest. Seismol. J. 1987, 9, 70–74. [Google Scholar]
  76. Xu, L.X.; Ran, Y.K.; Liang, M.J.; Wu, F.Y.; Gao, S.P.; Wang, H. Geometric distribution and characteristics of the surface rupture of two historical earthquakes in the Barkol Basin, XinJiang. Seismol. Geol. 2020, 42, 1–17. [Google Scholar]
  77. Grützner, C.; Carson, E.; Walker, R.T.; Rhodes, E.J.; Mukambayev, A.; Mackenzie, D.; Elliott, J.R.; Campbell, G.; Abdrakhmatov, K. Assessing the activity of faults in continental interiors: Palaeoseismic insights from SE Kazakhstan. Earth Planet. Sci. Lett. 2017, 459, 93–104. [Google Scholar] [CrossRef]
  78. Palumbo, L.; Hetzel, R.; Tao, M.; Li, X.; Guo, J. Deciphering the rate of mountain growth during topographic presteady state: An example from the NE margin of the Tibetan Plateau. Tectonics 2009, 28, TC4017. [Google Scholar] [CrossRef]
  79. Wells, D.L.; Coppersmith, K.J. New empirical relationships among magnitude, rupture length, rupture width, rupture area, and surface displacement. Bull. Seismol. Soc. Am. 1994, 84, 974–1002. [Google Scholar]
Figure 1. (a) Simplified map of the major active faults distribution in China and western Mongolia. (b) Tectonic setting of easternmost Tian Shan and southwest Mongolia. Detailed faults are inferred from [22] and from our interpretations of satellite imagery. Note that the yellow circels represent the epicenter of the earthquake with a magnitude of over 7.5 which occurred in eastern Tian Shan and Gobi Altai [25,26]. The GPS velocity field for this region is from [27] (referenced to stable Eurasia), which reveals consistent northeastward crustal motion (2–4 mm/yr) in easternmost Tian Shan. The active faults are marked by black solid lines. GTSFS: Gobi-Tian Shan Fault System; NKTF: North Karlik Tagh Fault; NGAFS: North Gobi Altai Fault System; HMNF: Hami north fault; J-BF: Jianquanzi-Barkol fault; FYF: Fuyun fault; BAF: Bolokenu-Aqikekuduk fault; BS: Bogda Shan; BT: Barkol Tagh.
Remotesensing 17 02498 g001
Figure 2. Geological and structural map of Karlik Tagh and the surrounding region, modified from a 1:200,000 scale geology map of Yiwu and Xiamaya. The background image is from 30 m resolution Shuttle Radar Topography Mission data. Major active faults are represented by red lines. Sites described in detail in the following text are marked by a yellow rectangle. The white squares indicate the location of a city or town. YW C.—Yiwu City, XMY T.—Xiamaya Town; YC T.—Yanchi Town. K V.—Kuotuogayi Village; fault segments are divided by dotted lines, Y. S: Yanchi segment; X. S: Xiamya segment. GTSFS: Gobi-Tian Shan Fault System; NKTF: North Karlik Tagh Fault.
Remotesensing 17 02498 g002
Figure 3. (a) Satellite image showing the fault trace of the Yanchi segment of the NKTF. The fault disturbed the alluvial fan surface and formed discontinued fault scarps. Red lines represent the fault trace. (bd) Field photos of the fault scarp. Yellow arrows represent the position of fault scarp.
Remotesensing 17 02498 g003
Figure 4. Fault geomorphic features at Site 1. Yellow or red arrows represent the fault traces (a) SfM-derived hillshade image of the fault. Black lines indicate the position of topographic profiles. (b) Field photo of the fault trace on the fan surface. (c) Outcrop of the fault plane. (d) Topographic profiles crossing the fault scarp.
Remotesensing 17 02498 g004
Figure 5. Fault geomorphic features at Site 2 of the Yanchi segment. (a) SfM-derived hillshade image of the fault. A spring is exposed in the midsection of the steep slope. Red lines indicate the positions of topographic profiles. (b) Geomorphic interpretation of the site. Two generation of alluvial fans are mapped for this site. White stars show the 10Be sampling site. (c) Topographic profiles crossing the fault scarp.
Remotesensing 17 02498 g005
Figure 6. Displaced geomorphic features of the fault at Site 3. (a) SfM-derived hillshade image. Red triangles show the fault trace on the alluvial fan surface. (b) SfM-derived contour map of Channel 1 and realignment of the horizontal displacement. (c) SfM-derived contour map of Channel 2 and realignment of the horizontal displacement. The red line represents the fault trace. Yellow and blue lines represent toporaphic profile of channel for offset measurement.
Remotesensing 17 02498 g006
Figure 7. Displaced river terraces at Site 4. (a) Hillshade map image derived from high-resolution (10 cm cell size) DEM showing that the fault offsets the Xiamaya River terrace left-laterally. The line between the two red arrows shows the fault trace on the surface. The bule and purple lines are the topographic profiles for the offset measurement across the terrace of both sides of the fault.The river flows northward. (b) Geomorphic interpretation, according to the height from the riverbed; three terraces are mapped. Orange represents the T3 terrace, green represent the T2 terrace, light green represents the T1 terrace, and light blue represents the riverbed (T0). White circles represent the sampling sites. (c) Field photo of the terrace of the east bank of the Xiamaya River. (d) Topographic profile across the river parallel to the fault trace.
Remotesensing 17 02498 g007
Figure 8. Reconstructions of the displacement of the T2/T3 riser on the eastern bank of the Xiamaya River. (a) Original topographic profile of cross-sections of the river; (b) Realignment of topographic profile of cross-sections of the river; (c) Realignment of T2/T3 riser. The red and blue line representthe upstream and downstream cross-sections of the river, respectively.
Remotesensing 17 02498 g008
Figure 9. (a) Shaded relief map of Site 3 showing a series of bulges along the fault trace which are interpretated as pressure ridges related to left-lateral slip motion. (b) Field photo of a pressure ridge in the field. (c) Topographic profile perpendicular to the fault trace. The a-a’ profile across a ridge shows a height of nearly 2 m, while the b-b’ profile shows negligible vertical displacement. The locations of the profiles can be seen in (a).
Remotesensing 17 02498 g009
Figure 10. (a) Overview of the west Xiamaya River, characterizing the linear fault trace. (b,c) Field photo of the pressure ridge on the alluvial fan surface. (d) Schistose in the Devonian strata, indicating thrust motion. Long arrows represent fault displacement characteristics, while short arrows indicate fracture traces.
Remotesensing 17 02498 g010
Figure 11. Outcrop photos of the Xiamaya segment of NKTF. (a) Fault trace along the Xiamaya segment from the Google Earth image. (b) Stone quarry and fault trace. The small hillocks above the ground surface are compression ridges, and the dashed rectangle indicates the location of the detailed photo. Red arrows indicate the fault trace. (c) The fault has displaced the black gravel layer and the grayish-white coarse sand layer, with a vertical displacement of 1.6 m; the attitude is 163°∠82°. (d) Fault plane, where the grayish-white coarse sand layer has thrust over the grayish-black gravel layer, forming a distinct fault surface with an attitude of 160°∠43°. Red arrows indicate the nature of fault movement.
Remotesensing 17 02498 g011
Figure 12. Depth profile results. (a) Interpretation of sedimentation (b) and pit photo at the T3 surface. (c) Field photo of the pit. The blue dots with error bars represent the 10Be concentrations sampled in each year. The black line surrounded by red is the best-fit solution.
Remotesensing 17 02498 g012
Figure 13. (a) Vertical slip rate of the Yanchi segment. The black square is from [42], using the vertical offset of the terrace of the channel versus luminescence age. (b) Left-lateral strike slip rate of the Xiamaya segment.
Remotesensing 17 02498 g013
Figure 14. Left-lateral strike-slip offset and evolution of strath terraces of the Xiamaya River. (a) The river incised into the original alluvial fan, forming terrace T3. (b) The fault sinistrally displaced T3 into the river path, and part of the displaced terrace was eroded. (c) The river incised further, forming terrace T2. (d) The fault sinistrally displaced T2 into the river path. However, since T2 is a strath terrace, the bedrock at its base was less affected by erosion. (e) The river continued to incise below the fluvial deposits, forming terrace T1. (f) The fault sinistrally displaced T1 into the river path. (g) The river completely eroded T1 on the eastern bank.
Remotesensing 17 02498 g014
Figure 15. (a) Distribution of active faults on easternmost Tian Shan; (b) Possible block 3D model across the Barkol across the Barkol Tagh; (c) Possible block 3D model across the Barkol across the Karlik Tagh. The 3D profiles A–A’ and B-B’ are extracted from DEM. The geological cross-section underground and the linkage of faults at depth are modified from [22]. HMNF-Hami Basin North Fault; KTNF–Karlik Tagh North Fault; GBTSFS–Gobi-Tian Shan Fault Systems; J-BF–Jianquanzarkol Fault.
Remotesensing 17 02498 g015
Figure 16. Geometry and kinematic model of the fault in easternmost Tian Shan and southern Gobi Altai. (a) Geometrics of the major fault and segmentation. BM: Bogda Mountain; BT: Barkol Tagh; KT: Karlik Tagh; NU: Nemegt Uul; GS: Gurvan Sayhan. (b) A simplified model of the geometrics of the fault. The fault location and geometry are inferred from interpretations of satellite image and references [21,22,28].
Remotesensing 17 02498 g016
Table 1. Results from the 10Be analysis.
Sample ID aLatitude (°N)Longitude (°E)Altitude (m)Depth (m)Thickness (cm)Quartz (g)10Be Carrier (mg)10Be Concentration (atoms/g)Exposure Age b (ka)Error
KAR-P0295.53276443.10978710491501030.35710.2281812,768181.2
KAR-P0395.53276443.1097871049901030.27360.23211,110,797
KAR-P0495.53276443.1097871049601030.8280.25351,347,753+8.8/−11.2
KAR-P0595.53276443.1097871049301030.6350.24681,673,081
KAR-0295.53276443.10978710490230.25590.23932,607,605
KAR-0495.5279643.11113410290230.22810.25352,125,579140.9±6.2
KAR-Y0194.28107343.28218921740230.5730.22682,580,603103.9±6.5
KAR-Y0294.28030743.28247321720230.47250.23051,900,59877.3±4.8
KAR-Y0394.30202743.27190921970230.73350.22532,735,180109.9±6.8
Notes: a KAR-Y01, Y02, and Y03 are boulder samples from the A2 surface at Site 2; KAR-P02, 03, 04, and 05 and KAR-02 are clast samples from the depth-profile on the T3 surface at Site 4; KAR-04 is clast sample from the T2 surface at Site 4. b The ages of 181.2 + 8.8/−11.2 are the fitted model ages determined by the depth profile method; the other ages are calculated using the CRONUS online calculator version 3.
Disclaimer/Publisher’s Note: The statements, opinions and data contained in all publications are solely those of the individual author(s) and contributor(s) and not of MDPI and/or the editor(s). MDPI and/or the editor(s) disclaim responsibility for any injury to people or property resulting from any ideas, methods, instructions or products referred to in the content.

