Article

Subauroral and Auroral Conditions in the Mid- and Low-Midlatitude Ionosphere over Europe During the May 2024 Mother’s Day Superstorm

by
Kitti Alexandra Berényi
1,2,*,
Veronika Barta
2,
Csilla Szárnya
2,
Attila Buzás
1,2,3 and
Balázs Heilig
2,3,4
1
HUN-REN-ELTE Space Research Group, H-1117 Budapest, Hungary
2
HUN-REN Institute of Earth Physics and Space Science, H-9400 Sopron, Hungary
3
Space Research Group, Department of Geophysics and Space Science, Institute of Geography and Earth Sciences, Eötvös Loránd University (ELTE), H-1117 Budapest, Hungary
4
Institute of Electrophysics, Kandó Kálmán Faculty of Electrical Engineering, Óbuda University, H-1034 Budapest, Hungary
*
Author to whom correspondence should be addressed.
Remote Sens. 2025, 17(14), 2492; https://doi.org/10.3390/rs17142492
Submission received: 4 June 2025 / Revised: 8 July 2025 / Accepted: 12 July 2025 / Published: 17 July 2025

Abstract

This study focuses on the mid- and low-midlatitude ionospheric response to the 2024 Mother’s Day superstorm, utilizing ground-based and Swarm satellite observations. The ground-based ionosonde measured F1, F2-layer, B0 and B1 parameters, as well as isodensity data, were used. The ionospheric absorption was investigated with the so-called amplitude method, which is based on ionosonde data. Auroral sporadic E-layer was the first time ever recorded at Sopron. Moreover, the auroral F-layer appeared at exceptionally low latitude (35° mlat, over San Vito) during the storm main phase. These unprecedented detections were confirmed by optical all-sky cameras. The observations revealed that these events were linked to the extreme equatorward shift of the auroral oval along with the midlatitude trough. As a result, the midlatitude ionosphere became confined to the trough itself. Three stages of F2-layer uplift were identified during the night of 10/11 May, each caused by different mechanisms: most probably by the effect of prompt penetration electric fields (PPEFs) (1), the travelling ionospheric disturbances (TIDs) (2) and the combination of electrodynamic processes and decreased O/N2 ratio (3). After a short interval of G-condition, an unprecedented extended disappearance of the layers was observed during daytime hours on 11 May, which was further confirmed by Swarm data. This phenomenon appeared to be associated with a reduced O/N2 along with the influence of disturbance dynamo electric fields (DDEFs) and it cannot be explained only by the increased ionospheric absorption according to the results of the amplitude method.

1. Introduction

Space weather events such as the May 2024 Mother’s Day Superstorm, caused by a series of interplanetary coronal mass ejections (ICMEs) and high-speed streams, induce hazardous perturbations in the coupled thermosphere–ionosphere–magnetosphere system. Analyzing such unique events offers valuable insight into the evolution of extreme geospace dynamics.
The Mother’s Day storm event originated from the solar active region classified as AR13664 [1], which produced at least four M-class flares and one X1.0 flare on 8 May 2024, followed by further strong solar flares (including six X-class flares) between 9 and 11 May, launching a series of fast ICMEs. For a detailed analysis of this storm, including a list of the ICMEs and their associated flares, see Spogli et al. [1]. Another study by Das et al. [2] examines the role of storm-time electric fields in the formation of the equatorial ionization anomaly (EIA) during this storm. Additionally, Aa et al. [3] investigate the expansion and merging of the EIA in the American and Atlantic longitude sectors through multi-instrumental data analysis. Further aspects of this event have been studied by [4,5,6,7,8,9,10,11,12,13,14,15].
When an ICME collides with Earth’s magnetic field, it triggers a geomagnetic storm. The resulting disturbance in the ionosphere is referred to as an ionospheric storm, which is traditionally classified into two types: positive and negative ionospheric storms, depending on whether the storm causes an increase or decrease in the electron density in the ionospheric layers, respectively [16,17]. Their effects can last from 1 to 10 days. There are several comprehensive reviews and studies on the potential physical and chemical mechanisms that may arise during ionospheric storms (see, e.g., [16,17,18,19,20,21,22,23] and references therein).
The ionosphere interacts with the plasmasphere through plasma diffusion and transport processes. Magnetospheric phenomena, such as field-aligned currents (FACs), particle precipitation, plasma drifts, and enhanced electric fields near the plasmapause (PP), are closely linked to ionosphere dynamics. For example, the ionospheric footprint of the nightside PP was found to be aligned with the midlatitude ionospheric trough (MIT) minimum [24] and the equatorward boundary of small-scale FACs ([25,26]). These boundaries are highly sensitive to geomagnetic activity.
This article examines the ionospheric F-layer, which splits into F1 and F2 sublayers during daylight. The F1-layer’s electron density is primarily induced by solar radiation, while the F2-layer is more affected by transport processes driven by neutral winds or electric fields [27]. The F2-layer’s peak density (NmF2) usually surpasses that of the F1-layer (NmF1). However, under special conditions (called G-conditions), such as intense geomagnetic storms, the F1-layer can blanket the F2-layer due to the latter’s electron density dropping below the former’s [28,29], with an occurrence rate of ~0.34% [30]. Auroral reflections, another unique feature, appear on ionograms at low- and mid-latitudes only during the strongest geomagnetic storms [29,31].
By employing ground-based Digisonde as well as Swarm satellite data, this study aims to identify the primary mechanisms responsible for the observed mid-latitude ionospheric perturbations arising due to the Mother’s Day superstorm. Extreme geomagnetic storms, like the Mother’s Day Superstorm, occur on average once in a solar cycle, providing a unique opportunity for studying the ionospheric response to such extraordinary conditions. Good quality Digisonde data in Europe and Swarm data were not available when the last same magnitude superstorm occurred in October/November 2003.
The rest of the paper is organized as follows: Section 2 introduces the data utilized for this study, Section 3 presents the observations, and Section 4 provides the discussion. Finally, Section 5 summarizes the results and concludes the paper.

2. Data and Methods

Manually scaled ionograms from Sopron, Hungary (SO148, quasi-dipole geomagnetic coordinates: 43.95°N, 90.69°E) and San Vito, Italy (VT139, geomagnetic coordinates: 35.94°N, 90.72°E) Digisonde stations [32,33,34] were analyzed. Key ionospheric parameters, including foF1, foF2, h’F1, and h’F2, which represent peak electron density and maximum layer altitude, were examined. Monthly median values of foF1, foF2, h’F2 and h’F2 were calculated to use them as references for each station. The time resolution is 5 min for Sopron (SO) and 7.5 min for San Vito (VT). In addition, Digisonde-derived B0 and B1 parameters were used, where B0 shows the height difference between hmF2 and the height where the electron density has dropped down to 0.24·NmF2 (maximum of electron density in the F2 layer) [29]. B1 characterizes the shape of the electron density profile: the larger B1 is the larger are the electron densities right below the F2 peak from hmF2 (F2 layer peak height) down to (hmF2 − B0) [29,35]. See more about the calculation and usage of B0, B1 parameters in the article of [36,37]. Figure A10 shows all the stations used in this study.
In addition, the manually scaled data of the ionosondes, the received amplitudes at SO and VT stations, were also taken into account to determine the ionospheric absorption changes. At every sounding, the amplitude values were taken in the following frequency bins: 2, 2.5, 3, 3.5, 4, 4.5, 5, and 5.5 MHz +/−200 kHz, respectively. From these amplitudes, the relative loss of the electromagnetic signal was estimated according to the following equation based on the Friis Transmission Formula (for a more detailed explanation see [38]):
10 lg ( L ) = 10 lg ( P t G t G r ) + 20 lg ( λ 4 π 2 h ) 10 lg ( P r )
In Equation (1), the known terms are λ (the wavelength of the received signal), h (height of the reflection), and Pr which is the power of the receiver. If we would like to calculate L, which is the loss in dB units, we have to determine the PtGtGr (power of the transmitter, gain of the transmitter, and gain of the receiver, respectively) product first. To do so, one can estimate that during nighttime, under quiet solar conditions, the loss is relatively “zero” (that is the reason that this method can only be used for the 2–5.5 MHz frequency range, where there is reflected signal from the F-layer during nighttime, too, the method is described in more detail in Buzás et al. [38]). With this assumption, we calculated the PtGtGr product based on Equation (1) for SO and VT stations using nighttime data from 173 quiet days in 2019 and 2020 (the same days as described in the Supplementary Material of Buzás et al. [38], just for the years of 2019 and 2020). With the PtGtGr product now established for each station, we can calculate the loss during the investigated period, which is proportional to the relative ionospheric absorption [38]. Subsequently, the absorption values are compared to the X-ray and integrated proton fluxes as measured by the GOES-16 satellite. The X-ray and integrated proton fluxes and the absorption values are determined as a median diurnal variation of three quiet days around the storm (24–26 May 2024) for the sake of better comparison.
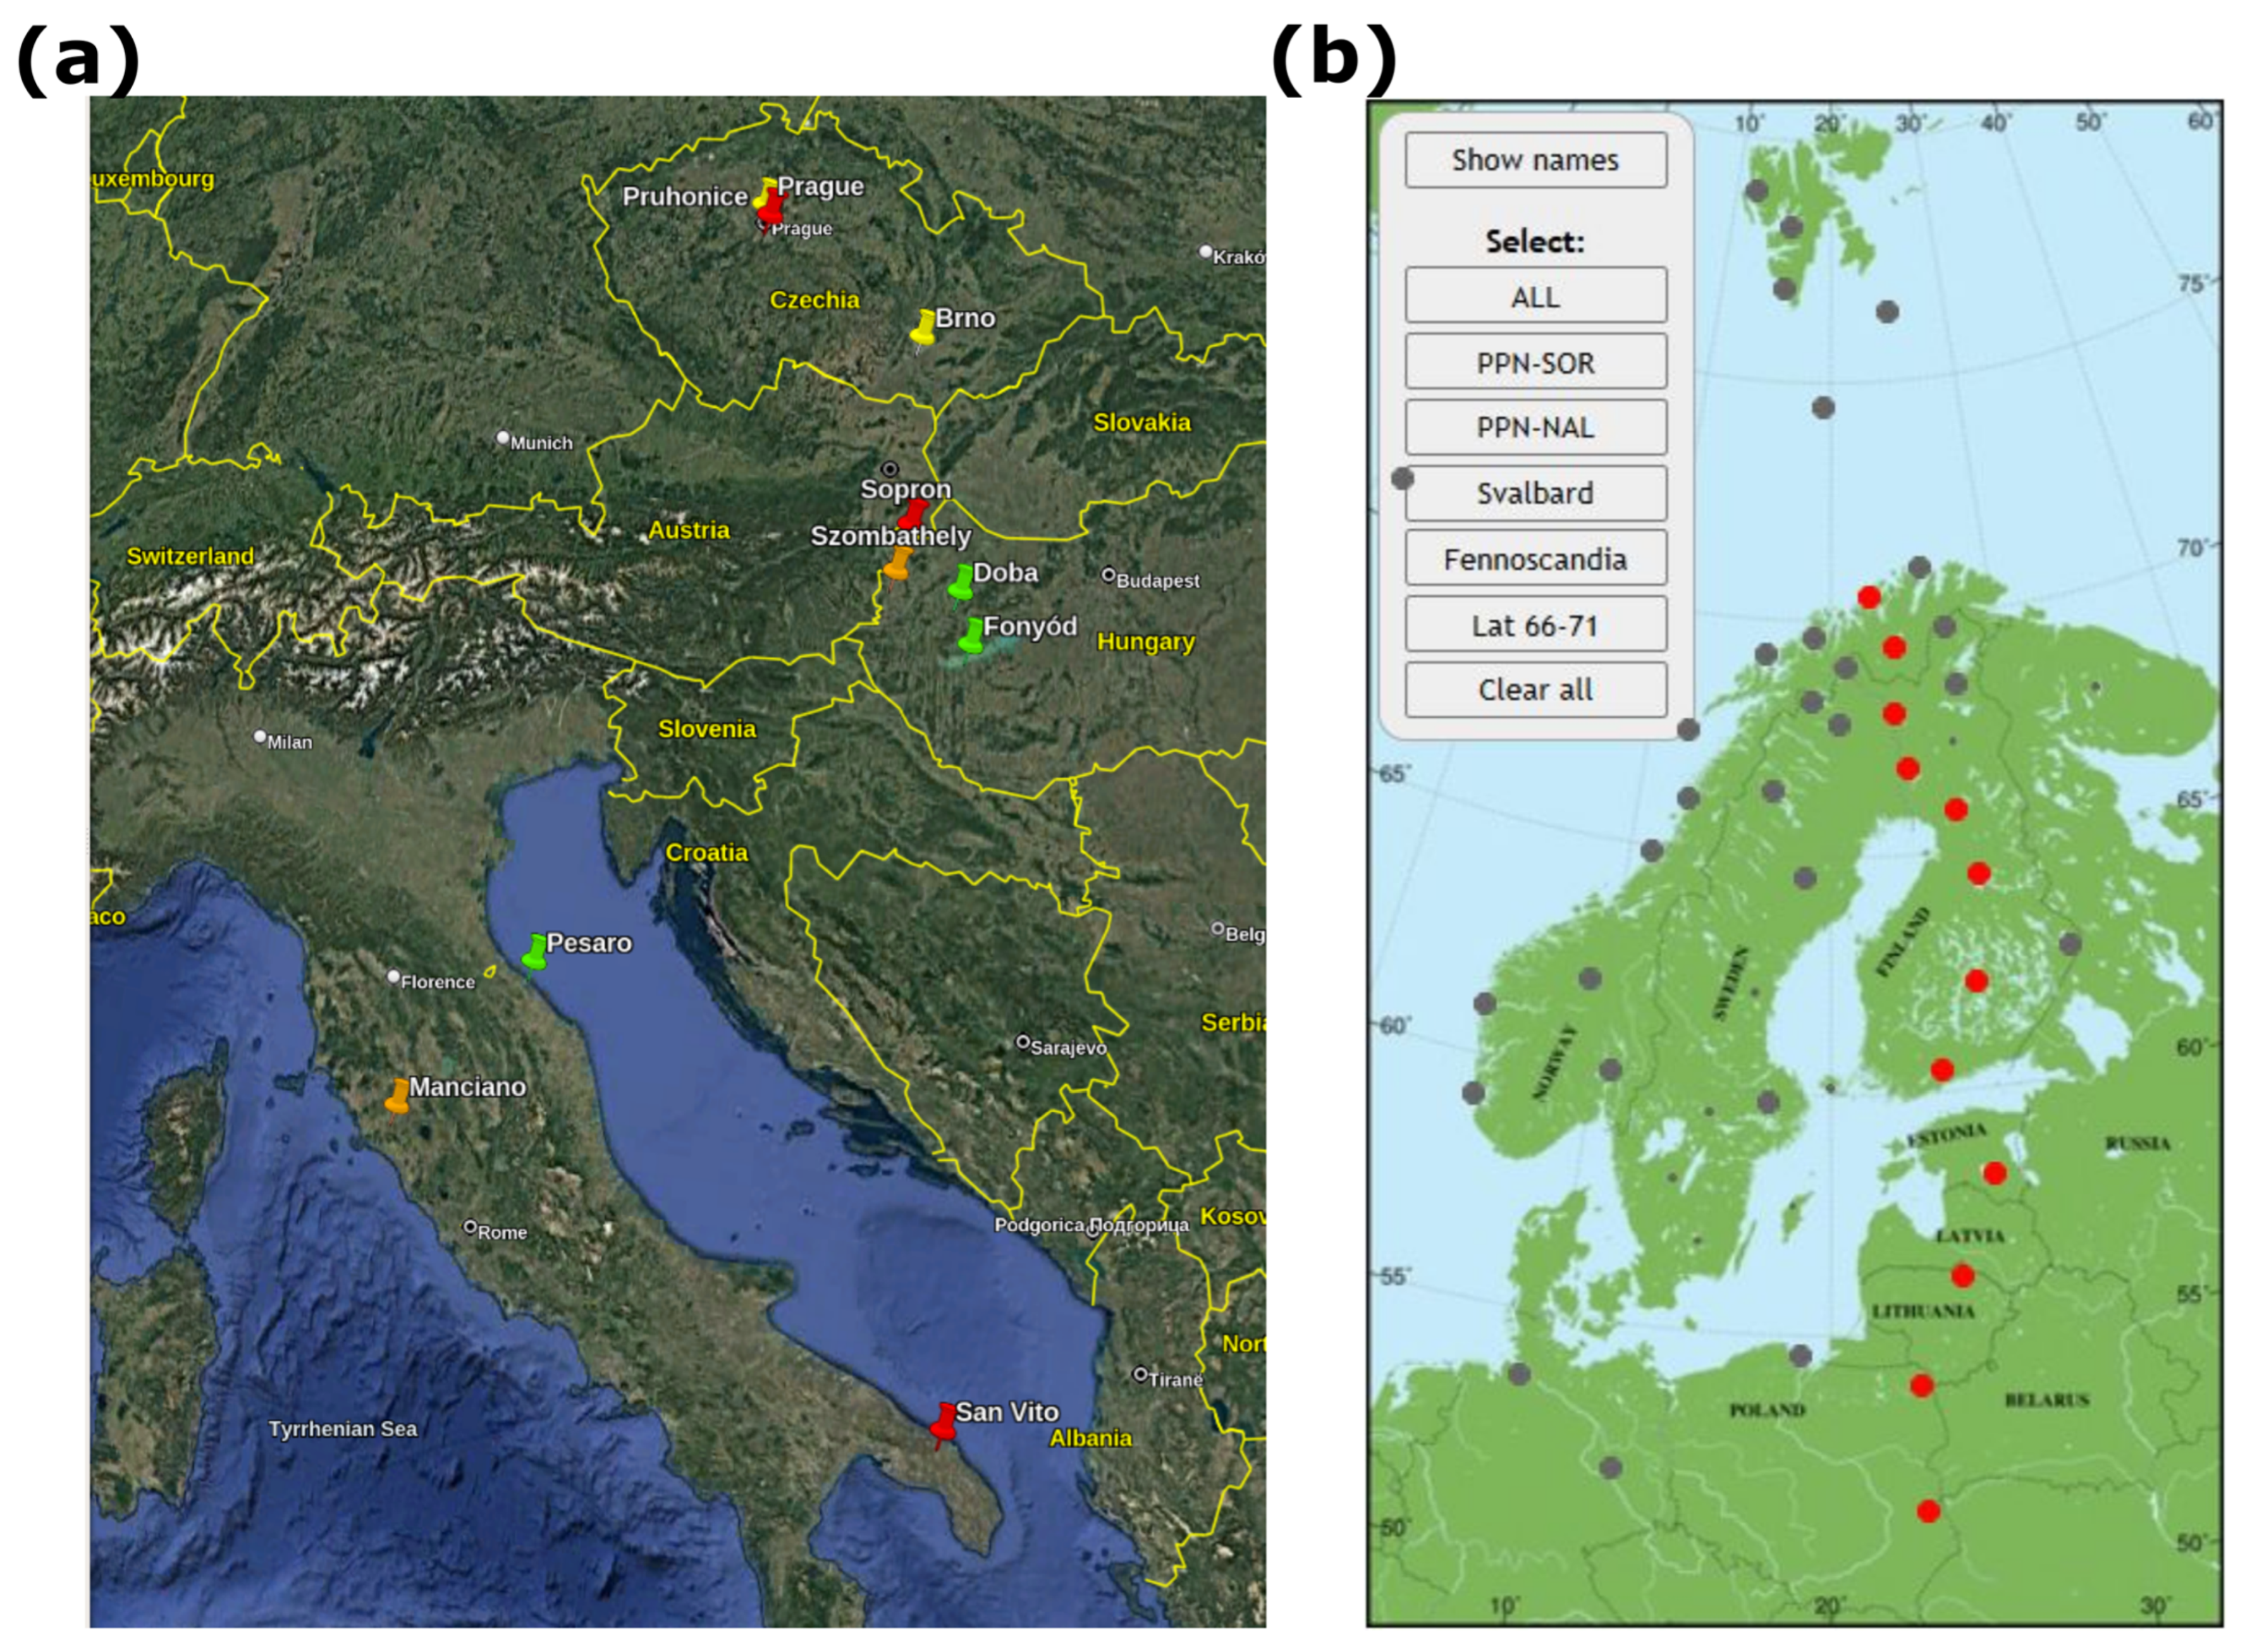
For the analysis of the auroral region’s storm-time condition, we used the IE, IU and IL indices (source: https://space.fmi.fi/image/www/il_index_panel.php (accessed on 8 July 2025). These auroral electrojet indicators are simple estimates of the total eastward and westward currents crossing the magnetometer network [39,40], managed by the International Monitor for Auroral Geomagnetic Effects (IMAGE), described by [41]. The definition for IE, IU and IL is like the standard AL, AU, and AE indices [42]. For our study, the data of the so-called PPN–SOR meridional station chain, namely the SOR, MAS, MUO, PEL, RAN, OUJ, HAN, NUR, TAR, BRZ, SUW, PPN stations, were used (Figure A10b).
Swarm satellite observations [43,44] provided a global context for the local ground-based data. During the analyzed period, Swarm C orbited at ~476 km altitude, and Swarm B at ~516 km, both with a 95-min orbital period. The study examined in-situ plasma electron density and temperature from Langmuir probes, vertical total electron content (vTEC) integrated between Global Navigation Satellite System (GNSS) and Swarm satellite altitudes, small-scale FAC (ssFAC) density from magnetic field data [26], and the MIT location, which aligns with the nightside plasmapause footprint [24]. Detailed information on these data products is available in the Swarm Product Data Handbook at https://swarmhandbook.earth.esa.int (accessed on 8 July 2025).
Global Ultraviolet Imager (GUVI) measurements from the Thermosphere, Ionosphere, Mesosphere, Energetics and Dynamics (TIMED) satellite were used to investigate the changes in the thermospheric O/N2 ratio. GUVI measurements provide dayside O/N2 composition (note that this is a column integrated value for an altitude range) and temperature profile of the Mesosphere and Lower Thermosphere/Ionosphere (MLTI) region, as well as the auroral energy inputs (see more in [20]).

3. Observations

The storm under investigation, also referred to as the Gannon Superstorm [45], commenced at 17:05 UT (sudden storm commencement–SSC time) on 10 May 2024 [46]. Following a brief initial phase with positive Dst, the main phase began at 18:04 UT and lasted until Dst reached its minimum (−412 nT) at 02:00 UT on 11 May. During the subsequent recovery phase, Dst gradually returned to pre-storm values. Figure 1 displays the Bz and By component of the Interplanetary magnetic field (IMF), the IU, IL indices and the Dst, Kp indices during the evolution of the storm. This study considers the 10–12 May interval, including a pre-storm period, the initial, main, and the early recovery phases of the event.
The temporal evolution of the Kp index is shown in Figure 1d. Following the SSC, the Kp value jumped close to 8 from the pre-storm 4-, and then oscillated between 8–9 until the evening of 11 May.

3.1. Digisonde Measurements

3.1.1. Overall Storm-Time Condition in the Ionosphere

Figure 2 illustrates the Digisonde observations of the F1- and F2-layers with their monthly median values, highlighting G-condition, the “fade-out” and auroral F- and Es-layer intervals. Following the SSC, the F2-layer’s electron density drastically decreased at both stations until 04:50 UT at SO and 04:07 UT at VT on 11 May, when the G-condition emerged. At SO, G-condition intervals were observed at 04:50–07:05 UT, 14:30–14:50 UT, and 16:10 UT (marked by magenta bars on Figure 2), while at VT, they occurred at 04:07:30–08:00 UT, 14:15–15:00 UT, and 16:07:30 UT.
These intervals were followed by peculiar total “fade-out” periods, where all ionogram traces disappeared. At SO, the exceptional “fade-outs” occurred from 07:10–14:10 UT and 15:05–16:05 UT, while at VT, they spanned 08:07:30–14:07:30 UT and 15:07:30–16:00 UT. Notably, the “fade-out” began one hour later at VT than at SO, though their end times coincided. Before the “fade-out,” the F2-layer rose to an extreme altitude (h’F2 > 800 km at VT and >1000 km at SO), while the F1-layer rapidly descended (below 250 km), see Figure 2b,d. An unusually fast recovery in ionospheric electron density was observed on 12 May.
To quantify the storm-time changes in respect to the quiet day level in percentage value, the so-called deltafoF1, deltafoF2, and deltahF1 and deltahF2 parameters were calculated using the well-known equation from previous studies, e.g., [47,48]:
d e l t a f o F 2 = f o F 2 s t o r m f o F 2 q u i e t f o F 2 q u i e t     100 %
On Figure A1 the calculated deltafoF1, deltafoF2, deltahF1, and deltahF2 parameters are shown. In Appendix A section the detailed description of the results can be found. In conclusion, the height values in percentage in Figure A1b,d show quite the same pattern as in Figure 2b,d in the virtual height data.
Section 3.1.3 below describes in detail the nighttime uplift phases on 10/11 May.

3.1.2. Auroral Conditions

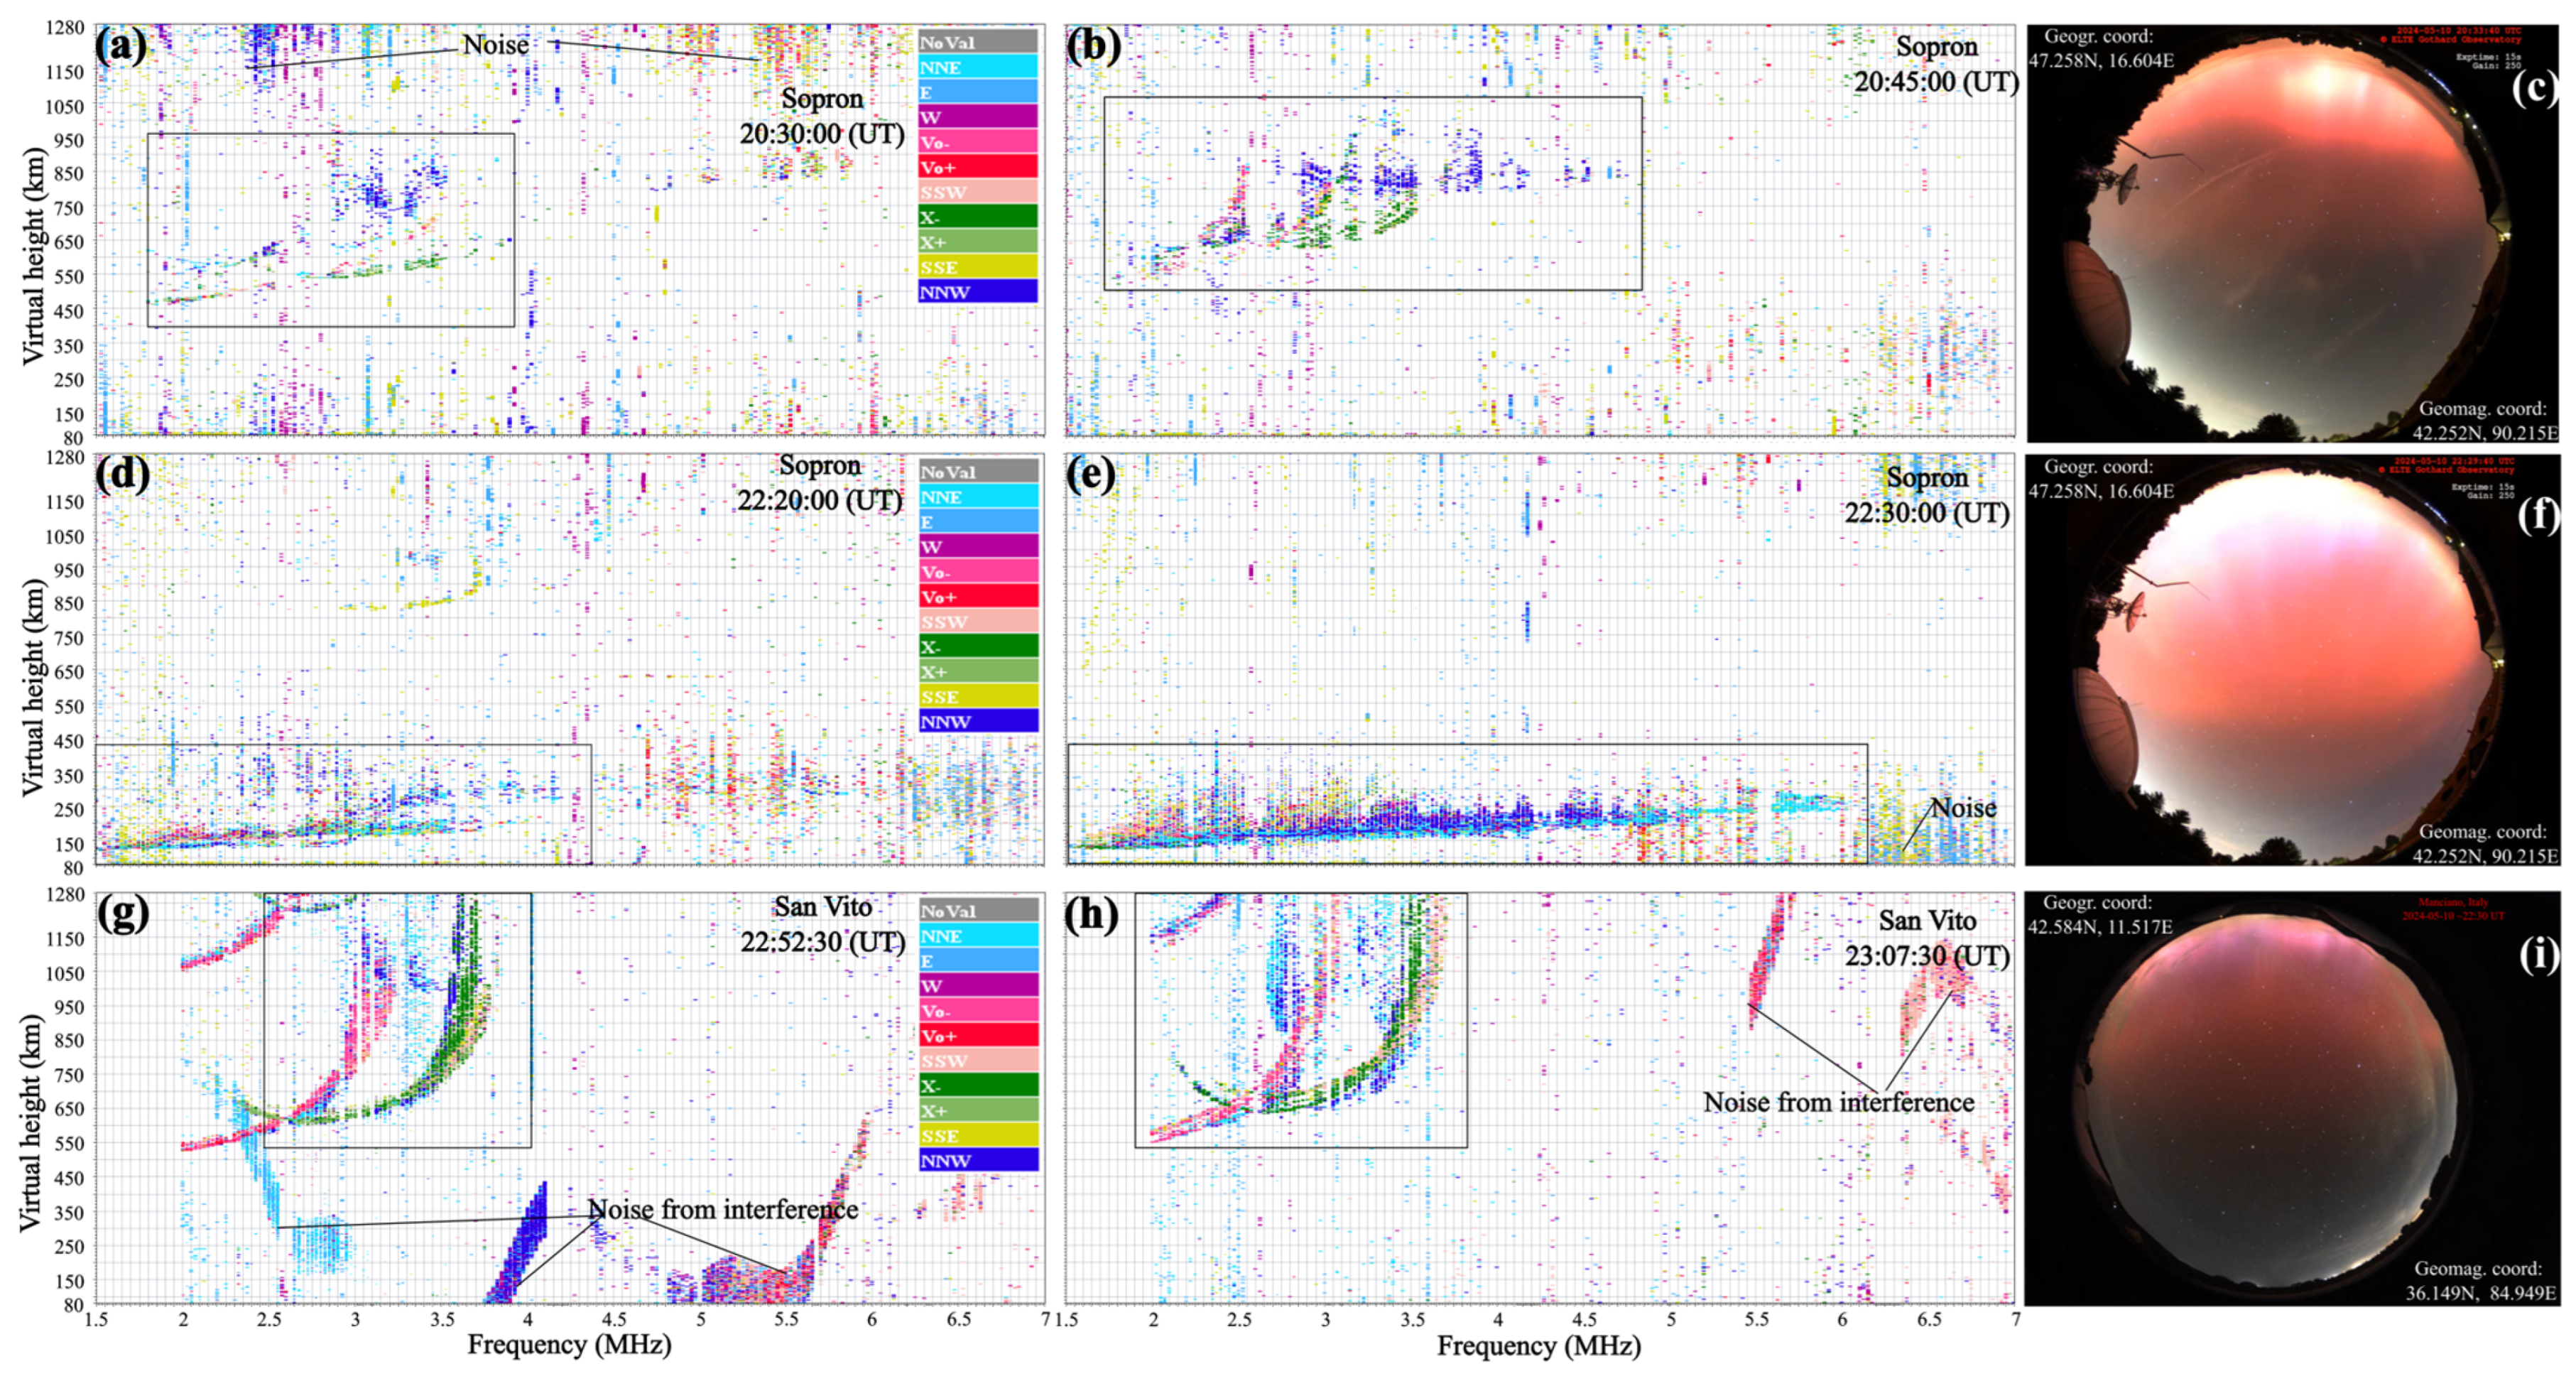
The appearance of auroral layers on mid- and low-midlatitude ionograms makes this event exceptional. The equatorward shift of the auroral oval (AO) is evident in ionograms (Figure 3), including the first-ever recorded auroral sporadic E at SO. Auroral F-layer intervals, typically seen at high latitudes, were observed from 20:30 to 04:45 UT at SO and 22:07:30–03:52:30 UT at exceptionally low latitude, at VT on the night of 10/11 May (green bars in Figure 2a–d).
Using the four cross-loop receiver antennas of the Digisonde systems, the direction (vertical and azimuthal) and polarization of the echoes were analyzed [29,49,50]. At 20:30 UT, SO ionograms indicated auroral activity in the F-layer, with oblique spread reflections from north–northeast (NNE, faint blue) and north–northwest (NNW, dark blue) directions (Figure 3a,b). At this time, only a reddish aurora, with an elevation angle of ~46°, was visible with optical all-sky cameras from Szombathely, Hungary (Figure 3c), suggesting the southern edge of the oval may have crossed 49.45°N mlat, the Prague–Krakow line (the detailed calculation steps are in Appendix B section and see also [51,52]). By 22:15 UT, a green aurora was also observed from Doba, Hungary (see Figure A9b), with an elevation angle of ~40° (corresponding to the latitude of Brno, 48.27°N mlat, map of Figure A10a). The red aurora reached the zenith at ~22:30 UT, extending to ~40° mlat (Figure 3f).
Auroral sporadic E appeared on ionograms by this time (Figure 3d,e) as a diffuse, rising trace [53]. Reflections from auroral ionization, including spread signals and oblique echoes from NNE/NNW, confirmed that the northern lights reached SO’s latitude (43.95°N mlat). The auroral intensity was remarkable, it was optically detected from Pesaro, Italy (22:52 UT, 39.48°N mlat, Figure A9c and Figure A10) and after the horizontal distance calculation, the aurora line was above Manciano, Italy (mlat 36.14°N, see Appendix B section and Figure A10). San Vito’s ionograms also recorded auroral ionization as spread-F and oblique reflections from NNW and NNE directions (Figure 3g,h).

3.1.3. The Three Identified F-Layer Uplift Phases

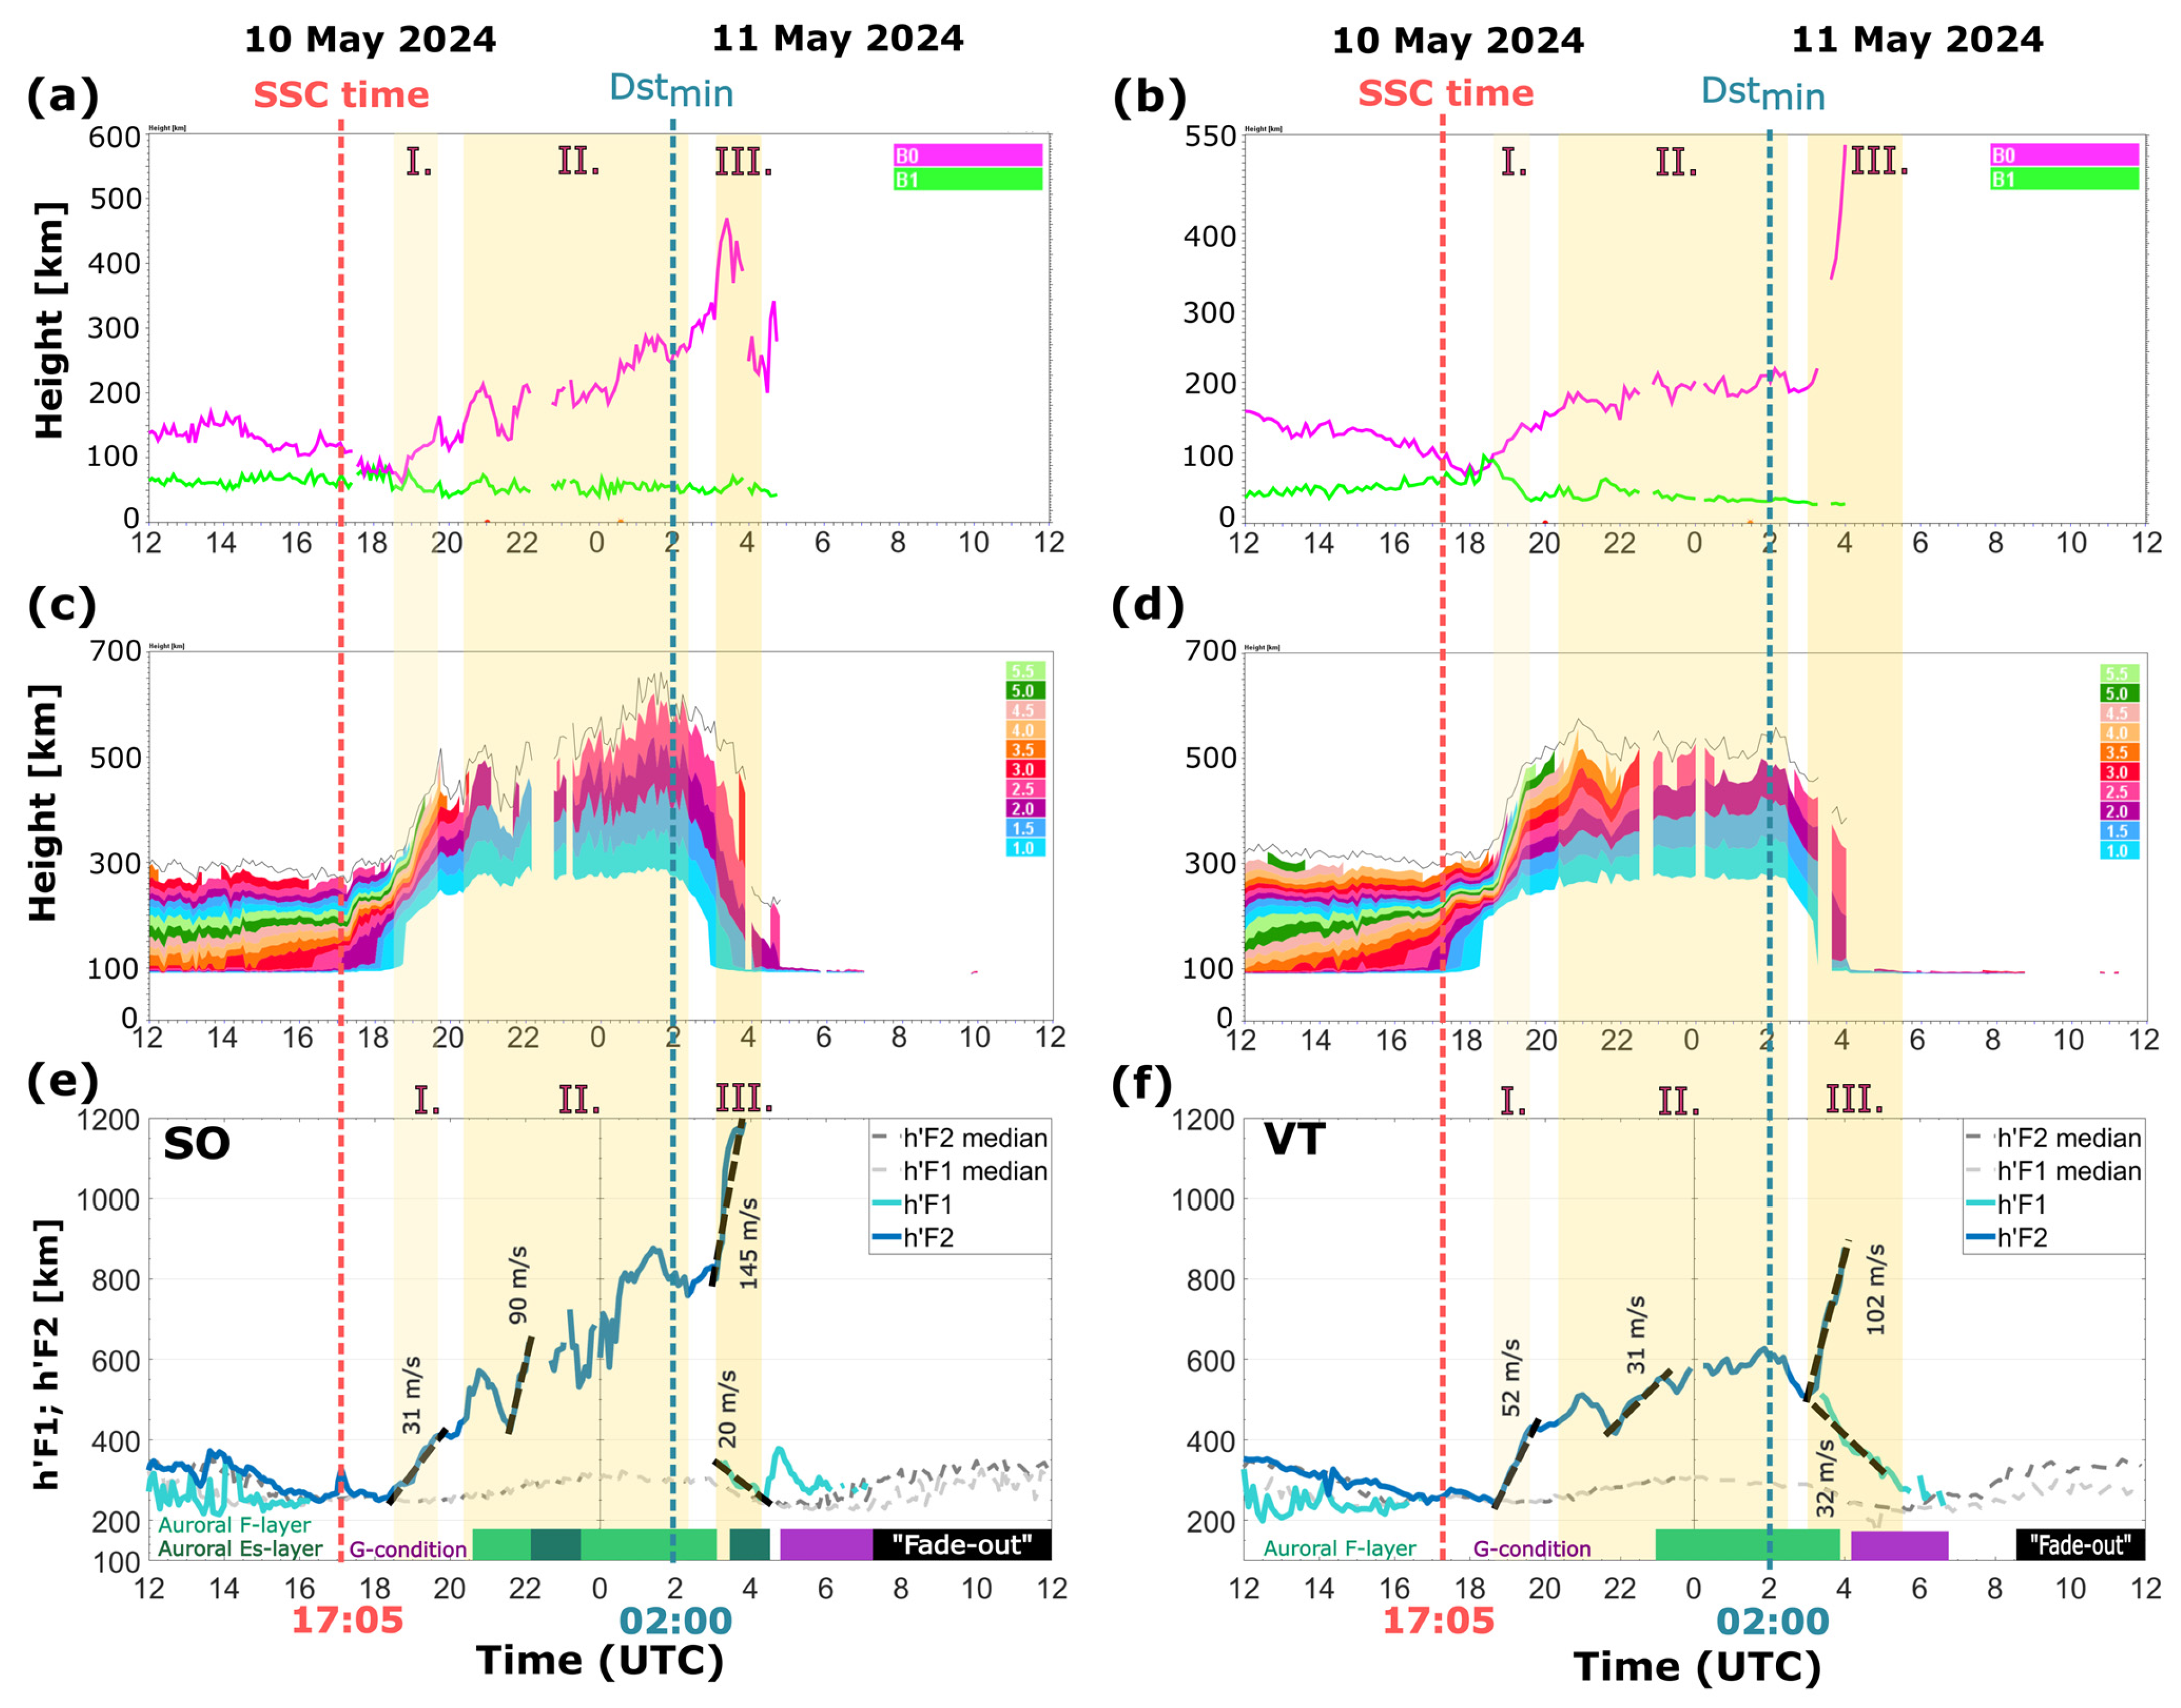
On Figure 4 we are focusing on the ionospheric layer uplift phases during the night of 10/11 May using the B0, B1, the isodensity and the h’F, h’F2 parameter data. At first, the uplift phases were identified in virtual height data (Figure 4e,f). The Digisonde-derived B0 and B1 parameters can be used as indicators for rapid ionospheric changes, which appears as a modification of the shape of the electron density profile. In Figure 4a,b, it seems to be clear that the B0 (thickness parameter) is strongly modified by the geomagnetic storm in the main phase. Our results also strengthen the conclusion of [29,37], that the B0 parameter is the most affected by space weather effects. The B1 parameter does not show any significant variability during storm conditions. Interestingly the three uplift phases are also nicely seen in the B0 parameter variability (Figure 4a,b).
The isodensity contours in Figure 4c,d are commonly used to investigate wave-like perturbations in the ionosphere, like large-scale Travelling Ionospheric Disturbances (LSTIDs), see e.g., the paper of [54,55]. LSTIDs mostly occur during geomagnetic storms and appear in the ionosonde data as height variations of the ionospheric layers in time. The second uplift phase identified in Figure 4e,f is such a wave-like variability of the layers, which most probably connected to LSTIDs. Isodensity and B0 data strengthen this possibility at both stations. The third identified uplift phase is the clearest in virtual height data (Figure 4e,f), therefore, those parameters are the most suitable for the investigation of that type of uplift variation during storms.

3.1.4. Ionospheric Absorption Investigation

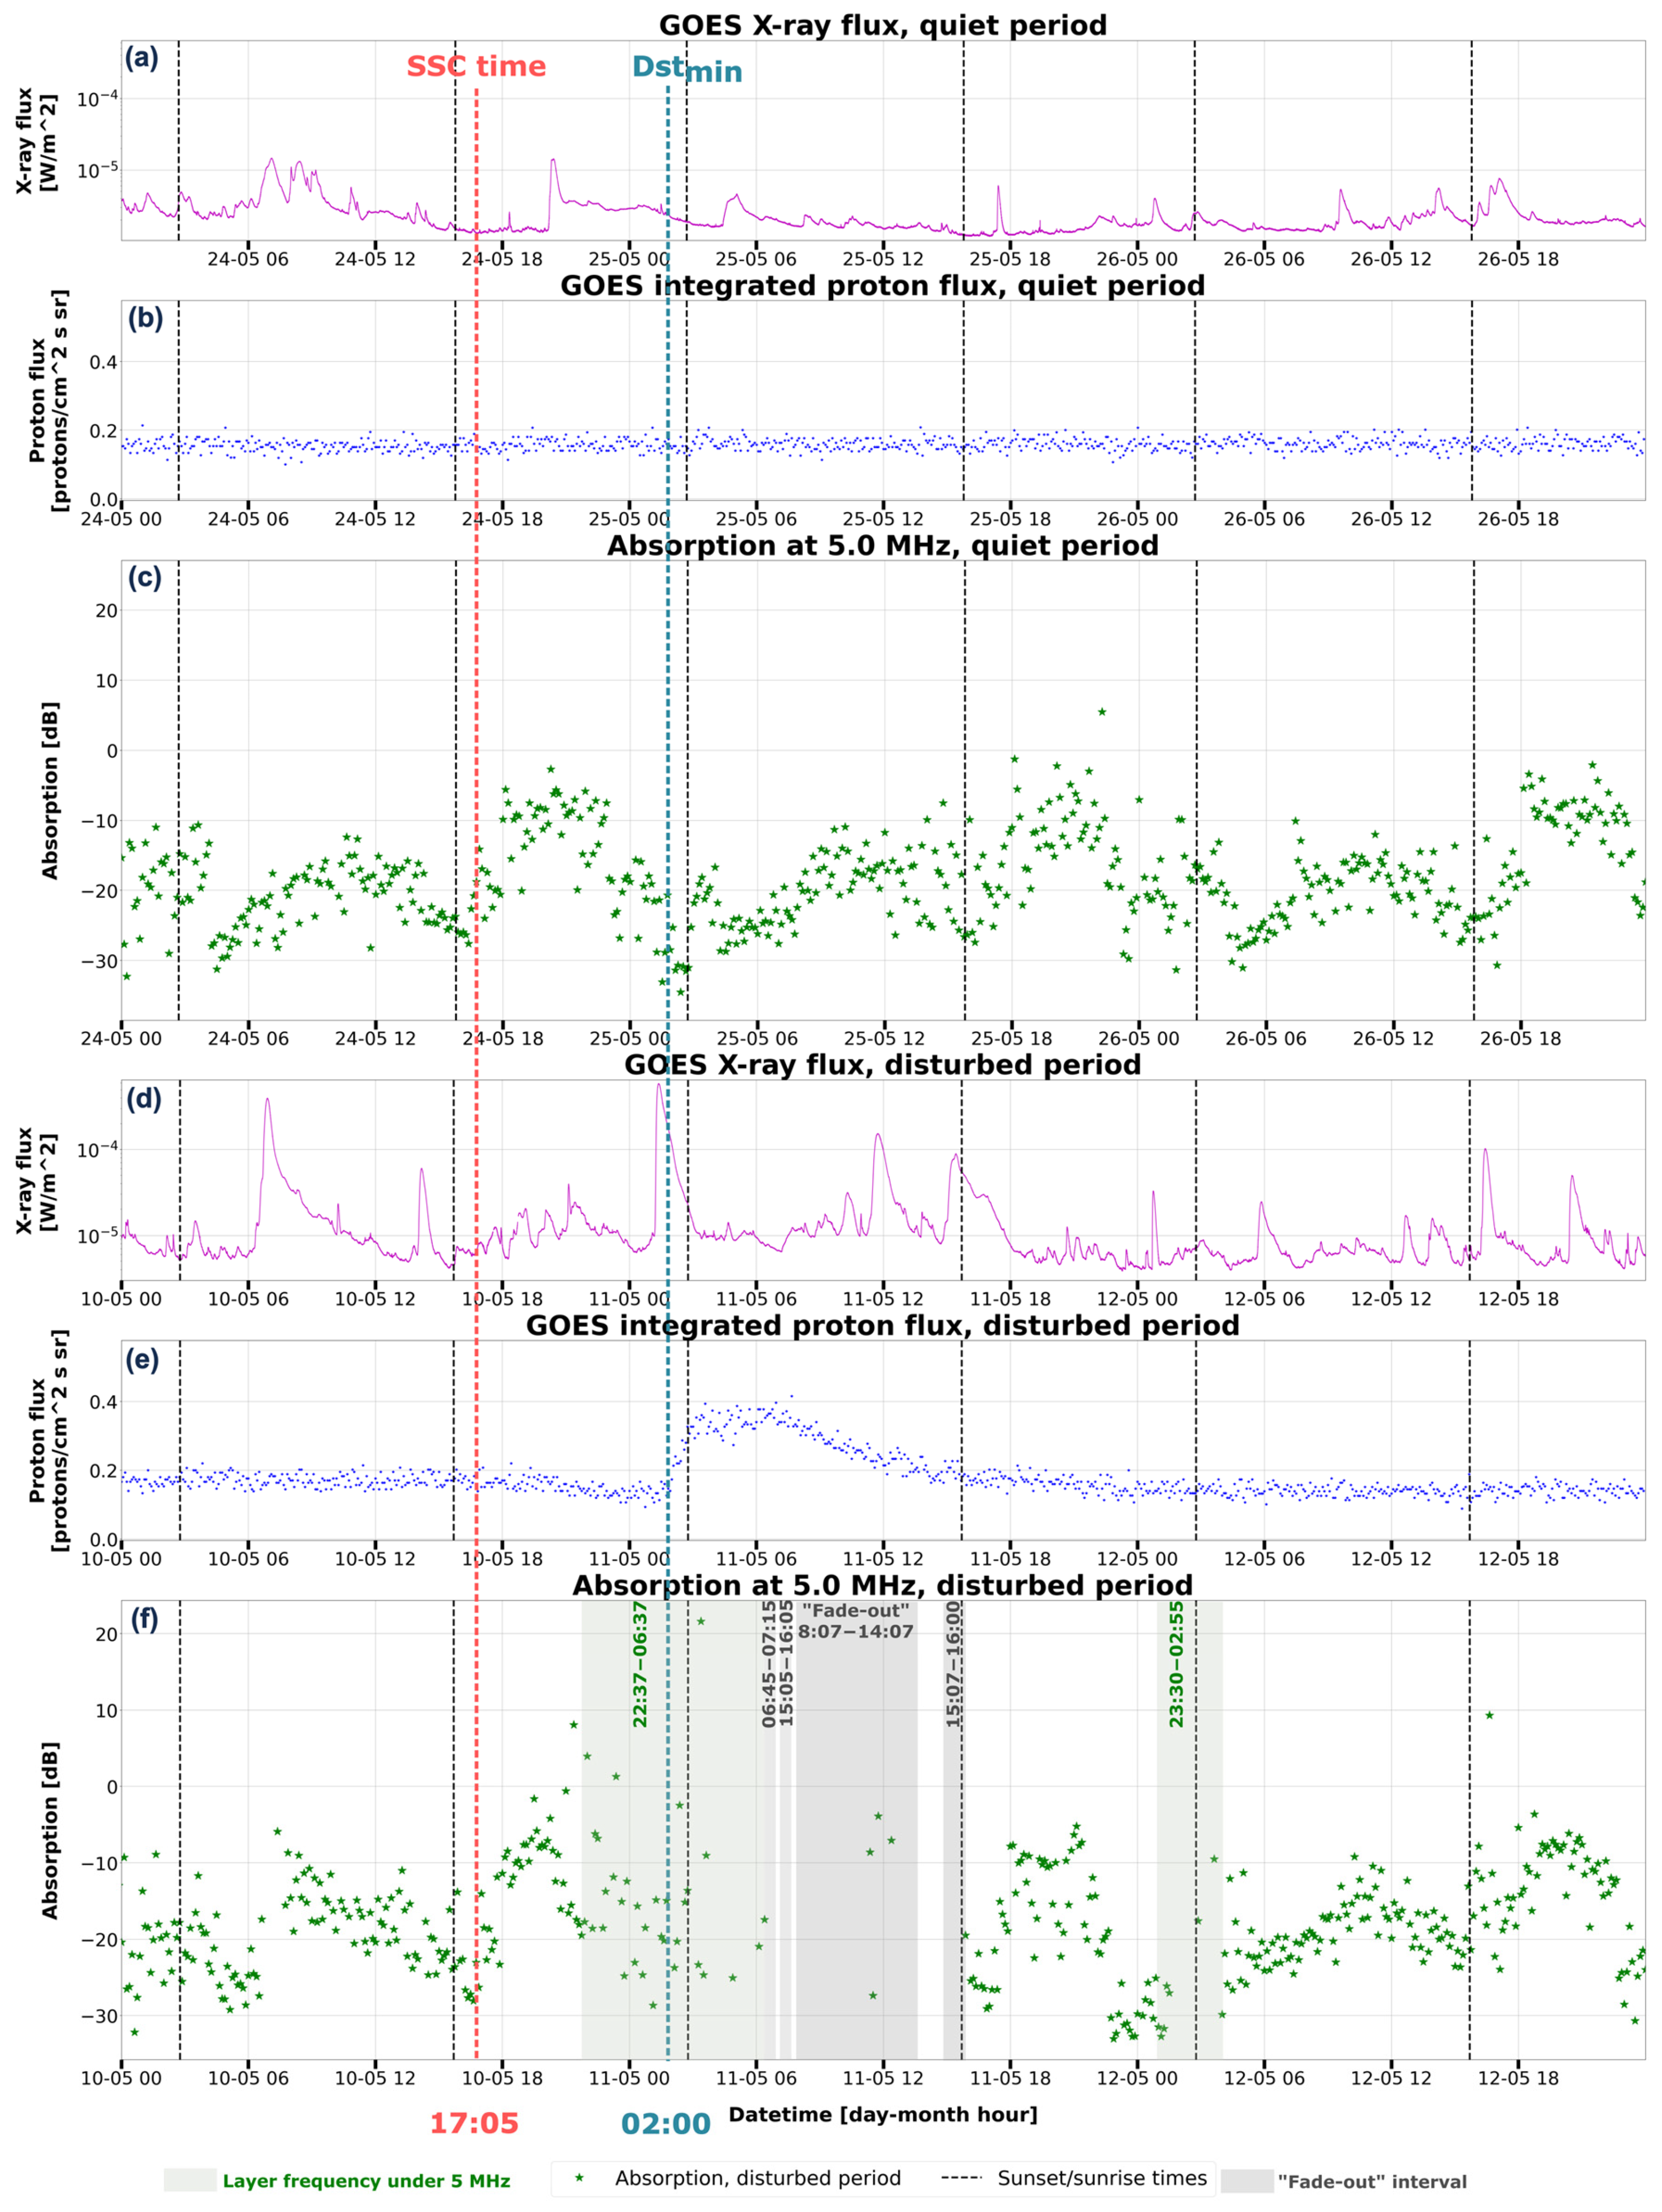
During the above listed periods of the “fade-out”, not only the F1 and F2 layers disappeared from the ionograms at the investigated stations but the E layer as well. A known reason for the fade-out phenomena, especially in the lower frequency range (1–5 MHz), is the increased absorption occurring in the lower ionosphere caused by enhanced X-ray or proton flux (see e.g., [56,57]). During this Mother’s Day storm period, the background X-ray flux was quite high. Furthermore, several strong solar flares were registered, consequently the ionospheric absorption is probably also increased (see the article of [58] for the list of the incident flares). To investigate the reason for the fade-out in the current case, the “amplitude method” [38] has been applied for the ionosonde data recorded at SO and VT during the studied period (Figure 5 and Figure A9). Figure 5 shows the X-ray and proton flux, furthermore, the absorption detected at 3 MHz at SO during 3 consecutive reference days (upper 3 subplots) and during the time of the geomagnetic storm (lower 3 subplots). The daily variation of the absorption can be clearly recognized in the data measured during the reference days (Figure 5c). The time of the “fade-out” is indicated by dark grey, while the periods when the maximum frequency of the F layer (foF2 or foF1) was below 3 MHz are indicated by faint grey shadow. Increased values of the absorption can be seen in the early morning hours and before the “fade-out” (02–06 UT) on 11 May (Figure 5f). The period of enhanced absorption agrees well with the time when the integrated proton flux increased according to the GOES data (Figure 5e). It is also important to note that the X-ray flux was increased as well throughout the day on 11 May (Figure 5d, time of terminators are indicated by black dashed lines). In summary, according to the results of the current analysis, we cannot exclude that the increased absorption caused by the enhanced proton and X-ray flux (during the early morning hours and the whole day, respectively) has an important role in the disappearance of the E-layer from the ionograms during the fade-out period.

3.2. Swarm Measurements

The electron density during the pre-storm and storm period (9–15 May 2024), observed by Swarm B at MLT = 23.5, is presented in Figure 6. Dotted red and blue lines mark the SSC and Dst minimum times, respectively. The quasi dipole (QD) mlat for SO and VT is indicated by grey horizontal lines. Black dots represent trough minima from the Swarm MIT product, with additional manual selections where the automated algorithm failed.
Swarm observations reveal that the trough moved rapidly equatorward during the storm’s main phase, nearing VT’s latitude by phase end. This is supported by all-sky records (Figure 3i), which show the Stable Auroral Red (SAR) arc approaching the zenith at Manciano (36.14°N). In the Southern Hemisphere, the MIT also reached low latitudes below 35°. During the recovery phase, the MIT gradually retreated poleward.
Enhanced density was observed equatorward of the MIT at night in both hemispheres, particularly early in recovery, while a density hole formed around the equator. This latter phenomenon was partially discussed by Das et al. [2] and is not the focus here. Poleward of the MIT, the ionosphere was severely depleted at the satellite’s altitude.
Swarm passed over VT and SO four times within a day following the SSC. The first pass occurred shortly after the SSC at 17:47 UT (SO) and 17:49 UT (VT) at MLT 19.1. Compared to the previous day (shown in grey in Figure 7a–c), EIA crests on 10 May (shown in black) were more pronounced in both Swarm C’s plasma density and LEO vTEC observations (Figure 7a–c). Additionally, ssFACs intensified poleward of mlat −60° (Figure 7a).
More dramatic changes were observed a few hours later at 22:04 UT when Swam B passed over VT and SO (Figure 7d–f). Poleward of 40° mlat in both hemispheres, ssFAC intensity increased by orders of magnitude. This zone of intense ssFACs (and particle precipitation) corresponds to the auroral zone. Notably, its equatorward boundary shifted to as low as 40° mlat (Figure 7d), south of SO. Local density peaks in both vTEC and plasma density (see Figure 7e,f), occurring between 40–60° mlat, were likely generated by storm-enhanced particle precipitation. During this flyby, MIT was located at around 40° mlat, marking the equatorward boundary of the auroral zone.
On 11 May, Swarm C, followed by Swarm B, passed over the ground stations again. In both cases, the in-situ plasma density observed near the stations was three to four times lower (log density decreased by 0.44 at MLT 7.3 and by 0.63-.64 at MLT 10.8) than the previous day (Figure 7i,l). This decrease was also noted in the LEO TEC in the Northern Hemisphere, poleward of 30° at MLT 7.3 (5:58 UT) (Figure 7h) and 10° at MLT 10.8 (9:30 UT) (Figure 7k). Meanwhile, excess plasma accumulated near the equator and in the Southern Hemisphere. The density distribution was asymmetric on both days, but in opposite senses.

4. Discussion

Multi-instrumental observations captured unique ionospheric conditions at mid- and low-midlatitudes during the storm’s main phase. Initially, F2 density rapidly decreased, followed by an unusual G-condition at both SO and VT, where F2 density fell below F1 in the early recovery phase. This was followed by an exceptionally long fade-out of the layers during daytime in the early recovery phase.
By 22 UT, the F2-layer raised to the altitude of Swarm, and Swarm confirmed the severe nighttime depletion of this layer (Figure 7f). Meanwhile, a horizontal redistribution also took place. By this time, MIT reached SO’s latitude. Afterwards, the equatorward shift of the MIT went to the extremely low 35° mlat (Figure 6), which was indicative of the simultaneous dramatic shrinkage of the plasmasphere [24]. The observed density depletion was limited to the extent of the MIT and to the F2-layer as vTEC remained nearly unchanged. The low F2 density observed by ionosondes in the main phase can also be primarily attributed to the arrival of MIT. Our findings are in good agreement with the result of [58].
Vichare and Bagiya [59] recorded IMF By turning at 22:30 UT on 10 May which also coincided with northward turning of IMF Bz, see also on Figure 1a,b.
Storm-enhanced plasma density (SED) developed at nighttime low latitudes and expanded toward mid-latitudes (Figure 6), approaching the counter-shifting MIT, while a deepening equatorial plasma depletion (EPD) evolved at the equator [2]. Das et al. [2] found that the daytime EIA extended up to +/−40° mlat due to a “Strong Super fountain Effect” which were linked to eastward PPEFs and DDEFs during the main and the early recovery phase of the present storm. EPDs generally develop due to the generalized Rayleigh-Taylor instability (e.g., [60,61,62]) and prefer the early morning [63,64,65,66] and post sunrise sectors [67] and can extend to +/−36° mlat [68]. By the end of the main phase, Swarm observed that the poleward-expanding SED and the equatorward-shifting ssFAC-dominated (precipitation) zone nearly merged, with the MIT sandwiched between them (Figure 6 and Figure 7). At this point, the nightside midlatitude ionosphere was confined to the MIT.
The movement of the MIT was closely followed by the AO. The poleward wall of MIT is believed to be shaped by auroral precipitation in the evening MLT sector [69,70]. The observations confirm the rapid equatorward shift of the AO (optical images, auroral Es- and F-layers and intense Swarm ssFAC). The unique observations included the first-ever Digisonde recording of auroral Es at SO, and auroral F observations at unprecedented low latitudes (down to 35° mlat), confirmed by optical all-sky observations (see Figure 3c,f,i). The source of these recorded auroral Es was most probably due to particle impact to the region of auroral oval [15].
Using multi-instrumental observations, Aa et al. [3] examined the American–Atlantic longitude sector during this event and found that the EIA expanded and merged with the AO. Karan et al. [14] reported repeated overlaps between the poleward-expanding EIA and the AO during the storm’s main phase, based on NASA’s Global-scale Observations of the Limb and Disk (GOLD) mission data. The northern and southern EIA crests reached approximately 38°N and 35°S mlat around UT midnight (20 MLT), while the AO extended to 40°S and 38°N (the latter estimated from a GOLD image taken at 22:10 UT, presented in Figure 5 of Karan et al. [14]). These observations confirm a remarkable absence of a mid-latitude ionosphere also on the dayside. Previous studies during extremely intense storms have also registered similar auroral expansions up to ~40–50° mlat [71,72,73].
Regarding the vertical plasma redistribution, three uplift phases can be distinguished (Figure 4):
(1) 18:30–19:30 UT (SO) and 18:37–19:37 UT (VT): Simultaneous parallel variations with similar speeds (around 31 m/s at SO and 52 m/s at VT), likely driven by the same global electric fields, initially PPEF, later with contribution from DDEF. The study of Astafyeva et al. [74] strengthens this scenario, while they observed signatures of strong unshielded PPEF (between 17:05 UT, and until ~19:40 UT). This caused an increase of the equatorial ExB drifts up to 95 m/s, which led to the occurrence of a strong ionospheric super-fountain effect around the equator. Most probably, the upward drift effect of PPEF manifested in our F-layer height data of VT and SO stations with the listed velocities.
Plasma uplifts typically enhance the density, while in this case a decrease was observed. The depletion can be attributed to the horizontal plasma redistribution, the arrival of MIT to the latitude of SO and VT.
This phase can be clearly observed in isodensity and virtual height data too (Figure 4c–f). The B0 parameter is also sensitive for this type of change, but with not that significant increase in its value.
(2) 21:30–02:15 UT (SO) and between 21:52–02:10 UT (VT): Uplift with strong fluctuations with significantly greater F2 heights (890 km vs. 630 km) and speeds (around 90 m/s vs. 31 m/s) at SO and VT, suggesting spatially inhomogene sources like traveling ionospheric disturbances (TIDs) or storm-time meridional wind surges [75]. During this phase, the stations were near the AO (as indicated by the presence of auroral layers), where storm-time winds and TIDs are initiated. The examination of Paul et al. [58] strengthens the presence of MS- and LSTIDs during the main and early recovery phase of this storm. Horvath et al. [76] during the analysis of the Halloween 2003 superstorm also identified TIDs which created large plasma depletions.
As for the analysis of the different ionosonde parameters, our conclusion is that for the identification of the TID effect, the isodensity data are found to be the best indicator (Figure 4c,d).
(3) 03:05–03:50 UT (F2), 03:10–04:25 UT (F1) (SO) and 03:00–04:00 UT (F2), 03:22–05:30 UT (F1) (VT): During this period, the F2-layer uplifted with 145 m/s velocity at SO and 102 m/s velocity at VT. An important difference between the two stations is that at SO the increase in the F2-layer height is not as steady as at VT, but much faster and has three uplift subsections (showing wave-like pattern between 261–546 km, see Figure 4). The steady uplift at VT is also peculiar, since the altitude of the F2-layer rose from 509 to 877 km reaching its highest altitude, thus, the layer went out of the range of the ionograms. In the meantime, the F1-layer at VT and SO descended with velocities of 20 m/s at SO and 32 m/s at VT as it is portrayed in Figure 4e,f. This height decrease was most probably due to the effect of westward DDEF as its presence was registered by Aa et al. [3]. The overall decrease, seen in the F2 density, the Swarm-observed density and Swarm vTEC is the result of the downward drift of the dominant part of the plasma. The anomalous rapid (around 145 m/s at SO and 102 m/s at VT) and steady uplift of the F2 layer at SO and VT may be linked to local heat sources which affect just the F2-layer heights, like frictional heating by subauroral polarization jets streaming along the MIT, or heat downward conducted from ring current (RC) [24]. Karan et al. [68] and Paul et al. [58] proposed that the rapid poleward shift of the EIA (with 450 m/s) together with the equatorward placement of the aurora caused the dramatic ionospheric uplift, which resulted in the prolonged disappearance of the layers at midlatitude during daytime. Note that during this phase, the Dst index was close to its minimum, and the RC to its maximum intensity. This peculiar feature requires further investigation.
The third uplift phase can be identified in all three types of ionosonde parameters portrayed on Figure 4, however, it is important to highlight that the virtual height (h’F, hF2) data is the most suitable for the identification of the uplifts and F1-layer height decreases.
Vichare and Bagiya [59] analyzed the equatorial ionosphere at Asian longitudes (54–76° W) with ionosonde and Swarm data during the main phase of this storm and they identified three IMF phases. They also analyzed the height variation of the F2-layer, but they came up with different conclusions as we were during our study. This is most probably connected to the fact that, during this superstorm interval, the equatorial and the low- and midlatitude ionosphere reacted differently to the incident interplanetary effects. Between 21.4 to 21.8 UT, IMF Bz was mostly constant at ~−40 nT and IMF By fluctuated around zero, the study of Vichare and Bagiya [59] named this interval as Condition I. They observed almost steady height in ionosonde data taken from near the magnetic equator in contrast to our observations at European longitudes. Between 22.2 and 22.5 UT the IMF Bz turned northward without much variation in IMF By (strongly negative with ~−60 nT, Vichare and Bagiya [59] named this as Condition II). In their ionosonde data, they observed a variable response. During northward IMF Bz turnings, around the equator due to overshielding, electron density decrease should be observed. Between 22.5 and 23 UT, IMF Bz turned northward to zero, and IMF By turned sharply from negative to positive (Condition III after Vichare and Bagiya [59]). They observed in ionospheric layer height data a very large increase at all three analyzed stations [59]. Vichare and Bagiya [59] concluded that this enhancement probably occurred due to the post-sunset pre-reversal enhancement (PRE) in that local time sector. Our observations reveal similar ionospheric height increasement during the period of Condition III (Figure 4), at SO station the height increased from 597.7 km to 642.2 km during this half hour interval, in the meantime VT height data show enhancement from 505 to 549.9 km indicating that the European midlatitude ionosphere behave similarly as the Asian longitude one. Ionosonde data of BVJ04 (Geographic: 2.8°S, 60.6° W; Geomagnetic: 11.98°N) (see Figure 2 of Vichare and Bagiya [59]) show the most similar variation to our investigated height parameters. It is important to note that our data show height fluctuations around the interval of Condition III, which can be attributed to TID activity as it discussed above. Therefore, this increasement cannot be clearly connected to the effect of positive IMF By turning in our case. In the European sector the effect of the strong eastward PPEF (caused by the strong positive IMF By turning, reported by Vichare and Bagiya [59]) between 22.5 and 23 UT manifested as electron density decrease at the latitude of VT (4 to 3.12 MHz), on the contrary no plasma density variation was observed at the latitude of Sopron.
In the early recovery phase, the G-condition was followed by an exceptionally prolonged disappearance of the layers from the ionograms (“fade-out”), lasting for 6–7 h at SO (07:10–14:10 UT) and VT (08:07–14:07 UT), which uniquely occurred during daytime. Meantime, the Swarm C and B observed a density decrease of a factor of 3 to 4 around 6:00 and 9:30 UT (7 and 11.5 MLT) compared to the previous day’s quiet values (Figure 7i,l). Swarm’s vTEC and electron density measurements also showed extreme (30–50% decrease in TEC) and latitudinally extended plasma depletion in the Northern Hemisphere (Figure 7h,k) during this interval. The “fade-out” from the ionograms likely resulted also from the fact that electron density dropped below the daytime detectability level of the Digisondes, approximately 2.3 MHz (6.58∙104 1/cm3) [20,77]. This prolonged depletion was mainly attributed to the extremely decreased O/N2 ratio [45] and the resulting high recombination rate as it can be seen in GUVI O/N2 data as well (see Figure A10b). Additionally, the low density may have been reinforced by the push of the layers exerted by DDEF, to lower altitudes, where the recombination rate is higher, as reflected in the h’F data in Figure 2b,d. However, it is important to note that increased background X-ray flux and solar flares during the investigated period could also contribute to the disappearance of the lower layers through the resulting increased absorption [38,56]. In the recent study of Pierrard et al. [15], different longitudinal sectors were investigated including one in Europe. In their observation they also registered “fade-outs” during quite the same interval during the May superstorm. Our results fit nicely into their ionosonde station line and complementing them. At high latitudes (53.95 mlat), the disappearance of the layers registered shortly after the SSC and the G-condition phase lasted much longer than at SO (46.67 mlat) and VT (35.94 mlat), which is in line with expectations. G-condition phase starts earlier and lasts longer at higher latitudes and appears during intense geomagnetic storms which are causing negative ionospheric storms in the main and early recovery phase [29]. Besides, the appearance of G-condition is dependent on the local time of the storm onset, as was concluded by Pierrard et al. [15] during the investigation of the October 2024 storm, where no G-condition was observed. A similar “fade-out” scenario was reported, e.g., during the nighttime of St. Patrick’s Days 2015 and the November 2012 storm. It was found to be related to both the equatorward movement of the MIT and the O/N2 ratio decrease as they caused significant negative ionospheric storms [20]. The Swarm-detected asymmetric electron density distribution can also be connected to the summer-to-winter solar radiation-driven circulation which causes the seasonal difference in the ionospheric plasma density, however, this needs further investigation [78].
However, it is important to note that increased background X-ray flux and solar flares during the investigated period could also contribute to the disappearance of the lower layers through the resulting increased absorption [38,56]. Increased absorption values were detected during the early morning hours (02 –06 UT) on 11 May, and the reason for the enhanced values was not the negative ionospheric storm in this case (the critical frequency of the F-layer was not below 3 MHz during this period). Thus, the reason could be the enhanced proton (early morning hours, Figure 5e) or X-ray flux (after sunrise, indicated by the black dashed line, Figure 5d). However, no increased values compared to the reference days were observed directly before the fade-out (please compare Figure 5c and f). Therefore, the reason for the disappearance of the E- and F1-layers from the ionograms cannot be clearly connected to the increased ionospheric absorption based on the present results, more investigation is needed.

5. Conclusions

During this current study, we aimed to investigate the mid- and low-midlatitude ionospheric response to the 2024 Mother’s Day superstorm. For this purpose, ground-based ionosonde measured F1, F2-layer, B0 and B1 parameters and isodensity data along with satellite measured electron density and O/N2 ratio data were used. The main conclusions of our study are as follows:
  • A series of unique ionospheric conditions were determined by multi-instrumental observations and discussed in the current study.
  • A sudden and extreme decrease in the F2 layer electron density and a simultaneous uplift were detected with the Digisondes above SO and VT right after the SSC. The initial density decrease was mostly caused by the arrival of MIT to these latitudes.
  • Right after the end of the main phase, a peculiar G-condition developed in the ionosphere. This appears only during intense geomagnetic storms and is connected to extremely depleted plasma in the F2-layer.
  • Auroral F- and auroral Sporadic E-layers were observed at unprecedented low latitudes (42°, 35° mlat, respectively) during the main phase, while the analyzed stations were below or near the AO. The first ever observation of auroral Es at SO occurred between 22:15–23:10 UT, while auroral F layers were recorded at SO (22:30–03:45 UT) and as extremely low latitude as VT station (22:37–03:52 UT) on 10/11 May 2024. Besides the optical observations and the Swarm measurements confirmed that the MIT, with the AO at its equatorward boundary, moved down as low as 35.9°N mlat.
  • The auroral and low-latitude nightside ionospheres converged at the MIT, creating an extraordinary situation where the midlatitude ionosphere was confined to the MIT itself.
  • Exceptionally prolonged disappearance of the ionospheric layers was observed through Digisonde measurements uniquely during daytime hours in the early recovery phase of the superstorm. The joint effect of the extremely decreased O/N2 ratio and density, as well as along with the influence of DDEFs was the most probable cause of the disappearance and not the increased ionospheric absorption caused by the incident solar flares, which was confirmed by the amplitude method.
  • Three uplift phases were distinguished during the main and early recovery phases. The first phase was driven by global electric fields. The second phase was most likely caused by the spatially varying effect of storm-time winds and TIDs. While the decrease of the F1-layer height during the third uplift phase must have been driven by the westward DDEF. The underlying process responsible for the peculiar third-phase F2-layer uplift remains unclear and requires further investigation, involving additional observations from the plasmasphere.
  • The isodensity and virtual height (h’F, h’F2) data are most suitable for the investigation of the ionospheric layer height variations.
  • Effects of TIDs during geomagnetic storms are best observed with isodensity data.
  • The B0 parameter is sensitive to all the three types of ionospheric layer uplift (and overall, to geomagnetic storm effects), however, it is the most suitable for the indication of TID related ionospheric height variations.
  • In a future study, we plan to investigate the prolonged daytime disappearance of the F-layer and its anomalous 3rd-phase uplift in detail, incorporating further experimental data and models like the thermosphere–ionosphere electrodynamic general circulation model (TIEGCM, see the article of [79,80], and the Horizontal Wind Model 2007 (HWM07 [81,82]).

Author Contributions

K.A.B. was the main writer of the article, which contained the preparation of the event, manual scaling of ionosonde data, figure making and discussion of the results. V.B. helped in the manual scaling of VT data, in the preparation of the manuscript and reviewed the paper. B.H. gave ideas, made the figures from the Swarm data, wrote the paragraphs about the Swarm observations and reviewed the manuscript. A.B. made the calculation for the ionospheric absorption data. C.S. calculated the aurora distances and wrote that connected section. Therefore, every author of this manuscript contributed substantially to this study. All authors have read and agreed to the published version of the manuscript.

Funding

The contribution of VB was supported by the National Research Excellence Programme (grant no. STARTING 150984) and Bolyai Fellowship (GD, no. BO/00461/21). BH was supported through ESA Swarm DISC (Contract SW-CO-DTU-GS-33).

Data Availability Statement

All data used in this study are publicly available. Solar and geomagnetic indices (Kp, Dst and IMF) were taken from http://wdc.kugi.kyoto-u.ac.jp/wdc/Sec3.html (accessed on 8 July 2025), https://space.fmi.fi/image/www/il_index_panel.php (accessed on 8 July 2025) and https://omniweb.gsfc.nasa.gov/form/dx1.html (accessed on 8 July 2025). The GOES-16 X-ray (XRS-B channel) and integrated proton fluxes plotted on Figure 6 and Figure 7 are available from NOAA’s data center: https://data.ngdc.noaa.gov/platforms/solar-space-observing-satellites/goes/goes16/l2/data/xrsf-l2-flx1s_science/ (accessed on 8 July 2025) and https://data.ngdc.noaa.gov/platforms/solar-space-observing-satellites/goes/goes16/l2/data/sgps-l2-avg1m/ (accessed on 8 July 2025). The absorption data calculated by the amplitude method supporting the conclusions of this article may be requested from the contact author via e-mail (Attila Buzás, buzas.attila@epss.hun-ren.hu). All Swarm data are freely accessible on the ESA Swarm server https://swarm-diss.eo.esa.int (accessed on 8 July 2025). AACGM coordinates of ground stations were computed at https://sdnet.thayer.dartmouth.edu/aacgm/aacgm_calc.php#AACGM (accessed on 8 July 2025). Ionosonde data are available via the Global Ionospheric Radio Observatory https://giro.uml.edu/didbase/scaled.php (accessed on 8 July 2025). Aurora borealis pictures are from https://www.idokep.hu/hirek/a-pentek-esti-buli-sztarja-a-sarki-feny-volt-iden-otodszorre (accessed on 8 July 2025), https://www.idokep.hu/hirek/zold-sarki-feny-eszakon (accessed on 8 July 2025), https://www.youtube.com/watch?v=yTQO1dr1IVk (accessed on 8 July 2025), https://www.youtube.com/watch?v=B9diWHKlQXM (all accessed on 8 July 2025). The GUVI data used here are provided through support from the NASA MO&DA program (https://guvitimed.jhuapl.edu/data_fetch_l3_on2_gif?y=2015&d=076) (accessed on 8 July 2025). The GUVI instrument was designed and built by The Aerospace Corporation and The Johns Hopkins University. The Principal Investigator is Andrew B. Christensen and the Chief Scientist and co-PI is Larry J. Paxton. The manuscript’s Figure 1, Figure 2, Figure 4, Figure 5, Figure 6 and Figure 7 were produced using Matlab R2019a.

Acknowledgments

We thank the data centers (OMNIWEB, WDC for Geomagnetism, Kyoto, and GIRO) for the high-quality data. SSC data are partly from Observatori de l’Ebre (OE, Spain).

Conflicts of Interest

The authors declare no conflicts of interest.

Abbreviations

The following abbreviations are used in this manuscript:
AOauroral oval
DDEFdisturbance dynamo electric field
EIAequatorial ionization anomaly
EPDequatorial plasma depletion
ICMEinterplanetary coronal mass ejection
GNSSglobal navigation satellite system
HWM07Horizontal Wind Model 2007
IMAGEInternational Monitor for Auroral Geomagnetic Effects
IMFinterplanetary magnetic field
FACfield-aligned current
GOLDglobal-scale observations of the limb and disk
LSTIDlarge-scale TID
NNEnorth–northeast
NNWnorth–northwest
MITmidlatitude ionospheric trough
MLTmagnetic local time
MSTIDmedium-scale TID
PPEFprompt penetration electric field
QDquasi dipole
PREpre-reversal enhancement
RCring current
SARstable auroral red
SEDstorm-enhanced plasma density
SSCsudden storm commencement
ssFACsmall-scale FAC
SOSopron
TIDtravelling ionospheric disturbance
TIEGCMthermosphere-ionosphere- electrodynamic general circulation model
UTuniversal time
VTSan Vito
vTECvertical total electron content

Appendix A

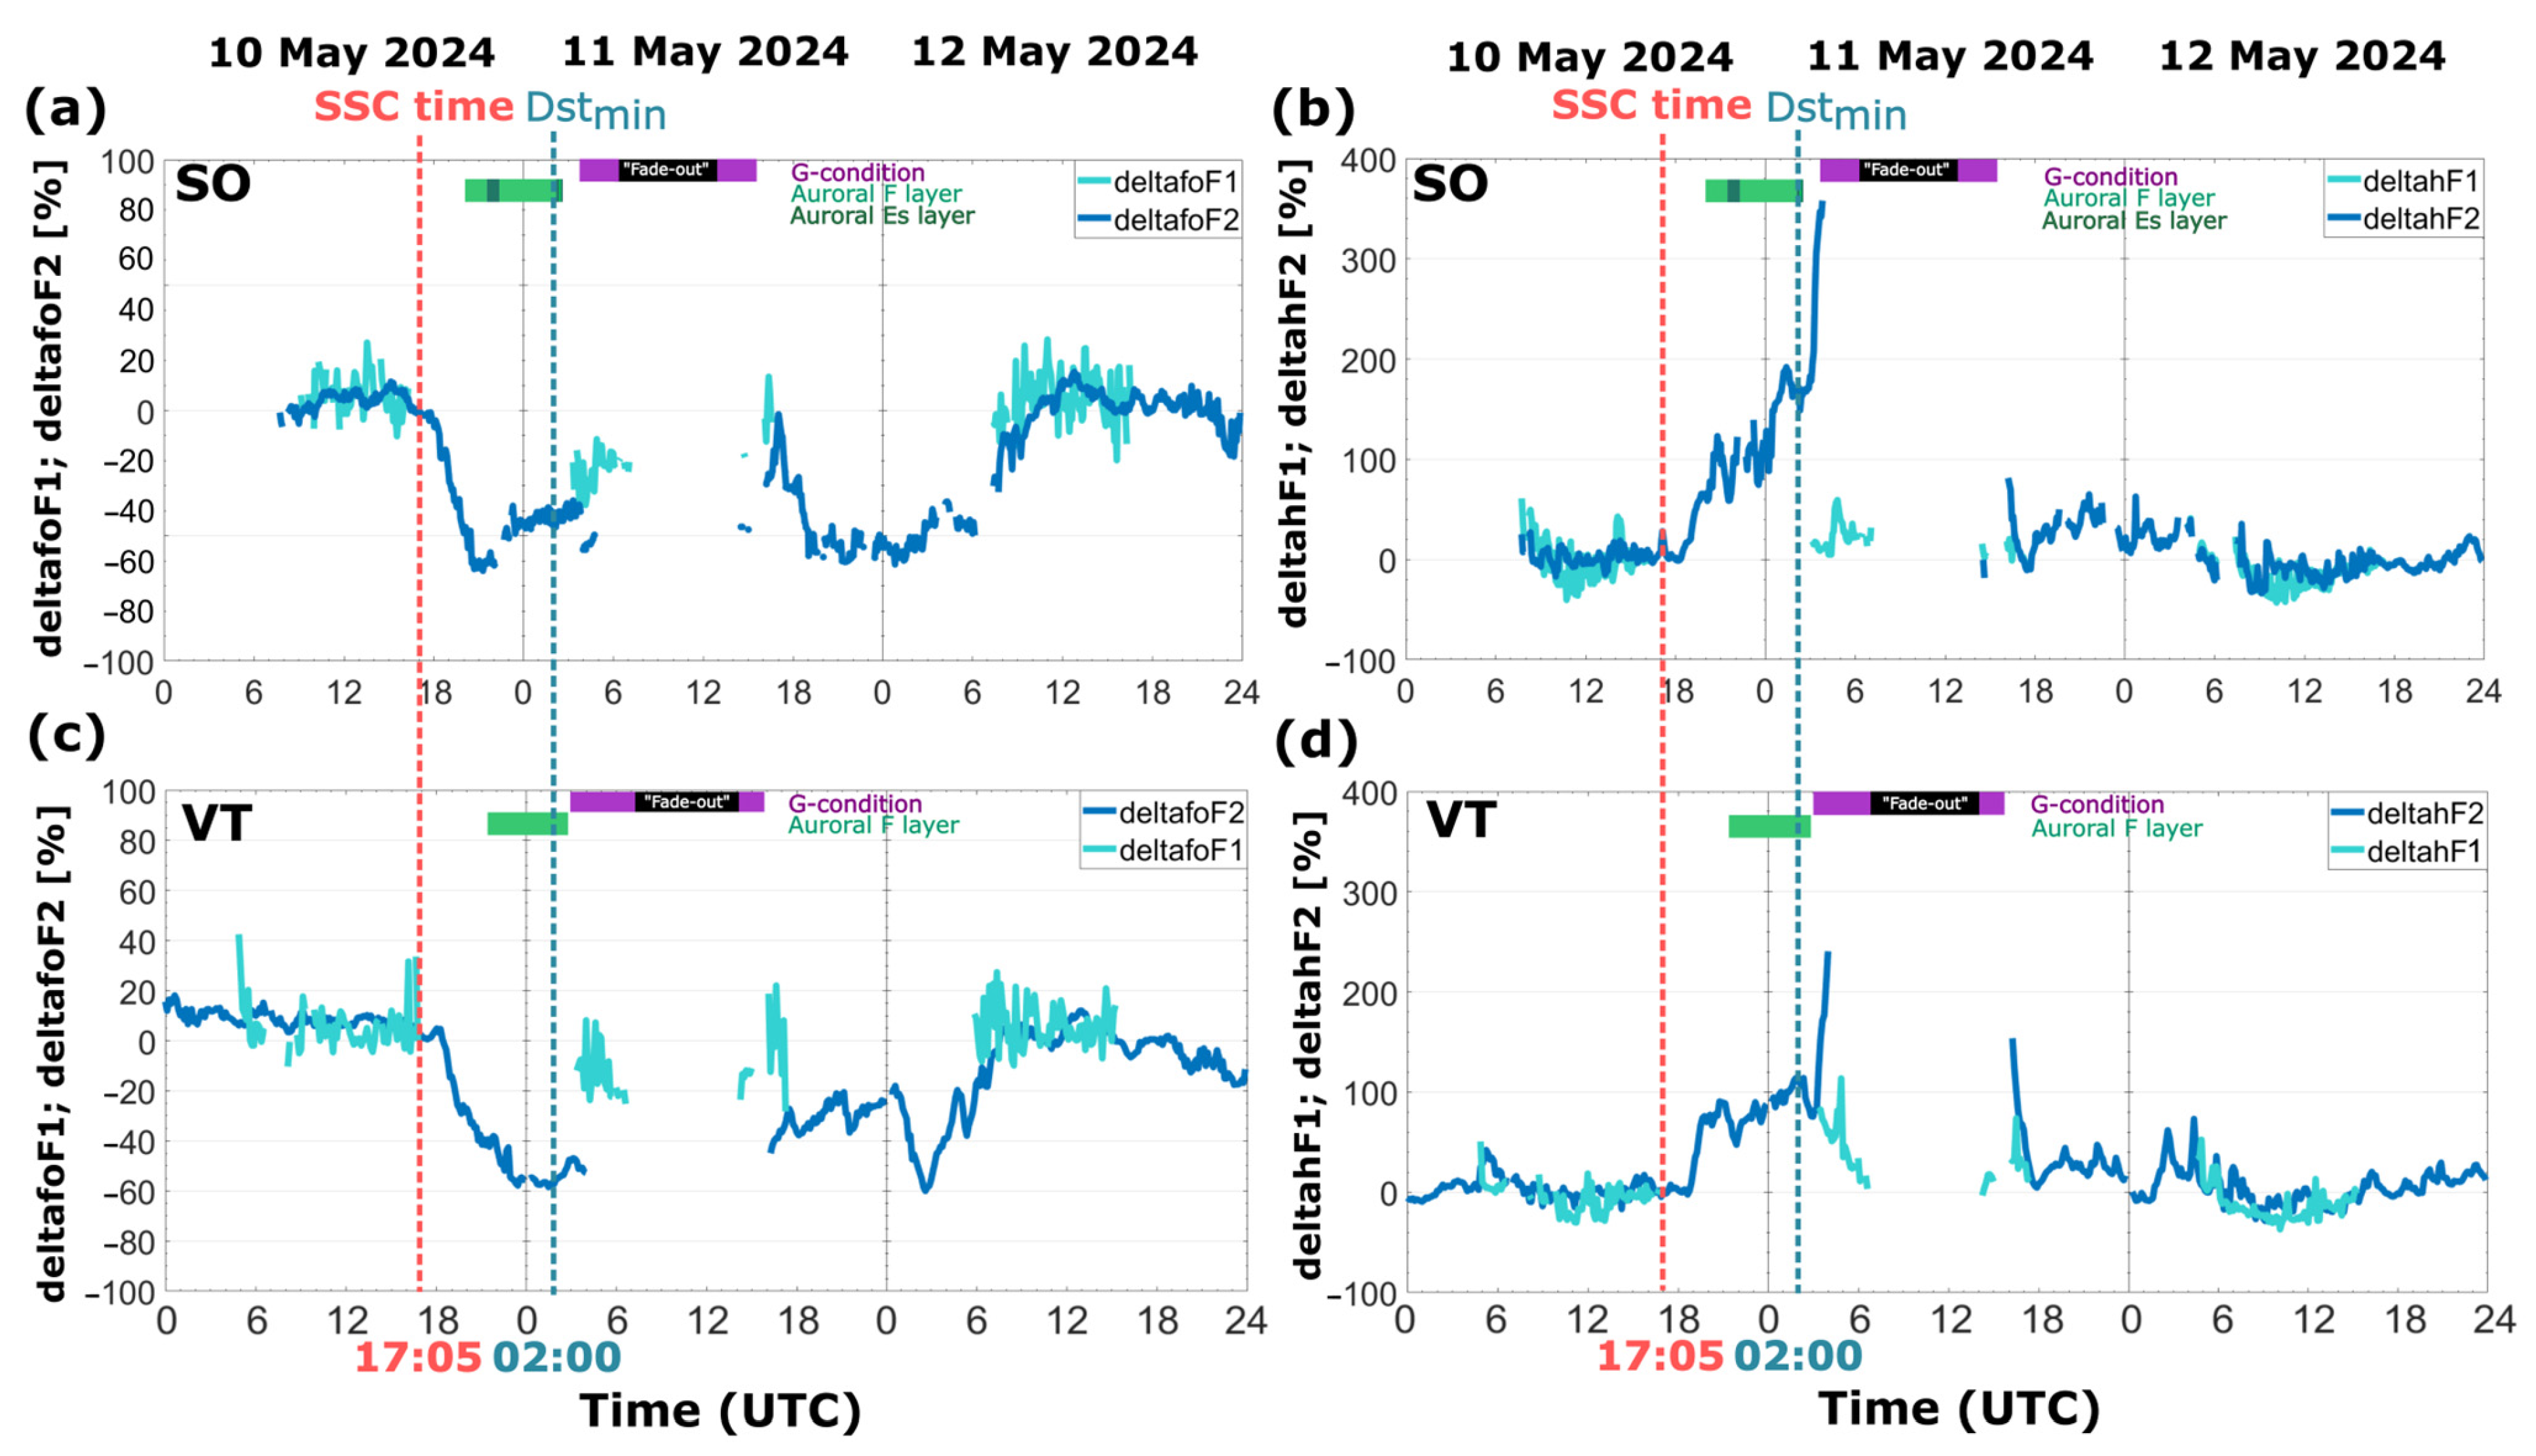
In Figure A1, the calculated deltafoF2, deltafoF2, deltahF1, and deltahF2 parameters are shown. The sudden decrease in F2-layer electron density after the SSC went up to −63% (at 20:40 UT) and 58% (at 23:22:30) at SO and VT, respectively (Figure A1a,c). A slight increase can be tracked in the data until G-condition mainly at SO. In F1-layer electron density it varies between 13% and −36% during the day of 11 May. At SO, a second nighttime electron density minimum with −60% can be observed from similarly around 20 UT until 02 UT during the night of 11/12 May. At VT, the second minimum in F2-layer electron density with −61% (at 00:50 UT) is more expressed and sharper after midnight on 12 May, which continues with a significant increase up to the quiet day values (0%) around 9 UT.
The height values in percentage in Figure A1b,d show quite the same pattern as in Figure 2b,d the virtual height data. After the SSC both station data show a sudden increase from 18:30 and 18:52 UT up to 50% and 90% at SO and VT, respectively. This phase continues with a wave-like, more oscillatory scenario until 03:05 UT and 03:22:30 UT on 11 May. Right after that an extreme increase follows, the deltahF2 values go up to 358% and 240% at SO and VT until the start time of the G-condition (Figure A1b,d). During this F2 layer height increase, the F1-layer decreased from 113% to 3% at VT, so the storm-time increased layer altitude went back to its quiet day value right before the disappearance/“fade-out” of the layers started. At SO in the deltahF1 data, we do not see such a significant decrease. After the fade-out scenario during the afternoon of 11 May, deltahF2 values quickly went back to their quiet day level (from 18 UT). Section 3.1.3 above describes in detail the nighttime uplift phases on 10/11 May.
Figure A1. The calculated deltafoF1, deltafoF2, deltahF1 and deltahF2 parameters are displayed at Sopron (a,b) and San Vito (c,d). F1-layer data: turquoise line; F2-layer data: dark blue line. Auroral layers (green bars), G-condition (magenta bars) and fade-outs (black bars) are shown.
Remotesensing 17 02492 g0a1

Appendix B

This is the additional explanatory text for the exact calculation steps, how the geographic and geomagnetic latitudes corresponding to the green and red auroras during the main phase of the superstorm were calculated.
Most studies regarding the aurora concentrate on the determination of the peak emission height of the aurora borealis and not the height boundaries of each type (color) of aurora. Since the accurate height of a given type (color) of aurora for this superstorm is currently not known and since the behavior of the aurora can differ storm by storm (and there can be differences at mid-latitude compared to high-latitude cases), here the upper boundary of the auroras is based on statistical observations (with this, the height is supposed to be overestimated). Regarding the green aurora, after the study of Whiter et al. [51] the correlation coefficient of the peak emission height of the green aurora is around 0 at 180 km height (see Figure 1 in the article of [51]), that is why 180 km was chosen as an overestimation for the upper height boundary of the green aurora.
For the height determination of the red aurora, we used the study of Jackel et al. [52]. The correlation coefficient of the peak emission height was close to 0 at 300 km (see Figure 2 in the article of [52]), therefore, the 300 km height was chosen as upper boundary height for the red aurora position calculations in our study.
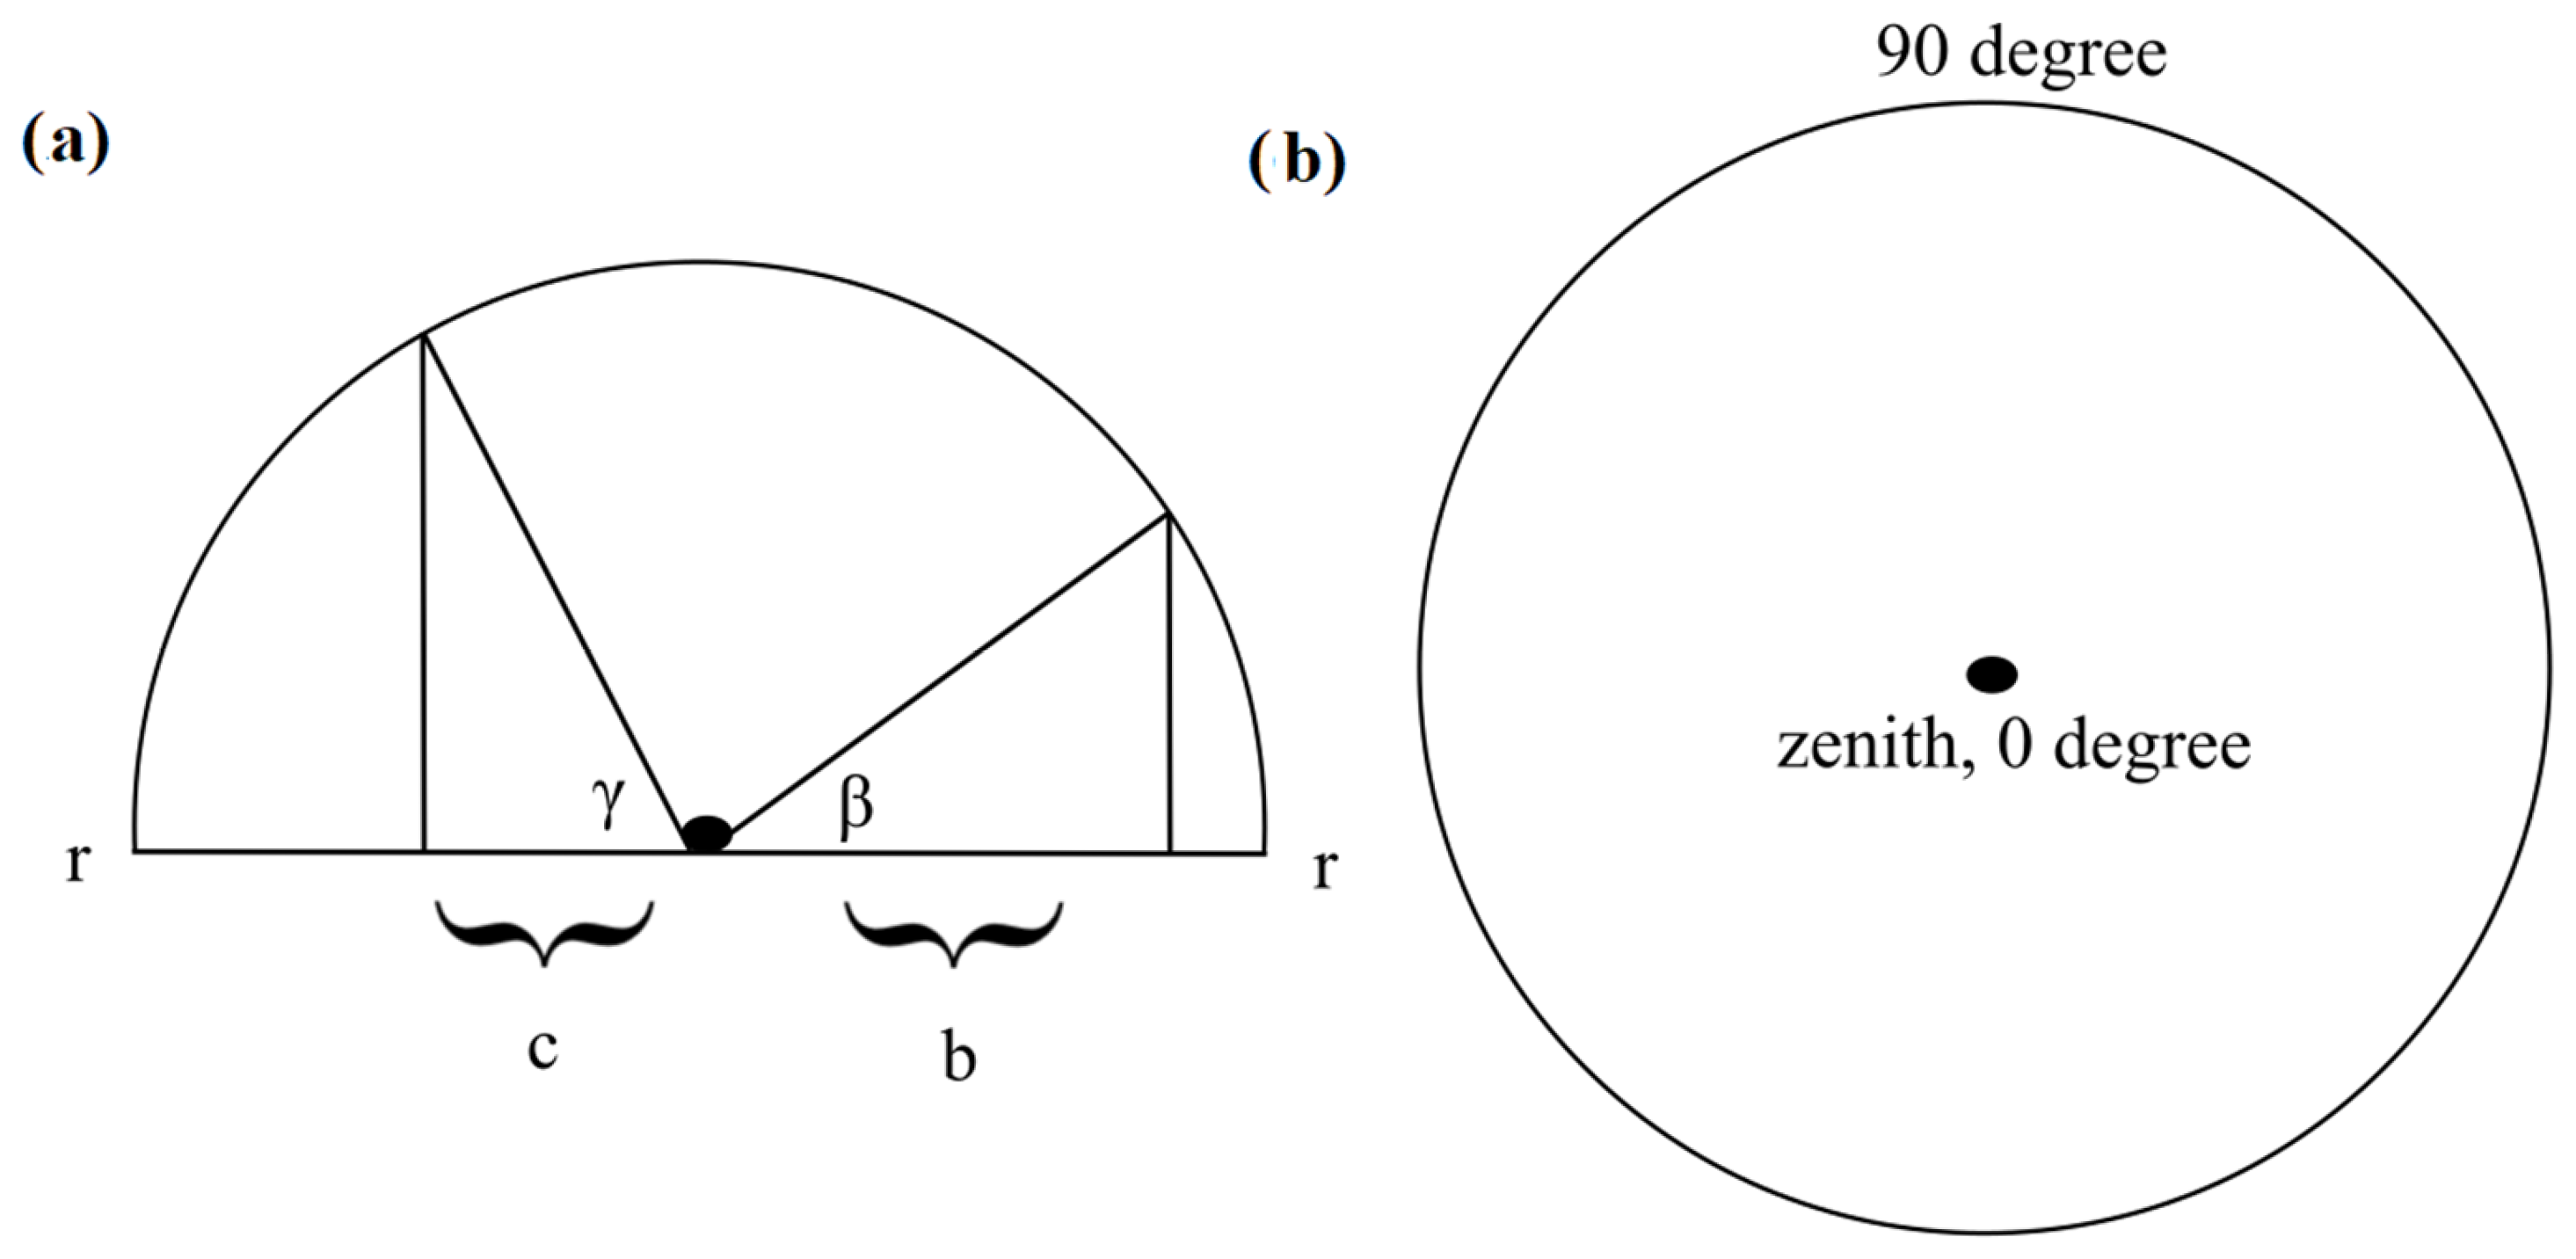
To estimate the geographical location of the auroral borealis, the images of all-sky cameras were used (e.g., Figure A2). Based on the configuration of the all-sky images (Figure A3a) the distances (b, c) and the viewing angles (β, γ) are directly proportional and can be determined. Therefore, the equation is
b r β 90 ° , c r γ 90 °
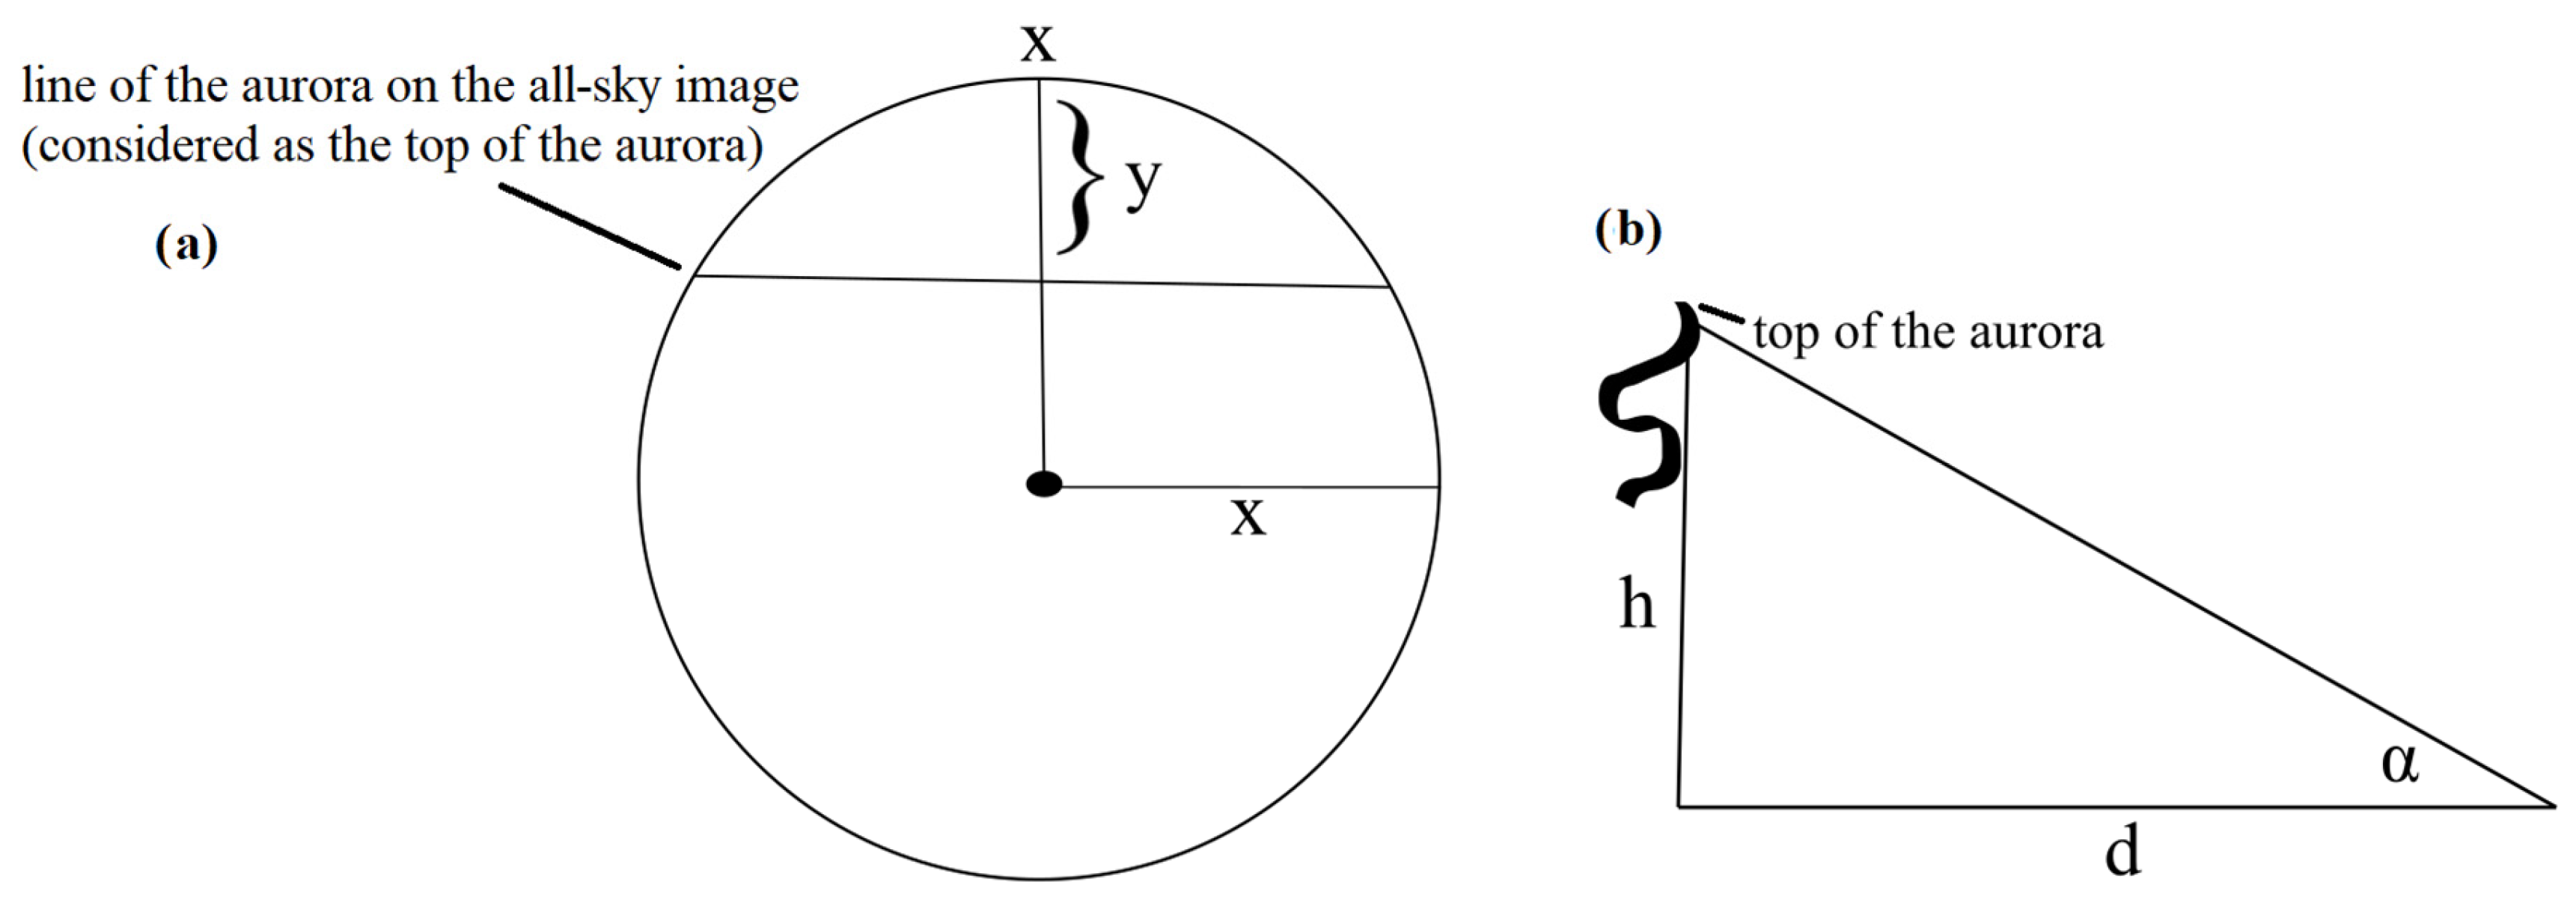
In the next step x (the average of three different measurements taken from the picture) was used instead of r, since the radius of the all-sky image is unknown, because the pictures are from outside source, see Acknowledgement. On Figure A4a the x and y (the proportion of the aurora on the captured image) can be measured and quantified from the images. From x and y, the angle α (angle between the location of the all-sky camera and the top of the aurora, Figure A4b) can be calculated:
y x = α 90 °
The h is the maximum height of the different type (color) of observed aurora, and were chosen as described above (180 km for the green aurora and 300 km for the red aurora), therefore the horizontal distance between the camera and the exact location of the aurora (d) can be estimated with this equation:
h d = tan ( a )
The exact calculation for 20:30 UT is as follows:
The subauroral arc (SAR) was at zenith at this time, and directly above Szombathely, Hungary (47.25°N lat, 42.25°N mlat, see Figure A8 for the location). For the red aurora with Equation (A2), where y = 4.8, x = 9.3 and after the calculation
4.8 9.3 · 90 ° = 46.45 ° ,
the top of the red aurora was visible around 46.45° degrees. Using the above-mentioned h = 300 km upper height for the red aurora (after [52]), the d value is determined with Equation (A3) as follows:
300 tan 46.45 ° = 285.7
As a result, the estimated horizontal distance between the camera (Szombathely) and the red aurora is around 285.7 km, so the aurora was above Prague (50.06°N lat, 49.45°N mlat, see Figure A8).
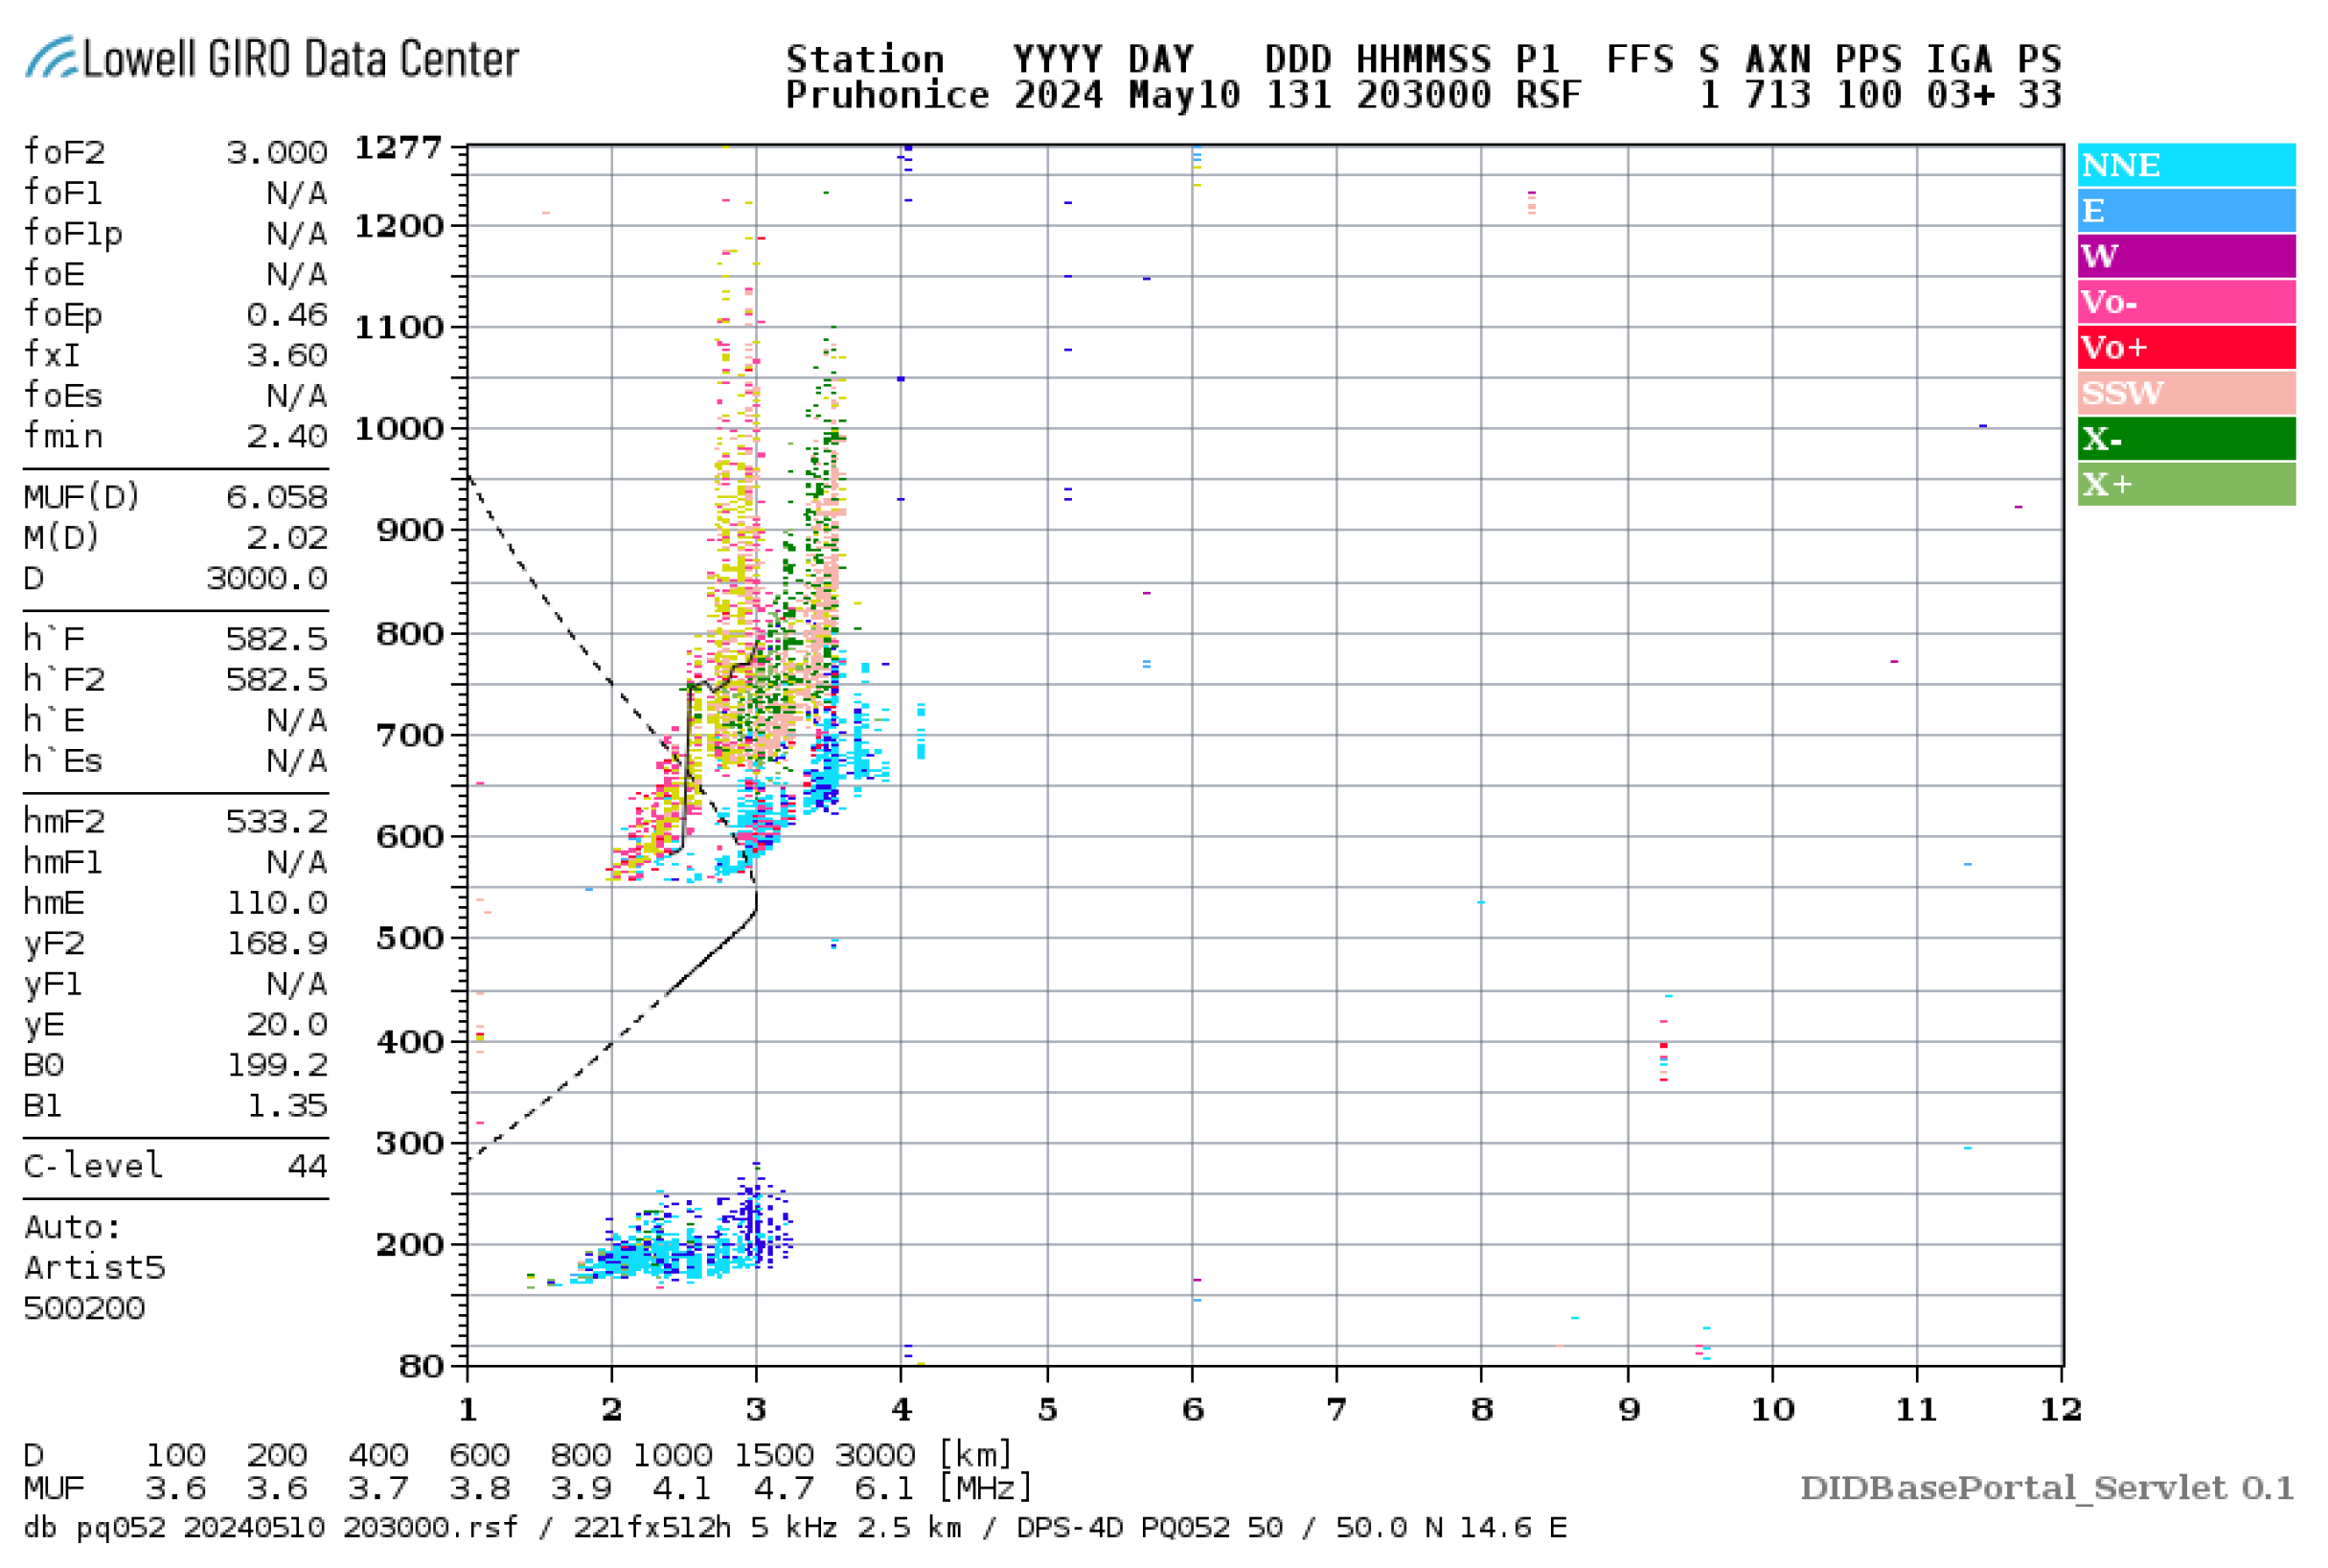
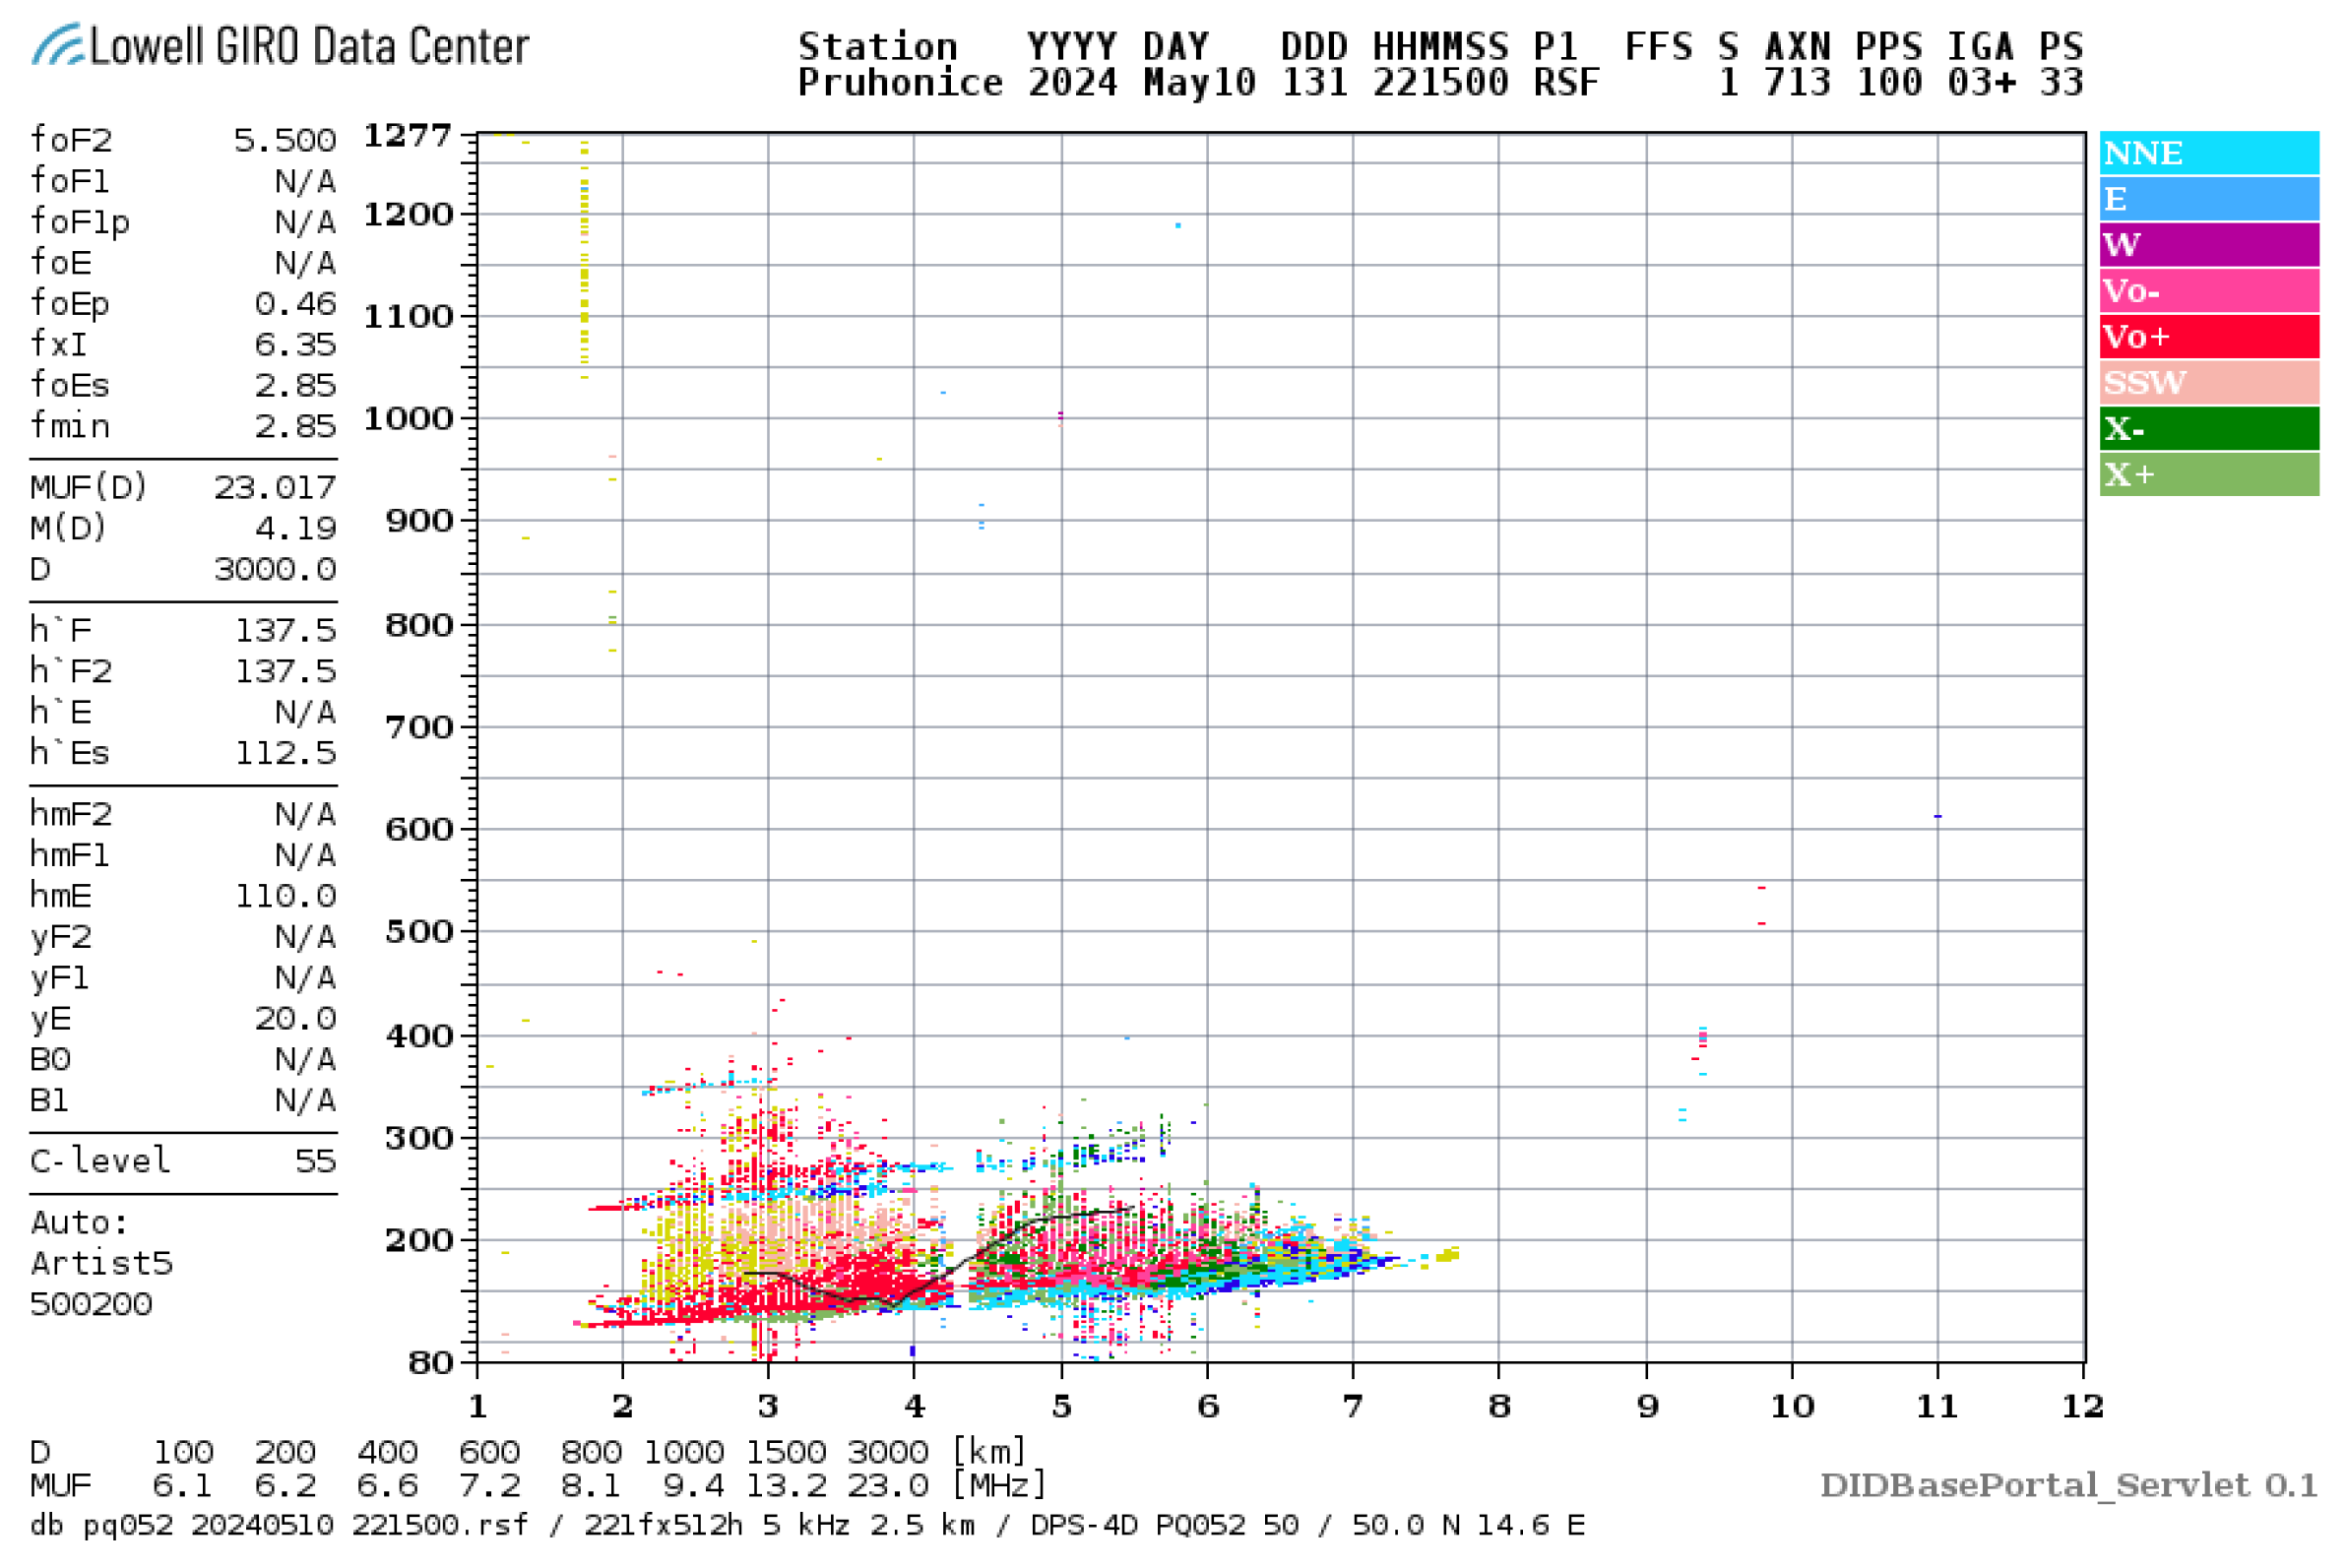
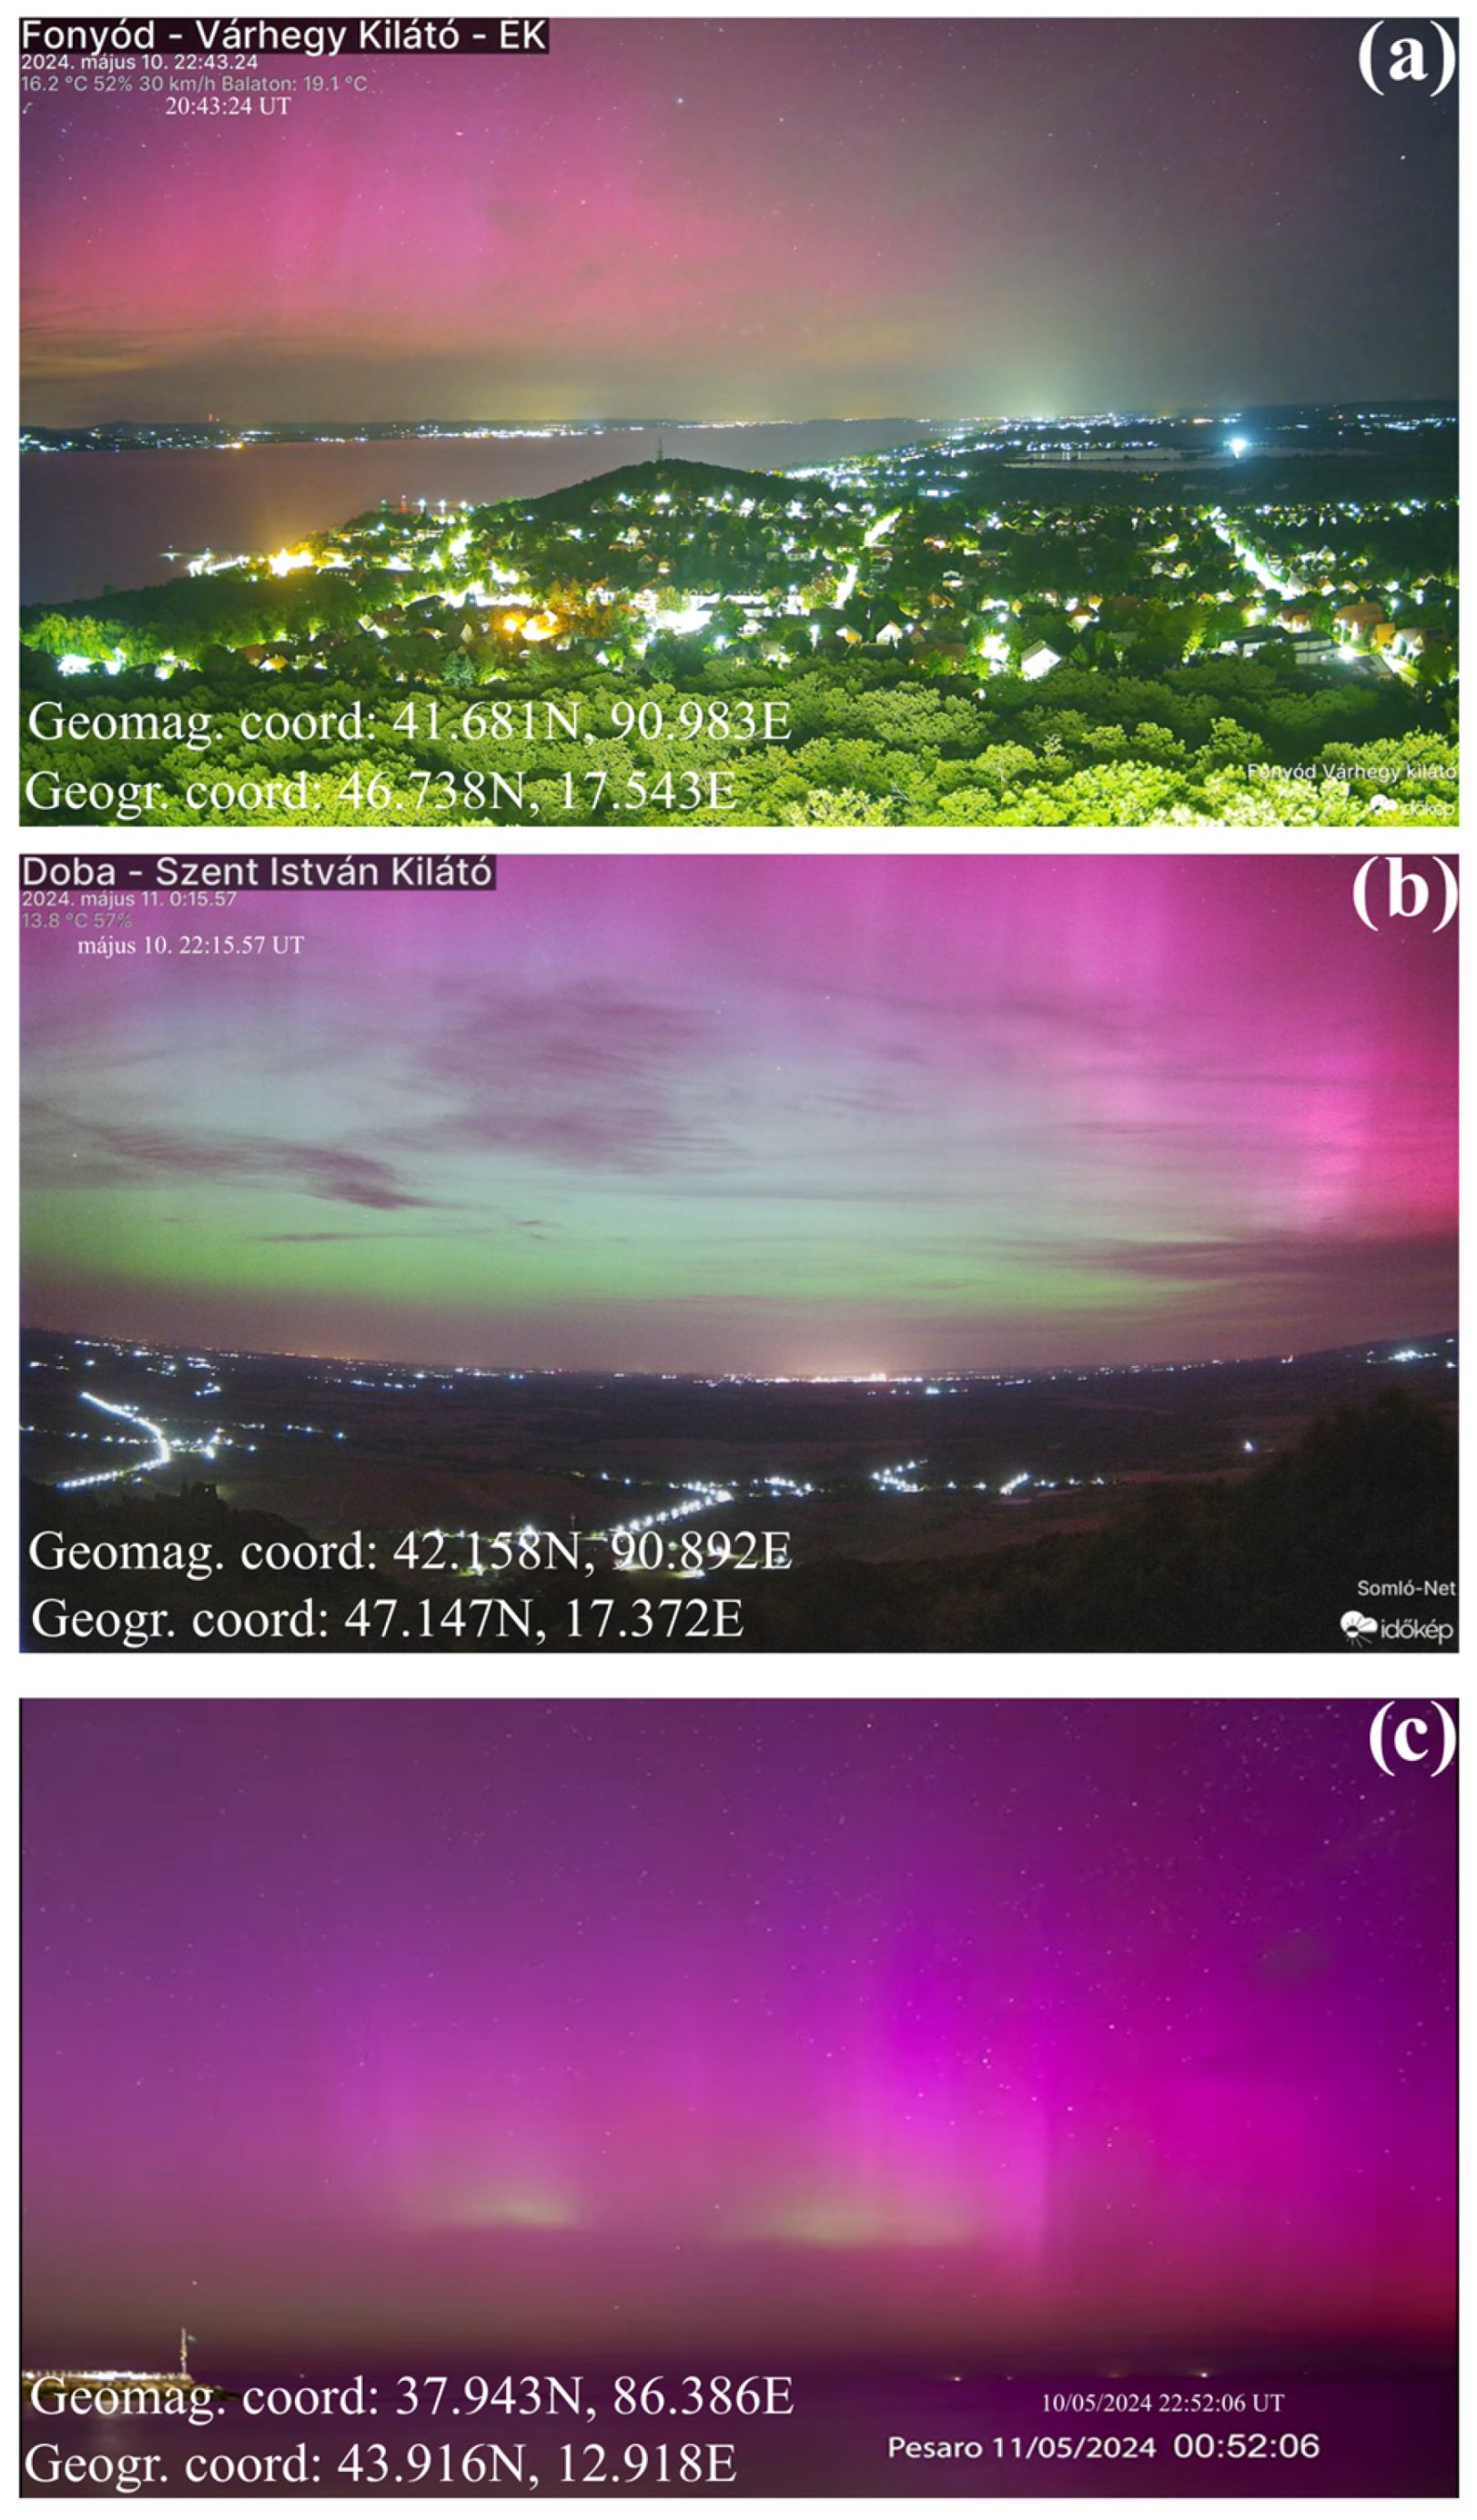
The ionograms from Pruhonice station (next to Prague, Figure A8) seems to confirm this, see Figure A5 (source: https://giro.uml.edu/ionoweb/# (accessed on 8 July 2025). An example for regular optical observation of the aurora recorded at Fonyód (Hungary, Figure A7) at 20:43 UT can be seen on Figure A7a.
The exact calculation for 22:15 UT is as follows:
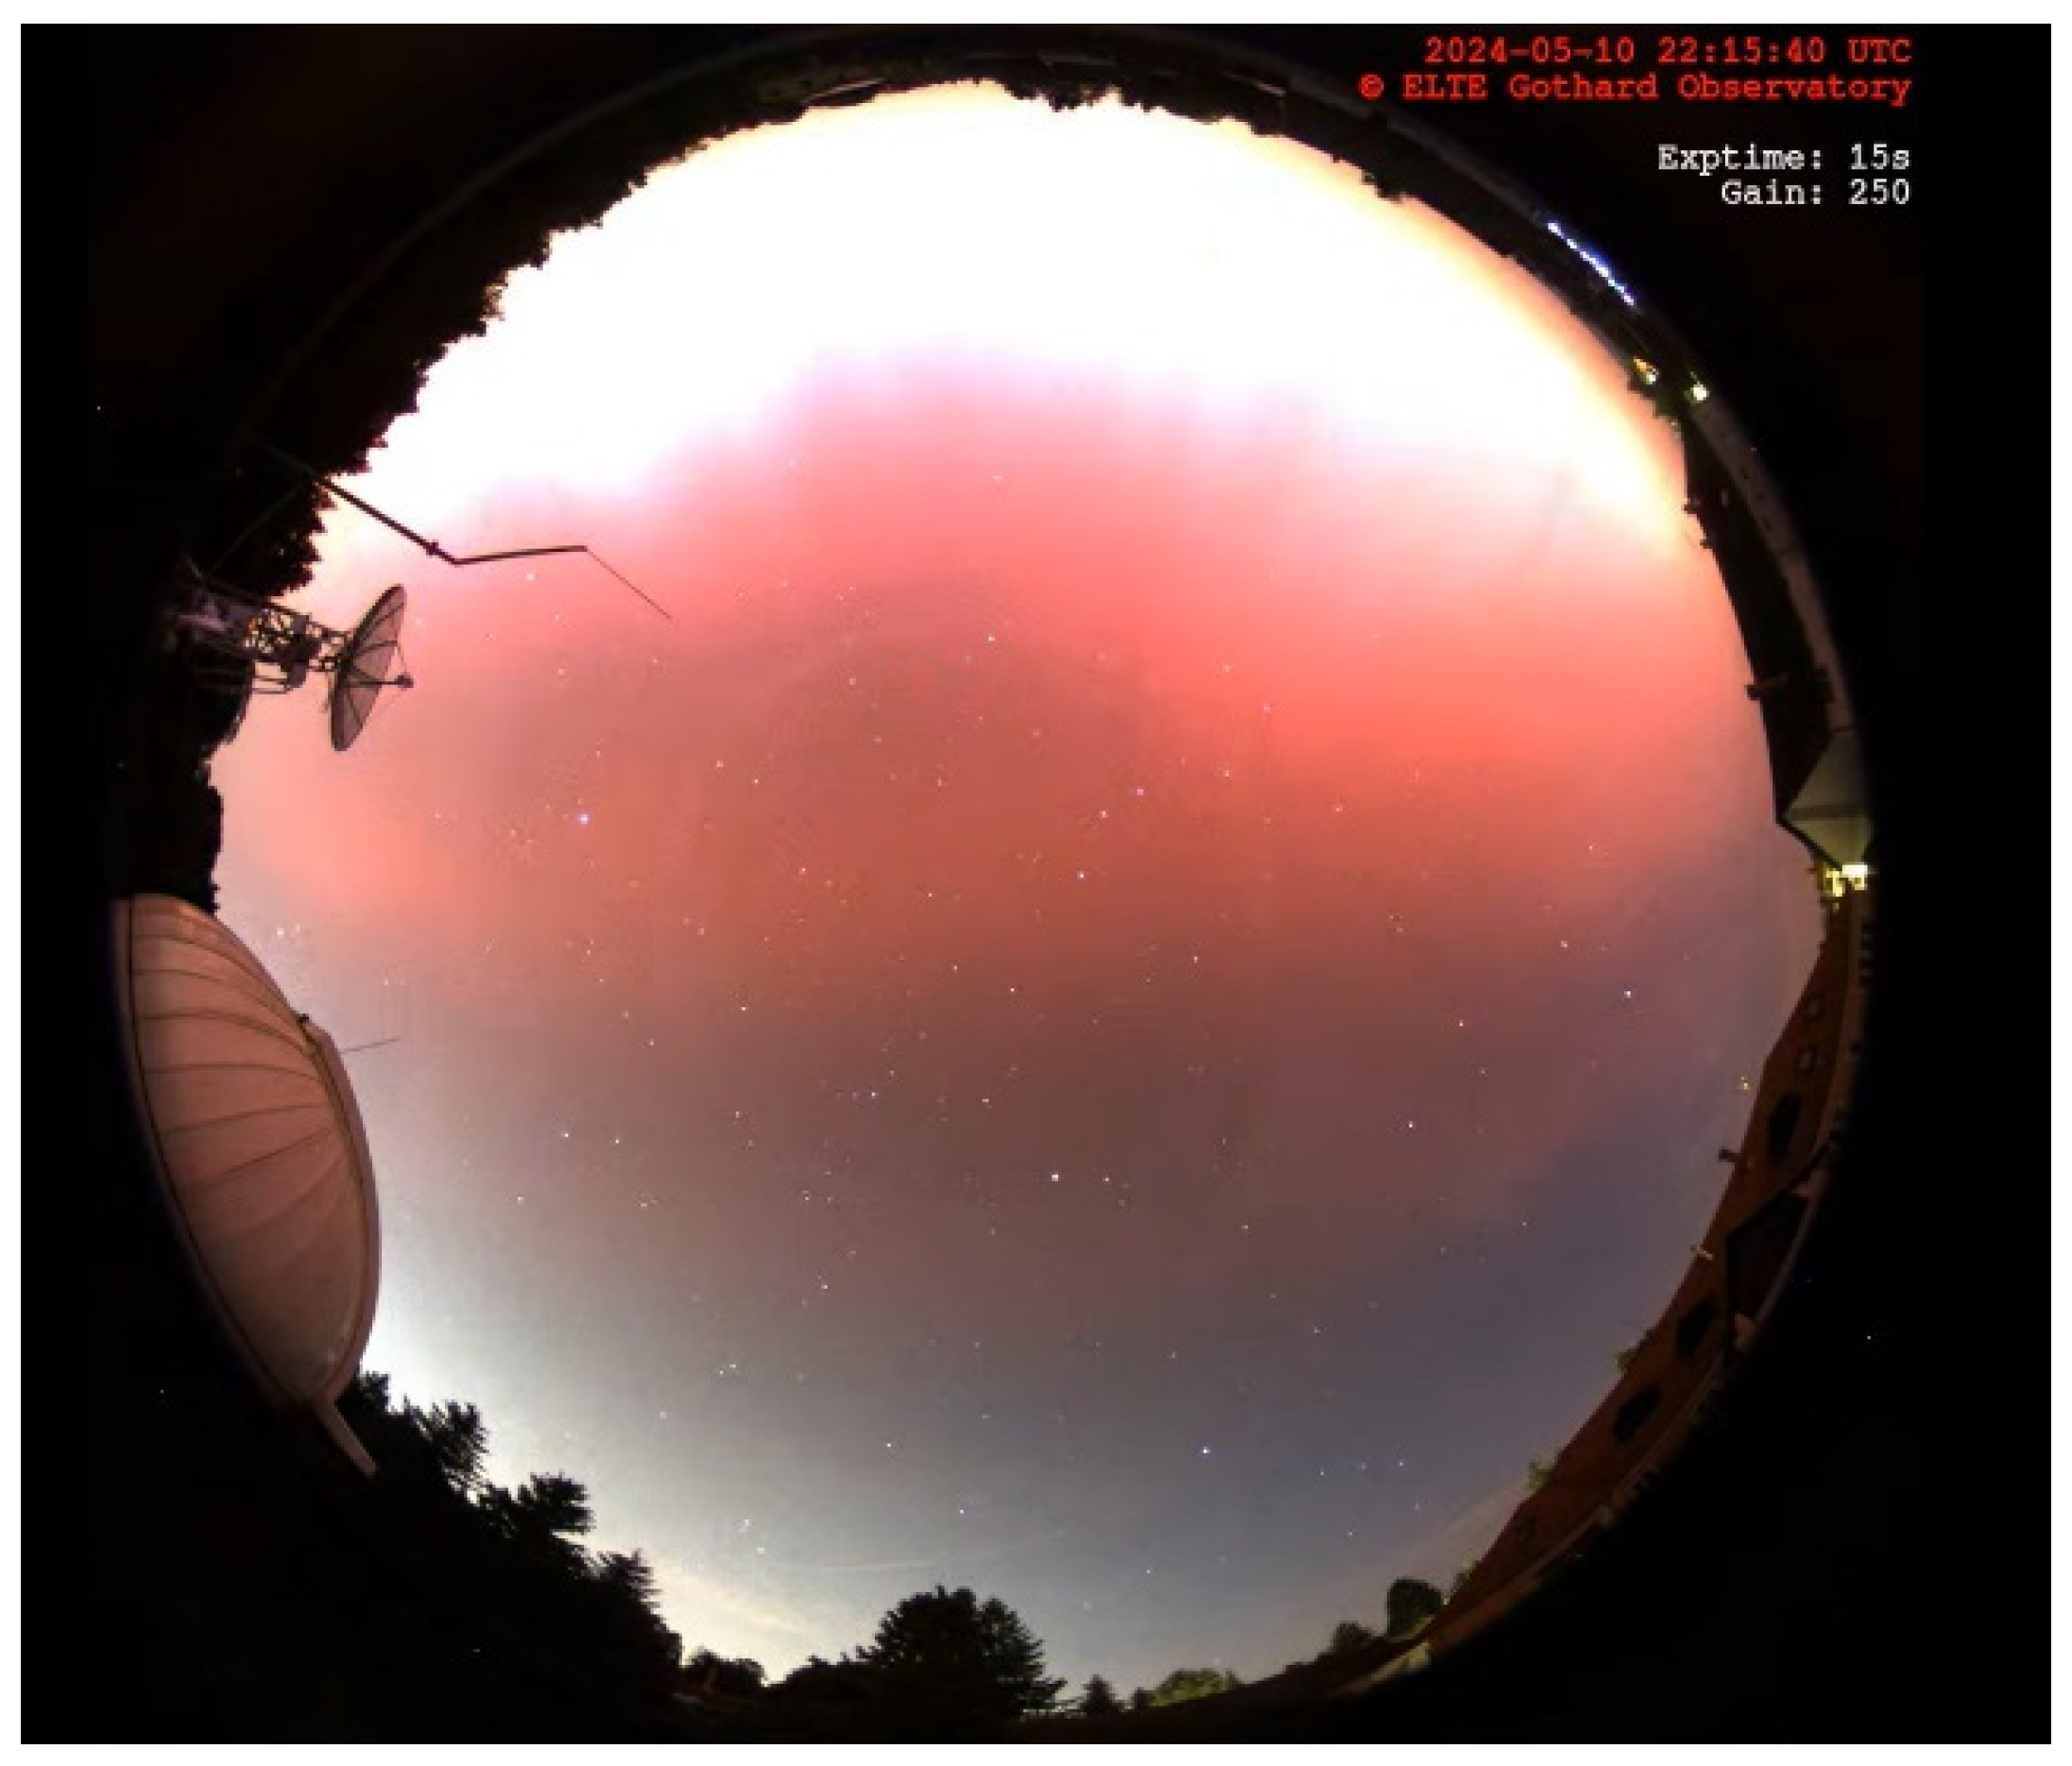
At this time, the red aurora was at zenith, directly above Szombathely (see Figure A2).
For the green aurora with Equation (A2), where y = 4.2, x = 9.3 and after the calculation
4.2 9.3 · 90 ° = 40.65 ° ,
the top of the green aurora was visible around 40.65° degrees. Using the above-mentioned h = 180 km upper height for the green aurora (after [51]), the d value is determined with Equation (A3) as follows:
180 tan 40.65 ° = 214.51   km
As a result, the estimated horizontal distance between the camera (Szombathely) and the green aurora is around 214.51 km, so the aurora was above Brno (49.2°N lat, 49.39°N mlat, see Figure A8 for the location). The ionogram recorded at Pruhonice at this time shows an intense auroral Es, see Figure A6. An optical observation of the aurora recorded at Doba (Hungary, Figure A7b) at 22:15 UT also shows the presence of green aurora (Figure A9b).
The exact calculation for 22:50 UT is as follows:
The SAR was almost at zenith at this time over Manciano, Italy (42.6°N lat, see Figure A8).
For the red aurora with Equation (A2), where y = 2.7, x = 8.3 and after the calculation
2.7 8.3 · 90 ° = 29.28 ° ,
the top of the red aurora was visible around 29.28° degrees. Using the above-mentioned h = 300 km upper height for the red aurora (after [52]), the d value is determined with Equation (A3) as follows:
300 tan 29.28 ° = 535.7   km
As a result, the red aurora’s estimated horizontal distance from Manciano is ~536 km (see Figure A8 for the location), which is in the line of Szombathely, Hungary. The all-sky camera records from Szombathely at this time strengthened this computation.
The closeness of the red aurora is confirmed by the image taken at Pesaro, Italy (Figure A7c, for the source, see Acknowledgement).
Figure A8 is a summary map, illustrating the locations of the used Digisondes, the all-sky cameras and optical observations for easier interpretation.
Figure A2. The all-sky camera image used for the estimations at 22:15 UT (10 May 2024), Szombathely, Hungary.
Remotesensing 17 02492 g0a2
Figure A3. Configuration and interpretation of the all-sky camera. Panel (a) shows the configuration of the all-sky images, how the c and b parameters can be determined from them, and panel (b) shows the zenith and the 90 degree on such an image.
Remotesensing 17 02492 g0a3
Figure A4. Determination of the parameters for geographic location determination from all-sky camera images. From panel (a) the x and y (the proportion of the aurora on the captured image) can be measured and quantified. Panel (b) shows the angle α (angle between the location of the all-sky camera and the top of the aurora) which is used for the calculation, see the details in the text.
Remotesensing 17 02492 g0a4
Figure A5. Ionogram from Pruhonice at 20:30 UT (10 May 2024).
Remotesensing 17 02492 g0a5
Figure A6. Ionogram from Pruhonice at 22:15 UT (10 May 2024).
Remotesensing 17 02492 g0a6
Figure A7. Optical aurora borealis observations, (a) from Fonyód, Hungary at 20:43 UT (10 May 2024), (b) from Doba, Hungary at 22:15 UT (10 May 2024), (c) from Pesaro, Italy at 22:52 UT (10 May 2024).
Remotesensing 17 02492 g0a7
Figure A8. (a) Locations of the Digisondes, all-sky cameras and optical aurora observations. Red for the Digisondes, orange for the all-sky cameras, green for regular optical images and yellow for the reference points of the calculated position of the auroras. (b) The selected PPN-SOR meridional station chain used for the IU, IL indices for the studied interval.
Remotesensing 17 02492 g0a8
Figure A9. The amplitude method for San Vito at 5 MHz. The ionospheric absorption investigation with the amplitude method for Sopron. (a,b,d,e) portray the GOES satellite X-ray flux and integrated proton flux data for the quiet and the disturbed period, respectively. (c) shows the calculated ionospheric absorption data at 5 MHz for the quiet period and (f) the calculated ionospheric absorption for the disturbed period at 5 MHz. The green bars mark the intervals when the layer frequency went under 5 MHz; the grey bars mark the intervals of the “fade-out periods”.
Remotesensing 17 02492 g0a9
Figure A10. The GUVI measured O/N2 ratio for the 2024 May storm period.
Remotesensing 17 02492 g0a10

References

  1. Spogli, L.; Alberti, T.; Bagiacchi, P.; Cafarella, L.; Cesaroni, C.; Cianchini, G.; Coco, I.; Di Mauro, D.; Ghidoni, R.; Giannattasio, F.; et al. The effects of the May 2024 Mother’s Day superstorm over the Mediterranean sector: From data to public communication. ESS Open Arch. 2024. [Google Scholar] [CrossRef]
  2. Das, S.K.; Stolle, C.; Yamazaki, Y.; Rodríguez-Zuluaga, J.; Wan, X.; Kervalishvili, G.; Rauberg, J.; Zhong, J.; Perwitasari, S. On the F-region ionospheric plasma density distribution and irregularities response during the May-2024 geomagnetic storm observed by LEO satellites. Geophys. Res. Lett. 2025, 52. [Google Scholar] [CrossRef]
  3. Aa, E.; Chen, Y.; Luo, B. Dynamic Expansion and Merging of the Equatorial Ionization Anomaly During the 10–11 May 2024 Super Geomagnetic Storm. Remote. Sens. 2024, 16, 4290. [Google Scholar] [CrossRef]
  4. Aa, E.; Zhang, S.; Lei, J.; Huang, F.; Erickson, P.J.; Coster, A.J.; Luo, B.; Kerr, R.B. Significant Midlatitude Plasma Density Peaks and Dual-Hemisphere SED During the 10–11 May 2024 Super Geomagnetic Storm. J. Geophys. Res. Space Phys. 2024, 129, 3360. [Google Scholar] [CrossRef]
  5. Bojilova, R.; Mukhtarov, P.; Pancheva, D. Global Ionospheric Response During Extreme Geomagnetic Storm in May 2024. Remote. Sens. 2024, 16, 4046. [Google Scholar] [CrossRef]
  6. Pierrard, V.; Winant, A.; Botek, E.; de Bonhome, M.P. The Mother’s Day Solar Storm of 11 May 2024 and Its Effect on Earth’s Radiation Belts. Universe 2024, 10, 391. [Google Scholar] [CrossRef]
  7. Carmo, C.S.; Dai, L.; Wrasse, C.M.; Barros, D.; Takahashi, H.; Figueiredo, C.A.O.B.; Wang, C.; Li, H.; Liu, Z. Ionospheric Response to the Extreme 2024 Mother’s Day Geomagnetic Storm Over the Latin American Sector. Space Weather. 2024, 22, 4054. [Google Scholar] [CrossRef]
  8. Gonzalez-Esparza, J.A.; Sanchez-Garcia, E.; Sergeeva, M.; Corona-Romero, P.; Gonzalez-Mendez, L.X.; Valdes-Galicia, J.F.; Aguilar-Rodriguez, E.; Rodriguez-Martinez, M.; Ramirez-Pacheco, C.; Castellanos, C.I.; et al. The Mother’s Day Geomagnetic Storm on 10 May 2024: Aurora Observations and Low Latitude Space Weather Effects in Mexico. Space Weather. 2024, 22, 4111. [Google Scholar] [CrossRef]
  9. Lazzús, J.; Salfate, I. Report on the effects of the May 2024 Mother’s day geomagnetic storm observed from Chile. J. Atmos. Sol.-Terr. Phys. 2024, 261, 106304. [Google Scholar] [CrossRef]
  10. Paul, K.S.; Moses, M.; Haralambous, H.; Oikonomou, C. Effects of the Mother’s Day Superstorm (10–11 May 2024) over the Global Ionosphere. Remote. Sens. 2025, 17, 859. [Google Scholar] [CrossRef]
  11. Liu, X.; Xu, J.; Yue, J.; Wang, W.; Moro, J. Mesosphere and Lower Thermosphere Temperature Responses to the May 2024 Mother’s Day Storm. Geophys. Res. Lett. 2025, 52, 2179. [Google Scholar] [CrossRef]
  12. Wang, X.; Aa, E.; Chen, Y.; Zhang, J.; Zhu, Y.; Cai, L.; Lu, X.; Luo, B.; Liu, S.; Li, M.; et al. Midlatitude Neutral Wind Response During the Mother’s Day Super-Intense Geomagnetic Storm in 2024 Using Observations from the Chinese Meridian Project. J. Geophys. Res. Space Phys. 2025, 130, 3574. [Google Scholar] [CrossRef]
  13. Singh, R.; Scipión, D.E.; Kuyeng, K.; Condor, P.; De La Jara, C.; Velasquez, J.P.; Flores, R.; Ivan, E.; Souza, J.R.; Migliozzi, M. Ionospheric Disturbances Observed Over the Peruvian Sector During the Mother’s Day Storm (G5-Level) on 10–12 May 2024. J. Geophys. Res. Space Phys. 2024, 129, e2024JA033003. [Google Scholar] [CrossRef]
  14. Karan, D.K.; Martinis, C.R.; Daniell, R.E.; Eastes, R.W.; Wang, W.; McClintock, W.E.; Michell, R.G.; England, S. GOLD Observations of the Merging of the Southern Crest of the Equatorial Ionization Anomaly and Aurora During the 10 and 11 May 2024 Mother’s Day Super Geomagnetic Storm. Geophys. Res. Lett. 2024, 51, 632. [Google Scholar] [CrossRef]
  15. Pierrard, V.; Verhulst, T.G.W.; Chevalier, J.-M.; Bergeot, N.; Winant, A. Effects of the Geomagnetic Superstorms of 10–11 May 2024 and 7–11 October 2024 on the Ionosphere and Plasmasphere. Atmosphere 2025, 16, 299. [Google Scholar] [CrossRef]
  16. Buonsanto, M. Ionospheric Storms—A Review. Space Sci. Rev. 1999, 88, 563–601. [Google Scholar] [CrossRef]
  17. Prölss, G.W. Ionospheric F-region storms. Handbook of Atmospheric Electrodynamics; CRC Press: Boca Raton, FL, USA, 1995; Volume 2, Chapter 8; pp. 195–248. Available online: https://cir.nii.ac.jp/crid/1570291225295033472 (accessed on 2 November 2022).
  18. Balan, N.; Shiokawa, K.; Otsuka, Y.; Kikuchi, T.; Lekshmi, D.V.; Kawamura, S.; Yamamoto, M.; Bailey, G.J. A physical mechanism of positive ionospheric storms at low latitudes and midlatitudes. J. Geophys. Res. 2010, 115, A02304. [Google Scholar] [CrossRef]
  19. Balan, N.; Liu, L.; Le, H. A brief review of equatorial ionization anomaly and ionospheric irregularities. Earth Planet. Phys. 2018, 2, 257–275. [Google Scholar] [CrossRef]
  20. Berényi, K.A.; Heilig, B.; Urbář, J.; Kouba, D.; Kis, Á.; Barta, V. Comprehensive analysis of the ionospheric response to the largest geomagnetic storms from solar cycle 24 over Europe. Front. Astron. Space Sci. 2023, 10, 1092850. [Google Scholar] [CrossRef]
  21. Danilov, A. Ionospheric F-region response to geomagnetic disturbances. Adv. Space Res. 2013, 52, 343–366. [Google Scholar] [CrossRef]
  22. Prölss, G.W. Ionospheric Storms at Mid-Latitude: A Short Review. Geophys. Monogr. Ser. 2008, 181, 9–24. [Google Scholar] [CrossRef]
  23. Tsurutani, B.T.; Verkhoglyadova, O.P.; Mannucci, A.J.; Saito, A.; Araki, T.; Yumoto, K.; Tsuda, T.; Abdu, M.A.; Sobral, J.H.A.; Gonzalez, W.D.; et al. Prompt penetration electric fields (PPEFs) and their ionospheric effects during the great magnetic storm of 30–31 October 2003. J. Geophys. Res. Space Phys. 2008, 113, A05311. [Google Scholar] [CrossRef]
  24. Heilig, B.; Stolle, C.; Kervalishvili, G.; Rauberg, J.; Miyoshi, Y.; Tsuchiya, F.; Kumamoto, A.; Kasahara, Y.; Shoji, M.; Nakamura, S.; et al. Relation of the Plasmapause to the Midlatitude Ionospheric Trough, the Sub-Auroral Temperature Enhancement and the Distribution of Small-Scale Field Aligned Currents as Observed in the Magnetosphere by THEMIS, RBSP, and Arase, and in the Topside Ionosphere by Swarm. J. Geophys. Res. Space Phys. 2022, 127, e2021JA029646. [Google Scholar] [CrossRef]
  25. Heilig, B.; Lühr, H. New plasmapause model derived from CHAMP field-aligned current signatures. Ann. Geophys. 2013, 31, 529–539. [Google Scholar] [CrossRef]
  26. Heilig, B.; Lühr, H. Quantifying the relationship between the plasmapause and the inner boundary of small-scale field-aligned currents, as deduced from Swarm observations. Ann. Geophys. 2018, 36, 595–607. [Google Scholar] [CrossRef]
  27. Polekh, N.; Chernigovskaya, M.; Yakovleva, O. On the formation of the F1 layer during sudden stratospheric warming events. Solnechno-Zemnaya Fiz. 2019, 5, 117–127. [Google Scholar] [CrossRef]
  28. Deminov, M.G.; Romanova, E.B.; Tashchilin, A.V. Origination of G conditions in the ionospheric F region depending on solar and geomagnetic activity. Geomagn. Aeron. 2011, 51, 669–675. [Google Scholar] [CrossRef]
  29. Mošna, Z.; Barta, V.; Berényi, K.A.; Mielich, J.; Verhulst, T.; Kouba, D.; Urbář, J.; Chum, J.; Knížová, P.K.; Marew, H.; et al. The March and April 2023 ionospheric storms over Europe. Front. Astron. Space Sci. 2024, 11, 1462160. [Google Scholar] [CrossRef]
  30. Lobzin, V.V.; Pavlov, A.V. G condition in the F2 region peak electron density: A statistical study. Ann. Geophys. 2002, 20, 523–537. [Google Scholar] [CrossRef]
  31. Moro, J.; Xu, J.; Denardini, C.M.; Resende, L.C.A.; Da Silva, L.A.; Chen, S.S.; Carrasco, A.J.; Liu, Z.; Wang, C.; Schuch, N.J. Different Sporadic-E (Es) Layer Types Development During the August 2018 Geomagnetic Storm: Evidence of Auroral Type (Esa) Over the SAMA Region. J. Geophys. Res. Space Phys. 2022, 127, e2021JA029701. [Google Scholar] [CrossRef]
  32. Reinisch, B.W.; Galkin, I.A. Global ionospheric radio observatory (GIRO). Earth Planets Space 2011, 63, 377–381. [Google Scholar] [CrossRef]
  33. Reinisch, B.; Huang, X.; Galkin, I.; Paznukhov, V.; Kozlov, A. Recent advances in real-time analysis of ionograms and ionospheric drift measurements with digisondes. J. Atmos. Sol.-Terr. Phys. 2005, 67, 1054–1062. [Google Scholar] [CrossRef]
  34. Bór, J.; Sátori, G.; Barta, V.; Szabóné-André, K.; Szendrői, J.; Wesztergom, V.; Bozóki, T.; Buzás, A.; Koronczay, D. Measurements of atmospheric electricity in the Széchenyi István Geophysical Observatory, Hungary. Hist. Geo- Space Sci. 2020, 11, 53–70. [Google Scholar] [CrossRef]
  35. Bilitza, D.; Pezzopane, M.; Truhlik, V.; Altadill, D.; Reinisch, B.W.; Pignalberi, A. The International Reference Ionosphere Model: A Review and Description of an Ionospheric Benchmark. Rev. Geophys. 2022, 60, e2022RG000792. [Google Scholar] [CrossRef]
  36. Bilitza, D.; Rawer, K. New options for IRI electron density in the middle ionosphere. Adv. Space Res. 1990, 10, 7–16. [Google Scholar] [CrossRef]
  37. Verhulst, T.G.W.; Stankov, S.M.; Verhulst, T.G.W.; Stankov, S.M. The Changing Shape of the Ionosphere During a Solar Eclipse. URSI Radio Sci. Lett. 2023, 4, 68. [Google Scholar] [CrossRef]
  38. Buzás, A.; Kouba, D.; Mielich, J.; Burešová, D.; Mošna, Z.; Knížová, P.K.; Barta, V. Investigating the effect of large solar flares on the ionosphere based on novel Digisonde data comparing three different methods. Front. Astron. Space Sci. 2023, 10, 1201625. [Google Scholar] [CrossRef]
  39. Kallio, E.I.; Pulkkinen, T.I.; Koskinen, H.E.J.; Viljanen, A.; Slavin, J.A.; Ogilvie, K. Loading-unloading processes in the nightside ionosphere. Geophys. Res. Lett. 2000, 27, 1627–1630. [Google Scholar] [CrossRef]
  40. Kauristie, K.; Sergeev, V.A.; Pulkkinen, T.I.; Pellinen, R.J.; Angelopoulos, V.; Baumjohann, W. Study on the ionospheric signatures of the plasma sheet bubbles. In International Conference on Substorms, Proceedings of the 3rd International Conference, Versailles, France, 12–17 May 1996; ESA SP-389; Rolfe, E.J., Kaldeich, B., Eds.; European Space Agency: Paris, France, 1996; p. 93. Available online: https://adsabs.harvard.edu/full/1996ESASP.389...93K (accessed on 13 May 2025).
  41. Viljanen, A.; Hakkinen, L. IMAGE Magnetometer Network, in Satellite-Ground Based Coordination Sourcebook; ESA Publications—European Space Agency: Noordwijk, The Netherlands, 1997. [Google Scholar]
  42. Tanskanen, E.I.; Viljanen, A.; Pulkkinen, T.I.; Pirjola, R.; Häkkinen, L.; Pulkkinen, A.; Amm, O. At substorm onset, 40% of AL comes from underground. J. Geophys. Res. 2001, 106, 13119–13134. [Google Scholar] [CrossRef]
  43. Friis-Christensen, E.; Lühr, H.; Hulot, G. Swarm: A constellation to study the Earth’s magnetic field. Earth Planets Space 2006, 58, 351–358. [Google Scholar] [CrossRef]
  44. Olsen, N.; Friis-Christensen, E.; Floberghagen, R.; Alken, P.; Beggan, C.D.; Chulliat, A.; Doornbos, E.; da Encarnação, J.T.; Hamilton, B.; Hulot, G.; et al. The Swarm Satellite Constellation Application and Research Facility (SCARF) and Swarm data products. Earth Planets Space 2013, 65, 1189–1200. [Google Scholar] [CrossRef]
  45. Evans, J.S.; Correira, J.; Lumpe, J.D.; Eastes, R.W.; Gan, Q.; Laskar, F.I.; Aryal, S.; Wang, W.; Burns, A.G.; Beland, S.; et al. GOLD Observations of the Thermospheric Response to the 10–12 May 2024 Gannon Superstorm. Geophys. Res. Lett. 2024, 51, e2024GL110506. [Google Scholar] [CrossRef]
  46. Hayakawa, H.; Ebihara, Y.; Mishev, A.; Koldobskiy, S.; Kusano, K.; Bechet, S.; Yashiro, S.; Iwai, K.; Shinbori, A.; Mursula, K.; et al. The Solar and Geomagnetic Storms in 2024 May: A Flash Data Report. Astrophys. J. 2025, 979, 49. [Google Scholar] [CrossRef]
  47. Buresova, D.; Lastovicka, J.; Hejda, P.; Bochnicek, J. Ionospheric disturbances under low solar activity conditions. Adv. Space Res. 2014, 54, 185–196. [Google Scholar] [CrossRef]
  48. Berényi, K.A.; Perrone, L.; Sabbagh, D.; Scotto, C.; Ippolito, A.; Kis, Á.; Barta, V. Ionosonde Measurement Comparison during an Interplanetary Coronal Mass Ejection (ICME)- and a Corotating Interaction Region (CIR)-Driven Geomagnetic Storm over Europe. Universe 2024, 10, 344. [Google Scholar] [CrossRef]
  49. Szárnya, C.; Mošna, Z.; Igaz, A.; Kouba, D.; Verhulst, T.G.W.; Knížová, P.K.; Podolská, K.; Barta, V. Technical Possibilities and Limitations of the DPS-4D Type of Digisonde in Individual Meteor Detections. Remote Sens. 2024, 16, 2658. [Google Scholar] [CrossRef]
  50. Reinisch, B.W. Digisonde 4D Technical Manual (Version 1.0); Lowell Digisonde International: Lowell, MA, USA, 2009. [Google Scholar]
  51. Whiter, D.K.; Partamies, N.; Gustavsson, B.; Kauristie, K. The altitude of green OI 557.7 nm and blue N2+ 427.8 nm aurora. Ann. Geophys. 2023, 41, 1–12. [Google Scholar] [CrossRef]
  52. Jackel, B.J.; Creutzberg, F.; Donovan, E.F.; Cogger, L.L. Triangulation of Auroral Red-Line Emission Heights; Sodankylä Geophysical Observatory Publications: Sodankylä, Finland, 2003; Volume 92, pp. 97–100. Available online: https://aurora.phys.ucalgary.ca/public/for_emma/Gillies_agu/LitReview/jackel_triangulation_oulu_2003.pdf (accessed on 5 February 2025).
  53. Piggott, W.R.; Rawer, K. U.R.S.I. Handbook of Ionogram Interpretation and Reduction. 1978. Available online: https://repository.library.noaa.gov/view/noaa/10404 (accessed on 25 October 2024).
  54. Belehaki, A.; Tsagouri, I.; Altadill, D.; Blanch, E.; Borries, C.; Buresova, D.; Chum, J.; Galkin, I.; Juan, J.M.; Segarra, A.; et al. An overview of methodologies for real-time detection, characterisation and tracking of traveling ionospheric disturbances developed in the TechTIDE project. J. Space Weather Space Clim. 2020, 10, 42. [Google Scholar] [CrossRef]
  55. Ventriglia, V.; Guerra, M.; Cesaroni, C.; Spogli, L.; Altadill, D.; Segarra, A.; Galkin, I.; Barta, V.; Verhulst, T.G.; de Paula, V.; et al. An explainable Machine Learning model for Large-Scale Travelling Ionospheric Disturbances forecasting. J. Space Weather Space Clim. 2025, 15. [Google Scholar] [CrossRef]
  56. Barta, V.; Sátori, G.; Berényi, K.A.; Kis, Á.; Williams, E. Effects of solar flares on the ionosphere as shown by the dynamics of ionograms recorded in Europe and South Africa. Ann. Geophys. 2019, 37, 747–761. [Google Scholar] [CrossRef]
  57. Tao, C.; Nishioka, M.; Saito, S.; Shiota, D.; Watanabe, K.; Nishizuka, N.; Tsugawa, T.; Ishii, M. Statistical analysis of short-wave fadeout for extreme space weather event estimation. Earth Planets Space 2020, 72, 173. [Google Scholar] [CrossRef]
  58. Paul, K.S.; Haralambous, H.; Moses, M.; Oikonomou, C.; Potirakis, S.M.; Bergeot, N.; Chevalier, J.-M. Investigation of the Ionospheric Response on Mother’s Day 2024 Geomagnetic Superstorm over the European Sector. Atmosphere 2025, 16, 180. [Google Scholar] [CrossRef]
  59. Vichare, G.; Bagiya, M.S. Manifestations of Strong IMF-By on the Equatorial Ionospheric Electrodynamics During 10 May 2024 Geomagnetic Storm. Geophys. Res. Lett. 2024, 51, e2024GL112569. [Google Scholar] [CrossRef]
  60. Kelley, M.C.; Makela, J.J.; de La Beaujardière, O.; Retterer, J. Convective Ionospheric Storms: A Review. Rev. Geophys. 2011, 49. [Google Scholar] [CrossRef]
  61. Woodman, R.F. Spread F – an old equatorial aeronomy problem finally resolved? Ann. Geophys. 2009, 27, 1915–1934. [Google Scholar] [CrossRef]
  62. Woodman, R.F.; La Hoz, C. Radar observations of F region equatorial irregularities. J. Geophys. Res. 1976, 81, 5447–5466. [Google Scholar] [CrossRef]
  63. Huang, C.-S. Occurrence of Equatorial Plasma Bubbles during Intense Magnetic Storms. Int. J. Geophys. 2011, 2011, 401858. [Google Scholar] [CrossRef]
  64. Sripathi, S.; Abdu, M.A.; Patra, A.K.; Ghodpage, R.N. Unusual Generation of Localized EPB in the Dawn Sector Triggered by a Moderate Geomagnetic Storm. J. Geophys. Res. Space Phys. 2018, 123, 9697–9710. [Google Scholar] [CrossRef]
  65. Ram, S.T.; Ajith, K.K.; Yamamoto, M.; Otsuka, Y.; Yokoyama, T.; Niranjan, K.; Gurubaran, S. Fresh and evolutionary-type field-aligned irregularities generated near sunrise terminator due to overshielding electric fields. J. Geophys. Res. Space Phys. 2015, 120, 5922–5930. [Google Scholar] [CrossRef]
  66. Wu, K.; Xu, J.; Yue, X.; Xiong, C.; Wang, W.; Yuan, W.; Wang, C.; Zhu, Y.; Luo, J. Equatorial plasma bubbles developing around sunrise observed by an all-sky imager and global navigation satellite system network during storm time. Ann. Geophys. 2020, 38, 163–177. [Google Scholar] [CrossRef]
  67. Carmo, C.S.; Pi, X.; Denardini, C.M.; Figueiredo, C.A.O.B.; Verkhoglyadova, O.P.; Picanço, G.A.S. Equatorial Plasma Bubbles Observed at Dawn and After Sunrise Over South America During the 2015 St. Patrick’s Day Storm. J. Geophys. Res. Space Phys. 2022, 127, 9934. [Google Scholar] [CrossRef]
  68. Karan, D.K.; Martinis, C.R.; Eastes, R.W.; Daniell, R.E.; McClintock, W.E.; Huang, C. GOLD Observations of Equatorial Plasma Bubbles Reaching Mid-Latitudes During the 23 April 2023 Geomagnetic Storm. Space Weather. 2024, 22, e2023SW003847. [Google Scholar] [CrossRef]
  69. Jones, D.G.; Walker, I.K.; Kersley, L. Structure of the poleward wall of the trough and the inclination of the geomagnetic field above the EISCAT radar. Ann. Geophys. 1997, 15, 740–746. [Google Scholar] [CrossRef]
  70. Karpachev, A. Longitudinal variations in the position and magnitude of the poleward wall of the ionospheric trough in the southern hemisphere. Adv. Space Res. 2023, 71, 4374–4381. [Google Scholar] [CrossRef]
  71. Mannucci, A.J.; Tsurutani, B.T.; Iijima, B.A.; Komjathy, A.; Saito, A.; Gonzalez, W.D.; Guarnieri, F.L.; Kozyra, J.U.; Skoug, R. Dayside global ionospheric response to the major interplanetary events of October 29–30, 2003 “Halloween Storms”. Geophys. Res. Lett. 2005, 32, L12S02. [Google Scholar] [CrossRef]
  72. Martinis, C.; Baumgardner, J.; Mendillo, M.; Wroten, J.; Coster, A.; Paxton, L. The night when the auroral and equatorial ionospheres converged. J. Geophys. Res. Space Phys. 2014, 120, 8085–8095. [Google Scholar] [CrossRef]
  73. Akasofu, S.-I. Electrodynamics of the magnetosphere: Geomagnetic storms. Space Sci. Rev. 1966, 6, 21–143. [Google Scholar] [CrossRef]
  74. Astafyeva, E.; Maletckii, B.; Förster, M.; Ouar, I.D.; Huba, J.D.; Hairston, M.R.; Coley, W.R. Electrodynamic and Ionospheric Puzzles of the 10–11 May 2024 Geomagnetic Superstorm. J. Geophys. Res. Space Phys. 2025, 130, e2024JA033284. [Google Scholar] [CrossRef]
  75. Panasenko, S.V.; Aksonova, K.D.; Burešová, D.; Bogomaz, O.V.; Zhivolup, T.G.; Koloskov, O.V. Large-scale traveling ionospheric disturbances over central and eastern Europe during moderate magnetic storm period on 22–24 September 2020. Adv. Space Res. 2023, 72, 4364–4378. [Google Scholar] [CrossRef]
  76. Horvath, I.; Lovell, B.C. Traveling ionospheric disturbances and their relations to storm-enhanced density features and plasma density irregularities in the local evening and nighttime hours of the Halloween superstorms of 29–31 October 2003. J. Geophys. Res. 2010, 115, A09327. [Google Scholar] [CrossRef]
  77. Berényi, K.; Barta, V.; Kis, Á. Midlatitude ionospheric F2-layer response to eruptive solar events-caused geomagnetic disturbances over Hungary during the maximum of the solar cycle 24: A case study. Adv. Space Res. 2018, 61, 1230–1243. [Google Scholar] [CrossRef]
  78. Forbes, J.M. Dynamics of the Thermosphere. J. Meteorol. Soc. Jpn. Ser. II 2007, 85B, 193–213. [Google Scholar] [CrossRef]
  79. Lu, G.; Zakharenkova, I.; Cherniak, I.; Dang, T. Large-Scale Ionospheric Disturbances During the 17 March 2015 Storm: A Model-Data Comparative Study. J. Geophys. Res. Space Phys. 2020, 125, e2019JA027726. [Google Scholar] [CrossRef]
  80. Qian, L.; Burns, A.G.; Emery, B.A.; Foster, B.; Lu, G.; Maute, A.; Richmond, A.D.; Roble, R.G.; Solomon, S.C.; Wang, W. The NCAR TIE-GCM. In Modeling the Ionosphere–Thermosphere System; Huba, J., Schunk, R., Khazanov, G., Eds.; AGU Publications: Malden, MA, USA, 2014. [Google Scholar] [CrossRef]
  81. Huang, C.; Xu, J.-Y.; Zhang, X.-X.; Liu, D.-D.; Yuan, W.; Jiang, G.-Y. Mid-latitude thermospheric wind changes during the St. Patrick’s Day storm of 2015 observed by two Fabry-Perot interferometers in China. Adv. Space Res. 2018, 61, 1873–1879. [Google Scholar] [CrossRef]
  82. Drob, D.P.; Emmert, J.T.; Crowley, G.; Picone, J.M.; Shepherd, G.G.; Skinner, W.; Hays, P.; Niciejewski, R.J.; Larsen, M.; She, C.Y.; et al. An empirical model of the Earth’s horizontal wind fields: HWM07. J. Geophys. Res. 2008, 113. [Google Scholar] [CrossRef]
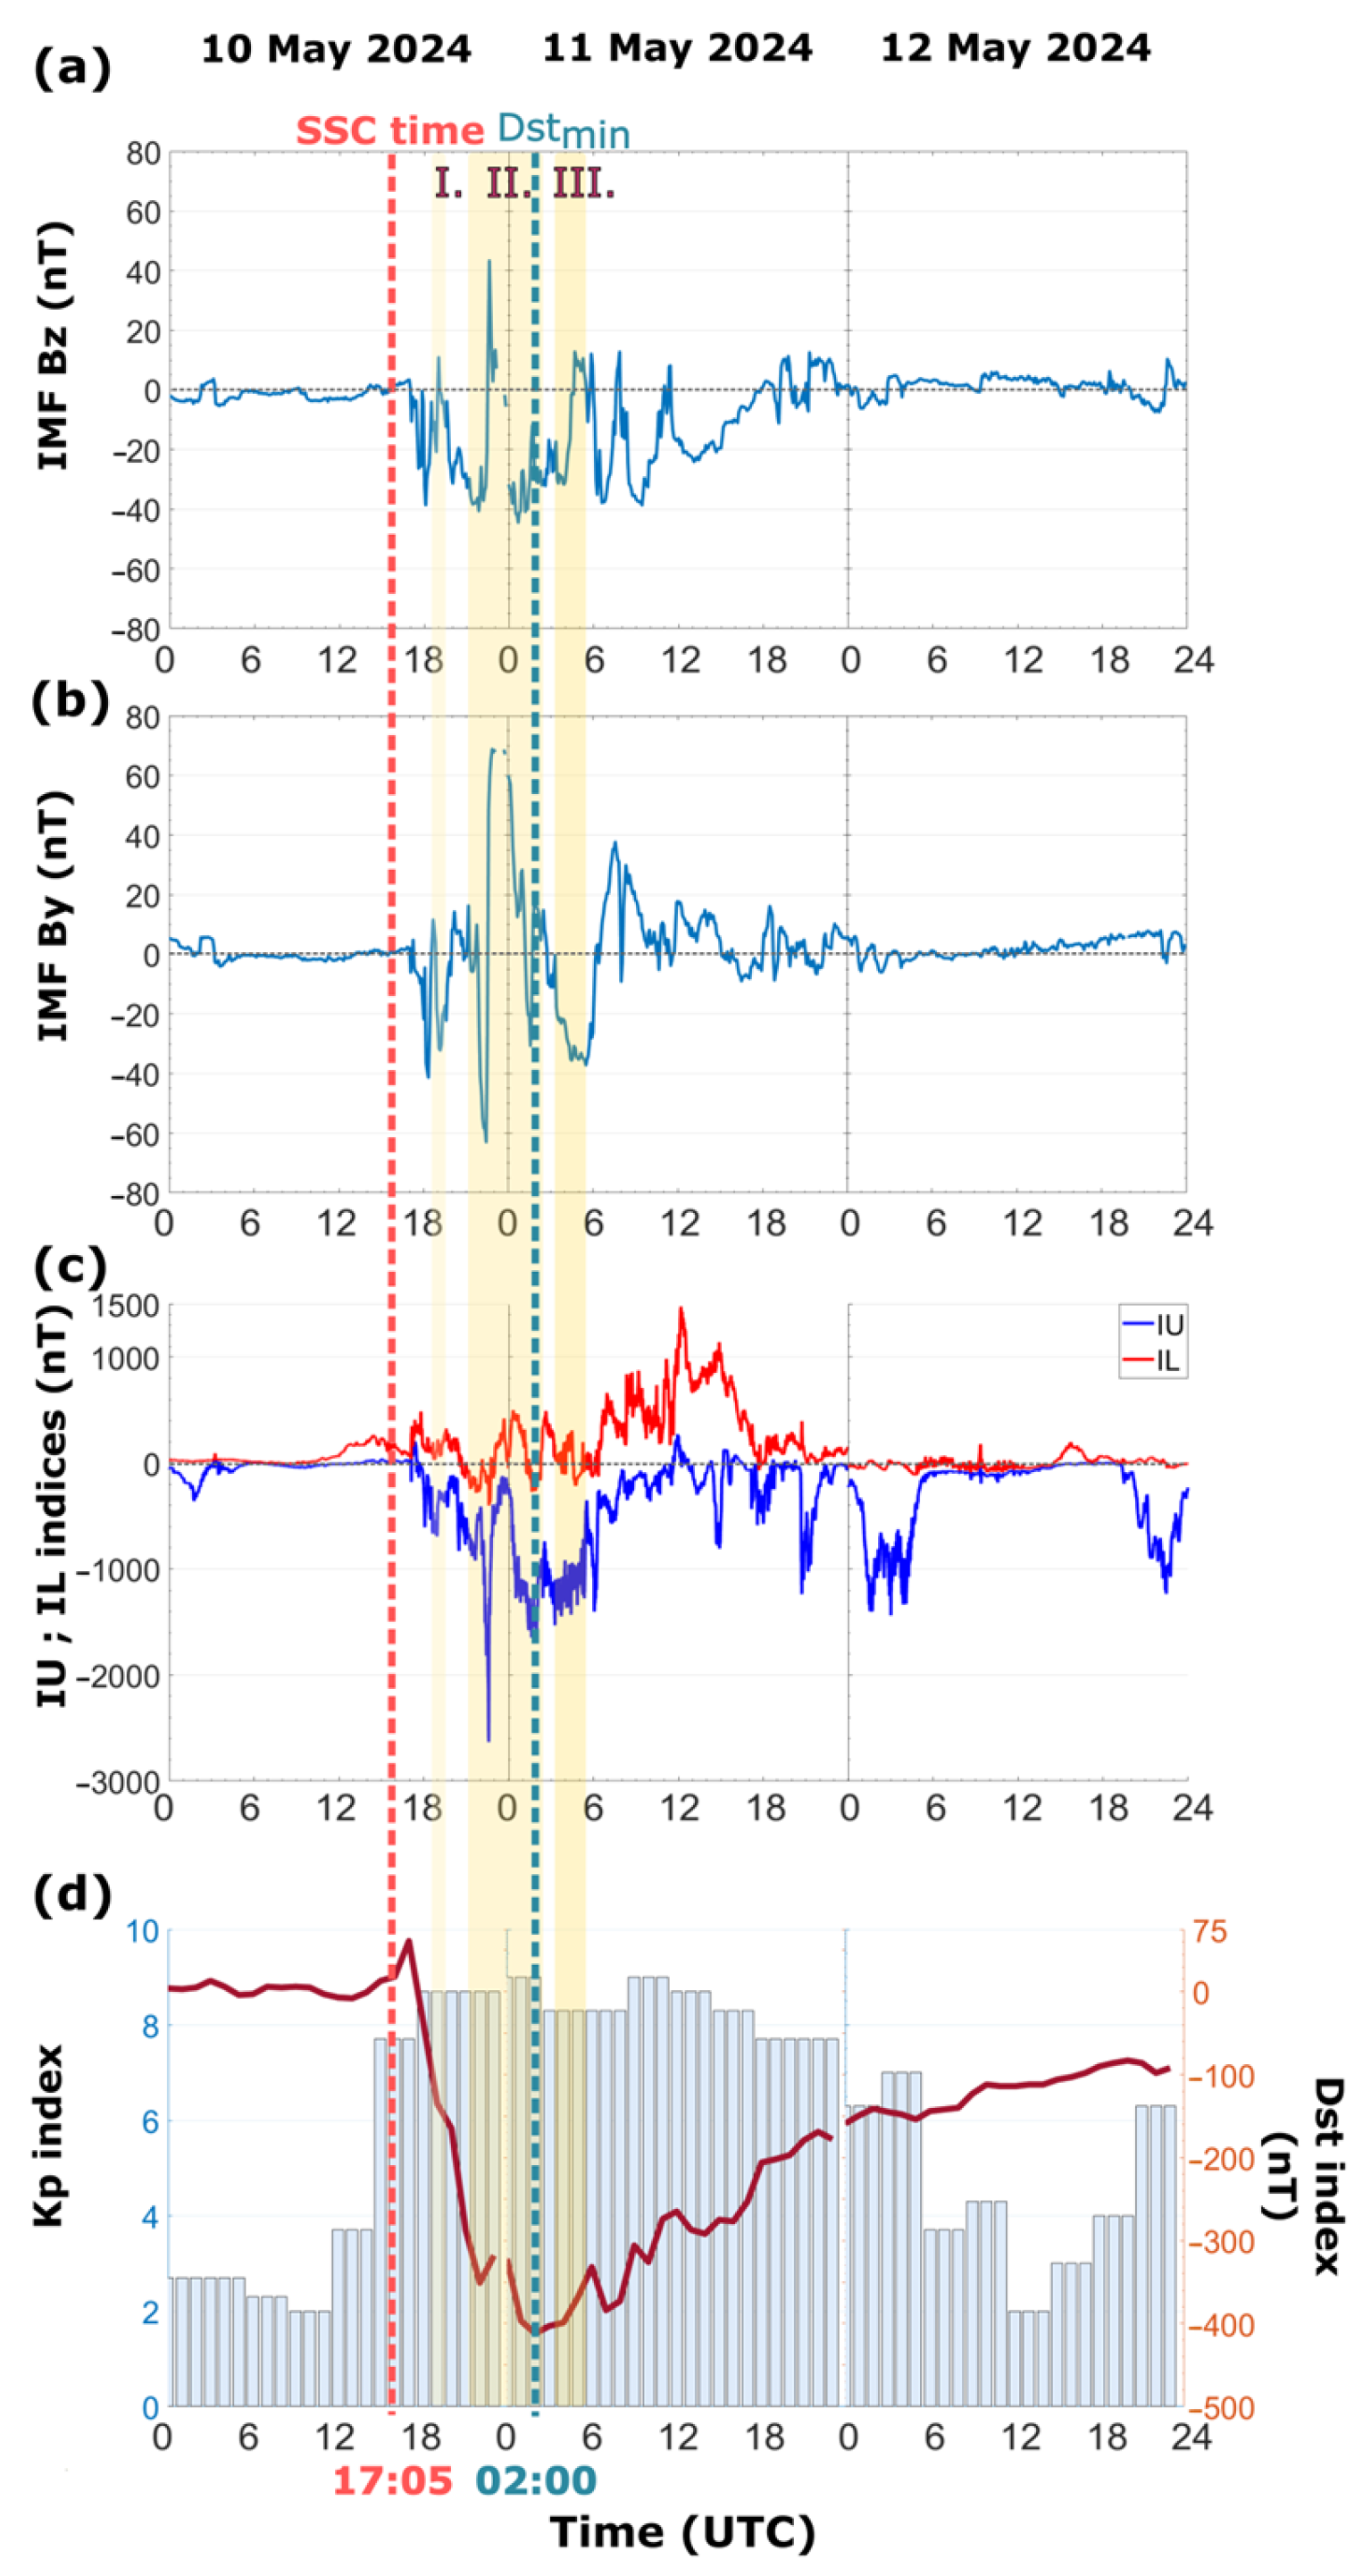
Figure 1. The Bz (panel (a)) and By (panel (b)) component of the interplanetary magnetic field, the IU and IL indices (panel (c)) for the characterization of auroral electrojet (over Europe) and the geomagnetic indices (Kp and Dst; panel (d)) are portrayed during the Mother’s Day storm. Red and blue vertical dashed lines represent the SSC time and the time of the Dst minimum, respectively. Light yellow bars (I, II, III) are indicating the three analyzed F-layer uplift phases (see the detailed description of these phases below in the Section 3.1).
Remotesensing 17 02492 g001
Figure 2. Digisonde F1- and F2-layer measurements during the Mother’s Day storm at Sopron (panel (a,b)) and San Vito (panel (c,d)). F1-layer data: turquoise line for foF1 and h’F1; F2-layer data: dark blue line for foF2 and h’F2. Gray dashed lines represent median values. Auroral layers (green bars), G-condition (magenta bars) and fade-outs (black bars) are shown, with the altitude range of the three Swarm satellites (A, B and C) marked by a yellow horizontal bar.
Remotesensing 17 02492 g002
Figure 3. Compilation of optical all-sky camera images (right column, (c,f,i)) and ionograms (first two columns (a,b,d,e,g,h)). Geographic and geomagnetic coordinates of the optical observation sites are shown in the subplots. Auroral reflections are marked with black frames in the ionograms. Rows 1 and 2 are for Sopron (af), and row 3 is for San Vito (gi). Light/dark blue reflection points indicate NNE/NNW direction, respectively, while red points represent vertical reflections in the ionograms.
Remotesensing 17 02492 g003
Figure 4. The Digisonde-derived B0, B1 (a,b), isodensity data (c,d) and the h’F1 and h’F2 parameter (e,f) are displayed for SO and VT stations during a 24 h time interval (from 12:00 UT 10 May 2024 to 12:00 UT 11 May 2024). Light yellow bars (I, II, III) are indicating the three analyzed F-layer uplift phases.
Remotesensing 17 02492 g004
Figure 5. The ionospheric absorption investigation with the amplitude method for Sopron (a,b,d,e) and the portray of the GOES satellite X-ray flux and integrated proton flux data for the quiet and the disturbed period, respectively. Panel (c) shows the calculated ionospheric absorption data at 3 MHz for the quiet period and panel (f) the calculated ionospheric absorption for the disturbed period at 3 MHz. The green bars mark the intervals when the layer frequency went under 3 MHz; the grey bars mark the intervals of the “fade-out periods”.
Remotesensing 17 02492 g005
Figure 6. Ionospheric plasma density observed by Swarm B at MLT 23.5 between 9–15 May 2024.
Remotesensing 17 02492 g006
Figure 7. Swarm passes over Sopron and San Vito between 9–11 May 2024. Black curves show observations following the SSC, while grey curves represent observations a day earlier for comparison. For each of the four passes (ac), (df), (gi), (jl), ssFAC density (log scale), vertical TEC, and plasma density (log scale) are shown. MLT, UT (at Sopron), and orbit longitude are provided above each block. Vertical dashed and dotted lines mark the positions of San Vito and Sopron, respectively.
Remotesensing 17 02492 g007
Disclaimer/Publisher’s Note: The statements, opinions and data contained in all publications are solely those of the individual author(s) and contributor(s) and not of MDPI and/or the editor(s). MDPI and/or the editor(s) disclaim responsibility for any injury to people or property resulting from any ideas, methods, instructions or products referred to in the content.