Abstract
When vehicles fly at hypersonic speeds, a high-temperature flow field forms and emits intense radiation across some spectral bands. This strong flow field can be seen as a point source and is transmitted to high altitudes through the radiative transfer process. In this study, the corresponding atmospheric profiles were introduced, the databases in high-temperature conditions were established, and the corresponding gas absorption characteristics were further calculated using the line-by-line method. Correspondingly, the radiative transfer processes were calculated by a Monte Carlo model with surface and point sources. The Monte Carlo model is rigorously validated against the VLIDORT model through detailed comparisons. For radiative simulations in the near-space environment, both high-temperature conditions and 3D scenarios are considered. The simulations reveal that the use of high-temperature databases could introduce an error of approximately 3%, and the radiation field exhibits stronger inhomogeneity in the infrared band.
1. Introduction
The near-space region, at altitudes of 20–100 km, is a significant region and the focus of many studies. Hypersonic vehicles have special capabilities in satellite transportation [1]. A vehicle flying at hypersonic speeds generates intense friction with the surrounding atmosphere, with a high-temperature flow field forming around it. Gases in this field undergo chemical reactions and emit intense radiation across the ultraviolet (UV) and infrared (IR) spectral regions [2,3]. The numerical simulation of bow-shock-layer emission is difficult, as multi-component gases within the high-temperature flow field undergo complex physical and chemical processes including internal energy-level excitation, dissociation, ionization, recombination, and photochemical reactions, accompanied by various radiative transition processes such as vibration, rotation, and electron energy-level transitions. As the relaxation time of the various processes differs, gases are in a thermochemical non-equilibrium state, which may increase the radiation intensity by 2–15 times. Theoretical radiation simulation results, with and without consideration of this non-equilibrium effect, may differ by more than 1–2 orders of magnitude. Special models have been designed to solve high-temperature radiation calculations. Ozawa et al. [4] and Nam et al. [5] have presented line-by-line (LBL) models for the calculation of molecular emission in the IR region, and Kumar et al. [6] introduced a k-distribution spectral model to simulate the non-gray radiation of the bow-shock layer.
With the development of hypersonic aerospace targets, there are thus increasing requirements for accuracy and efficiency of target detection. [7]. Earlier detections were IR systems based on the relatively high CO2, CO, and H2O contents of exhaust plumes, whose spectra are focused mainly on peaks at 3703 and 2325 cm−1. However, due to the low-level IR signal characteristics of targets despite continuous improvements in technology, and the complexity of background radiation and false-alarm sources within the field of view of the detector, other detection methods are required to assist IR systems. Ultraviolet detection technology has demonstrated advantages as an alternative means of target detection [2,3,8,9].
After the source radiation field of the bow-shock layer is excited, the radiation still goes through the atmosphere so that the signal can be received by sensors at high altitudes. This requires the consideration of the atmospheric radiative transfer process. Various methods have been developed to solve the radiative transfer equation, including discrete-ordinate methods such as DISORT [10] and VLIDORT [11], adding–doubling methods [12], diffusion approximation methods [13,14], and Monte Carlo methods [15,16]. The performances of different methods have been compared and validated by Saunders et al. [17], Kotchenova et al. [18], Kokhanovsky et al. [19], and Randles et al. [20], with intercomparisons including a range of atmospheric conditions for clouds, aerosols, and solar and observation angles. Results indicate that model bias ranges from 10% to 20%, which is deemed acceptable.
Regular observations such as lidar ceilometers and radiosondes provide atmospheric vertical information [21,22,23]. Radiosonde observations are one of the most basic and important data sources used in studying atmospheric profiles, providing atmospheric information at 0–30 km altitude [24,25]. Sounding data are the basis of most reanalysis and model data, so reanalysis data and model outputs generally reach altitudes of only 30 km. Conventional atmospheric observations cannot meet the needs of radiation transfer simulation. In 1976, Flanagan et al. proposed the US Standard atmosphere [26,27] (hereafter denoted as USSA1976), which provides atmospheric vertical information for up to 120 km altitude including temperature, altitude, pressure, and the concentrations of thirty gases including the seven main atmospheric gases (H2O, CO2, O3, N2O, CO, CH4, and O2). While the USSA1976 provides information on atmospheric components below 120 km, it cannot meet the requirements for higher altitudes. Therefore, the NRLMSIS empirical model is used to obtain information about atmospheric vertical profiles for higher altitudes [28]. The NRLMSIS2.0 model uses parameters such as location, time information, and solar and geomagnetic activity to predict temperature, mass density, and species densities. It simulates parameters from numerical weather prediction reanalysis, satellite limb observations, solar occultation, lidar, and passive remote sensing [28,29]. The NRLMSIS model has long been a popular choice of atmospheric vertical profile model in the research and operations communities, because the comparisons between predictions and satellite observations show the overall stability through technological iteration and addition of new data [30,31,32,33]. With the aid of radiative transfer models, source radiation emission of the bow-shock layer can be considered as a point radiation source at specific heights. However, near-space at altitudes of 20–100 km lies at the mesosphere, thermosphere, and ionosphere, and the high temperatures of these layers mean that only parts of traditional absorption spectroscopic databases can be used. In addition, conventional radiative transfer models usually use the ground source and the solar source as light sources, and are unable to calculate the radiative transfer process under the condition of a point source.
In this study, a forward simulation problem was trying to be solved, which served as the space-borne observation of radiation from high-speed vehicles in the near-space region. To simulate the forward radiative transfer process, two things must be provided: the absorption database of molecules under high temperature, since the near-space region lies at the mesosphere, thermosphere, and ionosphere, and a three-dimensional simulation method, since the radiation source can be treated as a point source. Moreover, the thermal radiation from high-speed vehicles falls into the UV and IR regions. Therefore, this study established the high-temperature absorption databases in the near-space region. A Monte Carlo method with a point source at any location was implemented to simulate the radiative transfer process in the near-space region in the UV and IR bands. Section 2 describes methods and databases used in this paper. Section 3 presents the validation and simulation results of the Monte Carlo model. Section 4 analyzes the influence of the Monte Carlo model’s internal parameter and extends the simulation to the 3D scenarios. Finally, Section 5 concludes this study.
2. Materials and Methods
2.1. NRLMSIS, an Atmospheric Vertical-Profile Empirical Model
To obtain a whole-atmosphere vertical profile for the calculations of gas absorption and radiation transfer processes, especially for upward transmission at an altitude where a signal-receiving device, such as a satellite, is located, it is necessary to combine the USSA1976 and NRLMSIS2.0 models, with the latter providing profile information at altitudes beyond the 120 km limit of the former. Height intervals in the USSA1976 profile are not uniform so it is interpolated to different heights and the NRLMSIS model also requires certain input parameters, as shown in Table 1.

Table 1.
Height intervals of the USSA1976 profile and input parameters of the NRLMSIS model. The F10.7 index refers to the solar radio flux at a wavelength of 10.7 cm. The Ap index is a measure of geomagnetic activity.
Figure 1 shows the two profiles and indicates that number densities in lower layers are far greater than those in higher layers. The water vapor and other trace gas concentrations decay to <1018/m3 (<10 ppm) at ~20 km, while the CO2 concentration drops to <1018/m3 at 50 km, decaying rapidly from 300 ppm to the order of several ppm above 90 km. Maximum gas number densities do not exceed 1018/m3 above 120 km, while at 1000 km only H, He, O, and N2 maintain an order of magnitude of ~1010/m3. In the troposphere and stratosphere below 120 km, the atmospheric temperature profile varies within a narrow range of 200–400 K, but above 120 km, in the mesosphere and thermosphere, it rises rapidly to above 1000 K at 200 km, maintaining this level thereafter. A high-temperature database is thus necessary for radiative transfer calculations in the upper atmosphere.
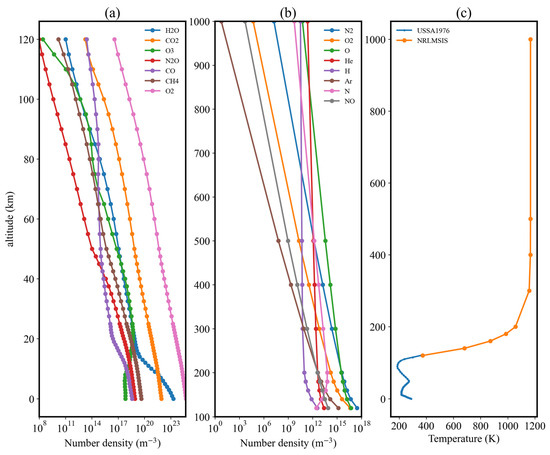
Figure 1.
The 50-layer USSA1976 profile and the generated NRLMSIS vertical profile. (a) Altitude-density plot for the seven main gases included in the USSA1976. (b) The same plot for eight gases in the NRLMSIS model. (c) Altitude–temperature plot for the temperature profile compiled using data from spliced USSA1976 and NRLMSIS models. At the splicing point of 120 km, the temperature of the USSA1976 model is 360.0 K and that of the NRLMSIS model is 373.72 K.
After using these input parameters to generate vertical profiles, the upper and lower profiles provide the number densities of different gases. In the calculation process, for gases that exist in the lower layer but not in the upper layer, it is assumed that the concentration of such gases rapidly decays to zero above 120 km, and their absorption of radiation is no longer considered. Regarding the calculation of IR band radiation, the main absorbing gases are H2O and CO2, which occur mainly below the stratosphere [34,35,36], so their impact is not significant.
2.2. Molecular Absorption Databases
The molecular absorption coefficient can be derived by the LBL integration [37] or the correlated k-distribution method [38,39] using spectroscopic data from different databases. As the near-space region covers a wide range of temperature, the choice of database is important. The spectroscopic databases, HITRAN [40] and its high-temperature version HITEMP [41], GEISA [42], and MPI-Mainz [43], were used to establish the absorption coefficients for the simulation of the near-space region. The light-source radiation field in this study covers two wavelength bands (25,000–55,000 cm−1 and 1800–4000 cm−1), where the radiative transfer calculations focus mainly on these bands in the UV and IR regions, respectively. In the IR region, line data were mainly used for the line-by-line calculations. The line data variables are converted to the standard HITRAN format and include the spectral line intensity at 296 K, the Einstein-A coefficient of a transition, the air-broadened and self-broadened half width at half maximum, the lower-state energy of the transition, and the lower and upper state statistical weights. In the UV region, cross-section data were mainly used. The types, concentrations, and characteristics of absorbing gases vary greatly, so the calculations must be conducted separately with different databases. After detailed organization of databases and consideration of which gases have relatively high contents in the atmospheric profile, gases were selected for consideration in the UV and IR bands.
Table 2 lists the characteristics of the studied databases. Based on these characteristics and information concerning the atmospheric profile, different databases were selected for calculations of gas optical depths. In the IR band, water vapor and CO2 are the main absorbing gases, but their concentration profiles reach only to 120 km where the temperature is ~360 K. Considering that the temperature rises rapidly to ~1000 K at 120–200 km, absorption coefficients of water vapor below 1000 K were calculated using the conventional database HITRAN and the high-temperature database HITEMP.

Table 2.
Comparison of gases and wavelength ranges covered by different databases. The line data indicate parameters such as line intensity and the Einstein-A coefficient of a transition.
Plots shown in Figure 2 indicate that, under given conditions, there were significant differences in absorption coefficients calculated using HITRAN and HITEMP databases at 360 K, 500 K, and 1000 K, because HITEMP uses more line data including weak transitions. This also leads to the large relative errors in Figure 2b. However, in actual applications, Schroder et al. [44] point out that the HITRAN database is relatively accurate for temperatures below 1300 K. For the near-IR band, HITRAN generates fewer line shapes and intensity prediction errors than HITEMP. Considering that the atmospheric profile used in this study did not consider water vapor at temperatures above 1000 K, only the HITRAN database was used in calculating absorption characteristics in the IR band.
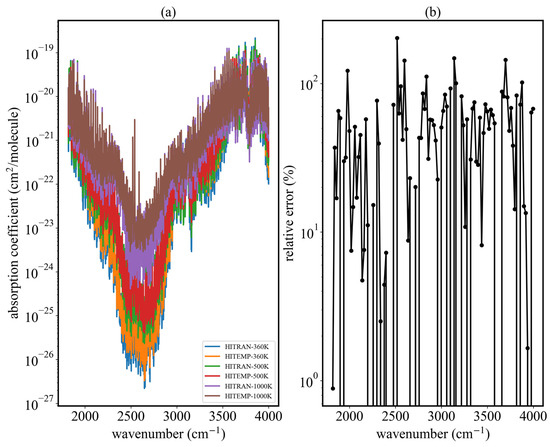
Figure 2.
Plot of water vapor absorption coefficients in the range of 1818–4000 cm−1 and their relative error at temperatures above 360 K. Calculations involved the SPECTRA database (https://spectra.iao.ru, accessed on 7 January 2025) with settings as follows: line intensity cut off = 1.0 × 10⁻²⁸; temperature = 360 K, 500 K, 1000 K; pressure = 1 atm; and Voigt line shape profile, line wing = 50 halfwidths. (a) Absorption coefficients with different databases and temperatures. (b) Relative error of HITRAN and HITEMP at 360 K.
For absorption in the UV band, the main gases are O2 and O3 [34]. As absorption data for the UV band are mainly cross-sectional data, often from various references, the MPI-Mainz and GEISA databases were used predominantly in practical applications. Atmospheric layer temperatures were used in selecting the closest cross-sectional data, which were used to calculate the optical depths. Results are shown in Figure 3. The temperature considered in Figure 3 is consistent with the temperature of the atmospheric profile used in the Monte Carlo simulation. Moreover, the calculated results of the absorption cross-section will be applied to the calculations of the optical depth and radiative transfer in the UV band.
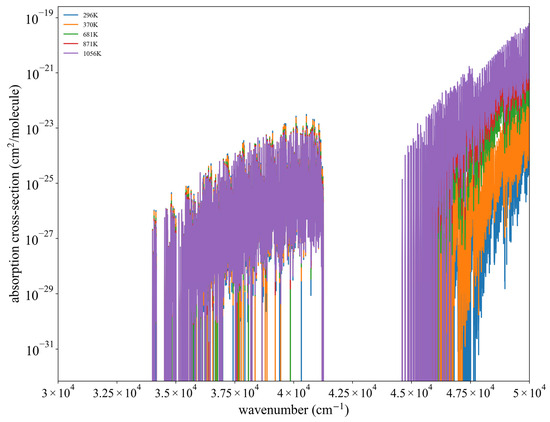
Figure 3.
The variation with wavenumber of the oxygen absorption cross-section at specific temperatures. Calculation was based on the collected gas-absorption databases and temperature conditions of the atmospheric profile.
2.3. Monte Carlo Radiative Transfer Method
The Monte Carlo method computes the complete effective Mueller matrix at any detector position [16]. Radiative transfer models based on the discrete-ordinate or diffusion methods usually cover situations where the light source is the sun or thermal emission from the Earth surface. However, the Monte Carlo method can place the light source at any position, with the source being either active or passive.
The Monte Carlo technique addresses the 3D vector radiative transfer equation by simulating photon propagation through inhomogeneous turbid media, such as coupled atmosphere–ocean systems. The method begins by discretizing the medium into optically homogeneous layers or smaller voxels, each defined by properties like the phase matrix, extinction coefficient, and single-scattering albedo. Photons are initialized with a weight of and a 4 × 4 identity Mueller matrix M, which are adaptable to any incident light’s polarization states. For photon sampling, the model determines propagation optical depth using random number sampling as follows:
where is the random number uniformly generated from 0 to 1. If the photon’s optical depth does not intersect boundaries, its optical depth is sampled directly as Equation (1). However, if it approaches a boundary, a forced collision is induced to ensure interaction inside the medium as follows:
where is the left optical depth along the photon path to the boundary of the medium. After the photon is at the new location after the optical depth sampling, it has a forced collision. Therefore, the photon weight is updated as follows:
where is the single-scattering albedo, and and are the photon weights before and after the forced collision, respectively. Consequently, the Mueller matrix is updated as follows:
where and are the Mueller matrices before and after the collision; and are related to the rotations between the meridian plane of Mueller matrix and the scattering plane; is the scattering phase matrix at the location and the scattering angle ; the scattering angle and two rotation angles are realized in terms of random numbers. To further enhance the photon efficiency, the scattering estimation to the detector is executed before every collision as follows:
where is the estimated Mueller matrix with respect to the specific detector and the final result is the summation over all the estimations; , , and are the scattering angle and two rotation angles between the Meridian and scattering planes, which can be directly calculated from the photon and detector status; is the optical depth from the photon location to the detector location; and is the projected area of the detector. After a photon is initialized, the basic steps are propagation as Equation (1) or (2), estimation to a detector as Equation (5), and scattering as Equations (3) and (4), and the steps are repeated until the photon weight falls below a threshold value ( is used in this study). Bias techniques for the extra introduction in Equation (2) and the bivariate sampling for angles and in Equation (4) are employed to remove the introduced biases and the details are given by Tynes et al. [45].
To summarize the Monte Carlo method, several techniques are employed to enhance sampling efficiency. First, photon weights are adjusted during boundary interactions and collisions to maintain energy conservation and remove biases from forced collisions or scattering assumptions. Then, every scattering is estimated to all detectors as given in Equation (5) and the sampling efficiency is significantly enhanced. Moreover, periodic boundary conditions are used to ensure that photons exiting the computational domain re-enter from the opposite side, preventing premature termination and ensuring comprehensive sampling. Validation against the spherical harmonic discrete ordinate method ensures the accuracy while optimizing computational efficiency, making the technique robust for modeling radiative coupling in complex three-dimensional environments [16].
To ensure the accuracy of the model, a phase function was first selected to provide radiative transfer results under various optical-depth conditions, and the results were compared with, and verified against, VLIDORT results. The model was then used for radiative transfer under high-altitude and high-temperature conditions. Rayleigh scattering dominates the radiation emission process there, so only it was considered in practical calculations. Figure 4 illustrates how physical quantities are distributed across each layer during the radiative transfer process. Layer1, Layer2, and Layer3 correspond to the layer numbers of the atmospheric profiles used. Therefore, physical quantities such as temperature, air pressure, and gas concentration are distributed across these layers. The optical depth, extinction coefficient, and single-scattering albedo are calculated from temperature, gas absorption data, and the layer thickness. As a result, they are distributed between each layer. The input of the Monte Carlo model includes some built-in and external parameters. The built-in parameters include the num of photons, the horizontal and vertical boundary values of the simulation space, the distribution of detectors and the height of the observer. The external parameters include the atmospheric profile and the scattering phase function. Once these parameters are determined, the radiative transfer process can be constructed.

Figure 4.
Schematic Diagram of the Distribution of Physical Quantities in the Radiative Transfer Process. T refers to the temperature, P refers to the pressure, M refers to the gas concentration, refers to the optical depth, refers to the extinction coefficient, refers to the single-scattering albedo.
In the vector radiative transfer model, the most convenient representation of polarized light involves the four Stokes parameters I, Q, U, and V. The Monte Carlo model computed a 4 × 4 Muller matrix describing the relationship between Stokes parameters of incident and transmitted light. The effective Muller matrix of the entire Monte Carlo model system can be obtained as follows:
where N is the number of photons, A is the projected area of the detector, is the detector’s estimation for photons as given in Equation (5). The radiative Stokes parameters received by the detector is obtained by multiplying the effective Muller matrix with the incident radiation,
Through the above calculations, the Monte Carlo radiative transfer model is achieved. A comparative verification between the Monte Carlo model and VLIDORT can be conducted as well.
To ensure the accuracy of the Monte Carlo method, the method was going to be validated with the VLIDORT model. The scattering phase function used in the Monte Carlo validation represents the strong scattering process in the radiative transfer calculation as shown in Figure 5. The other optical and geometrical parameter settings were made with reference to actual observation conditions of satellites [46], as shown in Table 3. A three-layer atmospheric profile was used for the comparison with the optical depth in Table 3 representing the sum of all three layers, and the single-scattering albedos in different layers were 0.999. The Monte Carlo model also has unique settings due to the strong effect of the number of photons on the results. When the number of photons increases gradually from tens of thousands to 1 million, the accuracy of the Monte Carlo model improves significantly. However, when the number exceeds 1 million, the accuracy improvement becomes marginal while computational efficiency decreases. More conclusions are discussed in Section 4. For these reasons, in the comparison with VLIDORT, the number of photons in the Monte Carlo model was empirically set to 106.
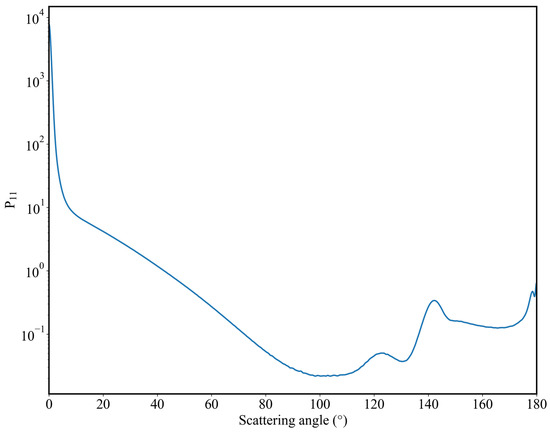
Figure 5.
Phase function used for the validation between the Monte Carlo model and VLIDORT.

Table 3.
Optical and geometrical parameters used in the comparison between the two models.
In the point source simulation, the geometrical parameters were slightly different from those of previous comparison experiments, as listed in Table 4. The incident angle (Theta in) and observing angle (Theta out) were set to 30°, which provided optimal precision in previous experiments. In the simulation of the 1800–4000 cm−1 band, only the HITRAN database was considered, with the high-temperature database not being involved at this stage. For the simulation of the 180–400 nm band in cases where the altitude was >100 km, based on the temperature and gas concentration of the two layers, values of the absorption cross-section under the closest temperature conditions were employed in the MPI-Mainz, GEISA, and HITRAN databases, and these values were used to calculate the optical depth between the two layers. For comparison, the optical depth under normal temperature conditions was also calculated using the HITRAN database, to facilitate subsequent comparisons.

Table 4.
Geometrical parameters of the simulation.
2.4. Statistical Metrics Used for Validation
Four statistical metrics including relative error, absolute relative error, mean absolute error (MAE), and root mean square error (RMSE) were used for the validation between the Monte Carlo method and VLIDORT.
The relative error is the most used statistical metric. Considering that the relative errors can be either positive or negative, and might cancel each other when calculating the overall average, resulting in an apparently better average, the absolute relative error was introduced to better reflect the errors as follows:
where represents the radiance calculated by the Monte Carlo model, represents the radiance calculated by VLIDORT, and represents the number of samples. If the absolute relative error is equal to the relative error or to the opposite sign of it, this indicates that the values of the Monte Carlo simulation are, respectively, greater or less than the VLIDORT results, which may also have statistical characteristics. In addition, mean absolute error and root mean square error were also used to quantify the bias error between two models. The calculation formulas of two metrics can be described as follows:
Based on these statistical indicators, relative error and absolute relative error, MAE and RMSE, the statistical characteristics of the comparison were calculated.
3. Results
3.1. Comparison of the Monte Carlo and VLIDORT Approaches
Figure 6, Figure A1 and Figure A2 compare the results of Stokes parameter I simulated by the two models for different relative azimuth angles. When the optical depth changes by three orders of magnitude, from 0.1 to 100, consistency is achieved by the two models. The Monte Carlo simulation depends on the number of photons, so as the optical depth increases for cases with larger optical thickness, it is more difficult for photons to pass through one layer to reach the next, with results exhibiting up-and-down oscillation. This can be solved by increasing the number of photons. Although the Monte Carlo results display these oscillations, the order-of-magnitude difference between the two models is within 10−4. Furthermore, as the solar zenith angle increases, the discrepancy between the two models also increases. This is because as the solar zenith angle increases, the assumption of a plane-parallel atmosphere is increasingly unsatisfied, and errors in the models themselves also increase, with different models being more likely to show different results. When the solar zenith angle is between 30° and 60°, the calculation results of two models are generally consistent both for transmissions and reflections.
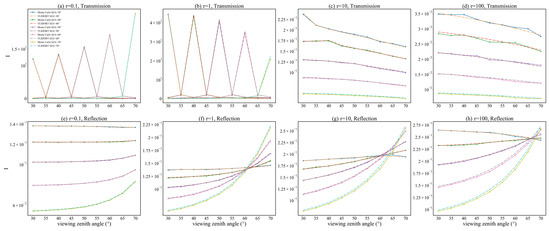
Figure 6.
Comparison of I computed by the Monte Carlo model and VLIDORT, with the relative azimuth angle set as 0°. ‘SZA’ in the legend represents the solar zenith angle. ‘Transmission’ represents the downwelling radiance at the bottom layer, and ‘Reflection’ represents the upwelling radiance at the top layer.
To quantify the errors of the Monte Carlo model, the relative errors were calculated, with the results shown in Figure 7, Figure A3 and Figure A4. For a solar zenith angle of 30–60°, relative errors are most within 2%; for an angle of 70°, errors are larger but still <5%; and for a viewing zenith angle of 40–60°, the relative errors are larger than those of other viewing zenith angles. When the optical depth changes from 0.1 to 100, the overall relative error is within 5%. The statistical metrics’ results were shown in Table 5. For reasons mentioned earlier, the relative errors can be either positive or negative, resulting in inconsistency between relative and absolute relative errors. Regarding the mean relative error, its value was <1% under all optical depth conditions, although the reflection relative error was –1.067% when the optical depth was 50. The mean absolute relative error increased with optical depth, consistent with the characteristics of the Monte Carlo simulation, i.e., the larger the optical depth, the greater the number of photons that were required for the simulation. Although the mean absolute relative error increased with optical depth, the largest error of 1.524% occurred when the optical depth was 100, which is still in an acceptable range. This indicates that the simulation results of the Monte Carlo model are consistent with those of VLIDORT, and, therefore, could be used for subsequent radiative transfer simulations.
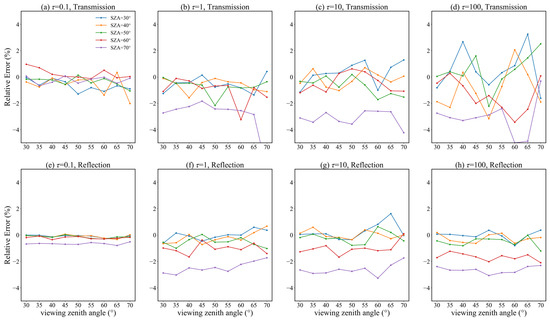
Figure 7.
Relative errors computed by the Monte Carlo model and VLIDORT, with the relative azimuth angle set to 0°. ‘SZA’ in the legend represents the solar zenith angle.

Table 5.
Overall statistical results of the two models under different optical depth conditions. represents the optical depth.
3.2. 1D Monte Carlo Simulation in 1800–4000 cm−1 and 25,000–55,000 cm−1
The altitude for observation of radiance emitted by the radiation field was set to be 1000 km, coping with the orbital altitude of polar-orbiting satellites. The height of the radiation field was set at 50 km, although it may be set at any height.
Simulation results are shown in Figure 8 and Figure 9 It can be seen from Figure 8a that there are two extremely low radiation intensity values near 2500 cm−1 and 3600 cm−1, corresponding to the two absorption peaks of CO2 and H2O in the IR region. In other positions, the weak absorptions of H2O, CO2, and greenhouse gases such as CH4 mean there are attenuation peaks of varying height. In the remaining positions, the values of Stokes parameter I are relatively consistent. Figure 8b,c show simulation results for the 25,000–55,000 cm−1 UV band. As the difference between the high- and normal-temperature databases lies only in specific values of the absorption cross-section, the simulation trends obtained using different databases are consistent. It can be seen from Figure 8b,c that the value of I increases with increasing wavenumber. Therefore, the radiation field signal is more likely to be received by polar-orbiting satellites at longer wavenumbers. In Figure 9, although the outlines of the simulation results appear similar, there are differences in I. Since gas absorption is minimal in the 25,000–50,000 cm−1, while strong absorption bands of oxygen and ozone occur at wavenumbers greater than 50,000 cm−1, this spectral region exhibits immediate feedback between gas absorption and corresponding radiation calculations. The maximum relative error between the two different conditions can reach −2.5%, which is relatively small because the strongly absorbing O3 occurs mainly below the stratosphere, and its concentration is not considered above 120 km.
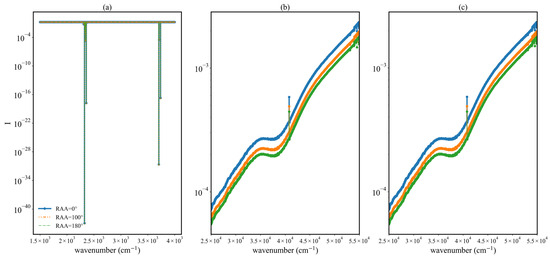
Figure 8.
Simulation results for the radiation field at 50 km, for (a) the 1800–4000 cm−1 band; (b) the 25,000–55,000 cm−1 band, using the normal-temperature database; and (c) the 25,000–55,000 cm−1 band, using the high-temperature database. ‘RAA’ represents the relative azimuth angle.
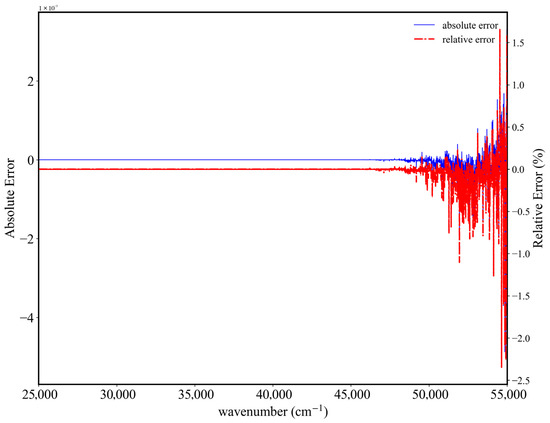
Figure 9.
Absolute and relative errors of 180–400 nm simulation results, using different databases.
4. Discussion
4.1. Influence of the Number of Photons on the Monte Carlo Method
When the optical depth is 100, different numbers of photons were used in the Monte Carlo simulation, and the results were compared with VLIDORT. The comparison results are shown in Figure 10 and Figure 11. For the reflected radiation, when the number of photons is 100,000 and 500,000, and the solar zenith angle is between 30° and 60°, the simulation results oscillate a lot. After the number of photons reaches 1,000,000 there are still obvious oscillations when the solar zenith angle is 40°, but the results are relatively smooth when the angle is 50° and 60°. For the case where the solar zenith angle is 70°, increasing the number of photons does not significantly change the simulation results of the Monte Carlo model. For the transmitted radiation, there are very obvious oscillations when the number is 100,000 and 500,000. After the number of photons reaches 1,000,000, the results are already in good agreement with the VLIDORT. In addition, it can be found that when the solar zenith angle is 30°, the simulation results are the best when the number of photons is set to 10,000,000. After exceeding 10,000,000, there are instead larger deviations when the observation zenith angle is between 50° and 70°. The statistical results can be found in Table 6. As the number of photons increases, the relative error of the reflection changes very little, while the relative error of transmission first decreases and then changes very little after reaching 1,000,000 photons. The absolute relative error of the reflection also shows a downward trend. It can also be seen that although the transmission has great oscillations when the number of photons increases, the calculation results under the condition of a higher number of photons are generally better than the condition of a lower number of photons.
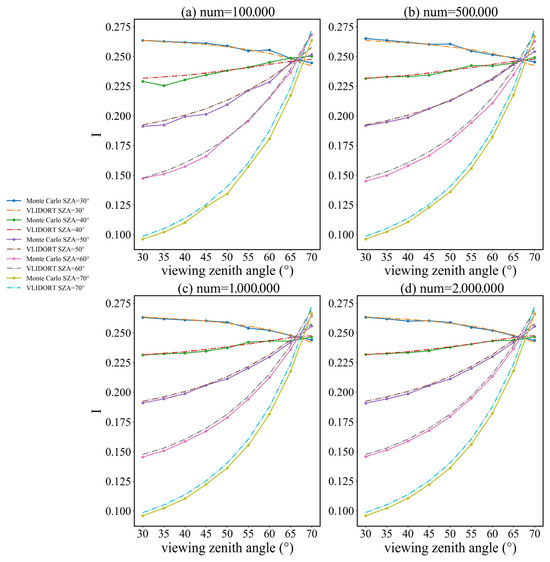
Figure 10.
Comparison of the reflected radiation results under different numbers of photons when the optical depth is 100. The subtitles of figures mark the number of photons used in the simulation, and the other parameters are same as before.
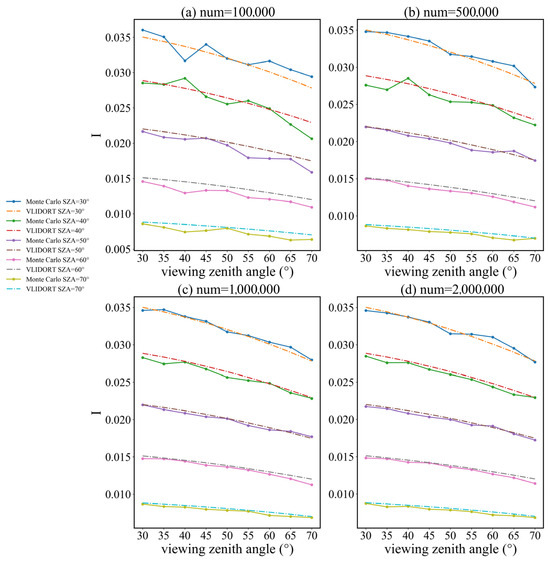
Figure 11.
Same as Figure 10, but for the transmission.

Table 6.
The statistical results between two models under different numbers of photons when the optical depth is 100.
In summary, when the number of photons is less than 1,000,000, as the number of photons increases, the accuracy of the Monte Carlo model is significantly improved, and at the same time, the calculation time also increases accordingly. When the number of photons is greater than 1,000,000, as the number of photons increases, the accuracy of the model is slightly improved, and the calculation time significantly increases. Therefore, setting the number of photons as 1,000,000 is a choice that can not only ensure the calculation accuracy but also avoid a long calculation time.
4.2. 3D Monte Carlo Simulation with Point Sources for 1800–4000 cm−1 and 25,000–55,000 cm−1
The Monte Carlo model achieves the radiative transfer simulation with point sources by placing detectors at different heights. The geometric observation parameters were consistent with the 1D simulation, as shown in Table 4. A total of 25 detectors were placed in a 5 × 5 pattern, evenly distributed on boxes [−10.5, 10.5] of the X and Y axes. The effective Muller matrix of the detector in the Monte Carlo model is the result of projection of the scattering direction at specific detectors, so its calculation result with point sources is much smaller than the ones with solar sources. Figure 12 shows a schematic diagram of the transmission process in the 3D situation. In this process, photons are emitted from the height of the point source and, after undergoing the absorption and scattering processes in the atmosphere, they, finally, reach the height of the detectors. The detectors are uniformly distributed on the horizontal plane at the height, and in this case a total of 25 detectors are used.
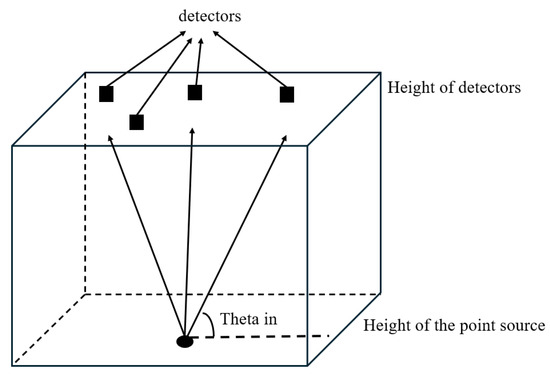
Figure 12.
Schematic diagram of the Monte Carlo model in the 3D situation. The height of the point source is also the height of the hypersonic vehicles. The black solid dot represents the point light source, and the black solid squares represent detectors.
Figure 13, Figure 14 and Figure 15 present the results of the simulations with point sources in 1800–4000 cm−1. In Figure 13, for the 1800–4000 cm−1 IR band, there is a maximum value at the detector coordinate (8.4, 0.0). With a relative azimuth angle of 100°, there is a secondary maximum value at the position (–4.2, 8.4), while at 180° the contour map of the phase matrix element P11 shows a strip shape, with the values of P11 decreasing towards both sides along the axis Y = 0. Maximum values are distributed at both ends of the X-axis. Figure 14 shows the variation of P11 with the band having a set relative azimuth angle, while Figure 15 shows the distribution of P11 as the average value over a band. In Figure 14, although the contour map shows most areas having the same color when the relative azimuth angle is 0°, P11 values at different positions are not consistent and can vary greatly. With the detector at (–8.4, –8.4), there are several large values of P11 near 1500, 2750, and 3600 cm−1; at (0.0, 0.0) there are large values near 2500 cm−1; at (8.4, 8.4) the large values are near 2250 cm−1; and at (–4.2, 4.2) they are near 3000 cm−1. These results indicate that, for the IR band, the different detector positions and band absorption characteristics result in inhomogeneous detections. Positions of some maximum values may reflect the optical thickness of the band being relatively large, with photons having undergone multiple scattering during their journey from the position of the point light source to the detector. Figure 15 shows the variation with the relative azimuth angle of results for band-averaged P11 at different detector positions. For different angles, the positions where the maximum values occur are also different. For the five detectors shown in Figure 15, when the relative azimuth angle is 20°, there is a maximum value at (8.4, 8.4); for a 100° angle the maximum is at (–4.2, 8.4), consistent with Figure 13b; and at 160° there is also a maximum value at (–4.2, 8.4).
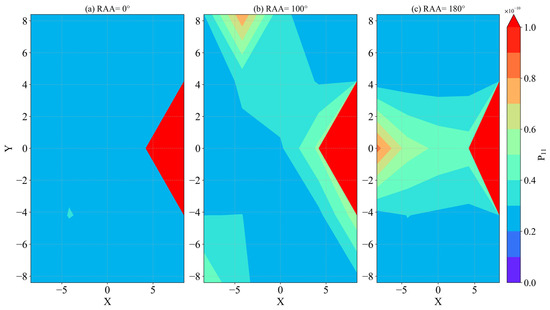
Figure 13.
Contour map of 3D simulation results in the 1800–4000 cm−1 band. ‘RAA’ represents the relative azimuth angle, and the color bar represents the first element P11 of the effective Muller matrix with different values. For (a) the relative azimuth angle is 0°; for (b) it is 100°; and for (c) it is 180°.
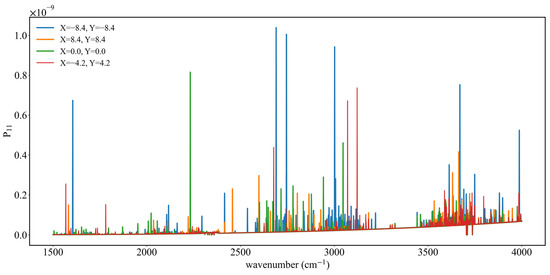
Figure 14.
Variation of P11 of the effective Muller matrix with wavelength at different detector positions when the relative azimuth angle is 0°, for the wavelength band of 1800–4000 cm−1.
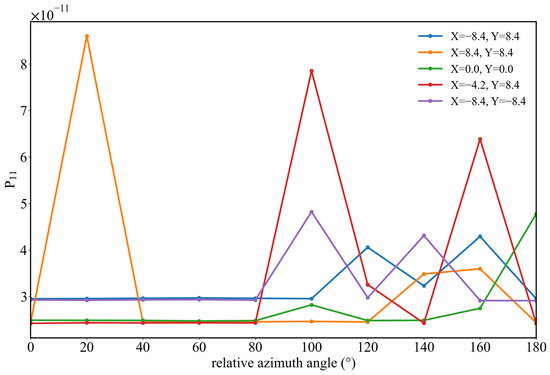
Figure 15.
Variation of the band-averaged P11 values of the effective Muller matrix with the relative azimuth angle at different detector positions, for the wavelength band of 1800–4000 cm−1.
Figure 16, Figure 17 and Figure 18 present the results of the simulations with point sources in 25,000–55,000 cm−1, where results show certain differences from those of the IR band. As shown in Figure 16, when the relative azimuth angle is 0°, there is a maximum value at the detector coordinate (4.2, 0), and radiation values at other positions show little variation; with an angle of 100°, all P11 values in the entire region lie in the range (1–2) × 10−6; while at 180° there is a decreasing trend towards both sides along the axis Y = 0 with a characteristic stratification. In the IR band, the variation of P11 with wavelength is obvious, but in the UV band there is a high degree of consistency at different detector positions, with a large difference only at the coordinate (4.2, 0.0). In Figure 17, the variation of P11 at different detector positions with the relative azimuth angle is similarly not obvious, with an abrupt change only at the coordinate (4.2, 0.0) when the relative azimuth angle is 0°. With other detector positions and relative azimuth angles, values of P11 are all in the range of (0–5) × 10−6.
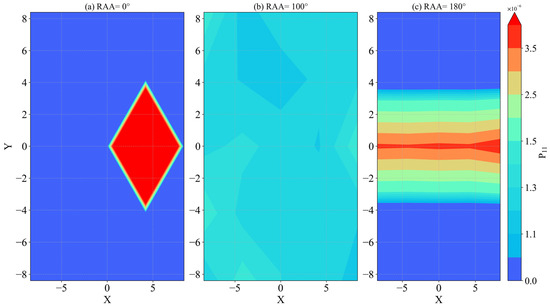
Figure 16.
As for Figure 13, but for the 25,000–55,000 cm−1 band.
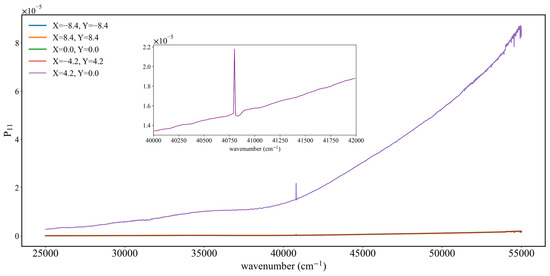
Figure 17.
As for Figure 14, but for the 25,000–55,000 cm−1 band. The inset figure is a zoomed-in view of the line located at X = 4.2, Y = 0.0 in the main figure, focusing on the wavenumber range 40,000–42,000 cm−1.
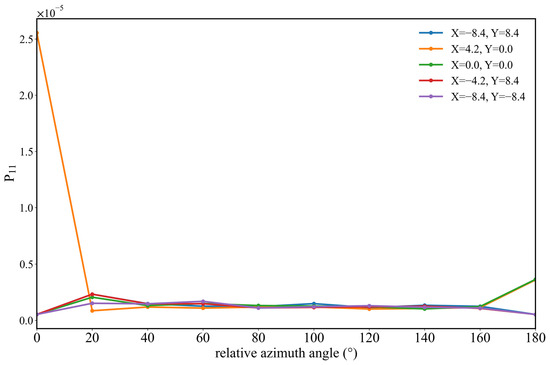
Figure 18.
As for Figure 15, but for the 25,000–55,000 cm−1 band.
Analysis of the radiative transfer results with point sources indicates that the radiation quantity is transmitted upward through the atmosphere in near space with the following characteristics: (1) Due to the different absorption characteristics of different bands, the radiation in different bands may show inconsistencies at different detector positions and under different relative azimuth angles; (2) the radiation quantity after band averaging shows inhomogeneity in the horizontal direction with different relative azimuth angles, while in general it decreases from the middle to both sides; and (3) different detector positions show inhomogeneity with different relative azimuth angles, and the inhomogeneity of the IR band is more obvious than that of the UV band.
In addition to the above characteristics, we observed that for both the IR and UV bands, larger radiation values appear on the right side of the X axis and centrally on the Y-axis. This may be related to the setting of geometric parameters. Here, both Theta in and Theta out were set at 30°, and the relative azimuth angle was set to various values. With a relative azimuth angle of 0°, both bands have maximum values to the right of the X axis. As the angle increases, the IR band still maintains this characteristic, while the UV band exhibits other characteristics. However, with an incident angle of 35°, an exit angle of 0°, and relative azimuth angle of 0°, Zhai et al. [16] found that the results exhibit a characteristic of spreading outwards, centered at (1, 1). Therefore, different settings of geometric parameters may also have an impact on the simulation results of radiative transfer in point-source scenarios.
5. Conclusions
In this study, the radiative transfer process in the near-space region was discussed with respect to the space-borne observation of radiation at arbitrary height and location. The high-temperature absorption databases were established since the near-space region lies at the mesosphere, thermosphere, and ionosphere. Moreover, a Monte Carlo method was implemented to simulate the radiative transfer processes with surface or point sources at arbitrary height or location. Furthermore, the radiative transfer process was simulated and discussed in the ultraviolet and infrared bands because the thermal radiation from high-speed vehicles falls into the ultraviolet and infrared regions.
In the simulation process, the atmospheric profile was first constructed to provide temperature information and the concentrations of various gases. The heights of layers in the atmospheric profile span a wide range. The standard atmospheric profile USSA1976 was used for lower layers, and the NRLMSIS model based on various input parameters was used for the upper-layer profile. The temperature rises rapidly from 360 K to ~1000 K over a narrow height range of 120–200 km. The NRLMSIS model considers relatively few types of gas, so there may be some important absorbing gases that have not been considered here.
The absorption database was organized by considering gas-absorption databases such as MPI-Mainz, HITRAN, GEISA, and HITEMP. By using the closest line data or cross-sectional data for high-temperature conditions, the optical depths of different layers were calculated.
Finally, the Monte Carlo model was used to calculate transmission processes related to the radiation field, simulating Stokes parameters from 50km to the height of polar-orbiting satellites. To verify the accuracy and applicability of the Monte Carlo model, a comparison with VLIDORT was undertaken under different optical depth conditions. Results indicate that the maximum absolute relative error for transmission was 1.524% and the minimum was 0.818%; while the maximum absolute relative error for reflection was 1.036% and the minimum was 0.236%. These results illustrate the universality of the model.
Based on the Monte Carlo simulation, the two absorption bands for water vapor and CO2 were clearly observed in the IR band, while, in the UV band, the Stokes parameter I increased in value as wavelength decreased. In the point-source scenario, the radiative transfer simulation was undertaken by setting multiple detectors at different positions. In the IR band, the radiation quantity P11 varied with changes in detector position, the band, and the relative azimuth angle, indicating inhomogeneity under various conditions. However, in the UV band the radiation quantity was most affected by detector position, exhibiting consistency over different bands and relative azimuth angles.
Author Contributions
Conceptualization, B.S.; funding acquisition, B.S.; methodology, M.L., R.L. and B.S.; supervision, B.S.; validation, M.L. and R.L.; writing– original draft, M.L.; writing– review and editing, M.L., R.L. and B.S. All authors have read and agreed to the published version of the manuscript.
Funding
This research was funded by the Natural Science Foundation of Shanghai (23ZR1405600), and the National Natural Science Foundation of China (42475083).
Data Availability Statement
Data underlying the results presented in this paper are available on request from the authors.
Acknowledgments
The authors would like to thank Robert Spurr for the use of his VLIDORT code.
Conflicts of Interest
The authors declare no conflicts of interest.
Appendix A
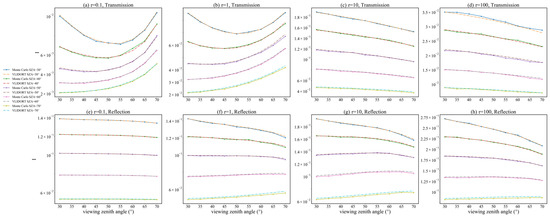
Figure A1.
As for Figure 6, but with the relative azimuth angle set to 100°.
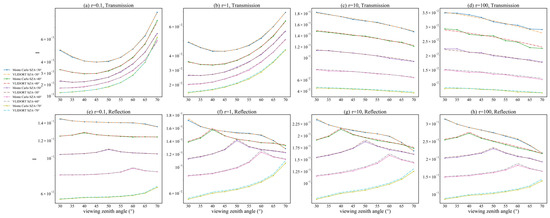
Figure A2.
As for Figure 6, but with the relative azimuth angle set to 180°.
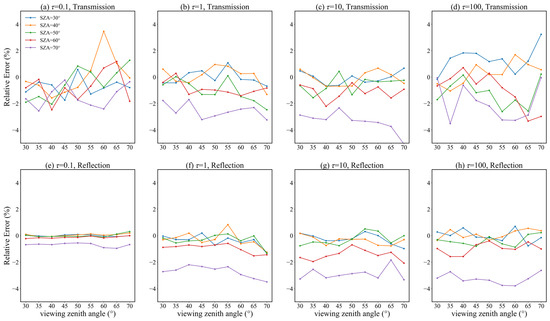
Figure A3.
As for Figure 7, but with the relative azimuth angle set to 100°.
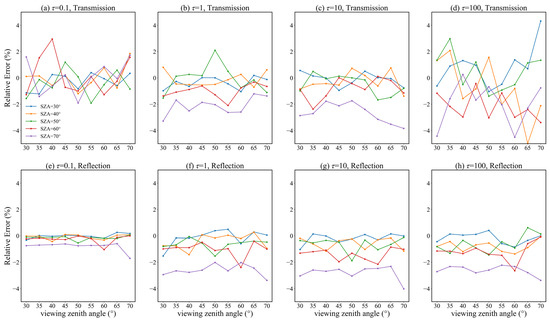
Figure A4.
As for Figure 7, but with the relative azimuth angle set to 180°.
References
- Niu, Q.; Yuan, Z.; Chen, B.; Dong, S. Infrared radiation characteristics of a hypersonic vehicle under time-varying angles of attack. Chin. J. Aeronaut. 2019, 32, 861–874. [Google Scholar] [CrossRef]
- Du, X.; Shi, Y.; Yang, Q.; Song, D.; Liu, X. Numerical Simulation of Spectral Radiation for Hypersonic Vehicles. Aerospace 2024, 11, 802. [Google Scholar] [CrossRef]
- Niu, Q.; He, Z.; Dong, S. Prediction of shock-layer ultraviolet radiation for hypersonic vehicles in near space. Chin. J. Aeronaut. 2016, 29, 1367–1377. [Google Scholar] [CrossRef]
- Ozawa, T.; Garrison, M.B.; Levin, D.A. Accurate Molecular and Soot Infrared Radiation Model for High-Temperature Flows. J. Thermophys. Heat Transf. 2007, 21, 19–27. [Google Scholar] [CrossRef]
- Nam, H.J.; Kwon, O.J. Infrared radiation modeling of NO, OH, CO, H2O, and CO2 for emissivity/radiance prediction at high temperature. Infrared Phys. Technol. 2014, 67, 283–291. [Google Scholar] [CrossRef]
- Kumar, N.; Bansal, A. Flow and radiation modeling over a Martian entry vehicle. Acta Astronaut. 2023, 205, 172–184. [Google Scholar] [CrossRef]
- Sziroczak, D.; Smith, H. A review of design issues specific to hypersonic flight vehicles. Prog. Aerosp. Sci. 2016, 84, 1–28. [Google Scholar] [CrossRef]
- Gorshkov, A.B. The simulation of ultraviolet radiation under conditions of re-entry of space vehicle from near-earth orbit. High Temp. 2010, 48, 12–22. [Google Scholar] [CrossRef]
- Jie, W.; Lu, B.; Tianjiao, Z.; Qiang, L.; Chaofan, X. Ultraviolet Radiation Characteristics of NO in Shock Layer of Hypersonic Vehicle. In Proceedings of the Sixteenth National Conference on Laser Technology and Optoelectronics, Shanghai, China, 3–6 June 2021; Volume 11907. [Google Scholar]
- Stamnes, K.; Tsay, S.-C.; Wiscombe, W.; Laszlo, I. DISORT, A General-Purpose Fortran Program for Discrete-Ordinate-Method Radiative Transfer in Scattering and Emitting Layered Media: Documentation of Methodology. 2000. Available online: http://www.rtatmocn.com/disort/docs/DISORTReport1.1.pdf (accessed on 7 January 2025).
- Spurr, R.J.D. VLIDORT: A linearized pseudo-spherical vector discrete ordinate radiative transfer code for forward model and retrieval studies in multilayer multiple scattering media. J. Quant. Spectrosc. Radiat. Transf. 2006, 102, 316–342. [Google Scholar] [CrossRef]
- Sun, B.; Gao, C.; Spurr, R. Scalar thermal radiation using the adding-doubling method. Opt. Express 2022, 30, 30075–30097. [Google Scholar] [CrossRef]
- Chen, Y.; Liou, K.N.; Gu, Y. An efficient diffusion approximation for 3D radiative transfer parameterization: Application to cloudy atmospheres. J. Quant. Spectrosc. Radiat. Transf. 2005, 92, 189–200. [Google Scholar] [CrossRef]
- Roger, M.; Caliot, C.; Crouseilles, N.; Coelho, P.J. A hybrid transport-diffusion model for radiative transfer in absorbing and scattering media. J. Comput. Phys. 2014, 275, 346–362. [Google Scholar] [CrossRef]
- Deutschmann, T.; Beirle, S.; Frieß, U.; Grzegorski, M.; Kern, C.; Kritten, L.; Platt, U.; Prados-Román, C.; Puķı¯te, J.; Wagner, T.; et al. The Monte Carlo atmospheric radiative transfer model McArtim: Introduction and validation of Jacobians and 3D features. J. Quant. Spectrosc. Radiat. Transf. 2011, 112, 1119–1137. [Google Scholar] [CrossRef]
- Zhai, P.-W.; Kattawar, G.W.; Yang, P. Impulse response solution to the three-dimensional vector radiative transfer equation in atmosphere-ocean systems. I. Monte Carlo method. Appl. Opt. 2008, 47, 1037–1047. [Google Scholar] [CrossRef]
- Saunders, R.; Rayer, P.; Brunel, P.; von Engeln, A.; Bormann, N.; Strow, L.; Hannon, S.; Heilliette, S.; Liu, X.; Miskolczi, F.; et al. A comparison of radiative transfer models for simulating Atmospheric Infrared Sounder (AIRS) radiances. J. Geophys. Res. Atmos. 2007, 112, D01S90. [Google Scholar] [CrossRef]
- Kotchenova, S.Y.; Vermote, E.F.; Levy, R.; Lyapustin, A. Radiative transfer codes for atmospheric correction and aerosol retrieval: Intercomparison study. Appl. Opt. 2008, 47, 2215–2226. [Google Scholar] [CrossRef] [PubMed]
- Kokhanovsky, A.A.; Budak, V.P.; Cornet, C.; Duan, M.; Emde, C.; Katsev, I.L.; Klyukov, D.A.; Korkin, S.V.; C.-Labonnote, L.; Mayer, B.; et al. Benchmark results in vector atmospheric radiative transfer. J. Quant. Spectrosc. Radiat. Transf. 2010, 111, 1931–1946. [Google Scholar] [CrossRef]
- Randles, C.A.; Kinne, S.; Myhre, G.; Schulz, M.; Stier, P.; Fischer, J.; Doppler, L.; Highwood, E.; Ryder, C.; Harris, B.; et al. Intercomparison of shortwave radiative transfer schemes in global aerosol modeling: Results from the AeroCom Radiative Transfer Experiment. Atmos. Chem. Phys. 2013, 13, 2347–2379. [Google Scholar] [CrossRef]
- Su, T.; Li, J.; Li, C.; Xiang, P.; Lau, A.K.H.; Guo, J.; Yang, D.; Miao, Y. An intercomparison of long-term planetary boundary layer heights retrieved from CALIPSO, ground-based lidar, and radiosonde measurements over Hong Kong. J. Geophys. Res. Atmos. 2017, 122, 3929–3943. [Google Scholar] [CrossRef]
- Ratynski, M.; Khaykin, S.; Hauchecorne, A.; Wing, R.; Cammas, J.-P.; Hello, Y.; Keckhut, P. Validation of Aeolus wind profiles using ground-based lidar and radiosonde observations at Réunion island and the Observatoire de Haute-Provence. Atmos. Meas. Tech. 2023, 16, 997–1016. [Google Scholar] [CrossRef]
- Costa-Surós, M.; Calbó, J.; González, J.A.; Long, C.N. Comparing the cloud vertical structure derived from several methods based on radiosonde profiles and ground-based remote sensing measurements. Atmos. Meas. Tech. 2014, 7, 2757–2773. [Google Scholar] [CrossRef]
- Hersbach, H.; Bell, B.; Berrisford, P.; Hirahara, S.; Horányi, A.; Muñoz-Sabater, J.; Nicolas, J.; Peubey, C.; Radu, R.; Schepers, D. The ERA5 global reanalysis. Q. J. R. Meteorol. Soc. 2020, 146, 1999–2049. [Google Scholar] [CrossRef]
- Tarek, M.; Brissette, F.P.; Arsenault, R. Evaluation of the ERA5 reanalysis as a potential reference dataset for hydrological modelling over North America. Hydrol. Earth Syst. Sci. 2020, 24, 2527–2544. [Google Scholar] [CrossRef]
- United States National Oceanic and Atmospheric Administration. US Standard Atmosphere, 1976; National Oceanic and Atmospheric Administration: Washington, DC, USA, 1976; Volume 76.
- Krueger, A.J.; Minzner, R.A. A mid-latitude ozone model for the 1976 US Standard Atmosphere. J. Geophys. Res. 1976, 81, 4477–4481. [Google Scholar] [CrossRef]
- Emmert, J.T.; Drob, D.P.; Picone, J.M.; Siskind, D.E.; Jones, M., Jr.; Mlynczak, M.G.; Bernath, P.F.; Chu, X.; Doornbos, E.; Funke, B. NRLMSIS 2.0: A whole-atmosphere empirical model of temperature and neutral species densities. Earth Space Sci. 2021, 8, e2020EA001321. [Google Scholar] [CrossRef]
- Picone, J.M.; Hedin, A.E.; Drob, D.P.; Aikin, A.C. NRLMSISE-00 empirical model of the atmosphere: Statistical comparisons and scientific issues. J. Geophys. Res. Space Phys. 2002, 107, SIA-15. [Google Scholar] [CrossRef]
- Licata, R.J.; Mehta, P.M.; Weimer, D.R.; Tobiska, W.K.; Yoshii, J. MSIS-UQ: Calibrated and enhanced NRLMSIS 2.0 model with uncertainty quantification. Space Weather 2022, 20, e2022SW003267. [Google Scholar] [CrossRef]
- Guo, Y.; Zhang, X.; Guo, F.; Yang, Y. Performance Analysis of NRLMSIS 2.1 Thermospheric Mass Density Model using GRACE-A and SWARM-C Observations. Adv. Space Res. 2024, 74, 2475–2491. [Google Scholar] [CrossRef]
- Virgili, B.B.; Lemmens, S.; Stevenson, E. The Impact of the New NRLMSIS 2.0 on Re-Entry Predictions. In Proceedings of the 8th European Conference on Space Debris, Online, 20–23 April 2021; pp. 20–23. [Google Scholar]
- Lean, J.; Picone, M.; Knowles, S.; Hedin, A.; Moore, G. Validating NRLMSIS Using Atmospheric Densities Derived from Spacecraft Drag: Starshine Example. In Proceedings of the AIAA/AAS Astrodynamics Specialist Conference and Exhibit, Monterey, CA, USA, 5–8 August 2002; p. 4736. [Google Scholar]
- Fried, A.; Richter, D. Infrared absorption spectroscopy. In Analytical Techniques for Atmospheric Measurement; Wiley-Blackwell: Hoboken, NJ, USA, 2006; pp. 72–146. [Google Scholar]
- Horvath, H. Atmospheric light absorption—A review. Atmos. Environ. Part A Gen. Top. 1993, 27, 293–317. [Google Scholar] [CrossRef]
- Bailey, J.; Simpson, A.; Crisp, D. Correcting infrared spectra for atmospheric transmission. Publ. Astron. Soc. Pac. 2007, 119, 228. [Google Scholar] [CrossRef]
- Clough, S.A.; Iacono, M.J.; Moncet, J.-L. Line-by-line calculations of atmospheric fluxes and cooling rates: Application to water vapor. J. Geophys. Res. Atmos. 1992, 97, 15761–15785. [Google Scholar] [CrossRef]
- Lacis, A.A.; Oinas, V. A description of the correlated k distribution method for modeling nongray gaseous absorption, thermal emission, and multiple scattering in vertically inhomogeneous atmospheres. J. Geophys. Res. Atmos. 1991, 96, 9027–9063. [Google Scholar] [CrossRef]
- Fu, Q.; Liou, K.N. On the Correlated k-Distribution Method for Radiative Transfer in Nonhomogeneous Atmospheres. J. Atmos. Sci. 1992, 49, 2139–2156. [Google Scholar] [CrossRef]
- Gordon, I.E.; Rothman, L.S.; Hargreaves, R.J.; Hashemi, R.; Karlovets, E.V.; Skinner, F.M.; Conway, E.K.; Hill, C.; Kochanov, R.V.; Tan, Y. The HITRAN2020 molecular spectroscopic database. J. Quant. Spectrosc. Radiat. Transf. 2022, 277, 107949. [Google Scholar] [CrossRef]
- Rothman, L.S.; Gordon, I.E.; Barber, R.J.; Dothe, H.; Gamache, R.R.; Goldman, A.; Perevalov, V.I.; Tashkun, S.A.; Tennyson, J. HITEMP, the high-temperature molecular spectroscopic database. J. Quant. Spectrosc. Radiat. Transf. 2010, 111, 2139–2150. [Google Scholar] [CrossRef]
- Delahaye, T.; Armante, R.; Scott, N.A.; Jacquinet-Husson, N.; Chédin, A.; Crépeau, L.; Crevoisier, C.; Douet, V.; Perrin, A.; Barbe, A. The 2020 edition of the GEISA spectroscopic database. J. Mol. Spectrosc. 2021, 380, 111510. [Google Scholar] [CrossRef]
- Keller-Rudek, H.; Moortgat, G.K.; Sander, R.; Sörensen, R. The MPI-Mainz UV/VIS spectral atlas of gaseous molecules of atmospheric interest. Earth Syst. Sci. Data 2013, 5, 365–373. [Google Scholar] [CrossRef]
- Schroeder, P.J.; Pfotenhauer, D.J.; Yang, J.; Giorgetta, F.R.; Swann, W.C.; Coddington, I.; Newbury, N.R.; Rieker, G.B. High temperature comparison of the HITRAN2012 and HITEMP2010 water vapor absorption databases to frequency comb measurements. J. Quant. Spectrosc. Radiat. Transf. 2017, 203, 194–205. [Google Scholar] [CrossRef]
- Tynes, H.H.; Kattawar, G.W.; Zege, E.P.; Katsev, I.L.; Prikhach, A.S.; Chaikovskaya, L.I.J.A.O. Monte Carlo and multicomponent approximation methods for vector radiative transfer by use of effective Mueller matrix calculations. Appl. Opt. 2001, 40, 400–412. [Google Scholar] [CrossRef]
- Lindfors, A.V.; Kujanpää, J.; Kalakoski, N.; Heikkilä, A.; Lakkala, K.; Mielonen, T.; Sneep, M.; Krotkov, N.A.; Arola, A.; Tamminen, J. The TROPOMI surface UV algorithm. Atmos. Meas. Tech. 2018, 11, 997–1008. [Google Scholar] [CrossRef]
Disclaimer/Publisher’s Note: The statements, opinions and data contained in all publications are solely those of the individual author(s) and contributor(s) and not of MDPI and/or the editor(s). MDPI and/or the editor(s) disclaim responsibility for any injury to people or property resulting from any ideas, methods, instructions or products referred to in the content. |
© 2025 by the authors. Licensee MDPI, Basel, Switzerland. This article is an open access article distributed under the terms and conditions of the Creative Commons Attribution (CC BY) license (https://creativecommons.org/licenses/by/4.0/).