Article

Bridging the Gap Between Active Faulting and Deformation Across Normal-Fault Systems in the Central–Southern Apennines (Italy): Multi-Scale and Multi-Source Data Analysis

by
Marco Battistelli
1,2,†,
Federica Ferrarini
2,3,*,†,
Francesco Bucci
4,
Michele Santangelo
4,
Mauro Cardinali
4,
John P. Merryman Boncori
5,
Daniele Cirillo
2,3,6,
Michele M. C. Carafa
7 and
Francesco Brozzetti
2,3,6
1
Dipartimento di Ingegneria e Geologia, Università degli Studi “G. d’Annunzio” Chieti-Pescara, 66100 Chieti, Italy
2
CRUST—Centro inteRUniversitario per l’analisi Sismotettonica Tridimensionale, 66100 Chieti, Italy
3
Dipartimento di Scienze, Università degli Studi “G. d’Annunzio” Chieti-Pescara, 66100 Chieti, Italy
4
CNR-IRPI—Consiglio Nazionale delle Ricerche, Istituto di Ricerca per la Protezione Idrogeologica, Via Madonna Alta, 06128 Perugia, Italy
5
DTU Space Department, Technical University of Denmark, DK-2800 Kongens Lyngby, Denmark
6
Laboratory of Structural Geology, 3D Digital Cartography and Geomatics, University of Chieti-Pescara, 66100 Chieti, Italy
7
Istituto Nazionale di Geofisica e Vulcanologia, Sezione di Sismologia e Tettonofisica, 67100 L’Aquila, Italy
*
Author to whom correspondence should be addressed.
These authors contributed equally to this work.
Remote Sens. 2025, 17(14), 2491; https://doi.org/10.3390/rs17142491
Submission received: 9 May 2025 / Revised: 8 July 2025 / Accepted: 14 July 2025 / Published: 17 July 2025

Abstract

We inspected a sector of the Apennines (central–southern Italy) in geographic and structural continuity with the Quaternary-active extensional belt but where clear geomorphic and seismological signatures of normal faulting are unexpectedly missing. The evidence of active tectonics in this area, between Abruzzo and Molise, does not align with geodetic deformation data and the seismotectonic setting of the central Apennines. To investigate the apparent disconnection between active deformation and the absence of surface faulting in a sector where high lithologic erodibility and landslide susceptibility may hide its structural evidence, we combined multi-scale and multi-source data analyses encompassing morphometric analysis and remote sensing techniques. We utilised high-resolution topographic data to analyse the topographic pattern and investigate potential imbalances between tectonics and erosion. Additionally, we employed aerial-photo interpretation to examine the spatial distribution of morphological features and slope instabilities which are often linked to active faulting. To discern potential biases arising from non-tectonic (slope-related) signals, we analysed InSAR data in key sectors across the study area, including carbonate ridges and foredeep-derived Molise Units for comparison. The topographic analysis highlighted topographic disequilibrium conditions across the study area, and aerial-image interpretation revealed morphologic features offset by structural lineaments. The interferometric analysis confirmed a significant role of gravitational movements in denudating some fault planes while highlighting a clustered spatial pattern of hillslope instabilities. In this context, these instabilities can be considered a proxy for the control exerted by tectonic structures. All findings converge on the identification of an ~20 km long corridor, the Castel di Sangro–Rionero Sannitico alignment (CaS-RS), which exhibits varied evidence of deformation attributable to active normal faulting. The latter manifests through subtle and diffuse deformation controlled by a thick tectonic nappe made up of poorly cohesive lithologies. Overall, our findings suggest that the CaS-RS bridges the structural gap between the Mt Porrara–Mt Pizzalto–Mt Rotella and North Matese fault systems, potentially accounting for some of the deformation recorded in the sector. Our approach contributes to bridging the information gap in this complex sector of the Apennines, offering original insights for future investigations and seismic hazard assessment in the region.

1. Introduction

Remote sensing techniques are successfully applied in wide-ranging Earth observations [1,2,3,4,5], and research on active tectonics and deformation greatly benefits from the analysis and interpretation of remote data [6,7,8,9,10,11,12,13].
In Italy, recognising active faults is a primary concern due to the high seismic hazard [14] which stems from both historically recorded [14] and recent energetic (MW ≥ 6.0) earthquakes [15,16,17], most of which are known to have nucleated along seismogenic sources [18] running across the Italian extensional belt (Figure 1). However, detecting ongoing tectonic processes is not straightforward everywhere. Peculiar structural and geological settings, low deformation rates, or strong anthropogenic modifications may hinder fault identification and hamper geometric characterisation [19]. In addition, concurrent geomorphic processes may introduce bias into the estimation of reliable fault slip rates and earthquake recurrence [20].
In this regard, studies using different approaches across the various Italian seismotectonic provinces [21] point out how even areas lacking clear morphological evidence of deformation deserve to be reconsidered from a seismic hazard viewpoint [22,23,24,25,26].
This work focuses on a sector of the central–southern Apennines across the Abruzzo and Molise regional boundary (hereinafter AMB). In this area, evidence of active extension is interrupted by a structural gap of ~20–25 km, located between two active fault systems that show opposite dips (Figure 1 and bold light-yellow ellipses in Figure 2). At the same time, the paucity of recent seismicity is noteworthy. In fact, within the AMB, only highly energetic historical earthquakes have been documented [27], while no significant ones have been recorded in instrumental times, aside from the 1984 (MW5.9) event (Figure 2). Nevertheless, the velocity fields obtained from GNSS measurements [28,29,30] indicate an extension rate comparable to adjacent sectors that have recently experienced earthquakes (Figure 1).
Concurrently, the area marked by the structural gap is marked by an abrupt change in outcropping lithologies, transitioning from highly cohesive carbonates—widely represented to the northwest, west, and southeast of the AMB—to marls and argillites (Figure 2A), which, over the long term, likely preserve less evidence of tectonic imprints on the landscape.
In addition, the alternating lithologic domains which characterise the AMB (carbonate–calcarenite and sandstone–marly–clayey outcrops—Figure 2A) have been identified as being prone to landslides and deep-seated gravitational phenomena (IFFI—https://idrogeo.isprambiente.it/app/, accessed on 30 September 2024 [31]). On the one hand, slope instabilities may further contribute to obscuring or biasing offset geomorphic markers on the landscape, particularly in the context of a low-deformation area like the AMB, where extension rates fall within the range of ~0.5–3 mm/y [32,33]. On the other hand, the clustering of slope instabilities, along with geological data, can provide useful insights for identifying fault zones, as these are typically associated with reduced bulk-rock strength [34,35] and may serve as proxies. Even though the two phenomena operate on different temporal scales—long term vs. short term—several authors have demonstrated that normal-fault activity influences the location, abundance, and size of landslides [35,36,37,38,39,40,41].
Figure 1. Regional seismotectonic background of central–southern Italy with the framing of the study area across the Abruzzo–Molise regional boundary (AMB). Historical seismicity (stars) due to major (MW ≥ 6.0) intra-Apennine earthquakes is reported from Rovida et al.’s [27] (CPTI v. 4.0, time interval: 1000–2020 A.D.—except for the 2009 L’Aquila earthquake, which is cited in the text, only earthquakes with a Mw ≥ 6.5 are labelled). The epicentres of the 2016 and 2009 seismic sequences were sourced from Chiaraluce et al. [17] and Chiaraluce et al. [16], respectively. Instrumental, upper-crustal seismicity (1985–2024, M ≥ 2.5, depth ≤ 12 km) sourced from the ISIDe Working Group [15] is also represented with kernel density estimation (KDE [42]). The (composite) seismogenic sources (CSSs) conceived across the extensional Apennine belt were sourced from the DISS Working Group [18] (last database access on 31 May 2024), while the GPS velocity vectors from GNNS stations were sourced from Serpelloni et al. [30] with 95% confidence error ellipses.
Remotesensing 17 02491 g001
All these geological and geomorphological conditions raise the possibility that the structural gap might be only apparent and that these peculiar factors all concur in concealing potential active structures, which are instead aligned with the nearby fault systems.
By taking into account that the disconnection between active deformation and the absence of surface faulting has not yet been addressed and/or solved through conventional field survey approaches, we relied on a remote sensing-based and multidisciplinary methodological approach aimed at detecting poorly preserved evidence of tectonic signals.
Integrating various methodologies such as morphometry from high-resolution topography, aerial-photograph interpretation, and Persistent Scatterer SAR Interferometry (PSInSAR) has proven effective in different tectonic environments, even when targeting subtle and/or distributed deformation in low-deformation areas [8,23,43,44,45,46,47,48,49,50].
Based on these premises, the work is structured to present an integrated and multidisciplinary approach within the AMB, first providing its contextualisation and tectonic significance within the area through the Section 1, Section 2 and Section 3. The Section 4 will outline the three-step approach, including (1) morphometric and relief analysis to identify topographic disequilibrium, (2) stereoscopic aerial-photo interpretation to map tectonic and slope-related features, and (3) InSAR time-series analysis to detect and distinguish ground deformation signals. The methods and data (Figure 3) will be exploited sequentially and integrated with the existing structural–geological literature in three key areas (KA1, KA2, and KA3, in Figure 4) and to identify evidence consistent with normal-fault kinematics. The findings will flow into the Section 5, focusing on their convergence across the Castel di Sangro–Rionero Sannitico corridor (CaS-RS), which will be described. The Section 6 will interpret the evidence in terms of possible deformation styles and its relationship to deformation data available in the literature, as well as the broader tectonic implications within the ‘apparent’ structural gap, ultimately contributing to a better understanding of the AMB’s seismotectonic framework.

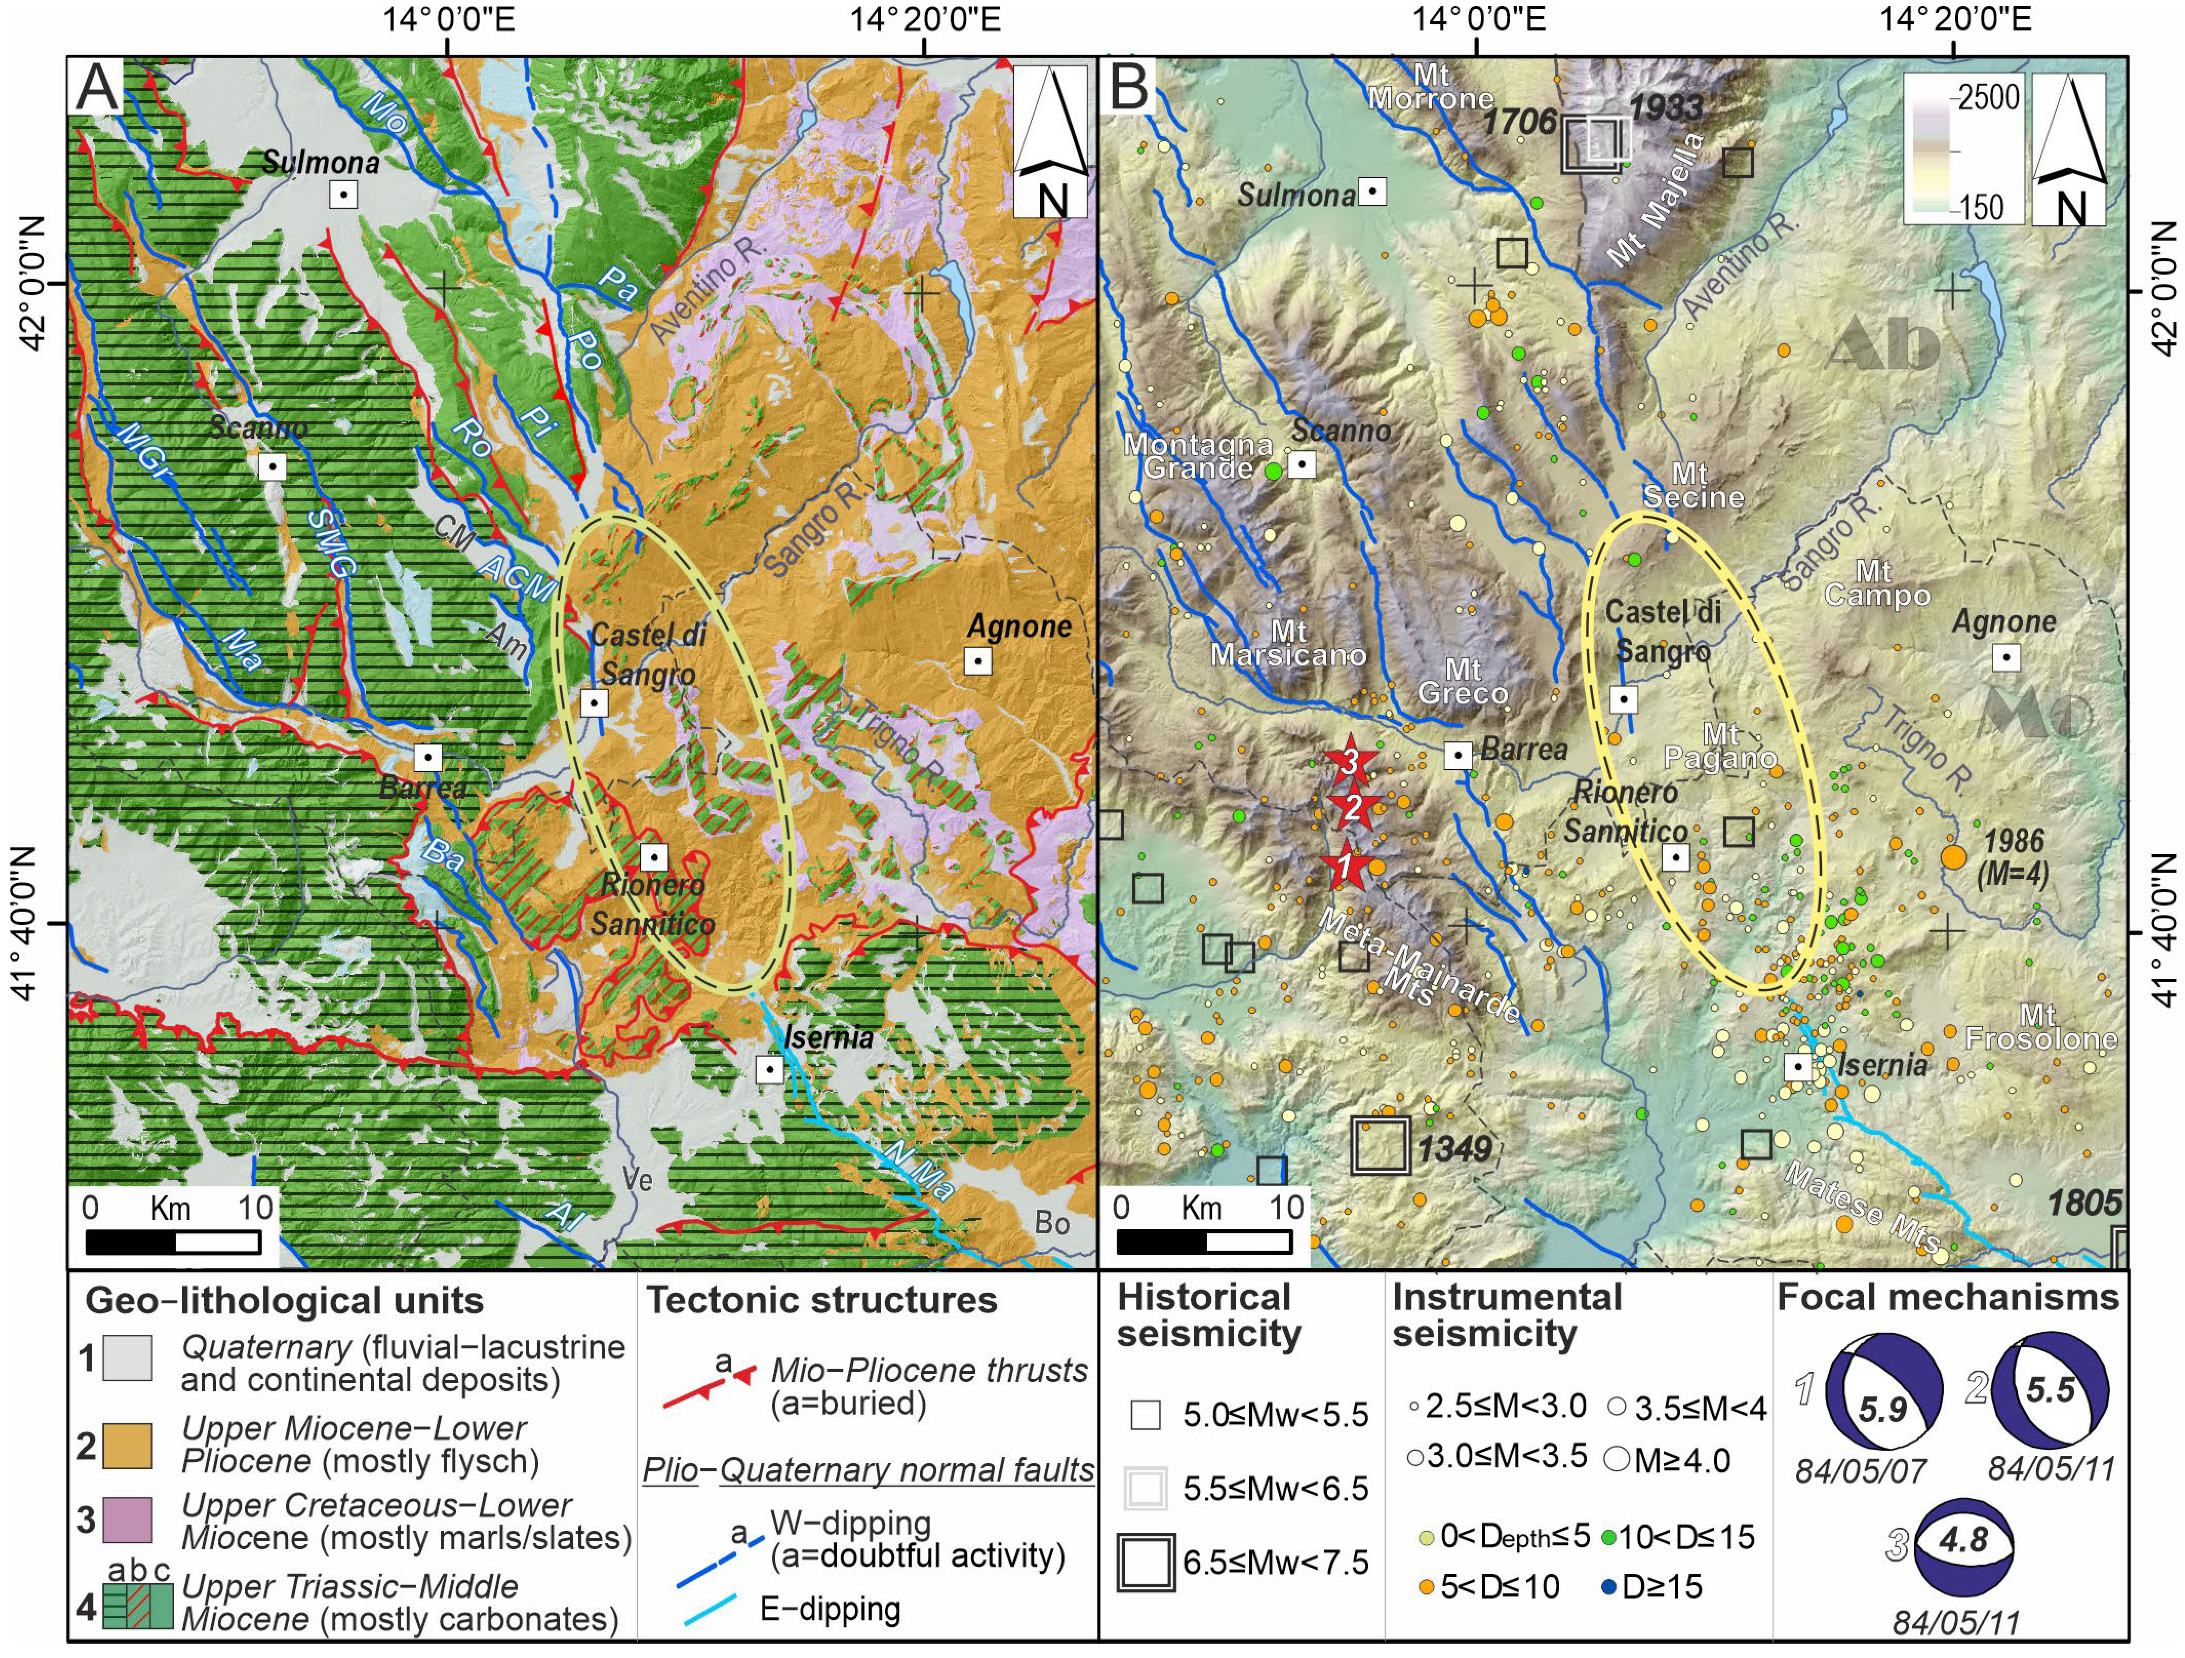
2. Geological and Structural Setting

The central–southern Apennines form a NE-verging fold-and-thrust belt which developed during the Neogene period as a result of the progressive forelandward thrusting and migration of Meso–Cenozoic palaeogeographic domains, which originally formed along the southern margin of the Tethyan ocean [51,52,53].
Within the AMB (Figure 2A), deposits belonging to shelf carbonate and slope-to-basin domains were stacked in response to compressive phases, which lasted until the Middle Pliocene [53,54]. Among them, separated by first-order thrusts and reverse faults, three main geo-lithological units can be recognised [52,55,56]. From W to E, they can be identified as follows:
-
Latium–Abruzzi and external Apulian units, consisting of Upper Triassic–Eocene platform-to-slope carbonates, which are disconformably overlain by Eocene–Middle Miocene carbonatic ramp- and slope-to-basin limestones (legend key 4a and 4c, in Figure 2A).
-
The Molise unit, made up of the following:
  • A Lower Cretaceous–Miocene slope-to-basin carbonate succession that is detached and thrust over Oligocene–Middle Miocene ramp-to-basin clayey marls and calcarenites (4b);
  • Upper Cretaceous–Early Miocene ‘inner’-derived basinal units, primarily consisting of argillites and varicoloured scaly clays (3 in Figure 2A).
-
Lower Messinian–Early Pliocene foredeep units and thrust-top deposits. These units overlie the deformed carbonatic thrust stack (2).
Following the general east-to-northeastward migration of the thrust sheets, a contemporary and coaxial post-Middle Miocene extension affected the inner part of the Apennine belt in response to a major geodynamic rearrangement at the Mediterranean scale, according to different models and deformation styles [57,58,59,60,61].
Throughout the central–southern Apennines, a predominant NE-SW-trending extension [62,63,64,65,66] has affected the AMB and surrounding sectors since the Early Pleistocene. Normal faults, mostly SW-dipping and oriented NW-SE to NNW-SSE, have overprinted the compressional structures, delimiting the carbonate ridges and promoting the formation of Quaternary basins and their infill with continental deposits (1 in Figure 2A) [67,68]. Extensional tectonics remains an active process, as confirmed by geological, geomorphological, and palaeoseismological data ([33,69,70,71,72] and references therein). This activity is further supported by the orientation of stress axes (Shmin) [66,73,74] and the spatial distribution of seismicity (Figure 1). Locally, extensional structures also seem to interplay with fluid circulation [75].
Recent studies within the AMB have determined that the Mt Morrone fault system (Mo in Figure 2A) has experienced constant slip rates (0.2–0.6 mm/y) over the last ~40 ka [76,77]. Displacements observed and measured on Upper Pleistocene alluvial surfaces support the recent activity of the fault segment bordering the Sulmona basin and confirm the deformation rates provided in the literature, even averaged over longer periods [78,79].
Southeastward, Pizzi et al. [80] examined the extensional deformation bordering the Majella massif. They identified Upper Pleistocene slope-derived deposits dragged and displaced by the Palena fault (Pa in Figure 2A), as well as slope deposits (grèzes litées sensu [81]) referable to the Last Glacial Maximum (LGM) faulted along the Porrara fault (Po in Figure 2A). Trenches dug in the Aremogna and Cinque Miglia basins (referred to as Am and CM, respectively, in Figure 2A) provide evidence of faulting during the Holocene epoch. These trenches revealed a normal-fault system approximately 16 km long (ACM in Figure 2A) and indicated that at least three seismic events have occurred in the last 7000 years. This fault system has the potential to generate earthquakes with magnitudes ranging from 6.5 to 6.8 ([82,83,84,85]). Slip-rate estimations of ~1 mm/y have been provided by Faure Walker et al. ([33] and references therein) based on post-LGM fault-throw measurements. The simultaneous activation of the Mt Morrone fault and segments belonging to the Aremogna and Cinque Miglia fault system during a palaeo-earthquake which occurred between 4.6 and 4.8 ka BP was also proposed by Di Domenica and Pizzi [86] based on radiocarbon dating of speleothems in a cave within the Majella massif and correlations with independent geological records available in the surrounding sectors.
36Cl radiometric dating and concentrations of rare earth elements along the ~13 km-long Pizzalto fault (Pi in Figure 2A) have provided evidence of at least six faulting events between 3 and 1 ka B.P. and an upper-bound slip rate of 2.6 mm/yr [87]. They suggest a behaviour similar to that of the Rotella fault (Ro in Figure 2A) and the Aremogna–Cinquemiglia faults, considering the fault’s recurrence time (1.2 ka), slip amount (0.3 to 1.2 m), and expected magnitude (up to MW6.4) and the potential for hard linkage or stress transfer during earthquakes.
Moving westwards, Faure Walker et al. [88] recognised post-LGM throws across the regularised slope faulted by the Scanno fault (Scanno–Mt Greco fault—SMG in Figure 2A) and estimated maximum slip-rate values of ~1 mm/y. According to Della Seta et al. [89], this fault was activated in a period earlier than ~330 ka, leading to the carving of the bedrock and the formation of an endorheic basin. The southern prolongation of the Scanno fault towards the fault bounding the western slope of Mt Greco is discussed by Lavecchia et al. [90].
Field evidence along the slope of Mt Marsicano suggests a long-standing geological history of the homonymous fault (Ma in Figure 2A) and the E-W-trending section of the Scanno–Mt Greco fault. The latter has been interpreted by Pace et al. [68] as a left-lateral, strike-slip discontinuity inherited from the Mio–Pliocene compressional phase and reactivated in the Quaternary extensional field. Displacements of Quaternary morphologies and continental deposits have been documented along the northern section of the Mt Marsicano fault, both along the main fault trace and in the hanging-wall rocks ([91,92] and references therein). Maximum slip-rate values of 1.8 mm/yr have been reported by Michetti and Roberts [71] for the Mt Marsicano fault, which, together with the SW-dipping Montagna Grande fault (MGr in Figure 2A), represents the southern prolongation of the Fucino–Parasano fault system, the latter being responsible for the 1915 MW7.1 Marsica earthquake (Figure 1) and seven palaeo-earthquakes during the Holocene [93,94].
There is no clear geologic evidence of Late Quaternary faulting reported in the literature regarding the Barrea fault system (Ba in Figure 2A). Nevertheless, its involvement in the 1984 earthquake sequence (main shock epicentres shown in Figure 2B) is shown in a study by Boncio et al. [70] (see next section).
In a landscape extensively influenced by Late Quaternary extensional tectonics, the continuity of the outcropping structures suddenly ceases south of the Mt Porrara–Mt Pizzalto–Mt Rotella and Aremogna–Cinquemiglia fault systems. In this area, we observe a predominance of siliciclastic, marly limestone, and clayey outcrops along with a notable absence of intramountain basins, which are instead well developed in the neighbouring sectors. Active normal faulting, indeed, is resumed only outside the AMB, in the Molise region, along the North Matese E-dipping fault system (NMa in Figure 2A). Several studies have reported on Upper Pleistocene–Holocene slope breccias and tephra levels [95,96,97] faulted along the northern slopes, which face the Bojano basin (Bo in Figure 2A), with slip-rate values ranging from 1 to 2 mm/y.

3. Seismotectonic Background

Despite being located between areas affected by Late Quaternary-active normal-fault systems, the AMB and adjacent sectors are marked by meagre seismicity rates. Notably, significant historical earthquakes, some dating back centuries [27], have occurred only outside this region (Figure 1 and Figure 2B).
In the northern sector of AMB, the Sulmona basin (Figure 2) experienced two destructive earthquakes in November 1706 (Imax = X/XI MCS, MW = 6.84) and in September 1933 (Imax = IX MCS, MW = 5.97). In particular, the seismogenic structure responsible for the 1706 earthquake is still a subject of debate, as it has been identified in part of the Mt Morrone normal fault [79,98], the Maiella (buried) back thrust [99], and the more external southern prolongation of the Adriatic Basal Thrust [100,101].
Figure 2. Structural–geological and seismotectonic background of the Abruzzo–Molise regional boundary (AMB). (A) Geological–structural map of AMB and surrounding sectors reporting the first-order geo-lithological units and tectonic lineaments. Geo-lithological units were extracted from existing cartography (ISPRA—Istituto Superiore per la Protezione e la Ricerca Ambientale, https://sgi.isprambiente.it/geologia100k/centro.aspx, accessed on 30 September 2024; Festa et al. [56]; Bucci et al. [102]). Mio–Pliocene compressional structures were sourced from Ferrarini et al. ([46] and references therein). Plio–Quaternary normal faults were sourced from Lavecchia et al. [90]. Fault key: Po = Mt Porrara; Pi = Mt Pizzalto; Ro = Mt Rotella; ACM = Aremogna–Cinque Miglia; Ba = Barrea; Mo = Mt Morrone; SMG = Scanno–Mt Greco; MGr = Montagna Grande; Ma = Marsicano; NMa = north Matese; AI = Aquae Iuliae. Basin key: S = Sulmona; CM = Cinque Miglia; Am = Aremogna; Bo = Bojano; Ve = Venafro. Dashed black lines mark regional boundaries. The yellow bold ellipses highlight the structural gaps observable between fault systems with opposite dips. (B) Historical ([27], from 1000 A.D. to 2020) and instrumental seismicity (ISIDe Working Group [15], from January 1985 to May 2024) recorded within the AMB and surrounding sectors (D = depth in km; M = magnitudes). Red stars (1, 2, 3) indicate the epicentres of the main events of the 1984 Barrea seismic sequence. Localisation and Mw values (within the beach balls, in the lower-right panel of the legend) were sourced from Boncio et al. [103]. The relative nodal planes were sourced from Pondrelli and Salimbeni [104]. Key for normal fault as in Figure 2A. Dashed black lines mark the boundaries between the Abruzzo (Ab) and Molise (Mo) regions.
Remotesensing 17 02491 g002
In the western sector of the AMB, a recent review of the macroseismic intensity data distribution associated with the September 1349 earthquake (Imax = X/XI MCS, MW = 6.8) suggests that the Aquae Iuliae W-dipping fault (AI, in Figure 2B) and the Gran Sasso Fault System (see fault location and details in Galli et al.’s [105]) were both activated during this event. This simultaneous activation resulted in significant far-field effects and damage across central Italy.
To the south, the July 1805 earthquake (Imax = X MCS, MW6.68) has been identified, in archaeo- and palaeoseismological records [96], as the most recent event which activated most of the segments belonging to the North Matese fault systems (NMa in Figure 2A). This event led to widespread hydrological changes and coseismic ruptures in the area facing the Bojano Plain [106,107].
The nearly aseismic feature of the AMB has been evident even during instrumental times (Figure 2B). Over the past several decades, only sparse and low-energetic upper-crustal seismicity (hypocentres within 15 km depth) has been detected within the sector ([15]—time interval: 1985–2024, M ≥ 2.5).
The paucity of seismicity has been strengthened following the installation of a temporary seismic network in the Sulmona area [108]. The relocation of earthquakes detected over a 7-month window in 2009 pointed out only background seismicity (ML values of up to 3.7) exhibiting a swarm-like behaviour. Nevertheless, the clustering of events, in particular at the southern tip of the Mt Porrara fault and the hanging wall of the Mt Marsicano fault, along with the low b-value, led the authors to suggest high-stress conditions. Accordingly, high seismic hazard in this area has been recently emphasised also in [109,110].
The only significant seismic activity within the AMB is associated with the 7 May 1984 MW5.9 Val di Sangro–Barrea earthquake (Figure 2B). This moderately energetic event was followed by two (MW = 5.5 and MW = 4.8) aftershocks in May [104]. The relocated seismicity from 1981 to 2003 [103,111], and particularly the aftershocks following the two main events (7 May and 11 May, Figure 2B), led the authors to identify the Barrea fault (Ba in Figure 2A) as the source of the entire sequence. These studies also emphasised the complex interaction with the inherited E–W-trending segment of the Scanno–Mt Greco fault (SMG in Figure 2A), which acted as a barrier to the along-strike propagation of the rupture processes along the Barrea fault. The available focal mechanisms (Figure 2B) indicate that normal-fault kinematics predominated, coherently with other extensional earthquakes occurring along the Apenninic chain [112].
In the area connecting the southern tips of the (W-dipping) Mt Porrara–Mt Pizzalto–Mt Rotella and Aremogna–Cinguemiglia and the (E-dipping) North Matese fault systems, no significant instrumental seismicity has been detected. Despite this evidence and the absence of mapped active faults in this region, Carafa et al. [22] noted that the area is currently undergoing permanent bulk deformation. They also suggested that the increase in the GPS velocity observed across the Apennines in this sector (as shown in Profile 3 of their paper) may indicate the presence of undiscovered fault(s).

4. Materials and Methods

We integrated different methodologies of analysis. In detail, these were as follows: (1) morphometric and relief analysis from high-resolution topography to first assess possible evidence of topography disequilibrium conditions and select key areas of investigation (KA1, KA2, and KA3 in Figure 4); the latter were targeted with (2) aerial-photo interpretation to examine the spatial distribution of morphological and tectonic features, as well as slope instabilities, and investigate their possible mutual links; and (3) InSAR data analysis was carried out to differentiate tectonic signals from non-tectonic (slope-related) processes.
Each methodology produced data outputs used as inputs for successive processes or analyses, which, ultimately, were related to the available structural–geological data to validate, strengthen, or refute the gathered evidence. Their final interpretation converged in a map of clues and/or evidence of normal faulting, following the flowchart outlined in Figure 3.
Figure 3. Flowchart illustrating the workflow from data input to processing, intermediate results, and their final integration and interpretation to produce the final map. Polygon key: 1—initial input data; 2—output/input in the subsequent process; 3—process (analysis); 4—decision; 5—final output.
Remotesensing 17 02491 g003

4.1. Relief Analysis

First-order topographic features provide insights into the interaction between tectonics (rock uplift) and erosion [113,114,115,116,117,118]. In particular, the relief is a measure of roughness in topography at a kilometre scale. Local relief indicates the amount of elevation change (in meters) within a ‘neighbouring’ area and has been demonstrated to be scale-dependent [119]. Residual relief refers to the difference between the surfaces representing the general forms of peak elevations (envelopes, hereinafter En) and valleys (sub-envelopes, hereinafter SEn). In landscapes shaped by active tectonics, areas with anomalously high residual relief may correspond to active stream incision [120,121]. Additionally, in a landscape characterised by a uniform climate and lithology, the residual relief correlates with the uplift rate [122,123].
We investigated the relief in the AMB using, as a topographic source, the 10m-px resolution DEM (raster dataset) released by Tarquini et al. [124] and performed the maps’ computation in a GIS (Geographic Information System) environment (see Resources). The local relief map was obtained using the Focal Statistics tool (‘range’ statistic type) within a 2.5 km rectangular neighbourhood (Figure 4A). The residual relief map (Figure 4B) was computed according to the workflow described in Ferrarini et al. [46]: (1) extraction of two stream networks, one from the original (DEM) raster (S) and the other from the ‘reversed’ raster (S’), to force flow direction and accumulation across topographic minima; (2) conversion of S and S’ into point vector datasets (PS and PS’, respectively) using a point sampling interval = 250 m; (3) extraction (from the DEM) of the elevation values for both S and S’ and generation of the final point datasets PE and PSE, respectively; (4) raster creation, from both PE and PSE, using the ‘Inverse Distance Weighted’ interpolation tool (power = 2; fixed radius = 2500 m) and obtaining En and SEn values, respectively; (5) residual relief map computation by subtracting SEn from En.
Figure 4. Relief analysis computed across the AMB and surrounding sectors. (A) Local relief map with the traces (1–5) of the swath profiles discussed in Section 5.1 and shown in Figure 5. (B) Residual relief map with the frames (red rectangles) of the three key areas (KA1-3) discussed in Section 5. First-order carbonatic-type boundaries (thin grey lines) have also been overlaid for comparison with the anomalies’ distribution. Normal-fault traces (light blue) are reported in both panels (key as in Figure 2A). Dashed black lines mark the boundaries between the Abruzzo (Ab) and Molise (Mo) regions.
Remotesensing 17 02491 g004
We also drew five parallel swath profiles spaced 10 km apart, SW-NE-oriented (i.e., perpendicular to the main structural lineaments), and with a 10 km buffer (Figure 5, map traces in Figure 4A). Swath profiles offer significant advantages over traditional cross-sections, as z-values are calculated as statistical parameters (minima, means, maxima, etc.) of elevation values at the same distance from the swath baseline [125]. Using swaths reduces the subjectivity in the location of the profiles and DEM topographic randomness, facilitating the spatial analysis of differential uplift across the landscape. This profiling technique has been widely applied in different active tectonic settings, both in high- and slow-deforming regions [46,113,116,117,120,126,127,128].
To achieve this target, we exploited the GIS add-in tool provided by Perez Peňa et al. [129] to project the minimum, maximum, and mean elevations onto the swaths (Figure 5). For comparison, both the local and residual topographic values were projected onto the swaths. In the latter case, we projected only the mean profile and reduced the buffer to 5 km to capture the main features while avoiding local effects. Profile 1 was primarily used as a ‘testing’ profile, as it crosses known Quaternary-active normal faults (see Section 2). Profiles 2 to 5 were traced to detect signals possibly related to a southeastern prolongation of the aforementioned lineaments.
Figure 5. Swath profiles (10 km buffer) across the AMB (map traces in Figure 4). Maximum–mean–minimum (max–mean–min) elevation profiles are projected along with (mean) local and residual profiles intercepted across the sections. Dashed red lines in Profiles 2 and 3 mimic a trendline fitting the wedge-shaped topography (from W to E) inherited from the Neogene compressional phases and unsettled by more recent tectonics. Light-blue bars emphasise the sectors which may show possible contributions to the topography due to recent active tectonics (see details in the text). Fault key as in Figure 2A.
Remotesensing 17 02491 g005

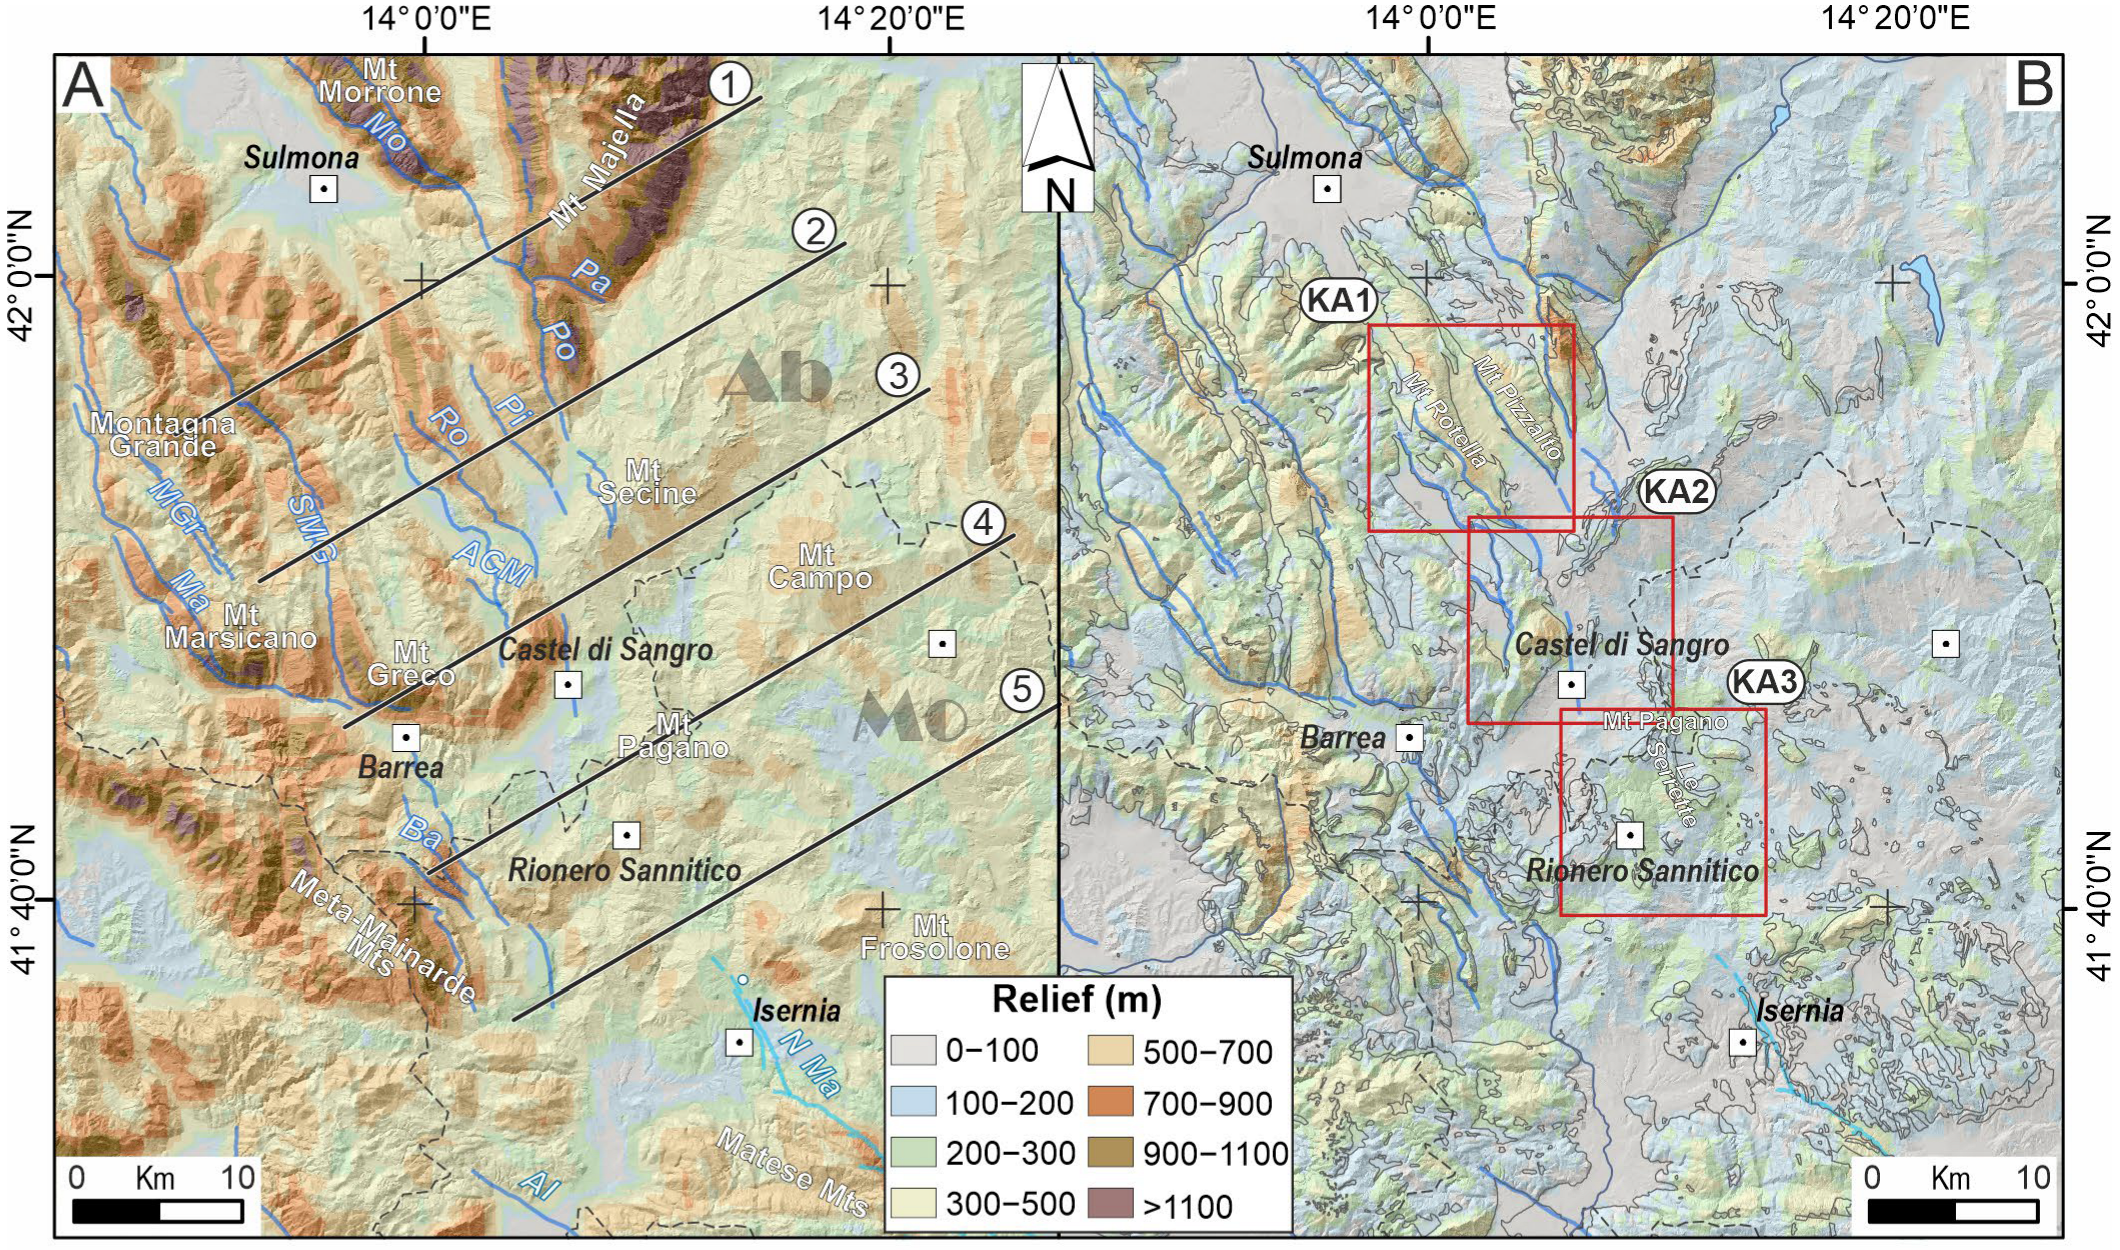
4.2. Topographic Derivatives

Among topographic attributes, slope and curvature maps, which represent the first and second derivatives of topography, respectively, are primarily used to infer information related to hydrological parameters as well as erosional and depositional processes [130,131,132,133]; additionally, they have been also used to investigate anomalous patterns (offset, bending, and interruption) in morphological features (scarps, valleys, and stream channels) which run across tectonically active regions [23,134,135].
We attempted to exploit these derivatives with the latter meaning, i.e., as morphometric indicators of active tectonics, and, given the greater detail needed to identify even subtle changes in laterally continuous values, we enhanced the resolution using topographic data at a scale of 1:5000 (CTR of Abruzzo Region, http://opendata.regione.abruzzo.it/, last accessed on 30 September 2024; CTR of Molise Region—see Resources). We digitised contour lines where only raster topography was available and used z-values to (1) generate a triangulated irregular network (TIN) and (2) interpolate it into a (raster) DTM with the 5m-px resolution.
By implementing the ‘Surface’ geoprocessing tools through the GIS software user interface (see Resources), we generated maps showing slope and profile curvatures (the latter being parallel to the maximum slope).
In the slope maps, we classified the values to emphasise steep and laterally continuous slopes, which may indicate the persistence of fault planes across the morphology.
For the curvature maps, we first applied, in advance, a low-pass filter to the DTM to remove the surface roughness. This was performed using the Focal Statistics tool with the rectangular-cell (50 × 50 m) neighbourhood mean statistic setting. To enhance the identification of laterally continuous bands of (coherent) negative or positive values and considering the moderate steepness of the area, we applied a colour-map stretch (minimum–maximum) in the range of −1 (upward convexity) to +1 (upward concavity) (blue and red values, respectively, in Figure 6 and Figure 7). Moreover, we combined the resulting maps with the hillshade of the DTM to enhance the continuity of naturally occurring tonal breaks.
The effectiveness of analysing the first and second (topographic) derivatives was initially tested in a sector where outcrops of Quaternary-active normal faults are well documented (KA1, in Figure 4). This method was then applied to less lithologically ‘conservative’ environments (KA2 and KA3, in Figure 4). Bedding data were also overlaid on the derivative maps to reduce the risk of misinterpretation. The most significant information and insights related to active tectonics are illustrated in Figure 6 and Figure 7 and discussed in Section 5 and Section 6.
Figure 6. Location maps with frames focusing on the derivative analysis (slope and curvature). Panel A displays KA1 (location map in Figure 4B) with hillshading of the topography (see Section 4.2 for details) and major tectonic lineaments. The normal-fault key differentiates (A,B) the fault traces already mapped in the literature and (C) those identified and/or reshaped in greater detail in this work. The enclosed frames (light-green rectangles) in panel (A) highlight the sectors with clues of tectonic imprints on the landscape (red arrows) as suggested by the slope (panels (B,D,F)) and curvature analyses (panels (C,E,G)). Red arrows mark the anomalies in the derivative signals.
Remotesensing 17 02491 g006

4.3. Morpho-Structural Analysis from Stereoscopic Imagery

Air-photo analysis (Figure 8) was performed using pairs of black-and-white stereoscopic aerial photographs obtained from Flight GAI 1954 (1:33,000 scale—http://www.pcn.minambiente.it/, accessed on 30 September 2024) and the Flight Abruzzo Region between 1981 and 1987 (1:13,000 scale—http://geoportale.regione.abruzzo.it/Cartanet, accessed on 30 September 2024).
The oldest photographs date back to the post-World War II period when urbanisation and landscape modifications were still in their early stages. This facilitated the recognition of large mass movements, including features that have been concealed or partially dismantled. In these earlier images, geomorphic lineaments also appear distinct and continuous, making them relatively easy to identify despite the varying image quality. In contrast, the higher-quality 1981–1987 image set allowed for a more accurate mapping of smaller features.
Stereoscopic visualisation and interpretation of photos were carried out using StereoPhoto Maker Pro (hereinafter SPM—see also Resources), which enables anaglyph 3D views of stereo-pairs (even in multiple instances simultaneously), their orientation, adjustments, and alignment. Since SPM does not permit the digitisation of features, the geomorphic lineaments and polygonal features were drawn, with feature attributes, on the corresponding Google Earth Pro imagery (see Resources). The resulting. kmz file was imported as an ESRI shapefile and overlaid on the 5m-px DTMs of the Abruzzo and Molise regions. The layer was also compared with additional information obtained with the other methodologies described in this section (Figure 6).

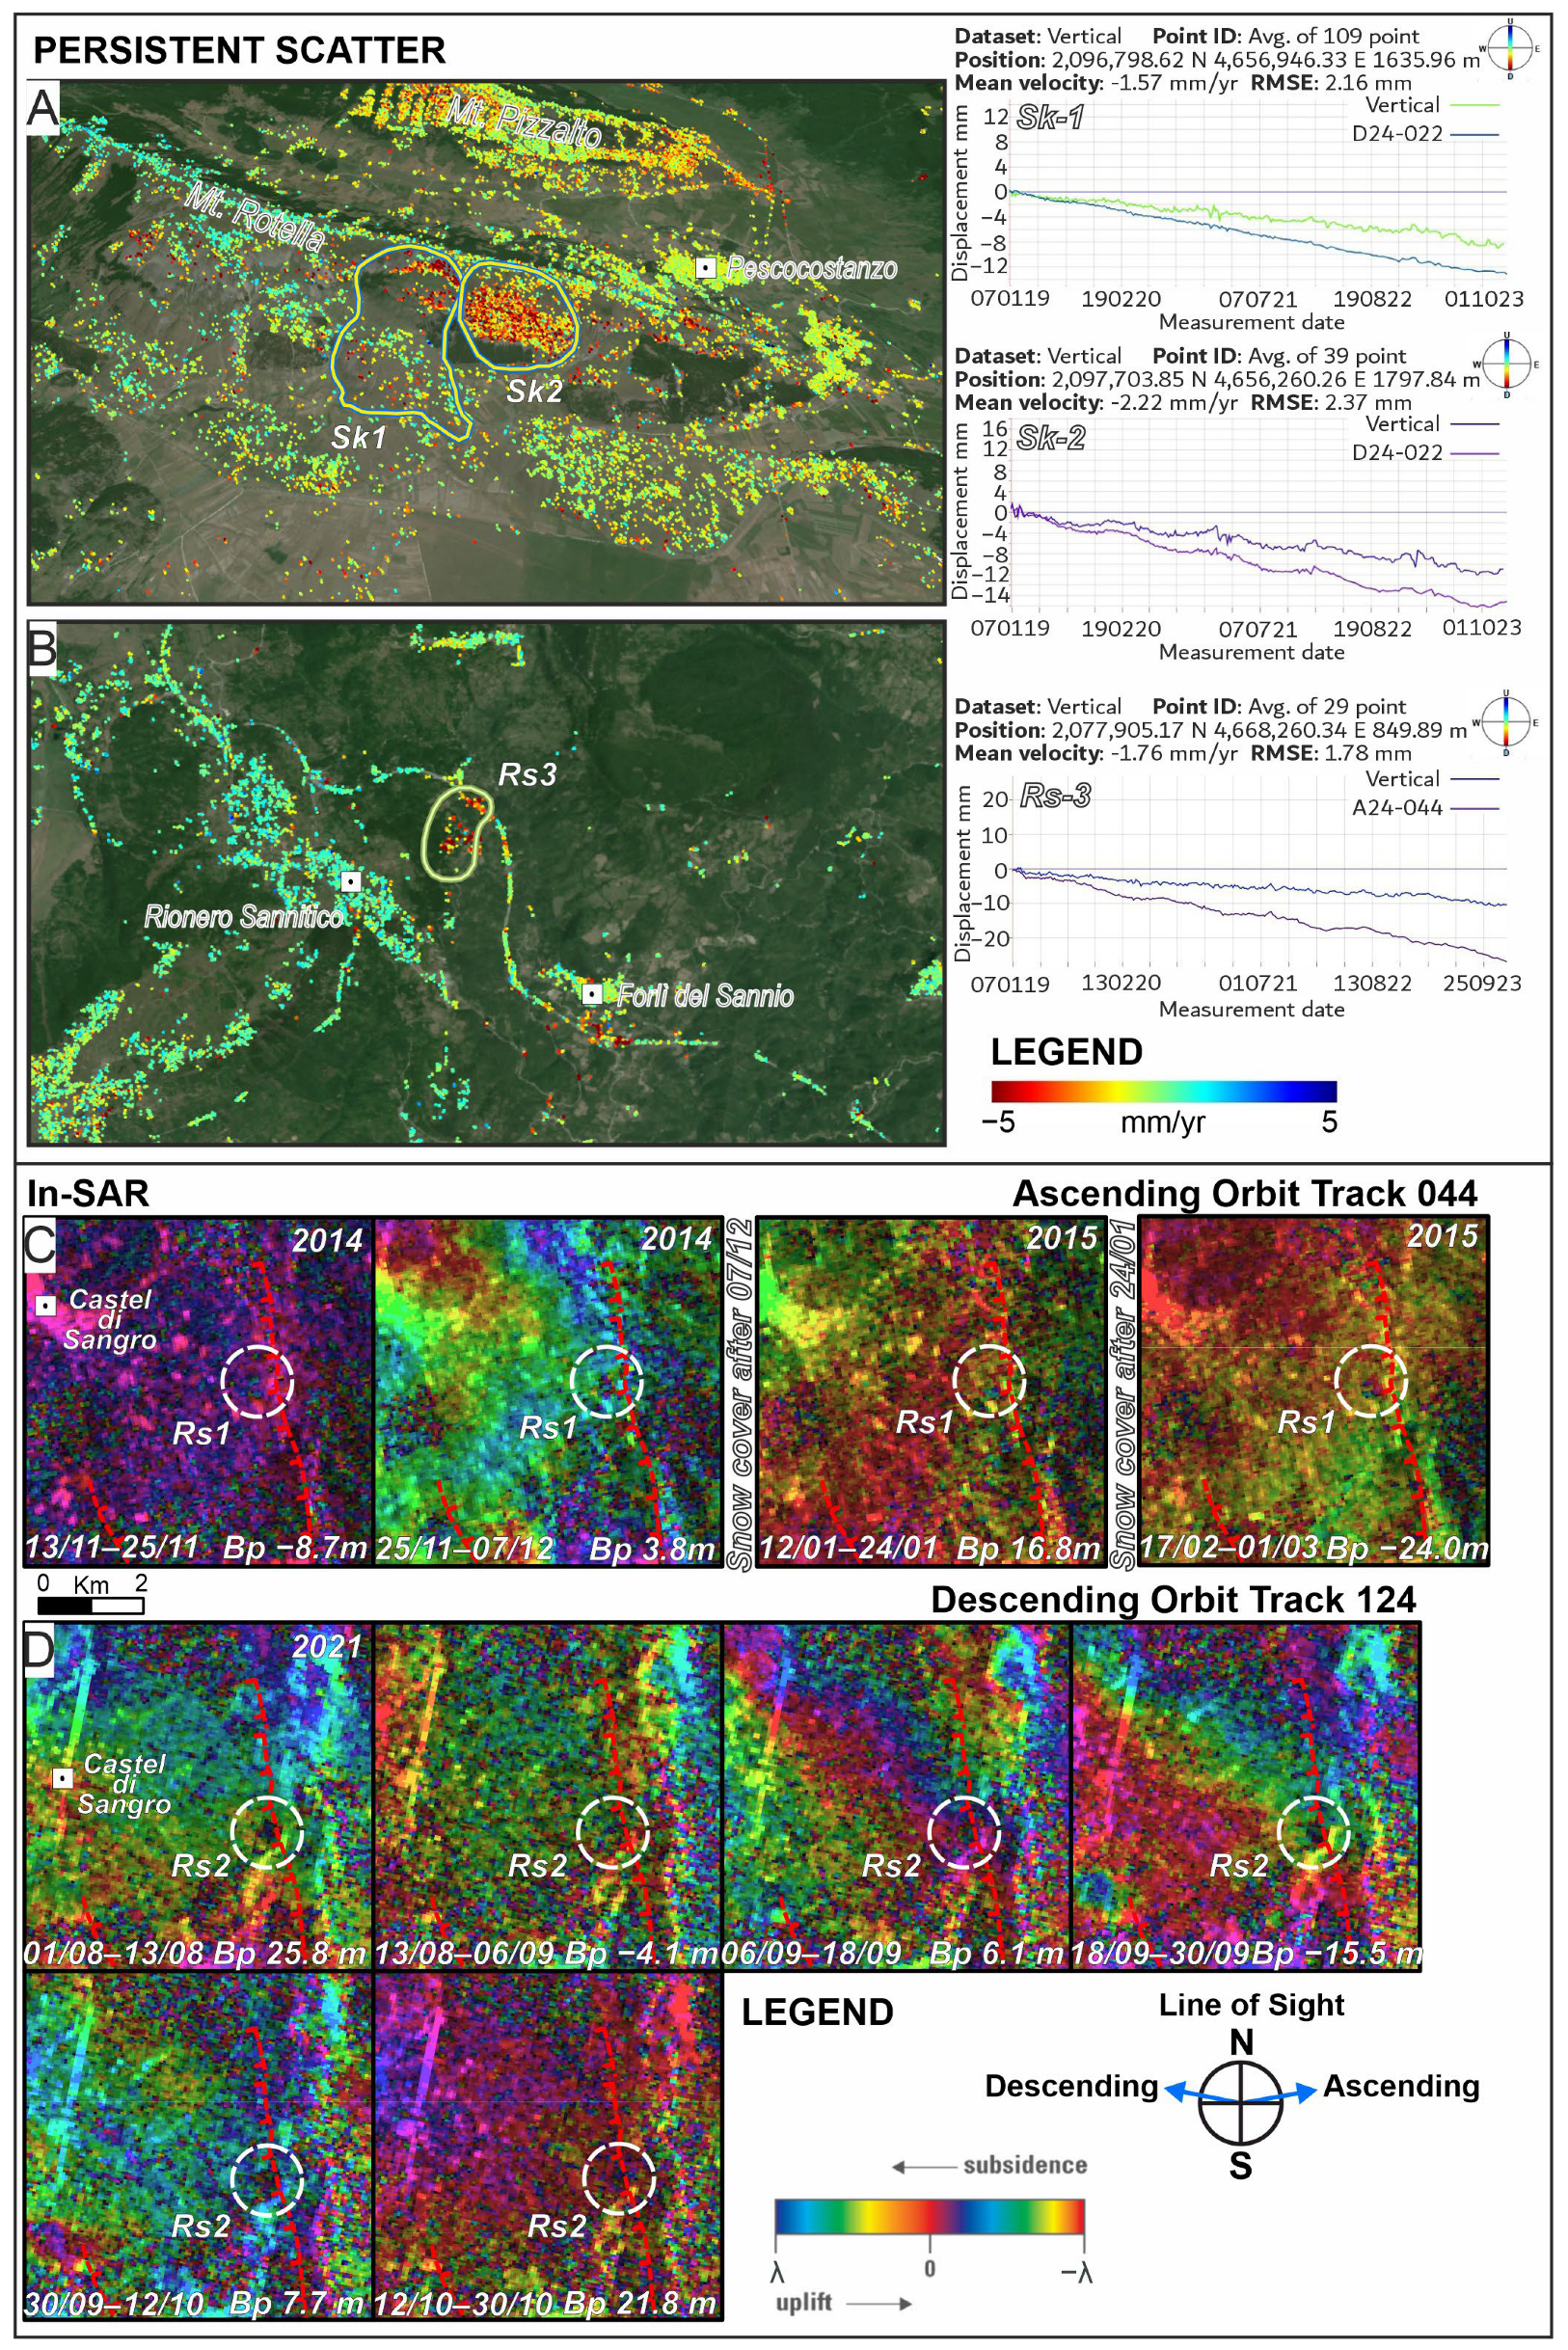
4.4. Time-Series InSAR Analysis

Interferograms allow the visualisation of phase differences—measured as a fraction of the radar wavelength and mapped within the range of −π to π radians—between two radar images. These differences may result from ground deformation of the target within a pixel relative to the sensor [136,137] between two acquisitions. Absolute deformation values can be computed if the phase ambiguity can be resolved [138] through the ‘phase unwrapping’ process. By contrast, signal coherence loss occurs when the earth’s surface between two acquisitions changes significantly (due, for example, to a long time span between interferograms, high deformation rates, snow cover, vegetation growth, and large perpendicular baseline values).
The European Ground Motion Service (EGMS) (https://egms.land.copernicus.eu/, accessed on 30 September 2024) provides calibrated measures of deformation rates obtained using a persistent scatterer (Ps-InSAR). This dataset (from 2019 to 2023) was used in KA1 and some sectors of KA3. Here, we used calibrated measures from ascending and descending orbits to spot slope movements and compute vertical measurements of the landmasses’ average velocities (Figure 9). In the KA2 and KA3 sectors, characterised by poor coverage of the scatterers, we tried to integrate the analysis with observations from time-series interferogram analysis (Figure 9).
Time-series interferogram (InSAR) analysis was performed using C-band SAR images acquired by the Sentinel-1 A/B satellites in the interferometric wide swath mode (IW) and with a swath width of 250 km. We collected the complete Single-Look Complex dataset available from June 2014 to May 2024 along ascending track 44 and descending track 124. Data processing was carried out using the IPP processor, developed and maintained by DTU Space [139]. Using this processor, we were able to compute interferograms by applying a multilook factor of 8 × 2 (range and azimuth), resulting in a spatial resolution of 40 × 40 m suitable for the detection of slope-related gravitational phenomena. For the topographic phase removal, we adopted the digital elevation model released by Tarquini et al. [124] with a pixel size of 10 m.
This approach was used mainly to validate the surface deformation processes pointed out by the aerial-photo analysis and eventually map any other slope-related movements.

5. Results

5.1. Clues of Topographic Disequilibrium Conditions from Relief Analysis

The local relief map (Figure 4A) shows the highest topographic anomalies (>900 m) along the western and eastern slopes of Mt Morrone and the Maiella–Porrara range, respectively, north of Montagna Grande, and on the southern side of Mt Marsicano and the Meta–Mainarde range. Moderate-to-high values (700–900 m) are also observable along the Pizzalto–Rotella Mts and Mt Greco, while the Upper Sangro Valley and Upper Molise foothills show low-to-moderate relief (up to 700 m).
A first-order rock-type dependency of the relief anomalies can be noted. The areas where Meso–Cenozoic platform-to-slope limestones and calcarenites crop out exhibit the highest values of local relief (Figure 4A), whereas the lowest relief values coincide with low-strength Upper Miocene–Middle Pliocene clayey–marly and calcarenitic foredeep deposits and Upper Cretaceous–Lower Miocene argillites and varicoloured clays.
The residual relief map (Figure 4B) shows a similar pattern, with most of the anomalies located in the carbonatic ‘domain’, particularly towards the eastern slope of Maiella Mountain (500–700 m), across the Porrara–Pizzalto–Rotella ridges (up to 700–900 m) and Mt Marsicano and Meta–Mainarde (500–700 m). Lower values (up to 500–700 m) are found in the Molise region, east of Mt Pagano and on the northwestern side of Mt Frosolone. Here, the close juxtaposition of foredeep and basinal successions (Upper Cretaceous–Miocene carbonates and calcarenites, and alternating sandstones and clays) reflects a scattered topographic signal, with anomalies reaching 300–500 m.
At first glance, the relief predictably mirrors the lithological facies and the location of compressional structures, the highest values being located across the mountain belt and with a general decrease from W to E. However, the swath profile comparison (Figure 5) shows that additional topographic contributions can be considered in the frame of more recent extensional tectonics.
Along the western section of Profile 1 (0–20 km), a prominent decrease in the topography (max–mean–min) can be observed, as mirrored by the local and the residual relief (the latter declines from 450 m to below 200 m). This pattern is consistent with the presence of the W-dipping active normal fault located on the Montagna Grande western flank (SMG in Figure 5), while the imprint of older and inactive thrust can also be found along its eastern flank (7.5 to 12.5 km—Montagna Grande ridge). At 10 km, the anticorrelation between maximum and minimum elevation profiles in the absence of significant lithological variation or mapped thrusts further supports the presence of a west-dipping normal fault. Considering the structural setting, this anomaly might be related to the northern prolongation of the Aremogna–Cinque Miglia fault system (ACM in Figure 5). The swath’s eastern section (20–40 km) shows similar features: the high average elevation (>2000 m) reflects an inherited topography related to the Maiella thrusting, while the abrupt profile drop on the western mountain slope is consistent with the recent activity of the W-dipping Mt Morrone and Mt Porrara faults (Mo and Po in Figure 5, respectively). Eastward, increasing relief values and anticorrelation between max and min profiles likely reflect the karst processes affecting the Majella massif, consistent with swath features already pointed out in similar geological contexts [140].
Along Profile 2, a trendline (dashed red line) fits the topography profile, indicating the wedge-shaped uplift (from W to E) inherited from the Neogene compressional phases (Figure 5). Standing to it, between 10 and 25 km, the mean elevation exceeds 1500 m, and relatively high local and residual relief values can be observed. The ‘excess’ of the topography coincides with the carbonatic ridges of Mt Rotella, Mt Pizzalto, and Mt Porrara (Ro, Pi, and Po, in Figure 5, respectively) and the homonymous Quaternary normal faults mapped at the rear of the thrust sheets. Residual relief also remains high across this fault belt (12–25 km), while no other insights into extensional tectonics can be inferred eastward on the profile (25–40 km), where the mean elevation and relief profiles decrease in correspondence with the transition from carbonates to flysch and marly–clayey deposits.
Analogously to Profiles 1 and 2, the relief dissection observable between 2.5 and 10 km in Profile 3 overlays the contractional structures along the Scanno–Mt Greco and Aremogna–Cinquemiglia normal faults (SMG and ACM in Figure 5, respectively). Between 15 and 40 km, a trendline similar to that featured in Profile 2 can be observed, suggesting a comparable (pre-Quaternary) tectonic influence. Nevertheless, a sharp decline of the local relief at about 30 km may reflect the combined contribution of the Sangro River’s tributary incision or the (possible) southern prolongation of the Mt Rotella–Mt Porrara active fault system (Ro and Po in Figure 5, respectively).
Along the initial section of Profile 4 (0–5 km), the peaks in elevation (1500 m) and local relief values (~750 m) are likely related to the Barrea fault system (Ba in Figure 5). Between 5 and 10 km, the elevation remains roughly steady (800–1000 m), probably due to the inherited Montenero Val Cocchiara compressional structure [141]. From 10 to 15 km, the local and residual relief values increase alongside the clear anticorrelation between the max and min elevations. Here, the difference of ~300 m in the mean altitude may suggest the presence of a W-dipping extensional structure possibly representing the southern prolongation of the Mt Rotella fault (Ro in Figure 5). However, the contact between Lower Messinian flysch and Middle Miocene carbonates (Figure 2A) may also contribute to the anomaly. Eastward (between 20 and 25 km), the mean elevation rises (from ~1000 to >1500 m) with a moderate increase in the local relief. Stream incision is evident from the anticorrelation between the max and min elevations, and although contractional tectonics may still affect the topography, the possible contribution of a W-dipping extensional structure aligned with the Mt Porrara–Mt Pizzalto fault is also plausible. In the easternmost section (Mt Campo sector, Figure 4A), the mean elevation increases again between 35 and 40 km, but, given the location of this transient on the outer edge of the Quaternary extensional belt (Figure 2 and Figure 4), we largely attribute it to inherited compressional phases.
Finally, along Profile 5, only the contribution of the Barrea normal-fault system (5–10 km) can be gleaned from the mean elevation rise (from ~700 m to ~1200–1300 m) and a similar trend in the local relief. Elsewhere across the profile, another transient can be observed between 15 and 35 km. Here, a ‘plateau-like’ signal emerges with mirrored max and min elevations and a local relief profile. Stream incision intensifies at the plateau rims, as also indicated by the slight anticorrelation between the max and min elevations. However, we consider the outcrops of Middle Miocene carbonates to have played a major role in shaping the plateau-rim topography and the relief setting in this external part of the belt.

5.2. Spatial Distribution of Tectonic-Related Anomalies from Derivative Maps

The slope and curvature analyses yielded robust results for KA1 and KA3 (Figure 5 and Figure 6), while their application for KA2 proved ineffective due to the complex local geomorphology, which has been heavily shaped by fluvial incision, anthropogenic modifications, and pervasive gravitational processes.
Across the carbonatic ridges of KA1, the predominance of a calcareous lithology and erosional process rates likely not exceeding tectonic uplift across fault scarps support the reliability of the method. High slope gradients align well with the mapped Quaternary fault traces, particularly along the western flank of Mt Pizzalto. Here, moderate slope values (15°–30°) define the mountain slope, but a near-continuous ‘strip’ of high values (30°–60°) trending N310°–N330° emerges downslope (red arrows in Figure 6B). Correspondingly, the profile curvature map reveals two parallel, pseudo-linear bands of maximum (red) and minimum (blue) curvature values (arrows in Figure 6C) indicative of convex and concave morphologies, respectively, typical of fault block morphologies. This pattern helped to refine the Pizzalto fault scarp trace (yellow fault trace in Figure 6A).
On the western flank of Mt Rotella, an ~2 km long band of steep slopes (30°–60°) delineates a slope break associated with the Rotella fault (Figure 6D, southeast side of the panel). The fault’s northwestern prolongation is suggested by an abrupt counterslope within an otherwise flat area. Elsewhere, slope values are scattered and do not clearly delineate linear fault-related features; instead, they correspond to the margins of gravitative phenomena, which are well defined in this sector (see also Figure 8A). Profile curvature values (Figure 6E) show a spatial pattern consistent with the slope analysis, reinforcing the morphotectonic interpretation.
The western slope of Mt Porrara is characterised by steep slopes (30°–60°), transitioning into an upslope with moderate gradients (15°–30°). This slope break corresponds to the Mt Porrara fault trace (red arrows in Figure 6F). Near the crest ridge, low (5°–15°)-to-very low slopes (0°–5°) define a pseudo-planar surface (northern sector in the panel) gently dipping E-NE associated with a synthetic splay of the Mt Porrara fault previously identified in available geological maps [55,56].
The profile curvature values (Figure 6G) strengthen these observations, revealing several discontinuities along the crest (blue strips), which may correspond to minor (old and inactive) E-W-striking faults inherited from earlier tectonic phases (Figure 6G).
Lastly, although the anthropogenic feature (Road SP12a in Figure 6F,G) obscures the curvature signal at the slope base, field evidence supports the outcrop of the Mt Porrara fault plane in this area [33].
In the Molise region (KA3), slope and curvature signals appear more scattered, although sub-linear alignments can still be discerned. In the Mt Pagano locality (Figure 6B), a N-S-trending band of steep slopes (30°–60°) is evident, even if it is abruptly disrupted by ~E-W stream incisions, despite the consistent bedding orientation. This pattern is mirrored in the profile curvature map (Figure 6C), where low curvature values outlining bedding traces are interrupted by continuous high values (in a meridian trend). Approximately 2 km south (Figure 7D), a band of steep slopes marks the Serrette section, dipping towards the valley. The corresponding curvature map (Figure 7E) emphasises the scarps and rules out the presence of morpho-structural surfaces, as the bedding is counterslope-dipping. Moving ~3 km southwestward, near Rionero Sannitico Village, the slope map (Figure 7F) shows a NNW-SSE-trending strip of high slope values (30°–60°) consistent with the curvature value pattern (Figure 7G). Unlike in the Mt Pagano sector, here the scarp dips eastward toward the valley.
Figure 7. Location maps with frames focusing on the derivative analysis (slope and curvature). Panel A displays KA3 (location map in Figure 4B) with hillshading of the topography (see Section 4.2 for details) and major tectonic lineaments. The frames (light-green rectangles) in panel (A) highlight the sectors with clues of tectonic imprints on the landscape (red arrows), as suggested by the slope (panels (B,D,F)) and curvature analyses (panels (C,E,G)). Red arrows mark the anomalies in the derivative signals.
Remotesensing 17 02491 g007

5.3. Spatial Distribution of Tectonic-Related Lineaments and Slope Instability Clustering Derived from Stereoscopic Imagery

The morpho-structural analysis based on stereoscopic imagery enabled the identification and classification of various geomorphological features (Figure 8). Among the polygonal features, landslides are predominant (Figure 8) and include (1) rockslides, (2) debris flows, (3) sackungs, and (4) deep-seated gravitational slope deformations [142,143] (hereinafter DSGSDs). Linear features have been classified as gravitational trenches, bedding traces, fold axes, and fault scarps.
The occurrence and spatial distribution of these features are primarily controlled by topography and litho-structural settings. Rockslides and DSGSDs are frequently associated with carbonate formations in contact with clayey–marly sediments and/or zones of intense faulting and fracturing. Debris flows are concentrated along the western slopes of Mt Rotella and Mt Pizzalto, where steep gradients, high relative relief, and the presence of carbonate breccias, loose debris, and fault-related fractured rocks create favourable conditions for their development.
In KA1 (the northern carbonatic-ridge sector), gravitational processes are strongly influenced by the presence of well-documented Late Quaternary normal-fault systems, which exert a significant influence on the spatial distribution, typology, and magnitude of slope instabilities. On the western slope of Mt Rotella, at least three sackungs (Sk1–Sk3, Figure 8A) have been identified, with deformation concentrated near the crest. This zone exhibits arched features comprising gravitational trenches, scarps, and counterslope scarps (Figure 8A). In this sector, debris flows commonly co-occur with rockslides, the latter typically occurring along pre-existing structural discontinuities such as joints, fault planes, and associated fracture networks.
On the eastern slope of Mt Rotella, rockslides and DSGSDs are associated with a minor thrust, as well as with downslope dipping or vertical bedding, within the thrust hanging wall (see bedding attitude in Figure 6E). In the Mt Pizzalto ridge, despite the stereoscopic photographic coverage not being optimal (Figure 8A), we primarily observed debris flows on the mountain’s western slope near the homonymous fault scarp.
KA2 (the Roccaraso–Castel di Sangro sector) is marked by two DSGSDs, which evolve into large earthflows along the valley connecting Roccaraso and Castel di Sangro Villages. Both landslide scarps and deposits originate on the western valley flank, where Miocene calcarenite and siliciclastic flysch crop out. The northern slide body (Figure 8B) exhibits a right-angle pattern, with the distal part of the toe very elongated toward the valley; the southern one displays a similar southward elongated shape. The W-dipping scarp, the elbow geometry of the northern slide body, and the elongation of both toes suggest the presence of a W-dipping, NNW-SSE-trending normal fault. The latter likely contributes to increased relief energy through footwall uplift and repeated faulting, thereby enhancing tectonically driven slope instability.
Figure 8. Gravitational processes, structural lineaments, and geomorphological features interpreted from the aerial-photo analysis carried out across the key areas KA1 (panel A), KA2 (panel B) and KA3 (panel C). The location maps of the key areas are reported in Figure 4. Sackungs and rockslides discussed in the text are labelled in the figure as Sk and Rs, respectively. Bedding traces, fold axes, and normal faults are mapped alongside gravitational slope deformation phenomena. The area with optimal stereoscopic coverage is also highlighted in panel (A).
Remotesensing 17 02491 g008
Additionally, the reduced bulk-rock strength within the fault damage zone and the enhanced weathering promote earthflow activity along this structurally controlled, low-relief valley. The fault can be traced 1–2 km further NNW beyond the landslide deposits, bounding the eastern edge of the endorheic ‘Il Prato’ basin (Figure 8B).
In KA3 (the Rionero Sannitico–Forlì del Sannio sector), large DSGSDs appear to be structurally controlled by the stratigraphic framework and newly inferred tectonic discontinuities. Rockslides are aligned along the NNW-SSE-trending Mt Pagano–Le Serrette ridge and extend toward Forlì del Sannio (Figure 8C). In the central portion of the ridge, an anticline fold can be observed, with its axis truncated by adjacent rockslides. Upslope of Forlì del Sannio Village, planar bedding defines a surface that is displaced westward and aligns with both the rockslide scarps and the dissected slope. These features suggest the presence of a W-dipping, NNW-SSE-trending normal fault, which drives the spatial distribution and evolution of the landslides.
On the opposite side of the valley, the eastern slope of the ridge near the Rionero Sannitico village is affected by two extensive DSGSDs (Figure 8C). The crown areas are marked by counterslope bedding, prominent scarps, counterscarps, and gravitational trenches. The landslides are similar in size and bear a comparable vertical offset on the main scarps. Notably, the crest of La Caprara ridge also displays an offset. These geomorphic features are all consistent with the presence of two E-dipping normal faults.

5.4. Time-Series InSAR Analysis Validation of Surface Deformation Processes

The interferometric analysis enabled the detection and validation of active gravitative deformations previously identified through the morpho-structural analysis (see Section 5.3), namely, Sk1–Sk2 in KA1 and Rs1-Rs2-Rs3 in KA3 (Figure 9).
In KA1, the high density of coherent scatterer enabled confirmation of the activity of sackungs Sk1 and Sk2 affecting the western slope of Mt Rotella (Figure 9A), previously identified through aerial-photo interpretation. The average vertical displacement rates over a 4-year period are 1.57 mm/yr for Sk1 and 2.22 mm/yr for Sk2. For Sk3 (Figure 8A), the sparse and uneven scatterer distribution prevents a reliable estimation of the vertical displacement rate.
In KA2, it was not possible to use this approach due to the contribution of several factors such as the virtual absence of scatterer coverage; the unfavourable morphological setting, marked out by a narrow-incised valley with steep slopes (which prevented the satellite sensors from properly resolving the topography on both the orbits’ geometries); and the loss of interferometric coherence due to farming activities.
In KA3, the integrated use of interferometric and persistent scatterer methodologies enabled the identification of three features related to surface deformation. Two anomalies (Rs1 and Rs2 in Figure 9C,D) were detected through interferogram analysis, while the third (Rs3 in Figure 9B) was identified via PS data. All features align with the structural framework previously delineated and correspond to rockslides Rs1–Rs3 (Figure 8C). On the interferograms, Rs1 and Rs2 appear as diffuse circular zones of coherence loss (Figure 9C,D) about 200–300 m in diameter, located on the western slope of Mt Pagano. These anomalies cannot be attributed to residual topography, given the consistently low perpendicular baseline (Bp) values (always between ±30 m), nor to transient surface changes such as snow cover, vegetation growth, wildfires, or floods. Topographic and atmospheric phase artefacts were also excluded based on their distinct spatio-temporal signatures. Thus, the observed coherence losses were interpreted as evidence of surface gravitational deformation. However, low coherence levels prevented reliable phase unwrapping and quantitative deformation estimates. The third feature (Rs3), detected through permanent scatterer analysis, affects the northern sector of the DSGSD, on the eastern slope of the La Caprara ridge, near the rockslide Rs3 (Figure 8C), and provides an average vertical displacement rate of 1.76 mm/yr over a time period of four years (Figure 9B).
Figure 9. Results of ground deformation analysis using persistent scatter measurement maps and time-series interferograms showing deformation clusters and coherence loss related to slope instabilities. (A) PS-InSAR-derived vertical displacement rates (mm/yr) for the sakungs Sk1 and Sk2 (light-yellow polygons) on the western slope of Mt Rotella (KA1), and (B) rockslide Rs3 (light-green polygon) at the Rionero Sannitico–Forlì del Sannio sector (KA3) showing localised deformation patterns. Related time-series plots (on the right) display a vertical displacement trend for the selected slope instabilities. (C,D) Interferograms from ascending (Track 044) and descending (Track 124) orbits highlighting deformation features of rockslides Rs1 and Rs2 in KA2. Coherence loss zones (white-dashed circles) are consistent with the gravitational deformation discussed in Section 5.3. Acquisition dates and perpendicular baselines (Bp) are indicated for each interferogram. The red-dashed lines in panels C and D represent normal faults inferred from the stereoscopic imagery analysis (see Section 5.3).
Remotesensing 17 02491 g009

5.5. Bridging the Late Quaternary Extensional Tectonics Within the AMB Structural Gap

The various methodologies applied in the KAs provided distinct evidence and/or clues related to recent normal-fault tectonics (for a summary, refer to Table 1 and the map view in Figure 10A,B).
In KA1, both topographic and morpho-structural analyses effectively refined the previously documented normal-fault system and identified additional fault segments (Figure 5 and Figure 6). Evidence of normal faulting in the Mt Porrara–Mt Pizzalto area aligns with well-exposed stacks of slope breccias found in the hanging walls of the respective faults [55,144] (Figure 2A). The absence of absolute dating for these deposits, whose formation is considered to generically predate the Brunhes–Matuyama boundary (~780 ka, [145,146]), makes it difficult to extend, unquestionably, the upper limit of extensional deformation affecting the mountains’ slopes. However, the topographic anomaly observed in Swath Profile 2 (Figure 5) suggests an equilibrium imbalance likely driven by active normal faulting across KA1. Further supporting this inference, the slope instabilities pointed out by the stereo-pair photo analysis (Figure 8A) and supported by data from permanent scatter analysis (Figure 9A) align with and cluster along the discontinuities, suggesting that they control their evolution, as has already been suggested by previous investigators across the Apennine and Peloritani Mts in Sicily ([36] and references therein).
In KA2 and KA3, the prevalence of low-strength lithologies (Figure 2A) has, on the one hand, hindered the identification of unambiguous signals in the topography and its derivatives. On the other hand, the tendency of non-conservative lithologies to favour gravitative phenomena has unexpectedly facilitated the identification of slope instability clustering along preferred trends, which are unlikely to be explained by the absence of tectonic discontinuities. Their mapping (Figure 7C and Figure 8B), further characterisation in terms of vertical displacement (Figure 9B) and occurrence (Figure 8C,D), and final comparison with topographic and derivative anomaly patterns (Figure 10B) allowed us to infer the existence of west- and east-dipping normal-fault segments near the villages of Castel di Sangro (partly according to Lavecchia et al. [90]) and Rionero Sannitico (Figure 8B and Figure 8C, respectively).
Figure 10. Plio–Quaternary normal faulting within the AMB study area according to the literature and the new findings collected in this study. (A) Structural map of the AMB with normal faults known from the literature (blue lines) and the structural discontinuities (red and orange lines) held to be responsible for topographic and slope instability phenomena, locally supported also by satellite data anomalies. The lineaments align through a corridor of deformation, the Castel di Sangro–Rionero Sannitico (CaS-RS) corridor (striped, grey band). Fault key as in Figure 2A. (B) Map view of the overall faulting evidence gathered within KAs 1, 2 and 3, based on the different methodologies used in this study and integration with the literature. (C) Velocity profile across the CaS-RS computed from geodetic data (from [22], map trace in (A)). The yellow rectangle across the profile marks the area with an increased velocity corresponding, on the map in panel (A), to the yellow strip crossing the CaS-RS and accounting for part of the deformation observed across the Apennine belt. (D) Cake diagram resuming the different percentages of lithologic outcroppings within the CaS-RS corridor and partially conditioning the deformation style in the link sector between the Mt Porrara–Mt Pizzalto–Mt Rotella (Po-Pi-Ro) and North Matese (NMa) fault systems. Key for different lithologies: 1—Quaternary (unconsolidated); 2—flysch (marls and sandstones); 3—clay and scaly clay; 4—carbonates.
Remotesensing 17 02491 g010
Mapping all the gathered clues and evidence of normal faults (Figure 10B) reveals that they are concentrated within a ~20 km long corridor that we have designated as the Castel di Sangro–Rionero Sannitico alignment (CaS-RS). It consists mainly of west-dipping lineaments whose normal-fault kinematics and dipping attitude are consistent with the integration of results from various methodologies and ultimately validated by available structural–geological data. In our view, the CaS-RS may fill an apparent structural gap between the Mt Porrara–Mt Pizzalto–Mt Rotella (to the north) and North Matese (to the south) fault systems (Po-Pi-Ro and NMa, respectively, in Figure 10A), thereby bridging the Late Quaternary deformation achieved by these two outcropping, opposite-dipping normal-fault systems, in partial agreement with Fracassi and Milano [136].

6. Discussion

6.1. Deformation Style of Active Tectonics Within the AMB and Tectonic Implications

The CaS-RS is located between the epicentres of the highly energetic 1805 and 1915 historical earthquakes (Figure 1), a sector where reduced seismic release (consistent with the potential for an MW~6.9 event) has been pointed out [28] and where a high strain rate has been highlighted (Figure 10C, profile from [22]). Recent statistical analyses of the correlation between observed strain rates and the time elapsed since the last earthquake suggest that this area is likely in a late stage of the seismic cycle, as indicated by its lower values compared to nearby regions affected by recent earthquakes [147]. All these observations suggest the need to at least consider alternative deformation styles or structural complexities that might be responsible for subtle and/or diffuse deformation, obscuring long-term normal-fault signatures in the landscape, thereby explaining the ‘apparent’ structural gap.
It is noteworthy that the majority of the active normal faults across the central Apennine belt are mapped within carbonate deposits, which dominate the lithological framework [102,148]. In contrast, the sector located between the Mt Porrara–Mt Pizzalto–Mt Rotella and North Matese fault systems (black-dashed rectangle in Figure 10D) is dominated by sandstones, marls, and clays (~45% compared with the remaining carbonatic and unconsolidated Quaternary deposits). Subsurface data indicate that these ‘non-conservative’ lithotypes have significant thicknesses within the AMB, since the top of the Apulian carbonates is buried below a ’soft‘, mainly terrigenous nappe, which in many cases exceeds a thickness of 2500 m (Pescopennataro 1–2 and Setteporte wells, VIDEPI Project—https://www.videpi.com/videpi/pozzi/gruppo.asp?ub=T&regione=Molise&provincia=Isernia, accessed on 30 September 2024).
When averaged over time or multiple slip events, faults which develop in mechanically competent layers tend to propagate rapidly along a strike relative to the accumulation of displacement. In contrast, faults which affect weak layers exhibit high displacement-to-propagation ratios, steep displacement gradients, and variable deformation zone widths [149,150]. The combined effect of these factors, along with the low deformation rates estimated for the sector (see Section 1), leads to an elusive and subtle morphological signature for any potentially active faults [151]. On the other hand, we envisage that active tectonics may also manifest as diffuse (off-fault) deformation, heavily influenced by the mechanical property of the stratigraphy, in analogy with evidence observed in various tectonic contexts and at different scales [23,47,150,152].
The location of the AMB, framed in the proximity of pre-existing NNE-SSW-oriented transverse structures, i.e., the Sangro–Volturno lateral-ramp zone [148,153], also raises the issue of the cross-cutting relationship between the Mio–Pliocene thrusts and the Quaternary (seismogenic) extensional faults. In the central Apennines, some of these oblique structures have been identified as barriers to the propagation of the ~NW-SE-striking Quaternary extensional faults (e.g., [154,155,156,157]), especially when related to regional-scale discontinuities involving the basement. Alternatively, when these oblique structures are limited to a few kilometres in length, they can play a twofold role.
They may act as barriers during the rupture of individual fault segments [111] or be reactivated as transfer faults between NW-SE adjacent segments of the same fault system [70,156]. This ongoing debate was recently sparked after the 2016 Norcia MW6.5 earthquake (Figure 1). One perspective supports the proposition that the Sibillini thrust was seismically reactivated [158,159] due to its favourable orientation within the current extensional stress field. Conversely, there is also evidence, based on coseismic displacement patterns and cumulative geological throw, that suggests an independent behaviour of the seismogenic normal-fault system which cuts through the regional thrust [160,161,162,163].
The abrupt break in the structural alignment of Quaternary normal faults, stepping from KA1 to KA2 and KA3 (Figure 1 and Figure 2), may also originate from and reflect the significant structural complexity, mirroring similar contexts along the Apennines.

6.2. Data Challenges Versus Lines of Evidence for the CaS-RS

Although our findings on the CaS-RS align well with the Abruzzo–Molise regional boundary (AMB)’s seismotectonic context, we cannot yet resolve whether lithological heterogeneity or a structural barrier plays the dominant role in the deformation style. Nor can we constrain the deformation along the CaS-RS and/or fully assess the seismogenic attitude of all the identified structures. These limitations stem primarily from two factors: (1) the lack of datable geomorphic markers, even in areas where fault planes are well exposed (e.g., KA1), and (2) the absence of recent earthquakes, which prevents the establishment of a spatial correlation between seismicity and tectonic structures, especially if they are buried or incipient.
The sparse seismicity across the CaS-RS, and generally throughout the AMB (Figure 2B), would support the presence of a structural barrier preventing the southward propagation of the west-dipping normal-fault alignment (see Section 6.1). However, similar seismic quiescence has been observed elsewhere along the Apennine extensional belt despite geological and palaeoseismological evidence of recent activity.
By way of example, just a few kilometres north of the investigated KAs, in the Sulmona basin (Figure 2B and Figure 10A), the last historical event associated with the Mt Morrone fault occurred in the second century AD [98], although, in instrumental times, temporary seismic monitoring of the area [108,164] has recorded only background seismicity and negative magnitudes. In contrast, Galli et al. [79] documented, along the same structure, four faulting events in the last ~9 ka BP, and Puliti et al. [77] estimated constant slip rates over the last ~40 ka.
Similarly, the sector to the south of the 2009 L’Aquila earthquake epicentral area (Figure 2) has remained silent over the past 1000–2000 years. Yet Falcucci et al. [165] documented surface ruptures associated with at least two large events during the Late Holocene and expected magnitudes of up to 6.8 (the Middle Aterno–Subequana Valley fault system).
Likewise, the Mt Vettore fault—responsible for the MW6.5 Norcia 2016 seismic sequence (Figure 1)—remained blocked in historical times (except for the 1639 earthquake, [166]), although palaeoseismological evidence accounts for six surface faulting events since 9 ka and released magnitudes (MW) higher than 6.6 [167].
To be thorough, unexpected fault activations have also been recently documented along the very-low-deforming (and long thought to be inactive) Apennine outer compressional front, specifically during the 2012 Emilia MW6.1 earthquake [26,168].
All these arguments provide support for the inference that the sparse, low-energetic seismicity within the AMB is not necessarily indicative of a structural barrier hindering the southward propagation of the active normal-fault system. Rather, it more likely reflects the concurrence of the lithological complexity and seismotectonic framework (low deformation rates—see Section 1 and Section 2), which contribute to subtle and diffuse faulting across the CaS-RS. Although challenging to detect, this style of faulting likely accounts for part of the deformation suggested by geodetic velocities on the surface [22,28].

7. Conclusions

In this work, we focused on a sector along the Apennine extensional belt (AMB) that lacks unequivocal geomorphic and seismic signatures of recent tectonics, despite its geographical location and the structural continuity with the Quaternary and active normal-fault systems (Figure 1 and Figure 10). Considering the complexity of the AMB geological and structural setting and the low deformation rates known for neighbouring sectors (see Section 1 and Section 2), we adopted a research approach which integrated multi-source and multi-scale data to address the challenge of detecting subtle clues of active tectonics. This included morphometry from high-resolution topography, aerial-photograph interpretation and spaceborne SAR persistent scatters, and interferometric imagery analysis (Section 3).
The cross-disciplinary methodology we employed facilitated the identification of relief and topographic anomalies, geomorphic lineaments, and clustering of slope instabilities, ultimately supported also by Ps-InSAR deformation patterns (Section 4 and Section 5). All anomalies and findings were concentrated within an ~20 km long corridor, the Castel di Sangro–Rionero Sannitico alignment (CaS-RS in Figure 10).
We interpret the anomalies observed along the CaS-RS as evidence of normal faulting characterised by subtle and diffuse deformation within a thick tectonic nappe composed of poorly cohesive lithologies (sandstones, marls, and clays) which dominate the investigated region. This deformation may represent, in our view, the ‘missing’ structural link bridging the gap between the (west-dipping) Mt Porrara–Mt Pizzalto–Mt Rotella and Aremogna–Cinguemiglia and (east-dipping) North Matese fault systems in central–southern Italy.
We demonstrated that a multidisciplinary approach, combining geological and (remote) multi-scale and multi-source data analyses, offers a valuable complementary method to address seismotectonic issues in areas like the AMB where concurrent factors, such as non-conservative lithologies, complex structural settings, human-related impacts, and low deformation rates, may hinder surface evidence of faulting.
Future efforts to constrain the seismogenic potential of the CaS–RS alignment should include more targeted field surveys aimed at assessing fault offsets, as well as geometric and kinematic parameters. Where possible, these should be integrated with the interpretation of available seismic lines crossing the alignment in order to link surface observations with the down-dip extensions of the interpreted faults.
Nevertheless, the evidence gathered in this study represents, in our opinion, a step forward in advancing our understanding of active faulting along the Apennine extensional belt in central–southern Italy. Although preliminary, these findings provide original inputs and valuable insights for future investigations in terms of seismic hazard assessment in the area.

Resources

Data georeferencing and processing and preliminary figure layouts were implemented in ArcGIS Pro by ESRI (v. 3.4.0), released at the University ‘G. d’Annunzio’ of Chieti-Pescara. The PDF version of the CTRs (Technical Cartography—scale 1:5.000) can be obtained upon request by the Molise Region, Campobasso, Italy, (regionemolise@cert.regione.molise.it). Stereoscopic visualisation and interpretation of photos were carried out using the free software StereoPhoto Maker Pro vers. 6.31 (https://stereo.jpn.org/eng/stphmkr/, accessed on 31 January 2024). The mapping of geomorphic lineaments and polygonal features was facilitated using Google Earth Pro, vers. 7.3.6. Code scripting to process InSAR data was implemented with MATLAB (v. R2024b), released at the University ‘G. d’Annunzio’ of Chieti-Pescara. Some layers in Figure 1 and Figure 2 were implemented using GMT—The Generic Mapping Tools designed by Wessel et al. [169]. The final graphic design of the figures was created using the software CorelDRAW Graphics Suite 2020, released to Federica Ferrarini.

Author Contributions

Conceptualisation, F.F., M.B., F.B. (Francesco Bucci), M.C., J.P.M.B., M.M.C.C., and F.B. (Francesco Brozzetti); methodology, F.F., F.B. (Francesco Bucci), M.S., M.C., and J.P.M.B.; software M.B., F.B. (Francesco Bucci), M.S., M.C., D.C., and J.P.M.B.; validation, F.F., F.B. (Francesco Bucci), M.S., M.C., J.P.M.B., M.M.C.C., and F.B. (Francesco Brozzetti); formal analysis, M.B.; investigation, M.B., F.B. (Francesco Bucci), M.C., F.F., and F.B. (Francesco Brozzetti); resources, F.F., F.B. (Francesco Bucci), M.S., M.C., D.C., and J.P.M.B.; data curation, M.B.; writing—original draft preparation, F.F. and M.B.; writing—review and editing, F.F., M.B., F.B. (Francesco Bucci), M.S., M.C., J.P.M.B., D.C., M.M.C.C., and F.B. (Francesco Brozzetti); visualisation, F.F. and M.B.; supervision, F.F., F.B. (Francesco Bucci), M.C., J.P.M.B., F.B. (Francesco Brozzetti), and M.M.C.C.; project administration, F.F. and M.M.C.C.; funding acquisition, F.F. and F.B. (Francesco Brozzetti). All authors have read and agreed to the published version of the manuscript.

Funding

The research and authorship of F. Ferrarini and F. Brozzetti were supported by the ‘ex 60%’ funds granted by the DiSPuTer of the University ‘G. D’Annunzio’ of Chieti-Pescara. This work received financial support through an agreement between INGV (Istituto Nazionale di Geofisica e Vulcanologia) and the University ‘G. D’Annunzio’ of Chieti-Pescara (PG–U N°0003705), which funds the PhD research of Marco Battistelli.

Data Availability Statement

The data presented in this study are available within the article. Additional data can be provided by the authors upon reasonable request.

Acknowledgments

The authors wish to thank Rita de Nardis for the thoughtful discussions, and the Editor João Catalão Fernandes and the anonymous reviewers for their valuable time and insightful comments, which greatly contributed to improving the original manuscript draft.

Conflicts of Interest

The authors declare no conflicts of interest.

Abbreviations

The following abbreviations are used in this manuscript:
36ClChlorine 36
AbAbruzzo Region
ACMAremogna–Cinque Miglia fault system
AIAquae Iuliae fault
AmAremogna Basin
AMBAbruzzo and Molise regional boundary
BaBarrea fault system
BoBojano Basin
BPBefore present
CaS-RSCastel di Sangro–Rionero Sannitico alignment
CMCinque Miglia Basin
CPTIItalian Parametric Earthquake Catalogue
CSS(Composite) seismogenic source
DEMDigital elevation model
DSGSDDeep-seated gravitational slope movement
DTMDigital terrain model
GNSSGlobal Navigation Satellite System
GPSGlobal Positioning System
InSARInterferometric Synthetic Aperture Radar
KaKilo annum
KA1Key Area 1
KA2Key Area 2
KA3Key Area 3
KDEKernel density estimation
LGMLast Glacial Maximum
Ma Mt Marsicano fault
MGMt Greco fault
MGrMontagna Grande fault
Mo Mt Morrone fault
NMaNorth Matese E-dipping fault system
Pa Palena fault
PiPizzalto fault
PoPorrara fault
PSInSARPersistent Scatterer SAR Interferometry
RoRotella fault
RsRockslide
ShminMinimum horizontal stress direction
Sk Sackung
SMGScanno–Monte Greco fault
SPMStereoPhoto Maker Pro
VeVenafro Basin

References

  1. Wilson, J.P. Digital terrain modeling. Geomorphology 2012, 137, 107–121. [Google Scholar] [CrossRef]
  2. Pepe, A.; Calò, F. A Review of Interferometric Synthetic Aperture RADAR (InSAR) Multi-Track Approaches for the Retrieval of Earth’s Surface Displacements. Appl. Sci. 2017, 7, 1264. [Google Scholar] [CrossRef]
  3. Okyay, U.; Telling, J.; Glennie, C.L.; Dietrich, W.E. Airborne lidar change detection: An overview of Earth sciences applications. Earth-Sci. Rev. 2019, 198, 102929. [Google Scholar] [CrossRef]
  4. Del Soldato, M.; Confuorto, P.; Bianchini, S.; Sbarra, P.; Casagli, N. Review of Works Combining GNSS and InSAR in Europe. Remote Sens. 2021, 13, 1684. [Google Scholar] [CrossRef]
  5. Jin, S.; Wang, Q.; Dardanelli, G. A Review on Multi-GNSS for Earth Observation and Emerging Applications. Remote Sens. 2022, 14, 3930. [Google Scholar] [CrossRef]
  6. Pezzo, G.; Merryman Boncori, J.P.; Tolomei, C.; Salvi, S.; Atzori, S.; Antonioli, A.; Trasatti, E.; Novali, F.; Serpelloni, E.; Candela, L.; et al. Coseismic Deformation and Source Modeling of the May 2012 Emilia (Northern Italy) Earthquakes. Seismol. Res. Lett. 2013, 84, 645–655. [Google Scholar] [CrossRef]
  7. Bucci, F.; Mirabella, F.; Santangelo, M.; Cardinali, M.; Guzzetti, F. Photo-geology of the Montefalco Quaternary Basin, Umbria, Central Italy. J. Maps 2016, 12, 314–322. [Google Scholar] [CrossRef]
  8. Brozzetti, F.; Mondini, A.C.; Pauselli, C.; Mancinelli, P.; Cirillo, D.; Guzzetti, F.; Lavecchia, G. Mainshock Anticipated by Intra-Sequence Ground Deformations: Insights from Multiscale Field and SAR Interferometric Measurements. Geosciences 2020, 10, 186. [Google Scholar] [CrossRef]
  9. Civico, R.; Blumetti, A.M.; Chiarini, E.; Cinti, F.R.; La Posta, E.; Papasodaro, F.; Sapia, V.; Baldo, M.; Lollino, G.; Pantosti, D. Traces of the active Capitignano and San Giovanni faults (Abruzzi Apennines, Italy). J. Maps 2016, 12, 453–459. [Google Scholar] [CrossRef]
  10. Mirabella, F.; Bucci, F.; Santangelo, M.; Cardinali, M.; Caielli, G.; De Franco, R.; Guzzetti, F.; Barchi, M.R. Alluvial fan shifts and stream captures driven by extensional tectonics in central Italy. J. Geol. Soc. 2018, 175, 788–805. [Google Scholar] [CrossRef]
  11. Valerio, E.; Tizzani, P.; Carminati, E.; Doglioni, C.; Pepe, S.; Petricca, P.; De Luca, C.; Bignami, C.; Solaro, G.; Castaldo, R.; et al. Ground Deformation and Source Geometry of the 30 October 2016 Mw6.5 Norcia Earthquake (Central Italy) Investigated Through Seismological Data, DInSAR Measurements, and Numerical Modelling. Remote Sens. 2018, 10, 1901. [Google Scholar] [CrossRef]
  12. Bello, S.; Scott, C.P.; Ferrarini, F.; Brozzetti, F.; Scott, T.; Cirillo, D.; de Nardis, R.; Arrowsmith, J.R.; Lavecchia, G. High-resolution surface faulting from the 1983 Idaho Lost River Fault Mw6.9 earthquake and previous events. Sci. Data 2021, 8, 68. [Google Scholar] [CrossRef] [PubMed]
  13. Goldberg, D.E.; Taymaz, T.; Reitman, N.G.; Hatem, A.E.; Yolsal-Çevikbilen, S.; Barnhart, W.D.; Irmak, T.S.; Wald, D.J.; Öcalan, T.; Yeck, W.L.; et al. Rapid Characterization of the February 2023 Kahramanmaraş, Türkiye, Earthquake Sequence. Seism. Rec. 2023, 3, 156–167. [Google Scholar] [CrossRef]
  14. Meletti, C.; Marzocchi, W.; D’Amico, V.; Lanzano, G.; Luzi, L.; Martinelli, F.; Pace, B.; Rovida, A.; Taroni, M.; Visini, F.; et al. The new Italian seismic hazard model (MPS19). Ann. Geophys. 2021, 64, SE112. [Google Scholar] [CrossRef]
  15. ISIDe-Working-Group. Italian Seismological Instrumental and Parametric Database (ISIDe) (Version 1); Istituto Nazionale di Geofisica e Vulcanologia (INGV): Rome, Italy, 2007. [Google Scholar] [CrossRef]
  16. Chiaraluce, L.; Valoroso, L.; Piccinini, D.; Di Stefano, R.; De Gori, P. The anatomy of the 2009 L’Aquila normal fault system (central Italy) imaged by high resolution foreshock and aftershock locations. J. Geophys. Res. 2011, 116, B12311. [Google Scholar] [CrossRef]
  17. Chiaraluce, L.; Di Stefano, R.; Tinti, E.; Scognamiglio, L.; Michele, M.; Casarotti, E.; Cattaneo, M.; De Gori, P.; Chiarabba, C.; Monachesi, G.; et al. The 2016 Central Italy Seismic Sequence: A First Look at the Mainshocks, Aftershocks, and Source Models. Seismol. Res. Lett. 2017, 88, 757–771. [Google Scholar] [CrossRef]
  18. DISS-Working-Group. Database of Individual Seismogenic Sources (DISS), Version 3.3.0: A Compilation of Potential Sources for Earthquakes Larger Than M 5.5 in Italy and Surrounding Areas; Istituto Nazionale di Geofisica e Vulcanologia (INGV): Rome, Italy, 2021. [Google Scholar] [CrossRef]
  19. Ferrarini, F.; Toké, N.A.; Carafa, M.M.C.; Arrowsmith, J.R. Editorial: Unveiling Active Faults: Multiscale Perspectives and Alternative Approaches Addressing the Seismic Hazard Challenge. Front. Earth Sci 2021, 9, 738164. [Google Scholar] [CrossRef]
  20. Kastelic, V.; Burrato, P.; Carafa, M.M.C.; Basili, R. Repeated surveys reveal nontectonic exposure of supposedly active normal faults in the central Apennines, Italy. J. Geophys. Res.-Earth 2017, 122, 114–129. [Google Scholar] [CrossRef]
  21. Lavecchia, G.; de Nardis, R.; Ferrarini, F.; Cirillo, D.; Bello, S.; Brozzetti, F. Regional seismotectonic zonation of hydrocarbon fields in active thrust belts: A case study from Italy. In Building Knowledge for Geohazard Assessment and Management in the Caucasus and other Orogenic Regions; Bonali, F.L., Mariotto, F.P., Tsereteli, N., Eds.; Springer: Dordrecht, The Netherlands, 2021; pp. 89–128. [Google Scholar] [CrossRef]
  22. Carafa, M.M.C.; Galvani, A.; Di Naccio, D.; Kastelic, V.; Di Lorenzo, C.; Miccolis, S.; Sepe, V.; Pietrantonio, G.; Gizzi, C.; Massucci, A.; et al. Partitioning the Ongoing Extension of the Central Apennines (Italy): Fault Slip Rates and Bulk Deformation Rates From Geodetic and Stress Data. J. Geophys. Res. Solid Earth 2020, 125, e2019JB018956. [Google Scholar] [CrossRef]
  23. Ferrarini, F.; de Nardis, R.; Brozzetti, F.; Cirillo, D.; Arrowsmith, J.R.; Lavecchia, G. Multiple Lines of Evidence for a Potentially Seismogenic Fault Along the Central-Apennine (Italy) Active Extensional Belt—An Unexpected Outcome of the MW6.5 Norcia 2016 Earthquake. Front. Earth Sci. 2021, 9, 642243. [Google Scholar] [CrossRef]
  24. Pandolfi, C.; Taroni, M.; de Nardis, R.; Lavecchia, G.; Akinci, A. Advanced 3D seismic hazard analysis for active compression in the Adriatic Thrust Zone, Italy. Bull. Earthq. Eng. 2024, 22, 4221–4244. [Google Scholar] [CrossRef]
  25. Tibaldi, A.; de Nardis, R.; Torrese, P.; Bressan, S.; Pedicini, M.; Talone, D.; Bonali, F.L.; Corti, N.; Russo, E.; Lavecchia, G. A multi-scale approach to the recent activity of the Stradella thrust in the seismotectonic context of the Emilia Arc (northwestern Italy). Tectonophysics 2023, 857, 229853. [Google Scholar] [CrossRef]
  26. Lavecchia, G.; De Nardis, R.; Costa, G.; Tiberi, L.; Ferrarini, F.; Cirillo, D.; Brozzetti, F.; Suhadolc, P. Was the Mirandola thrust really involved in the Emilia 2012 seismic sequence (northern Italy)? Implications on the likelihood of triggered seismicity effects. Boll. Geofis. Teor. Appl. 2015, 56, 461–488. [Google Scholar] [CrossRef]
  27. Rovida, A.; Locati, M.; Camassi, R.; Lolli, B.; Gasperini, P.; Antonucci, A. Catalogo Parametrico dei Terremoti Italiani (CPTI15), Versione 4.0; Istituto Nazionale di Geofisica e Vulcanologia (INGV): Rome, Italy, 2022. [Google Scholar] [CrossRef]
  28. D’Agostino, N. Complete seismic release of tectonic strain and earthquake recurrence in the Apennines (Italy). Geophys. Res. Lett. 2014, 41, 1155–1162. [Google Scholar] [CrossRef]
  29. Carafa, M.M.C.; Bird, P. Improving deformation models by discounting transient signals in geodetic data: 2. Geodetic data, stress directions, and long-term strain rates in Italy. J. Geophys. Res.-Solid Earth 2016, 121, 5557–5575. [Google Scholar] [CrossRef]
  30. Serpelloni, E.; Cavaliere, A.; Martelli, L.; Pintori, F.; Anderlini, L.; Borghi, A.; Randazzo, D.; Bruni, S.; Devoti, R.; Perfetti, P.; et al. Surface Velocities and Strain-Rates in the Euro-Mediterranean Region From Massive GPS Data Processing. Front. Earth Sci. 2022, 10, 907897. [Google Scholar] [CrossRef]
  31. Discenza, M.E.; Esposito, C.; Di Luzio, E.; Delchiaro, M.; Di Martire, D.; Minnillo, M.; Rouhi, J.; Martino, S.; Della Seta, M.; Troiani, F.; et al. Deep-Seated Gravitational Slope Deformations in Molise region (Italy): Novel inventory and main geomorphological features. J. Maps 2023, 19, 2163198. [Google Scholar] [CrossRef]
  32. Faure Walker, J.P.; Roberts, G.P.; Sammonds, P.R.; Cowie, P. Comparison of earthquake strains over 102 and 104 year timescales: Insights into variability in the seismic cycle in the central Apennines, Italy. J. Geophys. Res. Solid Earth 2010, 115, B10418. [Google Scholar] [CrossRef]
  33. Faure Walker, J.; Boncio, P.; Pace, B.; Roberts, G.; Benedetti, L.; Scotti, O.; Visini, F.; Peruzza, L. Fault2SHA Central Apennines database and structuring active fault data for seismic hazard assessment. Sci. Data 2021, 8, 87. [Google Scholar] [CrossRef]
  34. Scheingross, J.S.; Minchew, B.M.; Mackey, B.H.; Simons, M.; Lamb, M.P.; Hensley, S. Fault-zone controls on the spatial distribution of slow-moving landslides. Geol. Soc. Am. Bull. 2013, 125, 473–489. [Google Scholar] [CrossRef]
  35. Bucci, F.; Santangelo, M.; Cardinali, M.; Fiorucci, F.; Guzzetti, F. Landslide distribution and size in response to Quaternary fault activity: The Peloritani Range, NE Sicily, Italy. Earth Surf. Process. Landf. 2016, 41, 711–720. [Google Scholar] [CrossRef]
  36. Galadini, F. Quaternary tectonics and large-scale gravitational deformations with evidence of rock-slide displacements in the Central Apennines (central Italy). Geomorphology 2006, 82, 201–228. [Google Scholar] [CrossRef]
  37. Improta, L.; Ferranti, L.; De Martini, P.M.; Piscitelli, S.; Bruno, P.P.; Burrato, P.; Civico, R.; Giocoli, A.; Iorio, M.; D’Addezio, G.; et al. Detecting young, slow-slipping active faults by geologic and multidisciplinary high-resolution geophysical investigations: A case study from the Apennine seismic belt, Italy. J. Geophys. Res. 2010, 115, B11307. [Google Scholar] [CrossRef]
  38. Discenza, M.E.; Esposito, C.; Martino, S.; Petitta, M.; Prestininzi, A.; Scarascia Mugnozza, G. The gravitational slope deformation of Mt. Rocchetta ridge (central Apennines, Italy): Geological-evolutionary model and numerical analysis. Bull. Eng. Geol. Environ. 2011, 70, 559–575. [Google Scholar] [CrossRef]
  39. Bianchi Fasani, G.; Di Luzio, E.; Esposito, C.; Evans, S.G.; Scarascia Mugnozza, G. Quaternary, catastrophic rock avalanches in the Central Apennines (Italy): Relationships with inherited tectonic features, gravity-driven deformations and the geodynamic frame. Geomorphology 2014, 211, 22–42. [Google Scholar] [CrossRef]
  40. Gori, S.; Falcucci, E.; Dramis, F.; Galadini, F.; Galli, P.; Giaccio, B.; Messina, P.; Pizzi, A.; Sposato, A.; Cosentino, D. Deep-seated gravitational slope deformation, large-scale rock failure, and active normal faulting along Mt. Morrone (Sulmona basin, Central Italy): Geomorphological and paleoseismological analyses. Geomorphology 2014, 208, 88–101. [Google Scholar] [CrossRef]
  41. Conforti, M.; Ietto, F. Influence of Tectonics and Morphometric Features on the Landslide Distribution: A Case Study from the Mesima Basin (Calabria, South Italy). J. Earth Sci. 2020, 31, 393–409. [Google Scholar] [CrossRef]
  42. Silverman, B.W. (Ed.) Density Estimation for Statistics and Data Analysis; Chapman & Hall: London, UK, 1986. [Google Scholar]
  43. Lavecchia, G.; Castaldo, R.; Nardis, R.; De Novellis, V.; Ferrarini, F.; Pepe, S.; Brozzetti, F.; Solaro, G.; Cirillo, D.; Bonano, M.; et al. Ground deformation and source geometry of the 24 August 2016 Amatrice earthquake (Central Italy) investigated through analytical and numerical modeling of DInSAR measurements and structural-geological data. Geophys. Res. Lett. 2016, 43, 12389–12398. [Google Scholar] [CrossRef]
  44. Taghipour, K.; Khatib, M.M.; Heyhat, M.; Shabanian, E.; Vaezihir, A. Evidence for distributed active strike-slip faulting in NW Iran: The Maragheh and Salmas fault zones. Tectonophysics 2018, 742–743, 15–33. [Google Scholar] [CrossRef]
  45. Bucci, F.; Santangelo, M.; Fiorucci, F.; Ardizzone, F.; Giordan, D.; Cignetti, M.; Notti, D.; Allasia, P.; Godone, D.; Lagomarsino, D.; et al. Geomorphologic landslide inventory by air photo interpretation of the High Agri Valley (Southern Italy). J. Maps 2021, 17, 376–388. [Google Scholar] [CrossRef]
  46. Ferrarini, F.; Arrowsmith, J.R.; Brozzetti, F.; de Nardis, R.; Cirillo, D.; Whipple, K.X.; Lavecchia, G.; Cheng, F. Late Quaternary Tectonics along the Peri-Adriatic Sector of the Apenninic Chain (Central-Southern Italy): Inspecting Active Shortening through Topographic Relief and Fluvial Network Analyses. Lithosphere 2021, 2021, 7866617. [Google Scholar] [CrossRef]
  47. Stahl, T.A.; Niemi, N.A.; Delano, J.E.; Wolfe, F.D.; Bunds, M.P.; Howell, A. Diffuse Tectonic Deformation in the Drum Mountains Fault Zone, Utah, USA: Testing the Utility of Legacy Aerial Photograph-Derived Topography. Front. Earth Sci. 2021, 8, 600729. [Google Scholar] [CrossRef]
  48. Ardizzone, F.; Bucci, F.; Cardinali, M.; Fiorucci, F.; Pisano, L.; Santangelo, M.; Zumpano, V. Geomorphological landslide inventory map of the Daunia Apennines, southernItaly. Earth Syst. Sci. Data 2023, 15, 753–767. [Google Scholar] [CrossRef]
  49. Henriquet, M.; Peyret, M.; Dominguez, S.; Barreca, G.; Monaco, C.; Mazzotti, S. Present-Day Surface Deformation of Sicily Derived From Sentinel-1 InSAR Time-Series. J. Geophys. Res. Solid Earth 2022, 127, e2021JB023071. [Google Scholar] [CrossRef]
  50. Areggi, G.; Pezzo, G.; Boncori, J.P.M.; Anderlini, L.; Rossi, G.; Serpelloni, E.; Zuliani, D.; Bonini, L. Present-Day Surface Deformation in North-East Italy Using InSAR and GNSS Data. Remote Sens. 2023, 15, 1704. [Google Scholar] [CrossRef]
  51. Boccaletti, M.; Ciaranfi, N.; Cosentino, D.; Deiana, G.; Gelati, R.; Lentini, F.; Massari, F.; Moratti, G.; Pescatore, T.; Lucchi, F.R.; et al. Palinspastic Restoration and Paleogeographic Reconstruction of the Peri-Tyrrhenian Area during the Neogene. Palaeogeogr. Palaeoclimatol. Palaeoecol. 1990, 77, 41-IN13. [Google Scholar] [CrossRef]
  52. Patacca, E.; Scandone, P. Geology of the Southern Apennines. Boll. Soc. Geol. Ital. Vol. Spec. 2007, 7, 75–119. [Google Scholar]
  53. Cosentino, D.; Cipollari, P.; Marsili, P.; Scrocca, D. Geology of the central Apennines: A regional review. J. Virtual Explor. 2010, 36, 1–37. [Google Scholar] [CrossRef]
  54. Patacca, E.; Scandone, P.; Di Luzio, E.; Cavinato, G.P.; Parotto, M. Structural architecture of the central Apennines: Interpretation of the CROP 11 seismic profile from the Adriatic coast to the orographic divide. Tectonics 2008, 27, TC3006. [Google Scholar] [CrossRef]
  55. Vezzani, L.; Ghisetti, F. Carta Geologica dell’Abruzzo, 1: 100000; SELCA: Firenze, Italy, 1998. [Google Scholar]
  56. Festa, A.; Ghisetti, F.; Vezzani, L. Carta Geologica del Molise (Scala 1:100.000); SELCA: Firenze, Italy, 2004. [Google Scholar]
  57. Malinverno, A.; Ryan, W.B.F. Extension in the Tyrrhenian Sea and shortening in the Apennines as result of arc migration driven by sinking of the lithosphere. Tectonics 1986, 5, 227–245. [Google Scholar] [CrossRef]
  58. Lavecchia, G. The Tyrrhenian-Apennines system; structural setting and seismotectonogenesis. Tectonophysics 1988, 147, 263–296. [Google Scholar] [CrossRef]
  59. Carminati, E.; Wortel, M.J.R.; Spakman, W.; Sabadini, R. The role of slab detachment processes in the opening of the western–central Mediterranean basins: Some geological and geophysical evidence. Earth Planet. Sci. Lett. 1998, 160, 651–665. [Google Scholar] [CrossRef]
  60. Doglioni, C. A proposal of kinematic modelling for W-dipping subductions—Possible applications to the Tyrrhenian-Apennines system. Terra Nova 1991, 3, 423–434. [Google Scholar] [CrossRef]
  61. Finetti, I.R.; Boccaletti, M.; Bonini, M.; Del Ben, A.; Geletti, R.; Pipan, M.; Sani, F. Crustal section based on CROP seismic data across the North Tyrrhenian-Northern Apennines-Adriatic Sea. Tectonophysics 2001, 343, 135–163. [Google Scholar] [CrossRef]
  62. Lavecchia, G.; Brozzetti, F.; Barchi, M.; Menichetti, M.; Keller, J.V.A. Seismotectonic zoning in east-central Italy deduced from an analysis of the Neogene to present deformations and related stress fields. Geol. Soc. Am. Bull. 1994, 106, 1107–1120. [Google Scholar] [CrossRef]
  63. Cavinato, G.P.; Celles, P.G.D. Extensional basins in the tectonically bimodal central Apennines fold-thrust belt, Italy: Response to corner flow above a subducting slab in retrograde motion. Geology 1999, 27, 955. [Google Scholar] [CrossRef]
  64. Boncio, P.; Lavecchia, G. A structural model for active extension in Central Italy. J. Geodyn. 2000, 29, 233–244. [Google Scholar] [CrossRef]
  65. Cirillo, D.; Totaro, C.; Lavecchia, G.; Orecchio, B.; de Nardis, R.; Presti, D.; Ferrarini, F.; Bello, S.; Brozzetti, F. Structural complexities and tectonic barriers controlling recent seismic activity in the Pollino area (Calabria–Lucania, southern Italy)—Constraints from stress inversion and 3D fault model building. Solid Earth 2022, 13, 205–228. [Google Scholar] [CrossRef]
  66. Ferrarini, F.; Lavecchia, G.; de Nardis, R.; Brozzetti, F. Fault Geometry and Active Stress from Earthquakes and Field Geology Data Analysis: The Colfiorito 1997 and L’Aquila 2009 Cases (Central Italy). Pure Appl. Geophys. 2015, 172, 1079–1103. [Google Scholar] [CrossRef]
  67. Miccadei, E. Geologia del’area Alto Sagittario-Alto Sangro (Abruzzo, Appennino centrale). Geol. Romana 1993, 29, 463–481. [Google Scholar]
  68. Pace, B.; Di Matteo, P.; Boncio, P.; Lavecchia, G. Considerazioni sull’evoluzione geologica della Marsica Sud-Orientale (Abruzzo, Appennino Centrale) sulla base di un’analisi integrata di dati stratigrafici e strutturali. Boll. Soc. Geol. Ital. 2001, 120, 139–150. [Google Scholar]
  69. Galadini, F.; Galli, P. Active Tectonics in the Central Apennines (Italy)—Input Data for Seismic Hazard Assessment. Nat. Hazards 2000, 22, 225–270. [Google Scholar] [CrossRef]
  70. Boncio, P.; Lavecchia, G.; Pace, B. Defining a model of 3D seismogenic sources for Seismic Hazard Assessment applications: The case of central Apennines (Italy). J. Seismol. 2004, 8, 407–425. [Google Scholar] [CrossRef]
  71. Roberts, G.P.; Michetti, A.M. Spatial and temporal variations in growth rates along active normal fault systems: An example from The Lazio–Abruzzo Apennines, central Italy. J. Struct. Geol. 2004, 26, 339–376. [Google Scholar] [CrossRef]
  72. Lavecchia, G.; Boncio, P.; Brozzetti, F.; de Nardis, R.; di Naccio, D.; Ferrarini, F.; Pizzi, A.; Pomposo, G. The April 2009 L’aquila (Central Italy) Seismic Sequence (M 6.3): A Preliminary Seismotectonic Picture. In Recent Progress on Earthquake Geology; Guarnieri, P.P., Ed.; Nova Science Publisher, Inc.: Hauppauge, NY, USA, 2011; pp. 1–17. [Google Scholar]
  73. Carafa, M.M.C.; Barba, S. The stress field in Europe: Optimal orientations with confidence limits. Geophys. J. Int. 2013, 193, 531–548. [Google Scholar] [CrossRef]
  74. Mariucci, M.T.; Montone, P. Database of Italian present-day stress indicators, IPSI 1.4. Sci. Data 2020, 7, 298. [Google Scholar] [CrossRef]
  75. de Nardis, R.; Vuan, A.; Carbone, L.; Talone, D.; Romano, M.A.; Lavecchia, G. Interplay of tectonic and dynamic processes shaping multilayer extensional system in southern-central Apennines. Sci. Rep. 2024, 14, 18375. [Google Scholar] [CrossRef]
  76. Carafa, M.M.C.; Di Naccio, D.; Di Lorenzo, C.; Kastelic, V.; Bird, P. A Meta-Analysis of Fault Slip Rates Across the Central Apennines. J. Geophys. Res. Solid Earth 2022, 127, e2021JB023252. [Google Scholar] [CrossRef]
  77. Puliti, I.; Benedetti, L.; Pizzi, A.; Fleury, J.; Francescone, M.; Guillou, V.; Team, A. Evidence for a Constant Slip Rate Over the Last ∼40 ka Along the Mt. Morrone Fault System in Central Apennines. Tectonics 2024, 43, e2023TC007871. [Google Scholar] [CrossRef]
  78. Gori, S.; Giaccio, B.; Galadini, F.; Falcucci, E.; Messina, P.; Sposato, A.; Dramis, F. Active normal faulting along the Mt. Morrone south-western slopes (central Apennines, Italy). Int. J. Earth Sci. 2011, 100, 157–171. [Google Scholar] [CrossRef]
  79. Galli, P.; Giaccio, B.; Peronace, E.; Messina, P. Holocene Paleoearthquakes and Early–Late Pleistocene Slip Rate on the Sulmona Fault (Central Apeninnes, Italy). Bull. Seismol. Soc. Am. 2015, 105, 1–13. [Google Scholar] [CrossRef]
  80. Pizzi, A.; Falcucci, E.; Gori, S.; Galadini, F.; Messina, P.; Di Vicenzo, M.; Esestime, P.; Giaccio, B.; Pomposo, G.; Sposato, A. Active faulting in the Maiella Massif (central Apennines, Italy). GeoActa Spec. Publ. 2010, 3, 57–73. [Google Scholar]
  81. Coltorti, M.; Dramis, F. The significance of stratified slope-waste deposits in the Quaternary of Umbra-Marche Apennines, Central Italy. Z. Geùomorph. N.F. 1988, 71, 59–70. Available online: https://www.researchgate.net/profile/Mauro-Coltorti/publication/291961966_The_significance_of_stratified_slope-waste_deposits_in_the_Quaternary_of_Umbria-Marche_Apennines_central_Italy/links/59907485458515b87b4ac063/The-significance-of-stratified-slope-waste-deposits-in-the-Quaternary-of-Umbria-Marche-Apennines-central-Italy.pdf (accessed on 13 July 2025).
  82. Giraudi, C. Datazione con metodi geologici delle scarpate di faglia post-glaciali di Ovindoli, Piano di Pezza (Abruzzo, Italia centrale); implicazioni. In Morfogenesi e Stratigrafia dell’Olocene: Convegno; Societa Geologica Italiana: Rome, Italy, 1989; Volume 42, pp. 29–39. [Google Scholar]
  83. Frezzotti, M.; Giraudi, C. Evoluzione geologica tardo-pleistocenica el olocenica del Piano di Aremogna (Roccaraso-Abruzzo): Implicazioni climatiche e tettoniche. In Morfogenesi e Stratigrafia dell’Olocene: Convegno; Societa Geologica Italiana: Rome, Italy, 1989; Volume 42, pp. 5–19. [Google Scholar]
  84. Calderoni, G.; Lorenzoni, P.; Ortolani, F.; Pagliuca, S.; Serva, L. Paleoseismological evidence at Rivisondoli, Central Apennines, Italy. Rend. Soc. Geol. It. 1990, 13, 27–32. [Google Scholar]
  85. D’addezio, G.; Masana, E.; Pantosti, D. The holocene paleoseismicity of the Aremogna-Cinque Miglia Fault (Central Italy). J. Seismol. 2001, 5, 181–205. [Google Scholar] [CrossRef]
  86. Di Domenica, A.; Pizzi, A. Defining a mid-Holocene earthquake through speleoseismological and independent data: Implications for the outer Central Apennines (Italy) seismotectonic framework. Solid Earth 2017, 8, 161–176. [Google Scholar] [CrossRef]
  87. Tesson, J.; Pace, B.; Benedetti, L.; Visini, F.; Delli Rocioli, M.; Arnold, M.; Aumaître, G.; Bourlès, D.L.; Keddadouche, K. Seismic slip history of the Pizzalto fault (central Apennines, Italy) using in situ-produced36Cl cosmic ray exposure dating and rare earth element concentrations. J. Geophys. Res. Solid Earth 2016, 121, 1983–2003. [Google Scholar] [CrossRef]
  88. Faure Walker, J.P.; Visini, F.; Roberts, G.; Galasso, C.; McCaffrey, K.; Mildon, Z. Variable Fault Geometry Suggests Detailed Fault-Slip-Rate Profiles and Geometries Are Needed for Fault-Based Probabilistic Seismic Hazard Assessment (PSHA). Bull. Seismol. Soc. Am. 2019, 109, 110–123. [Google Scholar] [CrossRef]
  89. Della Seta, M.; Esposito, C.; Marmoni, G.M.; Martino, S.; Mugnozza, G.S.; Troiani, F. Morpho-structural evolution of the valley-slope systems and related implications on slope-scale gravitational processes: New results from the Mt. Genzana case history (Central Apennines, Italy). Geomorphology 2017, 289, 60–77. [Google Scholar] [CrossRef]
  90. Lavecchia, G.; Bello, S.; Andrenacci, C.; Cirillo, D.; Ferrarini, F.; Vicentini, N.; de Nardis, R.; Roberts, G.; Brozzetti, F. QUaternary fault strain INdicators database—QUIN 1.0—first release from the Apennines of central Italy. Sci. Data 2022, 9, 204. [Google Scholar] [CrossRef]
  91. Galadini, F.; Messina, P. Characterization of the recent tectonics of the upper Sangro River valley (Abruzzi Apennine, central Italy). Ann. Geofis. 1993, 36, 277–285. [Google Scholar]
  92. Galadini, F.; Giraudi, C.; Messina, P. Nuovi dati sulla tettonica tardo pleistocenica dell’alta valle del Sangro (Appennino Centrale): Implicazioni sismotettoniche. Ital. J. Quat. Sci. 1998, 11, 347–356. [Google Scholar]
  93. Galadini, F.; Galli, P. The Holocene paleoearthquakes on the 1915 Avezzano earthquake faults (central Italy): Implications for active tectonics in the central Apennines. Tectonophysics 1999, 308, 143–170. [Google Scholar] [CrossRef]
  94. Barchi, M.; Galadini, F.; Lavecchia, G.; Messina, P.; Michetti, A.M.; Peruzza, L.; Pizzi, A.; Tondi, E.; Vittori, E. Sintesi delle Conoscenze Sulle Faglie Attive in Italia Centrale: Parametrizzazione ai Fini della Caratterizzazione della Pericolosità Sismica; GNDT-Monografie; CNR-Gruppo Nazionale per la Difesa dai Terremoti: Roma, Italy, 2000; p. 62. [Google Scholar]
  95. Ferrarini, F.; Boncio, P.; de Nardis, R.; Pappone, G.; Cesarano, M.; Aucelli, P.P.C.; Lavecchia, G. Segmentation pattern and structural complexities in seismogenic extensional settings: The North Matese Fault System (Central Italy). J. Struct. Geol. 2017, 95, 93–112. [Google Scholar] [CrossRef]
  96. Galli, P.; Giaccio, B.; Messina, P.; Peronace, E.; Amato, V.; Naso, G.; Nomade, S.; Pereira, A.; Piscitelli, S.; Bellanova, J.; et al. Middle to Late Pleistocene activity of the northern Matese fault system (southern Apennines, Italy). Tectonophysics 2017, 699, 61–81. [Google Scholar] [CrossRef]
  97. Amato, V.; Aucelli, P.P.C.; Cesarano, M.; Rosskopf, C.M.; Cifelli, F.; Mattei, M. A 900 m-deep borehole from Boiano intermontane basin (southern Apennines, Italy): Age constraints and palaeoenvironmental features of the Quaternary infilling. Geol. J. 2021, 56, 2148–2166. [Google Scholar] [CrossRef]
  98. Ceccaroni, E.; Ameri, G.; Gómez Capera, A.A.; Galadini, F. The 2nd century AD earthquake in central Italy: Archaeoseismological data and seismotectonic implications. Nat. Hazards 2009, 50, 335–359. [Google Scholar] [CrossRef]
  99. Volatili, T.; Gironelli, V.; Luzi, L.; Galli, P.; Carafa, M.M.C.; Tondi, E. Elusive seismogenic sources of historical earthquakes: Insights from the Mw6.8, 1706 Maiella earthquake (central Italy). Bull. Earthq. Eng. 2025, 23, 1279–1296. [Google Scholar] [CrossRef]
  100. Lavecchia, G.; Boncio, P.; Creati, N. A lithospheric-scale seismogenic thrust in central Italy. J. Geodyn. 2003, 36, 79–94. [Google Scholar] [CrossRef]
  101. de Nardis, R.; Pandolfi, C.; Cattaneo, M.; Monachesi, G.; Cirillo, D.; Ferrarini, F.; Bello, S.; Brozzetti, F.; Lavecchia, G. Lithospheric double shear zone unveiled by microseismicity in a region of slow deformation. Sci. Rep. 2022, 12, 21066. [Google Scholar] [CrossRef]
  102. Bucci, F.; Santangelo, M.; Fongo, L.; Alvioli, M.; Cardinali, M.; Melelli, L.; Marchesini, I. A new digital Lithological Map of Italy at 1:100.000 scale for geomechanical modelling. Earth Sci. Data 2022, 14, 4129–4151. [Google Scholar] [CrossRef]
  103. Boncio, P.; Tinari, D.P.; Lavecchia, G.; Visini, F.; Milana, G. The instrumental seismicity of the Abruzzo Region in Central Italy (1981–2003): Seismotectonic Implications. Boll. Soc. Geol. Ital. 2009, 128, 367–380. [Google Scholar]
  104. Pondrelli, S.; Salimbeni, S. Italian CMT Dataset; Istituto Nazionale di Geofisica e Vulcanologia (INGV): Rome, Italy, 2006. [Google Scholar] [CrossRef]
  105. Galli, P.; Galderisi, A.; Messina, P.; Peronace, E. The Gran Sasso fault system: Paleoseismological constraints on the catastrophic 1349 earthquake in Central Italy. Tectonophysics 2022, 822, 229156. [Google Scholar] [CrossRef]
  106. Porfido, S.; Esposito, E.; Vittori, E.; Tranfaglia, G.; Michetti, A.M.; Blumetti, M.; Ferreli, L.; Guerrieri, L.; Serva, L. Areal distribution of ground effects induced by strong earthquakes in the southern Apennines (Italy). Surv. Geophys. 2002, 23, 529–562. [Google Scholar] [CrossRef]
  107. Cucci, L. Insights into the geometry and faulting style of the causative faults of the M6.7 1805 and M6.7 1930 earthquakes in the Southern Apennines (Italy) from coseismic hydrological changes. Tectonophysics 2019, 751, 192–211. [Google Scholar] [CrossRef]
  108. Romano, M.A.; de Nardis, R.; Garbin, M.; Peruzza, L.; Priolo, E.; Lavecchia, G.; Romanelli, M. Temporary seismic monitoring of the Sulmona area (Abruzzo, Italy): A quality study of microearthquake locations. Nat. Hazards Earth Syst. Sci. 2013, 13, 2727–2744. [Google Scholar] [CrossRef]
  109. Di Giulio, G.; de Nardis, R.; Boncio, P.; Milana, G.; Rosatelli, G.; Stoppa, F.; Lavecchia, G. Seismic response of a deep continental basin including velocity inversion: The Sulmona intramontane basin (Central Apennines, Italy). Geophys. J. Int. 2016, 204, 418–439. [Google Scholar] [CrossRef]
  110. Talone, D.; De Siena, L.; Lavecchia, G.; de Nardis, R. The Attenuation and Scattering Signature of Fluid Reservoirs and Tectonic Interactions in the Central-Southern Apennines (Italy). Geophys. Res. Lett. 2023, 50, e2023GL106074. [Google Scholar] [CrossRef]
  111. Pace, B.; Boncio, P.; Lavecchia, G. The 1984 Abruzzo earthquake (Italy): An example of seismogenic process controlled by interaction between differently oriented synkinematic faults. Tectonophysics 2002, 350, 237–254. [Google Scholar] [CrossRef]
  112. Scognamiglio, L.; Tinti, E.; Quintiliani, M. Time Domain Moment Tensor [Data Set]; Istituto Nazionale di Geofisica e Vulcanologia (INGV): Rome, Italy, 2006. [Google Scholar] [CrossRef]
  113. England, P.; Molnar, P. Surface uplift, uplift of rocks, and exhumation of rocks. Geology 1990, 18, 1173. [Google Scholar] [CrossRef]
  114. Burbank, D.W. Causes of recent Himalayan uplift deduced from deposited patterns in the Ganges basin. Nature 1992, 357, 680–683. [Google Scholar] [CrossRef]
  115. Montgomery, D.R. Valley incision and the uplift of mountain peaks. J. Geophys. Res. 1994, 99, 13913–13921. [Google Scholar] [CrossRef]
  116. Azañón, J.M.; Galve, J.P.; Pérez-Peña, J.V.; Giaconia, F.; Carvajal, R.; Booth-Rea, G.; Jabaloy, A.; Vázquez, M.; Azor, A.; Roldán, F.J. Relief and drainage evolution during the exhumation of the Sierra Nevada (SE Spain): Is denudation keeping pace with uplift? Tectonophysics 2015, 663, 19–32. [Google Scholar] [CrossRef]
  117. Liu-Zeng, J.; Tapponnier, P.; Gaudemer, Y.; Ding, L. Quantifying landscape differences across the Tibetan plateau: Implications for topographic relief evolution. J. Geophys. Res.-Earth 2008, 113, F04018. [Google Scholar] [CrossRef]
  118. DiBiase, R.A.; Whipple, K.X.; Heimsath, A.M.; Ouimet, W.B. Landscape form and millennial erosion rates in the San Gabriel Mountains, CA. Earth Planet. Sci. Lett. 2010, 289, 134–144. [Google Scholar] [CrossRef]
  119. Weissel, J.K.; Pratson, L.F.; Malinverno, A. The Length-Scaling Properties of Topography. J. Geophys. Res.-Solid Earth 1994, 99, 13997–14012. [Google Scholar] [CrossRef]
  120. Molin, P.; Pazzaglia, F.J.; Dramis, F. Geomorphic expression of active tectonics in a rapidly-deforming forearc, sila massif, calabria, southern Italy. Am. J. Sci. 2004, 304, 559–589. [Google Scholar] [CrossRef]
  121. Scotti, V.N.; Molin, P.; Faccenna, C.; Soligo, M.; Casas-Sainz, A. The influence of surface and tectonic processes on landscape evolution of the Iberian Chain (Spain): Quantitative geomorphological analysis and geochronology. Geomorphology 2014, 206, 37–57. [Google Scholar] [CrossRef]
  122. Hack, J.T. Interpretation of erosional topography in humid temperate regions. Am. J. Sci. 1960, 258, 80–97. [Google Scholar]
  123. Burbank, D.W. Geomorphology—Characteristic Size of Relief. Nature 1992, 359, 483–484. [Google Scholar] [CrossRef]
  124. Tarquini, S.; Isola, I.; Favalli, M.; Battistini, A.; Dotta, G. TINITALY, a Digital Elevation Model of Italy with a 10 Meters Cell Size (Version 1.1); Istituto Nazionale di Geofisica e Vulcanologia (INGV): Rome, Italy, 2023. [Google Scholar] [CrossRef]
  125. Telbisz, T.; Kovacs, G.; Szekely, B.; Szabo, J. Topographic swath profile analysis: A generalization and sensitivity evaluation of a digital terrain analysis tool. Z. Geomorphol. 2013, 57, 485–513. [Google Scholar] [CrossRef]
  126. Rehak, K.; Strecker, M.R.; Echtler, H.P. Morphotectonic segmentation of an active forearc, 37°–41° S, Chile. Geomorphology 2008, 94, 98–116. [Google Scholar] [CrossRef]
  127. Di Naccio, D.; Boncio, P.; Brozzetti, F.; Pazzaglia, F.J.; Lavecchia, G. Morphotectonic analysis of the Lunigiana and Garfagnana grabens (northern Apennines, Italy): Implications for active normal faulting. Geomorphology 2013, 201, 293–311. [Google Scholar] [CrossRef]
  128. Miccadei, E.; Piacentini, T.; Buccolini, M. Long-term geomorphological evolution in the Abruzzo area, Central Italy: Twenty years of research. Geol. Carpathica 2017, 68, 19–28. [Google Scholar] [CrossRef]
  129. Pérez-Peña, J.V.; Al-Awabdeh, M.; Azañón, J.M.; Galve, J.P.; Booth-Rea, G.; Notti, D. SwathProfiler and NProfiler: Two new ArcGIS Add-ins for the automatic extraction of swath and normalized river profiles. Comput. Geosci. 2017, 104, 135–150. [Google Scholar] [CrossRef]
  130. Moore, I.D.; Grayson, R.B.; Ladson, A.R. Digital Terrain Modeling—A Review of Hydrological, Geomorphological, and Biological Applications. Hydrol Process 1991, 5, 3–30. [Google Scholar] [CrossRef]
  131. Dietrich, W.E.; Bellugi, D.G.; Sklar, L.S.; Stock, J.D. Geomorphic Transport Laws for Predicting Landscape Form and Dynamics. In Prediction in Geomorphology: Geophysical Monograph Series; AGU Publications: Washington, DC, USA, 2003; Volume 135. [Google Scholar] [CrossRef]
  132. Hilley, G.E.; Chamberlain, C.P.; Moon, S.; Porder, S.; Willett, S.D. Competition between erosion and reaction kinetics in controlling silicate-weathering rates. Earth Planet. Sci. Lett. 2010, 293, 191–199. [Google Scholar] [CrossRef]
  133. Zevenbergen, L.W.; Thorne, C.R. Quantitative-Analysis of Land Surface-Topography. Earth Surf. Process. Landf. 1987, 12, 47–56. [Google Scholar] [CrossRef]
  134. Pizzi, A.; Pugliese, G. InSAR-DEM analyses integrated with geologic field methods for the study of long-term seismogenic fault behavior: Applications in the axial zone of the central Apennines (Italy). J. Seismol. 2004, 8, 313–329. [Google Scholar] [CrossRef]
  135. DeLong, S.B.; Hilley, G.E.; Rymer, M.J.; Prentice, C. Fault zone structure from topography: Signatures of en echelon fault slip at Mustang Ridge on the San Andreas Fault, Monterey County, California. Tectonics 2010, 29, Tc5003. [Google Scholar] [CrossRef]
  136. Bürgmann, R.; Rosen, P.A.; Fielding, E.J. Synthetic aperture radar interferometry to measure Earth’s surface topography and its deformation. Annu. Rev. Earth Planet. Sci. 2000, 28, 169–209. [Google Scholar] [CrossRef]
  137. Rosen, P.A.; Hensley, S.; Joughin, I.R.; Li, F.K.; Madsen, S.N.; Rodriguez, E.; Goldstein, R.M. Synthetic aperture radar interferometry. Proc. IEEE 2000, 88, 333–382. [Google Scholar] [CrossRef]
  138. Simons, M.; Rosen, P. Interferometric Synthetic Aperture Radar Geodesy; Schubert, G., Ed.; Elsevier: Amsterdam, The Netherlands, 2015; Volume 3, ISBN 978-0-444-51928-3. [Google Scholar]
  139. Kusk, A.; Merryman Boncori, J.P.; Dall, J. An automated System for Ice Velocity Measurement from SAR. In Proceedings of the 2th European Conference on Synthetic Aperture Radar, Aachen, Germany, 4–7 June 2018; pp. 1–4. [Google Scholar]
  140. Tamás, T. Large-scale relief of the Slovak Karst and Aggtelek Karst (Gömör–Torna/Gemer–Turňa Karst)—A DEM-based study. Hung. Geogr. Bull. 2011, 60, 379–396. [Google Scholar]
  141. Di Bucci, D.; Scrocca, D. Assetto tettonico dell’Alto Molise (Appennino Centrale): Considerazioni stratigrafiche e strutturali sull’unita di Montenero Val Cocchiara. Boll. Soc. Geol. Ital. 1997, 116, 221–236. [Google Scholar]
  142. Savage, W.Z.; Varnes, D.J. Mechanics of gravitational spreading of steep-sided ridges (“Sackung”). Bull. Int. Assoc. Eng. Geol. 1987, 35, 31–36. [Google Scholar] [CrossRef]
  143. Agliardi, F.; Crosta, G.B.; Zanchi, A.; Ravazzi, C. Onset and timing of deep-seated gravitational slope deformations in the eastern Alps, Italy. Geomorphology 2009, 103, 113–129. [Google Scholar] [CrossRef]
  144. Miccadei, E.; Parotto, M. Assetto geologico delle dorsali Rotella-Pizzalto-Porrara (Appennino abruzzese orientale). Geol. Romana 1999, 34, 87–113. [Google Scholar]
  145. Messina, P.; Moro, M.; Speranza, F. Primi risultati di stratigrafia magnetica su alcune formazioni continentali dell’alta valle dell’Aterno (Italia centrale). Il Quat. 2001, 14, 167–172. [Google Scholar]
  146. Bosi, C.; Galadini, F.; Giaccio, B.; Messina, P.; Sposato, A. Plio-Quaternary continental deposits in the Latium-Abruzzi Apennines: The correlation of geological events across different intermontane basins. Alp. Mediterr. Quat. 2003, 16, 55–76. [Google Scholar]
  147. Carafa, M.M.; Bird, P.; Verdecchia, A.; Taroni, M.; Doglioni, C. Empirical evidence for multi-decadal transients affecting geodetic velocity fields and derived seismicity forecasts in Italy. Sci. Rep. 2024, 14, 19941. [Google Scholar]
  148. Bigi, G.; Coli, M.; Cosentino, D.; Parotto, M.; Praturlon, A.; Sartori, R.; Scandone, P.; Turco, E. Structural Model of Italy scale 1:500,000, sheet 4. In C.N.R., Progetto Finalizzato Geodinamica; SELCA: Firenze, Italy, 1992. [Google Scholar]
  149. Ferrill, D.A.; Morris, A.P. Fault zone deformation controlled by carbonate mechanical stratigraphy, Balcones fault system, Texas. Aapg Bull. 2008, 92, 359–380. [Google Scholar] [CrossRef]
  150. Ferrill, D.A.; Morris, A.P.; McGinnis, R.N.; Smart, K.J.; Wigginton, S.S.; Hill, N.J. Mechanical stratigraphy and normal faulting. J. Struct. Geol. 2017, 94, 275–302. [Google Scholar] [CrossRef]
  151. Parrino, N.; Pepe, F.; Burrato, P.; Dardanelli, G.; Corradino, M.; Pipitone, C.; Morticelli, M.G.; Sulli, A.; Di Maggio, C. Elusive active faults in a low strain rate region (Sicily, Italy): Hints from a multidisciplinary land-to-sea approach. Tectonophysics 2022, 839, 229520. [Google Scholar] [CrossRef]
  152. Brandes, C.; Tanner, D.C.; Fossen, H.; Halisch, M.; Müller, K. Disaggregation bands as an indicator for slow creep activity on blind faults. Commun. Earth Environ. 2022, 3, 99. [Google Scholar] [CrossRef]
  153. Patacca, E.; Scandone, P.; Bellatalla, M.; Perilli, N.; Santini, U. La zona di giunzione tra l’arco appenninico settentrionale e l’arco appenninico meridionale nell’Abruzzo e nel Molise. Studi Geol. Camerti 1991, 1991/2, CROP-11, 417–441. [Google Scholar]
  154. Di Bucci, D.; Corrado, S.; Naso, G. Active faults at the boundary between Central and Southern Apennines (Isernia, Italy). Tectonophysics 2002, 359, 47–63. [Google Scholar] [CrossRef]
  155. Chiaraluce, L.; Barchi, M.; Collettini, C.; Mirabella, F.; Pucci, S. Connecting seismically active normal faults with Quaternary geological structures in a complex extensional environment: The Colfiorito 1997 case history (northern Apennines, Italy). Tectonics 2005, 24, Tc1002. [Google Scholar] [CrossRef]
  156. Pizzi, A.; Galadini, F. Pre-existing cross-structures and active fault segmentation in the northern-central Apennines (Italy). Tectonophysics 2009, 476, 304–319. [Google Scholar] [CrossRef]
  157. Di Domenica, A.; Turtù, A.; Satolli, S.; Calamita, F. Relationships between thrusts and normal faults in curved belts: New insight in the inversion tectonics of the Central-Northern Apennines (Italy). J. Struct. Geol. 2012, 42, 104–117. [Google Scholar] [CrossRef]
  158. Bonini, L.; Maesano, F.E.; Basili, R.; Burrato, P.; Carafa, M.M.C.; Fracassi, U.; Kastelic, V.; Tarabusi, G.; Tiberti, M.M.; Vannoli, P.; et al. Imaging the tectonic framework of the 24 August 2016, Amatrice (central Italy) earthquake sequence: New roles for old players? Ann. Geophys. 2016, 59, 1–10. [Google Scholar] [CrossRef]
  159. Buttinelli, M.; Pezzo, G.; Valoroso, L.; De Gori, P.; Chiarabba, C. Tectonics Inversions, Fault Segmentation, and Triggering Mechanisms in the Central Apennines Normal Fault System: Insights From High-Resolution Velocity Models. Tectonics 2018, 37, 4135–4149. [Google Scholar] [CrossRef]
  160. Brozzetti, F.; Boncio, P.; Cirillo, D.; Ferrarini, F.; de Nardis, R.; Testa, A.; Liberi, F.; Lavecchia, G. High-Resolution Field Mapping and Analysis of the August–October 2016 Coseismic Surface Faulting (Central Italy Earthquakes): Slip Distribution, Parameterization, and Comparison With Global Earthquakes. Tectonics 2019, 38, 417–439. [Google Scholar] [CrossRef]
  161. Porreca, M.; Fabbrizzi, A.; Azzaro, S.; Pucci, S.; Del Rio, L.; Pierantoni, P.P.; Giorgetti, C.; Roberts, G.; Barchi, M.R. 3D geological reconstruction of the M. Vettore seismogenic fault system (Central Apennines, Italy): Cross-cutting relationship with the M. Sibillini thrust. J. Struct. Geol. 2020, 131, 103938. [Google Scholar] [CrossRef]
  162. Stendardi, F.; Capotorti, F.; Fabbi, S.; Ricci, V.; Silvestri, S.; Bigi, S.; Iannace, A. Geological map of the Mt. Vettoretto–Capodacqua area (Central Apennines, Italy) and cross-cutting relationships between Sibillini Mts. Thrust and Mt. Vettore normal faults system. Geol. Field Trips 2020, 12, 1–22. [Google Scholar] [CrossRef]
  163. Vignaroli, G.; Mancini, M.; Brilli, M.; Bucci, F.; Cardinali, M.; Giustini, F.; Voltaggio, M.; Yu, T.L.; Shen, C.C. Spatial-Temporal Evolution of Extensional Faulting and Fluid Circulation in the Amatrice Basin (Central Apennines, Italy) During the Pleistocene. Front. Earth Sci. 2020, 8, 130. [Google Scholar] [CrossRef]
  164. Bagh, S.; Chiaraluce, L.; De Gori, P.; Moretti, M.; Govoni, A.; Chiarabba, C.; Di Bartolomeo, P.; Romanelli, M. Background seismicity in the Central Apennines of Italy: The Abruzzo region case study. Tectonophysics 2007, 444, 80–92. [Google Scholar] [CrossRef]
  165. Falcucci, E.; Gori, S.; Moro, M.; Fubelli, G.; Saroli, M.; Chiarabba, C.; Galadini, F. Deep reaching versus vertically restricted Quaternary normal faults: Implications on seismic potential assessment in tectonically active regions: Lessons from the middle Aterno valley fault system, central Italy. Tectonophysics 2015, 651, 186–198. [Google Scholar] [CrossRef]
  166. Lavecchia, G.; Ferrarini, F.; Brozzetti, F.; Nardis, R.D.; Boncio, P.; Chiaraluce, L. From surface geology to aftershock analysis: Constraints on the geometry of the L’Aquila 2009 seismogenic fault system. Ital. J. Geosci. 2012, 131, 330–347. [Google Scholar] [CrossRef]
  167. Galli, P.; Galderisi, A.; Peronace, E.; Giaccio, B.; Hajdas, I.; Messina, P.; Pileggi, D.; Polpetta, F. The Awakening of the Dormant Mount Vettore Fault (2016 Central Italy Earthquake, M w 6.6): Paleoseismic Clues on Its Millennial Silences. Tectonics 2019, 38, 687–705. [Google Scholar] [CrossRef]
  168. Lavecchia, G.; de Nardis, R.; Cirillo, D.; Brozzetti, F.; Boncio, P. The May–June 2012 Ferrara Arc earthquakes (northern Italy): Structural control of the spatial evolution of the seismic sequence and of the surface pattern of coseismic fractures. Ann. Geophys. 2012, 55, 533–540. [Google Scholar] [CrossRef]
  169. Wessel, P.; Luis, J.F.; Uieda, L.; Scharroo, R.; Wobbe, F.; Smith, W.H.F.; Tian, D. The Generic Mapping Tools Version 6. Geochem. Geophys. Geosyst. 2019, 20, 5556–5564. [Google Scholar] [CrossRef]
Table 1. Synoptic table summarising clues and evidence of normal faulting collected in Key Areas 1, 2, and 3, according to the different methodologies used in this work and in the literature. Results are also graphically outlined in map view in Figure 10B. Fault key: ACM = Aremogna–Cinquemiglia fault system; Ro = Rotella fault; Po = Porrara fault; PS = persistent scatter; Rs = rockslide; Sk = sackung. Reference key: * [85]; ** [84]; § [88]; °° [90]; ++ [56]. # [87].
Key AreaRelief AnalysisTopographic
Derivatives
Stereoscopic
Imagery Analysis
Time-Series
InSAR Analysis
Literature
KA1Transients from local and residual relief maps (Figure 4) and Swath Profile 2
(Figure 5)
Geomorphic scarp from slope and curvature analysis
(Figure 6)
Geom. lineaments and gravitational processes
(Figure 8A)
PS deformation patterns of Sk1 and Sk2
(Figure 9A)
ACM in *;
Ro in **;
Pi in #;
Po in §.
KA2Transients from local and residual relief maps (Figure 4) and Swath Profile 3
(Figure 5)
Geomorphic scarp from slope and curvature analysis
(Figure 7B,C)
Geom. lineaments and gravitational processes (Figure 8B)-Partly in °°
KA3(Subtle) transients from local and residual relief maps (Figure 4) and Swath Profile 4
(Figure 5)
Geomorphic scarp from slope and curvature analysis
(Figure 7D–G)
Geom. lineaments and gravitational processes (Figure 8C)PS deformation
pattern for Rs3 (Figure 9B)
and interferometric
coherence loss related
to Rs1 and Rs2
(Figure 9C,D)
Partly in ++
Disclaimer/Publisher’s Note: The statements, opinions and data contained in all publications are solely those of the individual author(s) and contributor(s) and not of MDPI and/or the editor(s). MDPI and/or the editor(s) disclaim responsibility for any injury to people or property resulting from any ideas, methods, instructions or products referred to in the content.

