Article

Fault Geometry and Slip Distribution of the 2023 Jishishan Earthquake Based on Sentinel-1A and ALOS-2 Data

1
College of Surveying and Geo-Informatics, North China University of Water Resources and Electric Power, Zhengzhou 450046, China
2
School of Surveying and Urban Spatial Information, Henan University of Urban Construction, Pingdingshan 467000, China
*
Author to whom correspondence should be addressed.
Remote Sens. 2025, 17(13), 2310; https://doi.org/10.3390/rs17132310
Submission received: 11 May 2025 / Revised: 26 June 2025 / Accepted: 4 July 2025 / Published: 5 July 2025

Abstract

On 18 December 2023, a Mw 6.2 earthquake occurred in close proximity to Jishishan County, located on the northeastern edge of the Qinghai–Tibet Plateau. The event struck the structural intersection of the Haiyuan fault, Lajishan fault, and West Qinling fault, providing empirical evidence for investigating the crustal compression mechanisms associated with the northeastward expansion of the Qinghai–Tibet Plateau. In this study, we successfully acquired a high-resolution coseismic deformation field of the earthquake by employing interferometric synthetic aperture radar (InSAR) technology. This was accomplished through the analysis of image data obtained from both the ascending and descending orbits of the Sentinel-1A satellite, as well as from the ascending orbit of the ALOS-2 satellite. Our findings indicate that the coseismic deformation is predominantly localized around the Lajishan fault zone, without leading to the development of a surface rupture zone. The maximum deformations recorded from the Sentinel-1A ascending and descending datasets are 7.5 cm and 7.7 cm, respectively, while the maximum deformation observed from the ALOS-2 ascending data reaches 10 cm. Geodetic inversion confirms that the seismogenic structure is a northeast-dipping thrust fault. The geometric parameters indicate a strike of 313° and a dip angle of 50°. The slip distribution model reveals that the rupture depth predominantly ranges between 5.7 and 15 km, with a maximum displacement of 0.47 m occurring at a depth of 9.6 km. By integrating the coseismic slip distribution and aftershock relocation, this study comprehensively elucidates the stress coupling mechanism between the mainshock and its subsequent aftershock sequence. Quantitative analysis indicates that aftershocks are primarily located within the stress enhancement zone, with an increase in stress ranging from 0.12 to 0.30 bar. It is crucial to highlight that the structural units, including the western segment of the northern margin fault of West Qinling, the eastern segment of the Daotanghe fault, the eastern segment of the Linxia fault, and both the northern and southern segment of Lajishan fault, exhibit characteristics indicative of continuous stress loading. This observation suggests a potential risk for fractures in these areas.

1. Introduction

Earthquake disasters play a critical role among the various factors contributing to natural disasters, and their considerable destructiveness poses a significant challenge to the sustainable development of human society. The impacts of seismic events exhibit distinct multi-scale characteristics: direct manifestations include the formation of surface rupture zones and coseismic alterations in terrain; secondary disaster chains encompass tsunami surges, slope instability leading to landslides, and foundation liquefaction resulting in collapses. These occurrences can trigger compound disasters such as fires and hazardous chemical spills by damaging manmade structures. Therefore, systematic investigations into earthquake rupture dynamics and scientific assessments of regional earthquake risk levels not only represent fundamental propositions in contemporary seismology research but also establish an essential scientific foundation for optimizing engineering seismic fortification standards. According to the China Earthquake Networks Center (CENC, https://www.cenc.ac.cn/ (accessed on 18 February 2025)), a shallow-focus earthquake with a magnitude of 6.2 occurred in Jishishan County, Gansu Province, at 23:59 Beijing Time on 18 December 2023. The epicenter was located at coordinates 35.70°N and 102.79°E, approximately 8 km northwest of Jishishan County, near the northeastern edge of the Tibetan Plateau along the Lajishan fault (LJSF) (Figure 1). The joint working group of the Seismological Bureau of China and the Chinese Academy of Geological Sciences conducted an on-site investigation and damage assessment in the Jishishan earthquake area located in Gansu Province. They developed an intensity distribution map for this earthquake, as depicted in Figure 2. From Figure 2, it is evident that the earthquake reached a maximum intensity of magnitude VIII, characterized by a major axis measuring 124 km and a minor axis measuring 85 km. Areas with an intensity of greater than or equal to VI covered 8364 km2 across five cities (prefectures) and thirteen counties (districts) in Gansu and Qinghai Provinces, affecting a total of 118 townships. Specifically, 88 townships located within nine counties of Gansu (encompassing an area of 5232 km2) and 30 townships situated in four counties of Qinghai (spanning 3132 km2) were impacted. The affected region also included ecologically sensitive areas such as the Taizi Mountain Nature Reserve and Gaixinping Forest Farm. This earthquake is recorded as the largest event on the fault to date, resulting in 151 fatalities and thousands of injuries by 31 December 2023. The disaster caused significant casualties and substantial property losses for the local population [1]. After the earthquake, both domestic and international research institutions systematically elucidated the source mechanism and rupture distribution characteristics of the event through a multidisciplinary approach. This investigation employed various methods, including satellite remote sensing observations, seismic wave inversion analyses, and geological constraints [2,3,4,5,6,7,8,9,10,11,12]. Liu et al. [2] employed Sentinel-1A satellite radar observations to derive the coseismic deformation field associated with the 2023 Jishishan earthquake, utilizing these data as a constraint for inverting the geometric and fine slip distribution of the seismogenic fault. The analysis revealed that the Jishishan earthquake occurred along an NNW-trending, eastward-dipping thrust blind fault. Yang et al. [3] determined the optimal focal mechanism solution for the MW 6.2 Jishishan earthquake on 18 December 2023, using a three-dimensional waveform fitting inversion method based on data from a regional digital seismic network. Furthermore, Yang et al. [4] extracted the coseismic surface deformation of this event by employing InSAR data from Sentinel-1A and fitted these observations to two fault models: one dipping southwest and another northeast. Through comprehensive analysis, they concluded that the earthquake ruptured along a northeast-dipping seismogenic fault, which may represent a concealed branch fault located along the southern margin of the Lajishan fault. Gao et al. [8] utilized Sentinel-1A satellite data to derive the coseismic deformation field for the MW 6.2 earthquake that occurred in Jishishan, Gansu, and subsequently inverted its coseismic rupture model. Their findings indicated that this earthquake was associated with a northeast-dipping fault, which is part of the southern margin fault system of Lajishan. Hua et al. [9] conducted a joint inversion of both seismic moment tensor and rupture processes while comparing and analyzing parameters related to the seismogenic fault involved in this event. Their analysis revealed that the responsible fault also dips to the northeast, with its primary rupture area located between Jishishan County and Dahejia Town. Sun et al. [10] employed GNSS and InSAR data for inversions concerning coseismic rupture models; their analyses suggested that the fault associated with this earthquake similarly dips toward northeastern directions, further investigating its stress impact on surrounding regions. Based on results from earthquake relocation studies, focal mechanism analyses, and stress inversion assessments, Wang et al. [11] confirmed that the fault linked to the Jishishan earthquake exhibits a northeastward dip directionally, identifying it as part of eastern edge faults within Jishishan itself. Zhang et al. [12], utilizing Sentinel-1 image data obtained through InSAR techniques, derived both coseismic and interseismic deformation fields relevant to this event; they integrated interseismic global navigation satellite system (GNSS) data which enabled them to construct an interseismic three-dimensional crustal deformation field—ultimately concluding instead that this particular fault dipped southwestward at its southern end adjacent to the northern edges of the Lajishan fault. The specific content is presented in Table 1. The existing achievements are based on synthetic aperture radar (SAR) technology, primarily utilizing data from the Sentinel-1A satellite. The geodetic model constructed from these data predominantly focuses on the single-fault rupture model of the northeast-dipping fault located in Jishishan. However, this singular-satellite data approach does not adequately account for the potential coseismic interactions between regional active faults and buried fault systems. Therefore, it is essential to conduct a comprehensive evaluation using multi-source geophysical datasets. Additionally, a comparison of the slip distribution obtained from InSAR inversion with field observation results indicates that relying solely on Sentinel-1 data for inversion leads to significant deviations from field observations. This further highlights the challenges associated with accurately characterizing the complex fracture characteristics beneath the Lajishan fault system using a single monitoring platform.
Based on interferometric synthetic aperture radar (InSAR) technology, this paper systematically elucidates the coseismic deformation patterns of the Earth’s surface by comprehensively analyzing both ascending and descending orbit images from the Sentinel-1A satellite, as well as ascending orbit images from the ALOS-2 satellite. By simulating an elastic half-space dislocation model, the geometric parameters and slip distribution characteristics of the seismogenic fault are inverted. The inversion results are validated through aftershock sequences and geological constraints, providing a crucial foundation for determining fault behavior and understanding seismic tectonic mechanisms. These research findings not only enhance our understanding of regional seismic activity patterns but also contribute to refining existing geodynamic models. Furthermore, through static Coulomb stress analysis, this study systematically evaluates the impact of coseismic stress disturbances on adjacent fault zones. This evaluation offers a scientific basis for earthquake risk prediction and informs disaster reduction strategies.

2. Regional Tectonic Context

The ongoing convergence of the Indian and Eurasian tectonic plates is a key driver behind the uplift of the Tibetan Plateau. This phenomenon is primarily characterized by a composite deformation pattern that encompasses both vertical crustal thickening and lateral extrusion. The northeastern edge of the Qinghai–Tibet Plateau spans a vast area, extending from the eastern region of the Ngola Shan to the western part of the Qinling Mountains, with its southern boundary adjacent to the Ameya Ma-chhen Range. This region is marked by numerous typical sedimentary basins, including those in Qinghai Province such as the Xining basin, Qaidam basin, Guide basin, Xunhua basin, Xinghai basin, and Linxia basin, as well as the Lanzhou basin located in Gansu Province. The regional topographic configuration exhibits a characteristic basin–mountain system; principal orogenic belts include the Lajishan belt, Jishishan belt, West Qinling tectonic belt, and Riyueshan uplift belt. The intricate interplay among geological structures and orogenic belts collectively contributes to the distinctive geomorphological patterns observed within both basins and mountain ranges throughout this region. This interaction gives rise to the distinctive “basin–range” structure situated on the northeastern edge of the Qinghai–Tibet Plateau. The northeastern region of the Qinghai–Tibet Plateau represents the northernmost area of crustal deformation, with its deep lithosphere serving as a record of the dynamic processes associated with far-field collisions resulting from plate boundary interactions [13]. Current tectonic and fault activities in this region remain significant [14,15,16,17,18]. Moreover, the redistribution of tectonic stress, mechanisms underlying crustal shortening and thickening, and the formation of new tectonic faults related to plateau expansion continue to be focal points of research attention [19].
The Jishishan Mw 6.2 earthquake occurred in the northeastern margin of the Qinghai–Tibet Plateau in 2023. The structural deformation associated with this seismic event was influenced by three kinematically related fault systems: the Hexi Corridor thrust structural belt, which includes the Qilian-Liupanshan fault array; the Haiyuan-A’erhchin mountain sinistral strike–slip fault system; and both the Riyueshan and Ngola Shan fault zones, which exhibit dextral strike–slip and thrust characteristics [20]. The Lajishan fault zone, which hosts the epicenter of this earthquake, is affected by the northeast extension of the plateau and displays features typical of an arc fault that protrudes to the northeast. This region functions as a compressive structural zone and serves as a transitional area between the right-lateral strike–slip Riyueshan fault and the left-lateral strike–slip West Qinling fault [21,22]. Here, stress tends to concentrate and is released with relative ease. Kinematics analysis indicates that activities along the LJSF are predominantly associated with late Pleistocene events, while Holocene activity is observed only in localized areas. The overall behavior of this zone reflects compressional thrusting into the basin; additionally, its western section experiences right-lateral compression due to interactions with the Riyueshan fault, accompanied by a degree of strike–slip movement [23,24]. Geodetic constraints indicate that the vertical uplift rate of the LJSF is 1.0 ± 0.5 mm/a [25], which is significantly lower than the right-lateral slip rate of 2.18 ± 0.4 mm/a observed along the Riyueshan fault [26] and the left-lateral movement rate of 2.3 ± 0.2 mm/a associated with the West Qinling Fault (XLNF) [27]. These kinematic differences observed indicate that the contemporary seismic activities along the LJSF are significantly reduced when compared to the adjacent major fault systems. Historical records document over 20 moderate earthquakes, each with a magnitude of approximately 5, occurring on both the southern and northern flanks of Lajishan. However, due to the age of these events and a lack of comprehensive historical documentation, accurately determining the precise locations of their epicenters and associated seismogenic structures remains challenging. Geological data and aftershock distributions suggest that the primary components of the Jishishan fault located south of the main earthquake event, as well as those along the LJSF to the north, are predominantly composed of Paleozoic sedimentary rocks and metamorphic rocks [19,28]. This structural difference may contribute to a northward migration of aftershocks and facilitate unilateral rupture propagation along the pre-existing stress transmission paths through structurally weak fault zones. The LJSF—where recent seismic activity occurred—cannot be directly compared to the surrounding large strike–slip faults in terms of sliding rate or the intensity of seismic activity. Given its structural characteristics and developmental context, it is more likely that this region will experience processes related to structural transformation or cumulative stress release during seismic intervals. The Jishishan earthquake of 2023 represents the largest recorded seismic event in close proximity to the LJSF. Extracting high-precision coseismic deformation field information provides essential constraints for elucidating the regional seismotectonic dynamics along the northeastern margin of the Qinghai–Tibet Plateau. This undertaking is of significant importance for a comprehensive understanding of the active tectonic characteristics and earthquake hazards present in this region.

3. InSAR Coseismic Deformation Field

3.1. Image Data and Processing

3.1.1. Image Data

The Sentinel-1 satellite, operated by the European Space Agency, is an Earth observation satellite equipped with C-band synthetic aperture radar (wavelength 5.6 cm). Due to its stable revisit period and open data policy, it has become a vital technical tool in the field of earthquake deformation monitoring. Its phase stability characteristics enable effective detection of millimeter-scale displacement signals associated with coseismic deformation. However, C-band electromagnetic waves are prone to decoherence effects in vegetated areas, which limits their applicability for monitoring the complex terrain located at the northeastern edge of the Qinghai–Tibet Plateau. To address these limitations, the ALOS-2 satellite deployed by the Japan Aerospace Exploration Agency (JAXA) employs L-band (wavelength 23.6 cm) synthetic aperture radar technology. The long-wavelength characteristics of this technology provide enhanced penetration capabilities, allowing it to maintain superior interference coherence in densely vegetated regions and areas undergoing water system development on plateaus. These technical advantages facilitate effective capture of the fine-structure deformation field associated with the Jishishan fault. This is particularly evident when interpreted alongside multi-source optical remote sensing data, significantly enhancing the accuracy of constraints on fault kinematic parameters. The complementary observations provided by a dual-band radar system present a distinctive technical solution for reconstructing the deformation field of active fault zones. This methodology holds considerable scientific significance in enhancing our understanding of the dynamic behavior of complex structural systems in the northeastern margin of the Qinghai–Tibet Plateau. This article investigates the 2023 Jishishan earthquake and compiles both ascending and descending radar images from the Sentinel-1A satellite, along with ascending radar images from the ALOS-2 satellite. By integrating multi-source data, we achieve comprehensive monitoring of the earthquake deformation field, thereby establishing a foundation for subsequent high-precision deformation analysis. Detailed information regarding the SAR images is provided in Table 2.

3.1.2. Data Processing

Differential InSAR processing was performed using Gamma software (Version 2020) [29]. This analysis involved differential interference processing of Sentinel-1A ascending and descending satellite radar images, as well as ALOS-2 ascending satellite radar images, which capture the Jishishan earthquake of 2023. The primary objective was to derive the Line-of-Sight (LOS) deformation associated with this seismic event. In the data processing phase, a range-to-azimuth ratio of 20:4 was established to mitigate the impact of noise. Furthermore, digital elevation models with a resolution of 30 m, provided by the Shuttle Radar Topography Mission (SRTM) and ALOS Panchromatic Remote-sensing Instrument for Stereo Mapping (PRISM), were employed to correct for terrain-induced phase variations [30,31]. To improve the quality of the interferogram, the signal-to-noise ratio of the effective deformation signal was improved through multi-power spectral density filtering techniques [32]. Additionally, continuous processing of the phase field was performed using a branch cutting method [33]. Subsequently, the processed data were geocoded into the WGS 84 coordinate system to generate the final InSAR coseismic interferogram for the Mw 6.2 Jishishan earthquake. The results are illustrated in Figure 3. Furthermore, a linear function relating to error phase, elevation, and position was estimated utilizing observational data from the far-field non-deformation area. This approach effectively mitigates residual orbital errors and terrain-related atmospheric delays [34].

3.2. Results of Coseismic Deformation Analysis

Figure 3 demonstrates that the coseismic interferograms derived from the Sentinel-1A ascending and descending tracks, as well as those from the ALOS-2 ascending track, exhibit a consistent elliptical deformation pattern. The primary coseismic displacement is concentrated between the northern and southern boundaries of the LJSF, resulting in a distinct zone of deformation concentration. This phenomenon is characterized by motion directed toward the satellite, indicative of uplift. The kinematic characteristics of this coseismic deformation pattern align with those typically associated with reverse fault activity. This observation suggests that the Jishishan earthquake was predominantly a reverse fault event. This inference is supported by the focal mechanism solutions provided by GCMT and other agencies, thereby cross-validating the nature of the faulting involved in this earthquake through various technical approaches and data sources. In terms of deformation levels, different satellite datasets reveal significant variations in detail. The maximum deformation recorded from Sentinel-1A’s ascending orbit data is 7.5 cm, while that obtained from its descending orbit data reaches 7.7 cm. These two values are comparable, indicating the stability and consistency in the satellite’s monitoring of deformation across different observational perspectives. The ALOS-2 ascending data, utilizing the enhanced penetration capability of L-band radar, recorded a maximum deformation of 10 cm. This finding not only underscores the monitoring advantages of ALOS-2 in capturing deep deformation information under complex surface conditions but also illustrates that the crustal deformation induced by earthquakes varies with depth and geological media. The fringes of the coseismic interference pattern are generally smooth and continuous, suggesting that the coseismic sliding associated with this earthquake either did not reach the surface or propagated to a minimal extent. Furthermore, the observed local decorrelation phenomenon may be attributed to secondary landslides and other derivative disasters triggered by the earthquake. During an earthquake event, intense vibrations can compromise the stability of mountain rock and soil, leading to landslides and other related hazards. These occurrences alter both the physical properties and geometric configurations of the surface, modify radar wave reflection characteristics, and ultimately disrupt coherence in radar images. In terms of seismic rupture parameter inversion, high-precision coseismic interferograms provide critical constraints for determining geometric parameters and slip distribution along seismogenic faults. In the field of focal mechanism research, the findings obtained are in alignment with the focal mechanism solutions published by GCMT and other institutions. This consistency plays a crucial role in enhancing our understanding of the dynamic processes and stress states associated with earthquakes. In regional seismic hazard assessment, an accurate earthquake model and precise aftershock locations are essential for evaluating fault activity, comprehending stress accumulation characteristics, and determining potential patterns of earthquake recurrence. These components provide a vital foundation for developing scientifically informed strategies aimed at earthquake prevention and disaster mitigation in the future.

4. Geodetic Inversion

4.1. Uniform Slip Inversion

The uniform elastic half-space dislocation model [35] served as the foundation for utilizing high-precision coseismic deformation fields derived from Sentinel-1A and ALOS-2 remote sensing images as constraints. These constraints were employed to ascertain the geometric parameters of the fault through a stochastic nonlinear inversion method. To enhance the computational efficiency of the sliding distribution inversion, a downsampling strategy based on resolution optimization was introduced [36]. This strategy effectively reduced the coseismic deformation field data from the 2023 Jishishan earthquake, balancing spatial resolution demands with matrix conditions while preserving essential displacement signals. This study adopted a two-stage inversion methodology: first, geometric parameters of the fault were derived through nonlinear analysis of the coseismic displacement field; subsequently, linear inversion of the sliding distribution was conducted using these parameters as constraints. In the uniform slip inversion process, considering minimal or absent surface rupture, Poisson’s ratio was set at 0.25 [37], while the shear modulus was defined as 3.32 × 10¹⁰ N/m2. To accurately determine key fault parameters—including dip angle, strike angle, slip angle, upper boundary depth, length, width, position, and slip amount—a multi-peak particle swarm optimization algorithm [38] was employed. This algorithm identified parameters by minimizing the mean square error between the observed data and simulated LOS deformation values. Furthermore, to quantitatively assess the uncertainty associated with geometric parameters, a Monte Carlo simulation [39] was utilized. By introducing random noise into 100 datasets and analyzing the resulting error propagation, we quantified uncertainty related to these geometric parameters.
Currently, the research findings regarding the fault tendency and geometric parameters of the Jishishan earthquake exhibit inconsistencies. Yang et al. [3] determined the parameters for southwest and northeast dips through seismic waveform data inversion, concluding that the seismogenic fault plane associated with this earthquake is predominantly inclined towards a southwest dip. Additionally, utilizing InSAR technology, Yang et al. [4] also inverted parameters for faults exhibiting both northeast and southwest dips. However, the inversion results of the southwest-dipping model without physical constraints reveal a slip anomaly on the fault plane measuring 33 m in height and 0.1 km in width. The emergence of this anomalous value not only indicates potential instability within the southwest-dipping model but also underscores the limitations inherent in relying solely on a single dataset for inversion analysis. The inversion framework proposed by Fang et al. [7] utilizes a Gaussian uncertainty distribution to characterize the random properties of parameters over 106 iterations. Its primary objective is to minimize parameter covariance, thereby validating and deriving the northeast dip model along with geometric parameters that exhibit high confidence from a statistical perspective. Notable discrepancies exist in the interpretation of fault tendencies associated with the Jishishan earthquake, as reflected in existing research findings. Among these interpretations, the northeast dip model has received substantial support from numerous studies due to its superior compatibility with multi-scale observational data [2,7,8,9,10,11]. In contrast, the southwest dip model requires coordination of parameter stability through artificially imposed geometric constraints. For instance, this model demonstrates an anomaly where a cross-section merely 0.1 km wide exhibits a slip of 33 m, which is inconsistent with actual geological conditions [4]. Importantly, the free inversion framework [7], based on millions of iterations and incorporating rigorous parameter optimization and uncertainty analysis, ultimately converges towards the northeast tilt model. The stability results obtained from repeated iterations further substantiate that the northeast-dipping fault model not only effectively elucidates the geological structural characteristics of earthquake-prone areas but also demonstrates commendable anti-interference capabilities and stability. This provides a robust theoretical foundation and data support for subsequent research. In this study, we developed the northeast-dipping fault model by integrating Sentinel-1A and ALOS-2 data. The search range for the strike angle was established between 271° and 359°, while allowing other geometric parameters to vary freely in order to identify optimal solutions. For the southwest-dipping fault model, the initial inversion established a search interval for the strike angle ranging from 91° to 179°; similarly, other geometric parameters were allowed to vary freely in order to find an optimal solution.
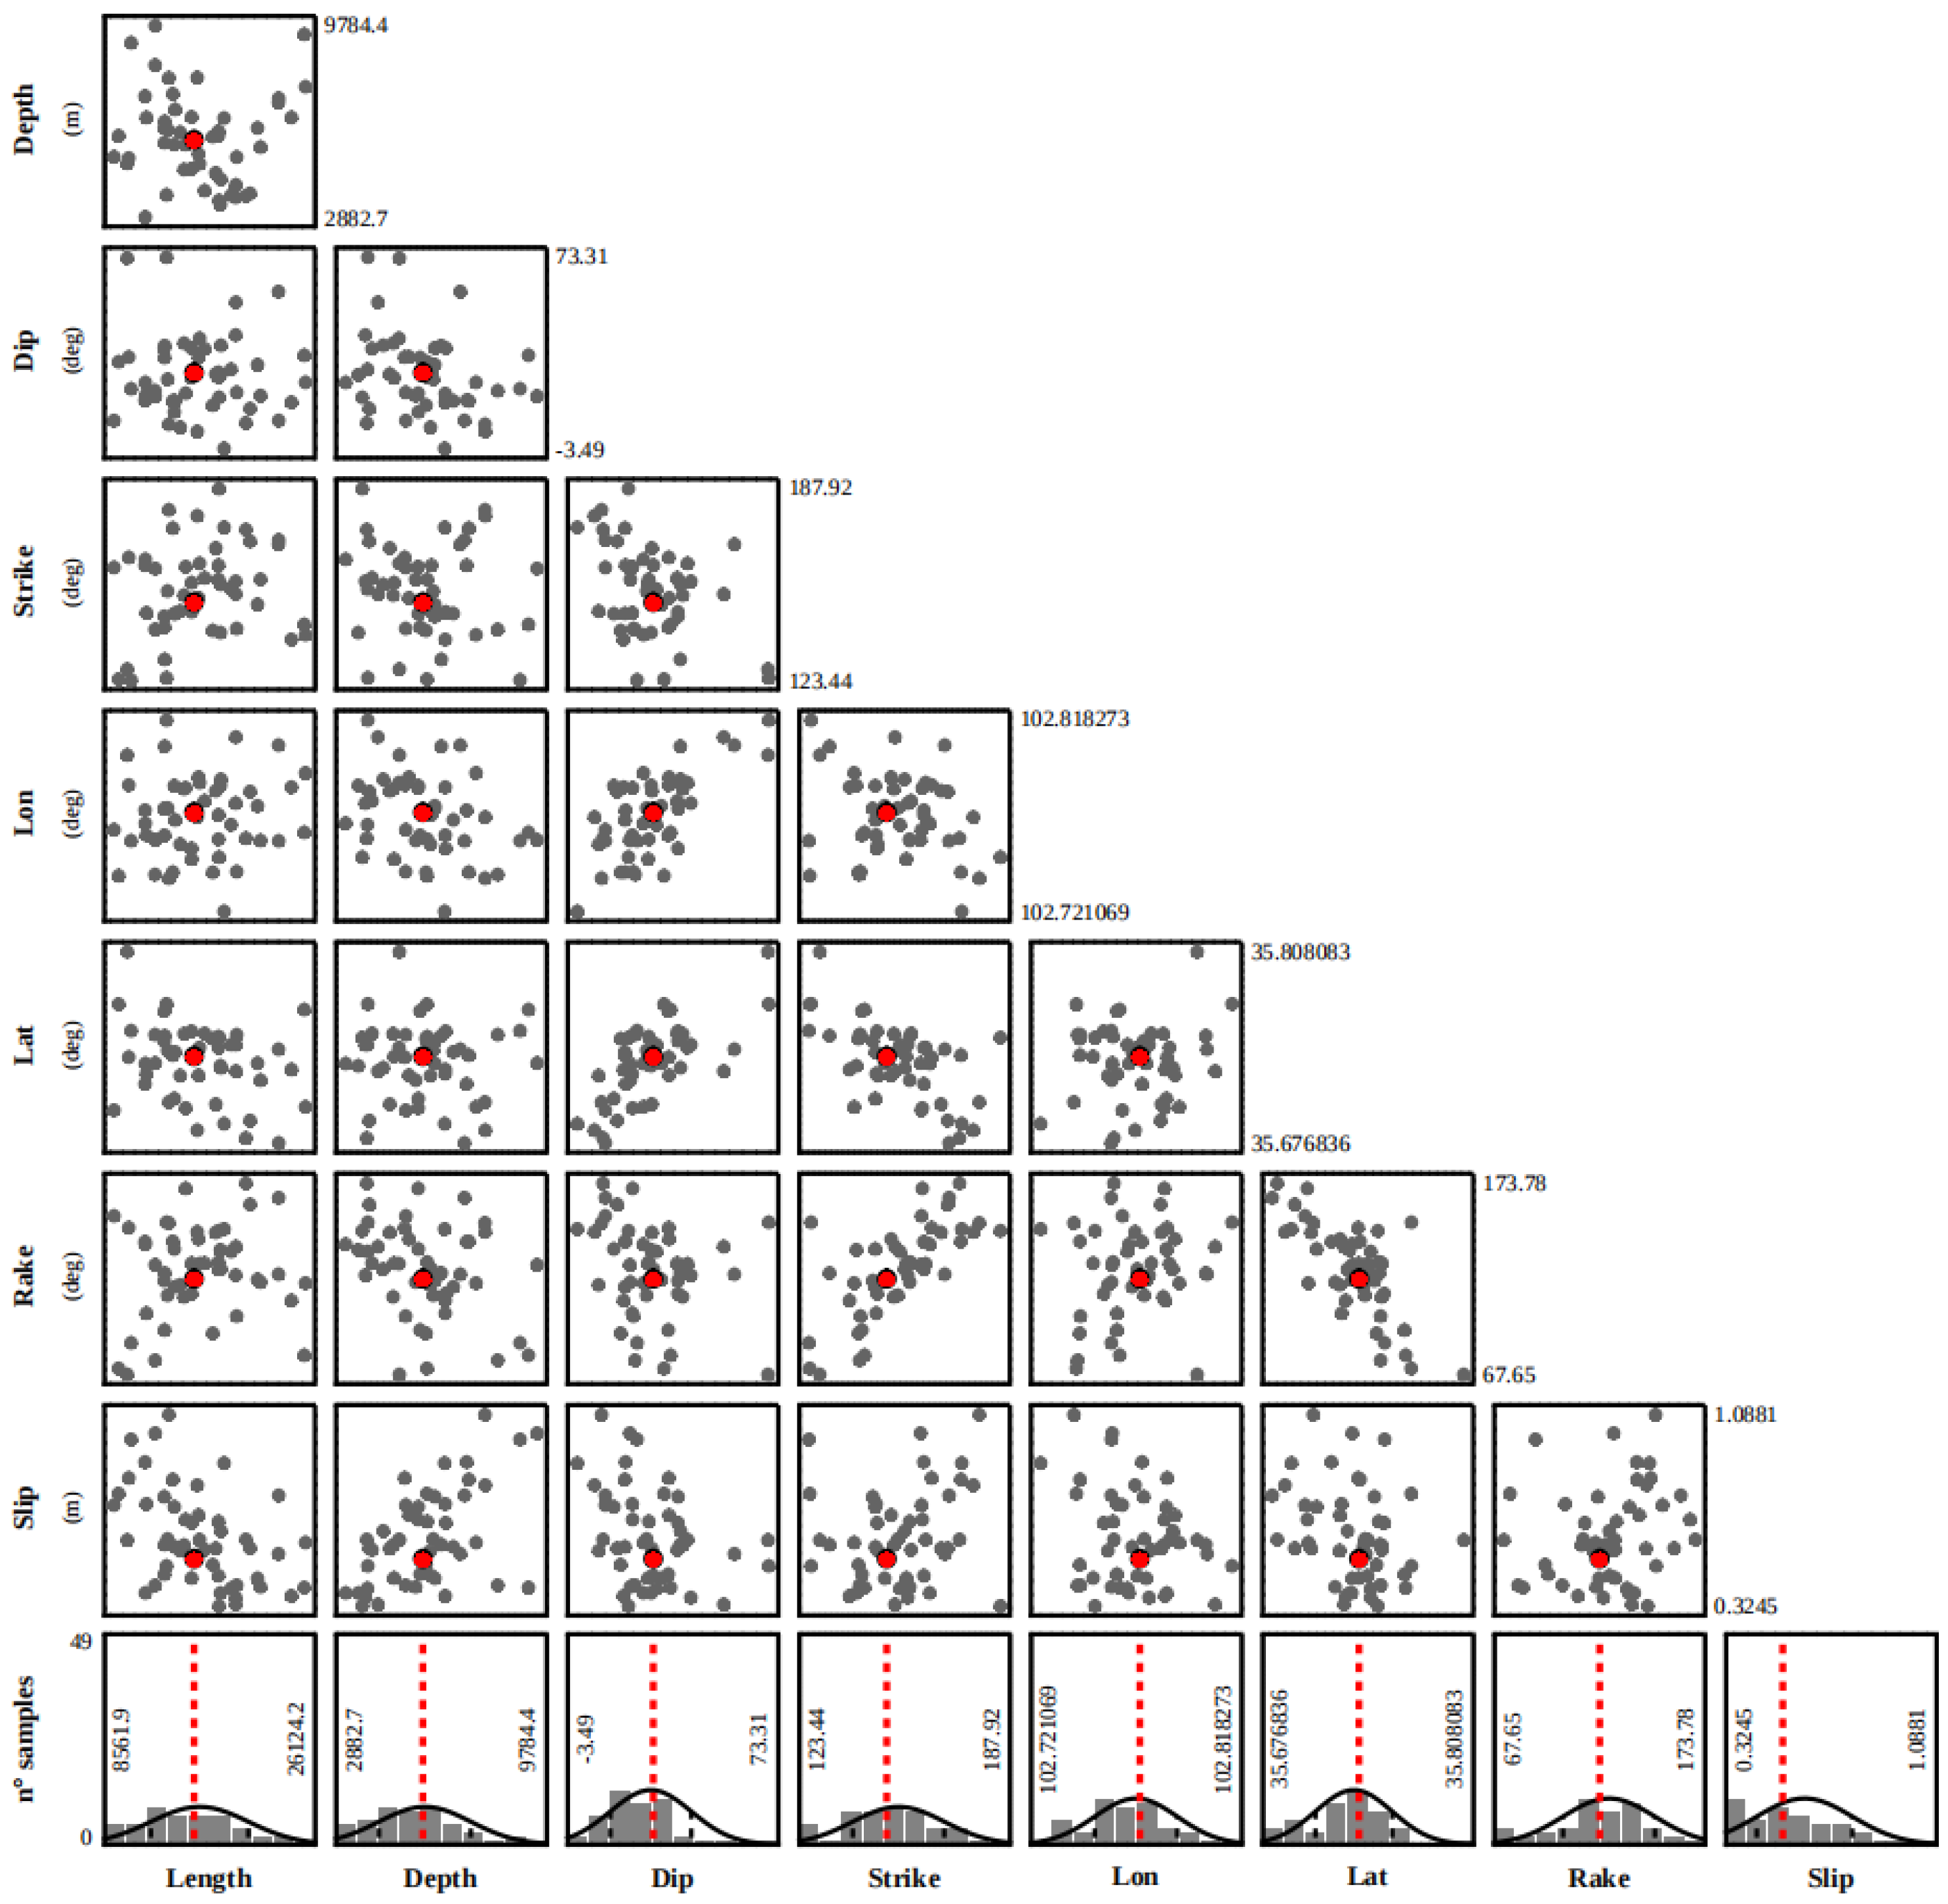
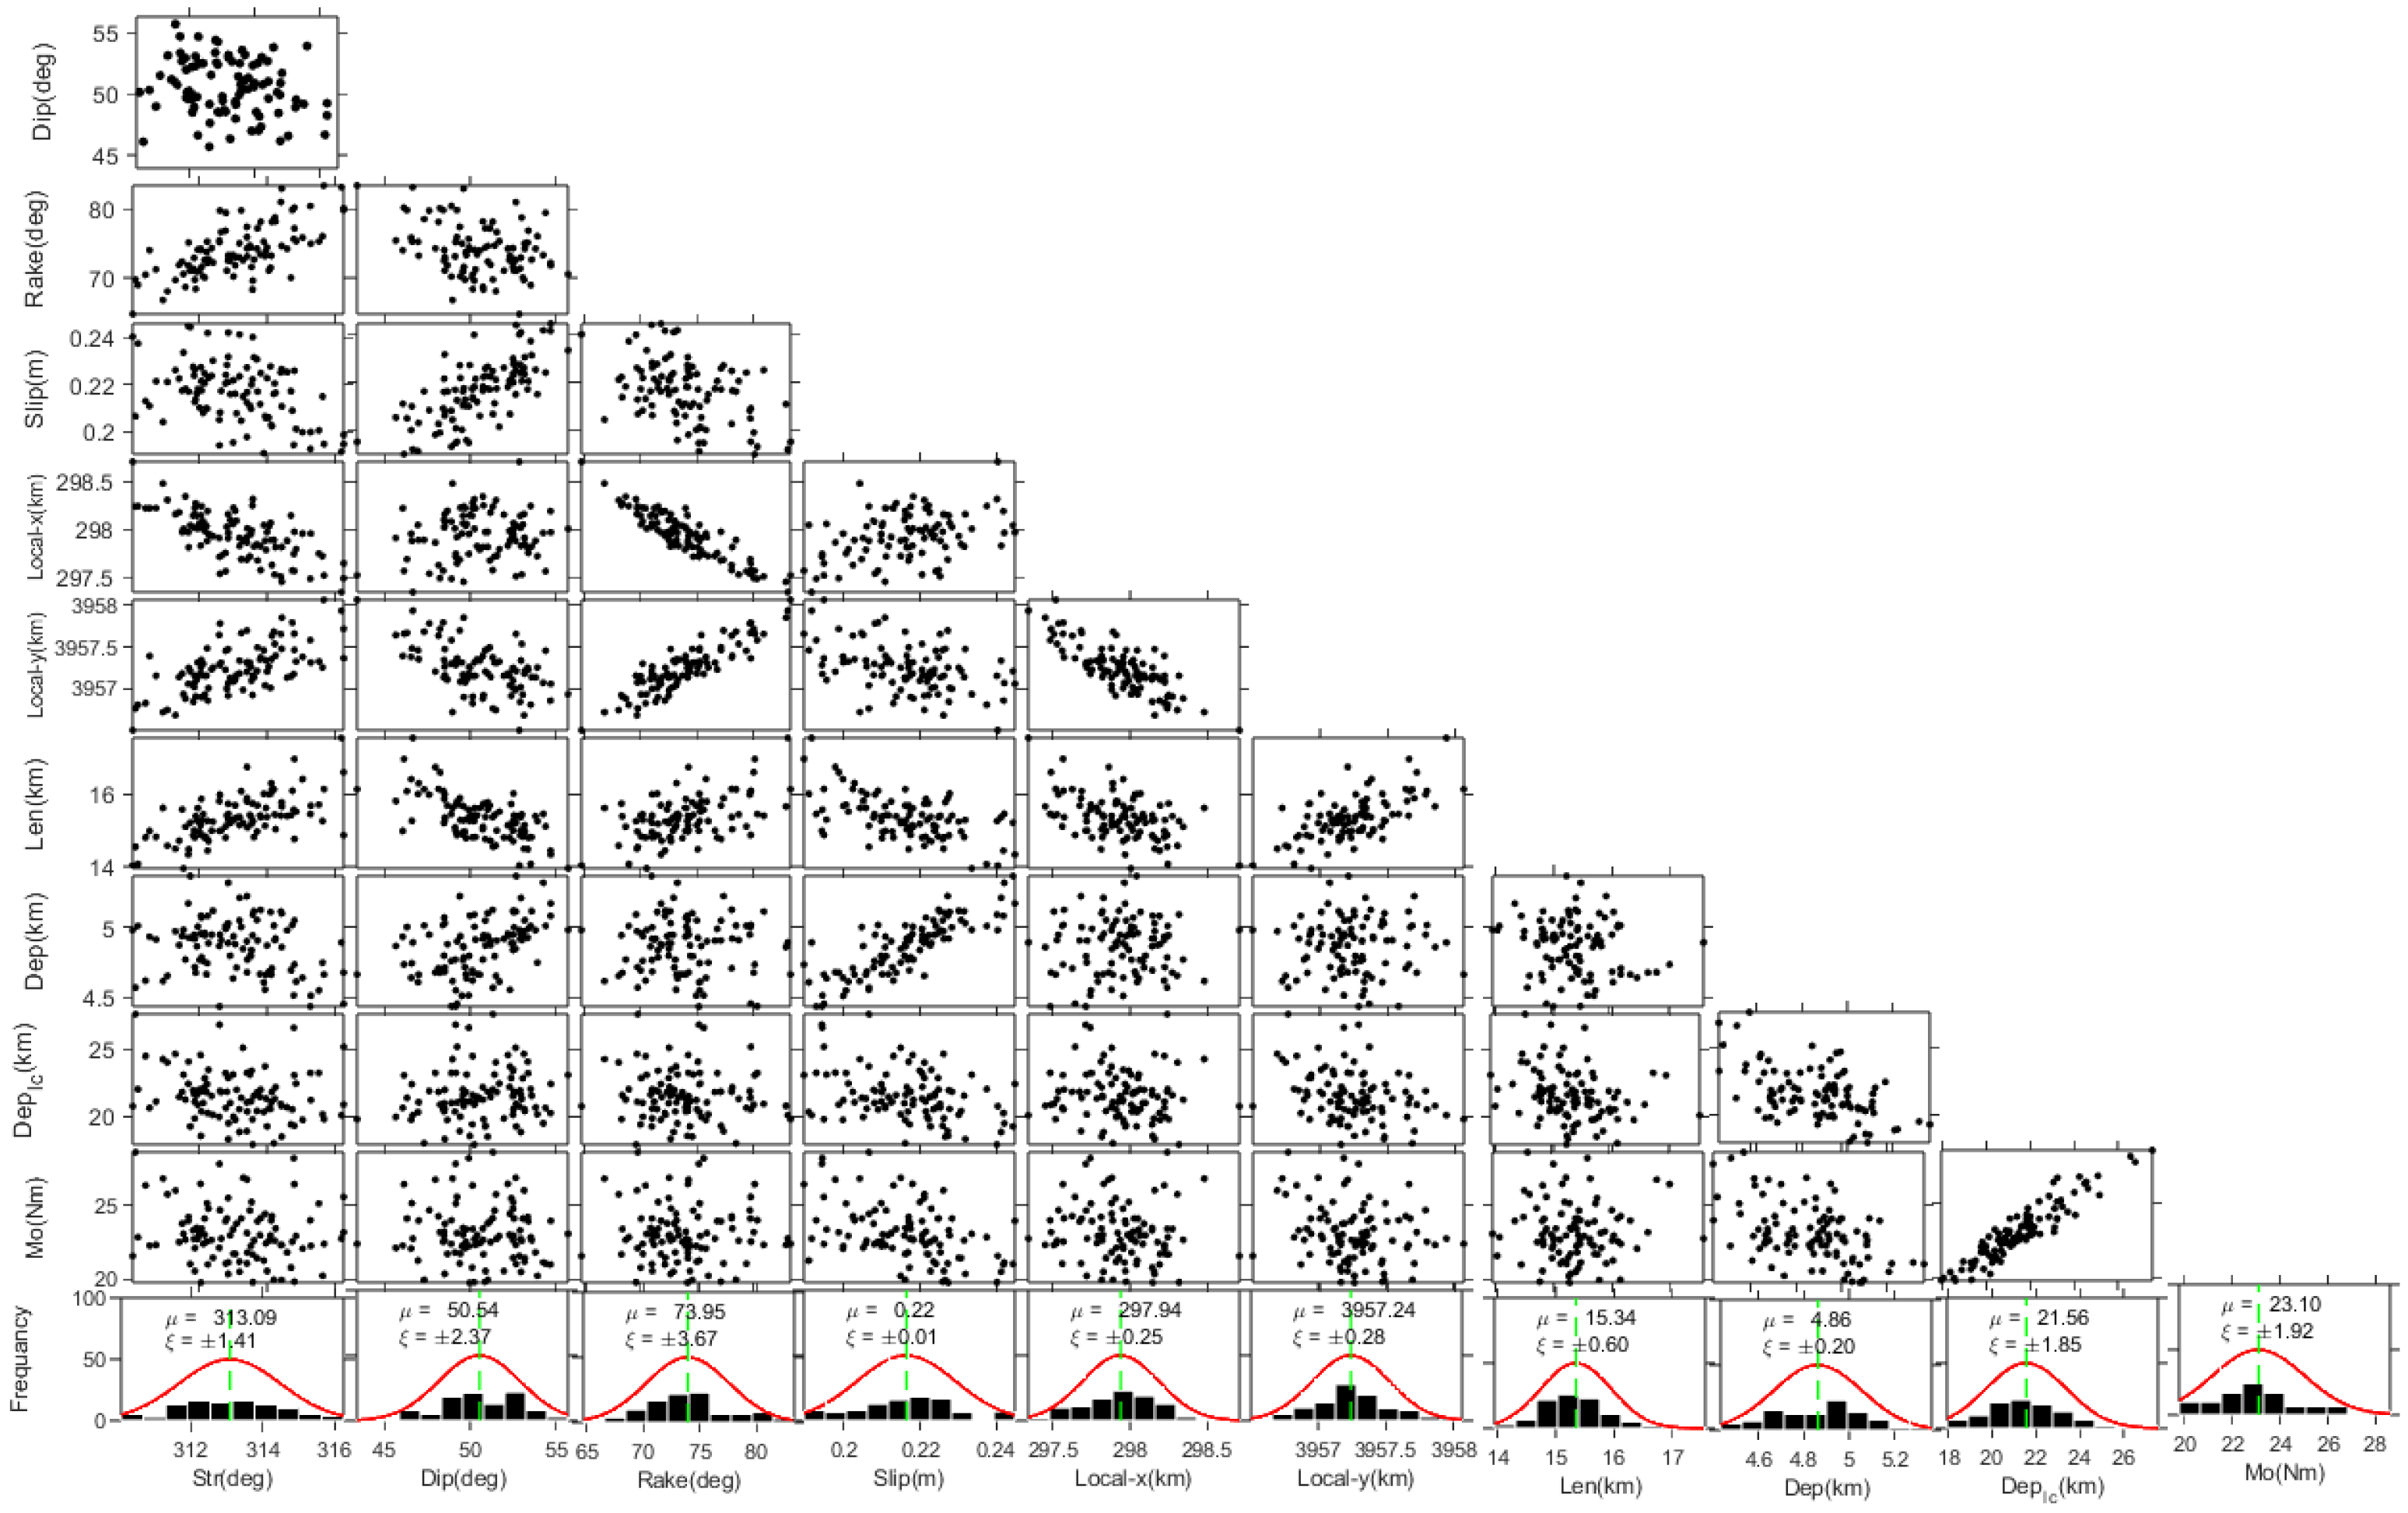
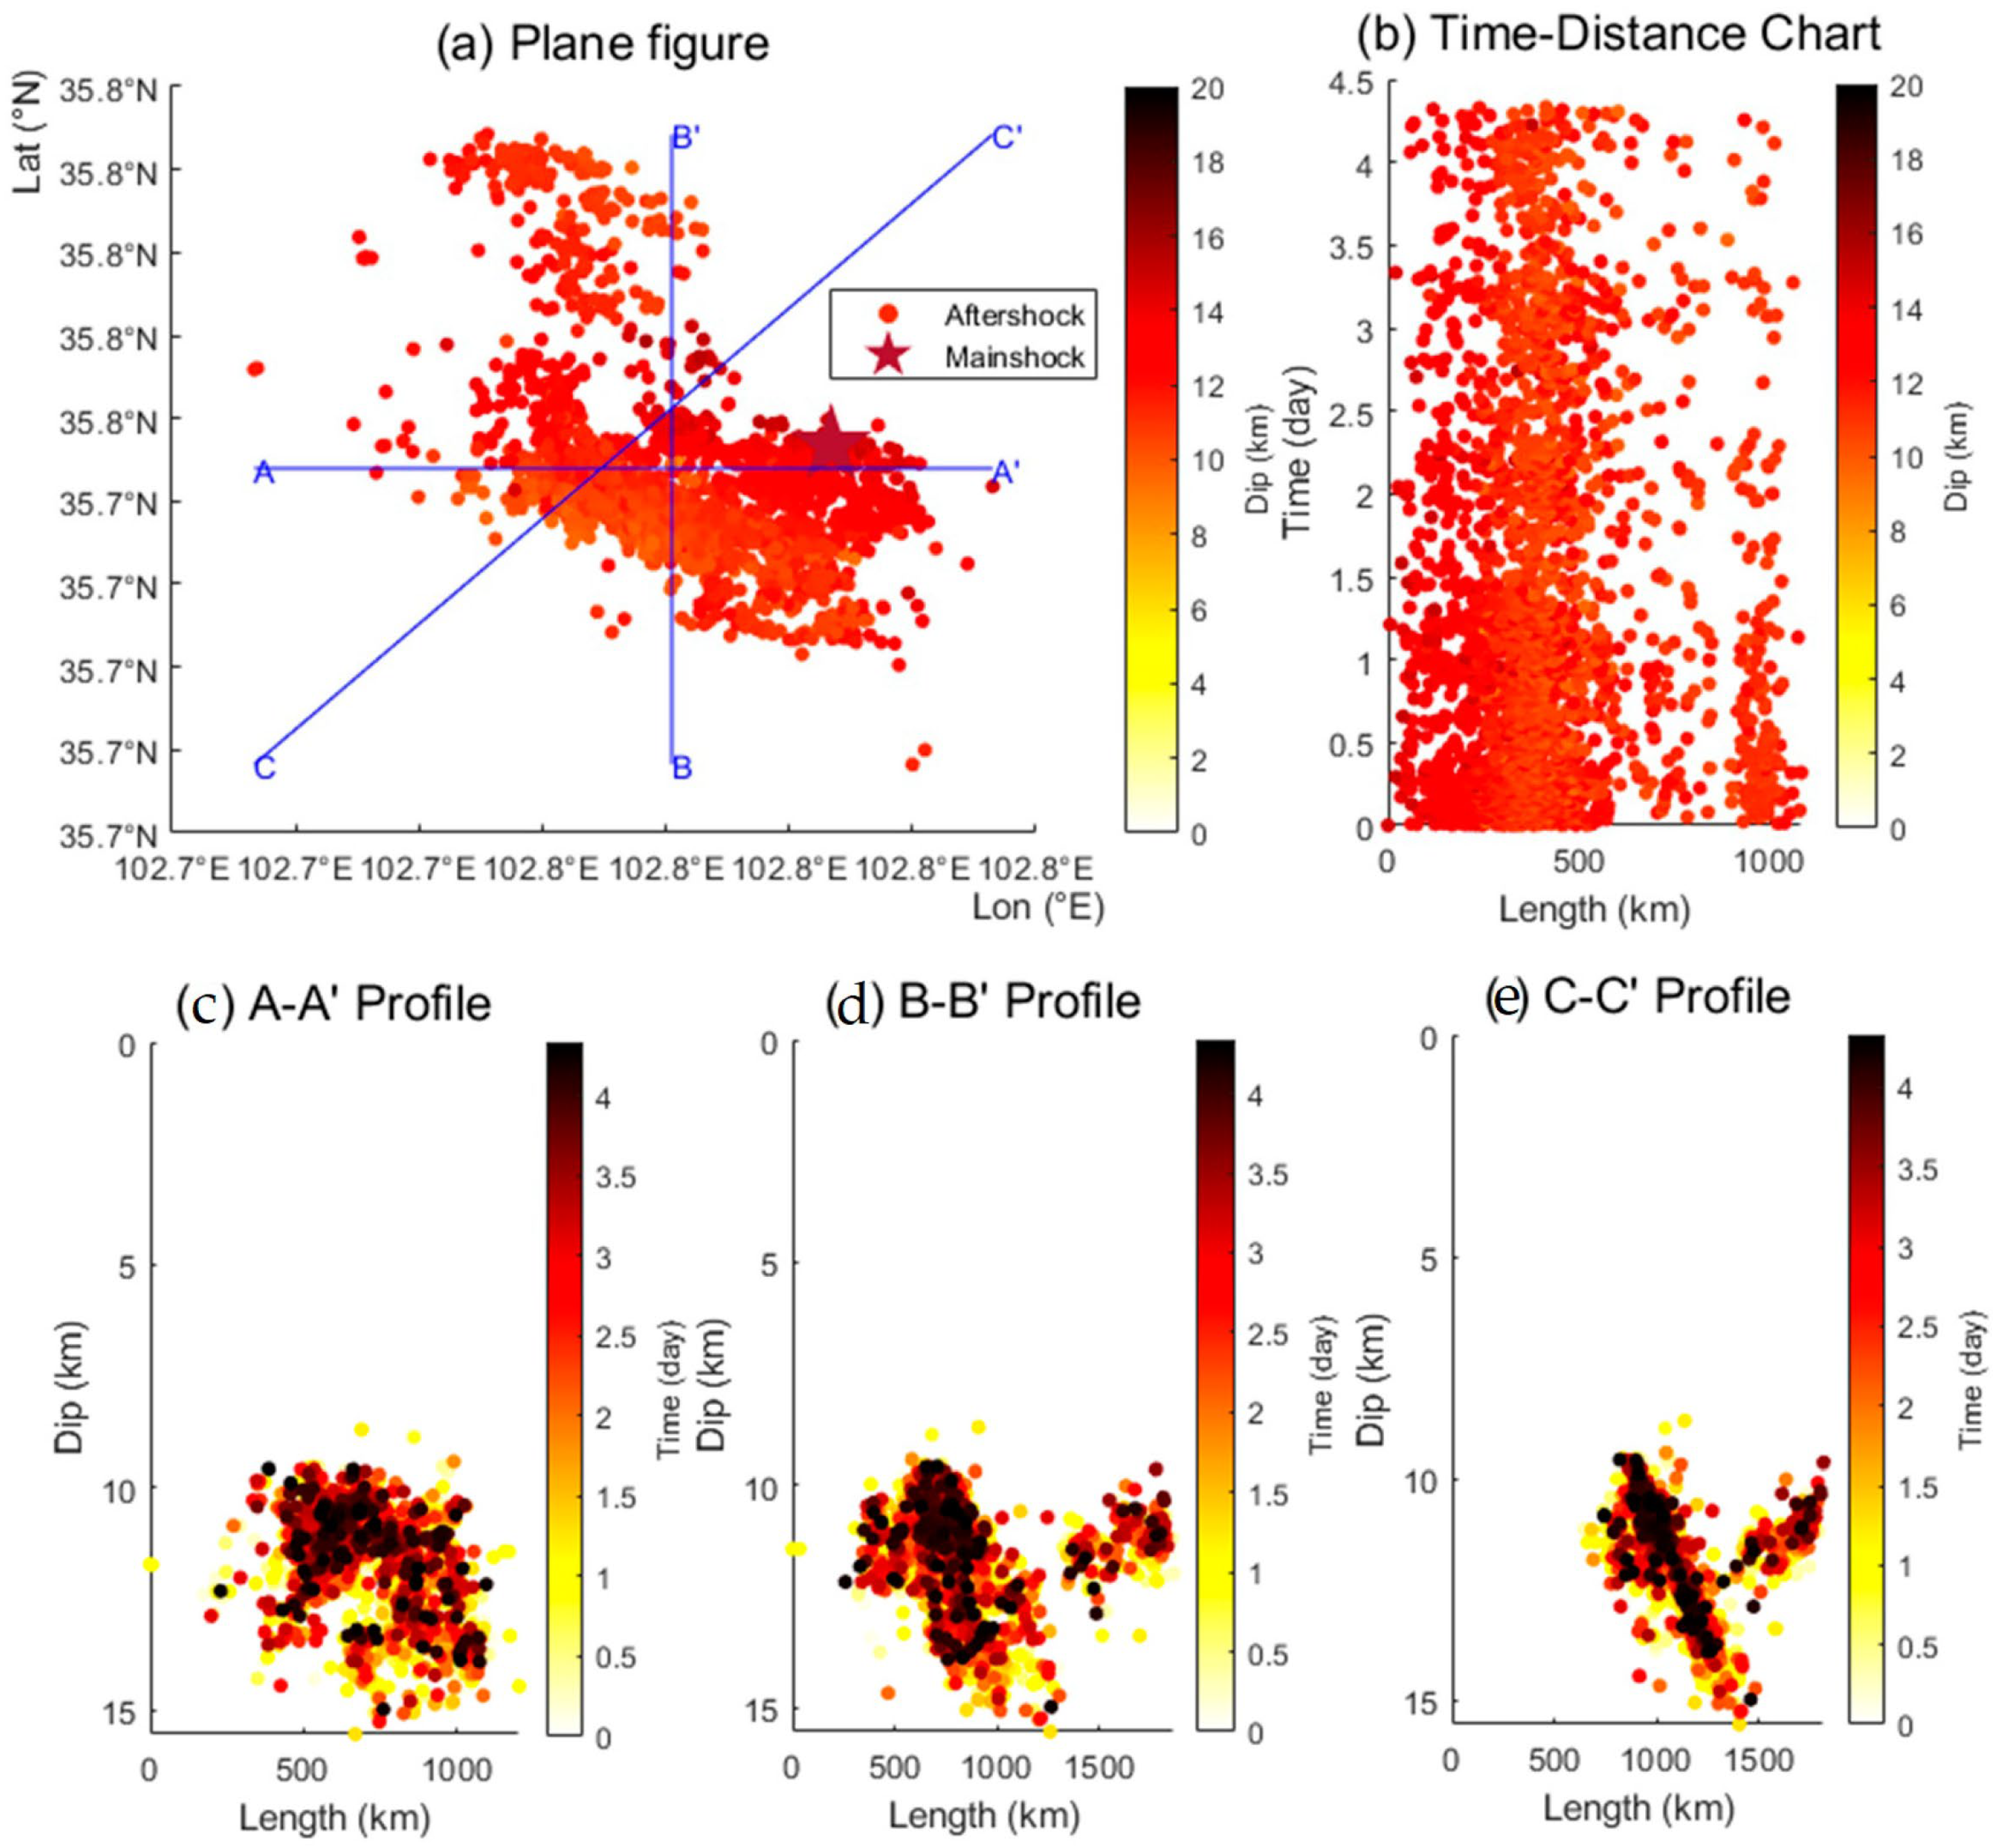
When inverting the southwest-dipping fault model, an anomalous slip of 7 m was observed on an exceptionally narrow fault with a width of 0.4 km in the unconstrained model. This finding contradicts the physical mechanisms underlying earthquake ruptures and indicates a strong correlation among the model parameters. Consequently, physical constraints regarding fault width were imposed, and the inversion process was repeated. As illustrated in Figure 4, the optimized inversion results for the southwest-dipping fault model demonstrate improved parameter stability. The fault exhibits a strike of 150°, a dip of 28°, a rupture length of 16 km, and a maximum slip of 0.53 m at a depth of 5.7 km. However, the sliding angle within this model is measured at 120°, suggesting that the characteristics associated with pure thrust movement differ somewhat from those expected based on this regional tectonic background. In contrast, the inversion results for the northeast-dipping fault model show significantly reduced uncertainty and lack any abnormal values. As depicted in Figure 5, the seismogenic fault measures approximately 15.3 km in length, with a slip value of 0.22 m, a dip angle of 50°, and a strike orientation of 313°. Its approximate burial depth is estimated to be around 4.9 km, indicating that it has not propagated to the surface. The slip angle recorded at 74° suggests that this earthquake predominantly involved reverse faulting accompanied by some left-lateral strike–slip movement. The joint probability density function of each parameter (Figure 5) indicates that all parameters approximate a normal distribution and exhibit minimal correlation. This finding further substantiates the stability of the inversion results and underscores the independence of the parameters. The observations from the northeast-dipping model are consistent with the regional tectonic background, particularly in the LJSF secondary branch region, where dip angles range from 45° to 55° [24]. Spatial analysis of aftershock relocation data (Figure 6) reveals that the area north of the main shock serves as a primary clustering zone for aftershocks. These aftershocks delineate a northwest-trending fault propagation path extending from southeast to northwest. This observed distribution pattern is congruent with the mechanical characteristics associated with northeast-dipping faults. Furthermore, up to 85% of aftershocks were concentrated within a 15 km radius of the fault plane, providing robust support for the validity of the northeast-dipping fault model. This study integrates geodetic constraints and aftershock distributions while employing multivariate optimization methods to demonstrate that the northeast dip model satisfies both kinematic and dynamic criteria for fault behavior. It addresses uncertainties related to fault dip and emphasizes the importance of comprehensive analyses that synthesize multiple data sources.

4.2. Distributed Slip Inversion

Based on the analysis of fault dip rationality and stability, the distributed slip inversion utilizes a northeast-dipping fault model as its input. The fault rupture surface is extended to 24 km × 24 km and discretized into 576 sub-fault units, each measuring 1 km × 1 km. To mitigate the violent shocks resulting from slip on the fault plane, we analyzed the trade-off curve between slip roughness and the standard deviation of observational data. An optimal smoothing factor was introduced to refine the simulation of fault slip, thereby ensuring both stability and reliability in the inversion results. In the process of slip distribution inversion, numerous incoherent phenomena surrounding the deformation zone in ALOS-2 data necessitated exclusive reliance on Sentinel-1A datasets from both ascending and descending orbits. To ensure that our results accurately reflect the primary characteristics of the fault, cross trajectory analysis was employed for verification. The inversion results are presented in Figure 7 and Figure 8.
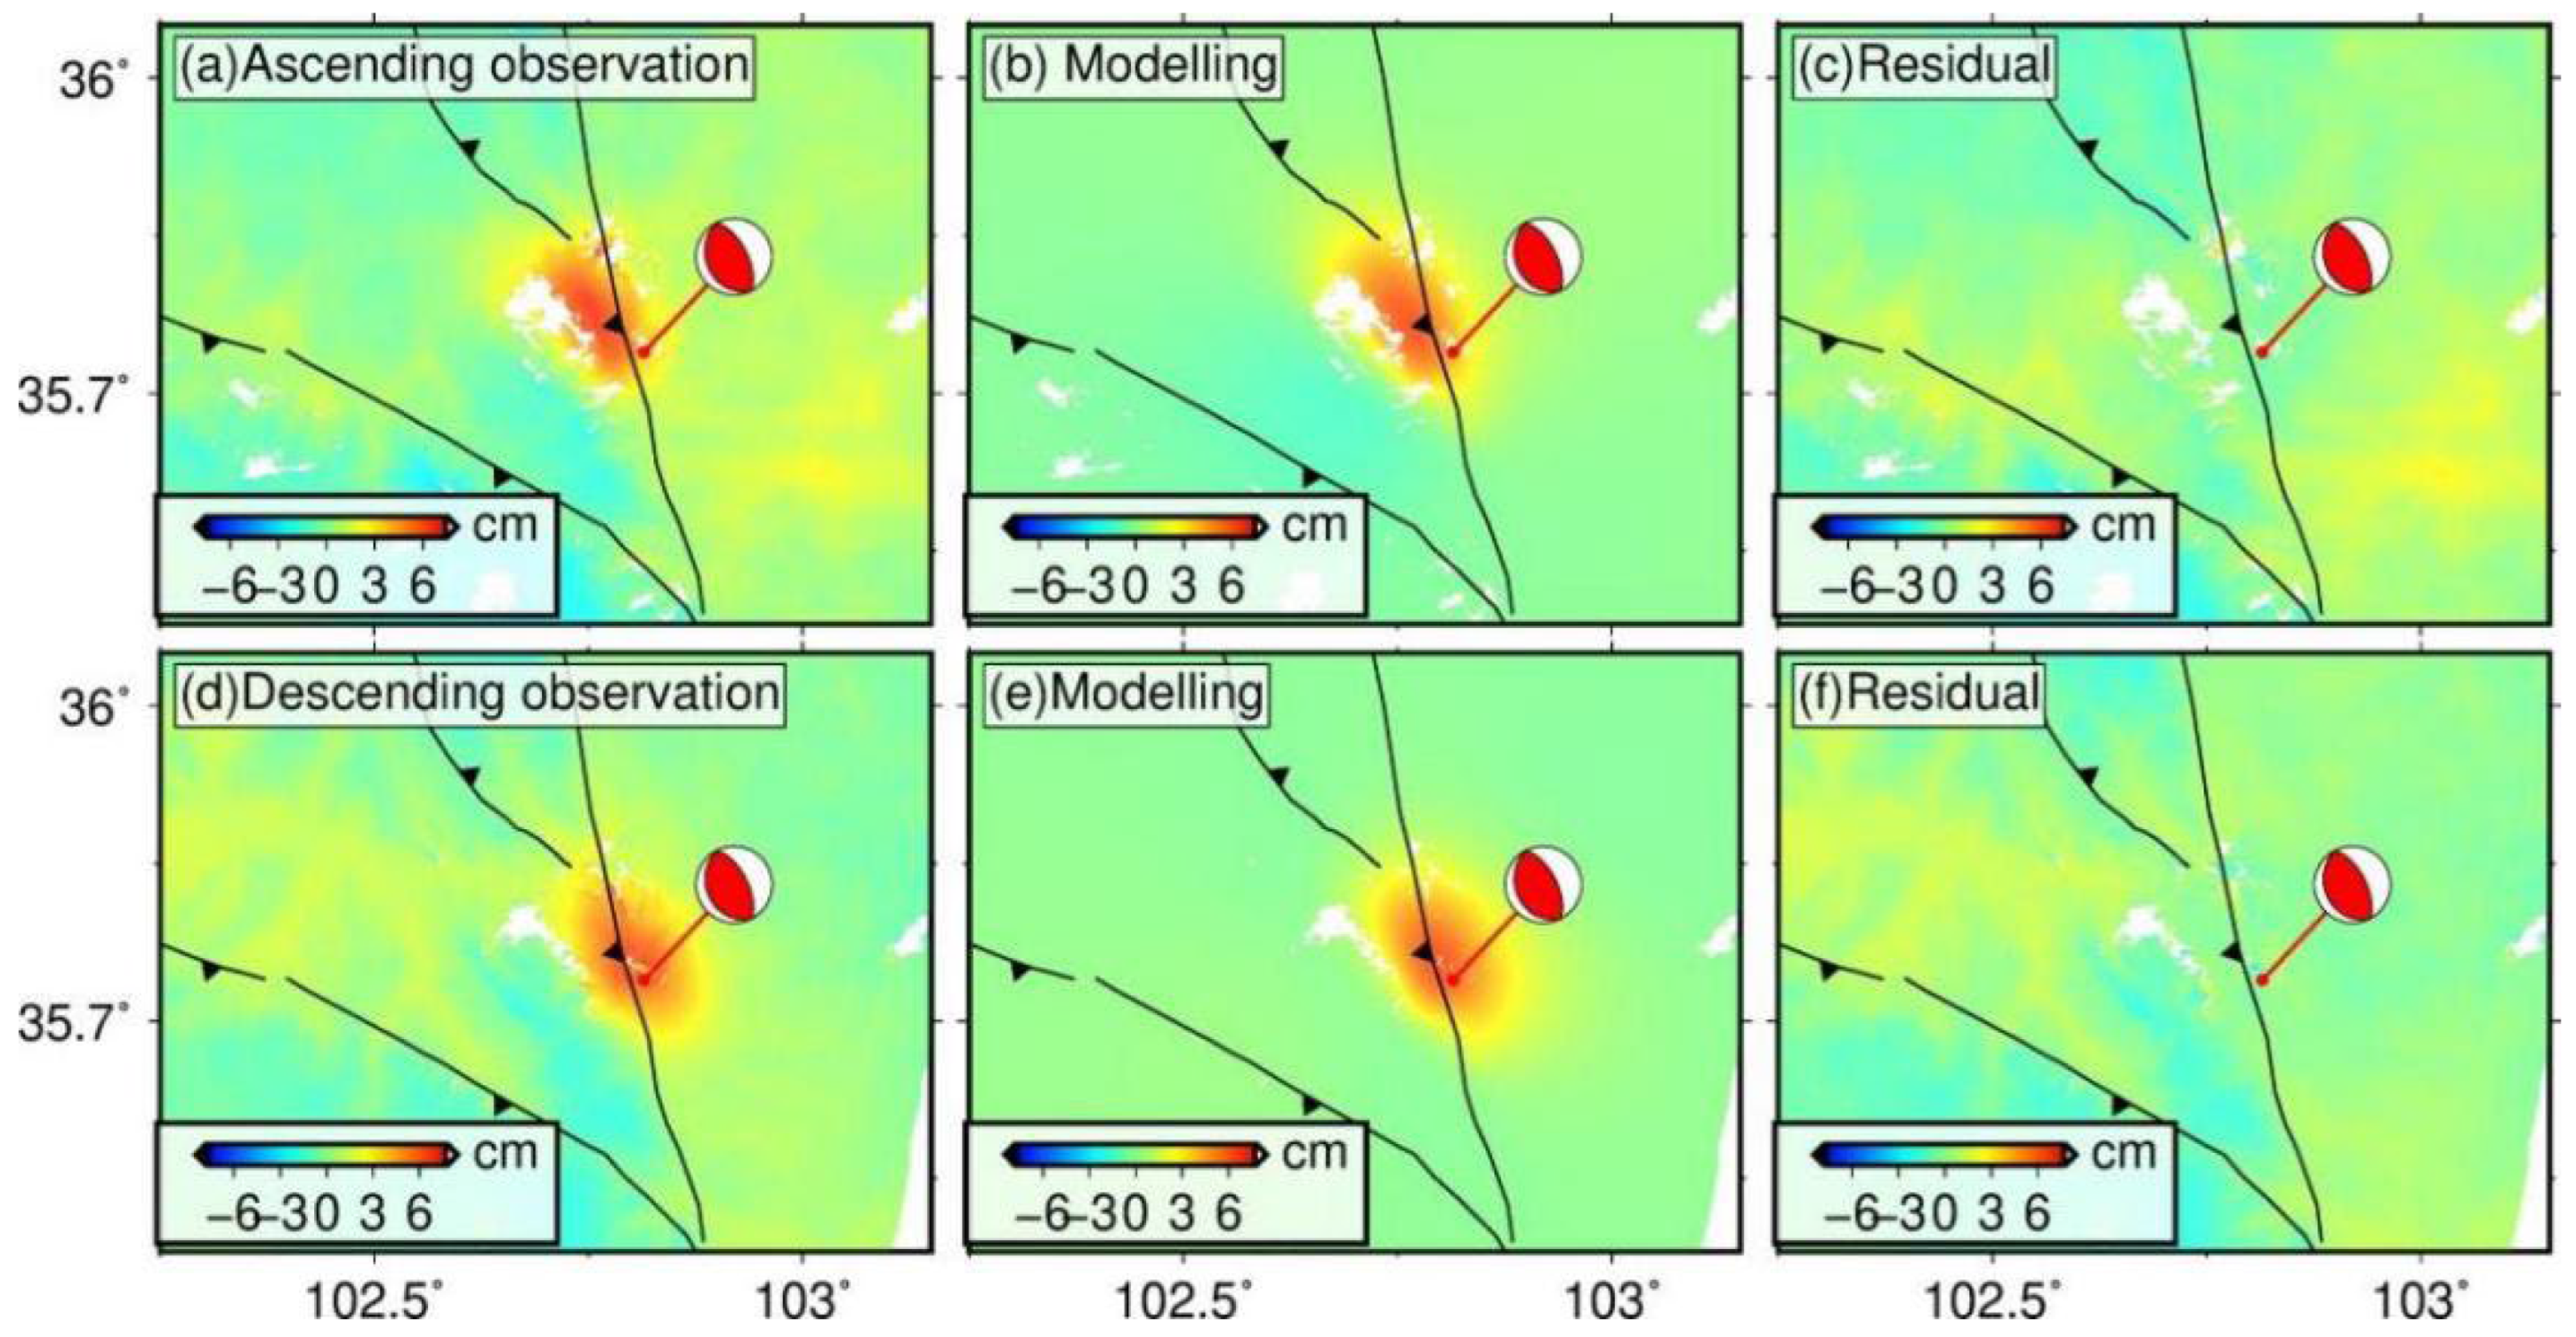
The slip distribution results presented in Figure 7 indicate that the faulting primarily involved reverse faulting, with minor left-lateral strike–slip components. The rupture depths varied from 5.7 km to 15.03 km, exhibiting a maximum slip of 0.47 m at a depth of 9.6 km, which closely aligns with the tensor solution derived from teleseismic moment data. The moment magnitude of the earthquake, calculated based on the northeast-dipping coseismic sliding distribution model, is estimated to be 1.69 × 10⁸ N·m, corresponding to a moment magnitude (MW) of 6.1. The results of the forward simulation regarding sliding distribution (Figure 8) demonstrate a high degree of consistency between simulated displacements and observed data. The root mean square residuals for both ascending and descending rails fall within the range of observational errors, measuring 7 mm and 8 mm, respectively. However, some residuals remain present in regions characterized by local deformation; these may be attributed to errors arising from near-field incoherence during the unwrapping process as well as post-earthquake deformation effects. Furthermore, when comparing coseismic deformation data obtained from ascending and descending InSAR observations with model simulation results, a millimeter-level root mean square difference is evident. This value is an order of magnitude lower than the centimeter-level deformation values obtained from InSAR observations, underscoring the high consistency between the simulation results and the actual observational data. It is clear that the developed model accurately captures the characteristics of earthquake deformation while maintaining its error within an acceptable minimum range. This provides a robust quantitative basis for assessing both the reliability and stability of the model at a data level—thereby strongly supporting further investigations into subsequent earthquake rupture processes and structural dynamics mechanisms.

5. Discussion

5.1. Comparison with Existing Coseismic Models

Constructing an accurate model of coseismic slip distribution is essential for elucidating the mechanisms underlying earthquake occurrences. This endeavor encompasses understanding the processes involved in fault rupture, the nature of energy release, and the spatial heterogeneity inherent in slip distribution. Concurrently, this methodology can visually illustrate the distribution of residual stresses within the fault zone, providing a crucial reference for assessing both the location and intensity of aftershocks. Furthermore, it possesses the capacity to identify adjacent faults that may be activated by the main earthquake, thereby offering scientific support for evaluating potential earthquake risks [35,40,41,42,43,44]. The current model for coseismic sliding distribution primarily relies on surface displacement observation data—such as GPS and InSAR—collected before and after earthquakes, seismic waveform records, and geological evidence to reconstruct earthquake processes. These models typically integrate multiple data sources and technological approaches; their accuracy and credibility are largely contingent upon the quality and comprehensiveness of input data. To enhance precision and reliability in these models, researchers frequently employ multidisciplinary methodologies that incorporate remote sensing technologies (such as InSAR), seismological analyses, and numerical simulations to construct and validate their findings.
In the investigation of the Jishishan earthquake, Yang et al. [4] reported deformations of 7.5 cm and 7.7 cm derived from Sentinel-1A ascending and descending data, respectively. Utilizing a similar methodology, Liu et al. [2] recorded deformations of 6.5 cm and 7.2 cm from the ascending and descending datasets, respectively. This article integrates Sentinel-1A ascending and descending orbit data with ALOS-2 ascending orbit data for a comprehensive analysis. The maximum deformation identified from the Sentinel-1A ascending orbit data is 7.5 cm, while the maximum deformation obtained from descending orbit data is 7.7 cm. The findings presented in this study are consistent with those reported by Yang et al. [4] and Gao et al. [8]. Furthermore, the L-band data from ALOS-2 significantly enhance phase consistency in areas characterized by vegetation coverage due to their superior penetration capabilities; notably, the maximum deformation observed from its ascending orbit data reaches 10 cm. This multi-band cooperative observation has successfully achieved a robust three-dimensional displacement vector decomposition process. Compared to single-sensor schemes, the quantization accuracy of vertical motion has been enhanced by approximately 18% to 22%. The coseismic deformation field presented in this study is largely consistent with the findings of Yang et al. [4], as both exhibit an approximately elliptical shape concentrated between the northern and southern edges of Lajishan. In comparison to the research findings of Liu et al. [2], while the characteristics of deformation distribution are similar, notable discrepancies exist in the deformation results, particularly concerning the orbit-rising deformation outcomes. This variation can primarily be attributed to the comprehensive integration of Sentinel-1A ascending and descending data alongside the ALOS-2 ascending data utilized in this study. The broader data coverage and enhanced resolution significantly contribute to improving both the accuracy and reliability of the deformation results. In their inversion of the slip model for the 2023 Mw 6.2 Jishishan earthquake, Liu et al. [2] employed two sets of nodal planes provided by the USGS to perform a constrained inversion. The geometric parameters obtained indicated that the southwest dip angle was 38 degrees while the northeast dip angle was 62 degrees. However, it is noteworthy that the dip angle associated with eastward-dipping models was significantly lower than those reported by USGS, GCMT, and in this study. Additionally, the sliding angle derived from this analysis was considerably higher than those reported by the USGS, GCMT, and in this paper. In contrast, the parameters obtained in this study demonstrate strong consistency with the results from GCMT analysis. Yang et al. [4] reported a northeast dip of 56° and a southwest dip of 43°. Fang et al. [7], utilizing only Sentinel-1A ascending and descending orbit data for differential interferometry processing, successfully derived the geometric parameters of the fault through a free search approach. The results indicate that the fault model exhibits a northeast dip with an angle of 32.2°. In contrast to previous studies, this paper innovatively integrates Sentinel-1A satellite imagery with ALOS-2 satellite imagery, thereby overcoming the limitations associated with relying on a single data source and constructing a more precise earthquake-causing fault model. This model not only significantly enhances the accuracy in interpreting fault geometric parameters but also provides a more accurate representation of the complex bending characteristics of the earthquake rupture surface. Such advancements offer a robust theoretical foundation for gaining deeper insights into the earthquake rupture process, the mechanisms of fault interactions, and regional earthquake risk assessment. Among various models related to the Jishishan earthquake, notable differences are observed in peak slip values and their corresponding locations. Liu’s research [2] indicates that the primary sliding fracture depths predominantly occur between 7 and 12 km, with a maximum slip reaching 0.6 m at a depth of 9.3 km. Conversely, the inversion results from Yang’s southwest-dipping fault model [4] reveal that sliding fracture depths primarily range from 7.2 to 12.2 km, with a maximum slip of 0.82 m occurring at a depth of 9.7 km. Additionally, the inversion results for the northeast-dipping fault model indicate that sliding fracture depths primarily span from 5.6 to 16.1 km, featuring a maximum slip measuring up to 0.66 m occurring at a depth of 10.9 km. Overall, both models are characterized by thrust movement accompanied by minor sinistral strike–slip components; this suggests that both faults exhibit an orientation consistent with northeast dipping characteristics. The study conducted by Fang et al. [7] indicates that the depth of sliding rupture predominantly occurs between 5 and 20 km, with an approximate length of 12.96 km and a width of about 7.96 km. The average displacement is measured at 0.2 m, primarily characterized by reverse motion, while also exhibiting a minor right-lateral strike–slip component. Furthermore, the findings presented by Gao et al. [8] reveal that the depth of sliding fractures mainly ranges from 7 to 15 km, with maximum displacement reaching up to 0.55 m at a depth of 10.41 km. These results are consistent with those reported by the USGS and GCMT. Sun et al. [10] reported that the sliding fracture depth predominantly occurs within the range of 2.5 to 7.5 km, with maximum sliding displacement observed as 0.56 m at a depth of 5 km. It is noteworthy that numerous secondary faults exist within the depth interval of 10 to 20 km, exhibiting slip values approximately between 20 and 30 cm. The inversion results from this study indicate that fault rupture is primarily characterized by reverse motion accompanied by a minor left-lateral slip component. Additionally, the sliding rupture depth mainly spans from 5.7 to 15.03 km, with the maximum sliding displacement reaching up to 0.47 m at a depth of approximately 9.6 km. There are significant differences between the research conducted by Fang et al. [7] and the present study concerning fault movement modes. These discrepancies may stem from the differing weight parameters assigned in seismic waveform inversion compared to those utilized in large dislocation models. Furthermore, during the analysis of individual sensors, incoherent phenomena induced by vegetation and the varying sensitivities of different data types to fault strike may also contribute to these observed differences. Additionally, when Fang et al. [7] inverted their fault model, they employed a grid size of 2 km × 2 km. In contrast, this study utilized a finer grid resolution of 1 km × 1 km to enhance our understanding of shallow crustal features, thereby providing a clearer and more detailed representation of the distribution characteristics associated with fault sliding. The methodology presented herein demonstrates that integrating multi-source and high-resolution SAR data can effectively reduce potential uncertainties during the inversion process for individual datasets. Comprehensive research conducted by various teams on the 2023 Jishishan earthquake has revealed that despite methodological variations and parameter setting discrepancies arising from complex geological conditions and data limitations, the key findings such as kinematic properties and rupture patterns remain consistent. All research outcomes clearly indicate that the Jishishan earthquake was predominantly characterized by thrust mechanisms, with a minor strike–slip component, and did not result in surface rupture propagation. The slip distribution within the shallow layer of the upper crust (depth ≤ 20 km) exhibits a notable concentration, with peak slip values ranging from 0.47 to 0.66 m, primarily occurring at depths between 9 and 13 km. This pattern corresponds to the spatial distribution of maximum fault seismogenic intensity. Differences in slip geometry and magnitude primarily arise from the sensitivity of sub-fault discretization at grid resolutions ranging from 1 km2 to 4 km2, as well as limitations in information completeness associated with single-satellite data. The integration of multi-source satellite data—amalgamating observations across various bands and viewing geometries—provides more comprehensive constraints on fault slip characteristics. Of particular significance is the observation that no evident surface rupture was detected during this earthquake. The sliding observed in the middle portion of the Earth’s crust exhibited localized characteristics, suggesting a potential decoupling between depth of occurrence and shallow structural features. This phenomenon represents a typical manifestation of a blind thrust system within continental collision zones.

5.2. Analysis of Seismic Faults and Regional Tectonics

Accurate characterization of the geometric shape of faults associated with earthquakes is crucial for assessing regional seismic risk and understanding active tectonic processes. Through comprehensive geological surveys and geophysical inversion analyses, the 2023 Jishishan earthquake has been identified as a concealed thrust-type event, occurring at a depth of 4.9 km with a fault plane dip angle of 50°. The LJSF exhibits several preconditions conducive to earthquake genesis, including a high rate of seismic moment release, localization of crustal strain, and concentration of tectonic stress along its northeast compressive arc. Notably, weak seismic activity is densely distributed at the northeastern terminus of the Lajishan fault. This observation indicates that this region experiences elevated levels of compression due to regional northeast-directed stress and represents an area characterized by significant tectonic stress concentration, thereby becoming a focal point for energy accumulation. The integration of historical seismicity and contemporary aftershocks confirms that this region operates as a persistent energy accumulation zone. The kinematic characteristics observed in this area are consistent with the recurrence patterns of historical earthquakes along the LJSF. Earthquake events in this region, primarily driven by thrust fault activities, periodically release accumulated strain through crustal detachment processes. The lack of surface rupture, coupled with the release of seismic moments at depths ranging from 5.70 to 15.03 km, indicates a decoupling between the seismogenic basement and shallow sediments. This phenomenon is a characteristic feature of blind reverse fault systems found in continental collision zones. The evolution of fault cliffs from the Pleistocene to the Holocene, alongside strain models derived from global positioning system data, further corroborates the continuous accumulation of stress within the arc transition zone. This evidence substantiates the inevitability of an earthquake occurring in Jishishan. Under the influence of principal compressive stress trending NEE, structural deformation in Lajishan and its eastern regions is characterized by clockwise rotation and extrusion towards the southeast. This process has led to the formation of a compression zone or fold–thrust fault zone at the terminus of the strike–slip faults [45]. From a structural perspective, both geometry and sliding behavior reveal significant similarities among several faults: namely, the Nanshan fault in Qinghai, the western section of the LJSF, and the XLNF. Based on this observation, if we consider the Qinghai South Mountain Fault and the LJSF as components of a unified fault system, the eastern terminus of this fault can be identified as a transitional area. This region features a step-like zone [7] that spans approximately 50 to 80 km in length, corresponding to the eastern segment of the LJSF. The unique tectonic and mechanical characteristics of this terrace region render it a hotspot for seismic activity. In this area, fault slip is more likely to become locked due to geometric distortions, thereby facilitating the nucleation and occurrence of earthquakes. The 2023 Jishishan earthquake occurred in the eastern Qilian Mountains, situated at a critical tectonic transition between two major active faults. The eastern LJSF plays an essential role in regional tectonics by enabling left-lateral strike–slip motion between the western LJSF–Qinghai South Mountain Fault and the XLNF. As a distinctive cascade region, its intricate geological conditions and unique stress environment collaboratively foster both the development and occurrence of seismic activities. Furthermore, through observation and analysis, it has been determined that the northeast-dipping fault associated with this earthquake is located several kilometers away from the eastern branch of the northern margin fault of Lajishan. Instead, it aligns more closely with the fault orientation observed along the southern margin of Lajishan. This spatial relationship and characteristic trend suggest that the seismogenic fault responsible for the Jishishan earthquake is likely a concealed branch of the fault system located in the southern margin of Lajishan which has not yet been fully recognized. The distinctiveness of seismogenesis in this region can be primarily attributed to the distortion of the stress field, arising from the structural discontinuity between the northeast-dipping thrust fault system and the eastern branch fault zone situated along the northern margin of Lajishan. Additionally, it is influenced by the development of a secondary fault network on the southern margin of Lajishan. Under NW-SE principal compressive stress, faults in this area have evolved into a strike–slip–thrust transition zone. This geological configuration has led to differential strain accumulation across different regions. Due to the complex structural characteristics within this fault zone, stress accumulates gradually in various sections, contributing to heightened seismic activity throughout this region. Specifically, both the LJSF and its associated secondary fracture network collectively form a “hotspot” area for seismic activity. Within these intricate faults and tectonic units, processes related to stress transfer and energy accumulation exhibit distinctly non-uniform characteristics. Furthermore, such stress and energy tend to concentrate in specific areas. This concentration phenomenon becomes particularly pronounced when influenced by factors such as the distortion and deformation of fault geometry. In this context, smaller stress disturbances may induce greater seismic activity at critical points. The precise location analysis of the aftershock sequence (Figure 6) reveals that aftershocks are predominantly distributed to the north of the main earthquake event. This distribution suggests that coseismic fractures may propagate from the southeast to the northwest along a northwest-trending fault. Such findings provide compelling evidence for the existence of a northeast-dipping seismogenic fault. Near the surface trace of this northeast-dipping earthquake fault, both ascending and descending coseismic interferograms exhibit a certain degree of decorrelation, likely attributed to surface rupture as reported by seismic institutions. Furthermore, aftershock data indicate the presence of an NEE-dipping branch fault located west of the main reverse fault. This feature may represent a back-thrust fault resulting from compression and contraction experienced by the hanging wall during its reverse movement toward the basin. Based on these research findings and geological data, it can be inferred that a blind thrust fault exists within shallow depth ranges in the southern section of the LJSF. This fault has not been previously surveyed and mapped, and evidence indicates that it has experienced fracturing and nucleation. This discovery highlights the fact that the complexity of the underground structure in this area significantly surpasses prior expectations. The LJSF is characterized by frequent geological activities, extensive historical earthquake records, a complex regional tectonic stress state, variable modes of fault activity, and notable features of seismic activity. These interrelated factors create numerous conditions conducive to the occurrence of moderate to strong earthquakes; therefore, the potential for such seismic events should not be underestimated. If the northeast-dipping earthquake fault is ultimately identified as responsible for the Jishishan earthquake, it is highly probable that it represents a blind earthquake accessory structure located along the southern side of the LJSF. This inference suggests that at depth, the LJSF exhibits complex structural forms and possesses significant potential for seismic activity. Consequently, future efforts should prioritize close monitoring and in-depth research in this area to enhance our capacity to mitigate the risks associated with earthquake disasters.

5.3. Evaluation of Regional Seismic Risk

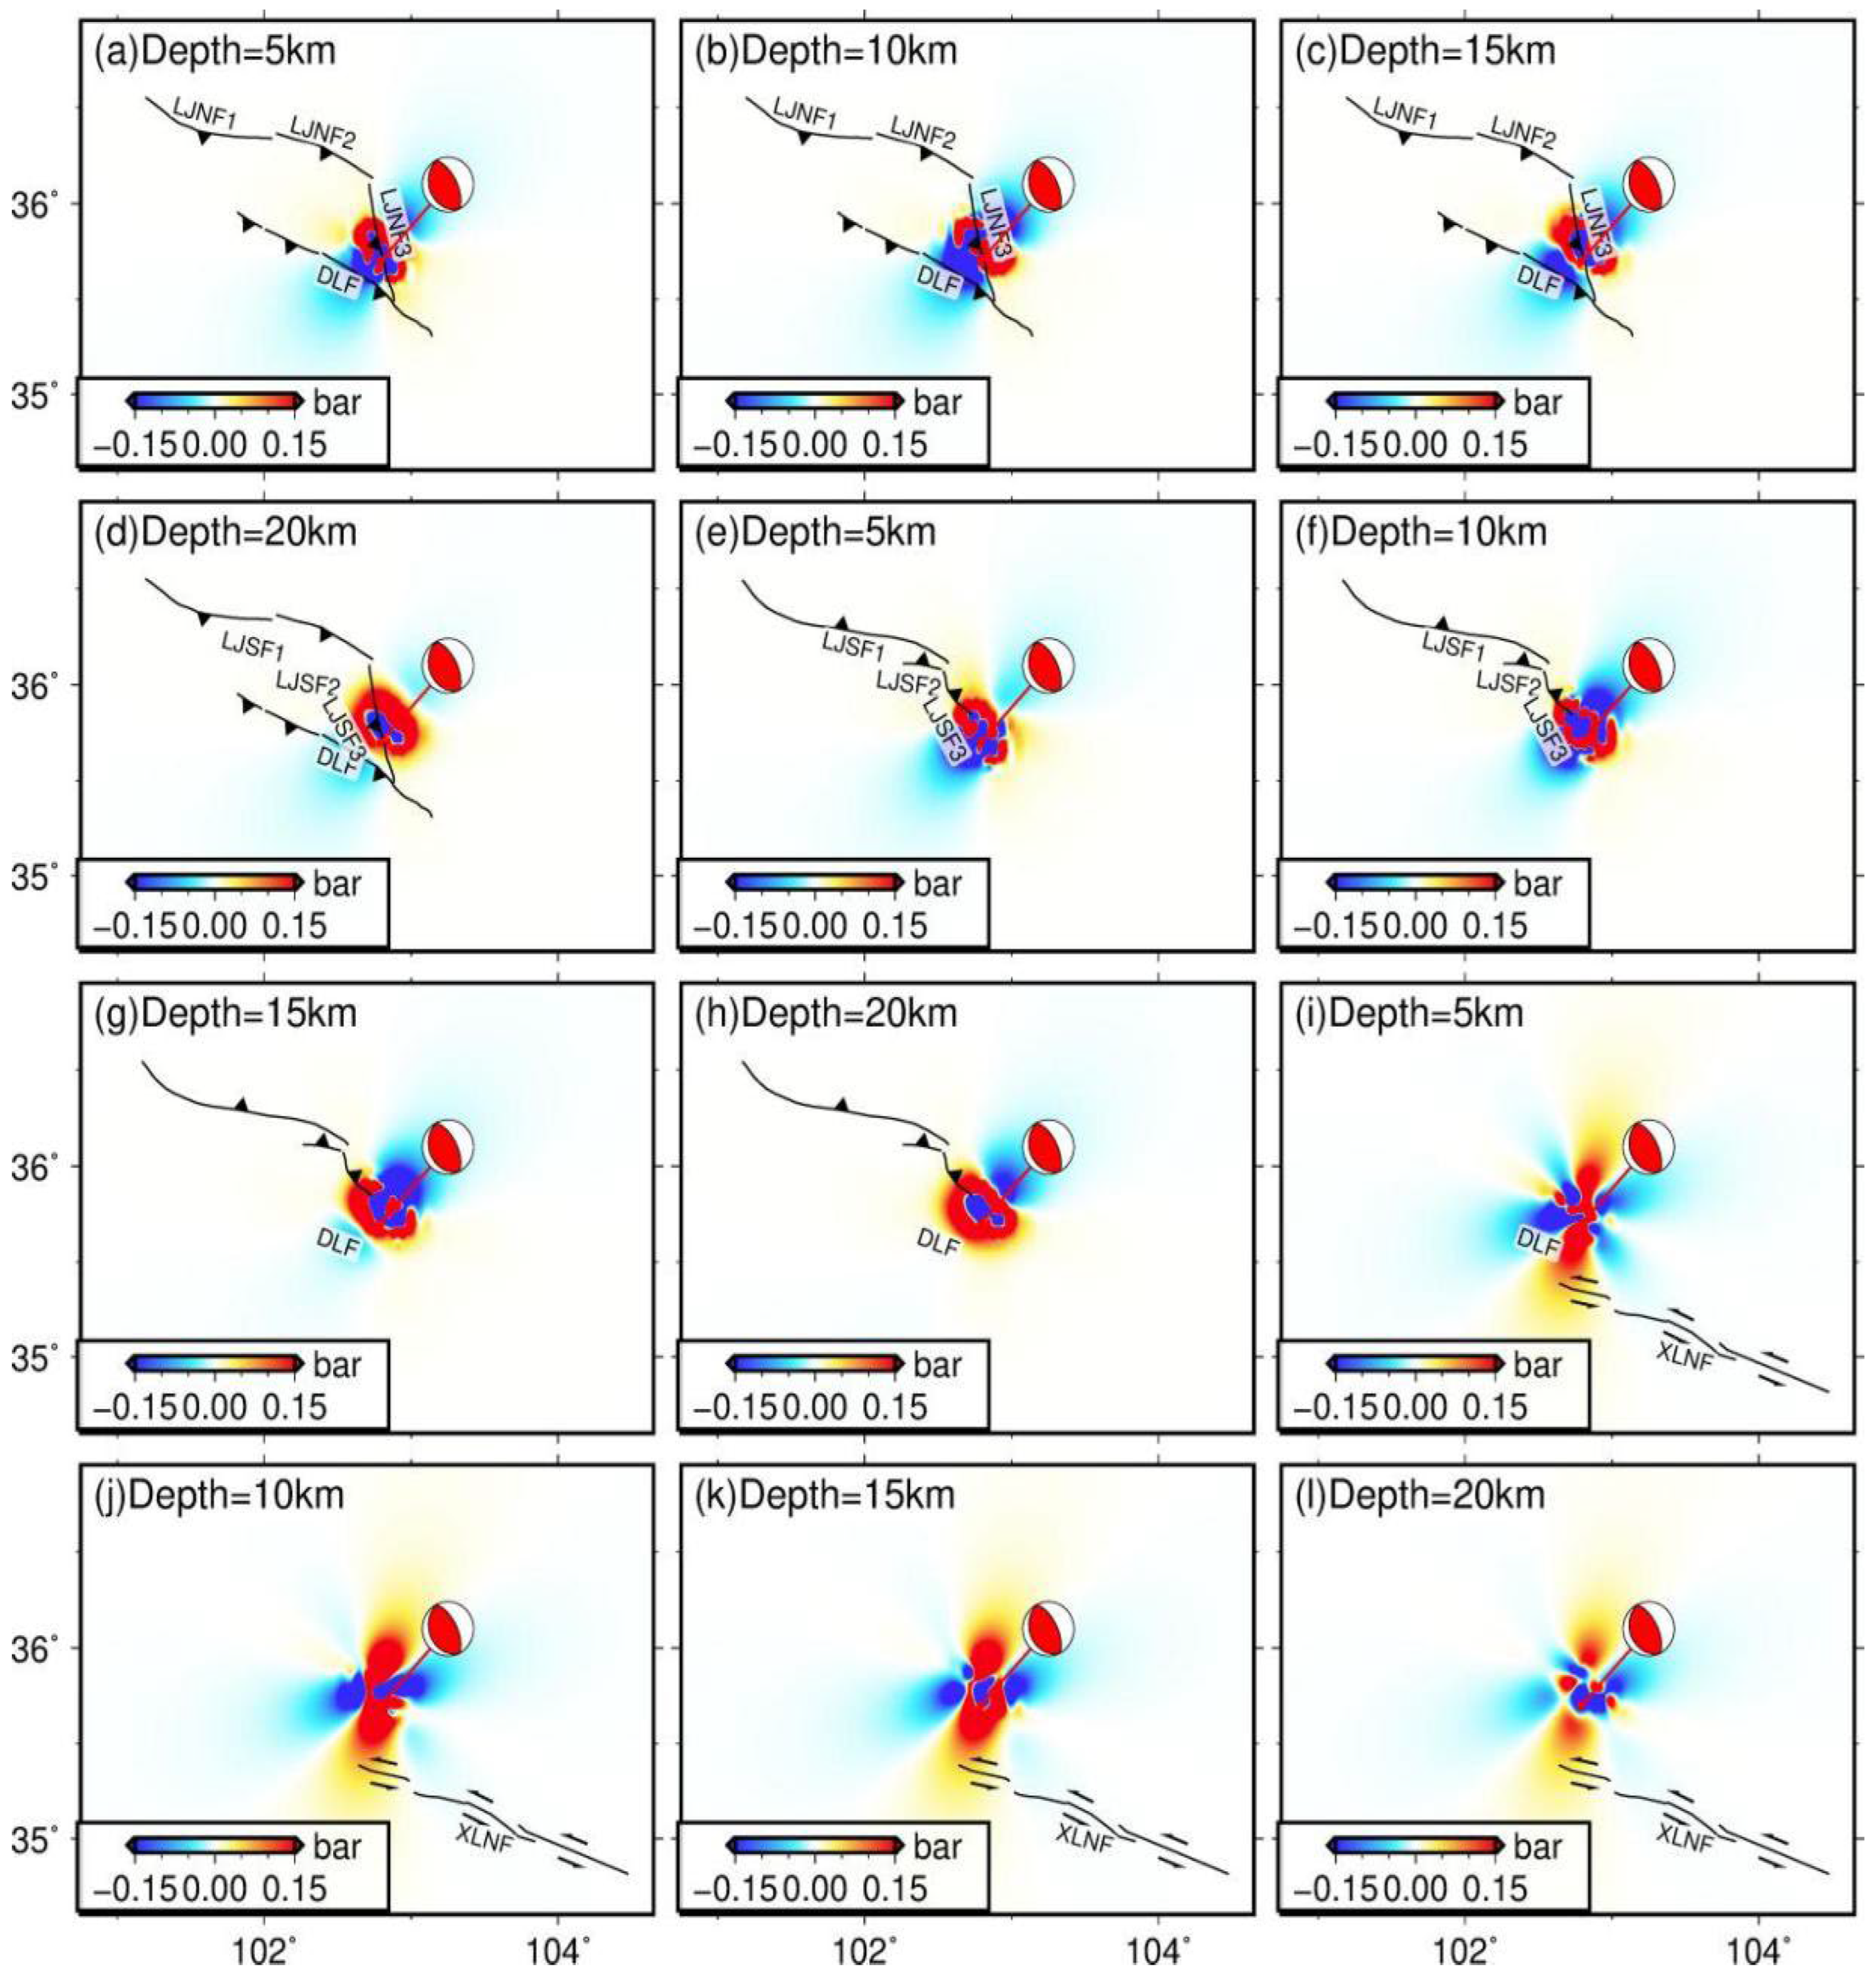
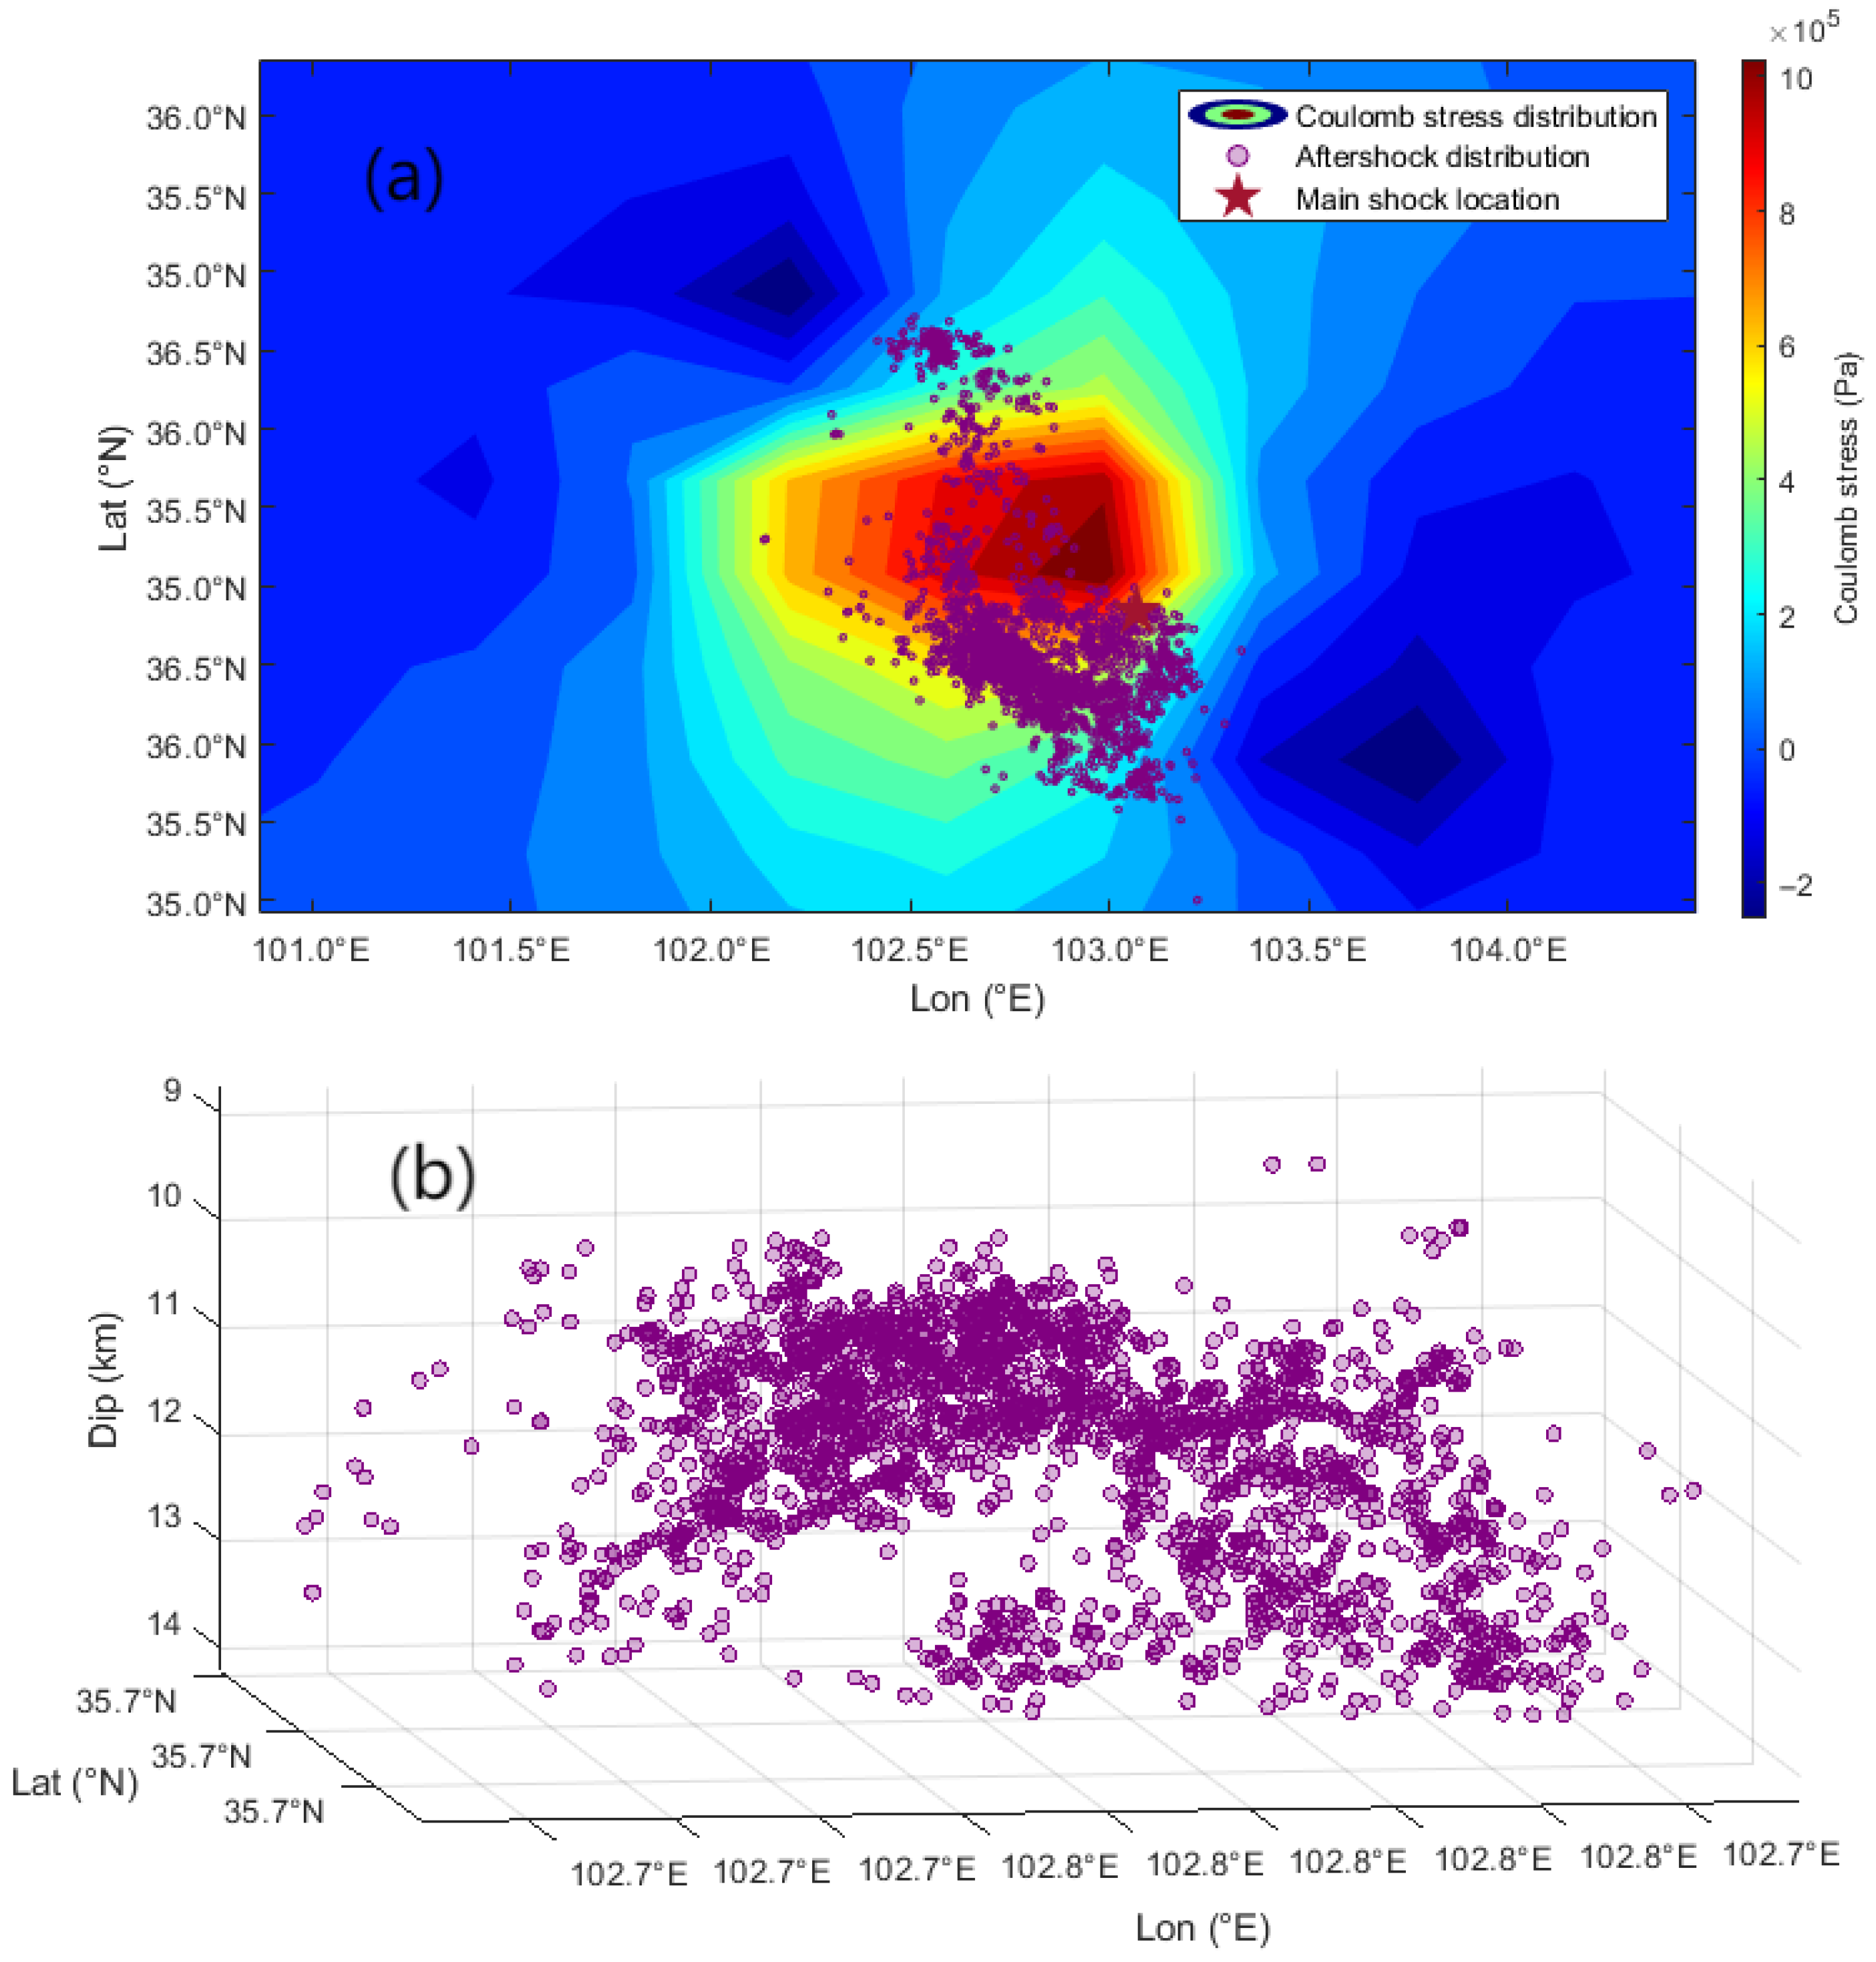
The coseismic slip associated with moderate-strength earthquakes can trigger a significant reorganization of the regional crustal stress field. This reorganization, in turn, influences adjacent fault systems through interactions among faults, the distribution of stress governed by sliding vectors, and various triggering effects [46]. In contemporary seismic tectonics research, the analysis of Coulomb fracture stress (CFS) tensors has emerged as a fundamental method for quantifying the multi-period stress transfer processes [47,48,49]. This approach integrates anelastic static disturbance models, rate-and-state friction laws, and Bayesian probability assessments of cascade rupture risk. It establishes a relationship between short-term stress disturbances and long-term strain accumulation models, thereby enabling accurate evaluation of interactions between faults and their dynamic behaviors. Particularly within the collision environments of orogenic belts, this method effectively identifies coupled fault segments exhibiting stress accumulation that exceeds the crustal strength threshold. Consequently, it facilitates more precise predictions of potential seismic activity and enhances the evaluation of deformation and activity patterns in fault systems across various time scales. The robust predictive capability of this method stems from its integration of both short-term stress disturbances and the long-term dynamics of strain accumulation. This approach effectively bridges the time scales from coseismic deformation to tectonic load cycles during the processes of stress accumulation and deformation, thereby enhancing our understanding and predictive accuracy regarding seismic activity. Particularly in the context of multiple interacting faults, this analysis elucidates more complex seismic dynamic characteristics. The Jishishan earthquake of 2023 exemplified this phenomenon, as the asymmetric distribution of the epicenter and aftershocks vividly illustrate the intricate interactions between the deep basement and shallow crust within the region. The adjustment of the stress field in this area is primarily influenced by northeast-directed compressive stresses resulting from the oblique convergence of Indian and Eurasian plates. This concentration of stress occurs between the Riyueshan fault zone and the XLNF. The convergence of tectonic plates coupled with stress accumulation has intensified interactions among various faults in this region, gradually establishing a seismic genetic framework that facilitates the triggering of multiple fault interactions. Within this framework, stress accumulates continuously in a gradual manner, ultimately leading to slippage within the deep basement [50,51]. Regarding the focal depth associated with the 2023 Jishishan earthquake, different institutions have reported varying results. The United States Geological Survey (USGS) indicated a focal depth of 10 km; conversely, Global Centroid Moment Tensor (GCMT) reported a focal depth of 18.9 km. To investigate how different seismic sources influence Coulomb fracture stress and assess fault states at varying depths, this study conducted comparative calculations and analyses concerning Coulomb stress across these differing depths. This study employed a northeast-dipping coseismic slip distribution model derived from InSAR inversion as the input model. The PSGRN/PSCMP program [50] was utilized with a friction coefficient of 0.4 [51] to calculate and evaluate the impact of this earthquake on the stress disturbance experienced by adjacent faults. The research quantified changes in Coulomb stress within a depth range of 5 to 20 km and assessed the triggering effects on neighboring faults, emphasizing their sensitivity to critical stress disturbances. The results are presented in Figure 9. Through three-dimensional spatial correlation analysis of high-precision aftershock positioning data, a joint constraint model integrating both the stress field and aftershock distribution was developed (Figure 10). This model elucidates the motion characteristics of deep fault systems and further clarifies the multi-scale fracture behavior and strain distribution mechanisms associated with seismogenic faults. Figure 9 demonstrates that the eastern branch of the northern margin of the Lajishan fault is undergoing stress loading at various depths, with its epicenter also exhibiting an increased state of stress. The stress distribution within the middle and northern sections of the eastern branch (LJNF3) exhibits an upward trend, with recorded stress values of 0.21 bar, 0.24 bar, and 0.30 bar at depths of 5 km, 10 km, and 15 km, respectively. In contrast, the southern section of this eastern branch along the southern margin fault (LJSF3) situated within the same tectonic belt displays distinct characteristics; here, stress values were measured at 0.12 bar, 0.23 bar, and 0.21 bar at depths of 5 km, 10 km, and 20 km, respectively. This pattern reflects typical features associated with earthquake-locked areas. However, the Daotanghe–Linxia fault system demonstrates notable characteristics of stress release. Specifically, stress values of −0.14 bar, −0.25 bar, and −0.26 bar have been recorded at depths of 5 km, 15 km, and 20 km in its southern section, respectively. Concurrently, the westernmost segment of the XLNF is characterized by a state of stress loading; measured stress values are reported as follows: 0.09 bar at a depth of 10 km, followed by measurements of 0.06 bar and 0.07 bar at depths of both 15km and 20km, respectively. The earthquake led to a substantial unloading of Coulomb stress in specific regions along both the southern and northern margins of Lajishan. Notably, the maximum reductions in Coulomb stress observed for the faults situated at the southern margin of Lajishan were -0.11 bar, while the faults at the northern margin experienced reductions of −0.22 bar. The Jishishan earthquake reduced the critical degree of horizontal differential stress, effectively alleviating strain accumulation along the near-end fault. Concurrently, this seismic event triggered a complex process of stress redistribution that significantly altered the regional stress state. As illustrated in Figure 10, following the Jishishan earthquake, aftershocks exhibited a trend of arrangement along an NNW direction. In this context, utilizing Coulomb stress transmission pathways facilitated interconnections among newly formed fault zones. It is important to note that the stress release associated with this earthquake was not complete and was accompanied by a gradual process of stress redistribution. This particular state of stress creates highly favorable conditions for subsequent delayed rupture, which may be initiated by residual slip adjustment mechanisms or activation through secondary faults. The area of aftershock distribution is located adjacent to the southern edge of the LJSF and spatially overlaps with regions experiencing Coulomb stress loading, suggesting that potential secondary faults may have partially modulated the release of coseismic stress through seismic creep. Research indicates that when Coulomb stress exceeds the threshold of 0.1 bar, it can significantly enhance the likelihood of earthquake triggering [52]. Consequently, the seismic risk associated with four key areas—specifically, the southern section of the eastern branch of the LJSF, the northern part of the eastern branch of the LJSF, the northern part of the eastern branch of the LJSF, the fault along the northern edge of the XLNF, and the Dongdaotanghe–Linxia fault zone in proximity to the epicenter—continues to escalate. These regions are characterized by critical stress loading states that intersect with historical earthquake zones. Furthermore, an analysis of aftershock spatial distribution suggests that seismogenic structures may be influenced by concealed transition faults. Additionally, it is posited that viscoelastic relaxation processes could further affect long-term stress evolution within these fault systems.

6. Conclusions

This study presents an investigation into the surface deformation and seismogenic structural characteristics of the 2023 Jishishan Mw 6.2 earthquake. Focusing on the core scientific issue of the unclear seismogenic fault, we obtained a high-precision coseismic interferogram of the earthquake by integrating high-spatial resolution data from Sentinel-1A and ALOS-2 satellites. This interferogram served as a constraint for inversion analysis to derive both the geometric parameters and coseismic slip distribution of the seismogenic fault. Through a comprehensive analysis of the inversion results, aftershock sequences, regional fault structural characteristics, and coseismic interferograms, we determined that rupture associated with this earthquake occurred along a northeast-dipping seismogenic fault, belonging to a concealed branch fault located at the southern edge of the LJSF. The coseismic slip rupture depth predominantly ranged from 5.70 to 15.03 km, with a maximum slip of 0.47 m at a depth of 9.60 km. The seismic moment was calculated to be 1.69 × 10¹⁸ N·m, which corresponds to a moment magnitude MW 6.1. The results from the Coulomb stress distribution model indicate significant stress loading in the middle section of the eastern branch of the northern margin fault of the LJSF, as well as in the southern section of the eastern branch fault associated with the southern margin fault and in the western section of the XLNF. These findings suggest that these structural sections are linked to a heightened risk of earthquake rupture.

Author Contributions

Conceptualization, K.M. and J.Y.; methodology, J.Y. and Y.L.; validation, J.Y. and Y.L.; formal analysis, Q.H.; investigation, J.Y. and Y.L.; data curation, J.Y. and L.W.; writing—original draft preparation, Y.L.; writing—review and editing, K.M. and J.Y.; visualization, Q.H. and L.W.; supervision, K.M.; project administration, J.Y. and Q.H.; funding acquisition, Q.H. and L.W. All authors have read and agreed to the published version of the manuscript.

Funding

This research was supported by the National Key Research and Development Program of China (No. 2024YFC3212200), the Henan Science Foundation for Distinguished Young Scholars of China (No. 242300421041), and the Henan Provincial Science and Technology Research Project (No. 242102321123).

Data Availability Statement

The data used to support the findings of this study are available from the corresponding author upon request.

Acknowledgments

The authors would like to thank the website (https://search.asf.alaska.edu/) for providing the data used in this paper and the reviewers for their insightful comments.

Conflicts of Interest

The authors declare no conflicts of interest.

References

  1. Lu, S.M.; Wu, Z.H.; Li, Z.C. Seismic structure characteristics of the 18 December 2023 MW 6.2 Jishishan earthquake, Gansu Province. Prog. Earthq. Sci. 2024, 54, 86–93. [Google Scholar]
  2. Liu, Z.J.; Han, B.G.; Nai, Y.H.; Li, Z.H.; Yu, C.; Song, C. Source parameters and slip distribution of the 2023 MW 6.0 Jishishan (Gansu, China) earthquake constrained by InSAR observations. Geomat. Inf. Sci. Wuhan Univ. 2025, 50, 344–355. [Google Scholar]
  3. Yang, Y.M.; Su, S.J. The 2023 Jishishan MS 6.2 earthquake in Gansu Province, China: A shallow strong earthquake with thrust-dominated components. Earthquake 2024, 44, 167–174. [Google Scholar]
  4. Yang, J.Y.; Wen, Y.M.; Xu, C.J. Seismogenic fault Structure of the 2023 Jishishan (Gansu) MS 6.2 earthquake revealed by InSAR observations. Geomat. Inf. Sci. Wuhan Univ. 2025, 50, 313–321. [Google Scholar]
  5. Yang, P.X.; Xlong, R.W.; Hu, C.Z. Preliminary analysis of the seismogenic tectonics for the 2023 Jishishan MS 6.2 earthquake in Gansu Province. Earthquake 2024, 44, 153–159. [Google Scholar]
  6. Wang, Y.S.; Zhao, B.; Ji, F. Preliminary insights into the hazards triggered by the 2023 Jishishan MS 6.2 earthquake in Gansu Province. J. Chengdu Univ. Technol. (Sci. Technol. Ed.) 2024, 51, 1–8. [Google Scholar]
  7. Fang, N.; Sun, K.; Huang, C.C.; Bai, C.Y.; Chen, Z.D.; Xie, L.; Yang, Z.; Xu, Y.H.; Xie, H.B.; Feng, G.C.; et al. Joint inversion of InSAR and seismic data for the kinematic rupture process of the 2023 MS 6.2 Jishishan Earthquake. Geomat. Inf. Sci. Wuhan Univ. 2025, 50, 333–343. [Google Scholar]
  8. Gao, J.N.; Zou, R.; Wang, J.X. Inversion of Coseismic Rupture Model and Deformation Time Series for the Jishishan, Gansu MS 6.2 Earthquake Using InSAR. J. Geod. Geodyn. 2025, 45, 177–183. [Google Scholar]
  9. Hua, S.B.; Xu, C.Y.; Zhou, J.C.; Xu, B.B.; Feng, W.P.; Zhang, Y.; Feng, L.H. Source characteristics and disaster mechanisms of the 2023 Gansu Jishishan MW 6.0 Earthquake. Chin. J. Geophys. 2024, 67, 2625–2636. [Google Scholar]
  10. Sun, Y.Q.; Qiu, X.P.; Chen, C.Y. GNSS and InSAR derived coseismic slip distribution of the 2023 Jishishan MS 6.2 earthquake. China Earthq. Eng. J. 2024, 46, 867–879. [Google Scholar]
  11. Wang, S.G.; Xu, G.Y.; Li, S.; Yang, T.; Shi, L.; Zhang, L.; Tang, F.T.; Fang, L.H. Analysis of earthquake sequence and seismogenic structure of the 2023 MS 6.2 Jishishan earthquake, Gansu Province, China. Acta Seismol. Sin. 2024, 46, 953–968. [Google Scholar]
  12. Zhang, W.T.; Ji, L.Y.; Chen, Y.X.; Liu, C.J.; Xu, J. Analysis of Crustal Deformation of the 2023 MS 6.2 Jishishan Earthquake in Gansu Province. Geomat. Inf. Sci. Wuhan Univ. 2025, 50, 391–403. [Google Scholar]
  13. Tian, X.; Zhang, Z. Bulk crustal properties in NE Tibet and their implications for deformation model. Gondwana Res. 2013, 24, 548–559. [Google Scholar] [CrossRef]
  14. Chen, J.F.; Lin, X.D.; He, X.S. Moment tensor inversion and seismogenic tectonics of the 2013 Minxian MS 6.6 earthquake in Gansu. China Earthq. Eng. J. 2013, 35, 425–431. [Google Scholar]
  15. Zheng, W.J.; Yuan, D.Y.; He, W.G. Geometric pattern and active tectonics in southeastern Gansu province, Discussion on seismogenic mechanism of the Minxian-Zhangxian MS 6.6 earthquake on July 22, 2013. Chin. J. Geophys. 2013, 56, 4058–4071. [Google Scholar]
  16. He, X.; Zhang, Y.; Shen, X.; Zhang, W.; Zhang, P.; Zhang, D. Examination of the repeatability of two MS 6.4 Menyuan earthquakes in Qilian-Haiyuan fault zone (NE Tibetan Plateau) based on source parameters. Phys. Earth Planet. Inter. 2020, 299, 106408. [Google Scholar] [CrossRef]
  17. Feng, W.P.; He, X.H.; Zhang, Y.P.; Fang, L.H. Seismic faults of the 2022 MW 6.6 Menyuan, Qinghai earthquake and their implication for the regional seismogenic structures. Chin Sci Bull. 2023, 68, 254–270. [Google Scholar] [CrossRef]
  18. Yang, J.Y.; Wen, Y.M.; Xu, C.J. The 21 May 2021 MS 6.4 Yangbi (Yunnan) earthquake: A shallow strike-slip event rupturing in a blind fault. Chin. J. Geophys. 2021, 64, 3101–3110. [Google Scholar]
  19. Yuan, D.Y.; Ge, W.P.; Chen, Z.W.; Li, C.Y.; Wang, Z.C.; Zhang, H.P.; Zhang, P.Z.; Zhang, D.W.; Zheng, W.J.; Craddock, W.H.; et al. The growth of northeastern Tibet and its relevance to large-scale continental geodynamics: A review of recent studies. Tectonics 2013, 32, 1358–1370. [Google Scholar] [CrossRef]
  20. Zhou, S.; Zhane, H.; Sun, Y. Numerical simulation of tectonic stress and strain rate fields in the northeastern margin of the Tibetan Plateau in association with major fault zones. Sci. China Earth Sci. 2023, 66, 2353–2367. [Google Scholar] [CrossRef]
  21. Yuan, D.Y. Tectonic Deformation Features and Space-time Evolution in Northeastern Margin of the Qinghai-Tibetan Plateau Since the Late Cenozoic Time; Institute of Geology, China Earthquake Administration: Beijing, China, 2003. [Google Scholar]
  22. Zhang, P.Z.; Zheng, D.W.; Yin, G.M. Discussion on late cenozoic growth and rise of northeastern margin of the Tibetan plateau. Quat. Sci. 2006, 26, 5–13. [Google Scholar]
  23. Li, Z.M.; Tian, Q.J.; Tu, H.W. Remote sensing characteristics of Lajishan fault. Plateau Earthq. Res. 2009, 21, 26–31. [Google Scholar]
  24. Yuan, D.Y.; Zhang, P.Z.; Lei, Z.S.; Liu, B.C.; Liu, X.L. A preliminary study on the new activity features of the Lajishan mountain fault zone in Qinghai Province. Earthq. Res. China 2005, 21, 93–102. [Google Scholar]
  25. Zhou, L.; Wang, Q.L.; Li, Z.J. The Study of Crustal Deformation on Western End of Lajishan Fault Based on GPS and Leveling Data. J. Geod. Geodyn. 2016, 36, 1056–1060. [Google Scholar]
  26. Li, Z.M.; Su, P.; Huang, S.T. Slip rates of the Riyue MT. fault at DeZhou segment since late pleistocene. Seismol. Geol. 2018, 40, 656–671. [Google Scholar]
  27. Teng, R.Z.; Jin, Y.Q.; Li, X.H.; Su, X.Z. Recent activity characteristics of the fault zone at northern edge of western QinLing MT. China Earthq. Eng. J. 1994, 16, 85–90. [Google Scholar]
  28. Richard, O.L.; Douglas, W.B.; Marin, K.C. Middle miocene reorganization of deformation along the northeastern Tibetan Plateau. Geology 2011, 39, 359–362. [Google Scholar]
  29. Werner, C.; Wegmüller, U.; Strozzi, T. Gamma SAR and interferometric processing software. In Proceedings of the ERS-ENVISAT Symposium, Gothenburg, Sweden, 16–20 October 2000. [Google Scholar]
  30. Farr, T.G.; Rosen, P.A.; Caro, E. The Shuttle Radar Topography Mission. Rev. Geophys. 2007, 45, RG2004. [Google Scholar] [CrossRef]
  31. Weiss, J.R.; Walters, R.J.; Morishita, Y. High-resolution Surface Velocities and Strain for Anatolia from Sentinel-1 InSAR and GNSS Data. Gephys. Res. Lett. 2020, 47, e2020GL087376. [Google Scholar] [CrossRef]
  32. Goldstein, R.M.; Werner, C.L. Radar interferogram filtering for geophysical applications. Gephys. Res. Lett. 1998, 25, 4035–4038. [Google Scholar] [CrossRef]
  33. Goldstein, R.M.; Zebker, H.A.; Werner, C.L. Satellite radar interferometry Two-dimensional phase unwrapping. Radio Sci. 1988, 23, 713–720. [Google Scholar] [CrossRef]
  34. Cavalie, O.; Doin, M.P.; Lasserre, C. Ground motion measurement in the Lake Mead area, Nevada, by differential synthetic aperture radar interferometry time series analysis Probing the lithosphere rheological structure. J. Geophys. Res. 2007, 112, B03403. [Google Scholar] [CrossRef]
  35. Okada, Y. Surface deformation due to shear and tensile faults in a half-space. Bull. Seismol. Soc. Am. 1985, 75, 1135–1154. [Google Scholar] [CrossRef]
  36. Lohman, R.B.; Simons, M. Some thoughts on the use of InSAR data to constrain models of surface deformation: Noise structure and data downsampling. Geochem. Geophys. Geosyst. 2005, 6, Q01007. [Google Scholar] [CrossRef]
  37. Steck, L.K.; Phillips, W.S.; Mackey, K.M. Seismic tomography of crustal P and S across Eurasia. Geophys. J. Int. 2009, 177, 81–92. [Google Scholar] [CrossRef]
  38. Feng, W.P.; Li, Z.H.; Elliott, J.R. The 2011 MW 6.8 Burma earthquake fault constraints provided by multiple SAR techniques. Geophys. J. Int. 2013, 195, 650–660. [Google Scholar] [CrossRef]
  39. Parsons, B.; Wright, T.; Rowe, P. The 1994 Sefidabeh (eastern Iran) earthquakes revisited: New evidence from satellite radar interferometry and carbonate dating about the growth of an active fold above a blind thrust fault. Geophys. J. Int. 2006, 164, 202–217. [Google Scholar] [CrossRef]
  40. Mai, P.M.; Beroza, G.C. A spatial random field model to characterize complexity in earthquake slip. J. Geophys. Res. Solid Earth 2002, 107, ESE-10. [Google Scholar] [CrossRef]
  41. Hiroo, K.; Luis, R. Source inversion of Wphase: Speeding up seismic tsunami warning. Geophys. J. Int. 2008, 175, 222–238. [Google Scholar]
  42. Lay, T.; Kanamori, H. An asperity model of large earthquake sequences. Earthq. Pred. Int. Rev. 1981, 4, 579–592. [Google Scholar]
  43. Wald, D.J.; Heaton, T.H. Spatial and temporal distribution of slip for the 1992 Landers, California, earthquake. Bull. Seismol. Soc. Am. 1994, 84, 668–691. [Google Scholar] [CrossRef]
  44. Field, E.H.; Dawson, T.E.; Felzer, K.R. Uniform California Earthquake Rupture Forecast, Version 2 (UCERF2). Bull. Seismol. Soc. Am. 2009, 99, 2053–2107. [Google Scholar] [CrossRef]
  45. Yuan, D.Y.; Zhang, P.Z.; Liu, B.C. Geometrical Imagery and Tectonic Transformation of Late Quaternary Active Tectonics in Northeastern Margin of Qinghai-Xizang Plateau. Acta Geol. Sin. Chin. Ed. 2004, 78, 270–278. [Google Scholar]
  46. Symithe, S.J.; Calais, E.; Haase, J.S. Coseismic slip distribution of the 2010 M 7.0 Haiti earthquake and resulting stress changes on regional faults. Bull. Seismol. Soc. Am. 2013, 103, 2326–2343. [Google Scholar] [CrossRef]
  47. Wang, J.J.; Xu, C.J.; Shen, W.B. The Coseismic Coulomb Stress Changes Induced by the 2010 Mw 6.9 Yushu Earthquake, China and Its Implication to Earthquake Hazards. Geomat. Inf. Sci. Wuhan Univ. 2012, 37, 1207–1211. [Google Scholar]
  48. Li, Q.; Li, C.T.; Zhao, B. Estimated seismic source parameters for 2020 Dingri Mw 5.6 earthquake in Xizang and study on the stress triggering. Chin. J. Geophys. 2024, 67, 172–188. [Google Scholar]
  49. Xu, G.Y.; Xu, X.W.; Yi, Y.N. Seismogemic structure of the 2022 Menyuan Mw6.6 earthquake, Qinghai Province constrained by InSAR and Gaofen-7 observation. Chin. J. Geophys. 2022, 65, 4704–4724. [Google Scholar]
  50. Wang, R.; Lorenzo Martín, F.; Roth, F. PSGRN/PSCMP-a new code for calculating co- and post-seismic deformation, geoid and gravity changes based on the viscoelastic-gravitational dislocation theory. Comput. Geosci. 2006, 32, 527–541. [Google Scholar] [CrossRef]
  51. Freed, A.M. Earthquake Triggering by Static, Dynamic, and Postseismic Stress Transfer. Annu. Rev. Earth Planet. Sci. 2005, 33, 335–367. [Google Scholar] [CrossRef]
  52. Harris, R.A.; Simpson, R.W. Suppression of large earthquakes by stress shadows A comparison of Coulomb and rate-and-state failure. J. Geophys. Res. Solid Earth 1998, 103, 24439–24451. [Google Scholar] [CrossRef]
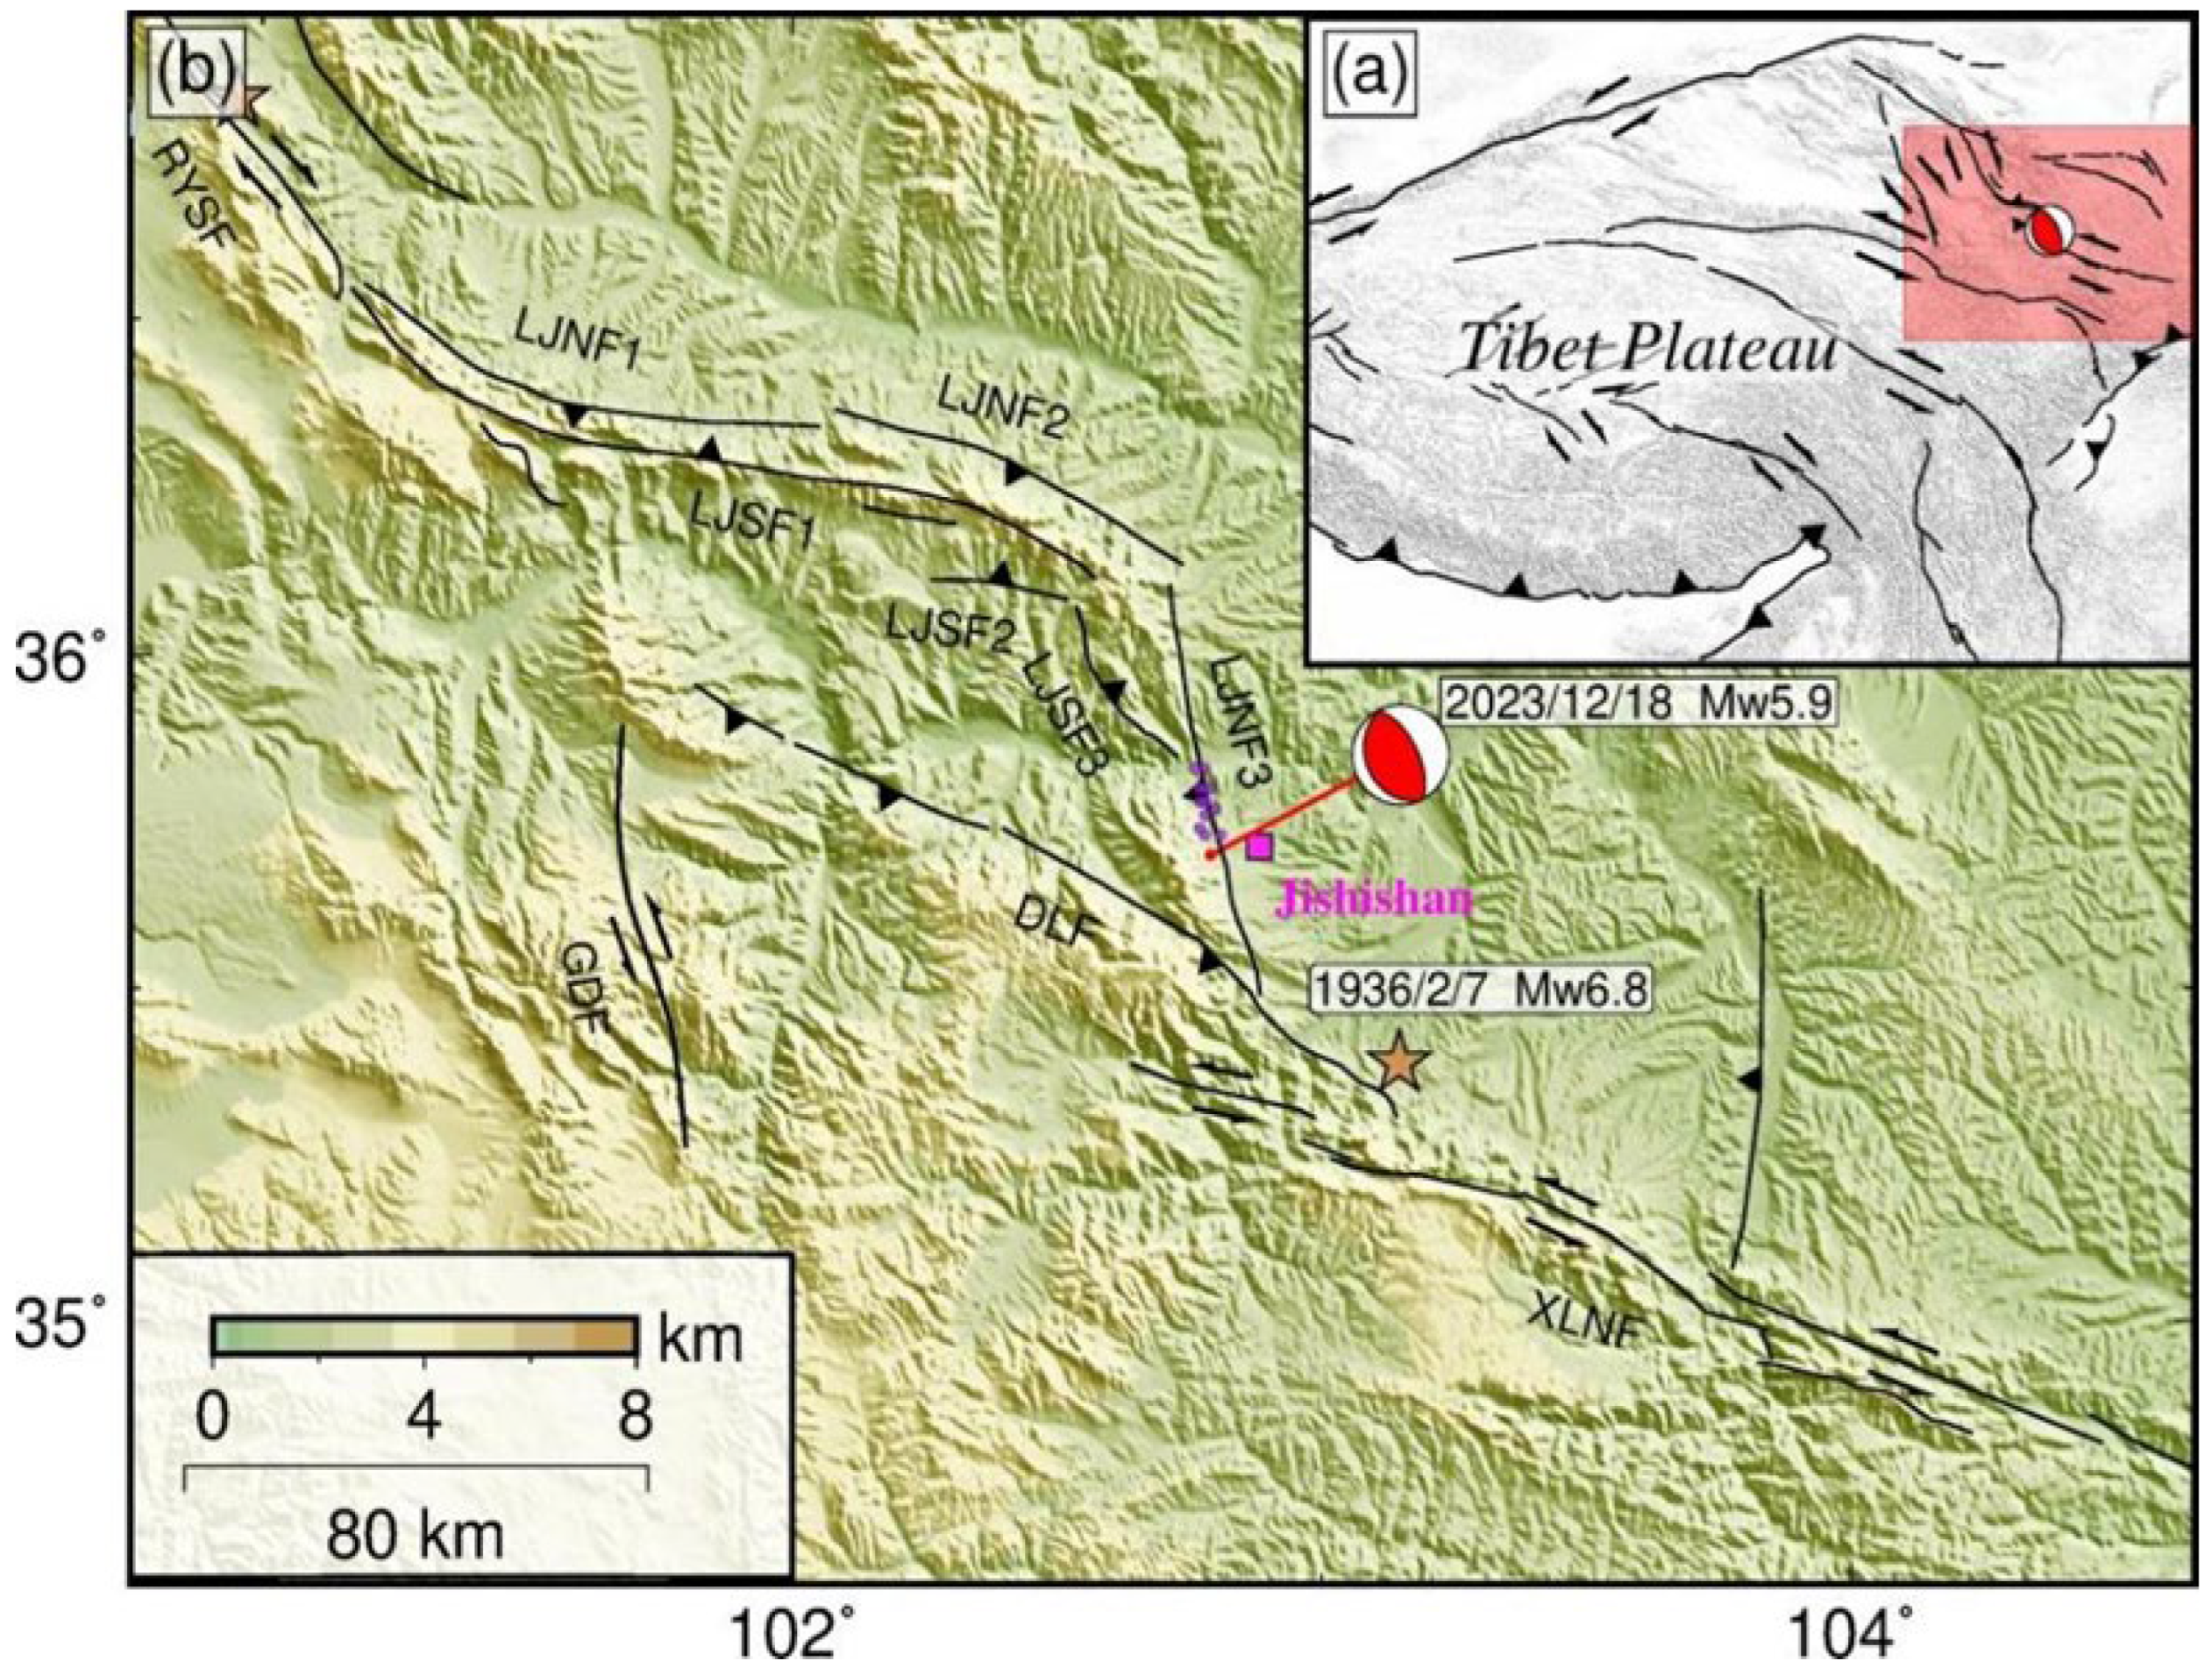
Figure 1. A background image of the Jishishan earthquake. Figure (a) illustrates the tectonic background associated with the Jishishan earthquake, where the red transparent region delineates the local tectonic context. Figure (b) depicts the main shock area of the Jishishan earthquake, in which the red beach ball represents the focal mechanism solution; the pink rectangle indicates the epicenter location of this seismic event; purple spheres illustrate aftershock distribution resulting from this earthquake; the yellow five-pointed star marks historical earthquake epicenters; and black lines denote regional fault lines.
Remotesensing 17 02310 g001
Figure 2. A seismic intensity map of Jishishan. This figure illustrates the spatial distribution of earthquake intensity within the Jishishan region. The areas shaded in red represent regions impacted by this seismic event, with color gradients ranging from deep to light corresponding to seismic intensity zones of VIII (8 degrees), VII (7 degrees), and VI (6 degrees). The yellow sphere denotes the epicenter of the earthquake, while black lines delineate regional fault lines.
Remotesensing 17 02310 g002
Figure 3. Coseismic interferograms illustrating the uplift and subsidence associated with the Jishishan earthquake in 2023. (a) The coseismic interferogram from the ascending orbit of Sentinel 1A; (b) the coseismic interferogram obtained from its descending orbit; (c) the coseismic interferogram generated from the ascending orbit of ALOS-2.
Remotesensing 17 02310 g003
Figure 4. A probability density distribution of parameters for the southwest-dipping model associated with the Jishishan earthquake fault.
Remotesensing 17 02310 g004
Figure 5. A probability density distribution of parameters for the northeast-dipping model associated with the Jishishan earthquake fault.
Remotesensing 17 02310 g005
Figure 6. A seismic sequence analysis diagram. (a) A plane view of the distribution of aftershock epicenters; (b) the temporal evolution of distances for aftershock sequences; (ce) the cross-sectional profiles corresponding to the blue reference line indicated in (a).
Remotesensing 17 02310 g006
Figure 7. A model illustrating the distribution of coseismic sliding with a northeastward inclination.
Remotesensing 17 02310 g007
Figure 8. Coseismic observations, simulations, and residual plots. (a) Coseismic deformation observations obtained from Sentinel-1A in ascending orbit; (b) simulation of slip distribution for the northeast-dipping fault in ascending geometry; (c) residual displacements recorded by Sentinel-1A in an ascending orbit; (d) coseismic deformation observations acquired from Sentinel-1A in descending orbit; (e) the corresponding simulation for the descending orbit; (f) residual displacements recorded by Sentinel-1A in descending orbit.
Remotesensing 17 02310 g008
Figure 9. The profiles of Coulomb stress changes induced by the 2023 Jishishan earthquake across adjacent fault systems. (ac) Variations in Coulomb stress along the northern segment of the Lajishan fault at depths of 5 km, 10 km, and 15 km; (df) stress perturbations along the southern segment of the Lajishan fault at depths of 20 km, 5 km, and 10 km; (gi) the redistribution of stress along the Linxia–Daotanghe fault at depths of 15 km, 20 km, and 5 km; (jl) modulation of stress along the northern margin fault of West Qinling at depths of 10 km, 15 km, and 20 km.
Remotesensing 17 02310 g009
Figure 10. Distribution of stress and aftershocks. (a) Distribution of aftershocks along stress gradients; (b) spatial and depth distribution of aftershocks.
Remotesensing 17 02310 g010
Table 1. Various institutions and studies offering solutions for seismic moment tensors.
InstitutionEpicenter/(°)Depth/kmFault Plane 1/(°)Fault Plane 2/(°)MW
ENStrikeDipRakeStrikeDipRake
USGS102.82735.7410156288333362885.9
GCMT102.81035.8318.91644612230352626.1
Liu et al. [2]102.75035.769.314338104319431046.1
Yang et al. [3]102.37735.969.01694312530556616.0
Yang et al. [4]102.73035.716.61493411631154806.1
Fang et al. [7]102.76035.777.71206177325321126.0
This study102.78035.754.91502812031350746.1
Table 2. Information on the SAR image data utilized in the experiment.
SatelliteTrackReference DateRepeat Date
Sentinel-1AAscending track 12827 October 202326 December 2023
Sentinel-1ADescending track 13514 December 202326 December 2023
ALOS-2Ascending track 14612 August 201622 December 2023
Disclaimer/Publisher’s Note: The statements, opinions and data contained in all publications are solely those of the individual author(s) and contributor(s) and not of MDPI and/or the editor(s). MDPI and/or the editor(s) disclaim responsibility for any injury to people or property resulting from any ideas, methods, instructions or products referred to in the content.