Article

Impacts of Typhoon Tracks on Frontal Changes Modulating Chlorophyll Distribution in the Pearl River Estuary

1
College of Ocean and Meteorology, Guangdong Ocean University, Zhanjiang 524088, China
2
School of Chemistry and Environment, Guangdong Ocean University, Zhanjiang 524088, China
3
Key Laboratory for Coastal Ocean Variation and Disaster Prediction, Guangdong Ocean University, Zhanjiang 524088, China
4
Key Laboratory of Climate, Resources and Environment in Continental Shelf Sea and Deep Sea of Department of Education of Guangdong Province, Guangdong Ocean University, Zhanjiang 524088, China
*
Author to whom correspondence should be addressed.
Remote Sens. 2025, 17(13), 2165; https://doi.org/10.3390/rs17132165
Submission received: 16 April 2025 / Revised: 14 June 2025 / Accepted: 22 June 2025 / Published: 24 June 2025

Abstract

Typhoons can significantly alter ocean hydrodynamic processes through their powerful external forces, greatly affecting marine biogeochemistry and ocean productivity. However, the specific impacts of typhoons with different tracks on coastal dynamics, including frontal activities and phytoplankton lateral transport, are not well understood. This study captured two distinct types of typhoons, namely Merbok (2017) and Nuri (2020), which landed from the right and left sides of the Pearl River Estuary (PRE), respectively, utilizing satellite remote sensing data to study their impacts on frontal dynamics and marine productivity. We found that after both typhoons, the southwest monsoon amplified geostrophic currents significantly (increased ~14% after Nuri (2020) and 48% after Merbok (2020)). These stronger currents transported warmer offshore seawater from the South China Sea to the PRE and intensified the frontal activities in nearshore PRE (increased ~47% after Nuri (2020) and ~2.5 times after Merbok (2020)). The ocean fronts limited the transport of high-chlorophyll and eutrophic water from the PRE to the offshore waters due to the barrier effect of the front. This resulted in a sharp drop in chlorophyll concentrations in the offshore-adjacent waters of PER after Typhoon Nuri (2020) (~37%). By contrast, despite the intensified geostrophic current induced by the summer monsoon following Typhoon Merbok (2020), its stronger offshore force, driven by the intense offshore wind stress (characteristic of the left-side typhoon), caused the nearshore front to move offshore. The displacement of fronts lifted the restriction of the front barrier and led more high-chlorophyll (increased ~4 times) and eutrophic water to be transported offshore, thereby stimulating offshore algal blooms. Our findings elucidate the mechanisms by which different track typhoons influence chlorophyll distribution through changes in frontal dynamics, offering new perspectives on the coastal ecological impacts of typhoons and further studies for typhoon impact modeling or longshore management.

1. Introduction

Typhoons inject substantial energy into the ocean, altering dynamics and triggering significant marine biogeochemical responses [1,2,3]. In coastal waters, heavy rainfall associated with typhoons increases freshwater runoff [4,5], while the strong force of these storms enhances vertical mixing in the water column [6,7]. These processes enrich surface waters with nutrients [8], stimulating phytoplankton growth [9,10,11] and modifying biogeochemical cycles [12,13,14,15]. Ocean fronts, ubiquitous and physically dynamic in marine environments, play a crucial role in regulating ocean productivity and biogeochemical cycles [16,17,18,19,20]. Their intense vertical mixing upwells deep nutrients to the euphotic zone, enhancing primary production similarly to typhoons [20,21,22]. However, typhoon forcing may alter frontal activity in coastal regions, potentially impacting productivity and biogeochemical processes [9]. While responses to typhoons or fronts have been extensively studied [10,11,16,17], research on typhoon-induced frontal modifications and their cascading effects on ocean productivity remains limited.
Especially under different typhoon conditions, such as moving tracks, the differences in their external dynamic directions may have a significant impact on frontal activities [1,8,9]. Due to the cyclonic structure of typhoons, strong winds cause significant differences in ocean hydrodynamic and ecological responses between the left and right sides of the typhoon’s track [1,9]. For instance, typhoons making landfall on the left side (relative to the typhoon’s movement direction) near the coast can induce more seawater intrusion into coastal bays, triggered by strong onshore wind stress [9]. Conversely, those landing on the right side tend to push seawater offshore due to strong offshore wind stress [9]. This may modify the behavior of coastal oceanic fronts [9,23,24,25]. For example, typhoons making landfall on the left side can enhance coastal frontal intensity by increasing the intrusion of high-salinity seawater [9]. Conversely, those landing on the right side tend to suppress frontal activity near the coast [9]. Additionally, the typhoon-induced upwelling can shift the position of ocean fronts [24]. The changes in fronts not only impact ocean productivity, but also affect marine biogeochemical processes, such as nitrogen cycling [15,25,26]. However, the current studies only presented changes in the intensity of salinity fronts in semi-enclosed bays under the influence of typhoons. In coastal open waters, it is unclear whether these frontal activities will shift and how they will affect ocean productivity, apart from changes in intensity, particularly across varying typhoon conditions.
The highly active frontal activity in the northern South China Sea (NSCS), including the Pearl River Estuary (PRE) region plays an extremely important role in regulating the distribution of chlorophyll in this region [18,26,27]. Particularly, the strength of frontal activity directly affects the lateral transport of nutrients and chlorophyll offshore [26]. Additionally, the NSCS is the area with frequent typhoons. According to statistics, up to 10 typhoons have a direct or indirect impact on the region in one year [28], making it an ideal area for studying the effects of typhoons on frontal activities and ocean productivity. Therefore, we speculate that different intensities and tracks of typhoons may alter the movement process of water masses in the PRE, thereby enhancing or weakening or even moving the frontal activity and affecting the local distribution of chlorophyll in the region. In this study, based on the pre-typhoon and post-typhoon frontal positions along the coast, we divided nearshore (<60 m) and offshore (>60 m) using the 60 isobaths (Figure 1b). Two typhoons, namely Merbok (2017) and Nuri (2020), which landed on the right and left sides of the PRE in the NSCS, respectively (Figure 1), were investigated to study their impact on the frontal activities and marine productivity in the PRE and its adjacent waters.

2. Materials and Methods

2.1. The Study Area and Typhoons Merbok (2017) and Nuri (2020)

The study area is located in the NSCS (20–23°N, 111.0–117.5°E), spanning both the eastern and western sides of the PRE (Figure 1). The Pearl River’s annual average runoff is approximately 2.85 × 10¹¹ m3 yr−1, significantly influencing the transport of terrestrial materials through the PRE to the adjacent coastal region [29]. Typhoon Merbok (2017) was generated in the central South China Sea (SCS) on 11 June 2017, moving towards the NSCS at speeds ranging from 3.3 to 6.9 m s−1, with an average of 5.5 m s−1. It made landfall in Shenzhen, situated on the eastern side of the PRE in the early hours of 13 June (http://www.wztf121.com) (accessed on 9 October 2024). The maximum wind speed reached 25 m s−1 as it passed through the study area (Figure 1). Typhoon Nuri (2020) formed in the east of the Philippines on 11 June 2020, and moved towards the NSCS at speeds ranging from 4.2 to 6.9 m s−1, with an average of 6.57 m s−1. It made landfall in west side of the PRE on June 14 (http://www.wztf121.com) (accessed on 9 October 2024). The maximum wind speed reached 23 m s−1 as it passed through the study area (Figure 1).
Based on these two typhoons, it is clear that apart from the differences in their landing locations (on the east and west sides of PRE, respectively), other characteristics, such as intensity and migration speed, were similar. Both typhoons also brought heavy rainfall (Figure 2). Typhoon Merbok (2017) produced significant rainfall one week before landfall (Figure 2a), along with additionally heavy rainfall in the west of the PRE within a week after landfall (Figure 2b). Typhoon Nuri (2020), on the other hand, had minimal rainfall before landfall (Figure 2e), while heavy rainfall persisted on the eastern side of PRE for up to two weeks after landfall, with peak rainfall occurring one week afterward (Figure 2f).

2.2. Satellite Data Sources

Daily sea surface temperature (SST) was obtained from OSTIA, an operation, real-time, high-resolution, global SST analysis system (https://data.marine.copernicus.eu/product/SST_GLO_SST_L4_NRT_OBSERVATIONS_010_001/description) (accessed on 9 October 2024). The spatial resolution of the SST data is 0.05° × 0.05°, and the daily SST data were obtained in this study. The daily L4 product of chlorophyll was obtained from Global Ocean Color (Copernicus GlobColour) with a spatial resolution of 4 × 4 km (https://data.marine.copernicus.eu/product/OCEANCOLOUR_GLO_BGC_L4_MY_009_104/description) (accessed on 9 October 2024). The processing level of the chlorophyll data is Level 4. For the global ocean satellite observations, the ACRI-ST company (Sophia Antipolis, France) is providing bio-geo-chemical (BGC) products based on the Copernicus-GlobColour processor. Concerning the chlorophyll-a retrieval approach, the main difference is the way to merge the different sensors [30]. The GlobColour processor merges the chlorophyll-a resulting from each sensor, while the OC-CCI processor is merging, in a preliminary step, the reflectance of the different sensors, then is applying the chlorophyll-a algorithm to the merged reflectance [30]. Daily geostrophic current data (SEALEVEL_GLO_PHY_L4_MY_008_047) were obtained from the Global Ocean Gridded L 4 Sea Surface Heights and Derived Variables Reprocessed dataset, spanning 1993 to present (https://data.marine.copernicus.eu/product/SEALEVEL_GLO_PHY_L4_MY_008_047/services) (accessed on 9 October 2024). Daily ocean surface wind data were sourced from ERA5 single-layer hourly reanalysis (https://cds.climate.copernicus.eu/cdsapp#!/dataset/reanalysis-era5-single-levels?tab=overview) (accessed on 9 October 2024). The horizontal resolutions of the surface wind data are 0.25° × 0.25° for atmosphere, and 0.5° × 0.5° for ocean waves. Daily precipitation data were obtained from Tropical Rain Measurement Mission (TRMM) satellites, with a spatial resolution of 0.25° × 0.25° (https://disc.gsfc.nasa.gov/datasets?keywords=rainfall&page=1&temporalResolution=1%20day) (accessed on 9 October 2024).

2.3. Detection of Ocean Front

The ocean front was calculated using the SST gradients in our study area, following the method outlined by Belkin and O’Reilly [31]. The gradient magnitude (GM) was calculated as follows:
T x = 1 0 + 1       2 0 + 2       1 0 + 1 × 1 4 · T ,   T y = + 1 + 2 + 1       0 0 0       1 2 1 × 1 4 · T
where T is a 3 × 3 matrix centered around the point being calculated, and the GM is given by the following:
G M = T x 2 + T y 2 .
Recently, there has yet to be a uniform standard for the threshold of thermal fronts. There are significant changes in the threshold for selecting SST gradients as fronts in different sea areas, such as the Yellow Sea, the northwest of the South China Sea, and the East China Sea [8,13,32,33,34]. Based on previous studies, this study selects an SST gradient greater than 0.025 °C km−1 as the frontal threshold in the NSCS. The continental shelf fronts in China’s coastal areas (such as the northern Jiangsu coastal front, the Fujian Zhejiang coastal front, and the NSCS) typically exhibit moderate to weak intensity (strong in winter and weak in summer) [18,32,33,34,35]. This threshold is a commonly used threshold range for identifying such fronts, and the sensitivity analysis results of this threshold show that the coefficient of variation (CV) of the frequency of front occurrence is <8% between the thresholds [18,32,33,34,35]. In this study, after the typhoon, most of the values below 0.08 °C km−1 are associated with Typhoon Nuri (2020), with no such values observed during the period of Typhoon Merbok (2017).

2.4. Calculation of Ekman Pumping

Ekman pumping velocity (EPV) describes the vertical movement of seawater driven by the interaction of wind stress and the Coriolis force, resulting in horizontal Ekman transport and the convergence or divergence of surface water. Negative EPV (EPV < 0) indicates downwelling, while positive EPV (EPV > 0) indicates upwelling. In this study, EPV was calculated using daily wind speed data to determine the spatiotemporal patterns of wind speed and the resulting upwelling or downwelling events before and after the typhoon. The formula used to calculate EPV is as follows [35]:
E P V = c u r l τ ρ f
where ρ denotes the density of seawater (1020 kg m−3), f is the Coriolis parameter, and τ denotes the wind stress.
The wind stress (τ) is calculated as follows:
τ = ρa Cd | U10 | U10
where ρa is the density of atmosphere (1.3 kg m−3), U10 denotes the wind speed at 10 m above the surface, and Cd is the drag coefficient, which depends on the wind speed (U10).
The drag coefficient (Cd) is defined by the following conditions:
C d × 1 0 3 = 1.2 ,   U 10 11   m / s 0.49 + 0.065 U 10 , 11 < U 10 19   m / s 1.364 + 0.0234 U 10 0.002 U 10 2 , 19 < U 10 100   m / s .

3. Results

3.1. Changes in Fronts in the PRE and Adjacent Waters Before and After Typhoons

Before Typhoon Nuri (2020), SST in the PRE and adjacent waters ranged between 27.0 and 30.0 °C. Significantly, the average low SSTs were observed to be 28.6 °C in the nearshore waters of the eastern PRE (Table 1), which corresponds to active upwelling (EPV > 0, 2.14 × 10⁻⁶ m s−1) in the region (Figure 3a and Table 2). At landfall, typhoon-induced convergence of cold and warm water masses caused significant spatial SST variability, with temperatures predominantly below 30 °C (Figure 3b). Nevertheless, the eastern PRE nearshore maintained comparatively low SST. During the subsequent four days, SST decreased slightly then increased rapidly, exceeding 30 °C in most areas and surpassing pre-typhoon levels (Figure 3c and Figure 4). Conversely, nearshore SST decreased rapidly post-landfall (Figure 4b). From one to three weeks post-typhoon, SST remained significantly elevated compared to pre-typhoon values, except in the eastern PRE nearshore, where low temperatures persisted (Figure 3d–f). Before Typhoon Merbok (2017), SST was generally below 30 °C, with significantly higher values in the western PRE compared to the east (Figure 3g). In contrast to Nuri, SST increased markedly in the eastern PRE at Merbok’s landfall (Figure 3h). Over the following four days, SST declined continuously, reaching its minimum—below pre-typhoon levels—approximately one week post-landfall (Figure 3i,j). SST subsequently recovered gradually (Figure 3k,l). Thus, the lower pre-typhoon SST (early June) relative to levels three weeks post-typhoon (early July) reflects the delayed seasonal warming characteristic of the spring–summer transition in the NSCS, including the PRE.
Before Typhoon Nuri (2020), SST gradients in most areas exceeded 0.05 °C km−1 (averaged 0.07 °C km−1 at the coastal region) but was below 0.08 °C km−1 (Figure 5a). On the day of Typhoon Nuri’s landfall, SST gradients in both nearshore and offshore regions significantly increased, exceeding 0.08 °C km−1 in most areas, with maximum values observed in the PRE and eastern PRE regions (Figure 5b). From four days to three weeks after landfall, nearshore fronts remained stronger than pre-typhoon levels as indicated by higher SST gradients (increased 47%, p < 0.05, Figure 4). The fronts were disturbed by the typhoon for a duration of one week, after which it subsequently returned to its original state (Figure 4). Conversely, offshore fronts gradually weaken to pre-typhoon levels (decreased 25%, p < 0.05) one week after landfall, eventually falling below these levels (decreased 46%, p < 0.05, Figure 5d–f).
Before Typhoon Merbok (2017), SST gradients in most other areas were below 0.05 °C km−1, except for values greater than 0.05 °C km−1 in the nearshore area of the eastern PRE (Figure 5g). Within one week of Typhoon Merbok’s landfall, the fronts in the nearshore region of the eastern PRE weakened, while offshore fronts increased (increased 57%, p < 0.05, Figure 5h–j). This indicated that the typhoon caused fronts to shift from the nearshore to the offshore. Two weeks after landfall, the fronts returned to their pre-typhoon state, and three weeks later, they strengthened (increased 2.5 times, p < 0.05, Figure 5k,l). Overall, Typhoon Nuri (2020), which made landfall on the western side of the PRE, disturbed the structure of SST gradients then recovered after one week and enhanced frontal activities in both nearshore and offshore regions, whereas Typhoon Merbok (2017) caused the fronts in the eastern PRE’s nearshore areas to shift towards offshore regions after two weeks. The impact of typhoon’s landfall location in the PRE showed significant variation in the coastal fronts.

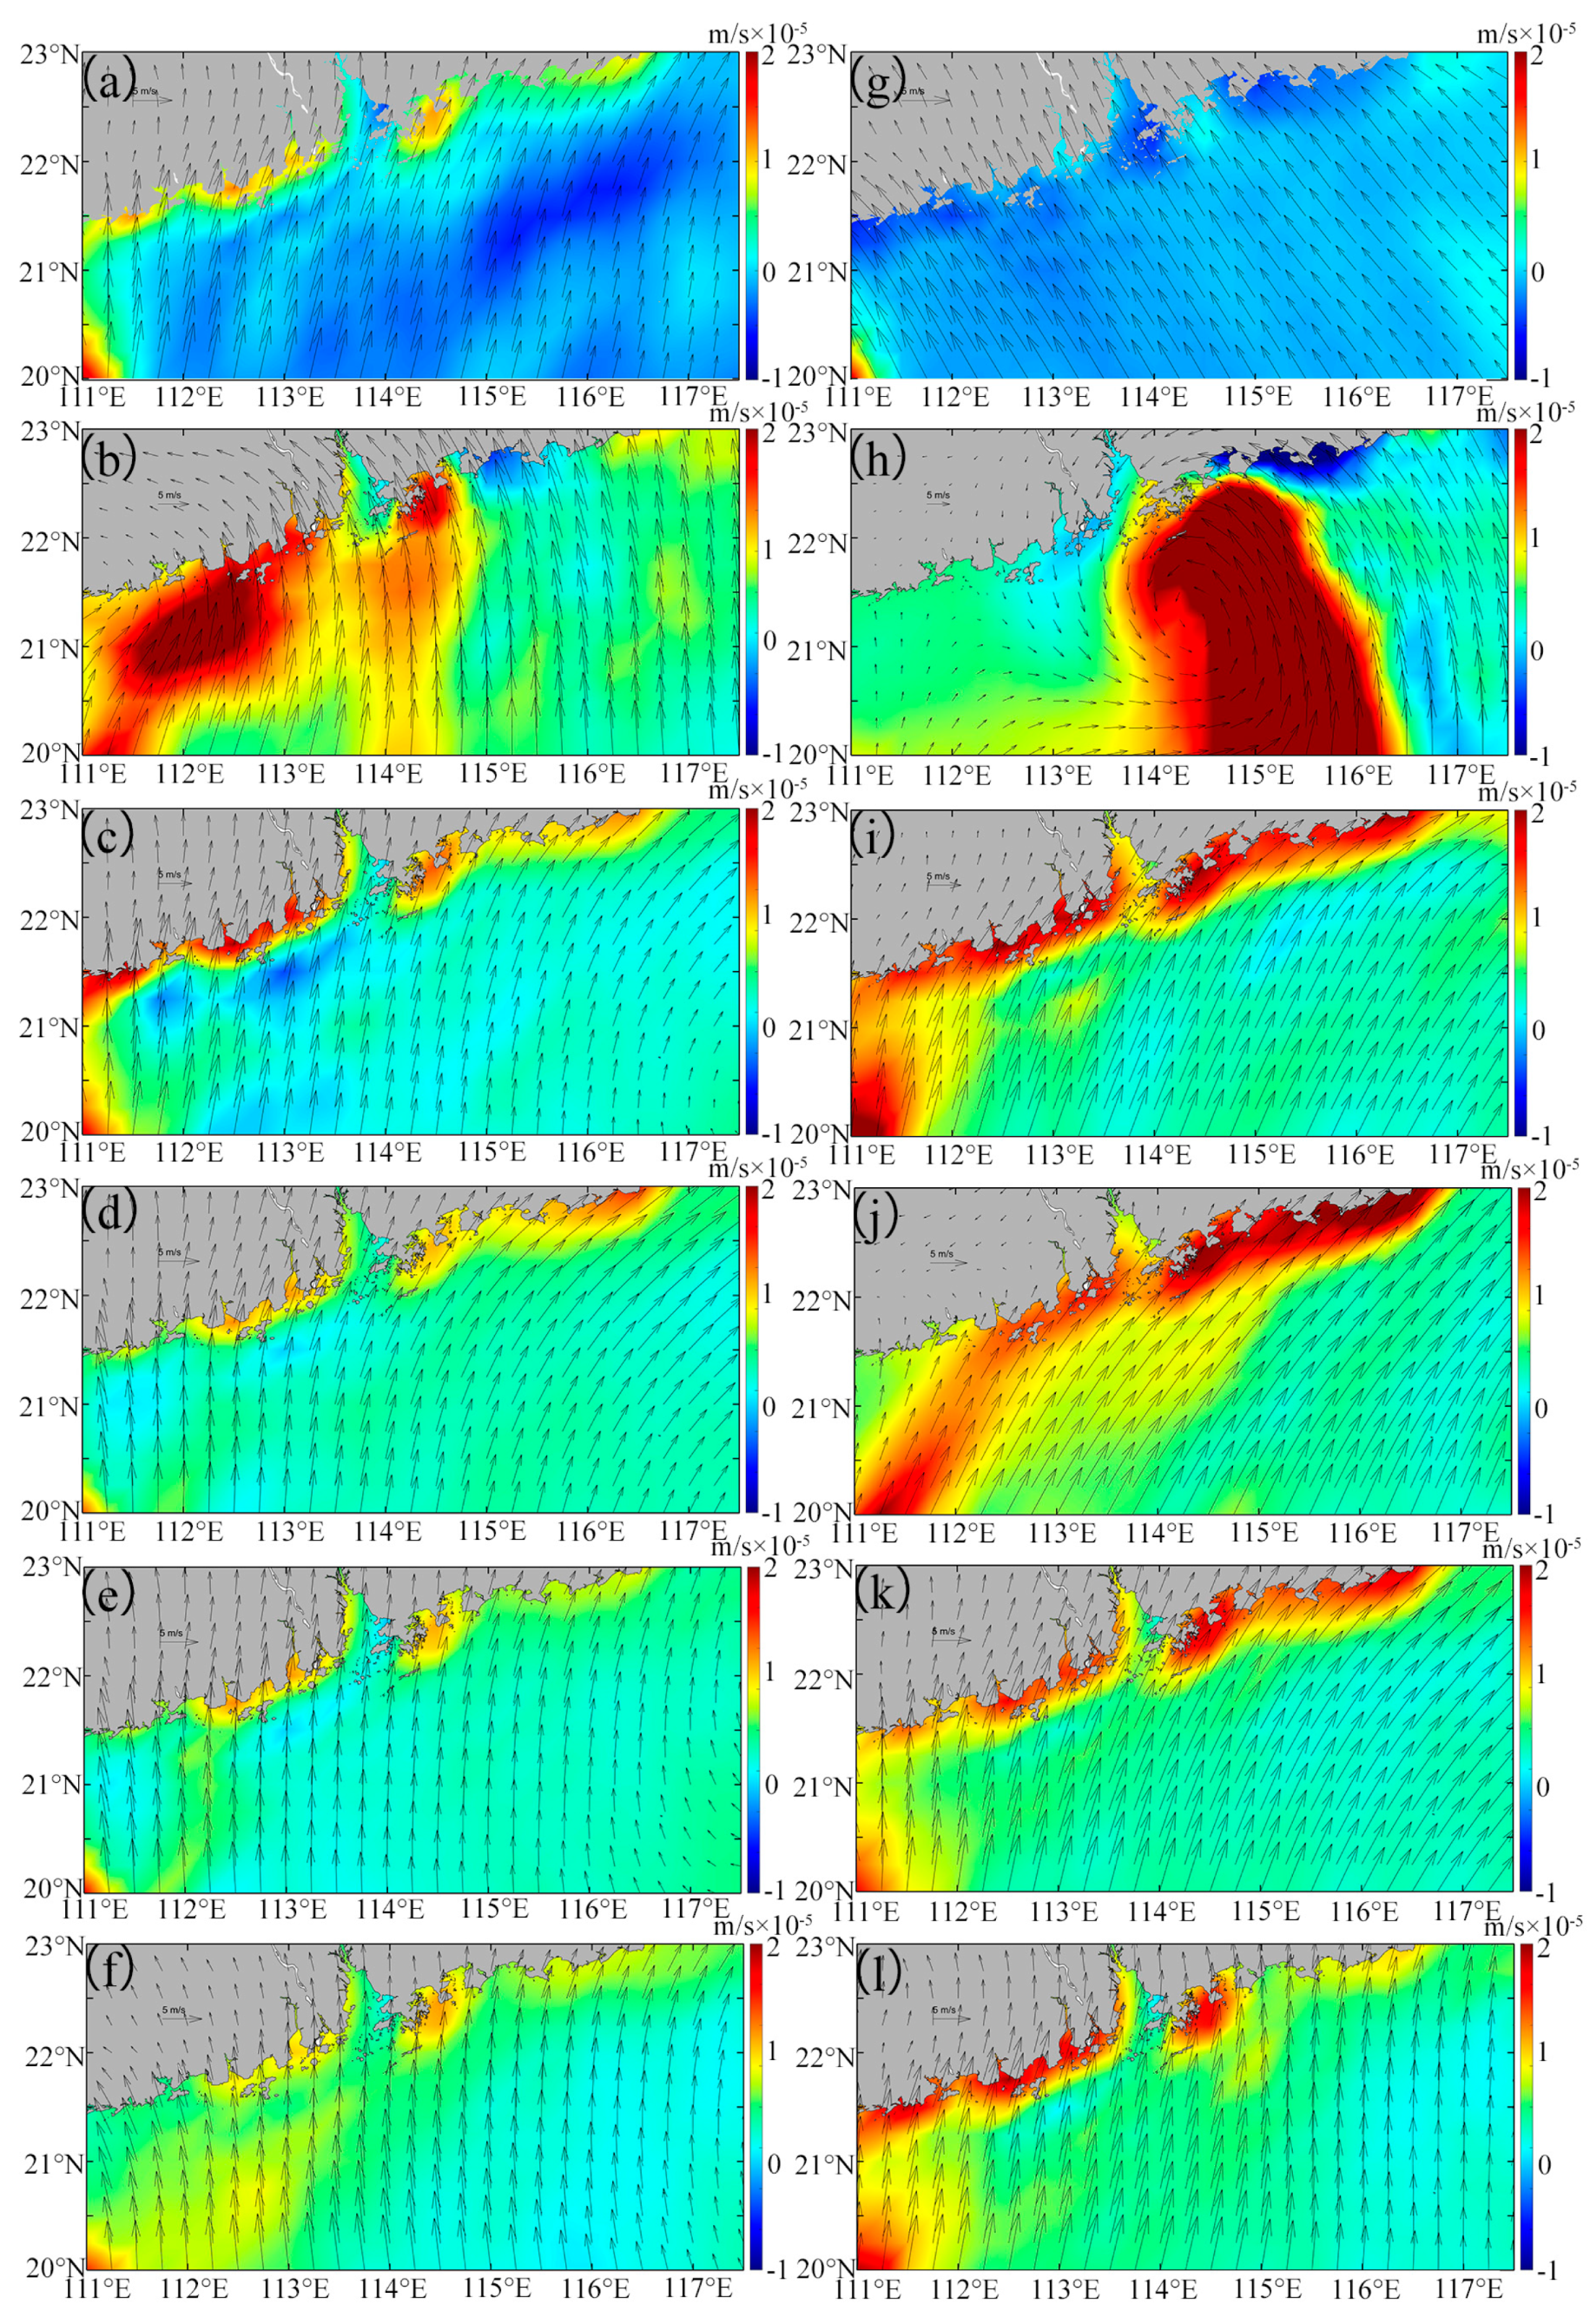
3.2. Changes in Wind and EPV Before and After Typhoons

Before Typhoon Nuri (2020), the study area was primarily influenced by the southwest monsoon, with winds blowing from southwest to northeast (Figure S1a). However, at landfall, the wind direction shifted significantly (from southwest to southeast), and wind intensity increased notably on the eastern side of the PRE (Figure S1b). After landfall, the wind direction returned to its pre-typhoon pattern, although its intensity changed (Figure S1c–f). Before Typhoon Merbok (2017), the wind direction in the study area mainly exhibited from southeast to northwest (Figure S1g). Similarly, significant changes in wind direction and intensity were observed after typhoon Merbok (2017) (Figure S1h–l). Specifically, the wind direction shifted towards the southwest, and the intensity increased after landfall.
Before Typhoon Nuri (2020), the geostrophic current flowed northeastward along the nearshore of Guangdong Province, with intensified currents observed in the eastern part of the PRE. Meanwhile, an opposite flow occurred in the offshore area (Figure 6a). After Typhoon Nuri (2020), the geostrophic current direction remains similar, but its intensity significantly increased and persisted for approximately three weeks post-landfall (Figure 6b–d). Before Typhoon Merbok (2017), the geostrophic current was similar to that observed during Typhoon Nuri (2020) (Figure 6e). However, in the offshore area of the eastern PRE, the current turned to the offshore region before flowing southwest, opposite to the direction of the nearshore flow (Figure 6e). Similar to Typhoon Nuri (2020), the direction of the geostrophic current after Typhoon Merbok (2017) did not change substantially, but the intensity significantly increased, especially in the nearshore areas (Figure 6f–h). After some days of Typhoon Nuri’s landfall, the intensified geostrophic current coincided with the observed increase in SST (Figure 3b–f), which showed significant positive correlation between them (Figure 7). In addition, the EPV increased in the offshore area (Figure 8b), indicating an upwelling of deeper cold water.

3.3. Response of Chlorophyll Distribution to Changes in Frontal Activity After Typhoons

Before Typhoon Nuri, high chlorophyll levels (>4 mg m−3) were observed in the PRE and the eastern PRE (8.31 mg m−3) (Figure 9a). After the Typhoon Nuri, chlorophyll levels in the offshore area of the eastern PRE began to decrease one day after the typhoon’ landfall (Figure 9b). The value continued to decline within a week of the typhoon’ landfall, reaching their lowest levels (0.69 mg m−3) in the offshore area (Figure 9d). Two to three weeks after landfall, higher chlorophyll concentrations started to fade away to offshore areas (Figure 9e,f). Unlike Typhoon Nuri, before Typhoon Merbok (2017), and within one week of its landfall, high chlorophyll values were primarily found in the PRE and the western PRE, while chlorophyll concentrations in the eastern PRE remained relatively low (Figure 9g–j). After Typhoon Merbok (2017), higher chlorophyll concentrations began to move toward the eastern PRE, reaching their peak two weeks after landfall (Figure 9j,k). High chlorophyll concentrations (>5 mg m−3) were observed in the western coastal region of PRE before the pre-typhoon and post-typhoon associated with Typhoons Nuri (2020) and Merbok (2017).

4. Discussion

Before Typhoon Nuri (2020), heavy rainfall in the eastern PRE resulted in massive freshwater inflow into the nearshore waters, reducing seawater density (Figure S2a) and increasing the horizontal pressure gradient [36]. Consequently, under the combined effects of baroclinicity driven by the southwest monsoon in summer and bottom topographic forcing [36,37], the northeastward geostrophic currents near the coast were stronger before Typhoon Nuri (2020) compared to the period before Typhoon Merbok (2017). Stronger geostrophic currents along the northeastern coast transported warmer seawater from the SCS into the nearshore waters [33,38], which mixed with cooler estuarine and nearshore waters, particularly in the region of upwelling-formed cold water column at the eastern PRE, thereby forming a stronger thermal front before Typhoon Nuri (2020) (Figure 5). After the typhoons made landfall, the strengthening of the southwest wind (Figure S1) led to the formation of stronger geostrophic currents, which carried warmer seawater from the southwest offshore to northeast nearshore regions (Figure 6). This phenomenon can be attributed to the positive wind stress curl induced by the typhoon, which enhances ocean circulation in the SCS [39]. Warmer seawater transported from the SCS mixed with cooler water due to intensified Ekman pumping during the typhoon period to form stronger temperature fronts in nearshore regions after Typhoon Nuri (2020) (Figure 5). This is also demonstrated by the strong positive correlation between geostrophic currents and SST gradients (Figure 7). In contrast, despite the increased intensity of geostrophic currents following Typhoon Merbok (2017), a combination of stronger offshore forces due to the enhanced offshore movement caused by the right-side typhoon resulted in transportation of the frontal activities in the nearshore to the offshore areas at eastern PRE [9]. Additionally, both typhoons caused strong EPV in the PRE and its adjacent waters (Figure 8), leading to rapid cooling of surface seawater. Therefore, typhoons caused more offshore warm seawater transport to nearshore areas and formed stronger SST gradients (frontal intensity). Obviously, the landfall location of a typhoon significantly influences the spatial heterogeneity of SST in the PRE region, with western-side landfalls generating more pronounced SST gradients compared to the eastern-side typhoon. This differential SST response serves as a key driver of the contrasting frontal activity associated with typhoons from different landfall locations. Compared to three weeks (early July) after the typhoon, lower SSTs of the pre-typhoon events (early June) obviously exhibited the delayed seasonal warming characteristic of the transitional spring-summer period in the NSCS including the PRE. Additionally, induced by heavy rainfall before Typhoon Nuri (2020) (Figure 2a), large river discharge led to an extensive surface plume and lower SSTs occurred in nearshore and offshore of the eastern PRE (Figure 3a). During and after the Typhoon Merbok (2017), significantly depressed SSTs were observed along the eastern nearshore and offshore regions (Figure 3h,i). This subsurface cold water was primarily driven by Ekman pumping (Figure 8) and excessive rainfall inputs (Figure 3f,i) during the one to two weeks post-typhoon period.
Despite wind-driven upwelling prevailing across most of the NSCS post-typhoon (Figure 8), elevated SSTs persisted over much of the area. However, significant cold anomalies were observed in the eastern coast of the PRE and Hainan Island where prevailing upwelling occurred in summer. The offshore SST increase was sustained by the intrusion of warmer SCS waters (Figure 3), which induced strong stratification that suppressed vertical nutrient transport to the surface via upwelling. As compared with the offshore waters, the river plume of PRE formed the salinity tongue extending westward and eastward (Figure S2). Subsequently, robust stratification over the adjacent shelf when the plume veered outward after freshwater discharged from the outlets along the west and east bank of the estuary. Wind-driven circulation interacts with the plume to jointly modulate the nutrient fluxes and residence time [37,40]. Thus, high chlorophyll concentrations (>5 mg m−3) were subject to the effect in the western coastal region of PRE before and after Typhoons Nuri (2020) and Merbok (2017) (Figure 9). Ocean fronts often stimulate the growth of phytoplankton, as their convergent effect gathers nutrients from different water masses [16,41] and lift nutrients to the upper ocean through vertical mixing [19,21,42]. However, in coastal waters, ocean fronts can also serve as a barrier, preventing nutrients from spreading offshore and instead causing accumulation in nearshore waters, thereby regulating phytoplankton growth in those areas [26]. Under global warming, the intensity of coastal ocean fronts is increasing [18,43], which will further limit the diffusion of pollutants, such as nutrients, from nearshore to offshore regions. This contributes to an increase in the frequency of harmful algal blooms in nearshore areas [44,45,46].
In the PRE, the Coriolis force deflects the diluted Pearl River water westward along the coast of Guangdong Province, forming the WGCC [47,48]. The WGCC delivers abundant nutrients, sustaining high chlorophyll levels in the PRE and western coast of Guangdong Province [49,50,51], likely explaining the persistent high chlorophyll concentrations observed there pre- and post-typhoon (Figure 9). Conversely, in the eastern PRE, nutrients from local upwelling support phytoplankton growth [52,53] but are generally lower than those supplied laterally from the PRE [37,40,54]. This lateral transport is modulated by fronts in the eastern PRE [26,37]. Surface salinity patterns (Figure S2) reveal two key features in the transition zone: the high-chlorophyll PRE plume and the cold upwelled bottom water (Figure 3). Their convergence is evident at the transition zone edge. Pre-typhoon, chlorophyll concentration and SST gradient (front intensity) here exhibited a significant negative correlation (r < −0.25, p < 0.05), indicating fronts acted as a primary barrier (Figure 10a,d). Typhoon forcing disrupted the frontal structure, eliminating this negative correlation (r < −0.21, p > 0.05) and weakening the barrier effect (Figure 10b,e).
Post-typhoon SST gradient recovery times differed markedly: one week for Nuri (2020) versus two weeks for Merbok (2017) (Figure 4). As typhoon forcing waned, nearshore fronts re-established near their pre-storm positions, restoring their barrier function. Within the eastern PRE cold-water edge region, SST gradients regained significant (p < 0.05) negative correlations with chlorophyll (Figure 10c,f). Despite potential eastward transport of chlorophyll-rich plume water by geostrophic currents, persistently strong fronts hindered the advection of nutrient-rich waters, limiting chlorophyll levels in the eastern PRE [53].
Typhoon Nuri (2020) induced contrasting biogeochemical responses. Before Typhoon Nuri (2020), high chlorophyll levels were found in the eastern PRE (Figure 8a), despite strong fronts in this region (Figure 5a), likely due to heavy pre-typhoon rainfall (>450 mm; Figure 2a) which introduced terrestrial nutrients, stimulating growth [13,55,56]. After Typhoon Nuri (2020), minimal eastern PRE rainfall (Figure 2b–d) reduced terrestrial input. Enhanced geostrophic currents intensified frontal activity (Figure 5b–f and Figure 6b–d). Consequently, with reduced nutrients and enhanced frontal barriers limiting lateral transport, eastern PRE chlorophyll declined (Figure 7b–d). Nuri’s western landfall generated clockwise (onshore) wind stress, further restricting offshore spread of chlorophyll-rich PRE water [9]. Post-typhoon increases in dissolved oxygen and microbial activity typically stimulate degradation of particulate organic matter, including phytoplankton [14,15,25], accelerating chlorophyll decline without exogenous nutrient input.
Unlike Typhoon Nuri (2020), there was heavy rainfall in the eastern PRE after the Typhoon Merbok (2017), while minimal rainfall before Typhoon Merbok (2017) (Figure 2e–h). Therefore, the front that formed in the nearshore area of the eastern PRE before Typhoon Merbok hindered the lateral transport of nutrients and chlorophyll-rich water masses, leading to lower chlorophyll concentrations in the region. However, after Typhoon Merbok (2017), as the fronts shifted offshore, the barrier effect of the nearshore front weakened, leading nutrients and chlorophyll-rich waters to be transported to the eastern PRE. Furthermore, Typhoon Merbok (2017)’s landfall on the right side of PRE generated counterclockwise wind stress (offshore wind), promoting the movement of chlorophyll-rich waters from the PRE toward offshore areas [9]. Heavy rainfall during the typhoon delivered abundant terrestrial nutrients [13,55,56], collectively increasing eastern PRE chlorophyll levels.
Overall, geostrophic current intensity during both typhoons drove changes in PRE frontal activity, regulating local chlorophyll distribution (Figure 10). After Typhoon Nuri (2020), limited rainfall reduced freshwater input and offshore forcing (Figure 9b). Enhanced southwest wind stress strengthened geostrophic currents, advecting warmer SCS water into the PRE. Increased Ekman pumping velocity (EPV) cooled SST, mixing with warmer offshore SCS inflow to form strong nearshore and offshore fronts. These fronts restricted the transport of eutrophic, high-chlorophyll water offshore, causing a sharp chlorophyll decline offshore and in the eastern PRE. In contrast, Merbok’s (2017) heavy rainfall increased freshwater input and offshore forcing. Offshore-directed winds from its eastern landfall shifted the eastern PRE nearshore front offshore [9], weakening its barrier effect and allowing a significant chlorophyll increase in the eastern PRE (Figure 10).
Therefore, the left-side typhoon, due to its strong onshore wind stress, increased the intrusion of warm and saline seawater from the offshore areas, thus forming a stronger ocean front [9]. The strong front formed by the left-side typhoon also prevented the transport of high-chlorophyll and eutrophic water from the PRE to the offshore, resulting in a sharp decline in chlorophyll concentration in the offshore. On the contrary, the right-side typhoon weakened the barrier of the nearshore front due to its strong offshore external forces, thereby promoting the diffusion of high-chlorophyll and eutrophic water from the PRE to the offshore, resulting in algal blooms offshore (Figure 11). Although this study primarily relies on satellite derived SST and chlorophyll data, under typhoon conditions with high cloud cover, there may be some challenges and uncertainties in the assessment of hydrodynamic processes and chlorophyll in nearshore waters during typhoon periods. Therefore, it is difficult to quantitatively evaluate the response of nearshore ecological environments under different typhoon conditions. Nevertheless, the trends between the parameters in this study are consistent with each other (Figure 7), which largely ensures the reliability of the analysis results in this study.
With decreasing typhoon frequency under climate change [57], the increased intensity of tropical cyclones may exacerbate these impacts [58]. Previous studies used the ocean model to simulate the change in material transport induced by typhoons [59,60,61]. For instance, Cong et al. (2023) used the model to investigate the intermittent migration of mixing fronts and discussed potential implications for sediment transport on the inner shelf during the passage of typhoon [60]. Further numerical investigation of modeling is applied to the prediction biogeochemical responses in specific frontal zones during and after typhoon [61]. This method provides a quantitative approach to assess the ecological damage post-typhoon in the future, such as phytoplankton bloom or dissolved oxygen depletion. Recently, machine learning methods demonstrated new applications of research in many fields. Further, the impacts of typhoons on the ocean front, clarifying the mechanism, apply more comprehensive methods, such as machine learning and deep learning [62,63,64]. Based on the predicted typhoon moving tracks (or landing points) and typhoon intensity, the results of this study may contribute to further evaluate the potential impact of the typhoon on the nearshore eco-environment. For instance, after identifying typhoon track and landfall location as primary factors influencing nearshore hydrodynamics and chlorophyll variations, the incorporation of typhoon-related parameters alongside SST, chlorophyll, geostrophic flow, EPV, and wind field data serve as valuable references for modeling frontal movements and developing chlorophyll anomaly prediction models. This provides a scientific basis for enhanced monitoring of coastal ecosystem responses to extreme weather events.

5. Conclusions

In this study, we analyzed satellite remote sensing data to investigate the impact of two distinct typhoons with different tracks on ocean fronts and marine productivity in the PRE and its adjacent waters. We found that while the direction of geostrophic flow in the study area remained consistent, its intensity significantly increased after both typhoons. Enhanced geostrophic currents transported warm seawater from the SCS into the study areas, resulting in a significant increase in frontal activity in both nearshore and offshore regions during Typhoon Nuri (2020). The enhanced frontal activity in the nearshore area limits the offshore transport of high-chlorophyll and eutrophic water, resulting in a sharp decline in chlorophyll concentration in the offshore. In contrast, although the geostrophic intensity increased after Typhoon Merbok (2017), the left-side typhoon had stronger offshore dynamics, causing nearshore frontal activity to move offshore, thereby promoting the transport of high-chlorophyll and eutrophic water from PRE to offshore, stimulating algal blooms in offshore areas including the eastern side of PRE. Overall, the intensity of geostrophic currents impacted by summer monsoon during these two typhoons played a major role in driving changes in frontal activity in the PRE and adjacent waters, ultimately regulating the distribution of chlorophyll. Machine learning methods demonstrated new applications of research in many fields. Further, the impacts of typhoons on the ocean front, clarifying the mechanism, apply more comprehensive methods, such as machine learning and deep learning. Combining machine learning and quantitative model simulations, investigations of such events on the short-term changes in chlorophyll distribution through front variation should be the subject of future studies.

Supplementary Materials

The following supporting information can be downloaded at: https://www.mdpi.com/article/10.3390/rs17132165/s1.

Author Contributions

Conceptualization, Q.Z., Q.L. and F.C.; methodology and software, Q.Z. and S.L.; validation, F.C.; formal analysis, C.W., S.L. and Q.L.; resources, F.C.; data curation, Q.Z. and Q.L.; writing—original draft, Q.Z. and Q.L.; writing—review and editing, Q.Z., Q.L. and F.C.; visualization, Q.Z.; supervision, F.C.; project administration, F.C.; funding acquisition, F.C. All authors have read and agreed to the published version of the manuscript.

Funding

This study was supported by the National Natural Science Foundation of China (42276047, U20A20103, U1901213, 92158201).

Data Availability Statement

Data are contained within the article.

Conflicts of Interest

The authors declare no conflict of interest.

References

  1. Chen, F.; Lao, Q.; Lu, X.; Wang, C.; Chen, C.; Liu, S.; Zhou, X. A Review of the Marine Biogeochemical Response to Typhoons. Mar. Pollut. Bull. 2023, 194, 115408. [Google Scholar] [CrossRef] [PubMed]
  2. Herbeck, L.S.; Unger, D.; Krumme, U.; Liu, S.M.; Jennerjahn, T.C. Typhoon-Induced Precipitation Impact on Nutrient and Suspended Matter Dynamics of a Tropical Estuary Affected by Human Activities in Hainan, China. Estuar. Coast. Shelf Sci. 2011, 93, 375–388. [Google Scholar] [CrossRef]
  3. Honda, M.C.; Sasai, Y.; Siswanto, E.; Kuwano-Yoshida, A.; Aiki, H.; Cronin, M.F. Impact of Cyclonic Eddies and Typhoons on Biogeochemistry in the Oligotrophic Ocean Based on Biogeochemical/Physical/Meteorological Time-Series at Station KEO. Prog. Earth Planet. Sci. 2018, 5, 42. [Google Scholar] [CrossRef]
  4. Mok, J.-S.; Kim, S.-H.; Kim, J.; Cho, H.; An, S.-U.; Choi, A.; Kim, B.; Yoon, C.; Thamdrup, B.; Hyun, J.-H. Impacts of Typhoon-Induced Heavy Rainfalls and Resultant Freshwater Runoff on the Partitioning of Organic Carbon Oxidation and Nutrient Dynamics in the Intertidal Sediments of the Han River Estuary, Yellow Sea. Sci. Total Environ. 2019, 691, 858–867. [Google Scholar] [CrossRef]
  5. Wang, X.; Wang, W.; Tong, C. A Review on Impact of Typhoons and Hurricanes on Coastal Wetland Ecosystems. Acta Ecol. Sin. 2016, 36, 23–29. [Google Scholar] [CrossRef]
  6. Chen, C.-T.A.; Liu, C.-T.; Chuang, W.S.; Yang, Y.J.; Shiah, F.-K.; Tang, T.Y.; Chung, S.W. Enhanced Buoyancy and Hence Upwelling of Subsurface Kuroshio Waters after a Typhoon in the Southern East China Sea. J. Mar. Syst. 2003, 42, 65–79. [Google Scholar] [CrossRef]
  7. Liu, S.-S.; Sun, L.; Wu, Q.; Yang, Y. The Responses of Cyclonic and Anticyclonic Eddies to Typhoon Forcing: The Vertical Temperature-Salinity Structure Changes Associated with the Horizontal Convergence/Divergence. J. Geophys. Res. Oceans 2017, 122, 4974–4989. [Google Scholar] [CrossRef]
  8. Lao, Q.; Lu, X.; Chen, F.; Jin, G.; Chen, C.; Zhou, X.; Zhu, Q. Effects of Upwelling and Runoff on Water Mass Mixing and Nutrient Supply Induced by Typhoons: Insight from Dual Water Isotopes Tracing. Limnol. Oceanogr. 2023, 68, 284–295. [Google Scholar] [CrossRef]
  9. Chen, C.; Lao, Q.; Zhou, X.; Jin, G.; Zhu, Q.; Chen, F. Tracks of Typhoon Movement (Left and Right Sides) Control Marine Dynamics and Eco-Environment in the Coastal Bays after Typhoons: A Case Study in Zhanjiang Bay. Sci. Total Environ. 2023, 912, 168944. [Google Scholar] [CrossRef]
  10. Tsuchiya, K.; Kuwahara, V.S.; Hamasaki, K.; Tada, Y.; Ichikawa, T.; Yoshiki, T.; Nakajima, R.; Imai, A.; Shimode, S.; Toda, T. Typhoon-Induced Response of Phytoplankton and Bacteria in Temperate Coastal Waters. Estuar. Coast. Shelf Sci. 2015, 167, 458–465. [Google Scholar] [CrossRef]
  11. Jiang, T.; Wu, G.; Niu, P.; Cui, Z.; Bian, X.; Xie, Y.; Shi, H.; Xu, X.; Qu, K. Short-Term Changes in Algal Blooms and Phytoplankton Community after the Passage of Super Typhoon Lekima in a Temperate and Inner Sea (Bohai Sea) in China. Ecotoxicol. Environ. Saf. 2022, 232, 113223. [Google Scholar] [CrossRef] [PubMed]
  12. Hung, C.-C.; Gong, G.-C. Biogeochemical Responses in the Southern East China Sea after Typhoons. Oceanography 2011, 24, 42–51. [Google Scholar] [CrossRef]
  13. Lao, Q.; Chen, F.; Jin, G.; Lu, X.; Chen, C.; Zhou, X.; Zhu, Q. Characteristics and Mechanisms of Typhoon-Induced Decomposition of Organic Matter and Its Implication for Climate Change. J. Geophys. Res. Biogeosci. 2023, 128, e2023JG007518. [Google Scholar] [CrossRef]
  14. Lu, X.; Zhou, X.; Jin, G.; Chen, F.; Zhang, S.; Li, Z.; Chen, C.; Zhu, Q.; Lao, Q. Biological Impact of Typhoon Wipha in the Coastal Area of Western Guangdong: A Comparative Field Observation Perspective. J. Geophys. Res. Biogeosci. 2022, 127, e2021JG006589. [Google Scholar] [CrossRef]
  15. Lu, X.; Lao, Q.; Chen, C.; Liu, S.; Zhou, X.; Zhu, Q.; Chen, F. Using Stable Isotopes and Spectral Properties of Particulate and Dissolved Organic Matter to Quantify Typhoon-induced Organic Matter Decomposition. J. Geophys. Res. Oceans 2024, 129, e2023JC020629. [Google Scholar] [CrossRef]
  16. Acha, E.M.; Piola, A.; Iribarne, O.; Mianzan, H. Ecological Processes at Marine Fronts: Oases in the Ocean; Springer Briefs in Environmental Science; Springer International Publishing: Cham, Switzerland, 2015; ISBN 978-3-319-15479-4. [Google Scholar]
  17. Brandini, F.P.; Tura, P.M.; Santos, P.P.G.M. Ecosystem Responses to Biogeochemical Fronts in the South Brazil Bight. Prog. Oceanogr. 2018, 164, 52–62. [Google Scholar] [CrossRef]
  18. Lao, Q.; Liu, S.; Ling, Z.; Jin, G.; Chen, F.; Chen, C.; Zhu, Q. External Dynamic Mechanisms Controlling the Periodic Offshore Blooms in Beibu Gulf. J. Geophys. Res. Oceans 2023, 128, e2023JC019689. [Google Scholar] [CrossRef]
  19. Lao, Q.; Liu, S.; Wang, C.; Chen, F. Global Warming Weakens the Ocean Front and Phytoplankton Blooms in the Luzon Strait over the Past 40 Years. J. Geophys. Res. Biogeosci. 2023, 128, e2023JG007726. [Google Scholar] [CrossRef]
  20. Palter, J.B.; Marinov, I.; Sarmiento, J.L.; Gruber, N. Large-Scale, Persistent Nutrient Fronts of the World Ocean: Impacts on Biogeochemistry. In Chemical Oceanography of Frontal Zones; Belkin, I.M., Ed.; Springer: Berlin/Heidelberg, Germany, 2022; pp. 25–62. ISBN 978-3-662-65839-0. [Google Scholar]
  21. Chapman, C.C.; Lea, M.-A.; Meyer, A.; Sallée, J.-B.; Hindell, M. Defining Southern Ocean Fronts and Their Influence on Biological and Physical Processes in a Changing Climate. Nat. Clim. Change 2020, 10, 209–219. [Google Scholar] [CrossRef]
  22. Mahadevan, A.; Archer, D. Modeling the Impact of Fronts and Mesoscale Circulation on the Nutrient Supply and Biogeochemistry of the Upper Ocean. J. Geophys. Res. Oceans 2000, 105, 1209–1225. [Google Scholar] [CrossRef]
  23. Huang, W.P. Modelling the Effects of Typhoons on Morphological Changes in the Estuary of Beinan, Taiwan. Cont. Shelf Res. 2017, 135, 1–13. [Google Scholar] [CrossRef]
  24. Suzuki, S.; Niino, H.; Kimura, R. The Mechanism of Upper-Oceanic Vertical Motions Forced by a Moving Typhoon. Fluid Dyn. Res. 2011, 43, 25504. [Google Scholar] [CrossRef]
  25. Lao, Q.; Lu, X.; Chen, F.; Chen, C.; Jin, G.; Zhu, Q. A Comparative Study on Source of Water Masses and Nutrient Supply in Zhanjiang Bay during the Normal Summer, Rainstorm, and Typhoon Periods: Insights from Dual Water Isotopes. Sci. Total Environ. 2023, 903, 166853. [Google Scholar] [CrossRef]
  26. Zhou, X.; Zhang, S.; Chen, C.; Lao, Q.; Chen, F. Changes in Fronts Regulate Nitrate Cycling in Zhanjiang Bay: A Comparative Study during the Normal Wet Season, Rainstorm, and Typhoon Periods. Sci. Total Environ. 2024, 931, 172902. [Google Scholar] [CrossRef]
  27. Yu, Y.; Xing, X.; Liu, H.; Yuan, Y.; Wang, Y.; Chai, F. The Variability of Chlorophyll-a and Its Relationship with Dynamic Factors in the Basin of the South China Sea. J. Mar. Syst. 2019, 200, 103230. [Google Scholar] [CrossRef]
  28. Chen, F.; Huang, C.; Lao, Q.; Zhang, S.; Chen, C.; Zhou, X.; Lu, X.; Zhu, Q. Typhoon Control of Precipitation Dual Isotopes in Southern China and Its Palaeoenvironmental Implications. J. Geophys. Res. Atmos. 2021, 126, e2020JD034336. [Google Scholar] [CrossRef]
  29. Li, D.; Gan, J.; Hui, R.; Liu, Z.; Yu, L.; Lu, Z.; Dai, M. Vortex and Biogeochemical Dynamics for the Hypoxia Formation within the Coastal Transition Zone off the Pearl River Estuary. J. Geophys. Res. Oceans 2020, 125, e2020JC016178. [Google Scholar] [CrossRef]
  30. Garnesson, P.; Mangin, A.; Fanton d’Andon, O.; Demaria, J.; Bretagnon, M. The CMEMS GlobColour Chlorophyll a Product Based on Satellite Observation: Multi-Sensor Merging and Flagging Strategies. Ocean Sci. 2019, 15, 819–830. [Google Scholar] [CrossRef]
  31. Belkin, I.M.; O’Reilly, J.E. An Algorithm for Oceanic Front Detection in Chlorophyll and SST Satellite Imagery. J. Mar. Syst. 2009, 78, 319–326. [Google Scholar] [CrossRef]
  32. Wang, D.; Liu, Y.; Qi, Y.; Shi, P. Seasonal Variability of Thermal Fronts in the Northern South China Sea from Satellite Data. Geophys. Res. Lett. 2001, 28, 3963–3966. [Google Scholar] [CrossRef]
  33. Jing, Z.; Qi, Y.; Zhang, S.; Du, Y.; Xie, L. Summer Upwelling and Thermal Fronts in the Northwestern South China Sea: Observational Analysis of Two Mesoscale Mapping Surveys. J. Geophys. Res. Oceans 2015, 120, 1993–2006. [Google Scholar] [CrossRef]
  34. Wang, G.; Li, J.; Wang, C.; Yan, Y. Interactions among the Winter Monsoon, Ocean Eddy and Ocean Thermal Front in the South China Sea. J. Geophys. Res. Oceans 2012, 117, C08002. [Google Scholar] [CrossRef]
  35. Price, J.F. Upper Ocean Response to a Hurricane. J. Phys. Oceanogr. 1981, 11, 153–175. [Google Scholar] [CrossRef]
  36. Yang, L.; Yuan, D. Absolute Geostrophic Currents in Global Tropical Oceans. Chin. J. Oceanol. Limnol. 2016, 34, 1383–1393. [Google Scholar] [CrossRef]
  37. Li, D.; Gan, J.; Hui, C.; Yu, L.; Liu, Z.; Lu, Z.; Kao, S.-J.; Dai, M. Spatiotemporal Development and Dissipation of Hypoxia Induced by Variable Wind-driven Shelf Circulation off the Pearl River Estuary: Observational and Modeling Studies. J. Geophys. Res. Oceans 2021, 126, e2020JC016700. [Google Scholar] [CrossRef]
  38. Jing, Z.; Qi, Y.; Fox-Kemper, B.; Du, Y.; Lian, S. Seasonal Thermal Fronts on the Northern South China Sea Shelf: Satellite Measurements and Three Repeated Field Surveys. J. Geophys. Res. Oceans 2016, 121, 1914–1930. [Google Scholar] [CrossRef]
  39. Wang, G.; Ling, Z.; Wang, C. Influence of Tropical Cyclones on Seasonal Ocean Circulation in the South China Sea. J. Geophys. Res. Oceans 2009, 114, 2009JC005302. [Google Scholar] [CrossRef]
  40. Li, D.; Gan, J.; Lu, Z.; Cheng, W.; Kung, H.; Li, J. Hypoxia Formation Triggered by the Organic Matter from Subsurface Chlorophyll Maximum in a Large Estuary-Shelf System. Water Res. 2023, 240, 120063. [Google Scholar] [CrossRef]
  41. Prants, S.V. Marine Life at Lagrangian Fronts. Prog. Oceanogr. 2022, 204, 102790. [Google Scholar] [CrossRef]
  42. Guo, L.; Xiu, P.; Chai, F.; Xue, H.; Wang, D.; Sun, J. Enhanced Chlorophyll Concentrations Induced by Kuroshio Intrusion Fronts in the Northern South China Sea. Geophys. Res. Lett. 2017, 44, 11565–11572. [Google Scholar] [CrossRef]
  43. Xing, Q.; Yu, H.; Wang, H. Global Mapping and Evolution of Persistent Fronts in Large Marine Ecosystems over the Past 40 Years. Nat. Commun. 2024, 15, 4090. [Google Scholar] [CrossRef]
  44. Lv, T.; Liu, D.; Zhou, P.; Lin, L.; Wang, Y.; Wang, Y. The Coastal Front Modulates the Timing and Magnitude of Spring Phytoplankton Bloom in the Yellow Sea. Water Res. 2022, 220, 118669. [Google Scholar] [CrossRef] [PubMed]
  45. Qi, L.; Hu, C.; Liu, J.; Ma, R.; Zhang, Y.; Zhang, S. Noctiluca Blooms in the East China Sea Bounded by Ocean Fronts. Harmful Algae 2022, 112, 102172. [Google Scholar] [CrossRef] [PubMed]
  46. Yang, K.; Meyer, A.; Strutton, P.; Fischer, A. Global Trends of Fronts and Chlorophyll in a Warming Ocean. Commun. Earth Environ. 2023, 4, 489. [Google Scholar] [CrossRef]
  47. Ye, F.; Jia, G.; Xie, L.; Wei, G.; Xu, J. Isotope Constraints on Seasonal Dynamics of Dissolved and Particulate N in the Pearl River Estuary, South China. J. Geophys. Res. Oceans 2016, 121, 8689–8705. [Google Scholar] [CrossRef]
  48. Deng, Y.; Liu, Z.; Zu, T.; Hu, J.; Gan, J.; Yuxin, L.; Li, Z.; Quan, Q.; Cai, Z. Climatic Controls on the Interannual Variability of Shelf Circulation in the Northern South China Sea. J. Geophys. Res. Oceans 2022, 127, e2022JC018419. [Google Scholar] [CrossRef]
  49. Lao, Q.; Chen, F.; Liu, G.; Chen, C.; Jin, G.; Zhu, Q.; Wei, C.; Zhang, C. Isotopic Evidence for the Shift of Nitrate Sources and Active Biological Transformation on the Western Coast of Guangdong Province, South China. Mar. Pollut. Bull. 2019, 142, 603–612. [Google Scholar] [CrossRef]
  50. Zhou, J.; Wang, Y.-S. A Comprehensive Approach to Assessing Eutrophication for the Guangdong Coastal Waters in China. Front. Mar. Sci. 2024, 10, 1280821. [Google Scholar] [CrossRef]
  51. Zhou, X.; Zhang, S.; Liu, S.; Chen, C.; Lao, Q.; Chen, F. Thermal Fronts in Coastal Waters Regulate Phytoplankton Blooms via Acting as Barriers: A Case Study from Western Guangdong, China. J. Hydrol. 2024, 636, 131350. [Google Scholar] [CrossRef]
  52. Zhang, H.; Cheng, W.; Chen, Y.; Yu, L.; Gong, W. Controls on the Interannual Variability of Hypoxia in a Subtropical Embayment and Its Adjacent Waters in the Guangdong Coastal Upwelling System, Northern South China Sea. Ocean Dyn. 2018, 68, 1–16. [Google Scholar] [CrossRef]
  53. Yang, C.; Ye, H. Enhanced Chlorophyll-a in the Coastal Waters near the Eastern Guangdong during the Downwelling Favorable Wind Period. Remote Sens. 2022, 14, 1138. [Google Scholar] [CrossRef]
  54. Yu, L.; Gan, J.; Dai, M.; Hui, C.R.; Lu, Z.; Li, D. Modeling the Role of Riverine Organic Matter in Hypoxia Formation within the Coastal Transition Zone off the Pearl River Estuary. Limnol. Oceanogr. 2021, 66, 452–468. [Google Scholar] [CrossRef]
  55. Wang, L.; Lei, X.; Zhou, Y.; Mao, X.-Z.; Han, J.-C.; Li, B.; Huang, Y.; Zhao, R.; Bi, H.; Tang, Z.; et al. Unforeseen Nitrate Accumulation under Nutrient Mitigation Measures in the East Pearl River Estuary: Phenomenon, Drivers and Implications. J. Hydrol. Reg. Stud. 2023, 50, 101554. [Google Scholar] [CrossRef]
  56. Chen, J.; Cao, R.; Lao, Q.; Chen, F.; Zhang, S.; Bian, P. Typhoon Merbok Induced Upwelling Impact on Material Transport in the Coastal Northern South China Sea. PLoS ONE 2020, 15, e0228220. [Google Scholar] [CrossRef]
  57. Zhao, H.; Zhao, K.; Klotzbach, P.; Chand, S.; Camargo, S.; Cao, J.; Wu, L. Decreasing Global Tropical Cyclone Frequency in CMIP6 Historical Simulations. Sci. Adv. 2024, 10, eadl2142. [Google Scholar] [CrossRef]
  58. Wang, G.; Wu, L.; Mei, W.; Xie, S.-P. Ocean Currents Show Global Intensification of Weak Tropical Cyclones. Nature 2022, 611, 496–500. [Google Scholar] [CrossRef]
  59. Miles, T.; Seroka, G.; Glenn, S. Coastal Ocean Circulation during Hurricane Sandy. J. Geophys. Res. Oceans 2017, 122, 7095–7114. [Google Scholar] [CrossRef]
  60. Cong, S.; Wu, X.; Ge, J.; Bi, N.; Li, Y.; Lu, J.; Wang, H. Intermittent Migration of Mixing Front Driven by Typhoon Events on the Inner Shelf of the East China Sea: A FVCOM Modeling Study. Mar. Geol. 2023, 465, 107161. [Google Scholar] [CrossRef]
  61. Han, H.; Xiao, R.; Gao, G.; Yin, B.; Liang, S.; Lv, X. Influence of a Heavy Rainfall Event on Nutrients and Phytoplankton Dynamics in a Well-Mixed Semi-Enclosed Bay. J. Hydrol. 2023, 617, 128932. [Google Scholar] [CrossRef]
  62. Felt, V.; Kacker, S.; Kusters, J.; Pendergrast, J.; Cahoy, K. Fast Ocean Front Detection Using Deep Learning Edge Detection Models. IEEE Trans. Geosci. Remote Sens. 2023, 61, 4204812. [Google Scholar] [CrossRef]
  63. Chen, Z.; Feng, J.; Li, T.; Zhang, S.; Lian, Q.; Wang, F. Seasonal Variability of the Pearl River Plume Front Based on Deep Learning. Cont. Shelf Res. 2025, 285, 105395. [Google Scholar] [CrossRef]
  64. Sung, T.; Kim, S.-H.; Sim, S.; Han, D.; Jang, E.; Im, J. Expanding High-Resolution Sea Surface Salinity Estimation from Coastal Seas to Open Oceans through the Synergistic Use of Multi-Source Data with Machine Learning. Int. J. Appl. Earth Obs. Geoinf. 2025, 137, 104427. [Google Scholar] [CrossRef]
Figure 1. The migration track of typhoons Nuri (2020) (blue cross) and Merbok (2017) (purple cross) (a) and the study area (b). Within the 60 m isobath (black solid line) is nearshore, and vice versa is offshore.
Remotesensing 17 02165 g001
Figure 2. The rainfall during the typhoons Nuri (2020) (ad) and Merbok (2017) (eh). (a,e) are daily averaged data over one week before the typhoon, (bd) are, respectively, daily averaged data over first week, second week, and third week after Typhoon Nuri (2020). (fh) are, respectively, first week, second week, and third week after Typhoon Merbok (2017).
Remotesensing 17 02165 g002
Figure 3. The SST in the study area before and after Typhoon Nuri (2020) (af) and Merbok (2017) (gl). (a,g) are daily averaged data over one week before typhoon. (bf) are, respectively, first day, day 4, day 7, day 14, and day 21 after Typhoon Nuri (2020). (hl) are, respectively, first day, day 4, day 7, day 14, and day 21 after Typhoon Merbok (2017).
Remotesensing 17 02165 g003
Figure 4. Spatiotemporal variability in the rainfall, SST, SST gradients, geostrophic currents, wind, EPV, and chlorophyll at the nearshore (NS) and offshore (OS) areas in the eastern PRE before and after typhoons Nuri (2020) and Merbok (2017).
Remotesensing 17 02165 g004
Figure 5. The SST gradients in the study area before and after the Typhoon Nuri (2020) (af) and Merbok (2017) (gl), ranged from 0 to 0.15 °C km−1 and 0 to 0.05 °C km−1, respectively. (a,g) are daily averaged data over one week before typhoon. (bf) are first day, day 4, day 7, day 14, and day 21 after Typhoon Nuri (2020). (hl) are, respectively, first day, day 4, day 7, day 14, and day 21 after Typhoon Merbok (2017).
Remotesensing 17 02165 g005
Figure 6. The geostrophic current in the study area before and after the Typhoon Nuri (2020) (ad) and Merbok (2017) (eh). (a,e) are daily averaged data over one week before the typhoon. (bd) are, respectively, daily averaged data over first week, second week, and third week after the Typhoon Nuri (2020). (fh) are, respectively, daily averaged data over first week, second week, and third week after the Typhoon Merbok (2017).
Remotesensing 17 02165 g006
Figure 7. The correlation of various parameters during typhoons. Geouv: the intensity of geostrophic current.
Remotesensing 17 02165 g007
Figure 8. The Ekman pumping velocity (EPV) in the study area before and after Typhoon Nuri (2020) (af) and Merbok (2017) (gl). (a,g) are daily averaged data over one week before the typhoon. (bf) are, respectively, first day, day 4, day 7, day 14, and day 21 after Typhoon Nuri (2020). (hl) are, respectively, first day, day 4, day 7, day 14 and day 21 after the Typhoon Merbok (2017).
Remotesensing 17 02165 g008
Figure 9. The chlorophyll levels in the study area before and after the Typhoon Nuri (2020) (af) and Merbok (2017) (gl). (a,g) are daily averaged data over one week before the typhoon. (bf) are, respectively, first day, day 4, day 7, day 14, and day 21 after Typhoon Nuri (2020). (hl) are, respectively, first day, day 4, day 7, day 14 and day 21 after Typhoon Merbok (2017).
Remotesensing 17 02165 g009
Figure 10. The spatial distribution of the correlation coefficient between SST gradients and chlorophyll at the nearshore areas in the eastern PRE before and after typhoon Nuri (2020) (ac) and Merbok (2017) (df), with r values of −0.26 (p < 0.05), −0.21 (p > 0.05), −0.36 (p < 0.05), −0.53 (p < 0.05), −0.35 (p < 0.05), and −0.49 (p < 0.05), respectively. Asterisks indicate statistically significant (p < 0.05). The dashed boxes indicate edge of the frontal zone.
Remotesensing 17 02165 g010
Figure 11. The diagram of the dynamic mechanism of the changes in front activity and chlorophyll distribution induced by typhoons.
Remotesensing 17 02165 g011
Table 1. Summary of the rainfall, SST, SST gradients, and geostrophic currents at the nearshore (NS) and offshore (OS) areas during the pre-typhoon and post-typhoon periods in the eastern PRE.
Rain (mm)SST (℃)SST Gradients (℃/km)Geouv (m/s)
Nuri (2020)Merbok (2017)Nuri (2020)Merbok (2017)Nuri (2020)Merbok (2017)Nuri (2020)Merbok (2017)
NSOSNSOSNSOSNSOSNSOSNSOSNSOSNSOS
Pre-typhoon53.88 ± 24.7927.28 ± 13.910.40 ± 0.770.17 ± 0.4028.61 ± 0.4829.06 ± 0.4628.72 ± 0.3128.78 ± 0.320.070 ± 0.0130.057 ± 0.0140.028 ± 0.0050.014 ± 0.0020.327 ± 0.1040.142 ± 0.0810.141 ± 0.0590.122 ± 0.045
First day5.28 ± 4.498.89 ± 6.490.14 ± 0.130.32 ± 0.3128.97 ± 0.4229.00 ± 0.4129.41 ± 0.3128.83 ± 0.450.071 ± 0.0160.057 ± 0.0120.029 ± 0.0050.025 ± 0.0050.367 ± 0.1150.150 ± 0.0820.163 ± 0.0620.123 ± 0.050
Day 40.08 ± 0.210.00 ± 022.76 ± 12.789.03 ± 8.9229.14 ± 0.3929.37 ± 0.2528.63 ± 0.2228.34 ± 0.310.035 ± 0.0170.043 ± 0.0080.023 ± 0.0050.023 ± 0.0050.385 ± 0.1250.153 ± 0.0800.183 ± 0.0640.126 ± 0.058
Day 70.14 ± 0.220.01 ± 0.0490.49 ± 41.99140.04 ± 62.0528.95 ± 0.6429.71 ± 0.2028.24 ± 0.1627.99 ± 0.290.113 ± 0.0290.033 ± 0.0080.013 ± 0.0030.020 ± 0.0040.385 ± 0.1330.153 ± 0.0820.208 ± 0.0670.139 ± 0.069
Day 140.52 ± 0.680.10 ± 0.270.85 ± 1.660.19 ± 0.4729.10 ± 0.5630.26 ± 0.2428.61 ± 0.2428.90 ± 0.170.091 ± 0.0190.029 ± 0.0060.031 ± 0.0050.011 ± 0.0020.365 ± 0.1440.170 ± 0.0710.212 ± 0.0900.163 ± 0.101
Day 211.02 ± 1.30.16 ± 0.4611.37 ± 13.403.89 ± 3.4829.54 ± 0.6730.10 ± 0.2529.08 ± 0.5229.69 ± 0.380.106 ± 0.0210.032 ± 0.0080.070 ± 0.0110.023 ± 0.0030.369 ± 0.1440.179 ± 0.0870.228 ± 0.1040.184 ± 0.117
Table 2. Summary of the wind, EPV, and chlorophyll levels at the nearshore (NS) and offshore (OS) areas during the pre-typhoon and post-typhoon periods in the eastern PRE.
Wind (m/s)EPV (×10−6 m/s)Chla (mg/m3)
Nuri (2020)Merbok (2017)Nuri (2020)Merbok (2017)Nuri (2020)Merbok (2017)
NSOSNSOSNSOSNSOSNSOSNSOS
Pre-typhoon3.99 ± 0.934.75 ± 0.663.28 ± 0.614.16 ± 0.342.14 ± 3.80−2.04 ± 2.37−0.84 ± 2.02−0.63 ± 0.768.31 ± 3.342.57 ± 0.802.84 ± 1.150.60 ± 0.15
First day7.25 ± 1.138.44 ± 0.618.62 ± 1.749.32 ± 2.760.45 ± 8.191.59 ± 4.85−1.69 ± 1.5316.52 ± 20.121.79 ± 0.510.69 ± 0.1813.00 ± 3.890.28 ± 0.06
Day 44.81 ± 0.674.91 ± 0.605.56 ± 1.316.84 ± 0.281.77 ± 4.89−3.75 ± 0.726.29 ± 8.75−2.66 ± 1.904.03 ± 1.781.65 ± 0.5813.46 ± 3.760.30 ± 0.07
Day 74.60 ± 0.914.66 ± 0.226.19 ± 2.007.33 ± 0.402.75 ± 3.25−2.50 ± 0.8210.87 ± 9.14−1.45 ± 2.725.79 ± 2.471.60 ± 0.353.70 ± 1.002.3 ± 0.68
Day 144.04 ± 0.574.51 ± 0.676.13 ± 1.206.82 ± 0.171.27 ± 3.12−2.90 ± 0.486.21 ± 6.45−2.46 ± 1.502.81 ± 0.830.76 ± 0.1211.78 ± 4.982.79 ± 0.93
Day 214.13 ± 0.895.34 ± 0.585.33 ± 1.066.71 ± 0.381.82 ± 3.34−2.74 ± 1.762.99 ± 5.47−1.57 ± 2.403.51 ± 1.370.52 ± 0.142.05 ± 0.810.77 ± 0.20
Disclaimer/Publisher’s Note: The statements, opinions and data contained in all publications are solely those of the individual author(s) and contributor(s) and not of MDPI and/or the editor(s). MDPI and/or the editor(s) disclaim responsibility for any injury to people or property resulting from any ideas, methods, instructions or products referred to in the content.

