1. Introduction
The Orbiting Carbon Observatory-3 (OCO-3) is a NASA-JPL mission [
1] launched on 4 May 2019 and operating on board the International Space Station (ISS) [
2]. The OCO-3 instrument is designed to quantify atmospheric CO
2 concentrations by measuring Earth-reflected solar radiation within the near-infrared to shortwave infrared (NIR-SWIR) spectral range. The instrument is able to acquire in the Snapshot Area Map (SAM) mode [
3], collecting data over 80 km by 80 km with a spatial resolution of about 1.6 km × 2.2 km at nadir. The mission targets a diverse range of sites, including deserts, volcanoes, regions with significant fossil emissions, and validation areas. OCO-3 data are applied to monitor CO
2 emissions from specific high-emission sources such as industrial facilities [
4] and major urban centres [
5], but not volcanoes. However, CO
2 fluxes in volcanic areas have been remotely estimated by means of predecessor OCO-2 data [
6,
7].
CO
2 emissions play a crucial role in the dynamics of volcanic activity, particularly in the generation and eruption of magma [
8]. High concentrations of volatiles, including CO
2, lower the density of magma, making it more buoyant and able to rise toward the surface [
9]; moreover, CO
2 emissions are critical indicators of volcanic unrest since they begin to degas at greater depths. This means that CO
2 emissions can precede other gas emissions, such as SO
2, making CO
2 monitoring a valuable tool for predicting volcanic eruptions. Increasing levels of CO
2 at the surface often signal that magma is moving toward the surface and that an eruption may be imminent [
10].
The present work focuses on the analysis of volcanic CO
2 emissions from Mt. Etna (Italy), which is one of the most continuously degassing volcanoes in the world [
11]. On average, it emits around 9000–20,000 metric tons of CO
2 per day, though this number can fluctuate depending on volcanic activity levels. Quiescent passive degassing emits an average of 9 ktons per day [
12,
13] that can reach 12,000–20,000 tons of CO
2 per day during eruptive phases [
14]. More recent technological advancements in gas measurement, showed daily CO
2 emissions can rise dramatically during active eruptive phases, sometimes exceeding 30,000 tons per day [
15]. This makes Mt. Etna an ideal study case to test the first capability of CO
2 measurements from space.
The novelty of the present work is the exploitation of OCO-3 data for volcanic applications. Here we use and analyse statistically all measurements acquired by OCO-3 in the period 2020–2023 to obtain information on degassing activity of Mt. Etna. A preliminary sensitivity analysis was performed to understand if OCO-3 satellite acquisitions are sensitive to CO2 emissions. Then, a simple methodology was developed and applied with the aim to assess the influence of volcanic activities on CO2 emissions, by analyzing the variation of atmospheric CO2 concentration with distance from the volcano summit.
2. Materials and Methods
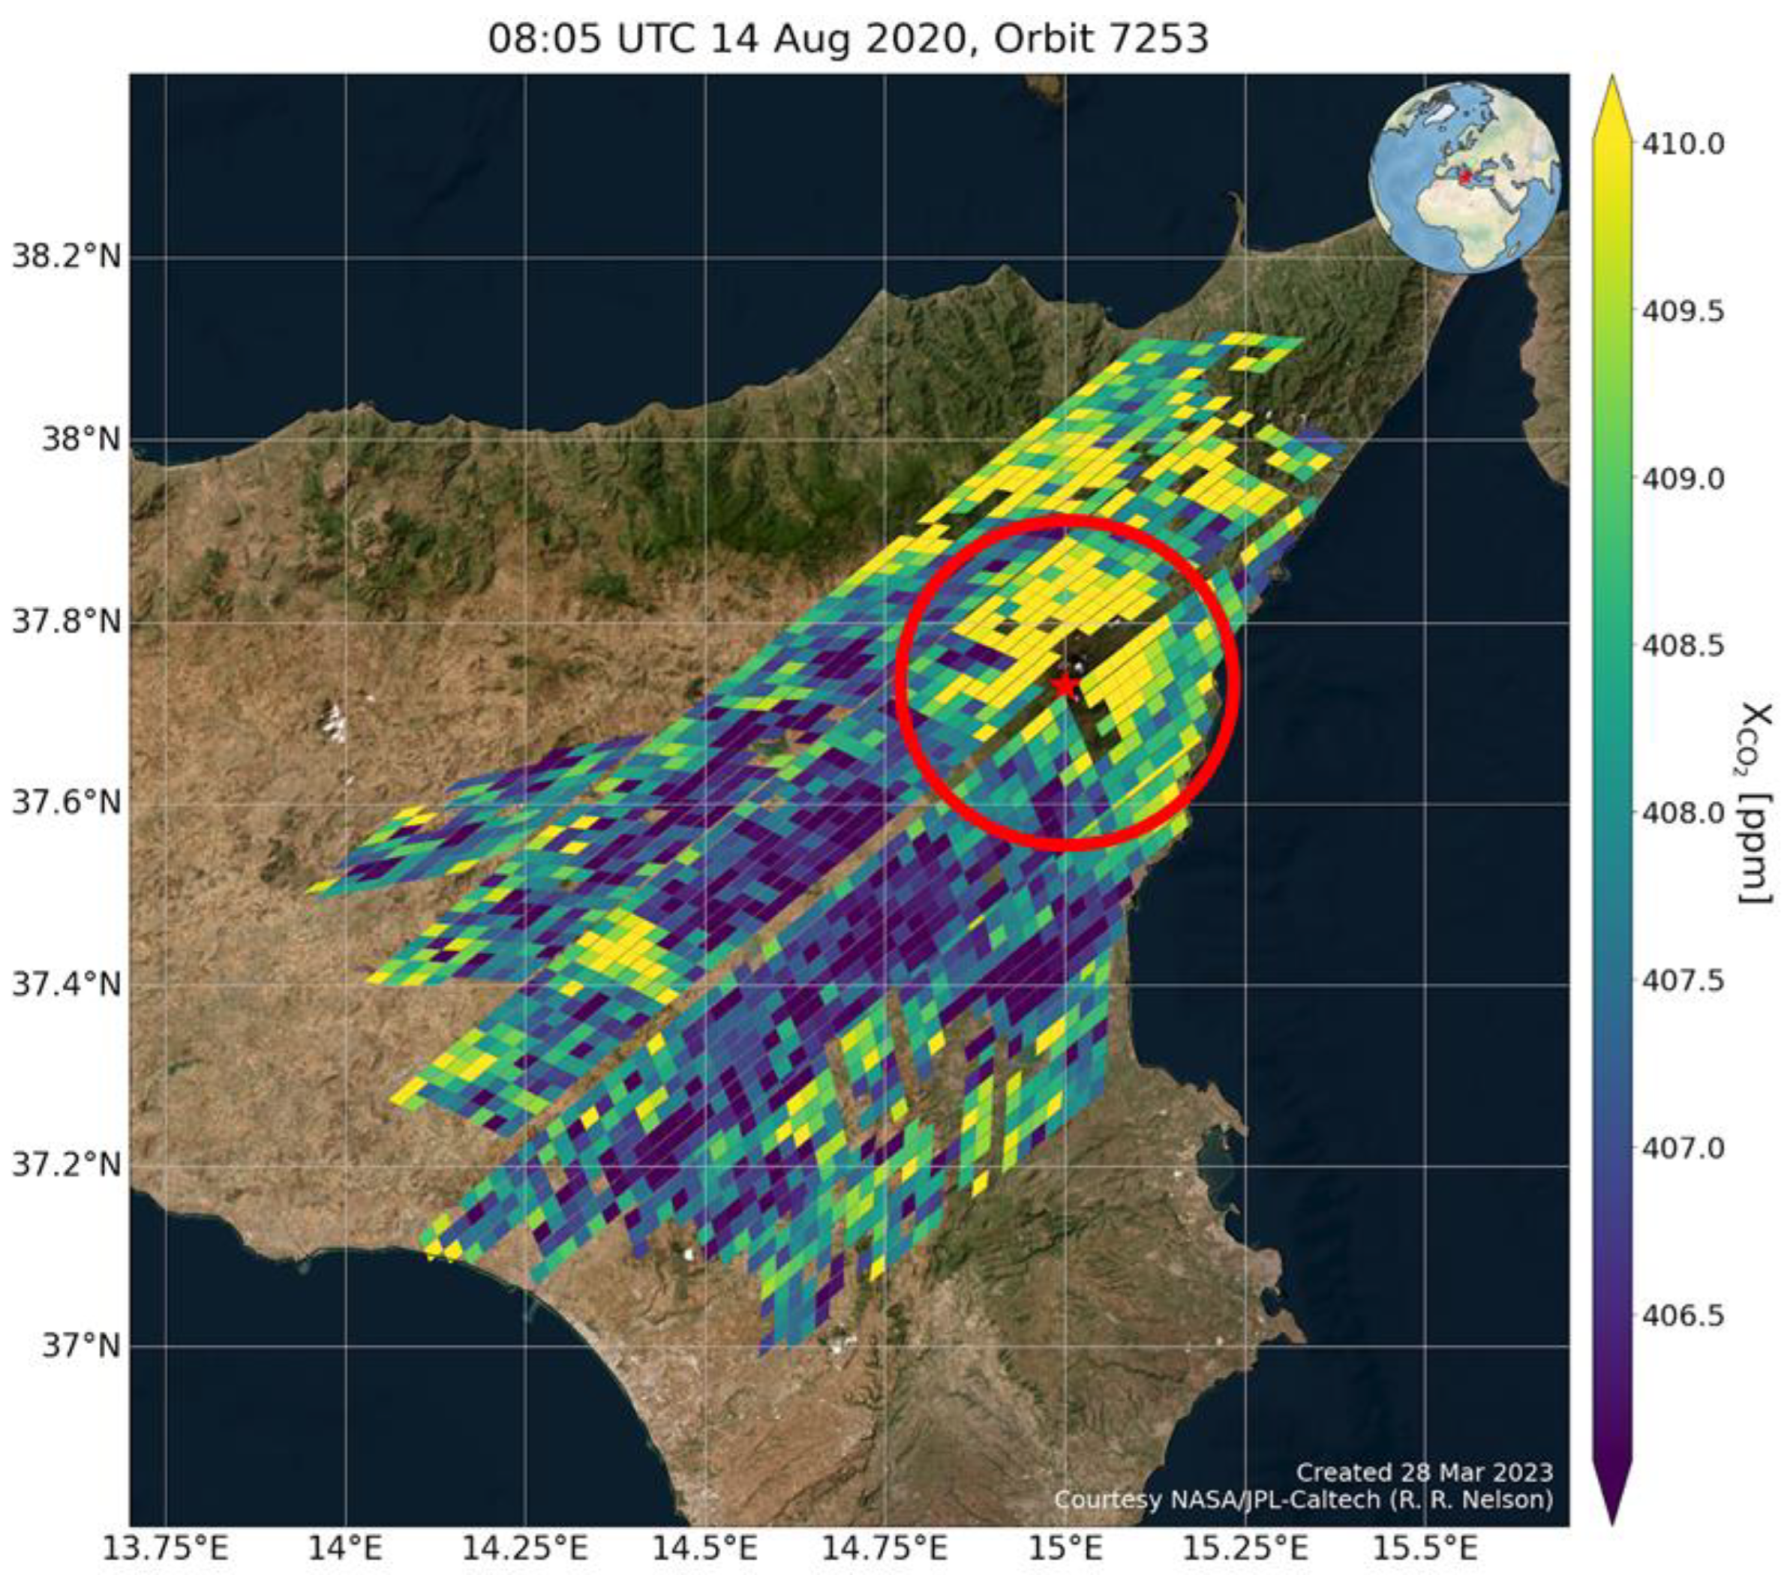
The dataset used in this work is composed of 62 OCO-3 SAM images acquired on Mt. Etna over the years 2020–2023. Specifically, the version 10 of OCO-3 XCO2 data is used. The investigated region is a circular area with a radius of 20 km from the Mt. Etna summit (Lat. = 37.753 deg; Lon. = 14.995 deg) where the main craters are located (
Figure 1).
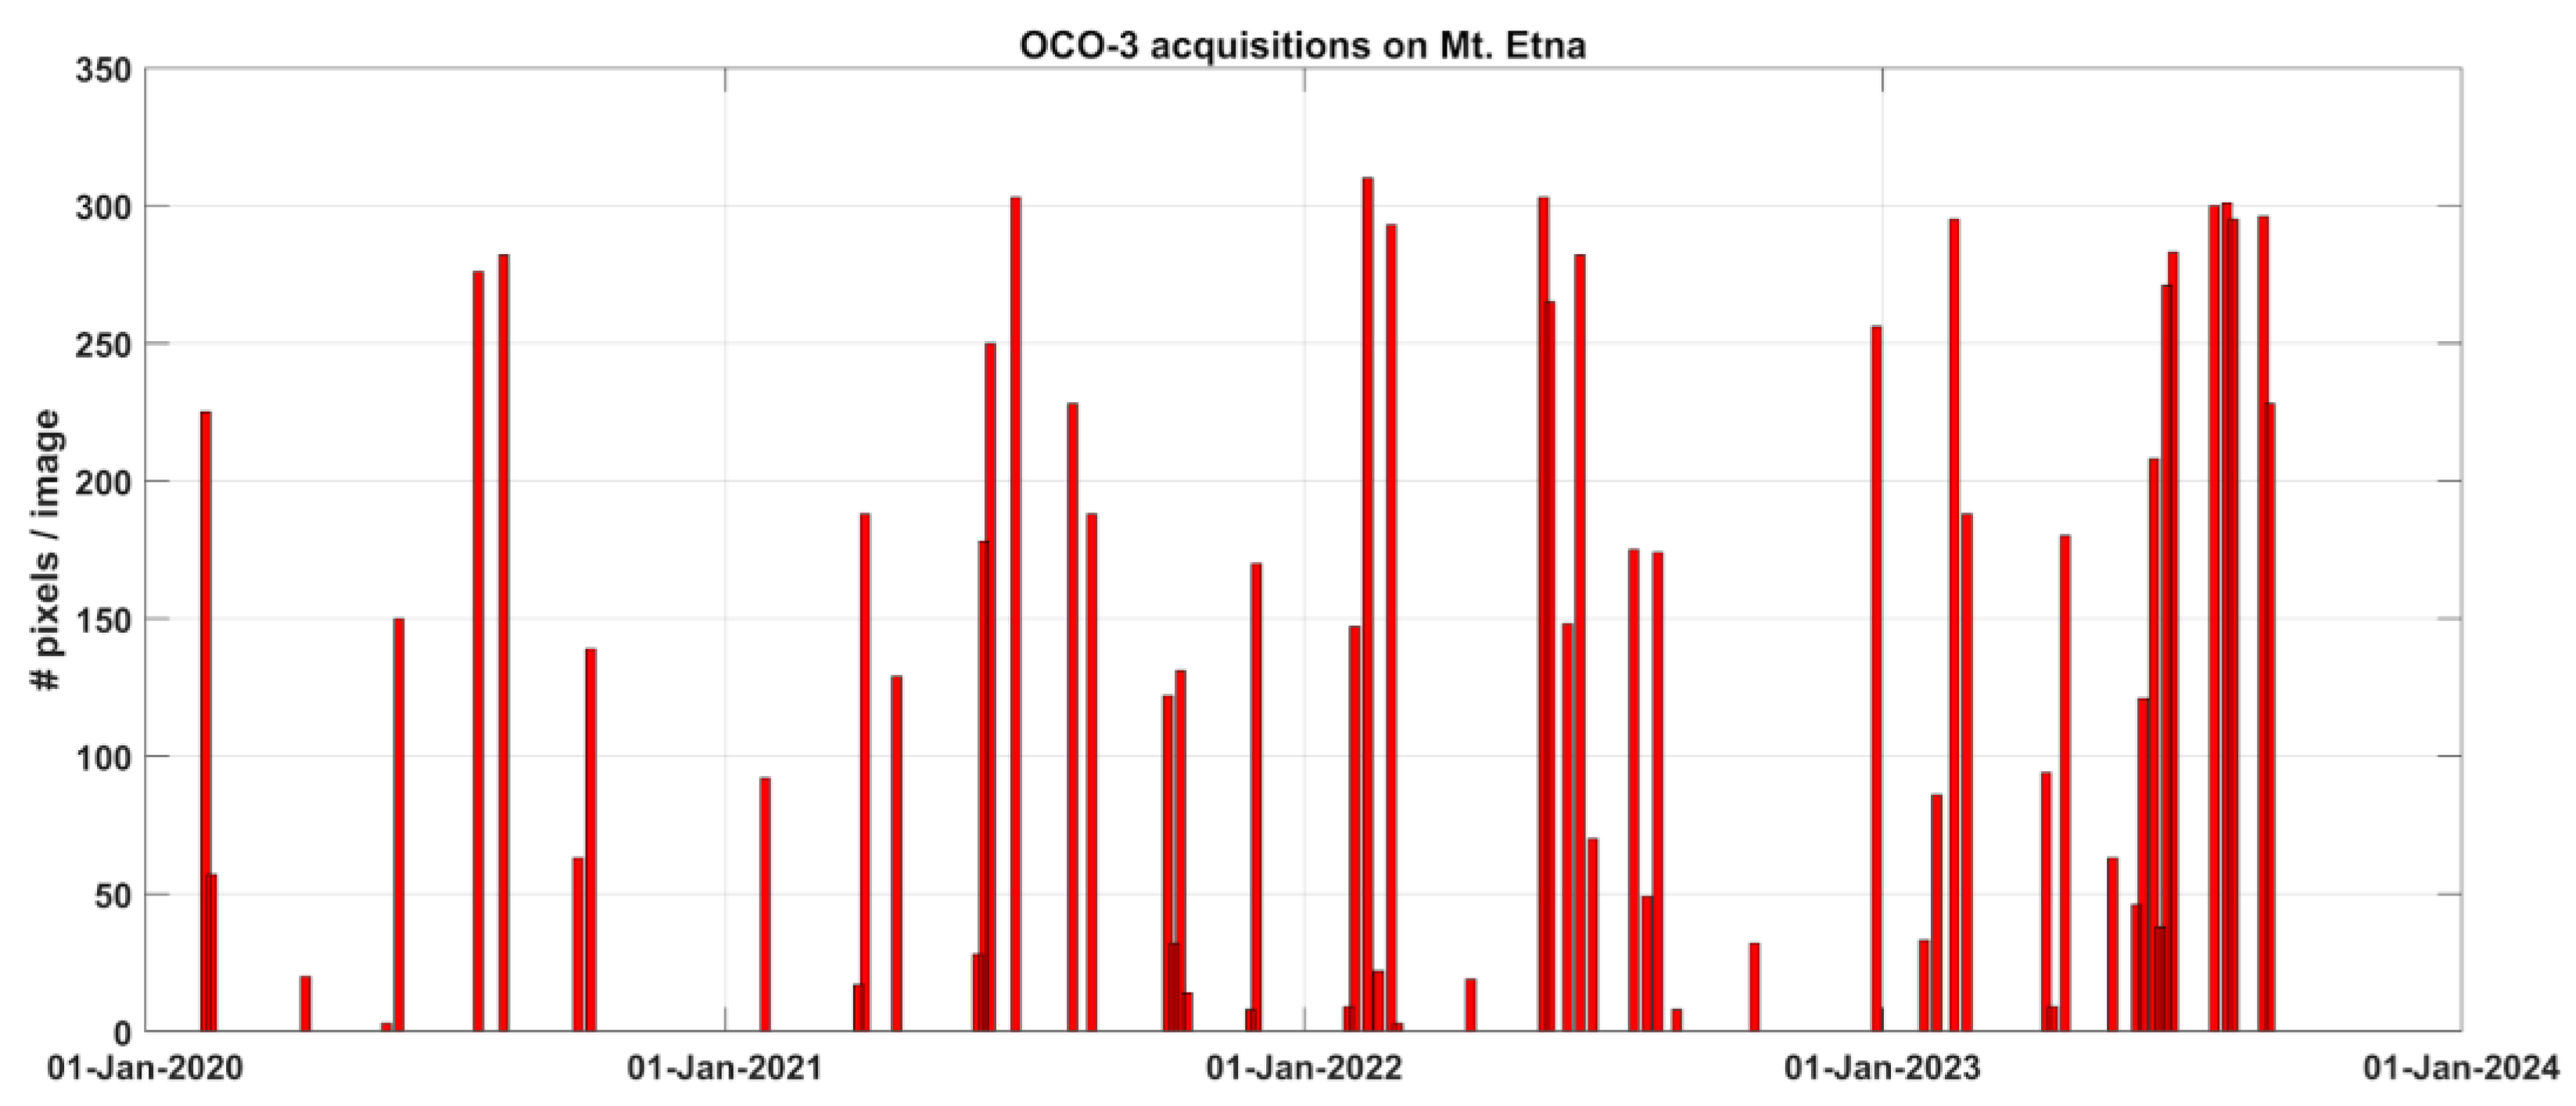
With the aim to understand whether Mt. Etna’s carbon dioxide contribution is detectable in OCO-3 data, the study methodology is based on the analysis of XCO2 concentrations as a function of the distance from the volcano summit. The first critical issue to address is the representativeness of each single OCO-3 acquisition in terms of the number of samplings (pixels) within the considered area. Indeed retrievals are only carried out on cloud-free pixels [
16], and XCO2 concentrations are provided for all retrievals that converge to a solution, which can sometimes yield a limited amount of usable data. As a result, a limited number of pixels within the area of interest (AOI) may not adequately capture the underlying phenomenology, whereas images with a higher pixel density can encompass and provide more comprehensive information on gas emissions.
Figure 2 reports the number of pixels falling into the AOI for each OCO-3 image acquired in the period 2020–2023.
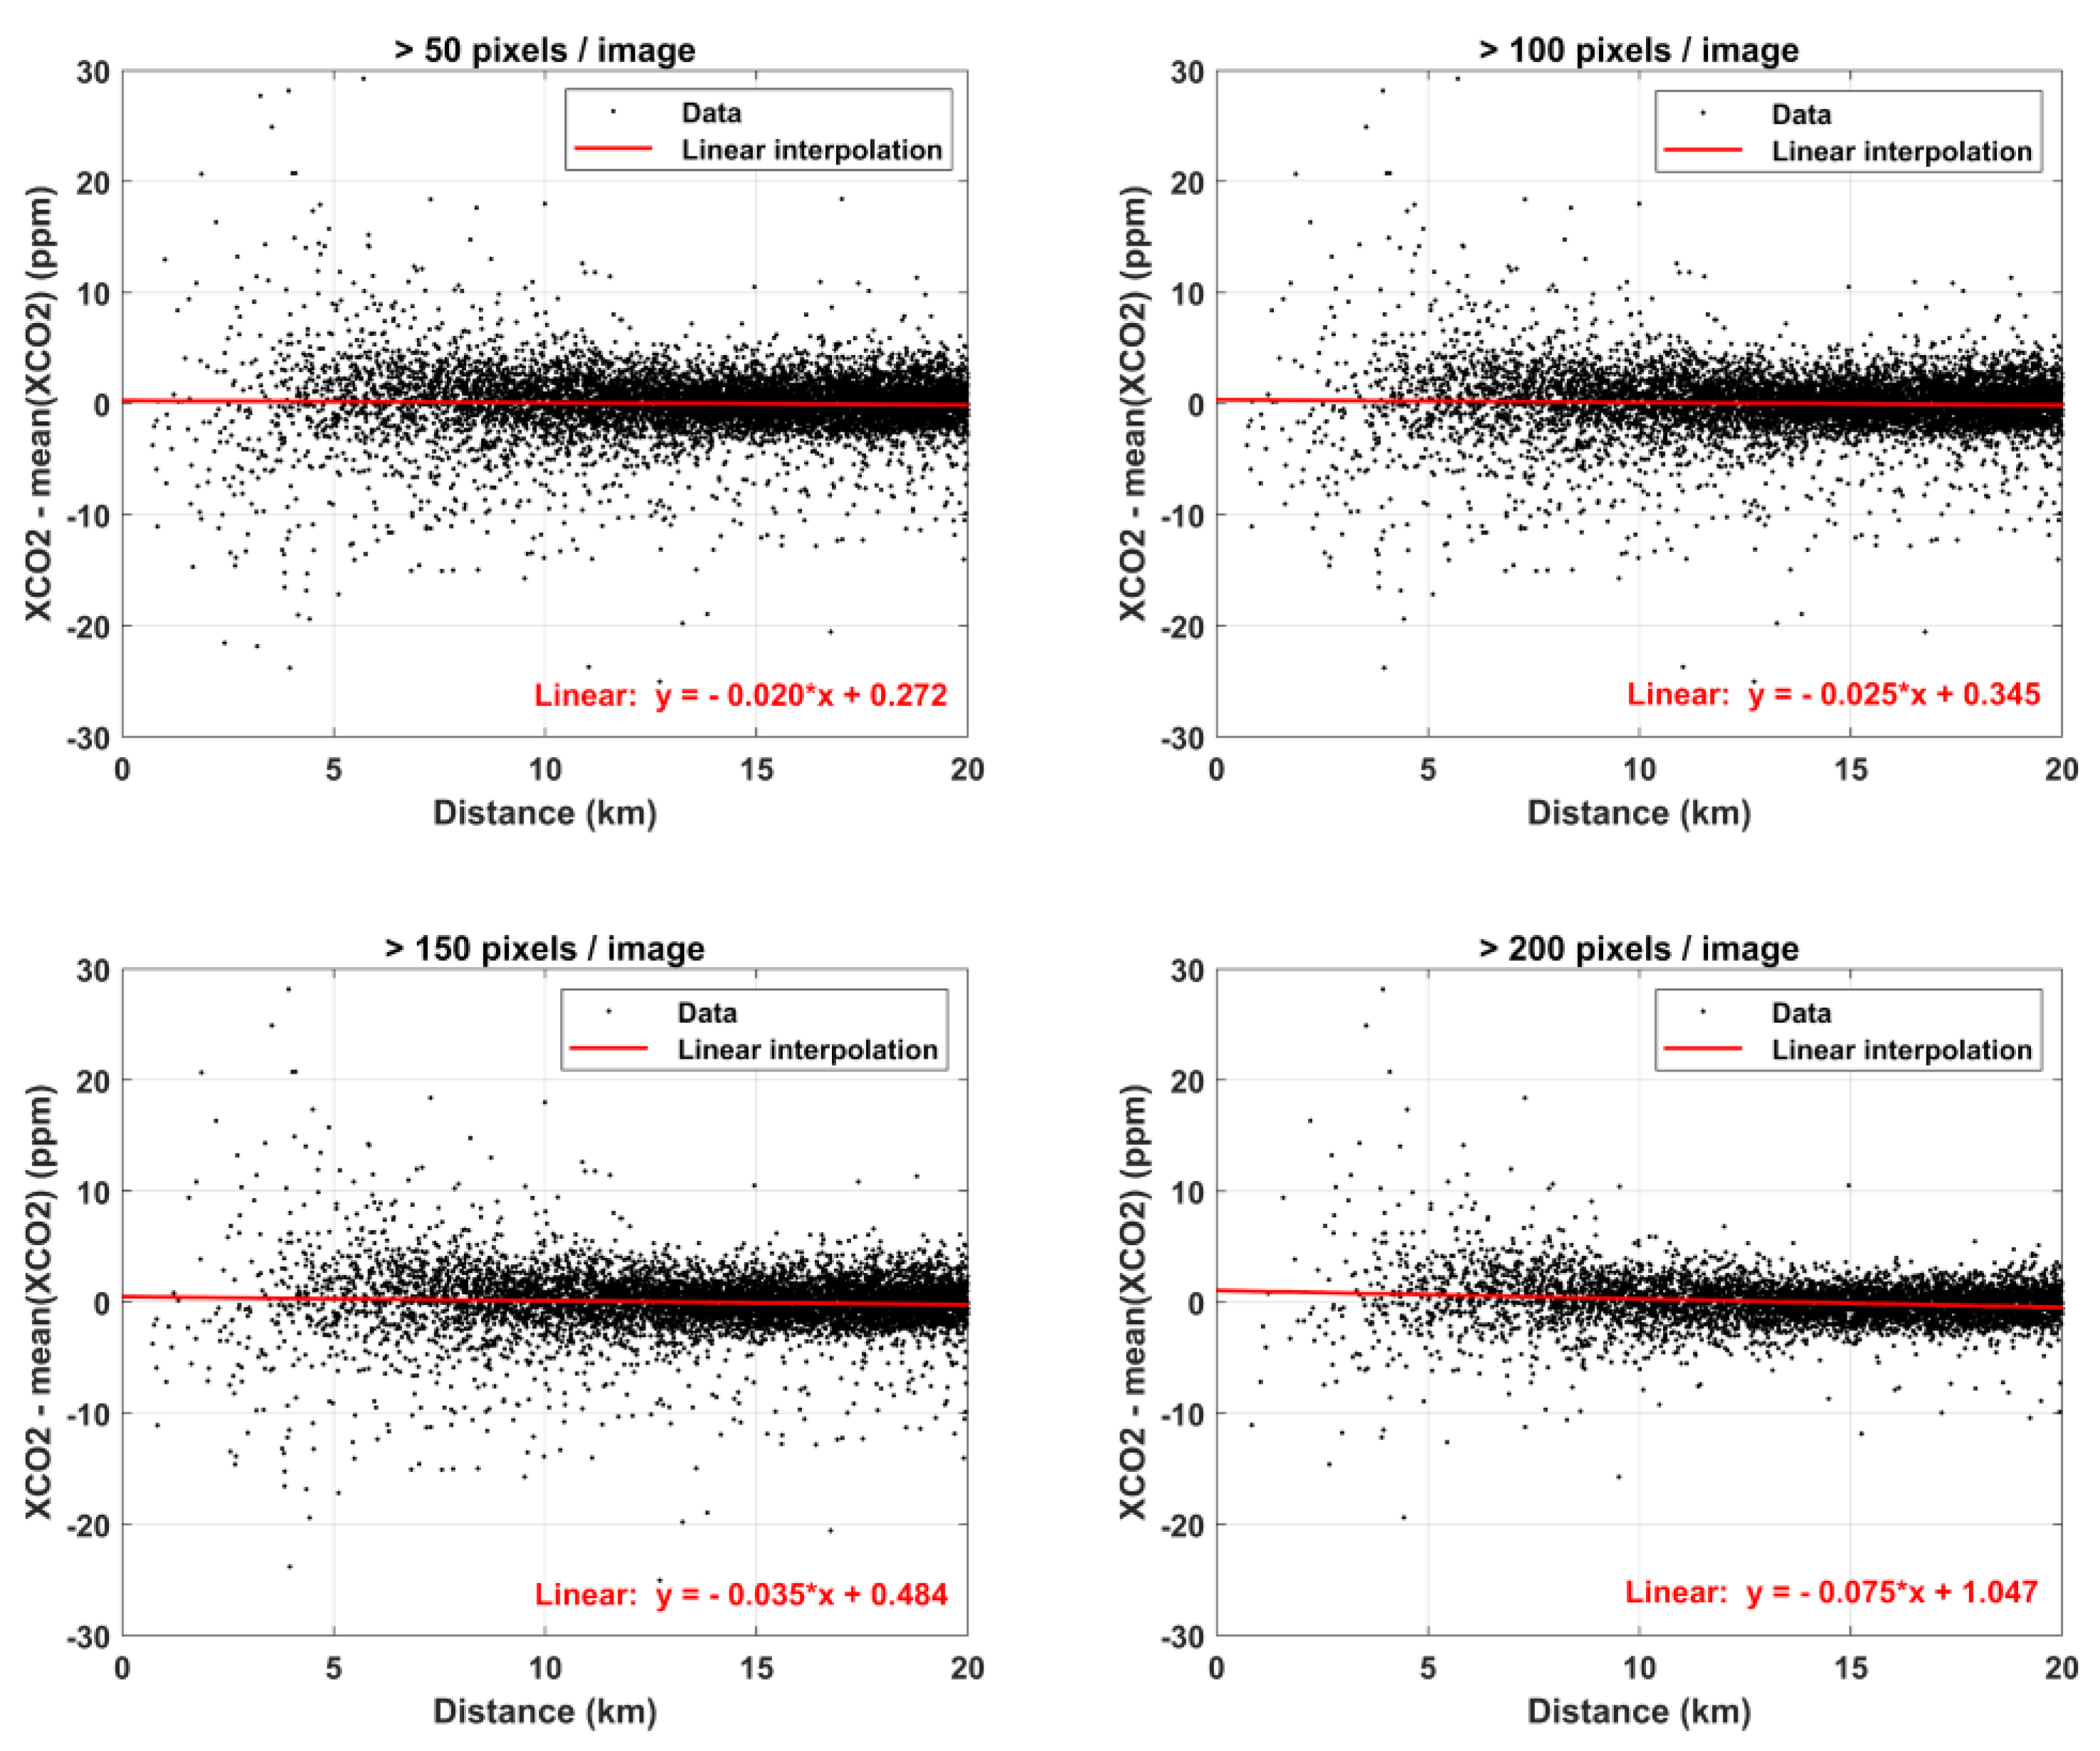
To statistically assess the entire dataset and investigate the influence of pixel density per image within the AOI on the measurement of Mt. Etna emissions in XCO2 fields, the concentrations retrieved by OCO-3 are analysed as a function of distance (ranging from 0 to 20 km). This analysis considers four distinct sampling thresholds within the AOI: 50, 100, 150, and 200 pixels per image.
Specifically, the difference between XCO2 values and the average in the AOI is considered to make the entire dataset more uniform, avoiding the seasonal variability and the trend over the years [
17]. The results of this analysis are reported in
Figure 3.
The linear interpolation method was applied to the above datasets (
Figure 3) with the aim to calculate the decreasing rates, as a function of the distance, for the four different thresholds. The angular coefficient, meaning the slope of the interpolation line, was calculated and considered as a reference parameter. This statistical analysis reveals decreasing trends for all considered thresholds with resulting angular coefficients, calculated on the range 0–20 km, of −0.020, −0.025, −0.035, and −0.075, respectively. The negative values allow us to infer that the effect of CO
2 emissions from Etna is detectable in the OCO-3 data and is the more visible the greater the AOI covered by the sampling in the individual images. Therefore, the role of data coverage appears to be crucial for detecting and assessing gas emissions from the volcano.
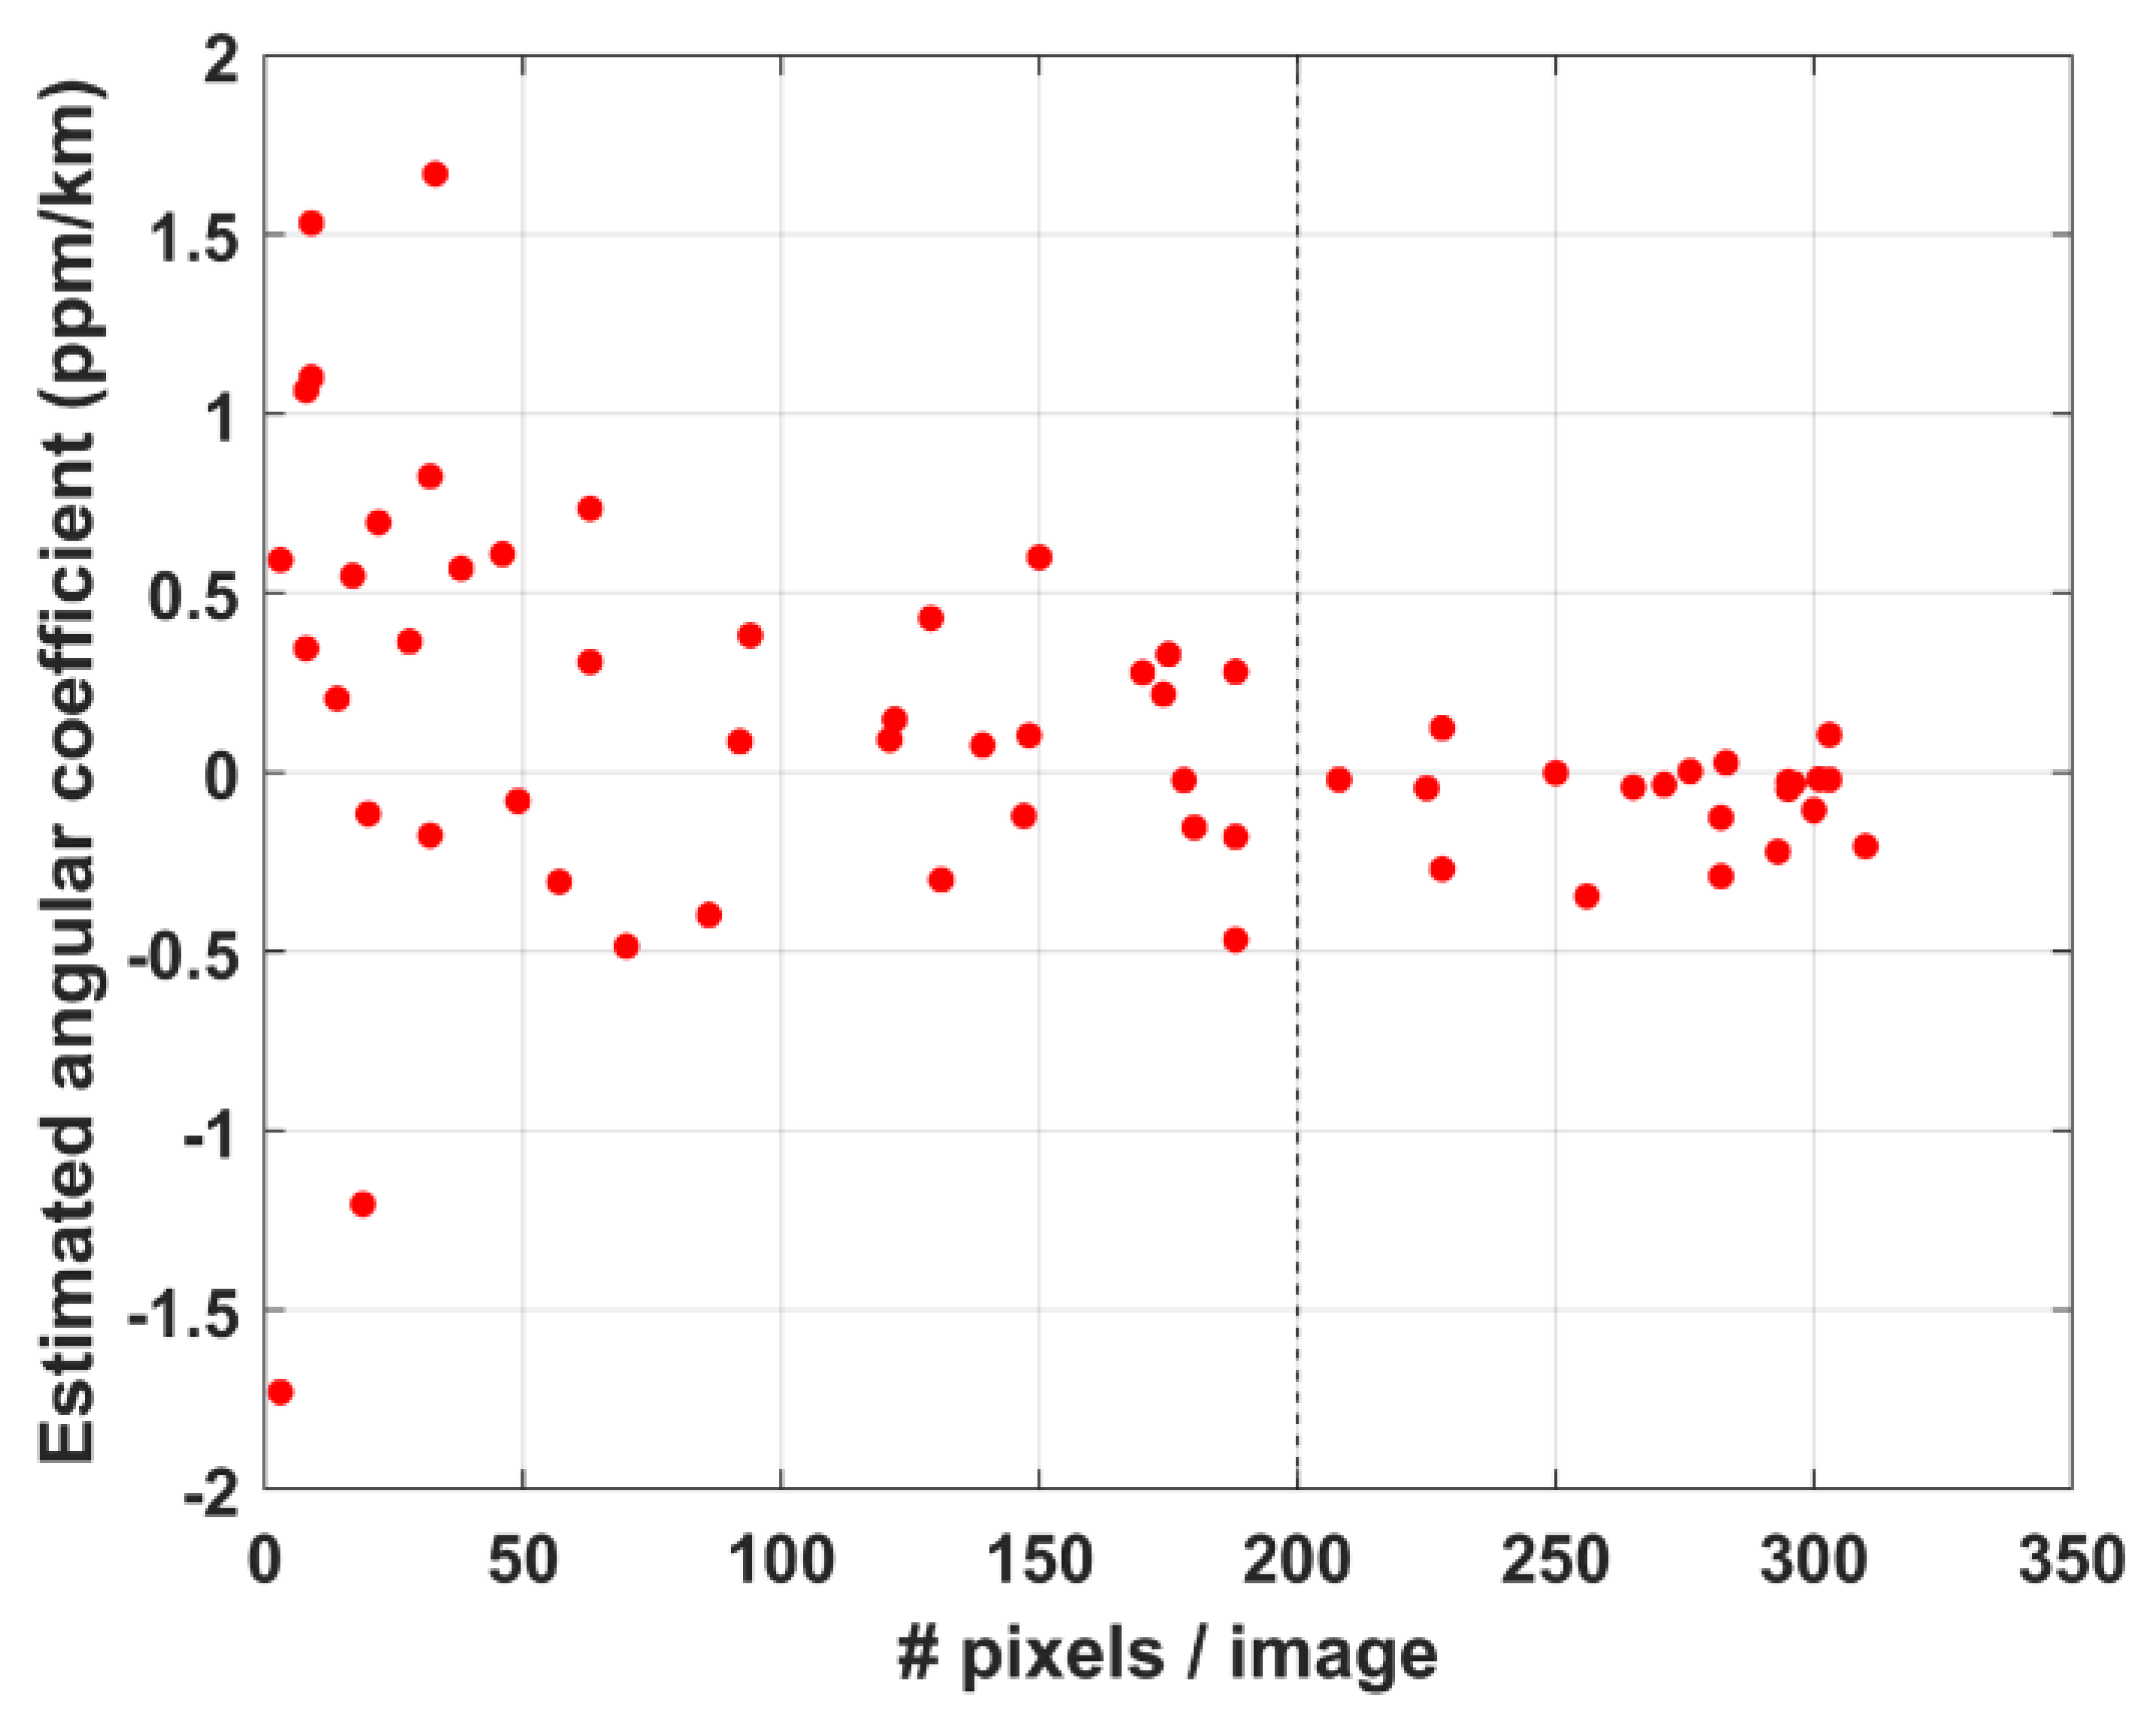
The impact of data coverage was assessed by calculating the angular coefficient (
m) values from individual images, which were also analysed as a function of the number of pixels in the AOI. The result of this analysis is reported in
Figure 4.
Values of
m are widespread for small values of the number of pixels, but seem to be stable and generally negative for pixel numbers above 200. Therefore, we focus our attention on OCO-3 images with a large sampling of data within the AOI. Considering only satellite acquisitions with more than 200 pixels in the AOI, we selected 21 statistically significant images.
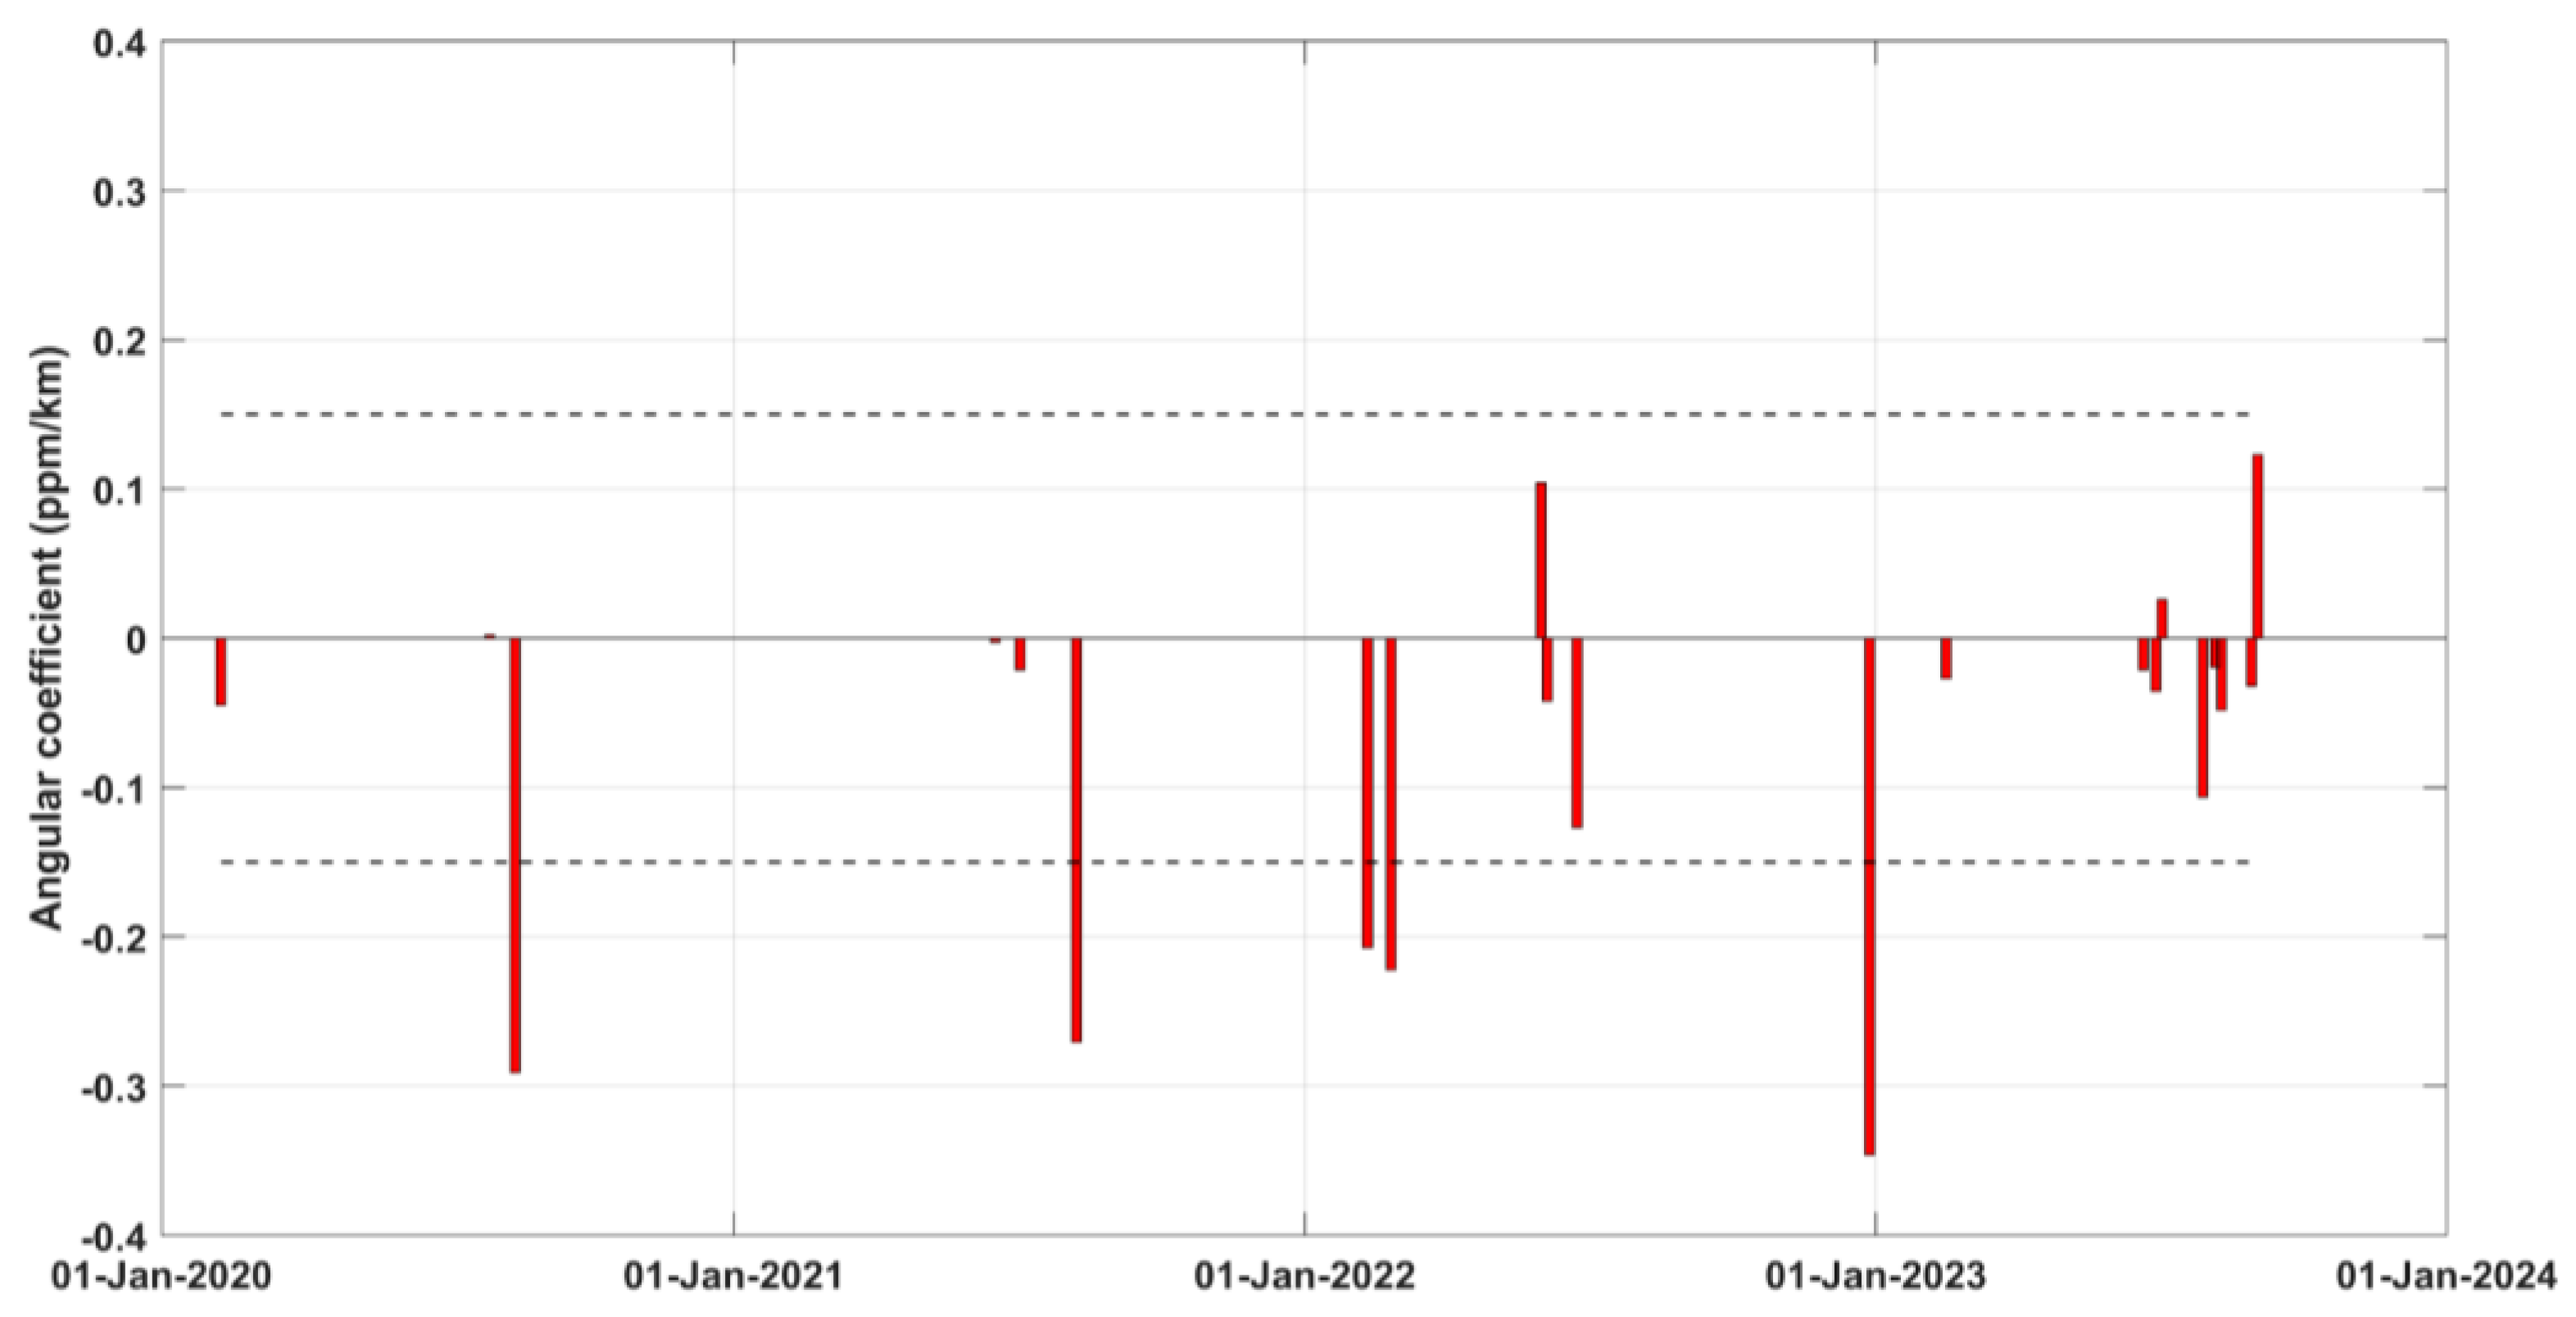
Figure 5 shows angular coefficient values for the selected images.
The values of m range from −0.35 to 0.15, where negative values suggest a potential influence of volcanic gas emissions, whereas positive values are associated with non-volcanic contributions or measurement uncertainties. Given the variability regarding the factors contributing to positive values in the angular coefficient, which still remain relatively small, we exclude the range |m| < 0.15 from our analysis. This selection criterion results in the consideration of only 5 cases, related to stronger CO2 emissions, out of a total of 21.
Furthermore, in order to estimate CO
2 fluxes from Mt. Etna, we followed the method used in [
6] for OCO-2 data. The method estimated localised CO
2 emission rates from volcanic plumes using the cross-sectional flux method, a satellite-based approach previously validated in atmospheric studies [
18]. This method integrates enhanced CO
2 column densities (XCO2) measured by the OCO-2 satellite across the plume’s cross-section, combined with wind data to estimate the flux.
Specifically, CO
2 flux was calculated by integrating the product of the XCO2 enhancement and the east–west component of wind speed, adopting a regular spatial grid and following Equation (1)
where
F is the flux (kg/s), (
x,
y) represents each grid cell of OCO-3 data resampled at the spatial resolution of 0.02 × 0.02 deg,
V(
x,
y) is the XCO2 column mass above the background (kg/m
2),
u(
x,
y) is the east–west component of wind speed and
dy (m) is the integration differential along the north–south direction.
The values of wind speed were calculated from a reanalysis of meteorological data from the European Centre for Medium-Range Weather Forecasts ERA5 model at the spatial resolution of 0.25° × 0.25° at 10 m above ground. The average values employed in the flux calculation result in the order of 1–3 m/s for the 5 selected case studies. The error adopted, about 65%, is derived from [
6] where the error propagation formula was used and the uncertainty of the wind speed appears to be the dominant term in the formula.
Given that CO2 concentrations exhibit a near-normal distribution across all scenes, we estimated CO2 fluxes only for those pixels with values exceeding two standard deviations (2σ) above the mean, as these are likely attributable to volcanic emissions.
3. Results
Here, we report the results of the OCO-3 acquisitions for the selected best cases and compare the retrieved values with the eruptive activity of Mt. Etna. In order to quantify the eruptive activity, we exploit all the information coming from the INGV ground-based monitoring network as well as multi-spectral satellite observations. In particular, data from the geostationary sensor SEVIRI are very valuable due to the high temporal resolution which, in almost all cases examined, provides measurements coincident with OCO-3 acquisitions. In the few cases where SEVIRI data are not available due to lower volcanic activity, complementary satellite datasets, such as MODIS or VIIRS, are exploited.
In particular, an in-depth analysis of Mt. Etna activity in the 5 days considered was conducted with the aim of evaluating the relationship between the
m parameter and the different eruptive phases. Moreover, to highlight the short-range variability, we also computed the
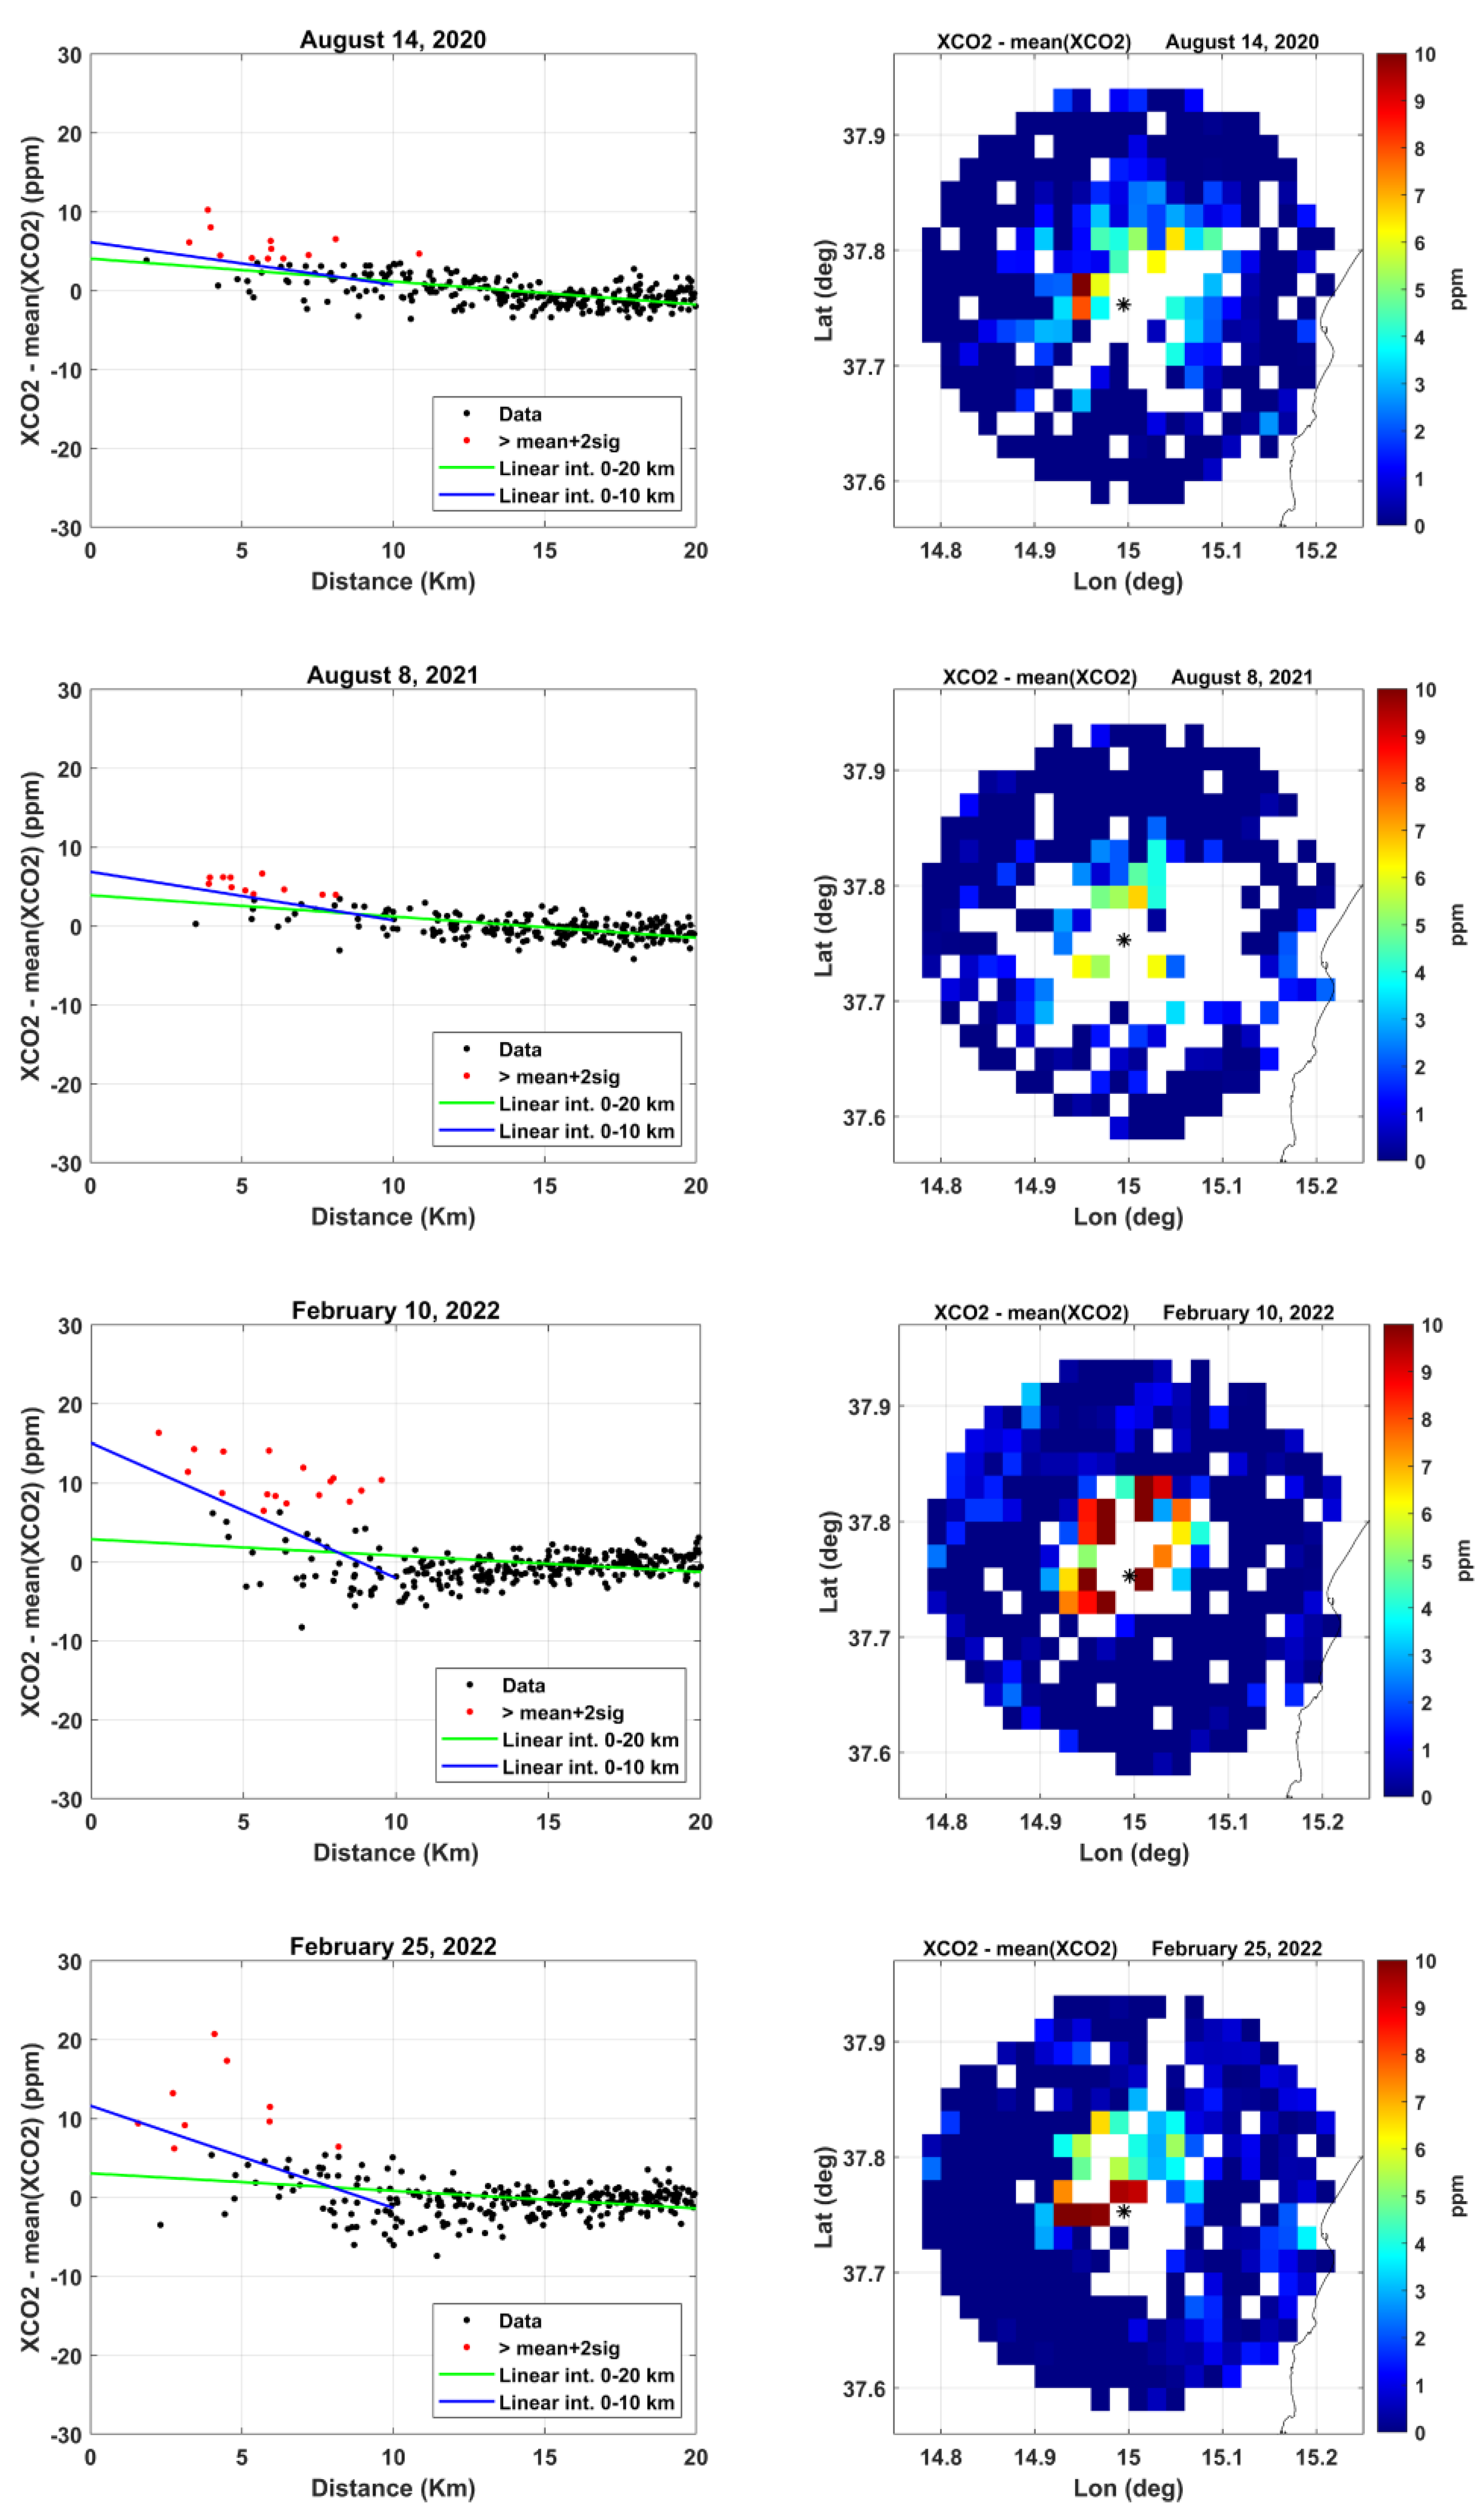
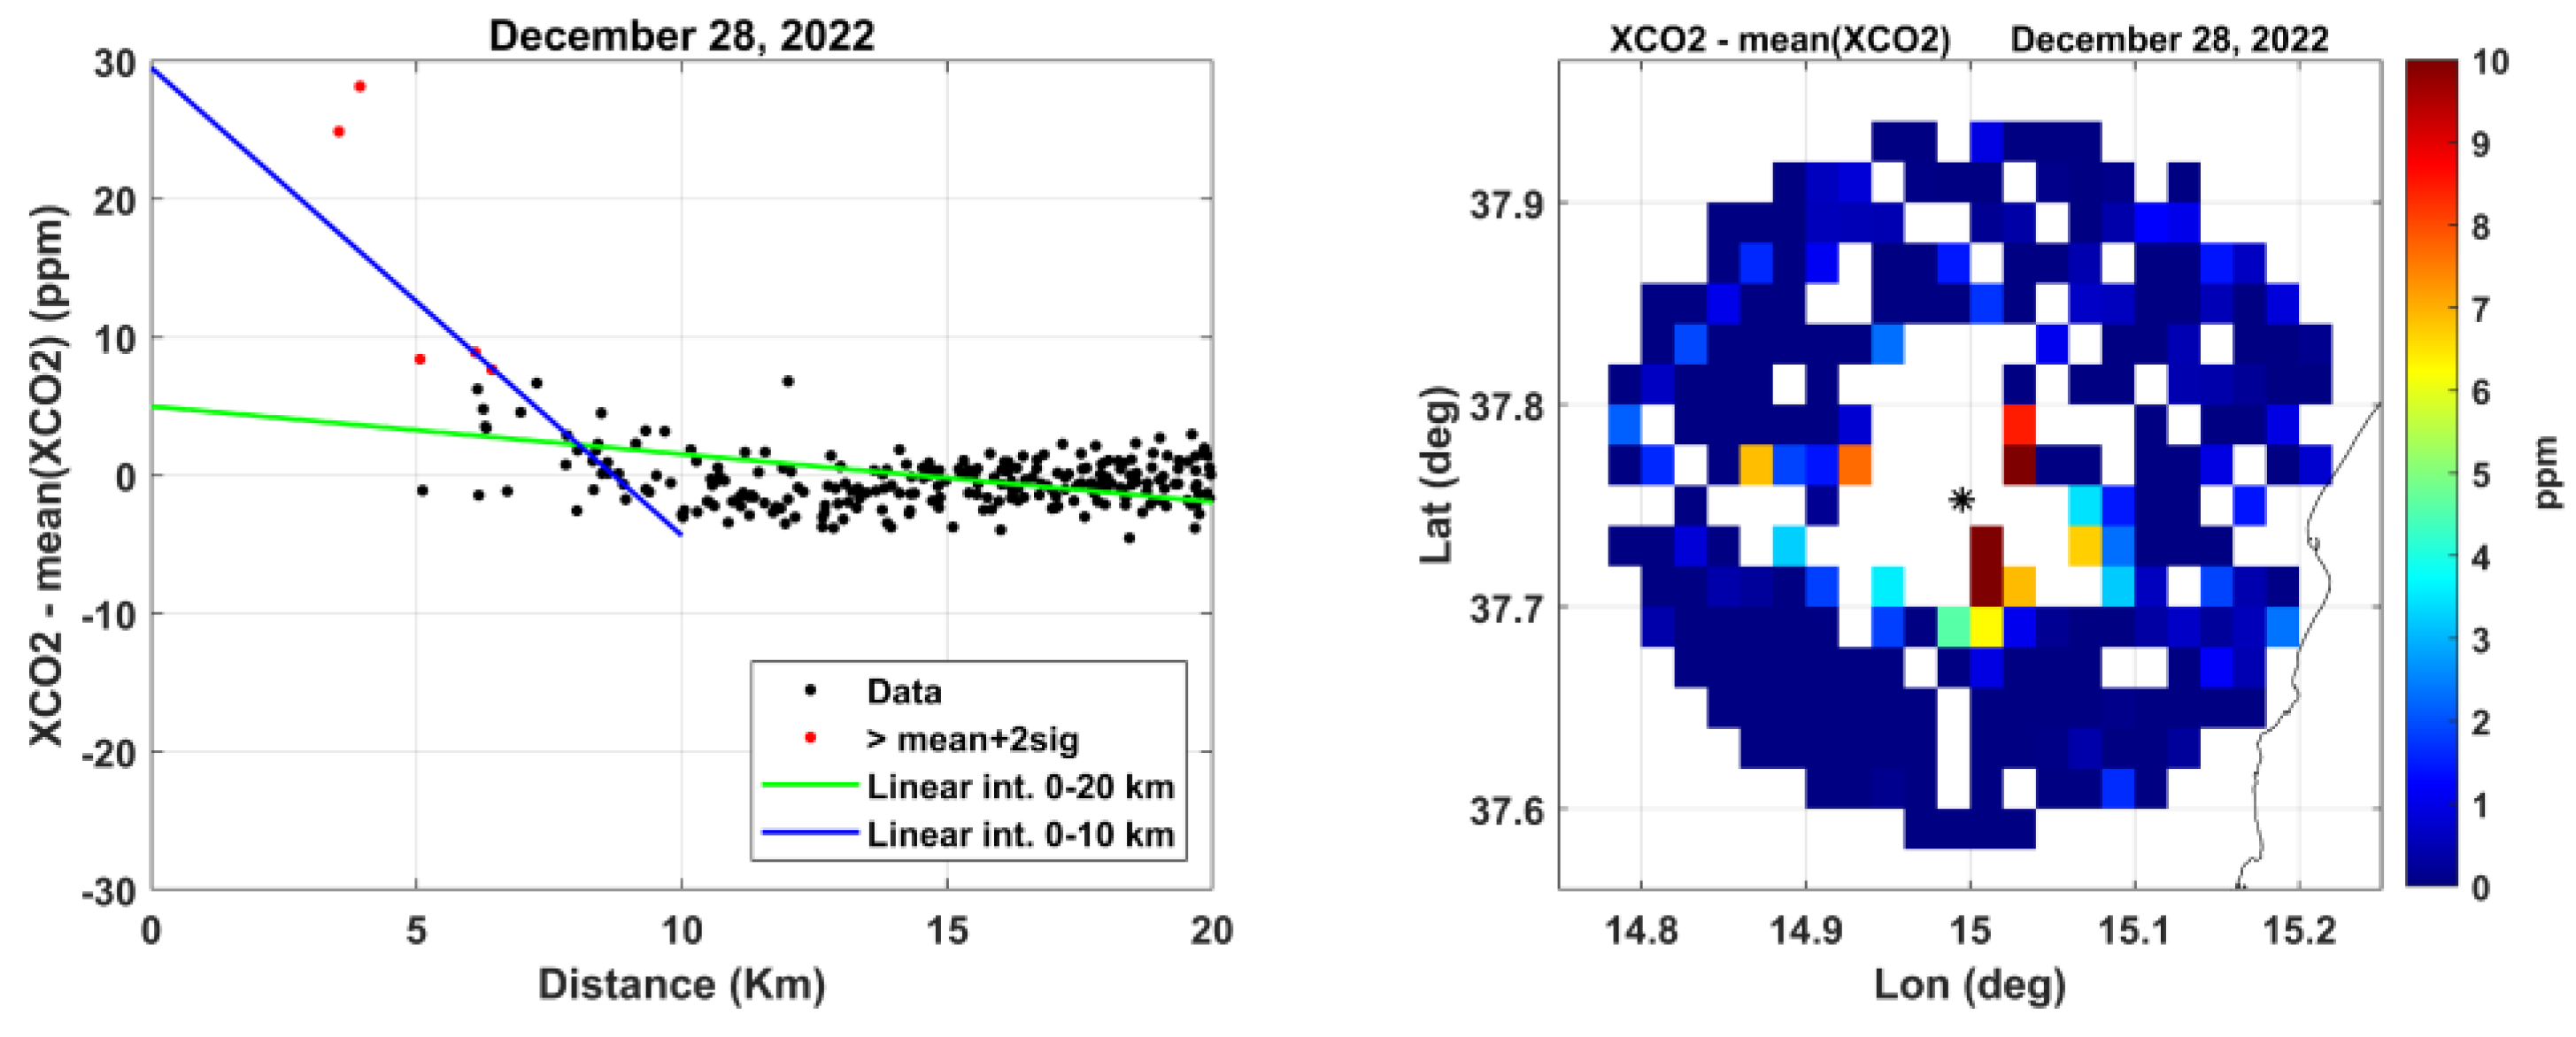
m values for the selected acquisitions considering the distance range 0–10 km from the volcano summit. XCO2 differences, as a function of distance from Mt. Etna summit, are reported for each of the five acquisitions in
Figure 6 (left) where pixels with values greater than mean + 2σ are highlighted in red. Spatial distributions of XCO2 differences are resampled in a regular grid with a spatial resolution of 0.02 × 0.02 deg (
Figure 6, right). This allows us to obtain a graphic representation referring to the summit of Mt. Etna for a better visual interpretation of CO
2 enhancements and distributions.
Table 1 summarises the OCO-3 results reporting the angular coefficients in the two considered ranges and the corresponding volcanic activity for each selected time period.
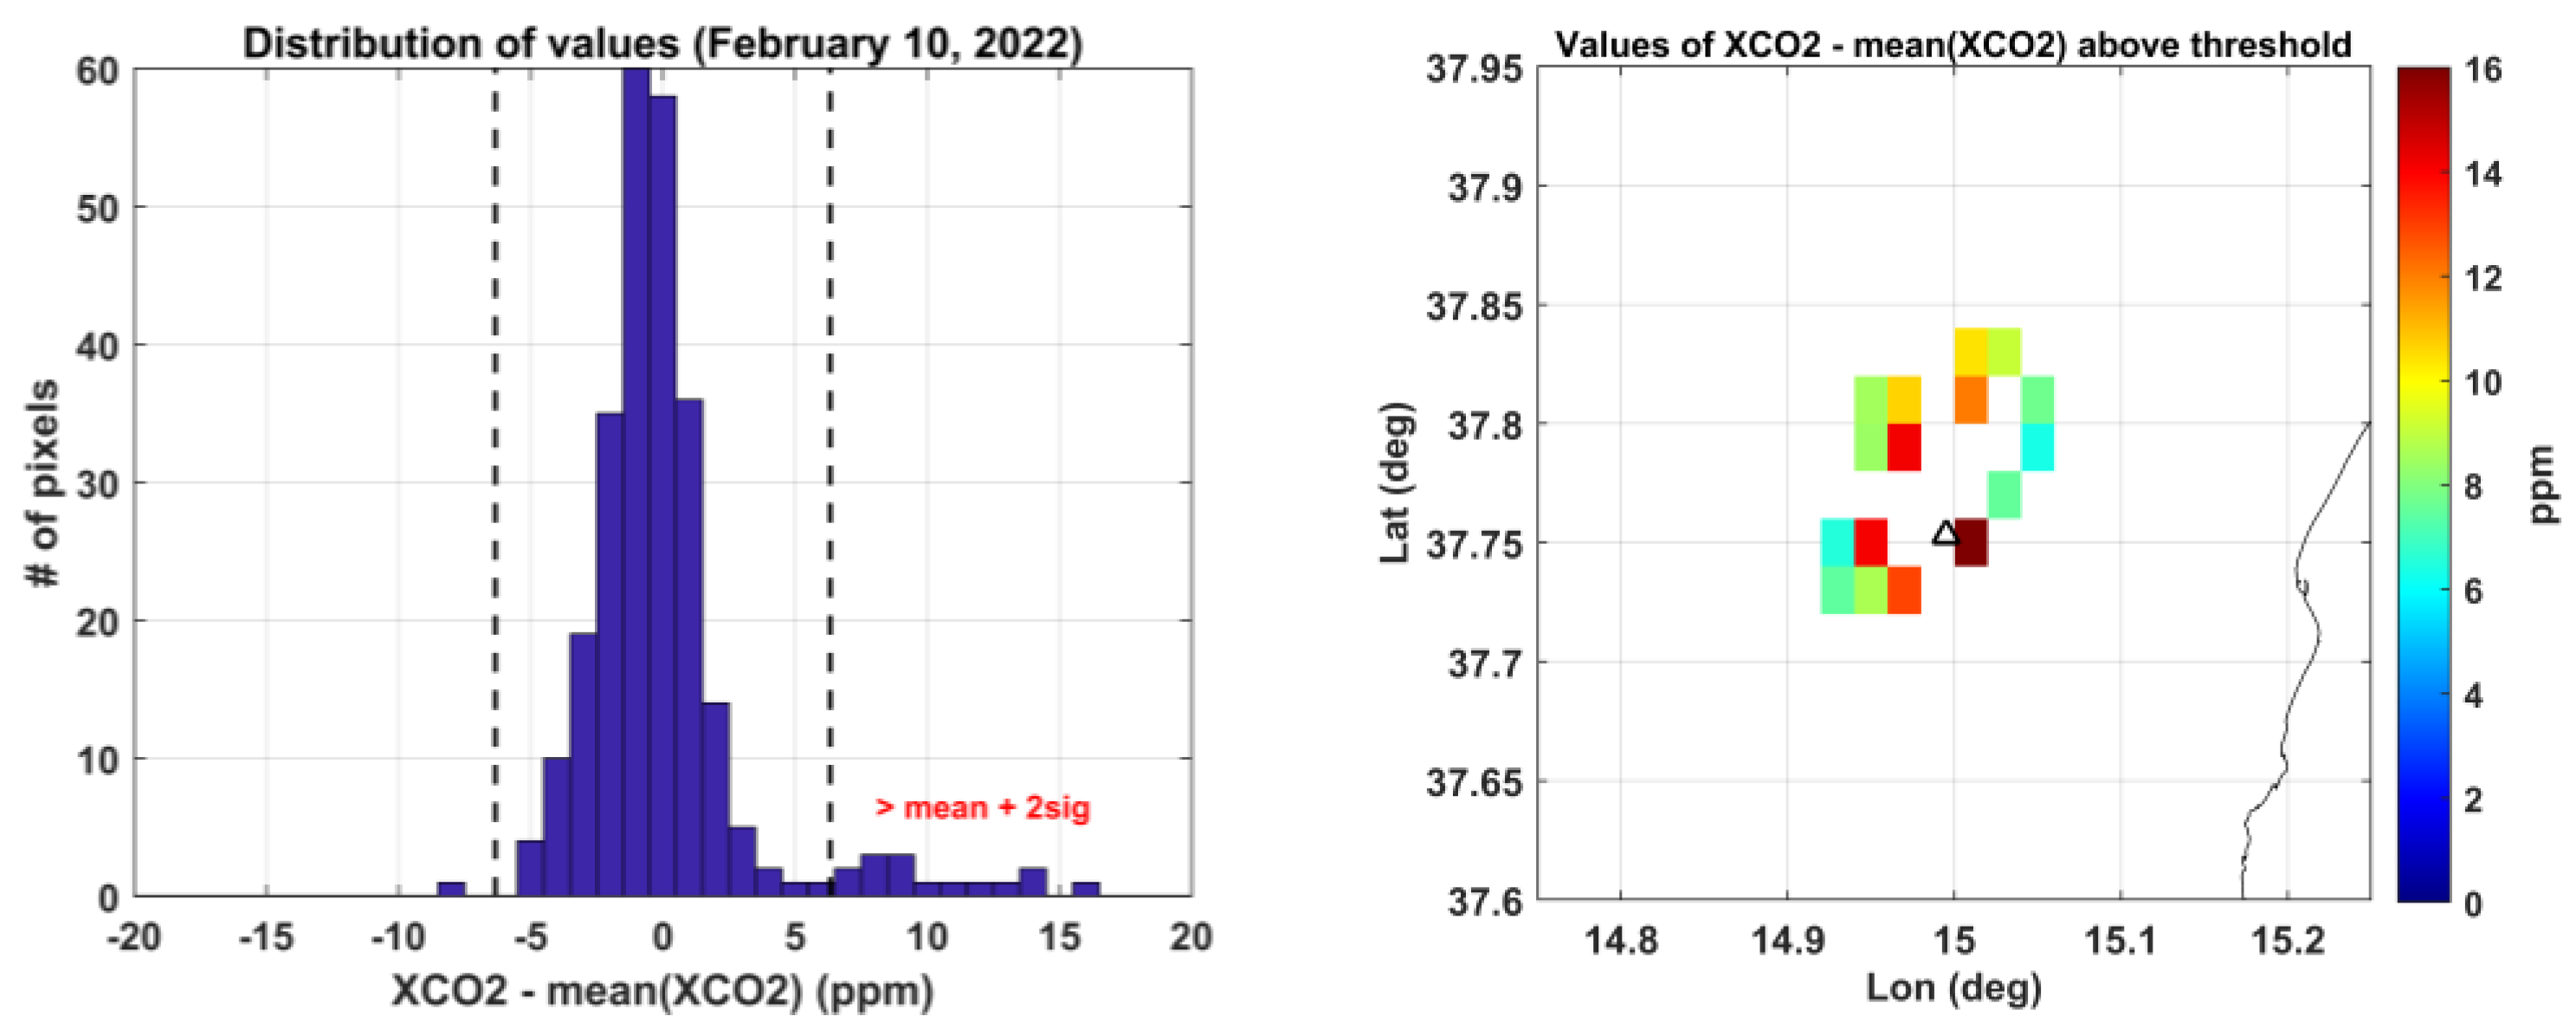
We also computed the CO
2 fluxes as described in
Section 2. For each image we analysed, the distribution of XCO2−mean(XCO2) values and computed the CO
2 fluxes for all those points with values exceeding two standard deviations (2σ) above the mean (see
Figure 7).
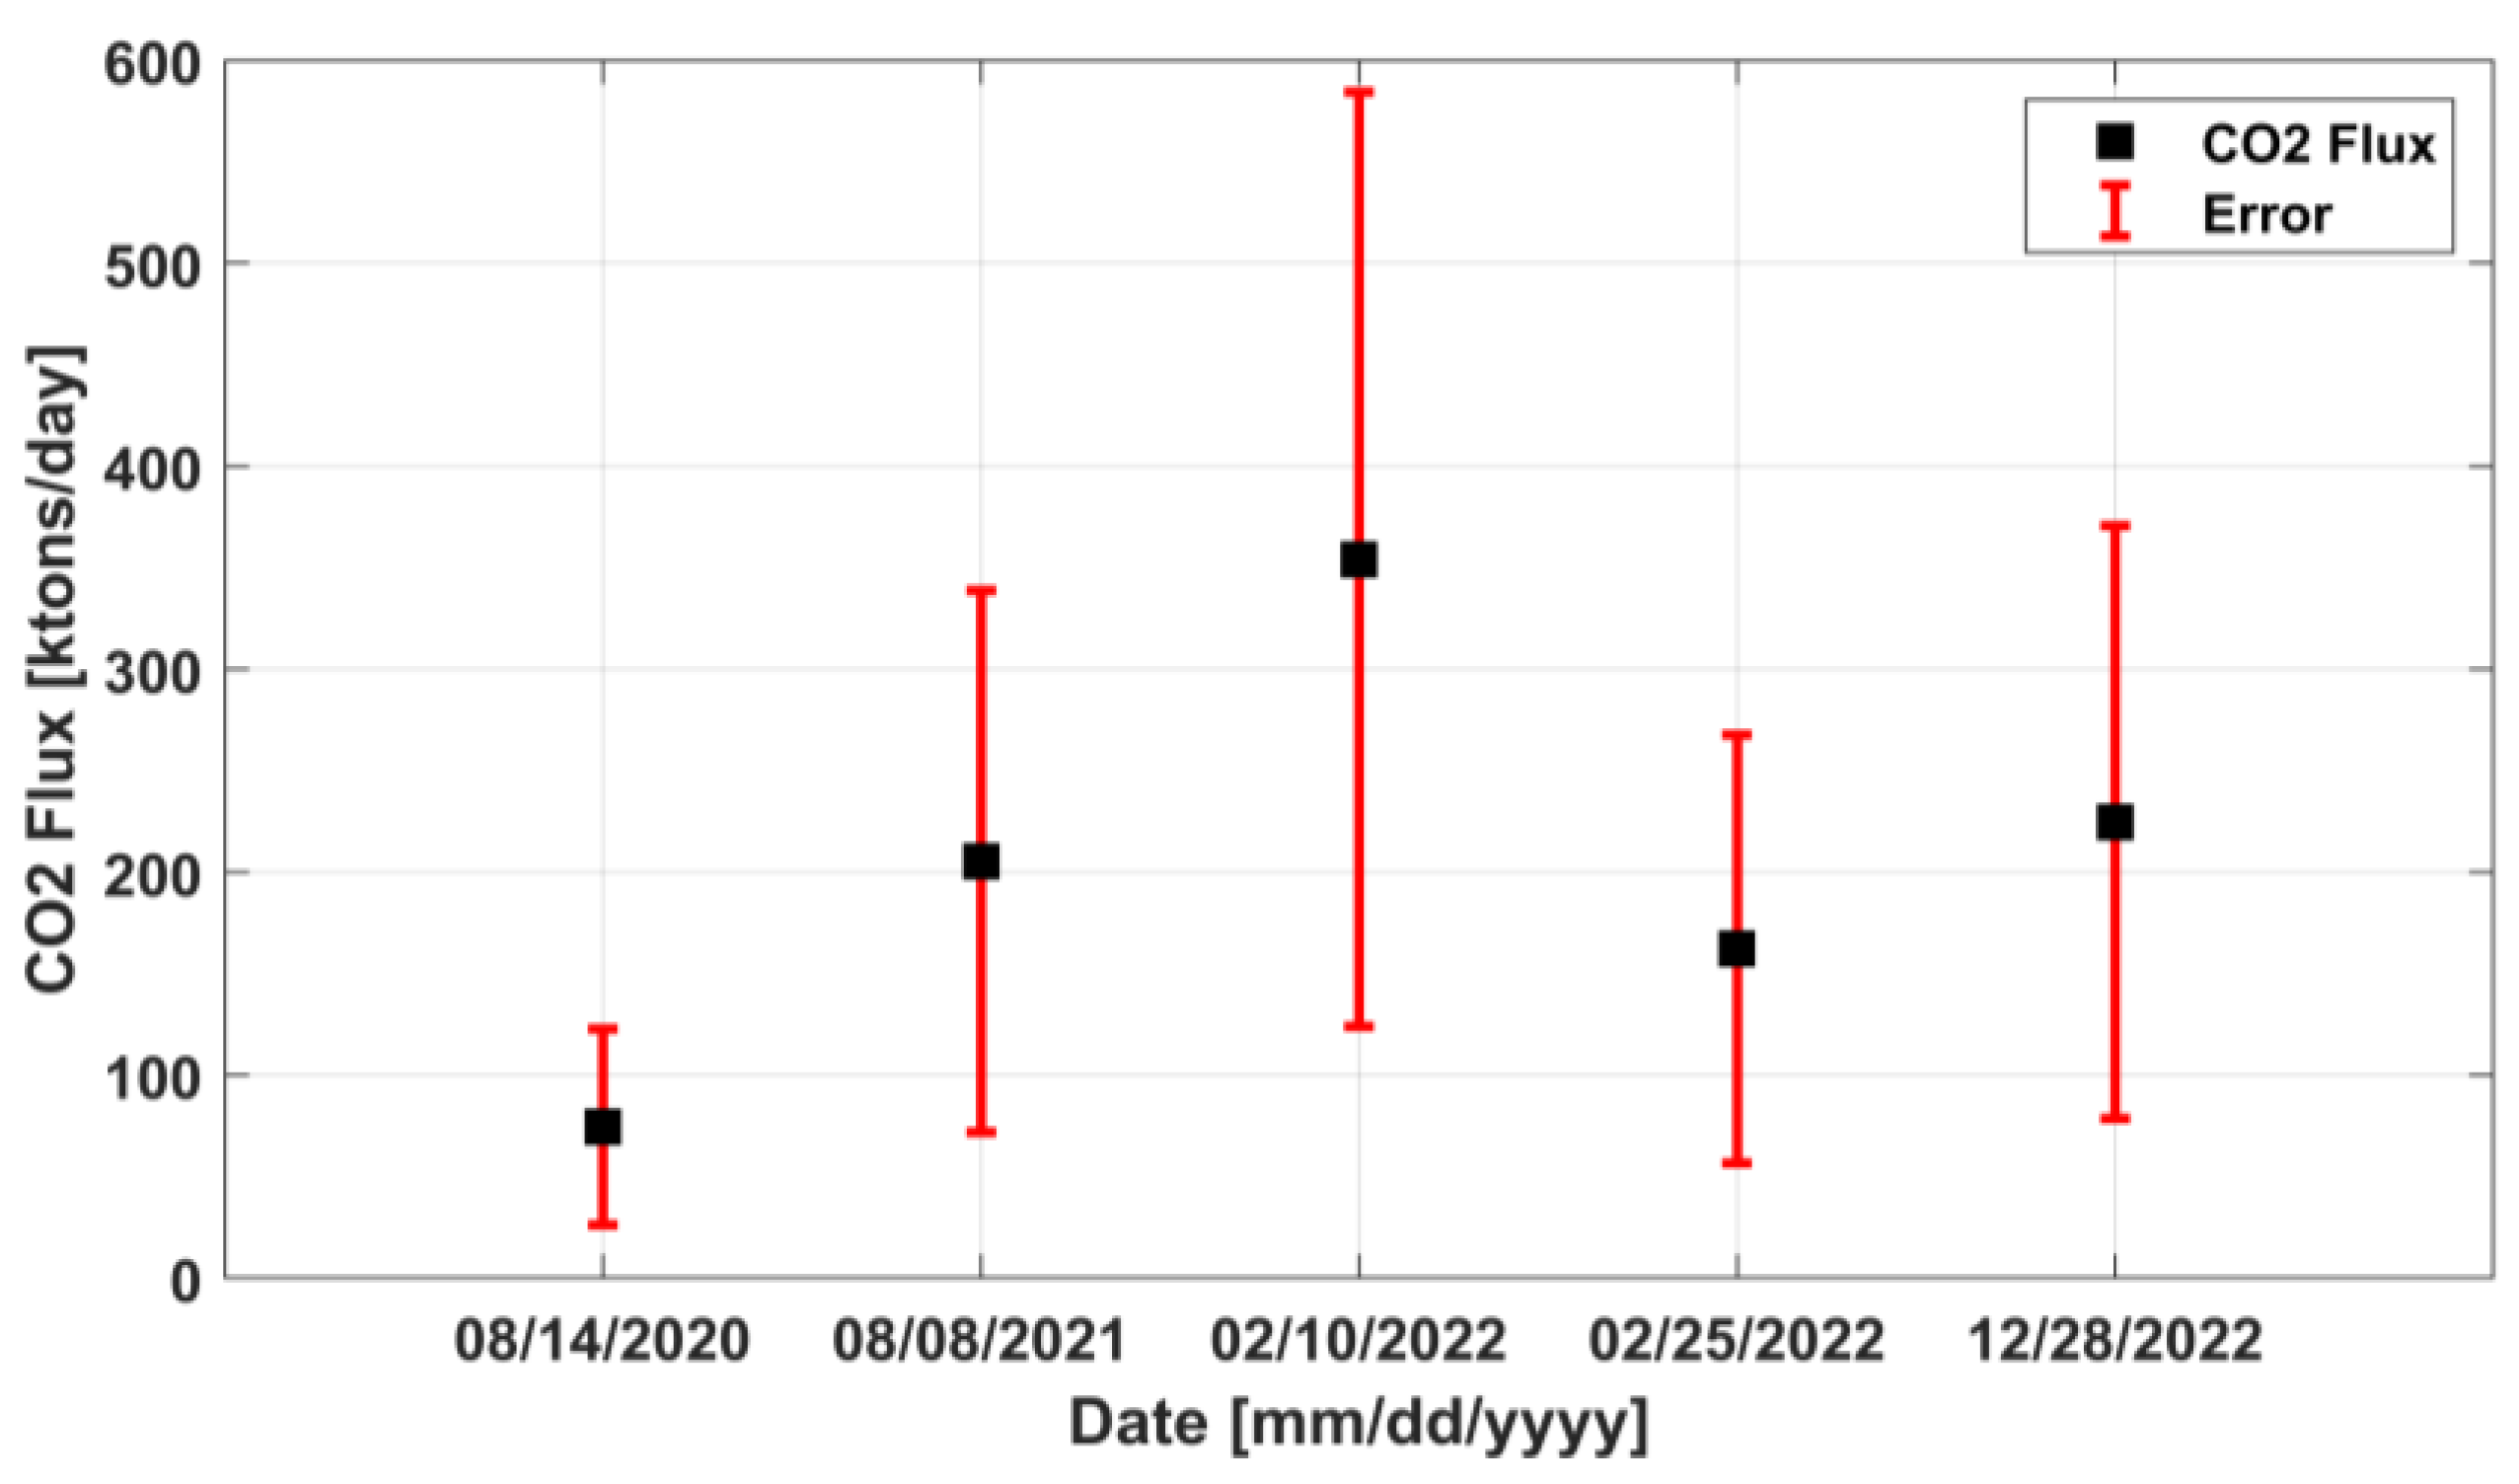
The resulting values of CO
2 fluxes and the corresponding errors are reported in the following histogram (
Figure 8) for the case studies listed in
Table 1, respectively. Flux values range between 74 and 354 ktons/day with the maximum reached on 10 February 2022 and minimum on 14 August 2020.
In the following, details about Mt Etna volcanic activity and the results from multi-spectral satellite imagery for the selected periods are described below.
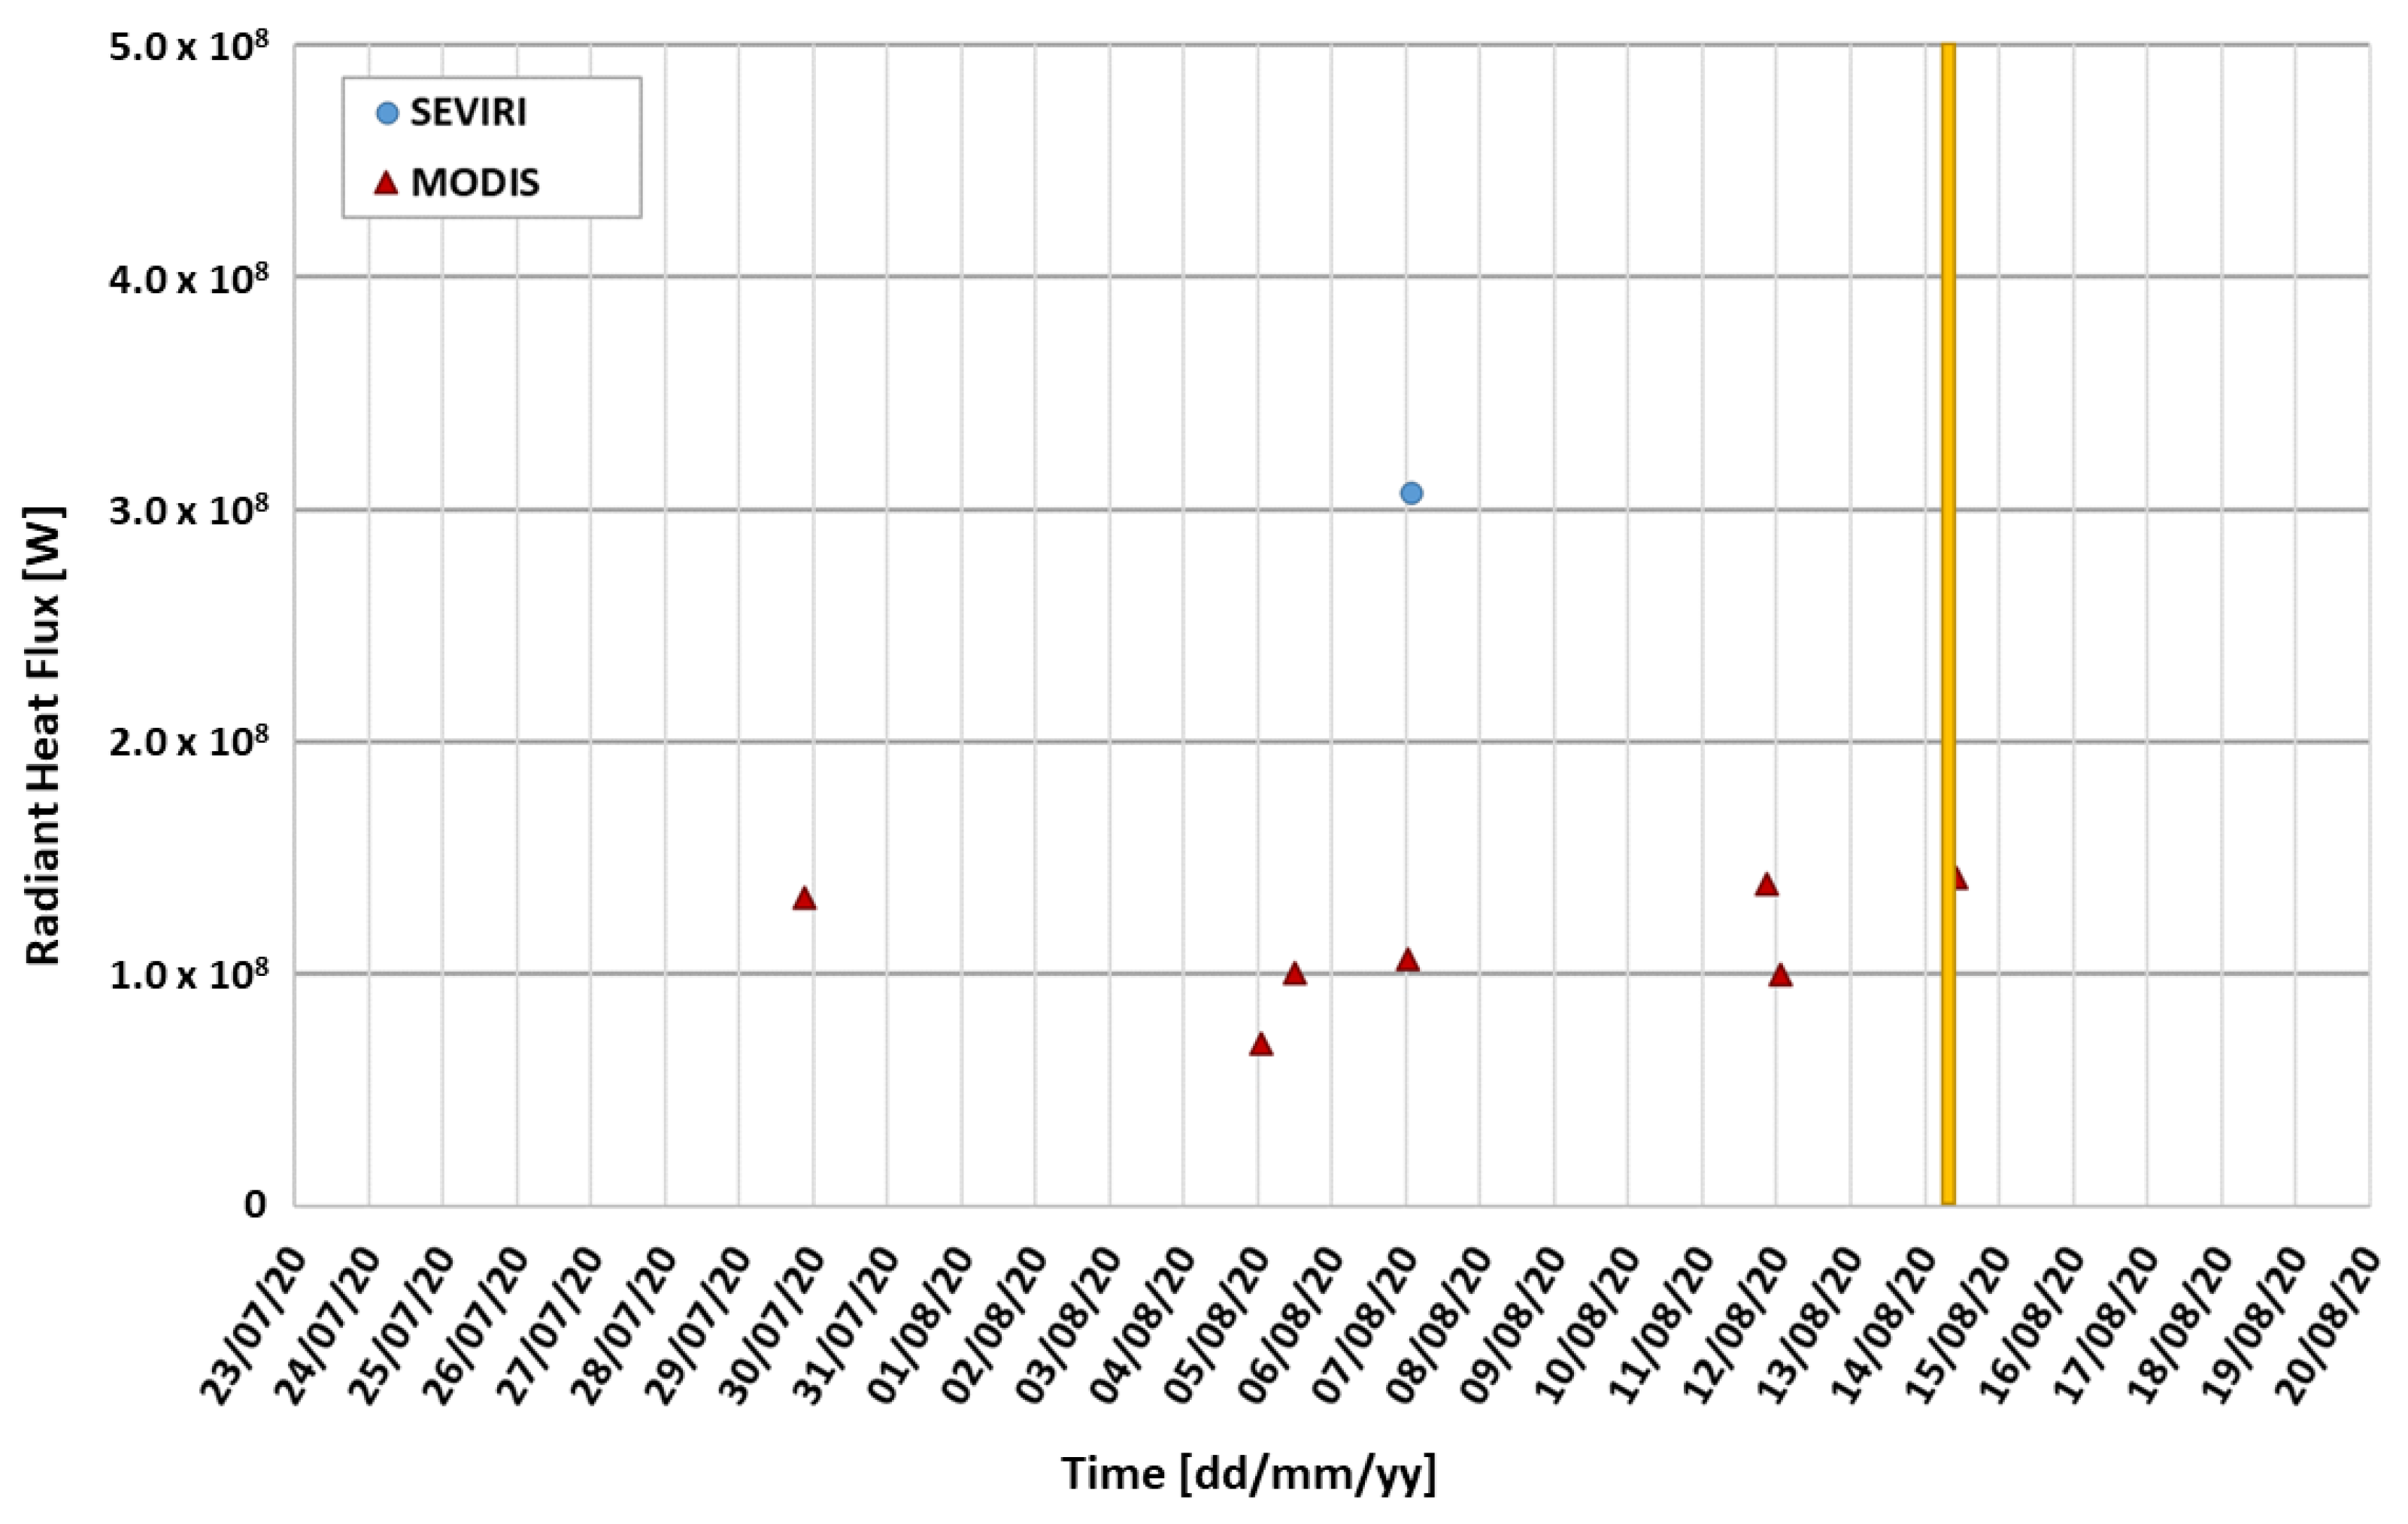
During the period of this OCO-3 acquisition, Etna’s activity was characterised by Strombolian activity at its summit craters. In particular, Strombolian activity was observed at the South-East Crater with fluctuations in intensity and frequency of explosions. The phases of the most intense activity launched lava shreds up to several tens of metres above the crater rim, which fell onto the flanks of the cone. During the day of 14 August, an episode of intense Strombolian activity produced significant quantities of ash, which formed a plume bent by the wind in a south-easterly direction, with ash fallout in the villages in the south-east flank of the volcano (i.e., Pedara, Trecastagni, Viagrande). This activity was registered from thermal satellites (
Figure 9), where almost in correspondence with the OCO-3 acquisition, a thermal anomaly with a heat flux of 0.14 GW was detected in a MODIS scene.
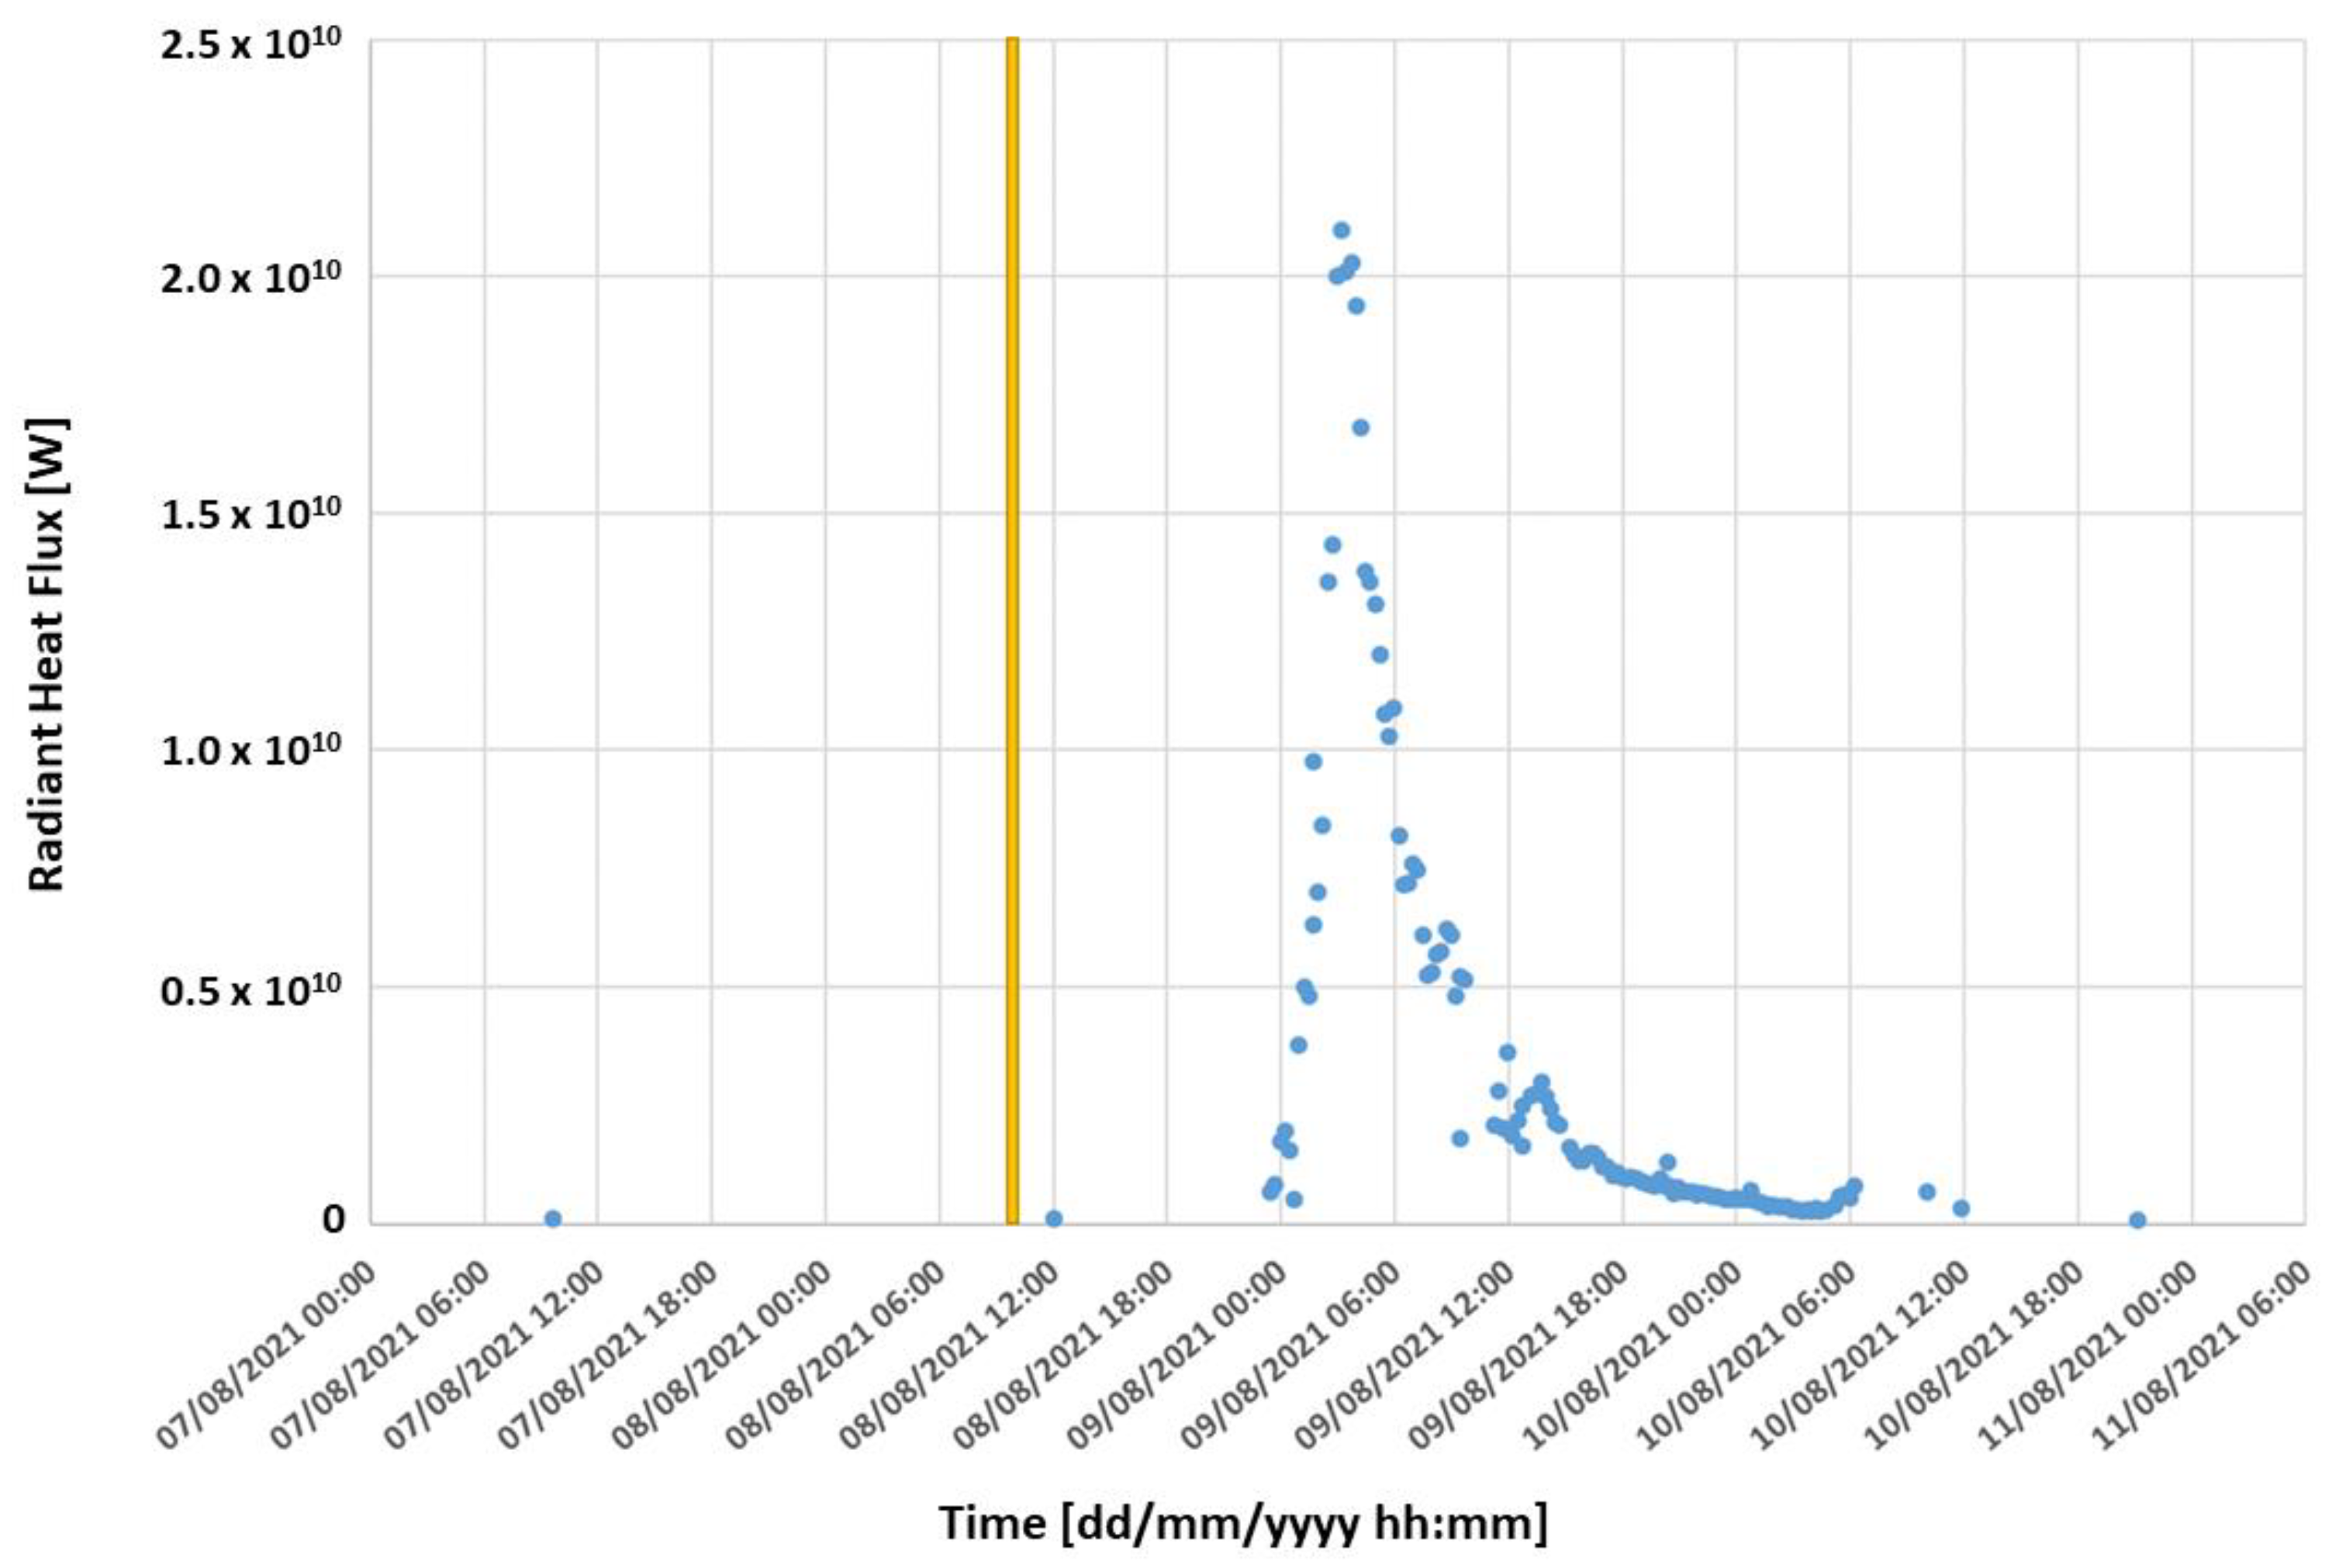
On 7 August, a resumption of Strombolian activity was observed at the South-East Crater, which produced sporadic isolated explosions with a projection of incandescent material beyond the crater rim. During the night, this activity showed no further evolution and essentially ceased. The following day, 8 August, a further resumption of Strombolian activity at the South-East Crater was observed, characterised by a more marked continuity and, again, by the frequent projection of incandescent material beyond the crater rim. The volcanic ash produced was dispersed in the south-eastern sector of the volcano. Starting in the early hours of 9 August, Strombolian activity resumed at the South-East Crater accompanied by an initial lava overflow from the eastern mouth in an easterly direction along the western wall of the Valle del Bove. Starting at 00:40 UTC there is an increase in Strombolian activity and a gradual transition to lava-fountaining activity that produces an eruptive column dispersing in a SE direction. The lava fountaining activity ended at approximately 04:00 UTC and overall caused the fall of pyroclastic material in the SE slope, affecting the inhabited centres between Lavinaio and Zafferana as far as the coast between Acireale and Pozzillo. The lava flows during the day of 9 August were weakly fed, reaching an altitude of approximately 2900 m a.s.l., and during the day of 10 August, the lava emission ceased. This activity was well observed by SEVIRI (
Figure 10), the closest temporally measured radiant heat flux value to the OCO-3 acquisition was 0.13 GW recorded on 8 August at 12 UTC.
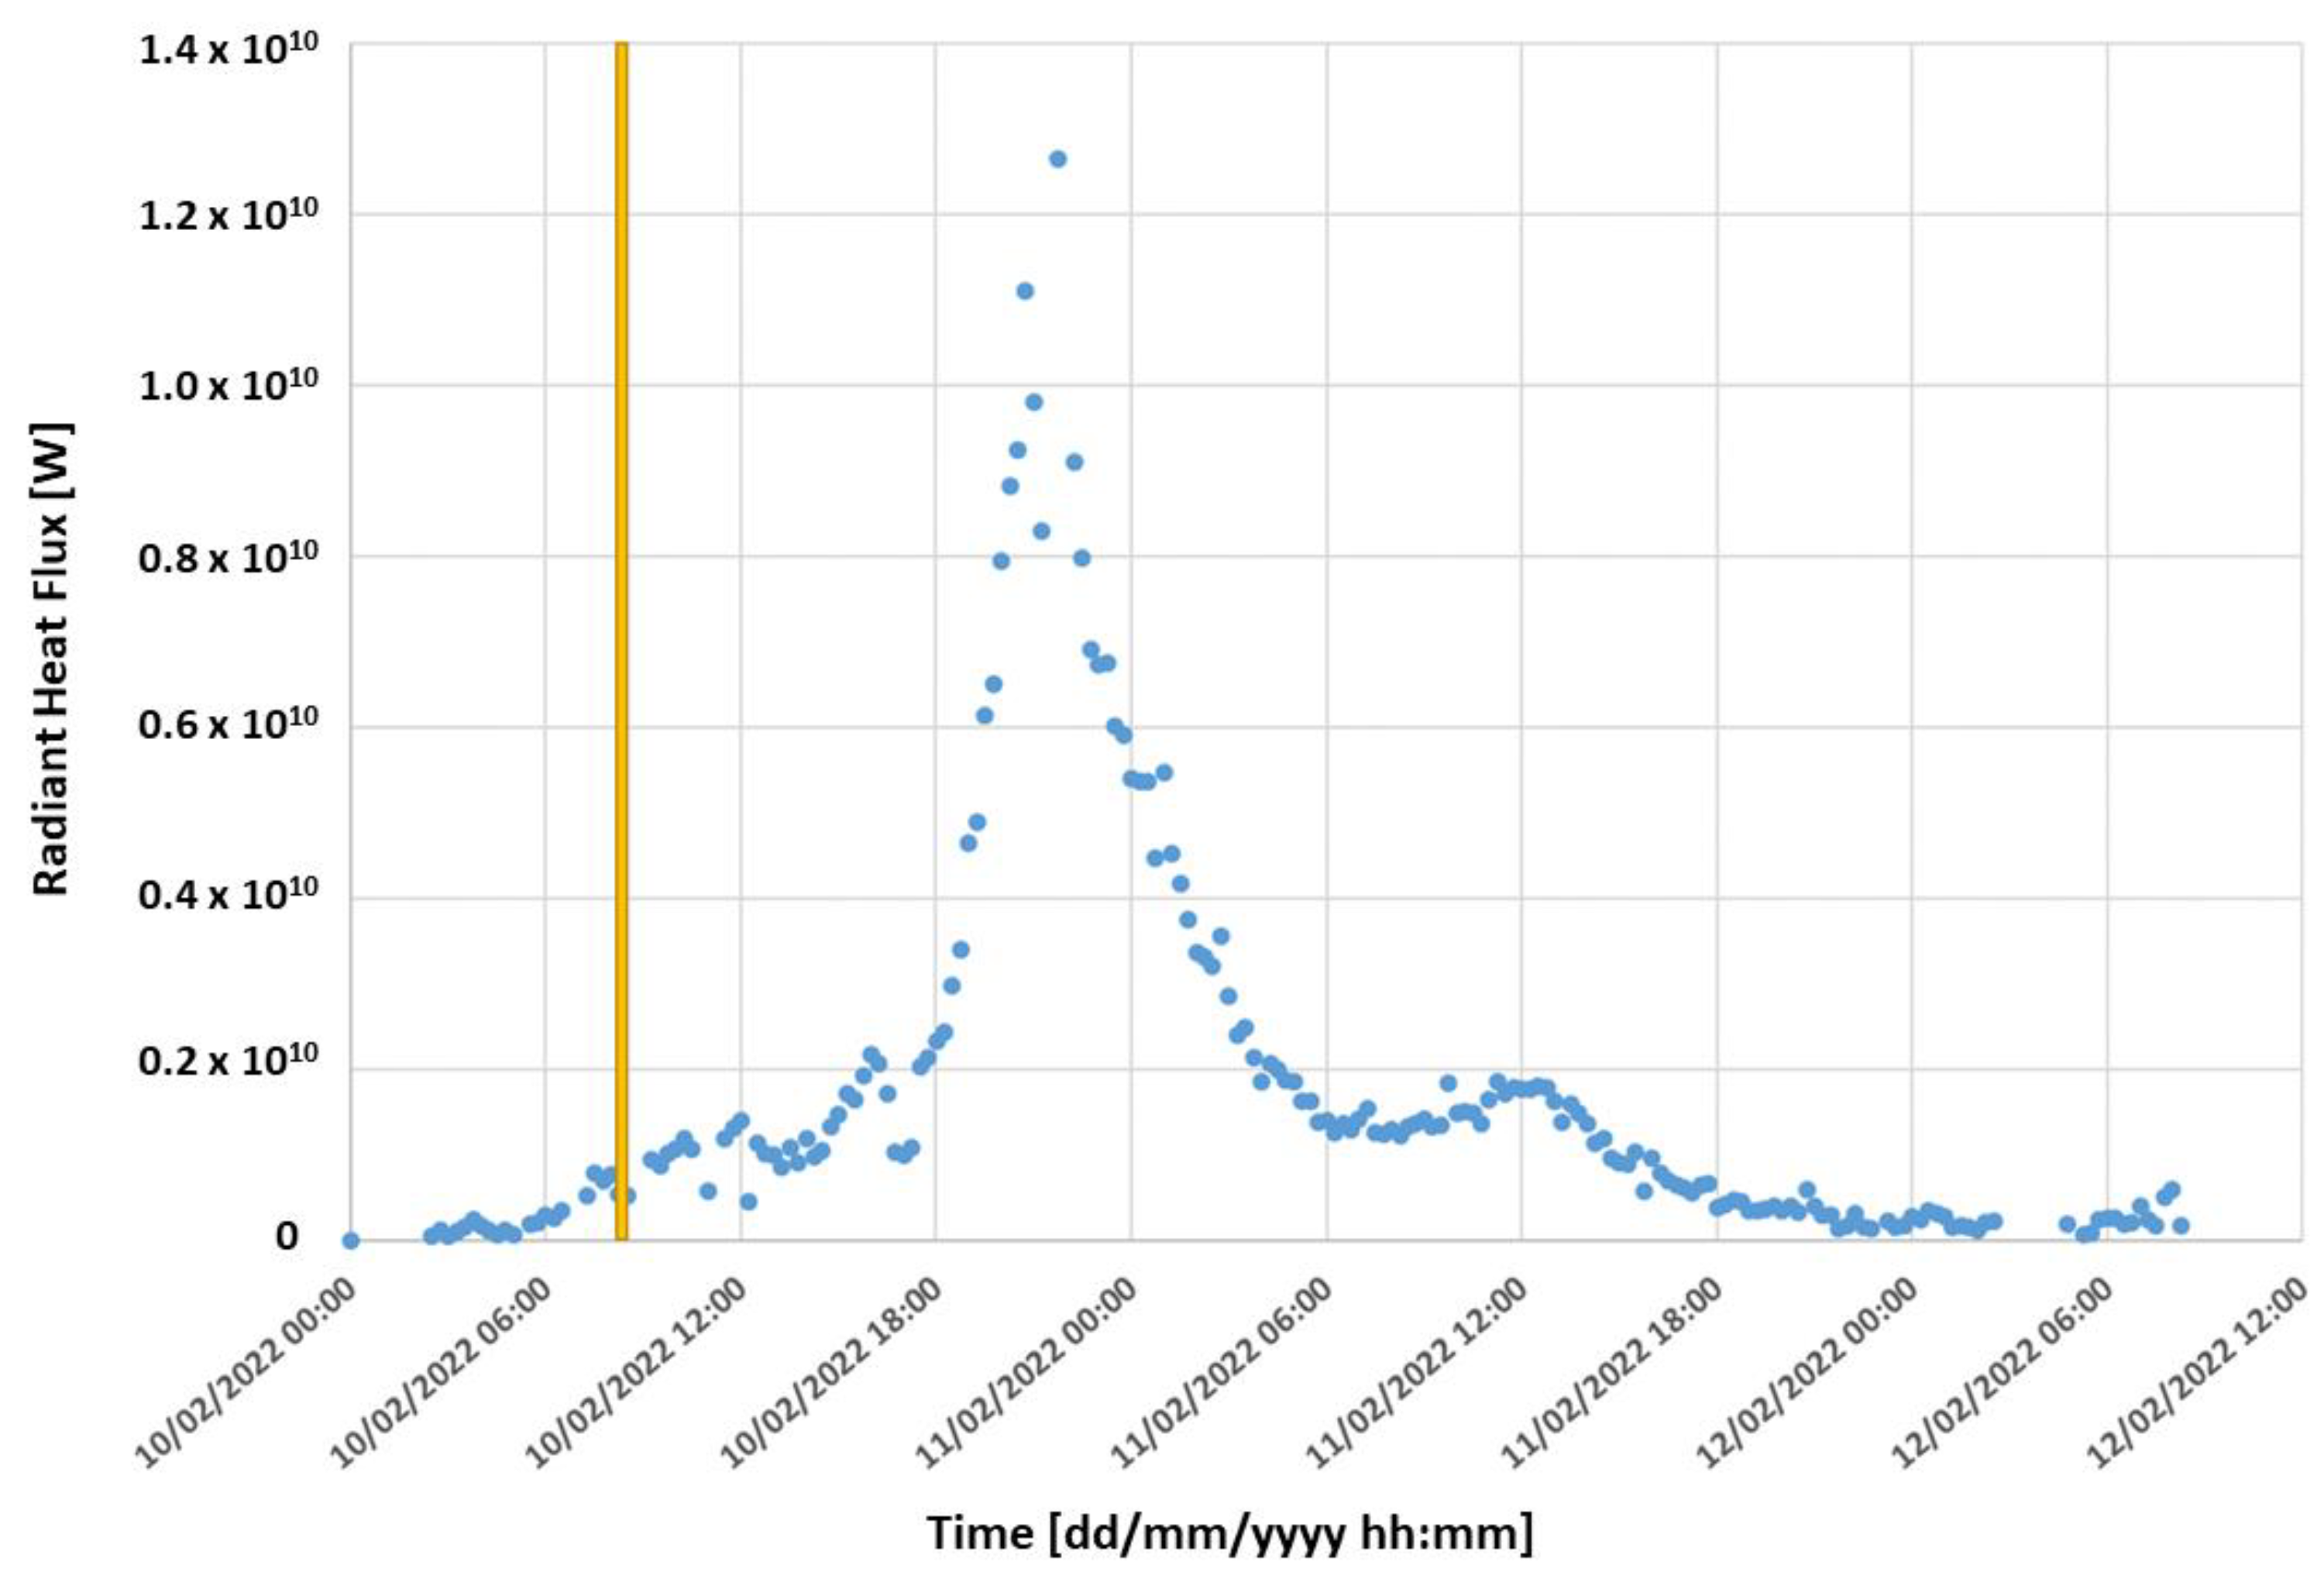
During the night of 9–10 February, a modest explosive activity was observed at the South-East Crater, evidenced by visible flashes on the cameras. The activity is—at that time—confined within the crater and generates discontinuous and mild ash emissions.
At 03:27 UTC on 10 February (a full 15 h before the paroxysm), the ETNAS early warning system (early warning) signals the transition to the level 1 alert level (A1), corresponding to the high probability of imminent lava fountaining. As of 14:20 UTC on 10 February, a modest lava outburst was observed from the South-East Crater, flowing in a west–southwest direction. From about 16:00 UTC there was a definite intensification of Strombolian activity, through alternating phases in terms of intensity and frequency, while the lava flow still appears to be fed and the front has reached an estimated altitude of about 2900 m above sea level.
From around 20:40 UTC, the transition of the Strombolian activity to lava fountains was observed, which reached heights of around 1000–1500 m at the summit of the cone, while the eruptive cloud produced by the ongoing activity, up to around 12 km above sea level, was dispersed in the western sector of the volcano and the lava flow continued to be well fed. Also, this activity was well observed via the SEVIRI-derived radiant heat flux, with a measured radiant heat flux value of 0.52 GW observed at 8:30 UTC in correspondence with the OCO-3 acquisition (
Figure 11).
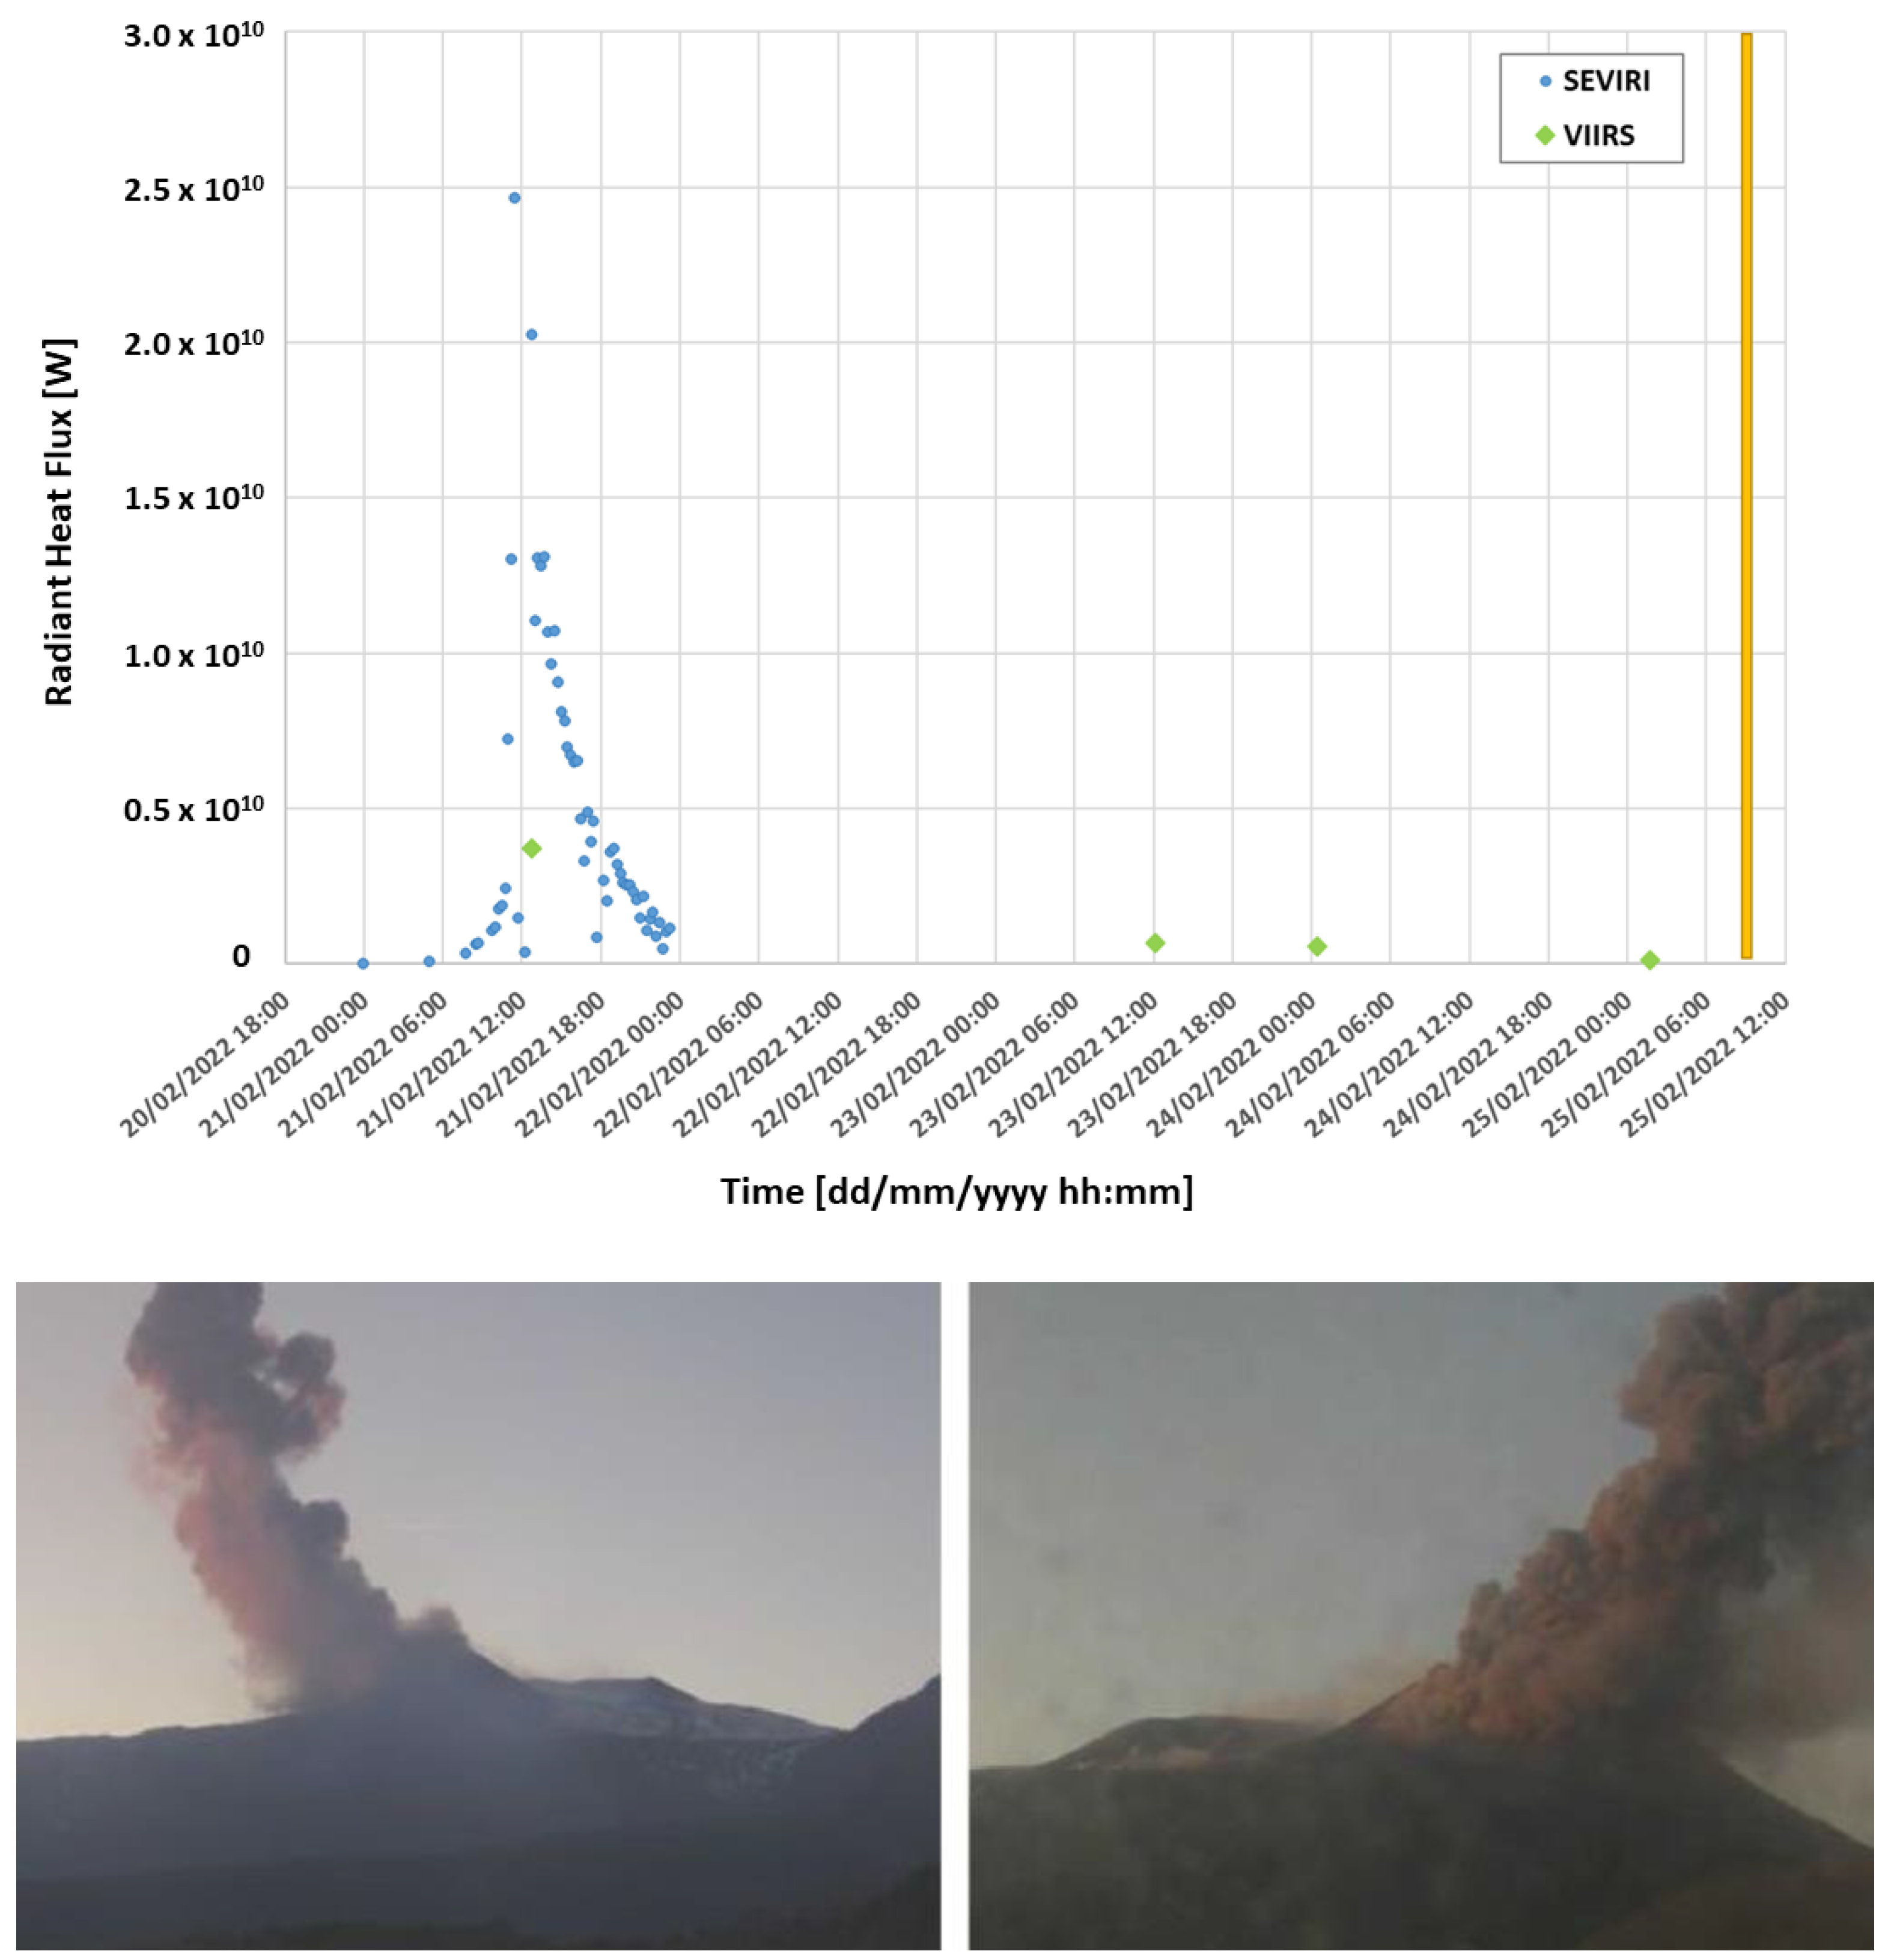
As for this period, a lava fountain was registered at SEC on 21 February which produced a volcanic cloud that reached a maximum height of 12 km and dispersed in a south-easterly direction and a lava flow approximately 2 km long. Strombolian activity intensified from about 10:40 UTC, fuelling a volcanic cloud that dispersed in a south-easterly direction. In less than half an hour, the Strombolian activity evolved into a lava fountain, which, as it intensified, produced an eruptive column that by 11:20 UTC had reached a height of 10 km a.s.l., expanding in a south-easterly direction. In addition, starting at 11:05 UTC, the formation of a lava overflow was observed, which propagated from the southern slope of the SEC in a southwesterly direction. At approximately 12:40 UTC, the fountaining episode was exhausted, having produced a volcanic cloud that had reached an estimated maximum height of about 12 km a.s.l. The Strombolian activity, which still persisted, gradually ceased around 12:50 UTC. From direct observations carried out in the field, INGV-OE personnel reported that the dispersion of the eruptive cloud in the southeast sector, had resulted in volcanic ash fallout over the localities of Viagrande, Trecastagni, Milo, Acicastello, with the main axis of dispersion between Petrulli and Zafferana. With regard to the effusive activity, at 13:00 UTC, the lava flow propagating in a southwesterly direction was still fed, while from 14:00 UTC, the surveillance cameras and INGV-OE personnel in the field reported a further poorly fed lava flow propagating along the eastern slope of the SEC, whose front was at an estimated altitude of approximately 2900 m a.s.l. At 18:00 UTC, both lava flows appeared poorly fed. As far as effusive activity is concerned, on the 23rd morning, the lava flow from the night before already appeared to be cooling.
Subsequently, on the days from 23 to 25 February, the weak Strombolian activity produced sporadic and occasional ash emissions that dispersed rapidly in the vicinity of the summit area; in particular, the most energetic were observed on 23 February at 10:14, 10:17 and 14:19 UTC (dispersion in the S-SSO direction), on 24 February at 08:00 UTC (dispersion in the SSE direction) and on 25 February at 15:07, 16:49 and 16:51 UTC (dispersion in the SSE direction) [
19] (
Figure 12, bottom). During this time window, ash dispersion as well as cloud coverage prevent the satellite from observing and quantifying the thermal activity. The closest measurement to OCO-3’s acquisition of radiant heat flux was made on 25 February at 01:45 UTC by VIIRS, which measured approximately 0.1 GW (
Figure 12, top).
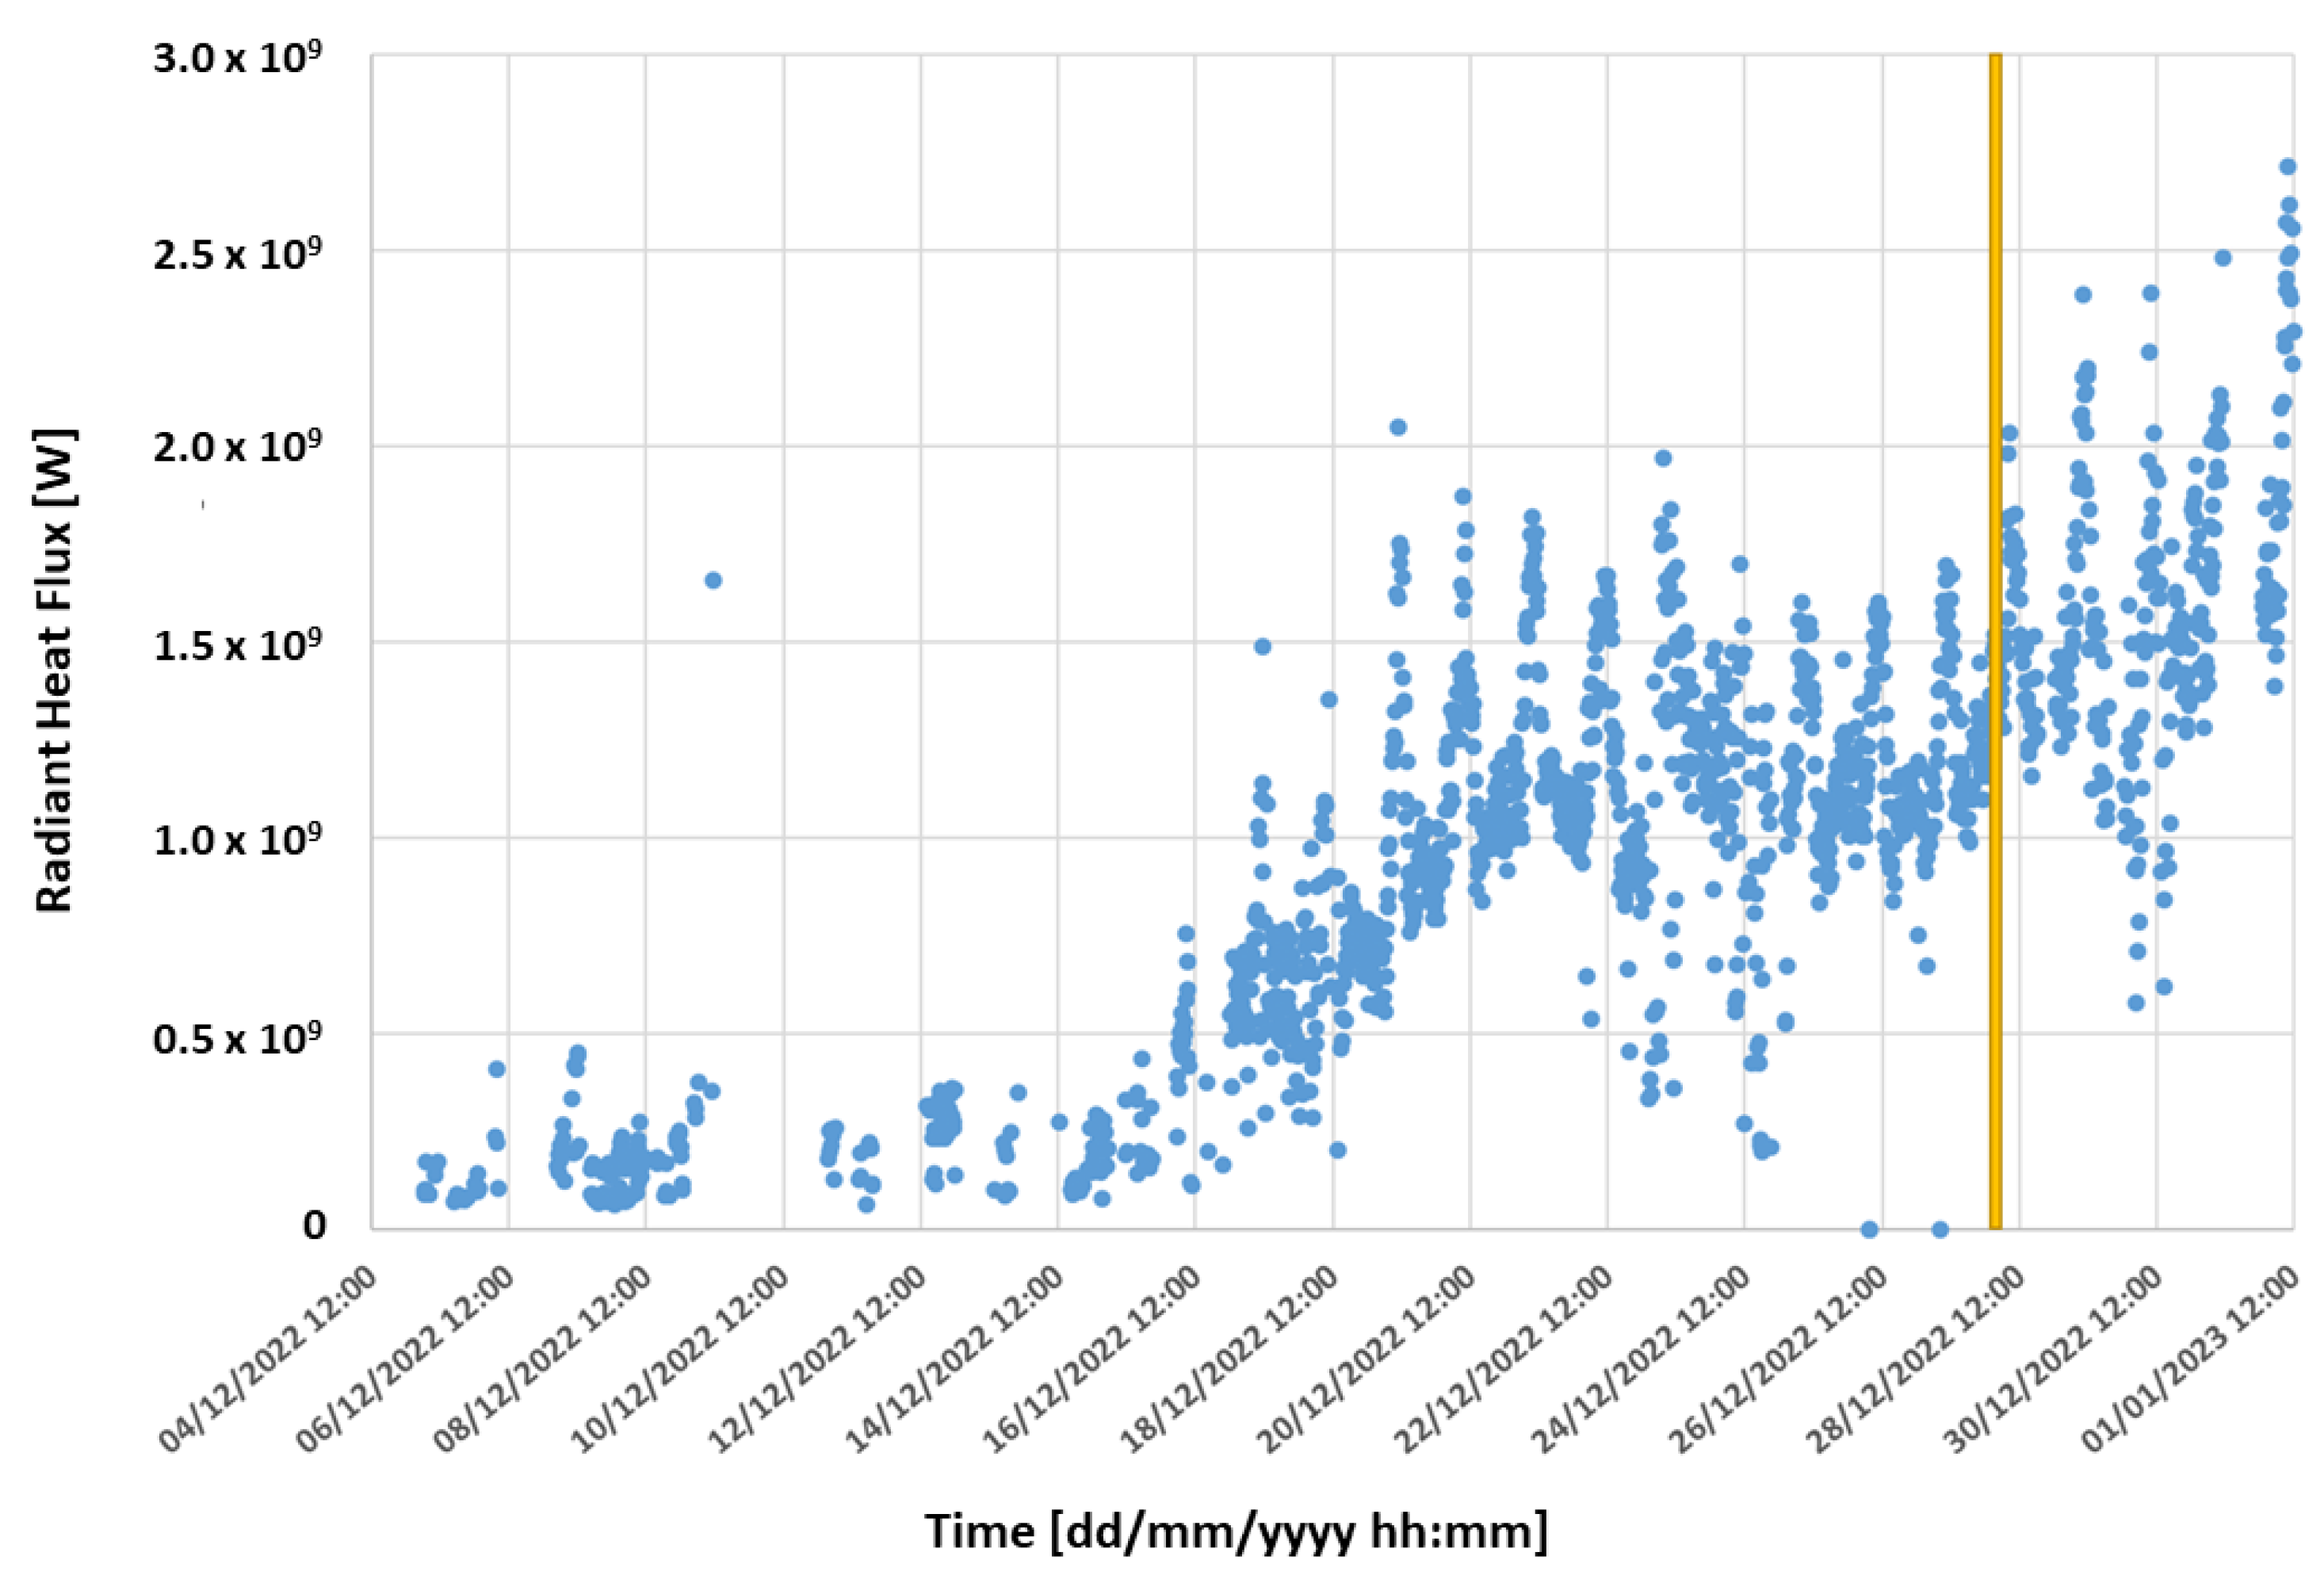
The eruption of Mt. Etna began relatively quietly in the late afternoon of 27 November 2022, in contrast to the intense activity observed in 2021, which featured numerous paroxysmal events at the South-East Crater. On 30 November 2022, a secondary vent opened, initiating the effusion of additional lava. As the eruption progressed, smaller lava breakouts were observed branching from the primary flow. By December, the lava flows had expanded into both the Valle del Leone and the Valle del Bove, forming an extensive lava flow field. Fumarolic activity was noted at all summit craters (Bocca Nuova (BN), Voragine (VOR), North-East Crater (NEC), and South-East Crater (SEC)) throughout the entire period, with variable levels of degassing. Between January and February 2023, occasional and modest ash emissions were recorded at the South-East Crater, although these were quickly dispersed by prevailing winds. The eruption subsided on 6 February 2023, when the lava flows ceased and the flow field began to cool. In correspondence of the OCO-3 acquisition, the observed SEVIRI-derived radiant heat flux shows a value of 1.25 GW observed in correspondence of the OCO3 acquisition (
Figure 13).
4. Discussion
Comparison of the angular coefficient with heat flux measurements revealed that its values, calculated in the 0–10 km range, are consistent with those derived from multispectral satellite observations. During Strombolian activity, as observed on 8 August and 14 August 2020, an angular coefficient of approximately −0.5 to −0.6 degrees was recorded, corresponding to a heat flux of 0.13–0.14 GW. The occurrence of a simultaneous lava overflow, as observed on 10 February 2022, indicating concurrent explosive and effusive activity, is associated with a lower angular coefficient, reaching −1.7 degrees, alongside a satellite-derived heat flux of 0.52 GW. The measurement on 25 February, which recorded an angular coefficient of −1.296 degrees, corresponds to the cooling phase of the lava flow field emitted during the 21 February eruptive event. This observation took place during a period of intense cloud cover and weak strombolian activity accompanied by ash emissions, as reported by the INGV monitoring networks, which likely obscured the thermal anomaly at the crater. Finally, during the OCO-3 measurement coinciding with the effusive eruption of 2022, the angular coefficient value increased threefold to −3.387 degrees as registered on 28 December 2022. This was accompanied by a radiant power measurement of 1.25 GW, indicating the presence of an extensive lava field.
On the other hand, if we consider the CO
2 fluxes, although the overall behaviour is consistent with the heat flux measurements and hence with the eruptive activity of Mt. Etna, some discrepancies are observed. In particular, this occurs on 28 December 2022, when one would expect the highest value of CO
2 flux, given the ongoing eruptive activity, but the estimated value is lower than that observed on 10 February 2022. This discrepancy could be due to a lack of measurement points in the 0–10 km range (
Figure 6), probably due to the presence of volcanic plume. These few data points significantly influence the slope of the interpolated line (i.e., the angular coefficient), yet their impact on the overall flux estimate is comparatively limited.
Our findings are consistent with previous studies on CO
2 flux at Mt. Etna, which have demonstrated that peaks of CO
2 emissions generally coincide with periods of increased volcanic activity, often accompanied by elevated SO
2 flux [
12]. In contrast, average CO
2 values are typically associated with background magma degassing [
11]. Beyond the summit, Etna also emits substantial quantities of carbon dioxide diffusely from its outer flanks, where no visible degassing occurs. These diffuse flank emissions likely contribute to the total CO
2 signal detected by satellite-based observations. Soil gas measurements support this phenomenon, indicating a broad, magmatic CO
2 release from the upper flanks, centred over the axial vents and gradually decreasing with distance. These emissions may be comparable in scale to summit crater degassing [
11].
Additionally, peak degassing episodes have been observed in the lead-up to eruptive events, marked by significant fluctuations in soil CO
2 flux and CO
2/SO
2 ratios [
20]. Such variations are valuable indicators of pressurization phases within Etna’s magmatic plumbing system, providing insight into subsurface dynamics and eruption forecasting [
21].
5. Conclusions
OCO-3 SAM data suggest the potential to detect and distinguish CO2 emissions originating from the Mt. Etna volcano. Statistical analysis on all available images indicates a possible volcano contribution in atmospheric CO2 concentrations, which is more evident in images with better spatial sampling. Therefore, spatial coverage, in terms of the number of samplings per OCO-3 image, is crucial for correctly estimating the trend in CO2 concentrations with distance from the gas source.
Five OCO-3 SAM images acquired between 2020 and 2023 exhibit a clear spatial gradient in CO2 concentration, with values decreasing with distance from Mt. Etna’s summit. This pattern suggests elevated emissions potentially associated with ongoing volcanic activity. Specifically, we identified strong correlations between radiant heat fluxes, that reflect the kind of eruptive activity, and the angular coefficients of interpolated lines of CO2 concentration within the first 10 km from the volcano summit.
We also calculated the CO
2 flux for the five selected case studies yielding high values, exceeding for example those estimated for Kilauea [
6] and the typical continuous flux from Mt. Etna, which averages approximately 9 ktons/day [
12], although its CO
2 discharge can exceed 100 ktons/day [
11]. This remains the case even when accounting for the substantial uncertainties and errors associated with these measurements. Nevertheless, the observed flux trends exhibit a moderate, though not optimal, correlation with the temporal evolution of the volcano’s eruptive phases. Notably, during the effusive eruption on 28 December, the CO
2 flux values were not the highest recorded—unlike the angular coefficient—primarily due to the limited number of valid data points available for flux estimation. The discrepancy between the angular coefficient and the estimated CO
2 flux could be also due to the effect of differing wind speeds: slower winds can favour the accumulation of CO
2 near the crater, leading to strong gradients. Given the constraints imposed by the sparse spatial sampling and the current limitations of OCO-3 data for volcanic observations, we can argue that the angular coefficient remains a reliable parameter for analysis in this context.
The maps of CO
2 concentration increases shown in
Figure 6 do not appear to indicate well-defined plumes flowing in a specific direction but rather a nearly homogeneous dispersion around summit craters. Generally, strong CO
2 concentrations due to volcanic emissions occur in the first tens of meters of the atmospheric column or less [
22]. The complex topography of Mt. Etna can influence the dispersion of the gas, since the air currents can be channelled or diverted by mountainous reliefs, creating different trajectories than those imposed by the wind at ground level, so favouring local accumulations. Furthermore, phenomena such as thermal inversion can prevent a vertical dispersion of the gas and favour its accumulation near the crater or its dispersion at a horizontal level.
Finally, this work can contribute to pave the way for using CO2 satellite measurements to analyse and monitor carbon dioxide emissions from volcanoes.


