Article

Dense Time Series Generation of Surface Water Extents through Optical–SAR Sensor Fusion and Gap Filling

1
Google LLC, Mountain View, CA 94043, USA
2
Department of Civil and Construction Engineering, Brigham Young University, Provo, UT 84602, USA
3
Department of Civil and Environmental Engineering, University of Houston, Houston, TX 77204, USA
4
Earth System Science Center, University of Alabama in Huntsville, Huntsville, AL 35899, USA
*
Author to whom correspondence should be addressed.
Remote Sens. 2024, 16(7), 1262; https://doi.org/10.3390/rs16071262
Submission received: 3 January 2024 / Revised: 25 March 2024 / Accepted: 25 March 2024 / Published: 3 April 2024

Abstract

:
Surface water is a vital component of the Earth’s water cycle and characterizing its dynamics is essential for understanding and managing our water resources. Satellite-based remote sensing has been used to monitor surface water dynamics, but cloud cover can obscure surface observations, particularly during flood events, hindering water identification. The fusion of optical and synthetic aperture radar (SAR) data leverages the advantages of both sensors to provide accurate surface water maps while increasing the temporal density of unobstructed observations for monitoring surface water spatial dynamics. This paper presents a method for generating dense time series of surface water observations using optical–SAR sensor fusion and gap filling. We applied this method to data from the Copernicus Sentinel-1 and Landsat 8 satellite data from 2019 over six regions spanning different ecological and climatological conditions. We validated the resulting surface water maps using an independent, hand-labeled dataset and found an overall accuracy of 0.9025, with an accuracy range of 0.8656–0.9212 between the different regions. The validation showed an overall false alarm ratio (FAR) of 0.0631, a probability of detection (POD) of 0.8394, and a critical success index (CSI) of 0.8073, indicating that the method generally performs well at identifying water areas. However, it slightly underpredicts water areas with more false negatives. We found that fusing optical and SAR data for surface water mapping increased, on average, the number of observations for the regions and months validated in 2019 from 11.46 for optical and 55.35 for SAR to 64.90 using both, a 466% and 17% increase, respectively. The results show that the method can effectively fill in gaps in optical data caused by cloud cover and produce a dense time series of surface water maps. The method has the potential to improve the monitoring of surface water dynamics and support sustainable water management.

1. Introduction

Surface water is a major component in the water cycle, and monitoring surface water dynamics is essential for understanding and managing water resources [1]. Sustainable water management requires accurate and timely information on surface water dynamics, such as streamflow and water body extent, which is necessary to plan for and mitigate the impacts of natural disasters like floods [2] and droughts [3]. Monitoring changes in surface water over time also helps identify areas that are particularly vulnerable to climate change and inform adaptation strategies [4]. Satellite-based remote sensing and modeling techniques have been used to provide vital information for international and transboundary water resources monitoring and management for variables such as water level [5], streamflow modeling [6], and surface water extent and water body changes [7,8]. These applications support the monitoring of surface water dynamics assisting in sustainable development goals for addressing climate change, most notably in providing data to meet Target 6.6 under the United Nations Sustainable Development Goal 6 concerning the availability and sustainability of water [9]. By monitoring surface water dynamics, we can better understand these changes and take action to promote sustainability and resilience in global water systems.
Optical multispectral sensors are commonly used to map surface water and characterize its spatial and temporal distribution [10]. For example, the ~40-year Landsat collection has been employed to map and quantify large-scale surface water changes across the Earth’s surface over time, using both time series information [8] and data-driven approaches [11] to characterize the surface water’s long-term trends. Mapping surface water via optical remote sensing typically involves identifying water features using indices [12], followed by classification using thresholds [13], decision tree approaches [14,15], or deep learning approaches [16,17]. However, clouds often obscure surface observations, particularly in the context of floods, limiting the effectiveness of optical sensors [18]. Some studies have explored the use of harmonized Landsat and Sentinel-2 data to increase the temporal density of observations and improve flood detection [19]. The recent availability of high-temporal-resolution datasets, such as Planet, provides additional data for monitoring surface water [20]. However, the presence of thin clouds, aerosols, fog, cloud shadows, etc. is still a significant factor that affects data quality [21]. Often, the peak surface water extent during flood events occurs coincidentally with cloud cover, resulting in data gaps and limiting the use of optical sensors for applications such as flood mapping [22].
Synthetic aperture radar (SAR) data offer advantages over optical data because observations of surface conditions can be acquired in almost all weather conditions [23], day or night, and can be used to fill in acquisition gaps in optical data. Since the launch of Copernicus Sentinel-1 by the European Space Agency (ESA) in 2014, SAR imagery has been frequently applied to various research applications [24,25], including surface water mapping using similar processing techniques as optical data [26,27,28,29,30]. SAR data are considered the most useful space-based remote sensing technology for detecting surface water in the presence of clouds [31]. However, substantial preprocessing is required to remove image artifacts such as radio frequency interference, terrain effects, and speckle effect [32]. Furthermore, SAR imagery relies on the specular reflectance of open water for detection, which can lead to errors of commission, with large areas of pavement or dry sandy soils being mistakenly classified as water [33], and errors of omission, when the water surface may be beneath vegetation canopies and not classified as water with a higher frequency radar signal [34].
Data fusion techniques that combine optical and SAR datasets offer a unique opportunity to leverage the advantages of both sensor types and produce a harmonized approach for surface water mapping that reduces errors and uncertainties [35]. These techniques can be implemented on multiple levels, including pixel-level, feature-level, and decision-level fusion [36]. Feature-level and decision-level fusion techniques use multiple sensors to identify features and fuse information to refine classification or object detection. For example, SAR, optical, and LiDAR data can be individually classified, and then the classified data are fused using decision tree approaches to map surface water [37] and wetlands [38]. Pixel-level fusion techniques can enhance images by creating a regression or mapping function that transforms original values into a harmonized value or by classifying directly with different sensor inputs [39]. Previous studies have used regression modeling to convert SAR backscatter data into a Sentinel-1 Water Index (SWI) [40] and Modified Sentinel-1 Water Index (MSWI) [41]; these data were used in tandem with Landsat 8 data to create a time series of surface water in China. However, these methods are regionally tailored with specific coefficients requiring significant effort to fit coefficients for each study to create a harmonized index. Non-parametric approaches for the pixel-level fusion of Landsat 8 optical and Sentinel-1 SAR imagery have also been used for surface water mapping [42]; however, non-parametric approaches are typically employed in data-scarce situations, but data-driven methods can yield better results with sufficient data, thus making non-parametric approaches unsuitable for large-scale water mapping in a variety of environments. Druce et al. [43] used temporal composites of SAR and optical data as inputs into a pixel-level fusion classifier to map surface water. This approach bypasses the need for a common index but requires coincident acquisitions as inputs into the classifier, resulting in data aggregation in time; this coincident requirement makes near real-time application infeasible. Additional frameworks have been developed for large-scale surface water mapping using multi-source data fusion [44]. While feature- and decision-level fusion may yield more accurate surface water mapping than single image classifications [45], this method aggregates data in space or time, making the approach unsuitable for events that have high-temporal and high-spatial changes, such as monitoring flooding events.
In this study, we applied a pixel-level data fusion approach for creating a dense time series of surface water maps by leveraging the complementary benefits of optical and SAR data. Our approach fills optical surface water data gaps caused by clouds, cloud shadows, and other atmospheric conditions using SAR surface water estimates. Studies have shown that merging observations from multiple satellites, such as Landsat, Sentinel-2, and Sentinel-1, can significantly improve flood detectability and increase the number of floods with useful imagery [46]. Research has been conducted focusing on the implementation of sensor fusion and gap-filling techniques to generate dense time series (e.g., [7,47,48]); however, these methods have been primarily focused on reservoir monitoring. In this study, we generated a contiguous, dense time series of surface water that (1) provided information on the spatial and temporal dynamics of surface water extent for different landscapes, including riverine, coastal, and floodplain regions, and (2) fused optical and SAR imagery to increase the temporal density of observations to monitor long-term dynamics and short-term changes in surface water (e.g., flood events). We validated this approach using hand-labeled reference points for different sites representing various ecological and climatic regions. We provided additional analysis to highlight this method’s capability to provide accurate time series information for monitoring surface water dynamics across landscapes. This approach has the potential to be highly beneficial for numerous water management applications, such as flood monitoring and drought monitoring, and can contribute to more effective decision-making in water resource management.

2. Materials and Methods

The following section outlines the method to create a dense time series by fusing optical and SAR data at the pixel level for surface water mapping. We used the Google Earth Engine (GEE) cloud computational platform [49] to implement the data fusion workflow. Figure 1 provides a visual overview of the data processing workflow. The green boxes represent the steps for processing optical data, the blue boxes represent SAR data processing steps, and the light gray boxes represent steps involving both data types. The workflow starts with data acquisition and preprocessing for both SAR and optical imagery. Then, the logistic regression models are applied to each data type independently to estimate water probability maps. These maps are then thresholded and filtered to generate binary water/no-water classifications. Finally, the sensor fusion step combines the SAR and optical classifications to fill gaps in the optical data and produce a dense time series of surface water maps. The following sections provide detailed explanations for various algorithms and present validation studies. We provide example code and methods to implement the data processing and create the figures in this paper at the following GitHub repository: https://github.com/KMarkert/phd-data-fusion-water (accessed on 12 March 2024). Please refer to the Data Availability Statement section and the repository for more information to run the code for the study.

2.1. Data

The ESA Sentinel-1 sensor is a C-band SAR sensor that offers multiple acquisition modes with different ground sampling distances. In this study, we used the Sentinel-1 Interferometric Wide (IW) swath mode at a 10 m ground sampling distance (GSD), which provides single and dual polarization options, including vertical transmitting with vertical receiving (VV) and vertical transmitting with horizontal receiving (VH) dual polarization. We used the preprocessed analysis ready dataset (ARD) of Sentinel-1 Level-1 IW Ground Range Detected (GRD) data provided by GEE (“COPERNICUS/S1_GRD”). The Sentinel-1 data on GEE were processed using the standard preprocessing steps via the Sentinel-1 SNAP Toolbox (Sentinel Application Platform). These steps included updating the orbit state vectors, removal of thermal and border noise, and conversion of linear backscatter units to logarithmic decibels (dB) to produce a radar backscatter dataset in dB units.
The Landsat 8 Operational Land Imagery (OLI) sensor, operated by the United States Geological Survey, provided the optical data for the data fusion workflow presented in this study. The OLI sensor collects spectral channel data in the visible, near-infrared (NIR), and short-wave infrared (SWIR) portions of the electromagnetic spectrum at a ground sampling distance of 30 m. We used the preprocessed surface reflectance (SR) Landsat 8 collection (“LANDSAT/LC08/C02/T1_L2”) available on GEE. This surface reflectance collection was processed through a series of steps, including conversion from raw digital numbers to top-of-atmosphere (TOA) reflectance using methods and band-specific irradiance values from [50], and atmospheric correction using the 6S atmospheric correction algorithm [51,52] within the Earth Resources Observation and Science (EROS) Center Land Surface Reflectance Code (LaSRC) to compute surface reflectance data [53]. We only used Landsat scenes that had 75% cloud cover or less in this study to ensure that the scenes had useful data for the fusion process.
In addition to the Sentinel-1 and Landsat 8 data used in the data fusion workflow, we also incorporated ancillary data sources for training a model to predict surface water probability from each of the Sentinel-1 and Landsat 8 data sources independently. To train the models, we used water extent data from the Sen1Floods11 dataset [54], a collection of Sentinel-1 SAR imagery and corresponding surface water classifications specifically designed for training and validating deep learning algorithms for flood detection. It consists of 4831 non-overlapping image chips, each covering an area of 512 × 512 pixels at 10 m resolution. These chips span 11 distinct flood events across the globe, encompassing diverse geographic and land cover characteristics. The dataset provides classifications for both permanent water bodies and floodwater, enabling the development of models that can distinguish between these two categories. The majority of the chips (4385) are weakly supervised, with surface water classifications generated using established remote sensing algorithms applied to Sentinel-1 and Sentinel-2 imagery. Additionally, a subset of 446 chips were meticulously hand-labeled by trained analysts, providing high-quality reference data for model validation and testing. We only used the hand-labeled chips from the dataset to use the highest quality data as inputs to train the model. We also used an independent validation dataset of hand-labeled points derived from time series of Planet imagery from Tottrup et al. [55] and Markert et al. [56] to validate the final data fusion outputs. The validation data from Tottrup et al. [55] represented monthly areas of inland, open surface waters at 10 m spatial resolution for 2019 over four sites (100 × 100 km) located across four countries: Colombia, Gabon, Mexico, and Zambia; the validation data from Markert et al. [56] represented a time series of inland surface water for areas in Cambodia and Myanmar in 2019. We aggregated these data to a monthly time step to align with the other datasets to allow us to include additional regions in the validation.

2.2. Study Area

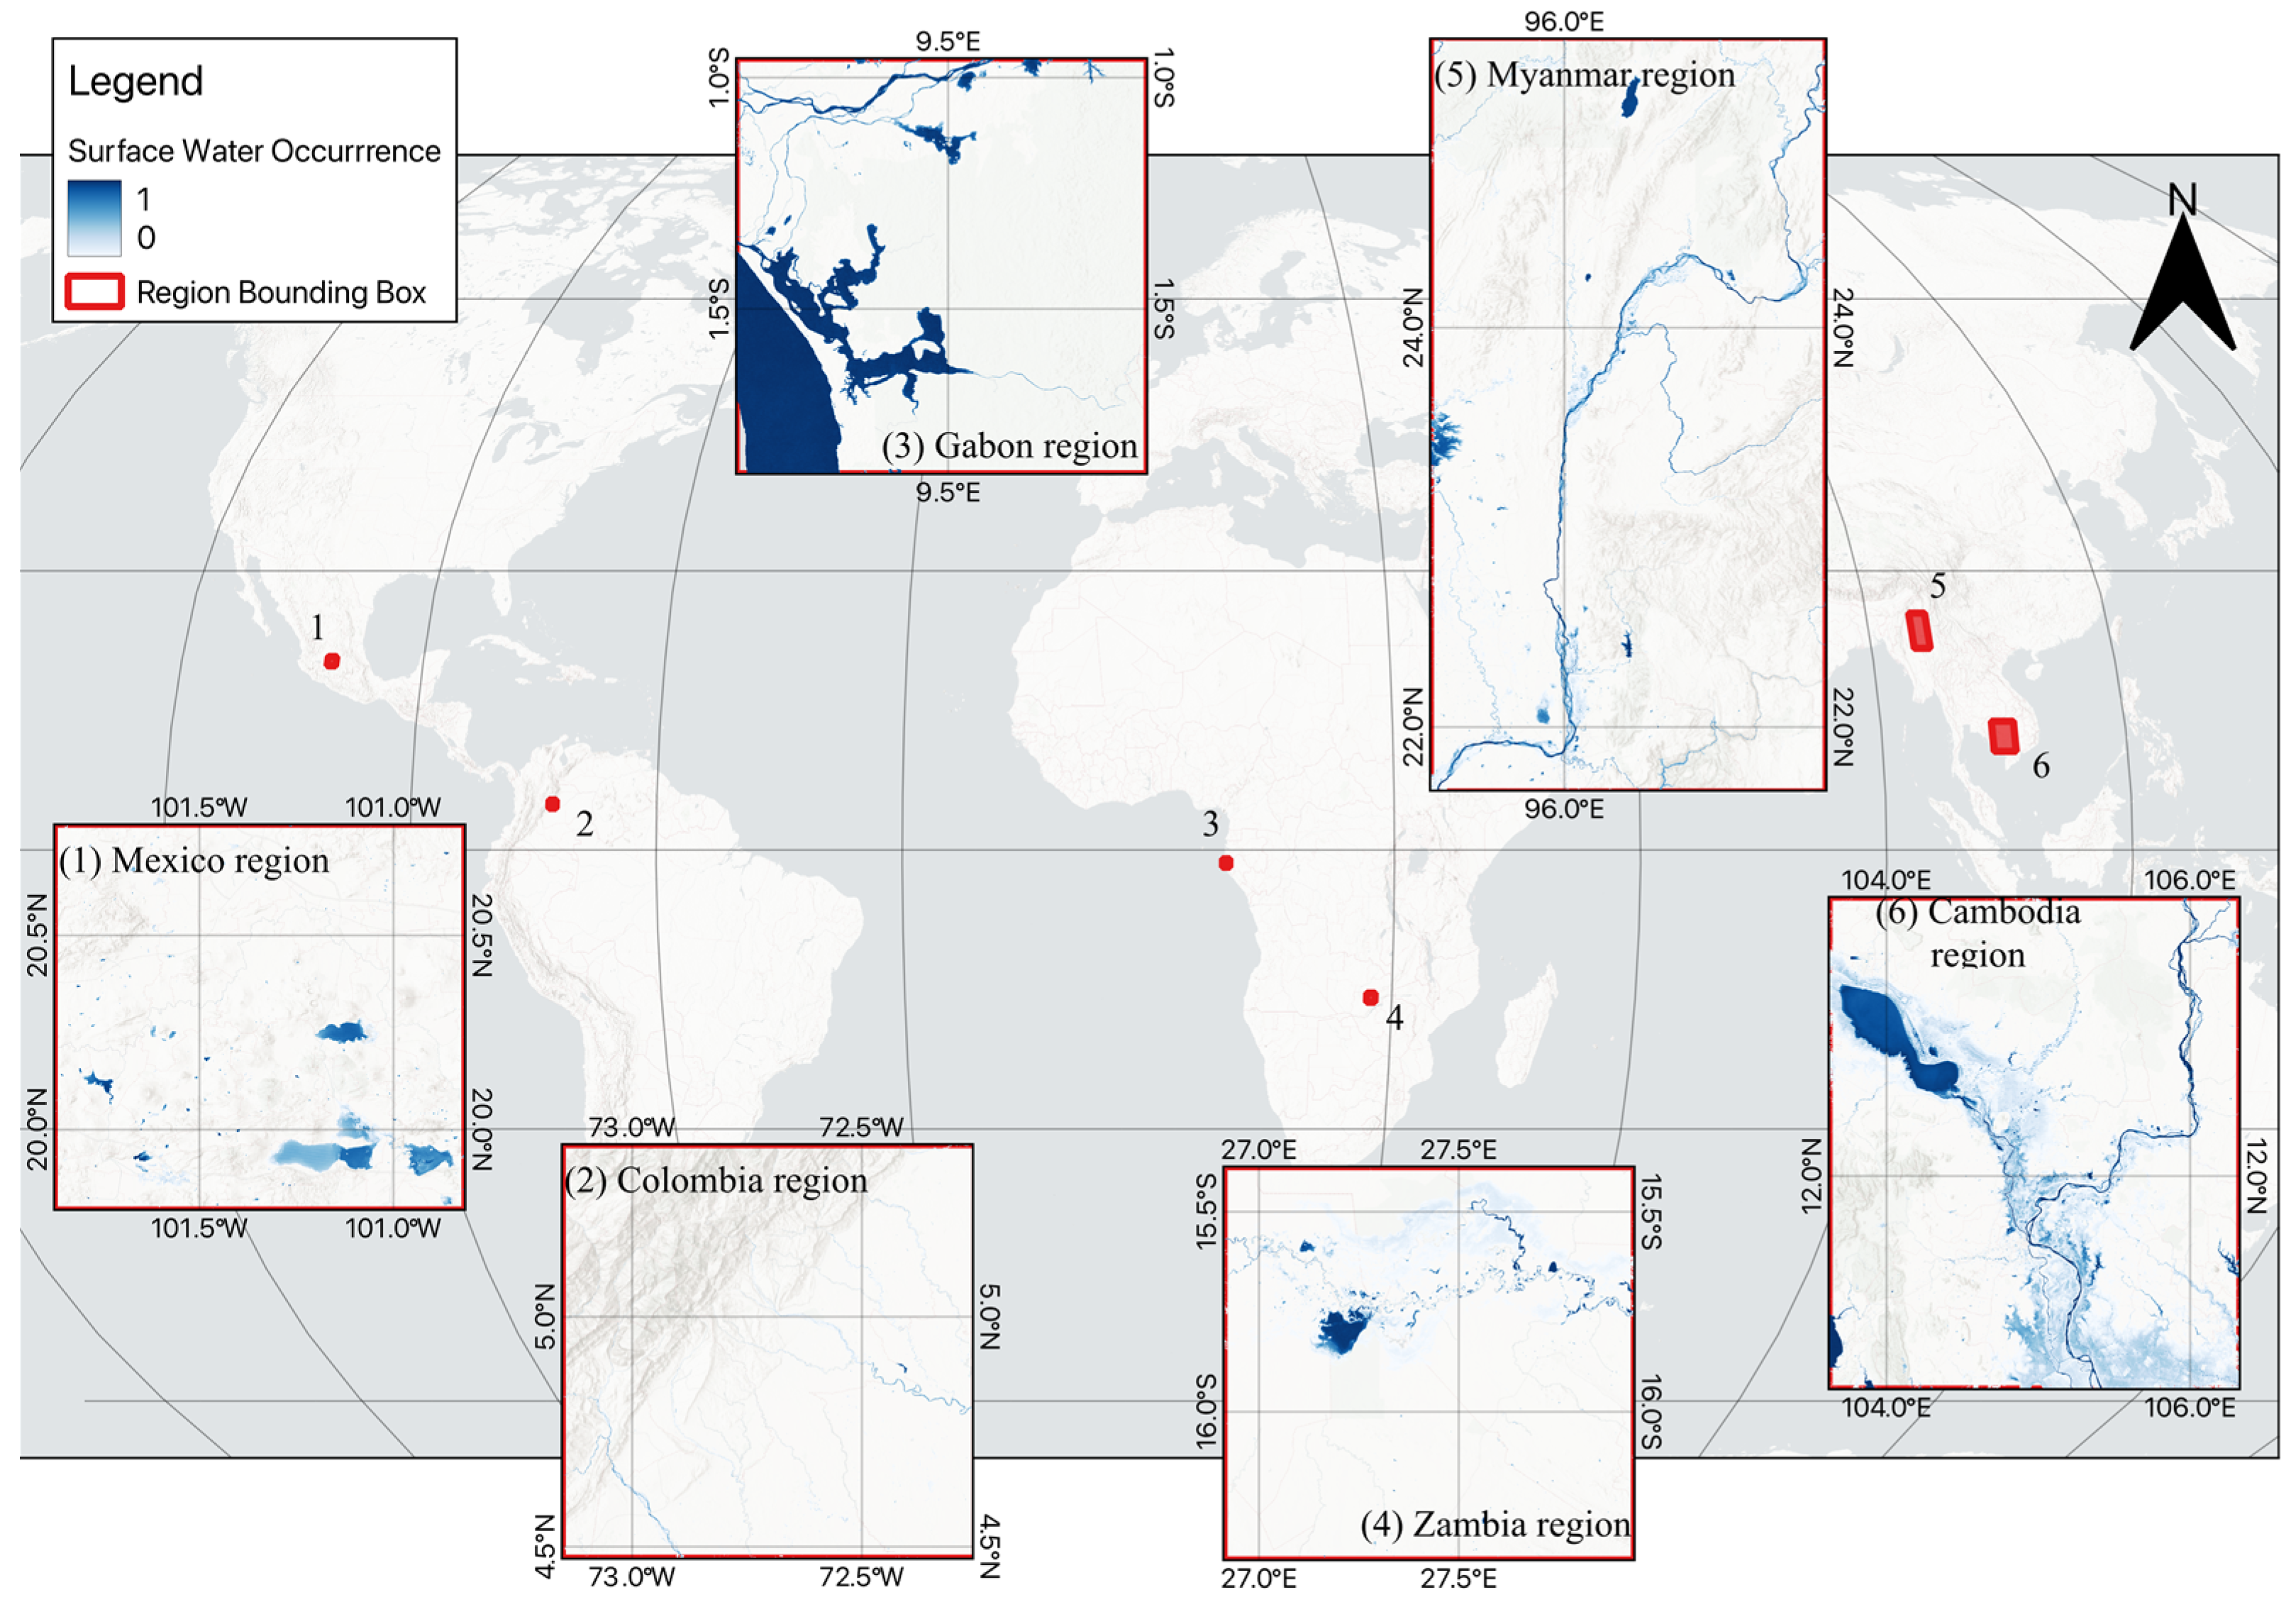
This study focused on six regions spanning diverse ecological and climatological conditions across the globe (Figure 2). The regions include the upper tributaries of the Magdalena River basin in Colombia, prone to frequent flooding; the outflow region of the Ogooué River basin in Gabon, characterized by extensive wetlands and floodplains; central Mexico, with reservoirs susceptible to both floods and droughts; the Zambezi River basin in Zambia, exhibiting significant seasonal variations in water levels; the Upper Irrawaddy River system in Northern Myanmar, which experiences severe flooding during the summer monsoon months; and the floodplains of the Lower Mekong basin in the Cambodian Tonlé Sap sub-watershed, a dynamic ecosystem with significant seasonal changes in water extent. These regions were selected to represent a variety of landscapes, climates, and surface water dynamics as well as to include major challenges for surface water mapping, including sites influenced by topography, cloud cover, vegetation, and additional land cover features, and regions with permanent low backscatter (e.g., flat and impervious areas, sandy surfaces). The sites also included a diversity of waterbodies, ranging from large waterbodies (wind and wave effects) to smaller waterbodies of both a permanent and seasonal nature, as well as waterbodies with varying water quality and shallow waters influenced by bottom reflectance. These diverse regions allowed us to assess the generalizability and effectiveness of our data fusion method across different environments. Furthermore, validation data were readily available for validation over these regions during the study period.

2.3. Model Training

We used the Sen1Floods11 dataset for training our models. This dataset contains coincident Sentinel-1 SAR and Sentinel-2 optical images, along with hand-labeled water/no-water classifications for each pixel. To prepare the data for model training, we flattened the images into vectors, treating each individual pixel as a training example. This resulted in approximately 96 million samples for the entire dataset. However, the training data exhibited an imbalance between water and non-water examples, with far more non-water pixels. To address this imbalance, we randomly undersampled the non-water examples to match the number of water examples, resulting in a balanced dataset of around 20 million examples. We then randomly withheld 33% of the data for validating the final model.
In addition to the raw SAR and optical bands, we computed and included several indices as input features for the models. These indices included the VV/VH ratio for SAR data, which can help distinguish water from other surfaces [12] and the Modified Normalized Difference Water Index (MNDWI) for optical data, which are specifically designed for water identification [57]. Other studies implemented texture mapping with SAR data for land cover classification [58,59]. We calculated texture features for the SAR data by computing the mean and standard deviation within a 9 × 9 moving window. These texture features capture spatial information that can be valuable for SAR-based water classification [60,61].
We chose logistic regression as the model for predicting surface water probability from the input features. Logistic regression is a well-established and computationally efficient method that has been successfully used in numerous studies for surface water mapping (e.g., [43,62]). Its interpretability allows for better understanding and analysis of the model’s predictions [43]. The logistic regression model is defined by Equation (1):
ln p 1 p = β 1 X 1 + β 2 X 2 + + β n X n + β 0
where β represents the fitted coefficients for each variable, X represents the variables used as inputs (shown in Table 1), and p is the raw logit outputs from the model that are transformed to probabilities of surface water.
To ensure robust model fitting, we implemented stratified K-fold cross-validation with five folds [63]. This technique helps estimate the model’s error distribution while preserving the water/non-water distribution of the original dataset. We selected the training parameters from the best-performing model during the K-fold process and used them to train the final production model on the entire dataset. This production model was then used to estimate water probability from each sensor type (SAR and optical) independently.

2.4. Water Prediction and Sensor Fusion

We applied the trained logistic regression models to the SAR and optical imagery to estimate the probability of each pixel being water. For SAR data, we followed established preprocessing steps from Mullissa et al. [64], including border noise correction, and angular-based radiometric slope correction from Vollrath et al. [65] to reduce terrain effects. For optical data, we used the CFMask band [66,67] to mask out clouds, cloud shadows, and snow/ice pixels, ensuring that only high-quality surface observations were used for fusion.
After applying the models and obtaining water probability maps for each sensor, we used the Edge Otsu algorithm [56,68] to determine a threshold for classifying water pixels. This adaptive thresholding approach accounts for potential errors in the optical data due to cloud masking and residual noise in the SAR predictions. Other studies applied filters for terrain shadows using HAND [69,70] as well as agricultural or soil pixels that result in low backscatter and are often confused with water in SAR data [33]. We further filtered the classified water areas for both SAR and optical data based on the maximum climatological extent for the corresponding month, using historical surface water data from the JRC. This dynamic filtering approach helps eliminate false positives and ensures that the predicted water extent is within reasonable bounds.
Our sensor fusion methodology employs a gap-filling technique based on the methods of Donchyts et al. [7]. Another study by Bai et al. [48] used a similar method with Naive Bayes classification to gap fill optical imagery to monitor reservoir dynamics. We first identified the water edges from the optical observation using the water extent derived from the logistic regression probabilities. Then, we sampled the SAR water probabilities from the most recent 15 days prior to the optical image acquisition that intersected with the edges of the optical image gaps. This accounted for seasonality and captured recent changes in water extent. We then reduced the sampled SAR probabilities to a single threshold value using the 50th percentile. This threshold was applied to the SAR data to identify water areas, which were then used to fill the gaps in the optical data. This process resulted in a merged optical–SAR surface water map for each observation and a dense time series of surface water maps when applied to all available images. Our approach differs from previous methods by using the most recent SAR data to fill gaps in optical imagery, rather than relying on long-term historical patterns. This allowed us to capture the maximum water extents and account for inter- and intra-annual trends in surface water dynamics. By aggregating the resulting time series to a monthly scale, we obtained a final dataset representing the frequency of surface water observations for each month.

2.5. Validation/Statistical Analysis

Surface water mapping results are often assessed using statistical metrics that measure the accuracy and reliability of the data. Accuracy is a key metric that measures the proportion of correctly identified surface water features compared to the total number of features identified. The false alarm rate (FAR) measures the proportion of incorrectly identified surface water features compared to the total number of features identified and provides an idea of whether the method has the tendency to overpredict water extent. The probability of detection (POD) is a metric that measures the proportion of actual surface water features that were correctly identified and indicates whether the method correctly captures the water extent or underestimates this extent. A low FAR and high POD are desirable, as this means that the system is less likely to generate false alarms while accurately estimating water extent. However, a low FAR can also lead to a lower POD and vice versa; therefore, it is important to quantify both metrics to measure the ability of the process to generate accurate estimates while limiting false positives. The critical success index (CSI) [71] is a comprehensive metric that combines both the POD and FAR to assess the overall success of the classification. The CSI avoids bias caused by true negatives (land areas), making it a more reliable metric for the relatively smaller number of water extent areas [72]. A high CSI indicates a high level of accuracy and reliability in the surface water mapping results. These statistical metrics provide a quantitative method to evaluate the performance of surface water mapping techniques and to characterize the data quality used for various applications such as hydrological modeling and land use planning.
The overall accuracy is the percentage of pixels that were correctly estimated, either true positive or true negative, over the total number of pixels:
O A = T N + T P T N + F N + F P + T P
where OA is the overall accuracy, TN is the true negative, TP is the true positive, FN is the false negative, and FP is the false positive rate.
The FAR is the number of incorrectly estimated water pixels over all the pixels estimated as water, providing a percentage of falsely estimated pixels:
F A R = F P F P + T N
where FAR is the false alarm rate metric.
The POD, also called precision, is the percentage of all pixels that were estimated as surface water that were actually water:
P O D = T P T P + F N
where POD is the probability of detection metric.
The CSI is the number of pixels that were correctly estimated as water over the number of pixels that were either estimated or observed as inundated and is calculated using the following equation:
C S I = T N T N + F N + F P
where CSI is the CSI metric.
We computed these metrics for the entire validation dataset to understand the overall accuracy of our method. We also computed these metrics per region and over the time series to better understand spatial and temporal issues. These spatial and temporal metrics provide a view on the performance for the different eco-climatic regions as well as in time, across a combination of accuracy metrics. The different metrics, computed in different regions, provide insight into the different aspects of accuracy and help managers evaluate how these approaches are relevant for use.

3. Results

3.1. Logistic Regression Model Fitting

We selected the logistic regression models used to estimate surface water in the imagery based on the model with the highest training accuracy from the K-fold training process. We validated these models using the 33% of the data that was withheld for validation. The best model from the K-fold training processes had a training mean accuracy of 0.8776 for the SAR model and 0.9599 for the optical model. When we trained and applied this model to the withheld training dataset without K-folds, the overall training accuracy was 0.8777 for the SAR data and 0.9601 for the optical data. The testing accuracy using the validation data was 0.8778 and 0.9601 for the SAR and optical datasets, respectively. While the testing accuracy was higher for the optical model, the results for both the SAR and optical water directions were comparable to those reported in other studies using logistic regression for water detection where reported accuracy ranged from 85.2% to 99% for different test sites and models [43,62]. The difference in accuracy between the SAR and optical models was likely due to the different nature of the data. Errors in surface water mapping with SAR typically arise due speckle noise, land surface characteristics, and the side-looking geometry of SAR collections, whereas optical data are better at capturing the spatial detail of surface water due to the electro-optical properties that are observed. A study by Konopala et al. [73] investigated the use of deep learning and combinations of SAR and optical data for surface water and found that using only optical data yielded a statistically significant superior performance compared to S1, which aligns with the results here. Regardless, the results of the model training showed that both the models for SAR and optical data effectively detected water.
The final logistics regressions equation with fitted coefficients are:
ln p 1 p = 0.0584   VV   0.0387   VH   + 0.1433   VV mean + 0.4898   VV std 0.4444   VH mea + 0.4265   VH std   0.0008   VV / VH 10.9985
ln p 1 p = 0.001848   Blue   + 0.003667   Green   + 0.002594   Red   0.002233   NIR 0.000491   SWIR 1   0.0025   SWIR 2 + 4.5892   MDNWI 1.0033
where the variables are described in Table 1. Equation (1) is for the SAR data and Equation (2) is for the optical data. The calculated SAR model coefficients show that the spatial statistics (i.e., mean and standard deviation) calculated from the SAR data are weighted greater than the original values, showing that spatial information is important for the mapping of surface water with SAR data. Furthermore, the VV/VH variable is weighted very low, indicating that it has relatively little importance for surface water mapping for our model. The optical model coefficients show that the MNDWI variable has a much greater importance than the individual bands. This makes sense as the index was developed specifically to identify water pixels. Among the individual bands, the SWIR1 variable was weighted the least, indicating little importance for surface water mapping. This was an unexpected result as water absorbs most of the incoming energy in the SWIR1 channel and is typically used for surface water mapping [13]. However, MNDWI uses the SWIR1 channel in the equations, which could account for that information with the weighting, as this information is included in the MNDWI variable.

3.2. Water Prediction

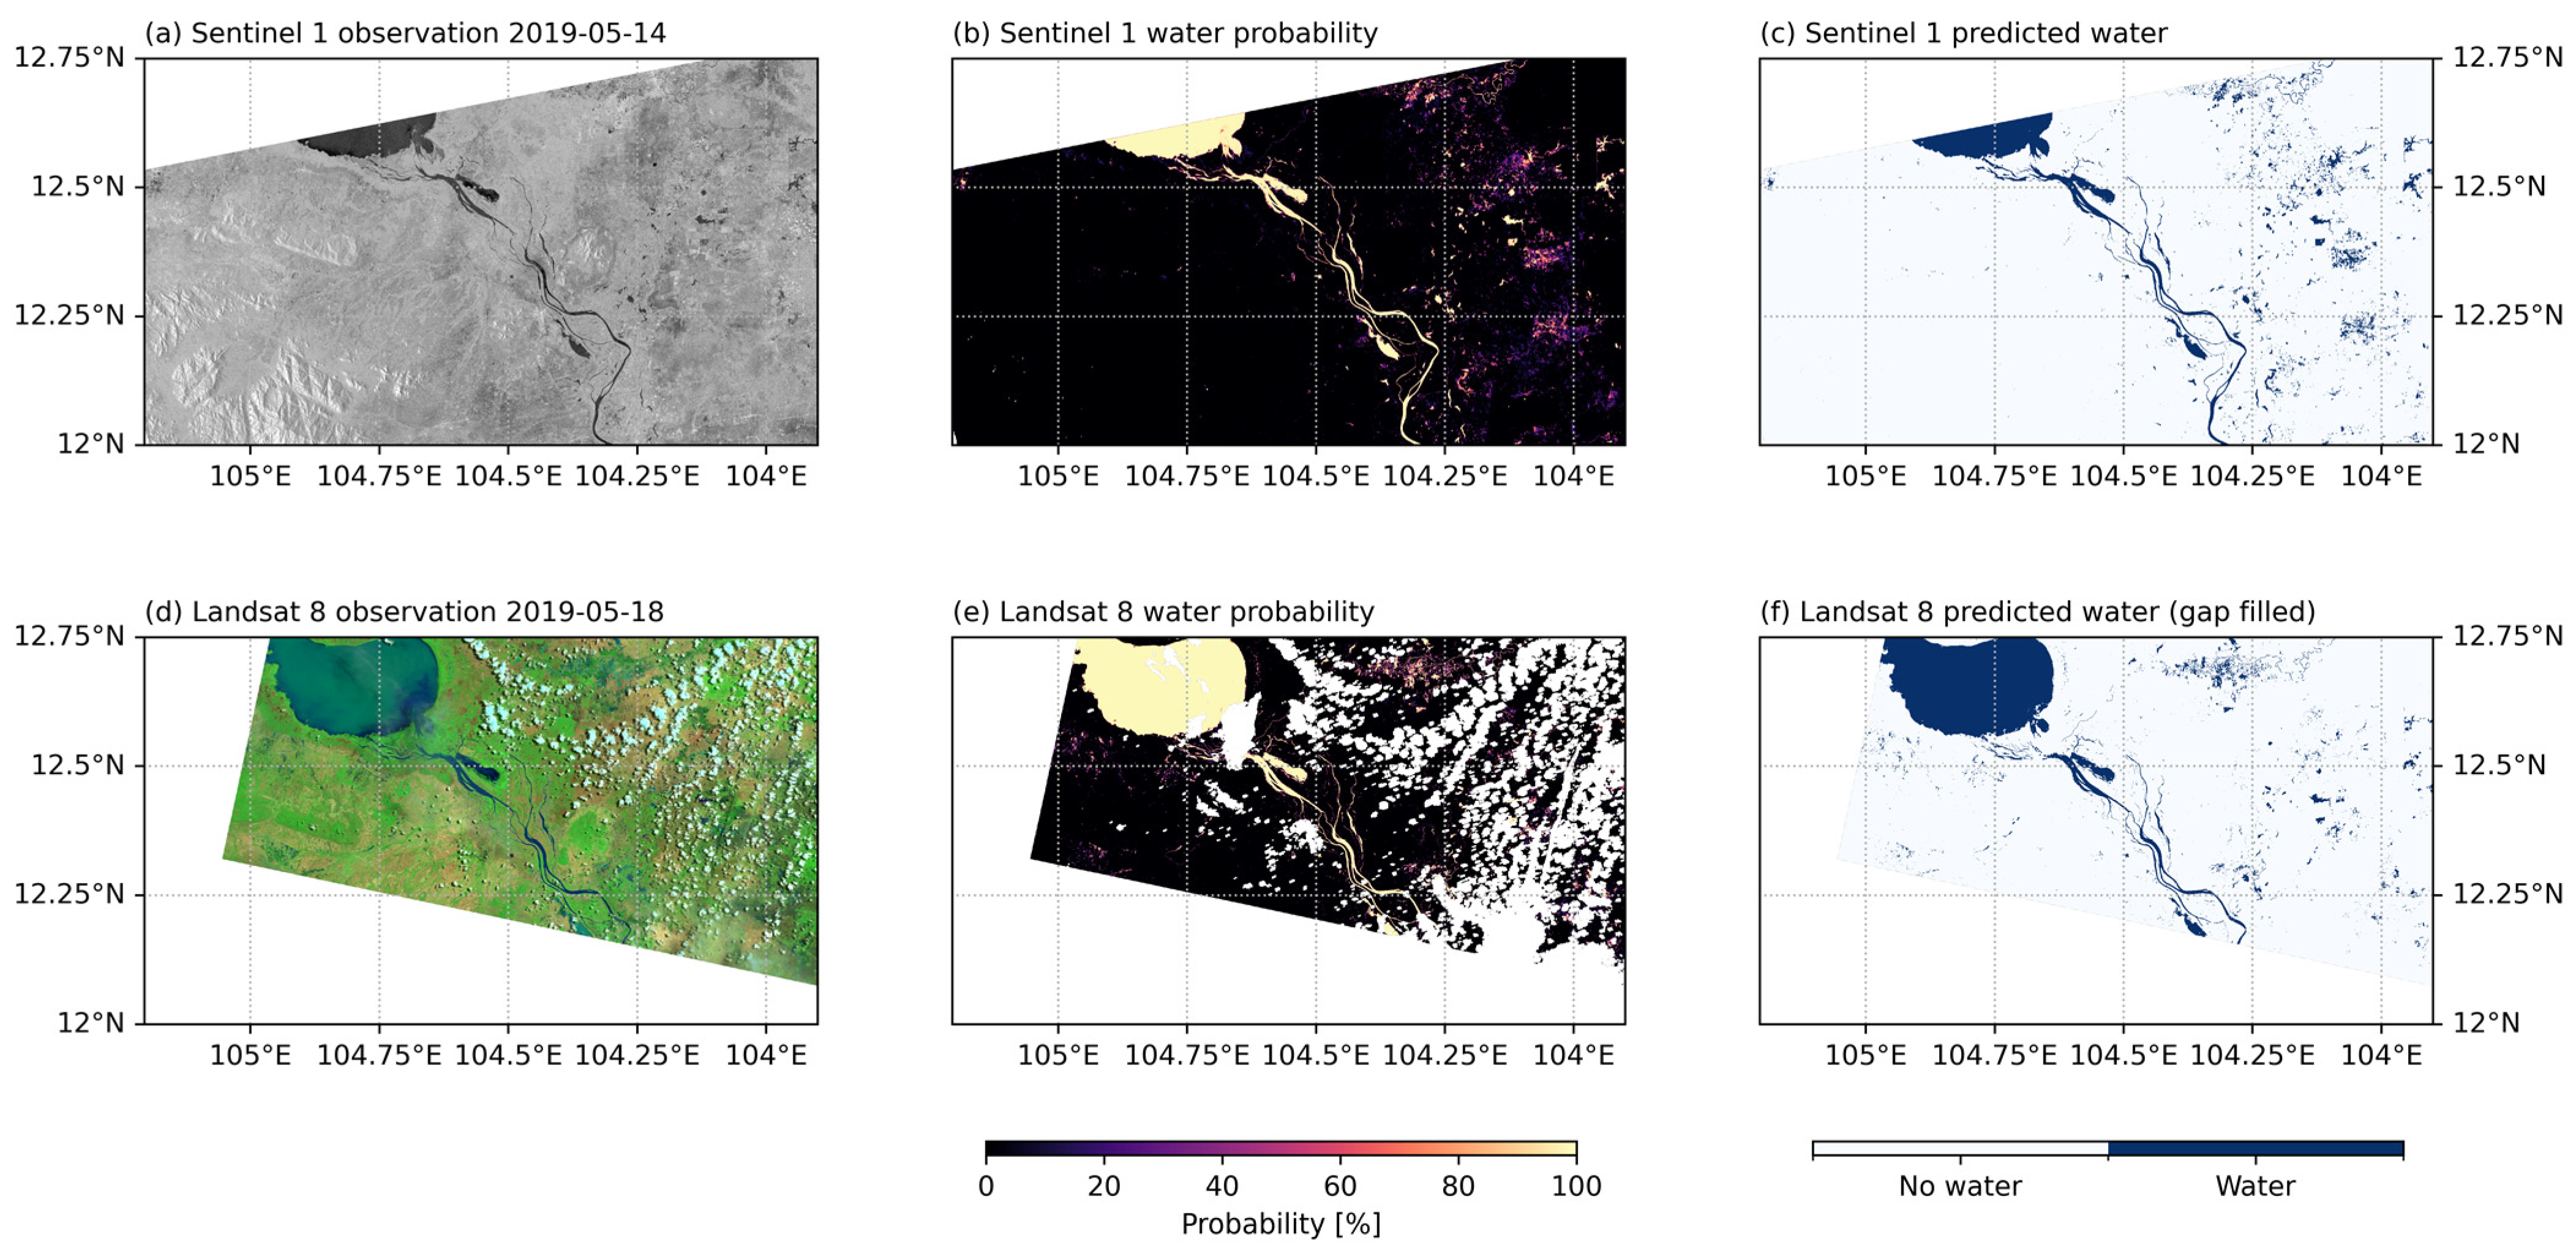
We applied the logistic regression models and resulting water classification to the imagery for the regions with validation data. We gap filled the optical imagery using SAR data following our method. Figure 3 highlights the results of the logistic regression model and water mapping for both the SAR and optical imagery for observations in May 2019 for an area in the Cambodia region. Figure 4 displays the same information, observations, logistic regression, and water mapping results as Figure 3 but for a case from the Gabon region. The figures show that the resulting model probabilities and water mapping were able to capture the spatial extent of surface water well when compared to the observation. We gap filled the optical water maps’ (Figure 3f and Figure 4f) areas of the optical imagery that were cloud occluded or had poor-quality pixels identified in the QA band. The figures show that gap filling produced a realistic water surface result in the absence of an in situ observation. Figure 4 is a more extreme case, where most of the area in the optical imagery was obscured by clouds, though there was a small area that produced enough data so that gap filling using SAR data could be performed. The location shown in Figure 3 was a less extreme case, where there was less cloud occlusion, and the gaps that needed to be filled using the SAR data were a smaller percentage of the water area.
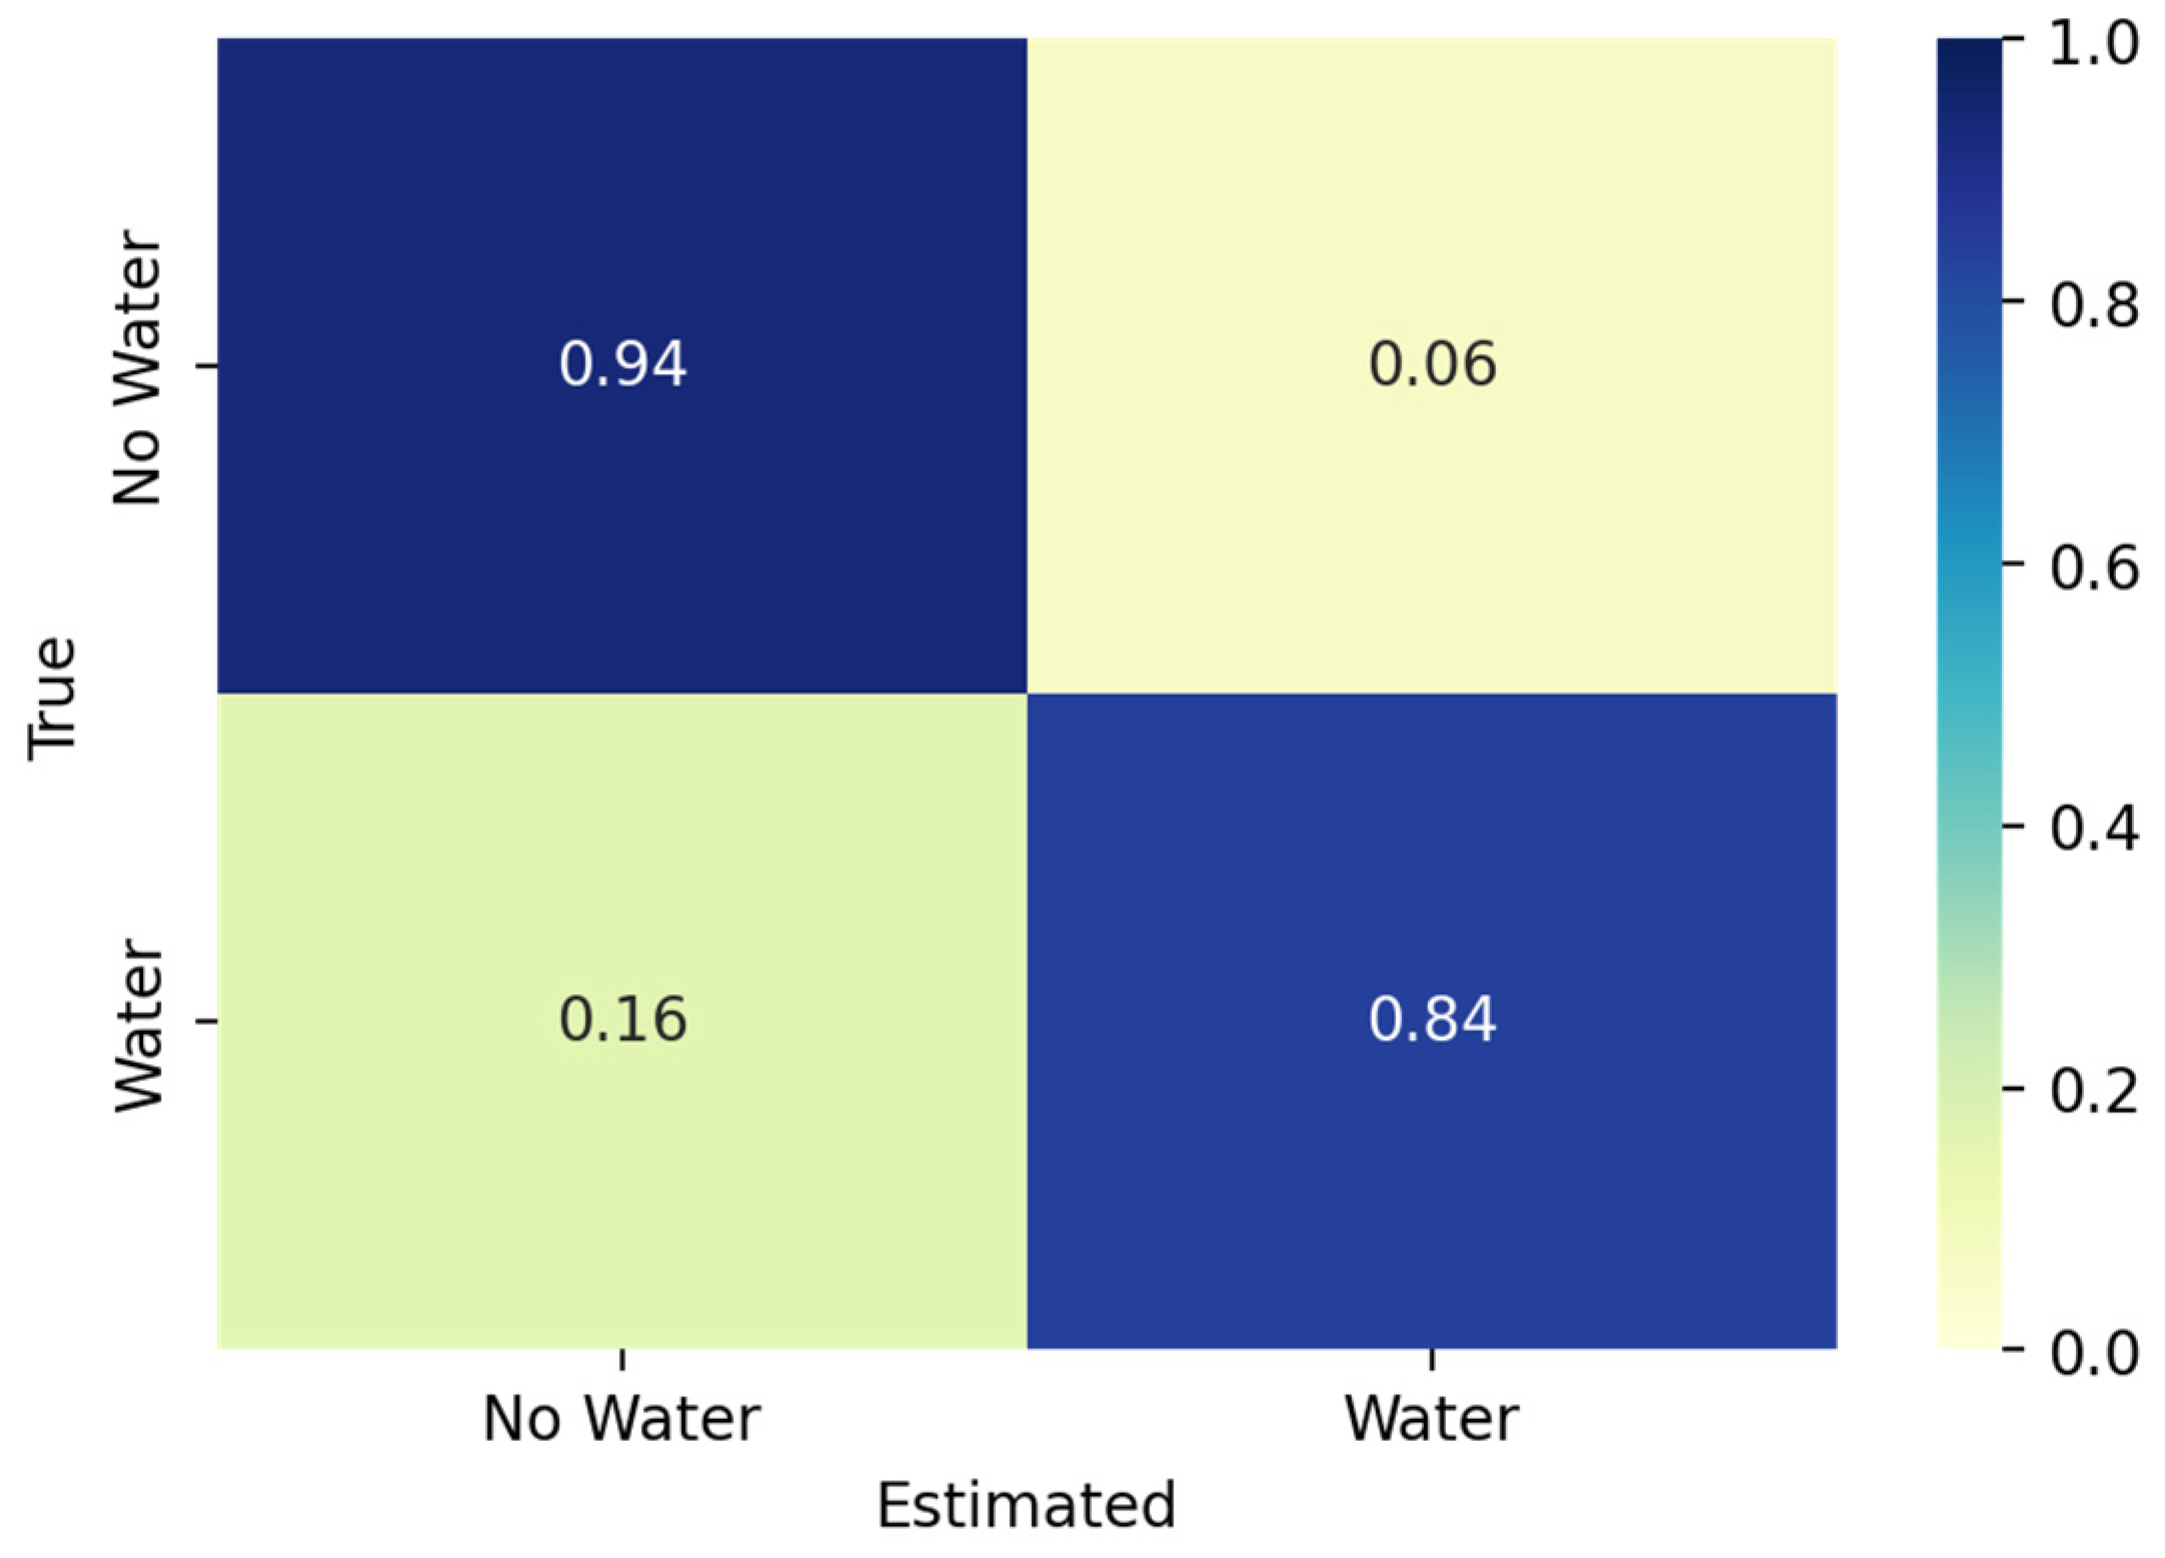
We validated the water predictions using the dataset from Tottrup et al. [55] and Markert et al. [56]. We found that the overall accuracy of our method based on the validation dataset was 0.9025 with a FAR of 0.0631 and a POD of 0.8394. This assumes that the validation dataset was “true”. The CSI metric was 0.8073, a good score [74]. Figure 4 shows the confusion matrix using all of the validation samples (n = 8974). Figure 5 shows that the overall false positive rate was around 6% compared to the false negative rate of 16%. These results indicate that the method generally performs well at identifying water areas; however, it slightly underpredicted water areas, that is, higher false negatives.
We computed the metrics on a regional basis to determine if specific regions performed better or worse than others and to potentially determine why. Table 2 tabulates the results per region. The Zambia region had the worst overall accuracy of 86.56%, with the Myanmar region having the best accuracy of 92.65%. The Cambodia region had the worst FAR of 3.49% and Mexico had the best FAR of 0.0%. This means the Cambodia region had the highest amount of area that was falsely predicted as water, false positives. This may be due to the high amount of fallow agricultural areas and alluvium soils present in the Cambodia floodplain region [75] that can often be confused as water due to low backscatter returns and, thus, reflected in fused time series. Conversely, Mexico had no validation points where non-water pixels were predicted as water and was drier. The Gabon region had the highest POD metric of 82.61%, whereas the Colombia region had the lowest, of 43.53%. The Colombia region was heavily vegetated and had terrain that could obscure the land surface in C-band SAR data like Sentinel-1 [76] leading to false negatives.
Figure 6 displays the accuracy across all regions in time for the 2019 period. This figure includes the monthly average cloud cover for the regions to highlight how the presence of clouds in a given month affects the accuracy of our method. Overall, accuracy for the regions varied between 82% and 98% for any given month. We found no statistical relationship between cloud cover and accuracy, with the accuracy correlation with cloud cover across all regions of −0.0331, which resulted in a p-value of 0.8621. These statistics indicate that accuracy of the extracted water at a monthly timescale using our method was not impacted by cloud cover.
When comparing the results of this study to other published works, our method resulted in a similar, albeit slightly lower, accuracy. The study conducted by Tottrup et al. [55] evaluated 14 different surface water mapping methods that employed different data fusion approaches and reported overall accuracies ranging between 89% and 98% over the Columbia, Gabon, Mexico, and Zambia regions. The Zambia region had the lowest average overall accuracy of 88.6% from Tottrup et al. [55] compared to our method’s overall accuracy of 86.56%. The region with the highest average accuracy from Tottrup et al. [55] was Colombia with an accuracy of 93.07%, whereas our method produced an accuracy of 88.43% for the same region. Markert et al. [56] reported accuracies of 92% to 95% for the Cambodia and Myanmar regions, testing four different combinations of two algorithms and two input data processing levels. Our method resulted in accuracies of 91.1% and 92.12% for the Cambodia and Myanmar regions, respectively. The algorithm introduced by Bai et al. [48], another gap-filling process based on Bayesian updating gaps in optical data based on historical occurrence values, resulted in accuracies greater than 90% across five regions, whereas this study resulted in three regions with a greater than 90% accuracy and a minimum of 86.56%. That study primarily evaluated the algorithm over reservoirs, which are typically less complex than the surface water dynamics evaluated in this study.
The results of this study demonstrate that our method generates images with more observations in time and more complete coverage, i.e., fewer gaps, with a similar accuracy to previous studies, supporting better analysis of surface water dynamics. One of the notable improvements to the state of the art was by incorporating multiple sensors in the surface water detection, where Markert et al. [56] and Bai et al. [48] only used single sensors, either SAR or optical sensors, respectively. The different algorithms presented by Tottrup et al. [55] applied data fusion with optical and SAR data; however, the results were at a monthly timescale. Our method resulted in data at a higher temporal resolution based on each scene acquisition, better capturing inter-monthly changes to surface water for flooding or real-time drought applications. This is a significant improvement, especially for results that change rapidly in time such as floods and computed with accuracy similar to other methods. In addition, our method generated images with more complete coverage of surface water phenomena, whereas the other approaches from Tottrup et al. [55] did not attempt to fill poor data gaps in optical observations.

3.3. Dense Time Series of Surface Water

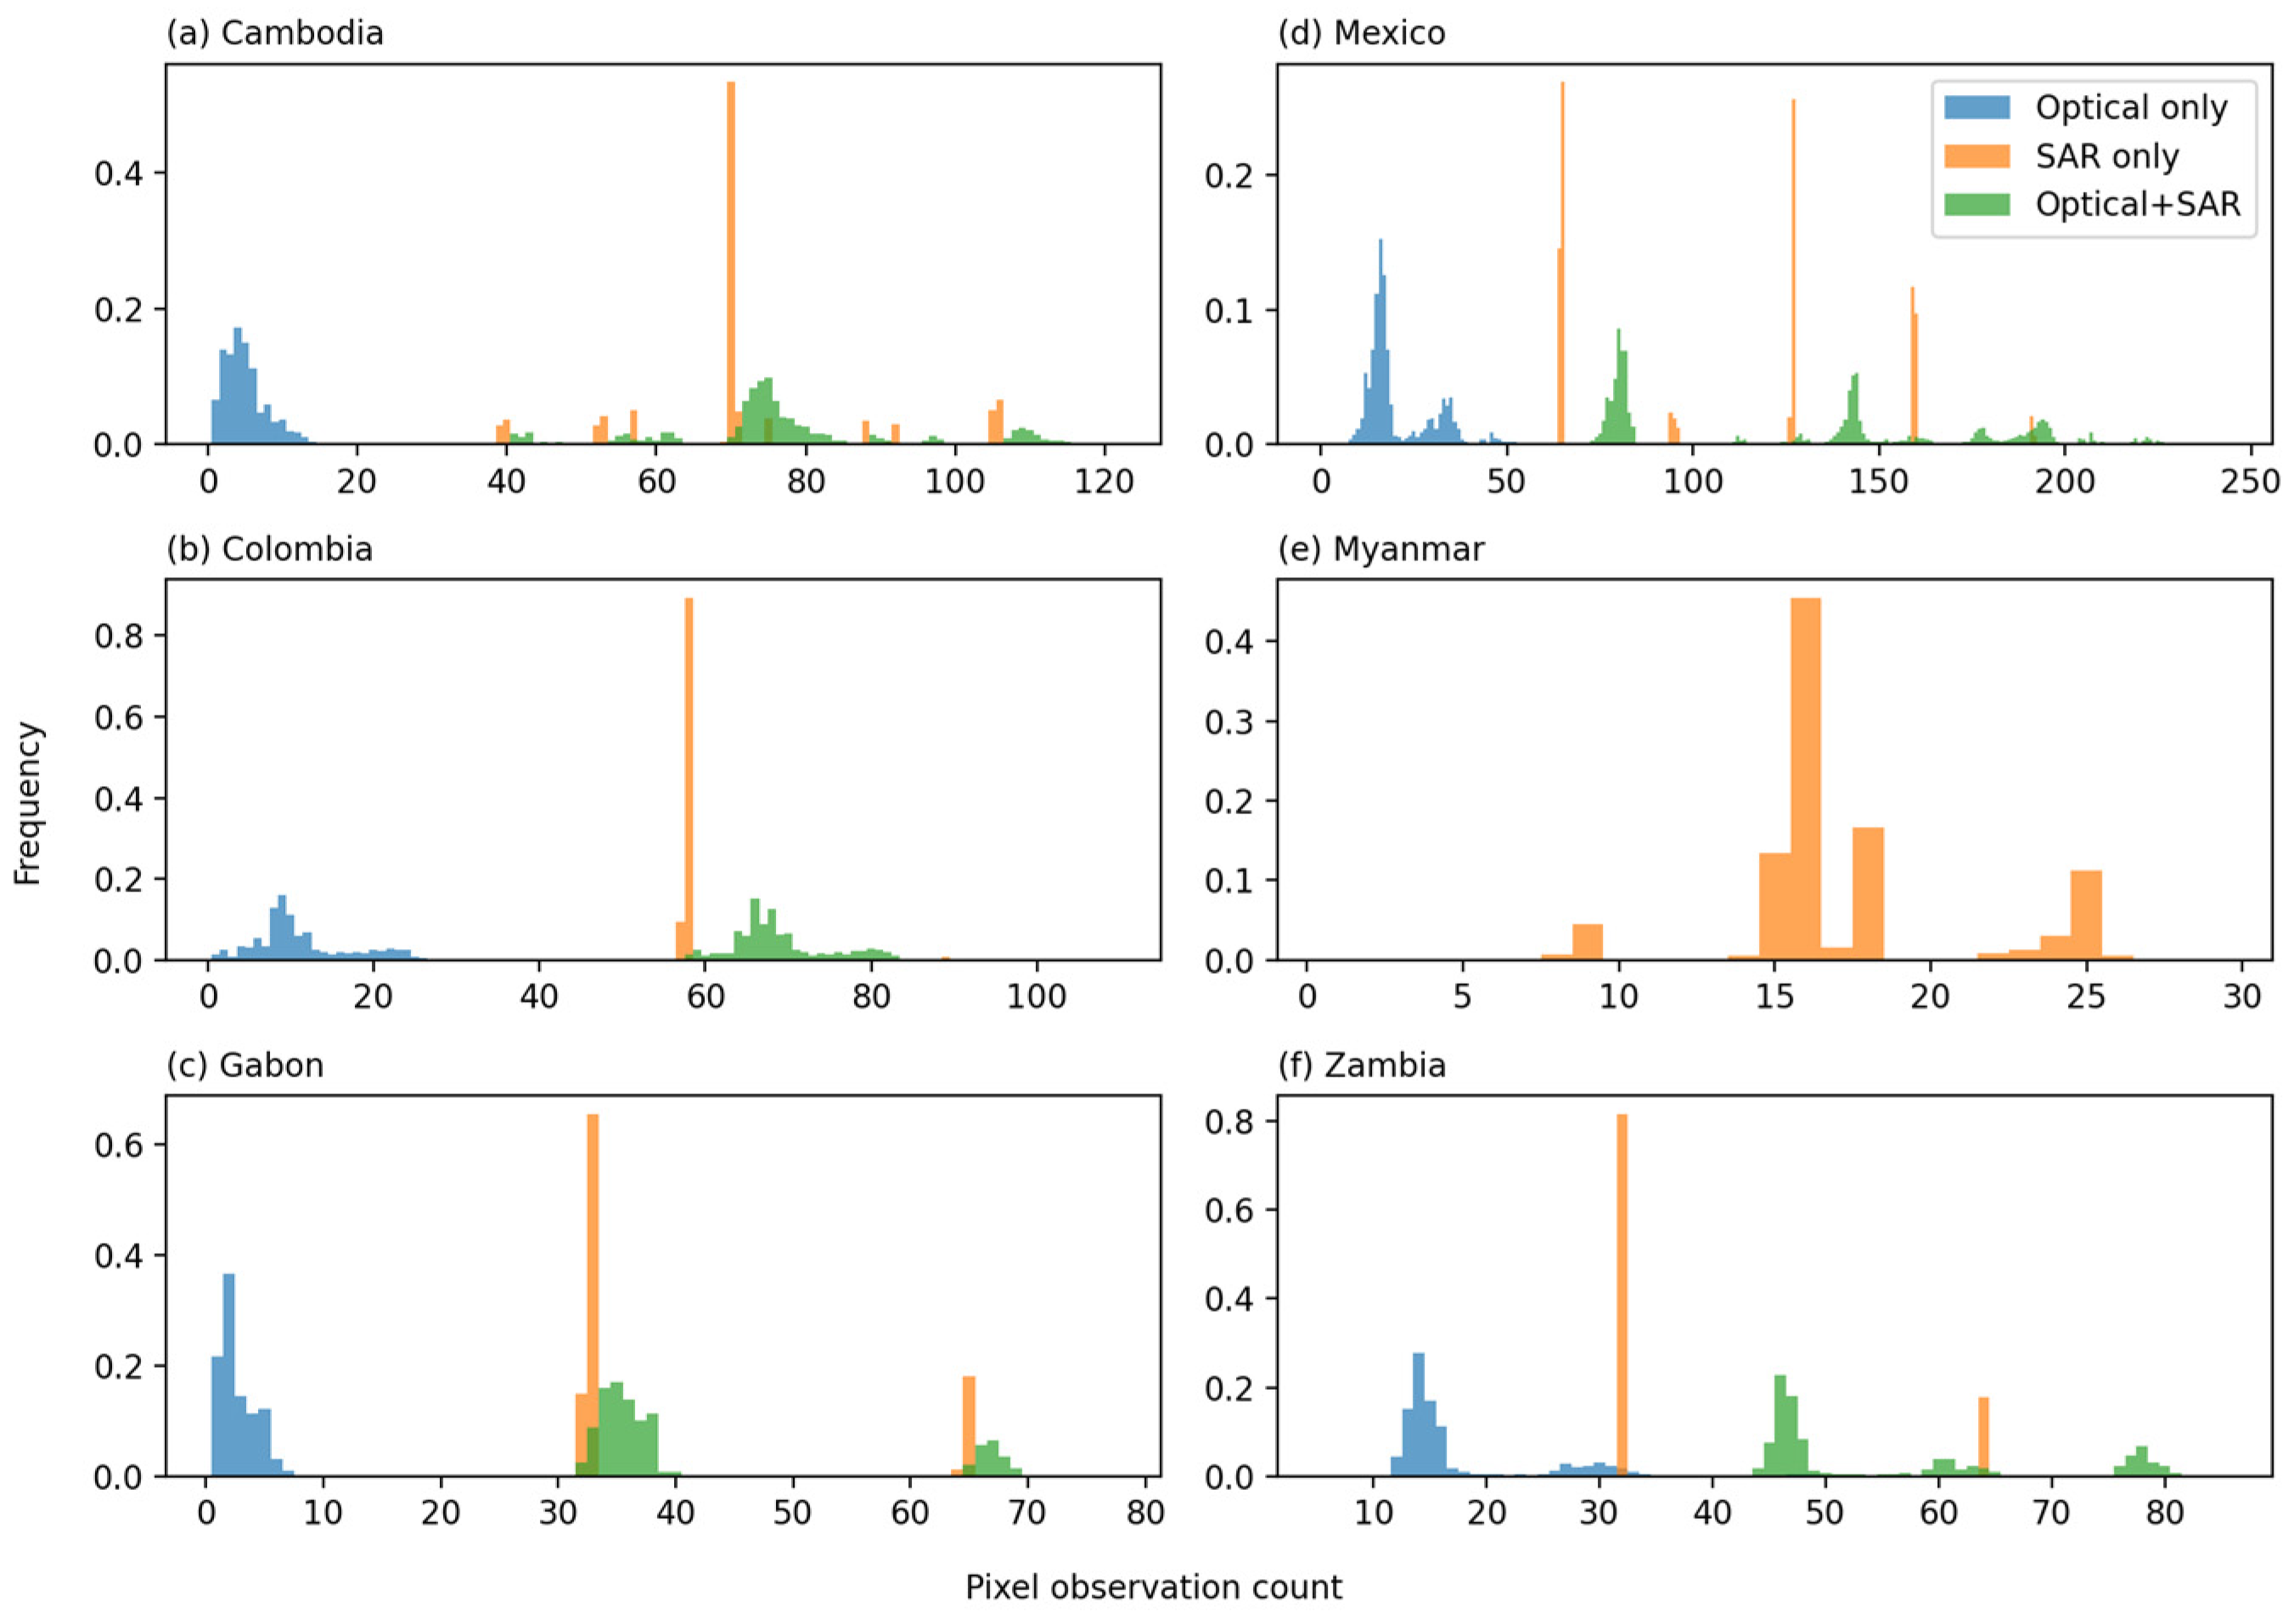
The main motivation for this work was to increase the temporal density of surface water observations in an effort to better capture the dynamics. Figure 7 illustrates the histograms of the number of valid observations for each pixel covering the different regions for the months validated for optical-only (blue), SAR-only (orange), and all valid observations (green). The figure shows that, in all cases except Myanmar, the inclusion of both optical and SAR sensors was able to increase the frequency of observations for any given pixel in the regions. In Myanmar, there were no optical observations that met the initial filter of less than 75% cloudy for use, resulting in only SAR imagery being used for the region. On average, the regions had 11.462 valid observations across the months used for validation (see Figure 5 for months for each validation region), whereas SAR data had an average of 55.354 valid observations. When using both optical and SAR data, the average number of valid observations across all regions increased to 64.899. This is, on average across all regions, a 466% increase over just using optical and a 17% increase over using SAR alone.
While our method increases the number of surface water observations, it requires regular observations from both optical and SAR sensors. The Sentinel-1 mission, which provided the critical datasets for the application of our method, especially in cloudy and tropical regions [77], has been in operation since October 2014; therefore, a dense time series of optical and SAR surface water observations can only be created from that time onwards.

3.4. Caveats and Limitations

Given the complexity of combining multiple sensors and gap-filling data, there are several caveats and limitations to our approach. First is the need for optical imagery for water observation to identify gaps that can be filled with SAR imagery. The algorithm does not work without water pixels computed from an optical image. If there are no valid water observations, then the gap filling cannot be performed. Furthermore, if there is an optical image, but there are no water pixels in the optical image, then the method can attempt to fill the gaps in the optical imagery using incorrect thresholds, as the water edges are not defined. Gap filling using SAR data only occurs where poor-quality data are identified in the optical imagery, as indicated by a quality mask. If the QA masks have errors that omit poor-quality data, then the resulting water detection could have errors and the gap-filling process will not be performed on the misclassified pixels. The gap filling uses the surface water probabilities computed from SAR data, which include a number of uncertainties and known issues (e.g., cannot detect water on the lee side of mountains, can have false positives due to sandy soils, etc.). The percentiles used to reduce the sampled probabilities can be calibrated for local regions and seasonality; however, the calibration of this value was out of the scope of this paper and may be explored in future studies. Lastly, we validated our method using monthly data. The improvement this method provides is a dense time series at a sub-weekly scale, but there is a mismatch of available data to validate weekly timescale water maps that are produced. The lack of high-temporal-frequency validation data is a gap in the community. The availability of commercial, small satellite SAR companies and tasking abilities provides an opportunity to provide high-value datasets for validating dense time series of surface water that can overcome the challenges of cloud cover. Future work will include looking at denser validation time series data.

3.5. Future Work

There are multiple opportunities and needs for future work and improvement. First, we based our statistical analysis on the ground validation samples at a monthly timescale, whereas this methodology produces surface water maps at a much higher temporal frequency. Additional work will be needed to gather appropriate high-temporal-resolution data to both improve and validate our method. This method could be modified to use additional data, such as Sentinel-2 or NISAR data, as they become available. Furthermore, additional sensors can provide daily acquisitions but coarse spatial resolution (e.g., VIIRS). These data could be investigated to determine the impacts of both spatial and time scales to understand how resolution tradeoffs in space and time play a role in computing a higher-resolution, more accurate time series. For example, including additional optical data, even at course resolutions, may add more observations to fill gaps and further increase the density of time series.
Another research area is the model choice for SAR and optical water detection, where the current model could be replaced by any other model that generates a probability of water detection. For example, implementing a deep learning approach for estimating surface water and its associated probabilities (e.g., [78]) instead of using logistic regression may improve upon accuracy with the tradeoff of model interpretability. Additionally, the inclusion of temporal filtering (e.g., [79]) can be explored to improve the temporal representation of water in time between observations and different sensors. Lastly, there are opportunities to explore the use of spatio-temporal deep learning methods (e.g., convolutional LSTM models [80]) to combine both improved water detection models and temporal evolution of water to better estimate water area with each observation.
We plan to use the results of this study as inputs into the Forecasting Inundation Extents using Rotated empirical orthogonal function analysis (FIER) framework [81,82] to evaluate the effectiveness of a more dense time series from data fusion outputs over raw satellite imagery for spatial flood prediction driven by satellite imagery.

4. Conclusions

This study presented a method for generating dense time series of surface water observations using optical–SAR sensor fusion and gap filling. The approach fills gaps in optical surface water data due to clouds, cloud shadows, and other atmospheric conditions by using SAR surface water estimates. We applied the method using data from the Copernicus Sentinel-1 and Landsat 8 satellites and validated the results using independent, hand-labeled data for six regions. The results showed that it can effectively generate high-quality surface water maps with an overall accuracy of 0.9025. Furthermore, the method is consistent between geographic regions, with accuracies ranging between 0.8656 and 0.9212. While the methodology relies on optical data, we found cloud cover was not correlated with accuracy and had no effect on the accuracy at a monthly scale. We found that incorporating both optical and SAR data increased, on average, the number of valid observations by 466% and 17% for optical and SAR, respectively, for the regions and time periods used for validation. This study demonstrates improvement on the state of the art in monitoring surface water by leveraging both optical and SAR data and creating dense time series of surface water information. Previous methods either used one sensor for mapping surface water at a high frequency or aggregated data fusion results at a lower temporal resolution. This improvement in methodology is especially useful for monitoring surface water during events that change rapidly in time, such as floods. This method has the potential to be used for a variety of applications, such as flood monitoring, drought monitoring, and water resource management. Furthermore, the data outputs from the method can be used in other frameworks for surface water prediction.

Author Contributions

Conceptualization, K.N.M., G.P.W., E.J.N. and H.L.; methodology, K.N.M.; software, K.N.M.; validation, K.N.M.; visualization, K.N.M., G.P.W., E.J.N. and H.L.; supervision: G.P.W., E.J.N., H.L., D.P.A. and R.E.G.; writing—original draft preparation, K.N.M., G.P.W., E.J.N., H.L. and D.P.A.; writing—review and editing, K.N.M., G.P.W., E.J.N., H.L., D.P.A. and R.E.G. All authors have read and agreed to the published version of the manuscript.

Funding

This research was funded by NOAA JPSS Program (Grant No. NA20NES4320003). Partial support provided under NASA Cooperative Agreement 80MSFC22M0004.

Data Availability Statement

The remote sensing data used for the analysis, Landsat 8 and Sentinel-1, are available as public data collections on the Google Earth Engine platform. The Sen1Floods11 data used to train the logistic regression models are available at https://github.com/cloudtostreet/Sen1Floods11 (accessed on 13 July 2023). The validation data from Markert et al. [52] and Tottrup et al. [51] were ingested into Earth Engine and are available in the following asset path: “projects/byu-hydroinformatics-gee/assets/kmarkert/datafusion/validation/<REGION>_all_wgs84.” The results of the processed surface water maps for each region are publicly available on Earth Engine as well and can be accessed using the following asset path: “projects/byu-hydroinformatics-gee/assets/kmarkert/datafusion/<REGION>_data_fusion” where <REGION> is the title case-capitalized name of the regions in Table 2 (e.g., Colombia).The software/scripts used in this study are publicly available under the open-source Apache 2.0 license. The source code used can be accessed at https://github.com/KMarkert/phd-data-fusion-water (accessed on 13 July 2023). Developer: K.N.M.; year first available: 2023; license: Apache 2.0; programming language: Python.

Acknowledgments

The authors would like to thank the data providers, USGS and the EU Copernicus program, for making data freely available. This analysis contains modified Copernicus Sentinel data (2019), processed by ESA. We would like to thank the Google Earth Engine team for the use of the Earth Engine platform under the non-commercial terms of service. Thanks to the anonymous reviewers for their comments that improved the quality of the manuscript.

Conflicts of Interest

K.N.M. is employed by Google; the methods presented use generally available Google technologies. The other authors declare no conflicts of interest.

References

  1. Vörösmarty, C.J.; McIntyre, P.B.; Gessner, M.O.; Dudgeon, D.; Prusevich, A.; Green, P.; Glidden, S.; Bunn, S.E.; Sullivan, C.A.; Liermann, C.R.; et al. Global Threats to Human Water Security and River Biodiversity. Nature 2010, 467, 555–561. [Google Scholar] [CrossRef]
  2. Mester, B.; Frieler, K.; Schewe, J. Human Displacements, Fatalities, and Economic Damages Linked to Remotely Observed Floods. Sci. Data 2023, 10, 482. [Google Scholar] [CrossRef] [PubMed]
  3. Jiao, W.; Wang, L.; McCabe, M.F. Multi-Sensor Remote Sensing for Drought Characterization: Current Status, Opportunities and a Roadmap for the Future. Remote Sens. Environ. 2021, 256, 112313. [Google Scholar] [CrossRef]
  4. Tellman, B.; Sullivan, J.A.; Kuhn, C.; Kettner, A.J.; Doyle, C.S.; Brakenridge, G.R.; Erickson, T.A.; Slayback, D.A. Satellite Imaging Reveals Increased Proportion of Population Exposed to Floods. Nature 2021, 596, 80–86. [Google Scholar] [CrossRef] [PubMed]
  5. Markert, K.N.; Pulla, S.T.; Lee, H.; Markert, A.M.; Anderson, E.R.; Okeowo, M.A.; Limaye, A.S. AltEx: An Open Source Web Application and Toolkit for Accessing and Exploring Altimetry Datasets. Environ. Model. Softw. 2019, 117, 164–175. [Google Scholar] [CrossRef]
  6. Du, T.L.T.; Lee, H.; Bui, D.D.; Graham, L.P.; Darby, S.D.; Pechlivanidis, I.G.; Leyland, J.; Biswas, N.K.; Choi, G.; Batelaan, O.; et al. Streamflow Prediction in Highly Regulated, Transboundary Watersheds Using Multi-Basin Modeling and Remote Sensing Imagery. Water Resour. Res. 2022, 58, e2021WR031191. [Google Scholar] [CrossRef] [PubMed]
  7. Donchyts, G.; Winsemius, H.; Baart, F.; Dahm, R.; Schellekens, J.; Gorelick, N.; Iceland, C.; Schmeier, S. High-Resolution Surface Water Dynamics in Earth’s Small and Medium-Sized Reservoirs. Sci. Rep. 2022, 12, 13776. [Google Scholar] [CrossRef] [PubMed]
  8. Donchyts, G.; Baart, F.; Winsemius, H.; Gorelick, N.; Kwadijk, J.; Van De Giesen, N. Earth’s Surface Water Change over the Past 30 Years. Nat. Clim. Chang. 2016, 6, 810–813. [Google Scholar] [CrossRef]
  9. Wang, C.; Jiang, W.; Deng, Y.; Ling, Z.; Deng, Y. Long Time Series Water Extent Analysis for SDG 6.6.1 Based on the GEE Platform: A Case Study of Dongting Lake. IEEE J. Sel. Top. Appl. Earth Obs. Remote Sens. 2022, 15, 490–503. [Google Scholar] [CrossRef]
  10. Musa, Z.N.; Popescu, I.; Mynett, A. A Review of Applications of Satellite SAR, Optical, Altimetry and DEM Data for Surface Water Modelling, Mapping and Parameter Estimation. Hydrol. Earth Syst. Sci. 2015, 19, 3755–3769. [Google Scholar] [CrossRef]
  11. Pekel, J.F.; Cottam, A.; Gorelick, N.; Belward, A.S. High-Resolution Mapping of Global Surface Water and Its Long-Term Changes. Nature 2016, 540, 418–422. [Google Scholar] [CrossRef] [PubMed]
  12. Huang, C.; Chen, Y.; Zhang, S.; Wu, J. Detecting, Extracting, and Monitoring Surface Water From Space Using Optical Sensors: A Review. Rev. Geophys. 2018, 56, 333–360. [Google Scholar] [CrossRef]
  13. Zhou, Y.; Dong, J.; Xiao, X.; Xiao, T.; Yang, Z.; Zhao, G.; Zou, Z.; Qin, Y. Open Surface Water Mapping Algorithms: A Comparison of Water-Related Spectral Indices and Sensors. Water 2017, 9, 256. [Google Scholar] [CrossRef]
  14. Jones, J.W. Efficient Wetland Surface Water Detection and Monitoring via Landsat: Comparison with in Situ Data from the Everglades Depth Estimation Network. Remote Sens. 2015, 7, 12503–12538. [Google Scholar] [CrossRef]
  15. Jones, J.W. Improved Automated Detection of Subpixel-Scale Inundation—Revised Dynamic Surface Water Extent (DSWE) Partial Surface Water Tests. Remote Sens. 2019, 11, 374. [Google Scholar] [CrossRef]
  16. Isikdogan, F.; Bovik, A.C.; Passalacqua, P. Surface Water Mapping by Deep Learning. IEEE J. Sel. Top. Appl. Earth Obs. Remote Sens. 2017, 10, 4909–4918. [Google Scholar] [CrossRef]
  17. Isikdogan, L.F.; Bovik, A.; Passalacqua, P. Seeing Through the Clouds With DeepWaterMap. IEEE Geosci. Remote Sens. Lett. 2020, 17, 1662–1666. [Google Scholar] [CrossRef]
  18. Phongsapan, K.; Chishtie, F.; Poortinga, A.; Bhandari, B.; Meechaiya, C.; Kunlamai, T.; Aung, K.S.; Saah, D.; Anderson, E.; Markert, K.; et al. Operational Flood Risk Index Mapping for Disaster Risk Reduction Using Earth Observations and Cloud Computing Technologies: A Case Study on Myanmar. Front. Environ. Sci. 2019, 7, 191. [Google Scholar] [CrossRef]
  19. Tulbure, M.G.; Broich, M.; Perin, V.; Gaines, M.; Ju, J.; Stehman, S.V.; Pavelsky, T.; Masek, J.G.; Yin, S.; Mai, J.; et al. Can We Detect More Ephemeral Floods with Higher Density Harmonized Landsat Sentinel 2 Data Compared to Landsat 8 Alone? ISPRS J. Photogramm. Remote Sens. 2022, 185, 232–246. [Google Scholar] [CrossRef]
  20. Cooley, S.W.; Smith, L.C.; Stepan, L.; Mascaro, J. Tracking Dynamic Northern Surface Water Changes with High-Frequency Planet CubeSat Imagery. Remote Sens. 2017, 9, 1306. [Google Scholar] [CrossRef]
  21. Mishra, V.; Limaye, A.S.; Muench, R.E.; Cherrington, E.A.; Markert, K.N. Evaluating the Performance of High-Resolution Satellite Imagery in Detecting Ephemeral Water Bodies over West Africa. Int. J. Appl. Earth Obs. Geoinf. 2020, 93, 102218. [Google Scholar] [CrossRef]
  22. Oddo, P.C.; Bolten, J.D. The Value of Near Real-Time Earth Observations for Improved Flood Disaster Response. Front. Environ. Sci. 2019, 7, 127. [Google Scholar] [CrossRef]
  23. Uddin, K.; Matin, M.A.; Meyer, F.J. Operational Flood Mapping Using Multi-Temporal Sentinel-1 SAR Images: A Case Study from Bangladesh. Remote Sens. 2019, 11, 1581. [Google Scholar] [CrossRef]
  24. Torres, R.; Snoeij, P.; Geudtner, D.; Bibby, D.; Davidson, M.; Attema, E.; Potin, P.; Rommen, B.; Floury, N.; Brown, M.; et al. GMES Sentinel-1 Mission. Remote Sens. Environ. 2012, 120, 9–24. [Google Scholar] [CrossRef]
  25. Flores-Anderson, A.I.; Herndon, K.E.; Thapa, R.B.; Cherrington, E. The SAR Handbook: Comprehensive Methodologies for Forest Monitoring and Biomass Estimation; Marshall Space Flight Center: Huntsville, AL, USA, 2019. [Google Scholar]
  26. Westerhoff, R.S.; Kleuskens, M.P.H.; Winsemius, H.C.; Huizinga, H.J.; Brakenridge, G.R.; Bishop, C. Automated Global Water Mapping Based on Wide-Swath Orbital Synthetic-Aperture Radar. Hydrol. Earth Syst. Sci. 2013, 17, 651–663. [Google Scholar] [CrossRef]
  27. Chini, M.; Hostache, R.; Giustarini, L.; Matgen, P. A Hierarchical Split-Based Approach for Parametric Thresholding of SAR Images: Flood Inundation as a Test Case. IEEE Trans. Geosci. Remote Sens. 2017, 55, 6975–6988. [Google Scholar] [CrossRef]
  28. Clement, M.A.; Kilsby, C.G.; Moore, P. Multi-Temporal Synthetic Aperture Radar Flood Mapping Using Change Detection. J. Flood Risk Manag. 2018, 11, 152–168. [Google Scholar] [CrossRef]
  29. Amitrano, D.; Di Martino, G.; Iodice, A.; Riccio, D.; Ruello, G. Unsupervised Rapid Flood Mapping Using Sentinel-1 GRD SAR Images. IEEE Trans. Geosci. Remote Sens. 2018, 56, 3290–3299. [Google Scholar] [CrossRef]
  30. Nemni, E.; Bullock, J.; Belabbes, S.; Bromley, L. Fully Convolutional Neural Network for Rapid Flood Segmentation in Synthetic Aperture Radar Imagery. Remote Sens. 2020, 12, 2532. [Google Scholar] [CrossRef]
  31. Yan, K.; Di Baldassarre, G.; Solomatine, D.P.; Schumann, G.J.P. A Review of Low-Cost Space-Borne Data for Flood Modelling: Topography, Flood Extent and Water Level. Hydrol. Process. 2015, 29, 3368–3387. [Google Scholar] [CrossRef]
  32. Landuyt, L.; Van Wesemael, A.; Schumann, G.J.-P.; Hostache, R.; Verhoest, N.E.C.; Van Coillie, F.M.B. Flood Mapping Based on Synthetic Aperture Radar: An Assessment of Established Approaches. IEEE Trans. Geosci. Remote Sens. 2019, 57, 722–739. [Google Scholar] [CrossRef]
  33. Martinis, S.; Plank, S.; Ćwik, K. The Use of Sentinel-1 Time-Series Data to Improve Flood Monitoring in Arid Areas. Remote Sens. 2018, 10, 583. [Google Scholar] [CrossRef]
  34. Huang, W.; DeVries, B.; Huang, C.; Lang, M.W.; Jones, J.W.; Creed, I.F.; Carroll, M.L. Automated Extraction of Surface Water Extent from Sentinel-1 Data. Remote Sens. 2018, 10, 797. [Google Scholar] [CrossRef]
  35. Liu, W.; Gopal, S.; Woodcock, C.E. Uncertainty and Confidence in Land Cover Classification Using a Hybrid Classifier Approach. Photogramm. Eng. Remote Sens. 2004, 70, 963–971. [Google Scholar] [CrossRef]
  36. Liu, Z.; Blasch, E.; Bhatnagar, G.; John, V.; Wu, W.; Blum, R.S. Fusing Synergistic Information from Multi-Sensor Images: An Overview from Implementation to Performance Assessment. Inf. Fusion 2018, 42, 127–145. [Google Scholar] [CrossRef]
  37. Irwin, K.; Beaulne, D.; Braun, A.; Fotopoulos, G. Fusion of SAR, Optical Imagery and Airborne LiDAR for Surface Water Detection. Remote Sens. 2017, 9, 890. [Google Scholar] [CrossRef]
  38. Montgomery, J.; Brisco, B.; Chasmer, L.; Devito, K.; Cobbaert, D.; Hopkinson, C. SAR and Lidar Temporal Data Fusion Approaches to Boreal Wetland Ecosystem Monitoring. Remote Sens. 2019, 11, 161. [Google Scholar] [CrossRef]
  39. Castanedo, F. A Review of Data Fusion Techniques. Sci. World J. 2013, 2013, e704504. [Google Scholar] [CrossRef] [PubMed]
  40. Tian, H.; Li, W.; Wu, M.; Huang, N.; Li, G.; Li, X.; Niu, Z. Dynamic Monitoring of the Largest Freshwater Lake in China Using a New Water Index Derived from High Spatiotemporal Resolution Sentinel-1A Data. Remote Sens. 2017, 9, 521. [Google Scholar] [CrossRef]
  41. Wang, J.; Ding, J.; Li, G.; Liang, J.; Yu, D.; Aishan, T.; Zhang, F.; Yang, J.; Abulimiti, A.; Liu, J. Dynamic Detection of Water Surface Area of Ebinur Lake Using Multi-Source Satellite Data (Landsat and Sentinel-1A) and Its Responses to Changing Environment. Catena 2019, 177, 189–201. [Google Scholar] [CrossRef]
  42. Markert, K.N.; Chishtie, F.; Anderson, E.R.; Saah, D.; Griffin, R.E. On the Merging of Optical and SAR Satellite Imagery for Surface Water Mapping Applications. Results Phys. 2018, 9, 275–277. [Google Scholar] [CrossRef]
  43. Druce, D.; Tong, X.; Lei, X.; Guo, T.; Kittel, C.M.M.; Grogan, K.; Tottrup, C. An Optical and SAR Based Fusion Approach for Mapping Surface Water Dynamics over Mainland China. Remote Sens. 2021, 13, 1663. [Google Scholar] [CrossRef]
  44. Li, J.; Li, L.; Song, Y.; Chen, J.; Wang, Z.; Bao, Y.; Zhang, W.; Meng, L. A Robust Large-Scale Surface Water Mapping Framework with High Spatiotemporal Resolution Based on the Fusion of Multi-Source Remote Sensing Data. Int. J. Appl. Earth Obs. Geoinf. 2023, 118, 103288. [Google Scholar] [CrossRef]
  45. Bioresita, F.; Puissant, A.; Stumpf, A.; Malet, J.-P. Fusion of Sentinel-1 and Sentinel-2 Image Time Series for Permanent and Temporary Surface Water Mapping. Int. J. Remote Sens. 2019, 40, 9026–9049. [Google Scholar] [CrossRef]
  46. Munasinghe, D.; de Moraes Frasson, R.P.; David, C.H.; Bonnema, M.; Schumann, G.; Brakenridge, G.R. A Multi-Sensor Approach for Increased Measurements of Floods and Their Societal Impacts from Space. Commun. Earth Environ. 2023, 4, 462. [Google Scholar] [CrossRef]
  47. Zhao, G.; Gao, H. Automatic Correction of Contaminated Images for Assessment of Reservoir Surface Area Dynamics. Geophys. Res. Lett. 2018, 45, 6092–6099. [Google Scholar] [CrossRef] [PubMed]
  48. Bai, B.; Tan, Y.; Donchyts, G.; Haag, A.; Xu, B.; Chen, G.; Weerts, A.H. Naive Bayes Classification-Based Surface Water Gap-Filling from Partially Contaminated Optical Remote Sensing Image. J. Hydrol. 2023, 616, 128791. [Google Scholar] [CrossRef]
  49. Gorelick, N.; Hancher, M.; Dixon, M.; Ilyushchenko, S.; Thau, D.; Moore, R. Google Earth Engine: Planetary-Scale Geospatial Analysis for Everyone. Remote Sens. Environ. 2017, 202, 18–27. [Google Scholar] [CrossRef]
  50. Chander, G.; Markham, B.L.; Helder, D.L. Summary of Current Radiometric Calibration Coefficients for Landsat MSS, TM, ETM+, and EO-1 ALI Sensors. Remote Sens. Environ. 2009, 113, 893–903. [Google Scholar] [CrossRef]
  51. Vermote, E.F.; El Saleous, N.; Justice, C.O.; Kaufman, Y.J.; Privette, J.L.; Remer, L.; Roger, J.C.; Tanré, D. Atmospheric Correction of Visible to Middle-Infrared EOS-MODIS Data over Land Surfaces: Background, Operational Algorithm and Validation. J. Geophys. Res. Atmos. 1997, 102, 17131–17141. [Google Scholar] [CrossRef]
  52. Vermote, E.F.; El Saleous, N.Z.; Justice, C.O. Atmospheric Correction of MODIS Data in the Visible to Middle Infrared: First Results. Remote Sens. Environ. 2002, 83, 97–111. [Google Scholar] [CrossRef]
  53. Vermote, E.; Justice, C.; Claverie, M.; Franch, B. Preliminary Analysis of the Performance of the Landsat 8/OLI Land Surface Reflectance Product. Remote Sens. Environ. 2016, 185, 46–56. [Google Scholar] [CrossRef] [PubMed]
  54. Bonafilia, D.; Tellman, B.; Anderson, T.; Issenberg, E. Sen1Floods11: A Georeferenced Dataset to Train and Test Deep Learning Flood Algorithms for Sentinel-1. In Proceedings of the 2020 IEEE/CVF Conference on Computer Vision and Pattern Recognition Workshops (CVPRW), Seattle, WA, USA, 14–19 June 2020; pp. 210–211. [Google Scholar]
  55. Tottrup, C.; Druce, D.; Meyer, R.P.; Christensen, M.; Riffler, M.; Dulleck, B.; Rastner, P.; Jupova, K.; Sokoup, T.; Haag, A.; et al. Surface Water Dynamics from Space: A Round Robin Intercomparison of Using Optical and SAR High-Resolution Satellite Observations for Regional Surface Water Detection. Remote Sens. 2022, 14, 2410. [Google Scholar] [CrossRef]
  56. Markert, K.N.; Markert, A.M.; Mayer, T.; Nauman, C.; Haag, A.; Poortinga, A.; Bhandari, B.; Thwal, N.S.; Kunlamai, T.; Chishtie, F.; et al. Comparing Sentinel-1 Surface Water Mapping Algorithms and Radiometric Terrain Correction Processing in Southeast Asia Utilizing Google Earth Engine. Remote Sens. 2020, 12, 2469. [Google Scholar] [CrossRef]
  57. Xu, H. Modification of Normalised Difference Water Index (NDWI) to Enhance Open Water Features in Remotely Sensed Imagery. Int. J. Remote Sens. 2006, 27, 3025–3033. [Google Scholar] [CrossRef]
  58. Mishra, V.N.; Prasad, R.; Kumar, P.; Gupta, D.K.; Srivastava, P.K. Dual-Polarimetric C-Band SAR Data for Land Use/Land Cover Classification by Incorporating Textural Information. Environ. Earth Sci. 2016, 76, 26. [Google Scholar] [CrossRef]
  59. Ngo, K.D.; Lechner, A.M.; Vu, T.T. Land Cover Mapping of the Mekong Delta to Support Natural Resource Management with Multi-Temporal Sentinel-1A Synthetic Aperture Radar Imagery. Remote Sens. Appl. Soc. Environ. 2020, 17, 100272. [Google Scholar] [CrossRef]
  60. Nicolau, A.P.; Flores-Anderson, A.; Griffin, R.; Herndon, K.; Meyer, F.J. Assessing SAR C-Band Data to Effectively Distinguish Modified Land Uses in a Heavily Disturbed Amazon Forest. Int. J. Appl. Earth Obs. Geoinf. 2021, 94, 102214. [Google Scholar] [CrossRef]
  61. Tang, H.; Lu, S.; Ali Baig, M.H.; Li, M.; Fang, C.; Wang, Y. Large-Scale Surface Water Mapping Based on Landsat and Sentinel-1 Images. Water 2022, 14, 1454. [Google Scholar] [CrossRef]
  62. Worden, J.; de Beurs, K.M.; Koch, J.; Owsley, B.C. Application of Spectral Index-Based Logistic Regression to Detect Inland Water in the South Caucasus. Remote Sens. 2021, 13, 5099. [Google Scholar] [CrossRef]
  63. Kohavi, R. A Study of Cross-Validation and Bootstrap for Accuracy Estimation and Model Selection. In Proceedings of the 14th International Joint Conference on Artificial Intelligence, Montreal, QC, Canada, 20–25 August 1995; Morgan Kaufmann Publishers Inc.: San Francisco, CA, USA, 1995; Volume 2, pp. 1137–1143. [Google Scholar]
  64. Mullissa, A.; Vollrath, A.; Odongo-Braun, C.; Slagter, B.; Balling, J.; Gou, Y.; Gorelick, N.; Reiche, J. Sentinel-1 SAR Backscatter Analysis Ready Data Preparation in Google Earth Engine. Remote Sens. 2021, 13, 1954. [Google Scholar] [CrossRef]
  65. Vollrath, A.; Mullissa, A.; Reiche, J. Angular-Based Radiometric Slope Correction for Sentinel-1 on Google Earth Engine. Remote Sens. 2020, 12, 1867. [Google Scholar] [CrossRef]
  66. Zhu, Z.; Wang, S.; Woodcock, C.E. Improvement and Expansion of the Fmask Algorithm: Cloud, Cloud Shadow, and Snow Detection for Landsats 4–7, 8, and Sentinel 2 Images. Remote Sens. Environ. 2015, 159, 269–277. [Google Scholar] [CrossRef]
  67. Foga, S.; Scaramuzza, P.L.; Guo, S.; Zhu, Z.; Dilley, R.D.; Beckmann, T.; Schmidt, G.L.; Dwyer, J.L.; Joseph Hughes, M.; Laue, B. Cloud Detection Algorithm Comparison and Validation for Operational Landsat Data Products. Remote Sens. Environ. 2017, 194, 379–390. [Google Scholar] [CrossRef]
  68. Donchyts, G.; Schellekens, J.; Winsemius, H.; Eisemann, E.; Van de Giesen, N. A 30 m Resolution Surface Water Mask Including Estimation of Positional and Thematic Differences Using Landsat 8, SRTM and OpenStreetMap: A Case Study in the Murray-Darling Basin, Australia. Remote Sens. 2016, 8, 386. [Google Scholar] [CrossRef]
  69. Twele, A.; Cao, W.; Plank, S.; Martinis, S. Sentinel-1-Based Flood Mapping: A Fully Automated Processing Chain. Int. J. Remote Sens. 2016, 37, 2990–3004. [Google Scholar] [CrossRef]
  70. Schlaffer, S.; Chini, M.; Dorigo, W.; Plank, S. Monitoring Surface Water Dynamics in the Prairie Pothole Region of North Dakota Using Dual-Polarised Sentinel-1 Synthetic Aperture Radar (SAR) Time Series. Hydrol. Earth Syst. Sci. 2022, 26, 841–860. [Google Scholar] [CrossRef]
  71. Schaefer, J.T. The Critical Success Index as an Indicator of Warning Skill. Weather Forecast. 1990, 5, 570–575. [Google Scholar] [CrossRef]
  72. Wing, O.E.J.; Bates, P.D.; Sampson, C.C.; Smith, A.M.; Johnson, K.A.; Erickson, T.A. Validation of a 30 m Resolution Flood Hazard Model of the Conterminous United States. Water Resour. Res. 2017, 53, 7968–7986. [Google Scholar] [CrossRef]
  73. Konapala, G.; Kumar, S.V.; Khalique Ahmad, S. Exploring Sentinel-1 and Sentinel-2 Diversity for Flood Inundation Mapping Using Deep Learning. ISPRS J. Photogramm. Remote Sens. 2021, 180, 163–173. [Google Scholar] [CrossRef]
  74. Bernhofen, M.V.; Whyman, C.; Trigg, M.A.; Sleigh, P.A.; Smith, A.M.; Sampson, C.C.; Yamazaki, D.; Ward, P.J.; Rudari, R.; Pappenberger, F.; et al. A First Collective Validation of Global Fluvial Flood Models for Major Floods in Nigeria and Mozambique. Environ. Res. Lett. 2018, 13, 104007. [Google Scholar] [CrossRef]
  75. Park, E.; Loc Ho, H.; Van Binh, D.; Kantoush, S.; Poh, D.; Alcantara, E.; Try, S.; Lin, Y.N. Impacts of Agricultural Expansion on Floodplain Water and Sediment Budgets in the Mekong River. J. Hydrol. 2022, 605, 127296. [Google Scholar] [CrossRef]
  76. Lee, H.; Yuan, T.; Yu, H.; Jung, H.C. Interferometric SAR for Wetland Hydrology: An Overview of Methods, Challenges, and Trends. IEEE Geosci. Remote Sens. Mag. 2020, 8, 120–135. [Google Scholar] [CrossRef]
  77. Flores-Anderson, A.I.; Cardille, J.; Azad, K.; Cherrington, E.; Zhang, Y.; Wilson, S. Spatial and Temporal Availability of Cloud-Free Optical Observations in the Tropics to Monitor Deforestation. Sci. Data 2023, 10, 550. [Google Scholar] [CrossRef] [PubMed]
  78. Mayer, T.; Poortinga, A.; Bhandari, B.; Nicolau, A.P.; Markert, K.; Thwal, N.S.; Markert, A.; Haag, A.; Kilbride, J.; Chishtie, F.; et al. Deep Learning Approach for Sentinel-1 Surface Water Mapping Leveraging Google Earth Engine. ISPRS Open J. Photogramm. Remote Sens. 2021, 2, 100005. [Google Scholar] [CrossRef]
  79. Wang, Z.; Xie, F.; Ling, F.; Du, Y. Monitoring Surface Water Inundation of Poyang Lake and Dongting Lake in China Using Sentinel-1 SAR Images. Remote Sens. 2022, 14, 3473. [Google Scholar] [CrossRef]
  80. Ulloa, N.I.; Yun, S.-H.; Chiang, S.-H.; Furuta, R. Sentinel-1 Spatiotemporal Simulation Using Convolutional LSTM for Flood Mapping. Remote Sens. 2022, 14, 246. [Google Scholar] [CrossRef]
  81. Chang, C.H.; Lee, H.; Kim, D.; Hwang, E.; Hossain, F.; Chishtie, F.; Jayasinghe, S.; Basnayake, S. Hindcast and Forecast of Daily Inundation Extents Using Satellite SAR and Altimetry Data with Rotated Empirical Orthogonal Function Analysis: Case Study in Tonle Sap Lake Floodplain. Remote Sens. Environ. 2020, 241, 111732. [Google Scholar] [CrossRef]
  82. Chang, C.-H.; Lee, H.; Do, S.K.; Du, T.L.T.; Markert, K.; Hossain, F.; Ahmad, S.K.; Piman, T.; Meechaiya, C.; Bui, D.D.; et al. Operational Forecasting Inundation Extents Using REOF Analysis (FIER) over Lower Mekong and Its Potential Economic Impact on Agriculture. Environ. Model. Softw. 2023, 162, 105643. [Google Scholar] [CrossRef]
Figure 1. Workflow overview for our method, which shows optical processing in green with SAR processing in blue. The data processing steps, which include both optical and SAR data, are in light gray.
Remotesensing 16 01262 g001
Figure 2. Study area map displaying the regions used to validate the methods for this study. The inset locations are shown on the global map with numbers corresponding to specific insets. The surface water occurrence derived from the JRC Global Surface Water Mapping Layers is shown to illustrate the permanent and seasonal water extents for each region.
Remotesensing 16 01262 g002
Figure 3. Results from the water mapping and gap filling for SAR (top row) and optical (bottom row) for an area in the Cambodia region. The left column shows the raw observation, the middle column shows the water probability from the respective logistic regression results, and the right column shows the final water map, where gaps in the optical data were filled using information from the SAR images.
Remotesensing 16 01262 g003
Figure 4. Same as Figure 2 but for the Gabon region, illustrating a more extreme case of gap filling, where more of the optical image was cloud occluded, relying more heavily on SAR data to fill the gaps.
Remotesensing 16 01262 g004
Figure 5. Confusion matrix for all the samples normalized by true values.
Remotesensing 16 01262 g005
Figure 6. Accuracy of water mapping results for all sites for months with available data in 2019 and monthly average cloud cover (black line). Months with no reported accuracy are time periods with no available validation data.
Remotesensing 16 01262 g006
Figure 7. Histograms of the number of valid observations for each pixel at 30 m resolution covering the different regions. Optical-only observations are blue, SAR-only observations are orange, and all observations are green.
Remotesensing 16 01262 g007
Table 1. Variables used as features for the surface water prediction models with the associated sensor type and description.
Sensor TypeVariable NameDescription
OpticalBlueBlue band
OpticalGreenGreen band
OpticalRedRed band
OpticalNIRNear-infrared band
OpticalSWIR1Short-wave infrared 1 band
OpticalSWIR2Short-wave infrared 2 band
OpticalMNDWICalculated MNDWI
(Green − SWIR1)/(Green + SWIR1)
SARVVVertical transmit vertical receive polarization
SARVHVertical transmit horizontal receive polarization
SARVV/VHCalculated ratio of VV/VH
SARVVmeanCalculated mean value of VV polarization for 9 × 9 window
SARVVstdCalculated standard deviation value of VV polarization for 9 × 9 window
SARVHmeanCalculated mean value of VH polarization for 9 × 9 window
SARVHstdCalculated standard deviation value of VH polarization for 9 × 9 window
Table 2. Accuracy metrics calculated for every validation region.
RegionAccuracyFARPODCSIn Records
Colombia0.88430.00340.43530.63691470
Gabon0.88130.00200.82610.85011500
Mexico0.91200.00000.79560.83031500
Zambia0.86560.03220.58150.68221600
Cambodia0.91100.03490.76120.77901012
Myanmar0.92650.01400.74300.784341892
Disclaimer/Publisher’s Note: The statements, opinions and data contained in all publications are solely those of the individual author(s) and contributor(s) and not of MDPI and/or the editor(s). MDPI and/or the editor(s) disclaim responsibility for any injury to people or property resulting from any ideas, methods, instructions or products referred to in the content.