Abstract
Rainfall and reservoir water level are commonly regarded as the two major influencing factors for reservoir landslides and are employed for landslide displacement prediction, yet their daily data are readily available with current monitoring technology, which makes a more refined analysis possible. However, until now, few efforts have been made to predict landslide displacements using daily data, which is likely to substantially improve accuracy and is crucial for landslide early warning. A novel feature enhancement approach for extracting critical characteristics from daily rainfall and reservoir water level data for use in landslide displacement prediction is proposed in this study. Six models, including gated recurrent units (GRUs), long short-term memory (LSTM), and support vector regression (SVR) with an unenhanced dataset and GRU-E, LSTM-E, and SVR-E with an enhanced dataset, were employed for displacement predictions at four GPS monitoring stations on the Baijiabao landslide, a typical step-like reservoir landslide. The results show that the accuracy values of all the enhanced models were significantly improved, and the GRU-E model achieved the most significant improvement, with the RMSE decreasing by 24.39% and R2 increasing by 0.2693, followed by the LSTM-E and SVR-E models. Further, the GRU-E model consistently outperformed the other models, achieving the highest R2 of 0.6265 and the lowest RMSE of 16.5208 mm, significantly superior than the others. This study indicates the feasibility of improving the accuracy of landslide monthly displacement predictions with finer monitoring data and provides valuable insights for future research.
1. Introduction
Landslides are a complex and dynamic geological phenomenon that can occur in various geological settings, resulting in the loss of human lives, damage to infrastructure, and the disruption of the natural environment [1,2,3,4,5]. More than 4200 potential landslides within the Three Gorges Reservoir Area (TGRA), located 600 km along the Yangtze River behind the Three Gorges Dam, could occur due to seasonal rainfall and periodic fluctuations in reservoir water levels (RWLs). An unfortunate example is the Qianjiangping landslide, with a volume of , which reactivated in 2003 when the RWL reached 135 m, causing 30-m-high waves of water that overturned many boats, killing 24 people and destroying 346 houses [1,6]. Due to the demand for flood control and power generation, the RWL has been cycling annually between the flood limiting level (145 m) and the normal pool level (175 m) since its operation [7], which, combined with seasonal rainfall, has caused many landslides with step-like deformation characteristics in its nearest upstream, the Zigui Basin [8,9]. To reduce the losses of life and property caused by landslides, the National Field Observation and Research Station of Landslides in the Three Gorges Reservoir Area of the Yangtze River has established a professional monitoring network, providing a large amount of landslide field monitoring data [10]. This makes it possible to provide early warnings through landslide displacement prediction and provide a basis for risk management decision making [11].
Rapid advancements in landslide monitoring technology have provided diverse data [12], enabling data-driven approaches for landslide displacement prediction. Machine learning and deep learning models such as artificial neural networks (ANNs), extreme learning machines (ELMs), support vector regression (SVR), long short-term memory (LSTM), and gated recurrent units (GRUs) have gained popularity due to their powerful nonlinearity, automatic feature extraction, and flexibility [13,14,15,16,17,18,19,20]. Historical deformation is considered an internal influencing factor for reservoir landslides, and rainfall and RWLs are considered external factors. To date, historical landslide factors, including cumulative or monthly displacement, monthly cumulative rainfall, monthly average RWL, and the statistical parameters based on them, are widely used as input features for landslide displacement prediction models [21,22,23]. However, previous research has indicated a significant correlation between the displacement of reservoir landslides and abrupt changes in daily reservoir water and rainfall levels [10,24,25,26], while most of these factors are derived from monthly monitoring data and cannot fully describe the variability of influencing factors. Specifically, it is difficult to accurately describe the variation in influencing factors, and crucial information is omitted, despite the use of monthly cumulative rainfall and monthly average reservoir level data. For example, the RWL fluctuation observed in the TGR area reached 14.47 m in November 2008; however, the monthly average RWL cannot describe this tremendous change. Similarly, the cumulative monthly rainfall cannot fully describe the rainfall ratio of each level and the number of consecutive rainfall days within one month. Moreover, with the current increase in automated monitoring technologies, monitoring data on finer time scales is becoming easier to acquire, making it possible to address these issues. Thus, characterizing the key influencing factors, rainfall and RWL, based on finer time scales is urgently required to improve the precision of landslide displacement prediction models.
The main aim of this study is to propose a novel feature enhancement approach for landslide displacement prediction based on multilayer recurrent neural network (RNN) models, including LSTM and GRU cells, to address the limitations posed by conventional input features derived from monthly monitoring data. This study introduces an innovative methodology for constructing datasets for landslide displacement prediction from daily rainfall and RWL data, enabling more accurate characterizations of the variability of influencing factors and potentially improving prediction accuracy. In addition to these dataset construction approaches, this study also proposes a multilayer RNN framework with core LSTM or GRU cells for landslide displacement prediction, presents hyperparameter and model evaluation schemes for optimization and performance assessment, and conducts a case study on the Baijiabao landslide, a typical landslide in the TGR area, to validate the effectiveness of the proposed feature enhancement approach. Furthermore, the study discusses two critical issues related to the best-performing and recommended model, namely sequence length selection and optimal hyperparameter combinations.
2. Methodology
Figure 1 shows a schematic of the workflow of the proposed feature-enhanced RNN model for landslide displacement prediction, which contains four main steps: landslide monitoring data collection, preprocessing, dataset construction, model solving, and evaluation.
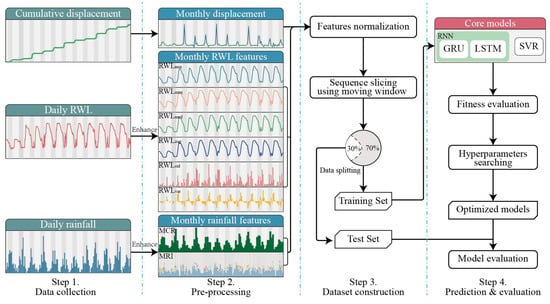
Figure 1.
Workflow of the proposed approach.
2.1. Landslide Monitoring Data Collection
Landslide monitoring plays a crucial role in landslide displacement prediction by providing long-term monitoring data on slope movement, ground stability, and environmental conditions that affect landslide behavior. For reservoir landslides, standard monitoring methods include surface displacement monitoring using a global positioning system (GPS), total stations, crack meters, 3D laser scanners and unmanned aerial vehicles (UAVs); deep displacement monitoring using inclinometers and optical fibers; and the external environment monitoring of rainfall and RWLs by weather stations. The aim of this study was to develop a predictive model for reservoir landslides by integrating long-term GPS surface displacement measurements with data on rainfall and RWLs, which are critical influencing factors. Daily data on RWL and rainfall amounts were deemed necessary to enhance the model’s accuracy. It should be emphasized that including environmental variables, such as daily RWLs and rainfall amounts, is crucial in developing a reliable and accurate model for predicting potential landslide events. By incorporating these variables, the developed model can better account for the dynamic changes in the reservoir environment and improve its ability to forecast the occurrence of future landslides. Thus, the advanced collection of monthly displacement (MDP), daily rainfall, and RWL data was essential.
2.2. Data Preprocessing and Dataset Construction
2.2.1. Feature Enhancement
Previous studies have predominantly utilized monthly cumulative rainfall and average RWL as input variables for reservoir landslide displacement prediction [27,28,29]. However, these metrics may fail to capture the significant temporal variations in rainfall distribution and RWL fluctuations that can occur within a single month. For instance, the Three Gorges Reservoir Area (TGRA) experiences considerable water level fluctuations, such as the 14.47 m fluctuation observed in November 2008. Rainfall patterns also vary significantly in the region. For instance, between May 2015 and July 2016, the total rainfall was approximately 200 mm.
Nevertheless, the rainfall distribution differed, with over 10 days of rainfall in May 2015 and 17 days in July 2016. Thus, collecting daily data is essential for accurately predicting landslide displacement and understanding the dynamic changes in the reservoir environment, which is crucial for risk management and engineering geology. To address this limitation, we propose a novel attribute enhancement method that incorporates daily RWL and rainfall data. This approach is expected to improve the accuracy and reliability of the landslide displacement prediction model by providing a more comprehensive understanding of the dynamic changes in the reservoir environment.
To enhance the RWL attribute, the mean (RWLavg), median (RWLmed), maximum (RWLmax), minimum (RWLmin), variation (RWLvar), and standard deviation (RWLstd) of daily RWL within each natural month were calculated. The first four metrics, RWLavg, RWLmax, RWLmin, and RWLmed, provide insight into the absolute values of the monthly RWLs. At the same time, RWLvar and RWLstd accurately describe RWL fluctuations within a particular month. For instance, the RWLstd of a given month is calculated as follows:
where is the RWL on day of the month, is the average RWL of the month, and is the number of days in the month.
Based on the standards released by the China Meteorological Administration, the daily rainfall intensity (DRI) can be obtained by classifying the daily rainfall into one of seven levels: no rain (<0.1 mm/d), light rain (<10 mm/d), moderate rain (<25 mm/d), heavy rain (<50 mm/d), torrential rain (<100 mm/d), downpour (<250 mm/d), and heavy downpour (≥250 mm/d) [30]. Then, the percentage of rainfall occurrence for each level in a month can be calculated by counting the number of days that each level occurs and dividing it by the total number of days in the month. Finally, traditional monthly cumulative rainfall (MCR) with enhanced monthly rainfall features, MRIno, MRIlgt, MRImod, MRIhvy, MRItrt, MRIdp, and MRIhvydp, can be prepared as the input series for modeling. The MCR and MRI of each level were acquired as follows:
where is the cumulative rainfall on day of the month, is the number of days in the month, and and are the lower and upper limits of daily rainfall intensity levels, respectively.
2.2.2. Dataset Construction
The construction of a landslide displacement prediction dataset involves developing a comprehensive framework that treats the prediction as a regression task. This task focuses on estimating the displacement based on previous deformation and relevant environmental factors. Key features include history displacement, RWLavg, RWLmax, RWLmin, RWLmed, RWLvar, RWLstd, MCR, and MRI. These input features are then normalized using the min–max normalization method for optimal processing.
To create a suitable dataset for training and testing the predictive models, the sliding window technique was employed. The initial starting window coordinate, denoted as , was set to one, and a window size and a queue length were used for the monthly displacement. Features were extracted from time steps to , forming the input feature set , and the displacement at time step served as the ground truth value . Then, the window coordinate was incremented by raising , with the extraction process continuing until equaled . Finally, the dataset was constructed with a length of , split into a ratio of 7:3, with the first part of the data used as the training set and the remaining data used as the test set, and then employed for the training and evaluation of the model, respectively.
2.3. Multilayer RNN Models
The proposed approach employed a multilayer RNN model to construct landslide displacement prediction models. As shown in Figure 2b,c, the RNN model consists of two widely used core architectures: LSTM and GRU networks [16].
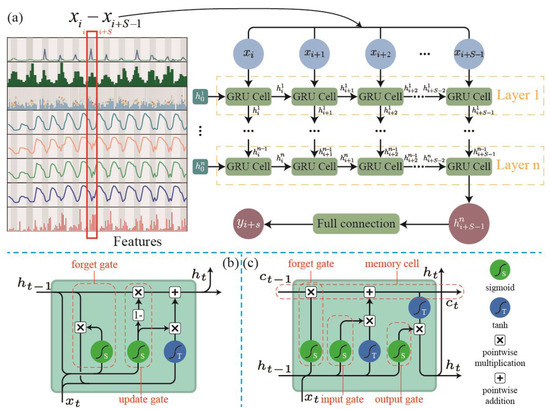
Figure 2.
The proposed multilayered GRU model for predicting landslide displacement. (a) Overview of the framework. The GRU cell architecture is depicted in (b) and can be replaced with an LSTM cell, as shown in (c).
LSTM is a type of RNN that is designed to capture long-term dependencies in sequence data and has been widely used for time series prediction. The LSTM cell is composed of four main components: an input gate , a forget gate , an output gate , and a cell state , which controls the flow of information in and out of the cell, and the memory cell stores information over time. The forms of the equations for an LSTM cell at time step are [31]:
where are the forget, input, output, and cell gates, respectively; , , and are the cell state, hidden state, and input at time t; is the sigmoid function; the operator denotes the Hadamard product; , and are the learnable weight and bias parameters; and the initial values are and .
A GRU is another type of RNN that is designed to capture long-term dependencies in sequence data [32]. The GRU cell is similar to the LSTM cell but has fewer gating mechanisms, making it computationally more efficient than LSTM. The GRU cell has two gates: a reset gate and an updated gate , which determines how much of the previous hidden state should be forgotten and how much of the candidate activation should be used to update the current hidden state, respectively. The equations for a GRU cell at time step are:
where are the reset and update gates; is the hidden state at time t; , and are the learnable weight and bias parameters; is the sigmoid function; and the operator denotes the Hadamard product. Initially, .
As shown in Figure 2a, a multilayer RNN model based on a GRU cell was employed for predicting landslide displacement, and this model can be alternatively constructed using the LSTM cell. The proposed model has multiple layers of GRU cells, enabling it to capture and learn the temporal dependencies and patterns in the input features. The model architecture comprises multiple layers, and each output of the previous layer is fed to the next layer as an input. The final step involves using a fully connected layer to connect the output of the last cell of the previous layer to generate the predicted monthly displacement.
For comparison, the multilayer GRU model, multilayer LSTM model, and popular SVR model were adopted for displacement prediction. Meanwhile, both pre- and post-enhancement datasets were adopted for all three models to compare the effectiveness of the feature enhancement. For model training, the mean squared error (MSE) loss function was chosen for the three models, and the adaptive moments (Adam) optimization algorithm was adopted for the parameter optimization of the LSTM and GRU models.
2.4. Hyperparameter Optimization
The selection of model hyperparameters is critical to the accuracy of the model. For the LSTM- and GRU-based multilayer RNN models, the critical hyperparameters selected for optimization are the number of layers and the hidden channels of the core cell, which can be optimized using a grid search method. For SVR, the kernel type and were selected as the hyperparameters [29], and the popular particle swarm optimization (PSO) algorithm [33] was employed to accelerate the optimization. The hyperparameter search spaces are listed in Table 1.

Table 1.
Hyperparameter search spaces of the models.
2.5. Performance Evaluation Criteria
Monthly landslide displacement prediction could be considered a regression problem, and three metrics were utilized for model evaluation: the MSE, root mean square error (RMSE), and R-squared (R2) score. The MSE measures the average squared difference between the predicted and actual values, and its formula is as follows:
where is the number of instances, is the ground truth, and is the predicted displacement.
The RMSE is the square root of the MSE, which measures the residuals’ standard deviation. The formula is as follows:
The score measures the proportion of variance in the dependent variable that is predictable from the independent variables. It ranges from 0 to 1, where 1 indicates a perfect prediction, and 0 indicates no correlation between the predicted and actual values. A higher value indicates better model performance. The formula is as follows:
where is the mean of the ground truth.
Ultimately, the MSE was used as the loss function for model training and hyperparameter optimization, and the RMSE and were employed for model evaluation and comparison.
3. Case Study
3.1. Landslide Overview
The Baijiabao landslide, the subject of the case study in this paper, is located on the right bank of the Xiangxi River (a tributary of the Yangtze River), approximately 2.5 km from the entrance to the Xiangxi River. As shown in Figure 3 and Figure 4, the landslide has a short tongue-shaped planar morphology, with an elevation of at the top and at the foot. The landslide is approximately wide and long, covering , with an average depth of m and a volume of approximately . The major sliding direction is , and it is a large-scale deep-seated soil landslide. The landslide mass is mainly composed of quaternary gray–yellow and brown–yellow powdery clay clasts, gravel, and blocky stone soil. The sliding surface consists of gray–yellow powdery clay mixed with gravel and pebbles, with purple–red plasticity. The bedrock is composed of Jurassic Lower Xiangxi Formation feldspar-quartz sandstone and mudstone, dipping at . The annual average rainfall is approximately between 1100 and 1300 mm, with the rainy season spanning from May to September accounting for approximately 80% of the total annual rainfall. The average temperature in the TGRA is 18 °C, and the hottest months are July and August, with an average temperature of 28 °C. The water level in the TGRA varies throughout the year due to seasonal changes in precipitation and water usage for power generation and navigation. Generally, the water level starts to decrease in March, reaching its minimum level of approximately 145 m in early June, when the reservoir is operated at a lower capacity to conserve water for power generation and navigation during the dry season. Then, it gradually rises and reaches its maximum level of approximately 175 m in October or November, when the reservoir operates at full capacity to store floodwater and generate hydroelectric power. Figure 5 shows the RWLs in this reservoir from 2007 to 2018.
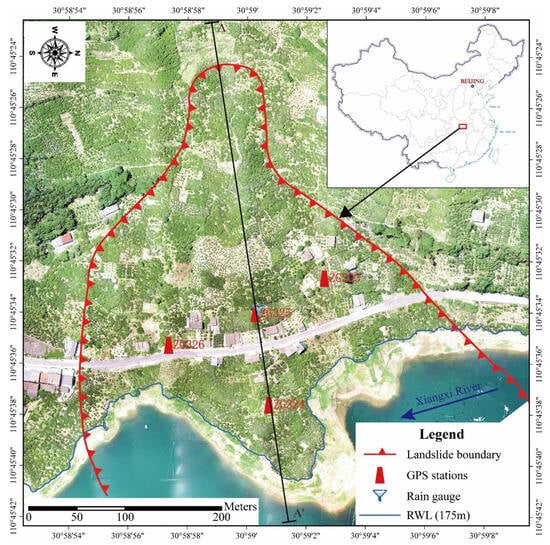
Figure 3.
Overview of the Baijiabao landslide. The orthophoto was taken using a DJI Phantom 4 RTK on 6 May 2022, when the RWL was 168.6 m. The Chinese map in the top-right corner was sourced from http://bzdt.ch.mnr.gov.cn (accessed on 12 February 2023).
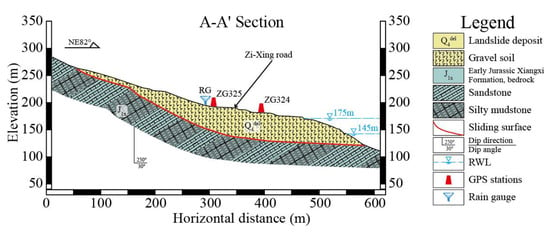
Figure 4.
A geological cross-section (A-A’) of the Baijiabao landslide. The location of the section line is shown in Figure 3.
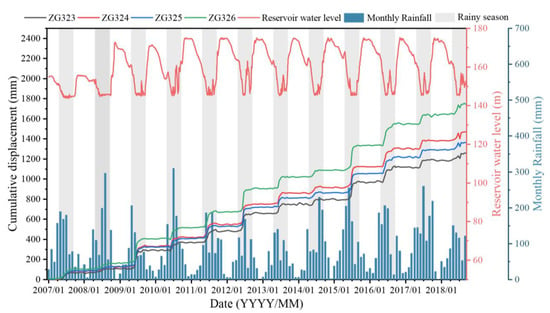
Figure 5.
Cumulative displacement, monthly rainfall, and RWL data relating to the Baijiabao landslide. The RWL and rainfall data were sourced from the Department of Water Resources of Hubei Province (http://113.57.190.228:8001/, 12 February 2023).
To monitor the displacement of the landslide, four GPS stations have been in operation since October 2006. Among them, ZG324 and ZG325 were installed in the principal direction, while ZG323 and ZG326 are located on both flanks of the landslide mass. For our study, data on the daily RWL of the TGRA were collected from the Department of Water Resources of Hubei Province [2]. The rain gauge (RG) installed in 2017 acquires high-precision daily rainfall data, but previous data were unavailable for the proposed feature enhancement approach. Therefore, daily rainfall monitoring data from Quyuan Station, located 8 km downstream and established in 2012, were used to supplement the missing data from June 2012 to October 2018, while data from Badong Station, located 35 km upstream, were used to fill in the remaining missing data from before June 2012.
The Baijiabao landslide was predominantly in its creeping stage, presenting a tiered displacement curve after the impoundment of the Three Gorges Reservoir. As illustrated in Figure 5, the preponderance of landslide activity transpired during the rainy season, specifically when the reservoir water level was markedly low, and precipitation was considerably high. Throughout the monitoring period, ZG326 exhibited the largest cumulative displacement, attaining 1.8 m, while the lowest displacement was observed at ZG323, measuring 1.4 m. With respect to annual displacement, the Baijiabao landslide underwent its most accelerated displacement during the rainy seasons of 2009, 2012, and 2015 and manifested a conspicuous deceleration commencing from 2016 onwards [34].
3.2. Preprocessing Displacement Data and Influencing Features
Considering the phenomenon of reservoir-triggered landslides, variations in precipitation and reservoir water levels have the potential to alter the geotechnical characteristics of the soil, compromising stability during instances of rapid reservoir drawdown or rise [24,25,35]. For the Baijiabao landslide, our study not only collected historical displacement curve data but also incorporated external contributory factors such as daily precipitation measurements and reservoir water level records.
3.2.1. Monthly Displacement
The cumulative displacement data of the four GPS stations are shown in Figure 5, which indicates that the Baijiabao landslide shows an obvious step-like deformation. The incremental displacement predominantly occurs between May and August each year and remains relatively stable in other months. The GPS stations are manually monitored at a typical frequency of one month, with increased monitoring frequency during the rainy season to capture rapid changes in landslide movement. However, the specific sampling date varies between the start, middle, and end of each month, which leads to irregular monitoring intervals. Consequently, linear interpolation was employed to calculate the cumulative displacement at the end of each month, followed by the subtraction of the cumulative displacement at the end of the previous month to obtain the monthly displacement.
Figure 6 shows the monthly displacement data of the four GPS stations monitoring the Baijiabao landslide. Based on Figure 5 and Figure 6, it is evident that the majority of the landslide deformation occurs between May and August, with the most significant deformations being observed in June each year, particularly in 2009, 2012, and 2015. Moreover, the deformation trends observed at the four GPS stations are generally consistent, suggesting that the different parts of the landslide exhibit similar sliding tendencies. Conversely, during nonrainy seasons, the landslide remains in a relatively stable state.
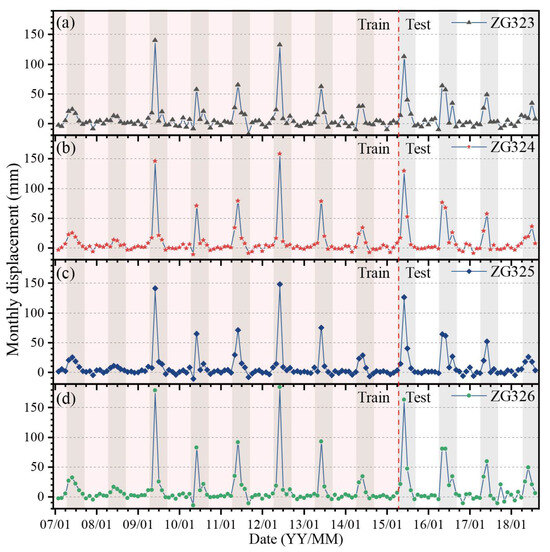
Figure 6.
Monthly displacement data relating to the Baijiabao landslide from February 2007 to September 2018. The data shown are derived from four GPS stations: ZG323 (a), ZG324 (b), ZG325 (c), and ZG326 (d).
3.2.2. Feature Enhancement of Rainfall and RWL Data
As described in Section 2.2, the daily rainfall data in this case study were subjected to feature enhancement. Specifically, the rate of precipitation was classified into seven levels, and the monthly rainfall intensity distribution was calculated based on the daily rainfall intensity, as shown in Figure 7. The predominant type of rainfall intensity in the region was light rain, with heavy rain, torrential rain, and downpour occurring during the rainy season. Heavy downpours did not occur during the monitoring period. Moreover, the rainy season typically features continuous rainfall, with precipitation occurring for half of each month. Ultimately, eight monthly rainfall-related features, MCR, MRIno, MRIlgt, MRImod, MRIhvy, MRItrt, MRIdp, and MRIhvydp, were obtained for landslide displacement prediction modeling.
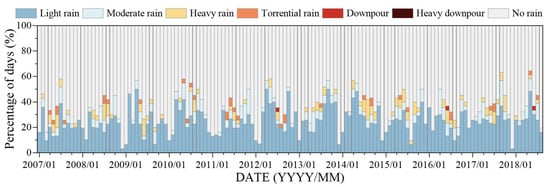
Figure 7.
Monthly rainfall intensity distribution, classified based on the standard released by the China Meteorological Administration (GB/T 28592-2012 [30]).
For daily RWLs, the RWLavg, RWLmax, RWLmin, RWLmed, RWLvar, and RWLstd were calculated as enhanced RWL features for the landslide displacement prediction models, as shown in Figure 8. Throughout the year, a consistent decreasing trend regarding the RWL was observed from January to June, with the rate of decline increasing until the lowest level (145 m) was reached. Subsequently, the RWL remained low during July and August, with significant fluctuations due to concentrated rainfall during the rainy season being observed. From September to November, the RWL rose steadily until it reached its peak (175 m) in December.
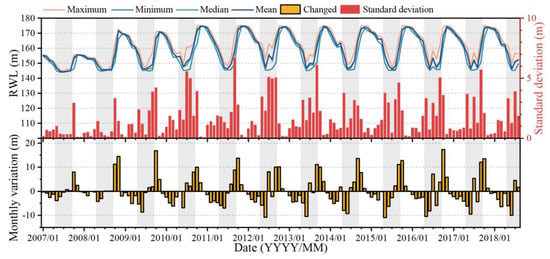
Figure 8.
Enhanced monthly RWL features, including the maximum, minimum, median, mean, and variation values generated from daily RWLs.
3.3. Dataset Construction
To evaluate the effectiveness of the proposed feature enhancement method, pre- and post-enhanced datasets were constructed for model training and testing. After feature normalization, a total of 133 feature-displacement pairs were generated using a sliding window of 6 months (S = 6) based on the data from February 2007 to August 2018, with the first 93 pairs (70%) being used as the training set and the remaining 40 pairs (30%) being used as the testing set. For the control group, before enhancement, the input of the models included the MDP, MCR, and RWLavg of the past 6 months. After enhancement, the experimental group included additional enhanced rainfall and RWL features, including MRIno, MRIlgt, MRImod, MRIhvy, MRItrt, MRIdp, MRIhvydp, RWLmax, RWLmin, RWLmed, RWLvar, and RWLstd, which were obtained through feature enhancement. In summary, a total of eight datasets were constructed for the four GPS monitoring stations, and each monitoring point contained one pre- and one post-enhanced dataset, with the former containing 3 features per month and the latter including 15 features per month.
3.4. Experimental Design for Model Comparison
To compare the performance of the feature enhancement with different models, three popular models, GRU, LSTM, and SVR, were applied to two types of datasets (DSpre and DSenh), and the “-E” suffix was added to the models applied to DSenh, namely, GRU-E, LSTM-E, and SVR-E, respectively. The GRU/GRU-E and LSTM/LSTM-E models were built and trained based on PyTorch [36], and the SVR model was based on scikit-learn. All analyses, including data pre-processing, model construction, training, validation, and post-processing, were performed using Python 3.10.4, PyTorch 1.13.1, scikit-learn 1.2.0, and ArcGIS Pro 3.0.2 in Windows Pro 22H2 with an AMD Ryzen 7 5800H CPU @3.2 GHz, 64G RAM and RTX 3060.
4. Results
4.1. Model Performance Comparison
Hyperparameter tuning was implemented for each model using the method delineated in Section 2.4, and the optimal hyperparameter configurations and corresponding performance metrics for both the training and test sets are presented in Table 2. First, the findings showed that the application of feature augmentation to the GRU-E, LSTM-E, and SVR-E models yielded significant performance gains, thereby validating the effectiveness of the proposed approach. This was further confirmed by Taylor diagrams depicting each model’s performance with the test sets, as exemplified in Figure 9. Second, the GRU-E model consistently outperformed the other models, achieving the most favorable prediction results across all four GPS stations. Specifically, the GRU-E model achieved the lowest RMSE of 15.65 mm for predicting the displacement of ZG323, followed by the LSTM-E (16.53 mm), LSTM (19.26 mm), SVR-E (19.36 mm), GRU (19.55 mm), and SVR (25.96 mm) models. Notably, the displacement prediction results for the other three GPS stations, ZG324, ZG325, and ZG326, demonstrated a high degree of conformity with the ZG323 predictions, suggesting that the GRU-E model is robust in capturing the spatiotemporal variation in GPS displacement.

Table 2.
Model hyperparameter optimization results and performance on the training and testing sets.
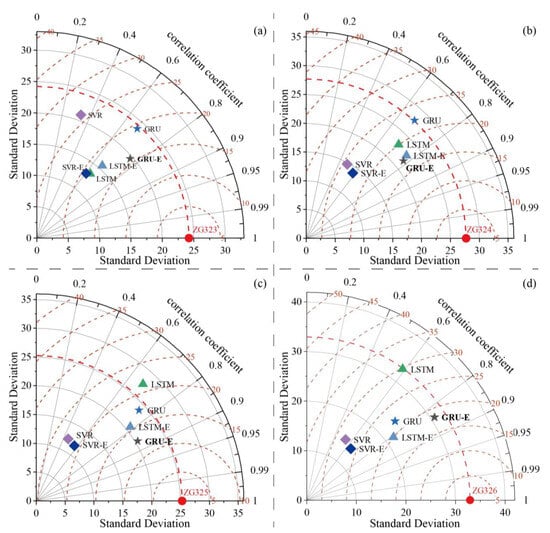
Figure 9.
Comparison of pre- and post-enhanced model performance in predicting monthly displacements for the four GPS stations ((a–d) ZG323 to ZG326) using Taylor diagrams.
This study offers compelling evidence that the GRU-E model consistently outperforms others in predicting monthly landslide displacement at the four GPS stations. The Taylor diagrams in Figure 9 and the composite performance comparison in Table 3 illustrate that the GRU-E model achieved the lowest mean RMSE (16.5208 mm) and the highest mean R2 (0.6265), followed by the LSTM-E, SVR-E, GRU, LSTM, and SVR models. This suggests that the GRU-based models produced the best performance in both groups of unenhanced and enhanced models, with the GRU-E model standing out among the six models.

Table 3.
The composite performance of the six models for displacement prediction at the four GPS stations.
The comparison between enhanced models and their corresponding unenhanced models in Table 3 indicates that the GRU-E model yielded the most significant performance improvement, reducing the mean RMSE by 24.39% and increasing the mean R2 by 0.2693. The LSTM-E model displayed similar but minor improvements, reducing the mean RMSE by 21.09% and increasing the mean R2 by 0.2517. The SVR-E model resulted in the slightest improvement, reducing the mean RMSE by 11.47% and increasing the mean R2 by 0.2087, which is still a considerable improvement. Therefore, the proposed feature enhancement approach achieved significant performance improvements for the GRU, LSTM, and SVR models.
Furthermore, this study demonstrates the commendable generalizability of the model across diverse sites, which is an essential trait for any predictive model. Moreover, the optimal hyperparameter configurations for each model varied across different monitoring stations. However, the GRU-E model exhibited optimal performance with 32 hidden channels, emphasizing the critical role of the number of hidden channels as a hyperparameter when implementing the GRU-E model for landslide monthly displacement prediction.
Figure 10 illustrates the training loss curves of various RNN models across the four GPS stations. The findings reveal that the enhanced models, GRU-E, LSTM-E, and SVR-E, exhibited notably superior convergence curves for all four stations, both in terms of convergence speed and the final results, compared to those of the nonenhanced models, GRU, LSTM, and SVR. This observation highlighted the efficacy of the proposed feature enhancement approach. Specifically, the GRU-E model exhibited the fastest convergence speed for ZG323, ZG325, and ZG326, with a shallow loss for ZG325 relative to the other models. While the GRU-E model converged slower than the LSTM-E model for ZG324, both models demonstrated comparable final loss values, indicating similar performance. These findings suggest that the proposed feature enhancement approach is a compelling strategy for improving the performance of RNN models for landslide displacement prediction. Moreover, the superior performance of the GRU-E model highlighted the significance of selecting an appropriate RNN architecture to achieve optimal performance.
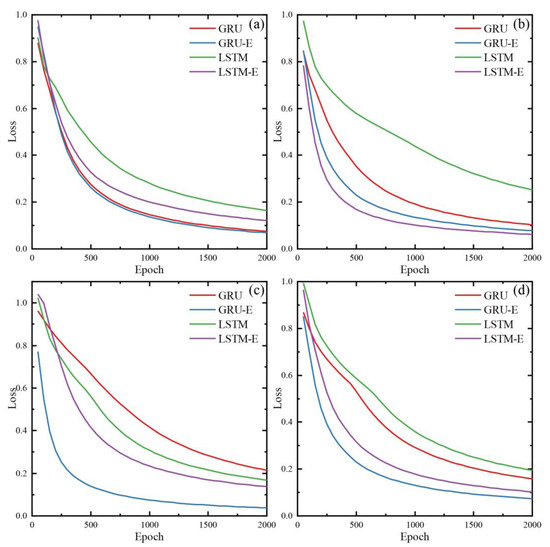
Figure 10.
Training loss curves of the GRU, GRU-E, LSTM and LSTM-E models across the four GPS stations: (a) ZG323, (b) ZG324, (c) ZG325, and (d) ZG326.
4.2. Analysis of Monthly Landslide Displacement Prediction Results
In addition to comparing the macroscopic performance of different models, we conducted a detailed analysis of their specific prediction results. Figure 11 illustrates the prediction performance of the six models for the four GPS monitoring stations over a period of 40 months, from May 2015 to August 2018, spanning four rainy seasons. The left side of Figure 11 shows the prediction results of the unenhanced models, and the right side displays the prediction results of the enhanced models. Our research findings indicate that the enhanced models outperformed the unenhanced models in predicting landslide displacement during the rainy seasons and had higher accuracy. Moreover, the enhanced models accurately differentiated between rainy and nonrainy seasons, with a stable prediction sequence during the nonrainy seasons and an accurate prediction of landslide displacement during the rainy seasons.
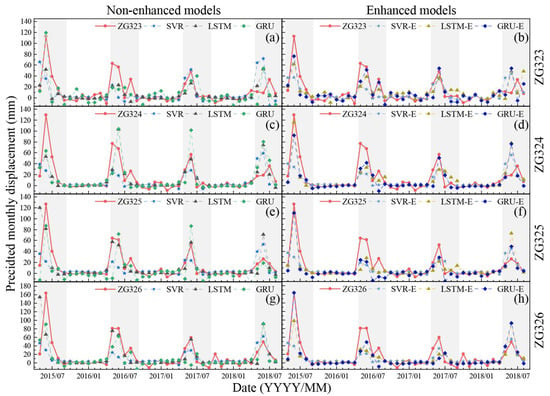
Figure 11.
Comparative Analysis of Displacement Predictions for Non-Enhanced and Enhanced Models Across Four GPS Stations During Rainy Seasons (May 2015–August 2018). This figure juxtaposes the displacement prediction outcomes from non-enhanced and enhanced models on the left and right sides, respectively, for four GPS stations (ZG323, ZG324, ZG325, and ZG326) across rainy seasons spanning from May 2015 to August 2018. Solid red lines depict the actual measured monthly displacement (ground truth), while dashed lines in various colors signify the displacement predictions from different models. Panels (a,c,e,g) display the predictions from non-enhanced models for stations ZG323, ZG324, ZG325, and ZG326, respectively. Conversely, panels (b,d,f,h) illustrate the results from enhanced models for the same stations, in the same order.
To elaborate, in contrast to the conventional nonenhanced model, the GRU-E model offered increased precision in predicting monthly landslide displacement throughout the rainy seasons of 2015, 2016, and 2017, demonstrating adaptability to the abrupt displacement variations in landslides during those periods. On the other hand, the original nonenhanced model exhibited marked time lag in its landslide displacement predictions for the rainy seasons, rendering it deleterious for this particular class of tiered landslides.
Specifically, among the three enhanced models, the GRU-E model’s prediction results were significantly closer to the true values. The model’s predictions for the first three rainy seasons were found to be highly accurate, with the first one being particularly precise. However, the predictions for the fourth rainy season deviated significantly from the ground truth. This deviation may be attributed to the lack of prior experience from the previous three rainy seasons, suggesting that the model’s predictive ability may decrease as the extrapolation interval increases. Therefore, the optimal extrapolation time for the GRU-E model is recommended to be one year, which means predicting the displacement within the next year, and it is not recommended to predict more than three years.
4.3. Selection of the Sequence Length of the Model Input
The selection of an appropriate sequence length for predicting landslide displacement is crucial, as it can significantly impact the model’s accuracy. To determine the optimal sequence length, we conducted a study with four GPS stations, examining the performance of the training and testing sets under different sequence lengths, as shown in Figure 12. Among the three sequence lengths tested (3, 6 and 12), the GRU-E model achieved the best results for the testing set, with a sequence length of 6, exhibiting the smallest RMSE and the highest R2. This performance was consistent across all four GPS stations. In addition, the model exhibited no significant differences in performance with the training set, especially for R2. Therefore, we suggest that the input sequence length of the GRU-E model be set to 6.
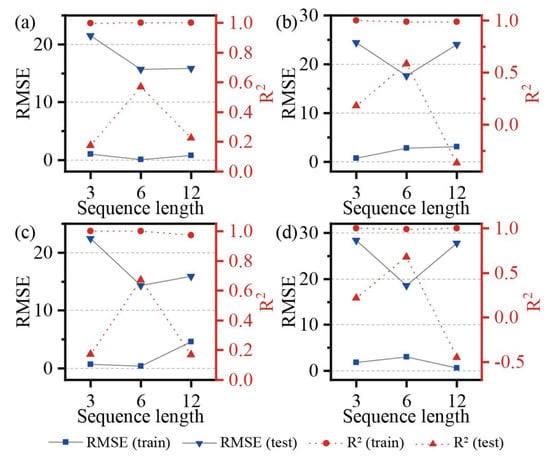
Figure 12.
Performance of the GRU model with different sequence lengths for predicting landslide displacements at different GPS monitoring stations: (a) ZG323, (b) ZG324, (c) ZG325, and (d) ZG326.
4.4. Influence of Hyperparameters for the GRU-E Model
Model hyperparameters play a crucial role in determining the accuracy and performance of a model. In this study, a grid search was performed for two hyperparameters and the numbers of hidden channels and layers of the GRU-E model. The search space for these hyperparameters is specified in Table 1. Increasing the numbers of hidden channels and layers can significantly enhance the model’s complexity and capacity to learn from data but may also make the model harder to train and more prone to overfitting. Conversely, if there are too few hidden channels and layers, the model may not be able to capture displacement features adequately. To investigate the impact of hyperparameter combinations on the model’s performance, the model’s performance was evaluated using different hyperparameter settings, as shown in Figure 13 The results indicate that the optimal performance for the GRU-E model at all four GPS stations was achieved with 32 hidden channels, resulting in the lowest RMSE. However, the optimal number of layers varied among the stations, with the best performance for ZG323 and ZG325 being obtained with one layer and that for ZG324 and ZG326 being obtained with three layers. As there is no clear consensus on the optimal hyperparameter settings, we recommend that hyperparameter tuning be performed when using the GRU-E model to ensure optimal model performance. In summary, selecting appropriate hyperparameter combinations is crucial for optimizing the performance of the GRU-E model, and a grid search is an effective method for tuning hyperparameters. However, careful consideration must be given to the trade-offs between model complexity, training difficulty, and overfitting, and hyperparameter optimization should be performed to identify the best settings for each specific application.
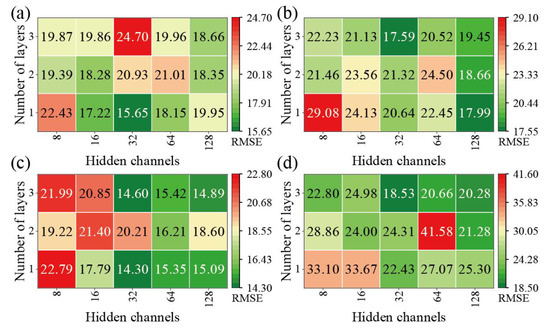
Figure 13.
The performance of the GRU-E model with different combinations of hyperparameters for four GPS stations: (a) ZG323, (b) ZG324, (c) ZG325, and (d) ZG326.
4.5. Comparison of RNN Models for Landslide Displacement Prediction
Based on the performance of the enhanced models for the test set presented in Table 2, as well as in Figure 9, Figure 10 and Figure 11, it is evident that the two enhanced RNN models, GRU-E and LSTM-E, achieved the best and second-best results, respectively, outperforming SVR. However, from the model structures displayed in Figure 2b,c, it can be seen that the GRU-based models have a simpler structure and fewer parameters than the LSTM-based models, making them less prone to overfitting. Moreover, due to the increased number of parameters in the LSTM-based models, the convergence speed during training was slower, as seen in the loss curves of Figure 10. Additionally, as shown in Figure 11, the GRU-E model exhibited superior accuracy in predicting large displacements during the rainy season compared to that of the LSTM-E model. In summary, the GRU-based models demonstrated a prominent advantage in predicting landslide displacement compared to the LSTM-based models, with the GRU-E model achieving the best prediction results among the considered models. Thus, this model is recommended for monthly landslide displacement prediction.
5. Discussion
In this paper, we propose a novel feature enhancement approach designed to improve the accuracy of reservoir landslide displacement prediction, and we verified the effectiveness of the method through a comparative study. Compared to traditional approaches that use single parameters such as monthly average reservoir water level or monthly accumulated precipitation to characterize external environmental changes, our proposed method substantially expands and enriches the parameters of external environmental factors. Rainfall parameters such as MCR, MRIno, MRIlgt, MRImod, MRIhvy, MRItrt, MRIdp, and MRIhvydp, and water level parameters such as RWLavg, RWLmax, RWLmin, RWLmed, RWLvar and RWLstd enable the model to capture the influence of external environmental changes on landslide displacement more comprehensively. Contrasting studies of nonenhanced and enhanced models have shown that the proposed feature enhancement approach significantly improves the description of external factors. Essentially, this attribute enhancement approach is a new way of thinking about fusing and analyzing monitoring data from different time scales, and it is applicable and could be subsequently applied to these types of landslide displacement prediction models and cases.
The GRU-E model, while demonstrating superior performance compared to both nonenhanced and other enhanced models, presents several limitations, and it is crucial that these limitations are improved upon in future. First and foremost, hyperparameter optimization remains a critical aspect for enhancing the effectiveness of the GRU-E model, similar to other machine learning models. Additionally, the current approach in constructing displacement prediction models for each GPS station independently overlooks the potential interdependencies and deformation correlations across different parts of the landslide, which is a vital factor in comprehensive landslide analysis. Another notable limitation is the requirement for high-resolution monitoring data, including daily rainfall and reservoir water level (RWL) data. Acquiring such detailed data can be challenging, especially in the context of early long-term monitoring projects, potentially limiting the model’s applicability in these scenarios. Moreover, the enhanced models, including the GRU-E, tend to show reduced performance when making extrapolations beyond the observed data range. This limitation becomes particularly pronounced for predictions extending over periods longer than three years, underlining the need for cautious interpretation in long-term forecasting. This study also faced challenges with data sourcing, as the daily rainfall data for the extended monitoring period were partially obtained from nearby national weather stations, not in situ rain gauges. This substitution led to minor discrepancies in the data source, which might impact the model’s precision. Furthermore, the model’s validation, carried out using data on the Baijiabao landslide from four GPS stations, indicates that additional case studies are required to fully assess its generalizability across diverse landslide scenarios.
Addressing the model’s adaptability to diverse landslide types, particularly in complex environments such as dam reservoir banks, is a critical area for enhancement. The wide range of landslide typologies in these settings demands a modeling approach that is versatile and robust. Furthermore, the model’s capacity to predict complex geological behaviors, especially in scenarios with the potential for rapid and significant slope deformations, is a vital aspect of its development. This consideration is crucial in mitigating the risks associated with catastrophic landslide events.
In light of these factors, it is evident that while the GRU-E model marks a significant stride in landslide displacement prediction, there is substantial scope for improvement. Future work should focus on augmenting the model’s adaptability to different landslide typologies and enhancing its predictive capabilities for a range of geological behaviors. These improvements are crucial for effectively managing landslide risks, particularly in scenarios involving complex or rapidly evolving geological conditions.
6. Conclusions
This study proposed a feature enhancement approach for improving landslide displacement prediction by enhancing the rainfall and RWL parameters of the models. For comparison, six models, including GRU, LSTM, and SVR using an unenhanced dataset and GRU-E, LSTM-E, and SVR-E using an enhanced dataset, were employed for landslide displacement prediction at four GPS monitoring stations on the Baijiabao landslide. The results indicate the following:
- The enhanced models, including the GRU-E, LSTM-E, and SVR-E models, showed significant improvements in terms of the prediction accuracy for all four GPS monitoring stations, demonstrating the effectiveness of the proposed feature enhancement approach for daily rainfall and daily RWL characteristics in landslide displacement prediction. The GRU-E model showed the highest improvement, with the RMSE decreasing by 24.39% and the R2 increasing by 0.2693, followed by the LSTM-E model, with a decrease in the RMSE of 21.09% and an increase in the R2 of 0.2517, and the SVR-E model, with a decrease in the RMSE of 11.47% and an increase in the R2 of 0.2087.
- The GRU-E model consistently excelled in comparison to the other models for the four GPS monitoring stations. Specifically, it attained the highest mean R2 of 0.6265 and the lowest mean RMSE of 16.5208 mm, substantially superior results to those of the LSTM-E model (mean RMSE = 17.7103 mm and R2 = 0.5734) and the SVR-E model (mean RMSE = 22.4909 mm and R2 = 0.3159). This highlights its remarkable aptitude for predicting displacements in reservoir landslides with step-like deformation characteristics. Moreover, it was determined that an input sequence length of 6 is the optimal configuration for the GRU-E model, and fine-tuning the hyperparameters is also crucial for enhancing its performance.
- The GRU-E model showed promising results in landslide displacement prediction, but it has limitations that need to be addressed, including the need for hyperparameter optimization and the lack of consideration of deformation correlations between different parts of the landslide. Further case studies are needed to evaluate its generalizability.
In conclusion, the proposed approach for incorporating daily rainfall and daily RWL characteristics was effective in improving the prediction accuracy of landslide displacement models, and the GRU-E model was shown to be the most promising model for displacement prediction of reservoir landslides with step-like deformation characteristics. This study highlights the importance of the proposed feature enhancement approach and provides valuable insights for future research in this field.
Author Contributions
D.X.: methodology, software, writing—original draft, writing—review and editing. H.T.: conceptualization, validation, writing—review and editing, supervision. T.G.: writing—review and editing, supervision. All authors have read and agreed to the published version of the manuscript.
Funding
This research was supported by the Major Program of the National Natural Science Foundation of China (No. 42090055), the National Major Scientific Instruments and Equipment Development Projects of China (No. 41827808), and the State Scholarship Fund from the China Scholarship Council (No. 202106410076).
Data Availability Statement
The data and materials supporting this study’s findings are available from the first and corresponding authors, Ding Xia and Huiming Tang, upon reasonable request.
Acknowledgments
We sincerely appreciate the valuable comments and suggestions provided by the reviewers and editors during the manuscript review process.
Conflicts of Interest
The authors declare no conflicts of interest.
References
- Tang, H.; Wasowski, J.; Juang, C.H. Geohazards in the Three Gorges Reservoir Area, China—Lessons Learned from Decades of Research. Eng. Geol. 2019, 261, 105267. [Google Scholar] [CrossRef]
- Xia, D.; Tang, H.; Sun, S.; Tang, C.; Zhang, B. Landslide Susceptibility Mapping Based on the Germinal Center Optimization Algorithm and Support Vector Classification. Remote Sens. 2022, 14, 2707. [Google Scholar] [CrossRef]
- Xie, J.; Uchimura, T.; Wang, G.; Selvarajah, H.; Maqsood, Z.; Shen, Q.; Mei, G.; Qiao, S. Predicting the Sliding Behavior of Rotational Landslides Based on the Tilting Measurement of the Slope Surface. Eng. Geol. 2020, 269, 105554. [Google Scholar] [CrossRef]
- Fang, K.; Tang, H.; Li, C.; Su, X.; An, P.; Sun, S. Centrifuge Modelling of Landslides and Landslide Hazard Mitigation: A Review. Geosci. Front. 2023, 14, 101493. [Google Scholar] [CrossRef]
- Zhang, B.; Tang, H.; Sumi, S.; Ding, B.; Zhang, L.; Ning, Y. Exploring the Deformation and Failure Characteristics of Interbedded Anti-Inclined Rock Slopes: Insights from Physical Modelling Tests. Rock Mech. Rock Eng. 2023, 1–26. [Google Scholar] [CrossRef]
- Tang, H.M.; Yong, R.; Eldin, M. Stability Analysis of Stratified Rock Slopes with Spatially Variable Strength Parameters: The Case of Qianjiangping Landslide. Bull. Eng. Geol. Environ. 2017, 76, 839–853. [Google Scholar] [CrossRef]
- Liu, P.; Li, L.; Guo, S.; Xiong, L.; Zhang, W.; Zhang, J.; Xu, C.-Y. Optimal Design of Seasonal Flood Limited Water Levels and Its Application for the Three Gorges Reservoir. J. Hydrol. 2015, 527, 1045–1053. [Google Scholar] [CrossRef]
- Li, C.; Criss, R.E.; Fu, Z.; Long, J.; Tan, Q. Evolution Characteristics and Displacement Forecasting Model of Landslides with Stair-Step Sliding Surface along the Xiangxi River, Three Gorges Reservoir Region, China. Eng. Geol. 2021, 283, 105961. [Google Scholar] [CrossRef]
- Long, J.; Li, C.; Liu, Y.; Feng, P.; Zuo, Q. A Multi-Feature Fusion Transfer Learning Method for Displacement Prediction of Rainfall Reservoir-Induced Landslide with Step-like Deformation Characteristics. Eng. Geol. 2022, 297, 106494. [Google Scholar] [CrossRef]
- Huang, H.; Yi, W.; Lu, S.; Yi, Q.; Zhang, G. Use of Monitoring Data to Interpret Active Landslide Movements and Hydrological Triggers in Three Gorges Reservoir. J. Perform. Constr. Facil. 2016, 30, C4014005. [Google Scholar] [CrossRef]
- Ma, J.W.; Tang, H.M.; Liu, X.; Wen, T.; Zhang, J.R.; Tan, Q.W.; Fan, Z.Q. Probabilistic Forecasting of Landslide Displacement Accounting for Epistemic Uncertainty: A Case Study in the Three Gorges Reservoir Area, China. Landslides 2018, 15, 1145–1153. [Google Scholar] [CrossRef]
- Juang, C.H. BFTS—Engineering Geologists’ Field Station to Study Reservoir Landslides. Eng. Geol. 2021, 284, 106038. [Google Scholar] [CrossRef]
- Zhang, J.; Tang, H.; Tannant, D.D.; Lin, C.; Xia, D.; Liu, X.; Zhang, Y.; Ma, J. Combined Forecasting Model with CEEMD-LCSS Reconstruction and the ABC-SVR Method for Landslide Displacement Prediction. J. Clean. Prod. 2021, 293, 126205. [Google Scholar] [CrossRef]
- Zhou, C.; Yin, K.; Cao, Y.; Ahmed, B.; Fu, X. A Novel Method for Landslide Displacement Prediction by Integrating Advanced Computational Intelligence Algorithms. Sci. Rep. 2018, 8, 7287. [Google Scholar] [CrossRef]
- Liu, Y.; Xu, C.; Huang, B.; Ren, X.; Liu, C.; Hu, B.; Chen, Z. Landslide Displacement Prediction Based on Multi-Source Data Fusion and Sensitivity States. Eng. Geol. 2020, 271, 105608. [Google Scholar] [CrossRef]
- Zhang, W.; Li, H.; Tang, L.; Gu, X.; Wang, L.; Wang, L. Displacement Prediction of Jiuxianping Landslide Using Gated Recurrent Unit (GRU) Networks. Acta Geotech. 2022, 17, 1367–1382. [Google Scholar] [CrossRef]
- Hong, H.; Pradhan, B.; Xu, C.; Tien Bui, D. Spatial Prediction of Landslide Hazard at the Yihuang Area (China) Using Two-Class Kernel Logistic Regression, Alternating Decision Tree and Support Vector Machines. CATENA 2015, 133, 266–281. [Google Scholar] [CrossRef]
- Hong, H.; Miao, Y.; Liu, J.; Zhu, A.X. Exploring the Effects of the Design and Quantity of Absence Data on the Performance of Random Forest-Based Landslide Susceptibility Mapping. CATENA 2019, 176, 45–64. [Google Scholar] [CrossRef]
- Liu, Z.; Ma, J.; Xia, D.; Jiang, S.; Ren, Z.; Tan, C.; Lei, D.; Guo, H. Toward the Reliable Prediction of Reservoir Landslide Displacement Using Earthworm Optimization Algorithm-Optimized Support Vector Regression (EOA-SVR). Nat. Hazards 2023, 1–24. [Google Scholar] [CrossRef]
- Ma, J.; Lei, D.; Ren, Z.; Tan, C.; Xia, D.; Guo, H. Automated Machine Learning-Based Landslide Susceptibility Mapping for the Three Gorges Reservoir Area, China. Math. Geosci. 2023, 1–36. [Google Scholar] [CrossRef]
- Gong, W.; Tian, S.; Wang, L.; Li, Z.; Tang, H.; Li, T.; Zhang, L. Interval Prediction of Landslide Displacement with Dual-Output Least Squares Support Vector Machine and Particle Swarm Optimization Algorithms. Acta Geotech. 2022, 17, 4013–4031. [Google Scholar] [CrossRef]
- Kv, S.; Pillai, G.N.; Peethambaran, B. Prediction of Landslide Displacement with Controlling Factors Using Extreme Learning Adaptive Neuro-Fuzzy Inference System (ELANFIS). Appl. Soft Comput. 2017, 61, 892–904. [Google Scholar] [CrossRef]
- Liu, J.; Zhu, X. Landslide Displacement Prediction Based on Multi-Source Time Series. In Proceedings of the 2022 5th International Conference on Pattern Recognition and Artificial Intelligence (PRAI), Chengdu, China, 19–21 August 2022; pp. 1267–1274. [Google Scholar]
- Wang, S.; Pan, Y.; Wang, L.; Guo, F.; Chen, Y.; Sun, W. Deformation Characteristics, Mechanisms, and Influencing Factors of Hydrodynamic Pressure Landslides in the Three Gorges Reservoir: A Case Study and Model Test Study. Bull. Eng. Geol. Environ. 2021, 80, 3513–3533. [Google Scholar] [CrossRef]
- Yao, W.; Li, C.; Guo, Y.; Criss, R.E.; Zuo, Q.; Zhan, H. Short-Term Deformation Characteristics, Displacement Prediction, and Kinematic Mechanism of Baijiabao Landslide Based on Updated Monitoring Data. Bull. Eng. Geol. Environ. 2022, 81, 393. [Google Scholar] [CrossRef]
- Zhang, W.; Tang, L.; Li, H.; Wang, L.; Cheng, L.; Zhou, T.; Chen, X. Probabilistic Stability Analysis of Bazimen Landslide with Monitored Rainfall Data and Water Level Fluctuations in Three Gorges Reservoir, China. Front. Struct. Civ. Eng. 2020, 14, 1247–1261. [Google Scholar] [CrossRef]
- Wang, Y.; Tang, H.; Wen, T.; Ma, J. A Hybrid Intelligent Approach for Constructing Landslide Displacement Prediction Intervals. Appl. Soft Comput. 2019, 81, 105506. [Google Scholar] [CrossRef]
- Ma, J.; Xia, D.; Wang, Y.; Niu, X.; Jiang, S.; Liu, Z.; Guo, H. A Comprehensive Comparison among Metaheuristics (MHs) for Geohazard Modeling Using Machine Learning: Insights from a Case Study of Landslide Displacement Prediction. Eng. Appl. Artif. Intell. 2022, 114, 105150. [Google Scholar] [CrossRef]
- Ma, J.; Xia, D.; Guo, H.; Wang, Y.; Niu, X.; Liu, Z.; Jiang, S. Metaheuristic-Based Support Vector Regression for Landslide Displacement Prediction: A Comparative Study. Landslides 2022, 19, 2489–2511. [Google Scholar] [CrossRef]
- GB/T 28592-2012; General Administration of Quality Supervision Grade of Precipitation. Standardization Administration of the P.R.C: Beijing, China, 2012.
- Hochreiter, S.; Schmidhuber, J. Long Short-Term Memory. Neural Comput. 1997, 9, 1735–1780. [Google Scholar] [CrossRef]
- Cho, K.; van Merrienboer, B.; Bahdanau, D.; Bengio, Y. On the Properties of Neural Machine Translation: Encoder-Decoder Approaches. arXiv 2014, arXiv:1409.1259. [Google Scholar] [CrossRef]
- Huang, C.-L.; Dun, J.-F. A Distributed PSO–SVM Hybrid System with Feature Selection and Parameter Optimization. Appl. Soft Comput. 2008, 8, 1381–1391. [Google Scholar] [CrossRef]
- Yao, W.; Li, C.; Zuo, Q.; Zhan, H.; Criss, R.E. Spatiotemporal Deformation Characteristics and Triggering Factors of Baijiabao Landslide in Three Gorges Reservoir Region, China. Geomorphology 2019, 343, 34–47. [Google Scholar] [CrossRef]
- Wang, C.; Wang, H.; Qin, W.; Wei, S.; Tian, H.; Fang, K. Behaviour of Pile-Anchor Reinforced Landslides under Varying Water Level, Rainfall, and Thrust Load: Insight from Physical Modelling. Eng. Geol. 2023, 325, 107293. [Google Scholar] [CrossRef]
- Paszke, A.; Gross, S.; Massa, F.; Lerer, A.; Bradbury, J.; Chanan, G.; Killeen, T.; Lin, Z.; Gimelshein, N.; Antiga, L.; et al. PyTorch: An Imperative Style, High-Performance Deep Learning Library. In Proceedings of the Advances in Neural Information Processing Systems, Vancouver, BC, Canada, 8–14 December 2019; Curran Associates, Inc.: Red Hook, NY, USA, 2019; Volume 32. [Google Scholar]
Disclaimer/Publisher’s Note: The statements, opinions and data contained in all publications are solely those of the individual author(s) and contributor(s) and not of MDPI and/or the editor(s). MDPI and/or the editor(s) disclaim responsibility for any injury to people or property resulting from any ideas, methods, instructions or products referred to in the content. |
© 2024 by the authors. Licensee MDPI, Basel, Switzerland. This article is an open access article distributed under the terms and conditions of the Creative Commons Attribution (CC BY) license (https://creativecommons.org/licenses/by/4.0/).