


CO Emissions Associated with Three Major Earthquakes Occurring in Diverse Tectonic Environments

Abstract
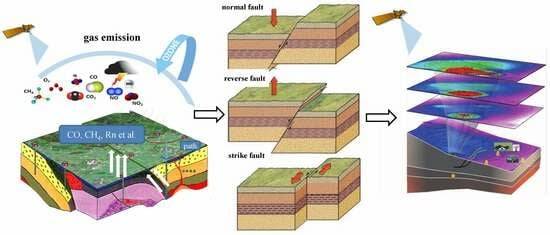
1. Introduction
2. Data and Methodology
2.1. Data
2.2. Methodology
3. Results
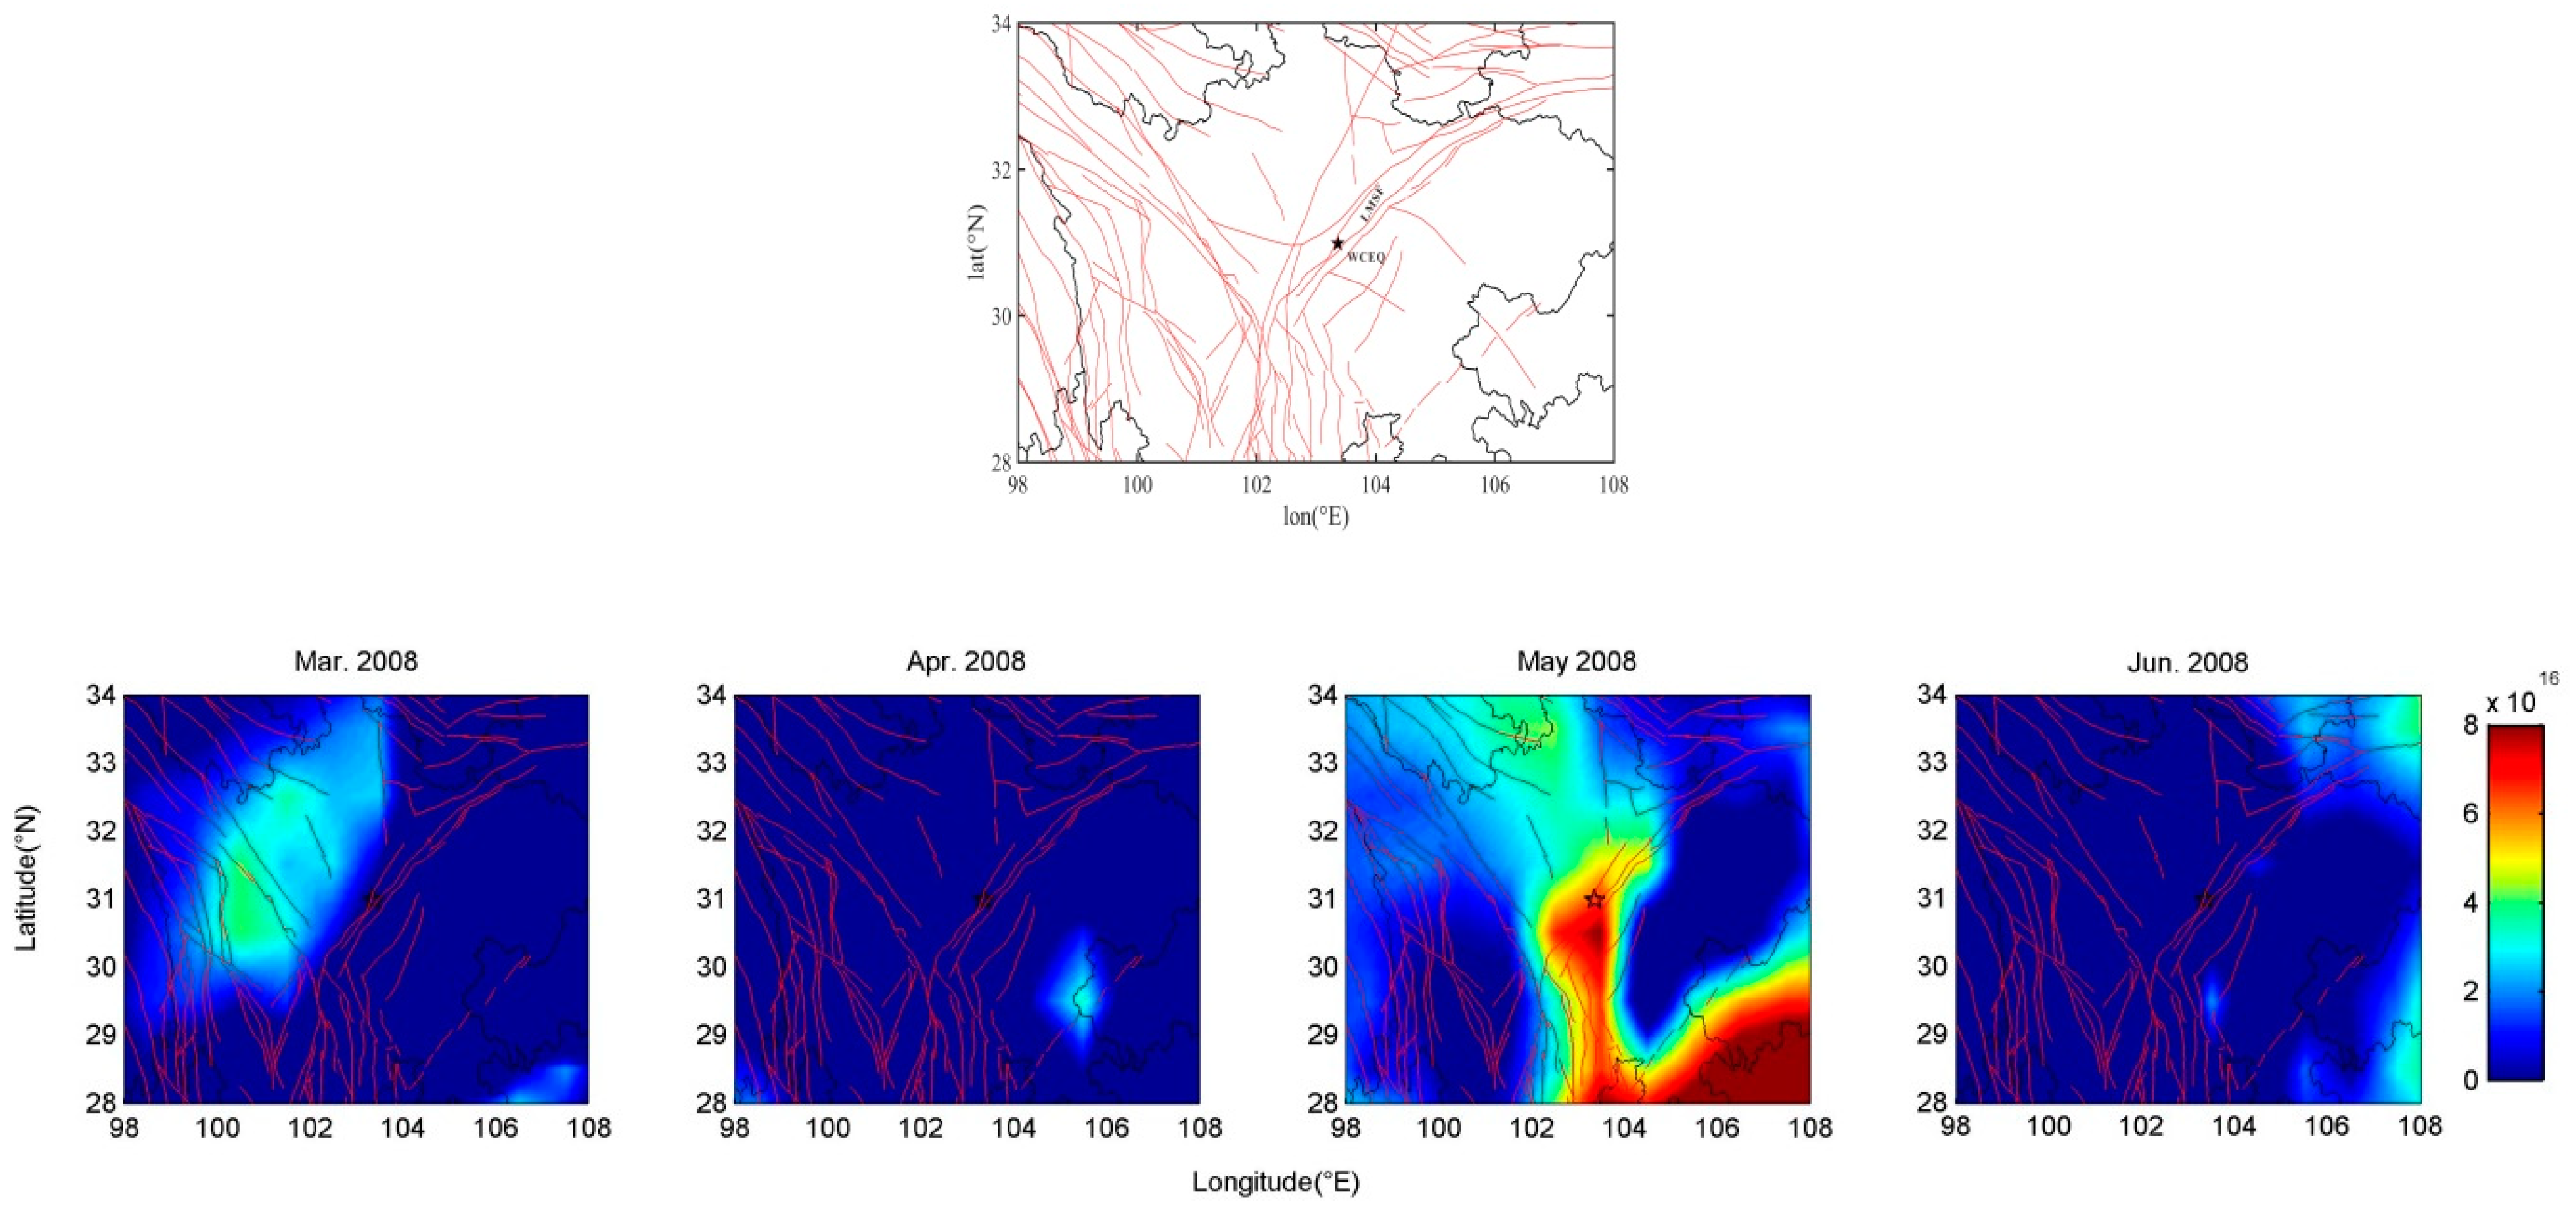
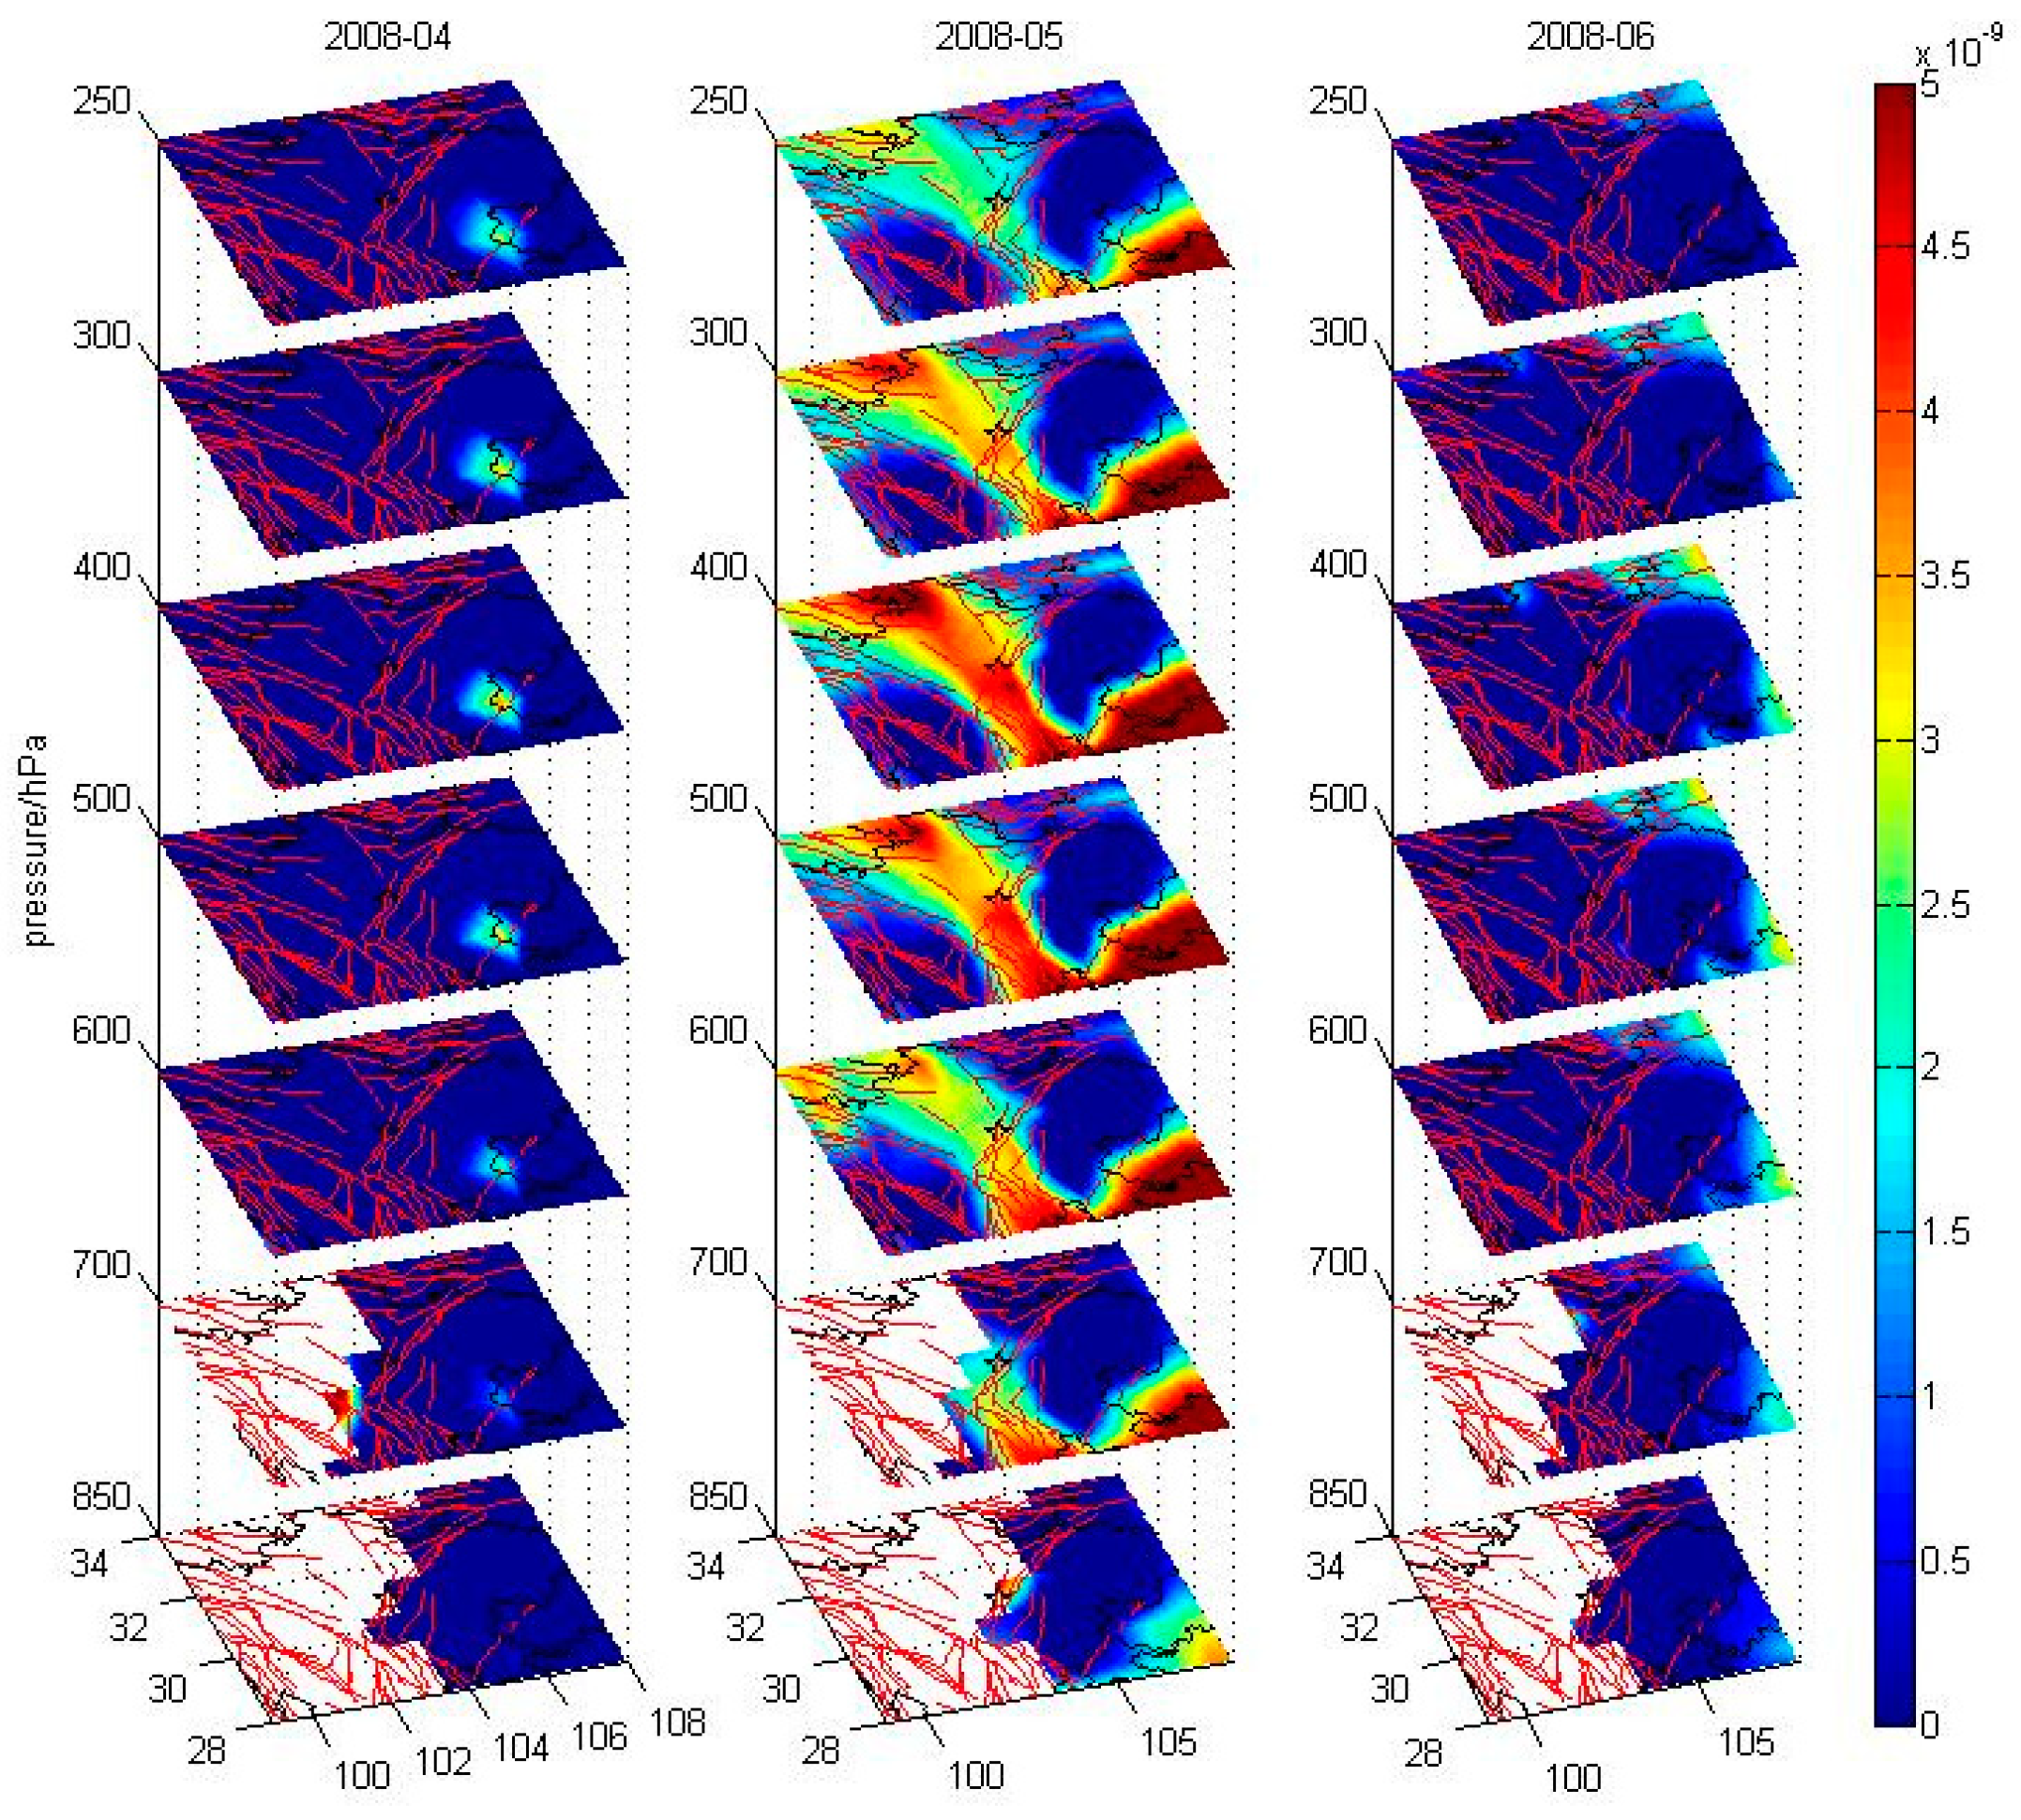
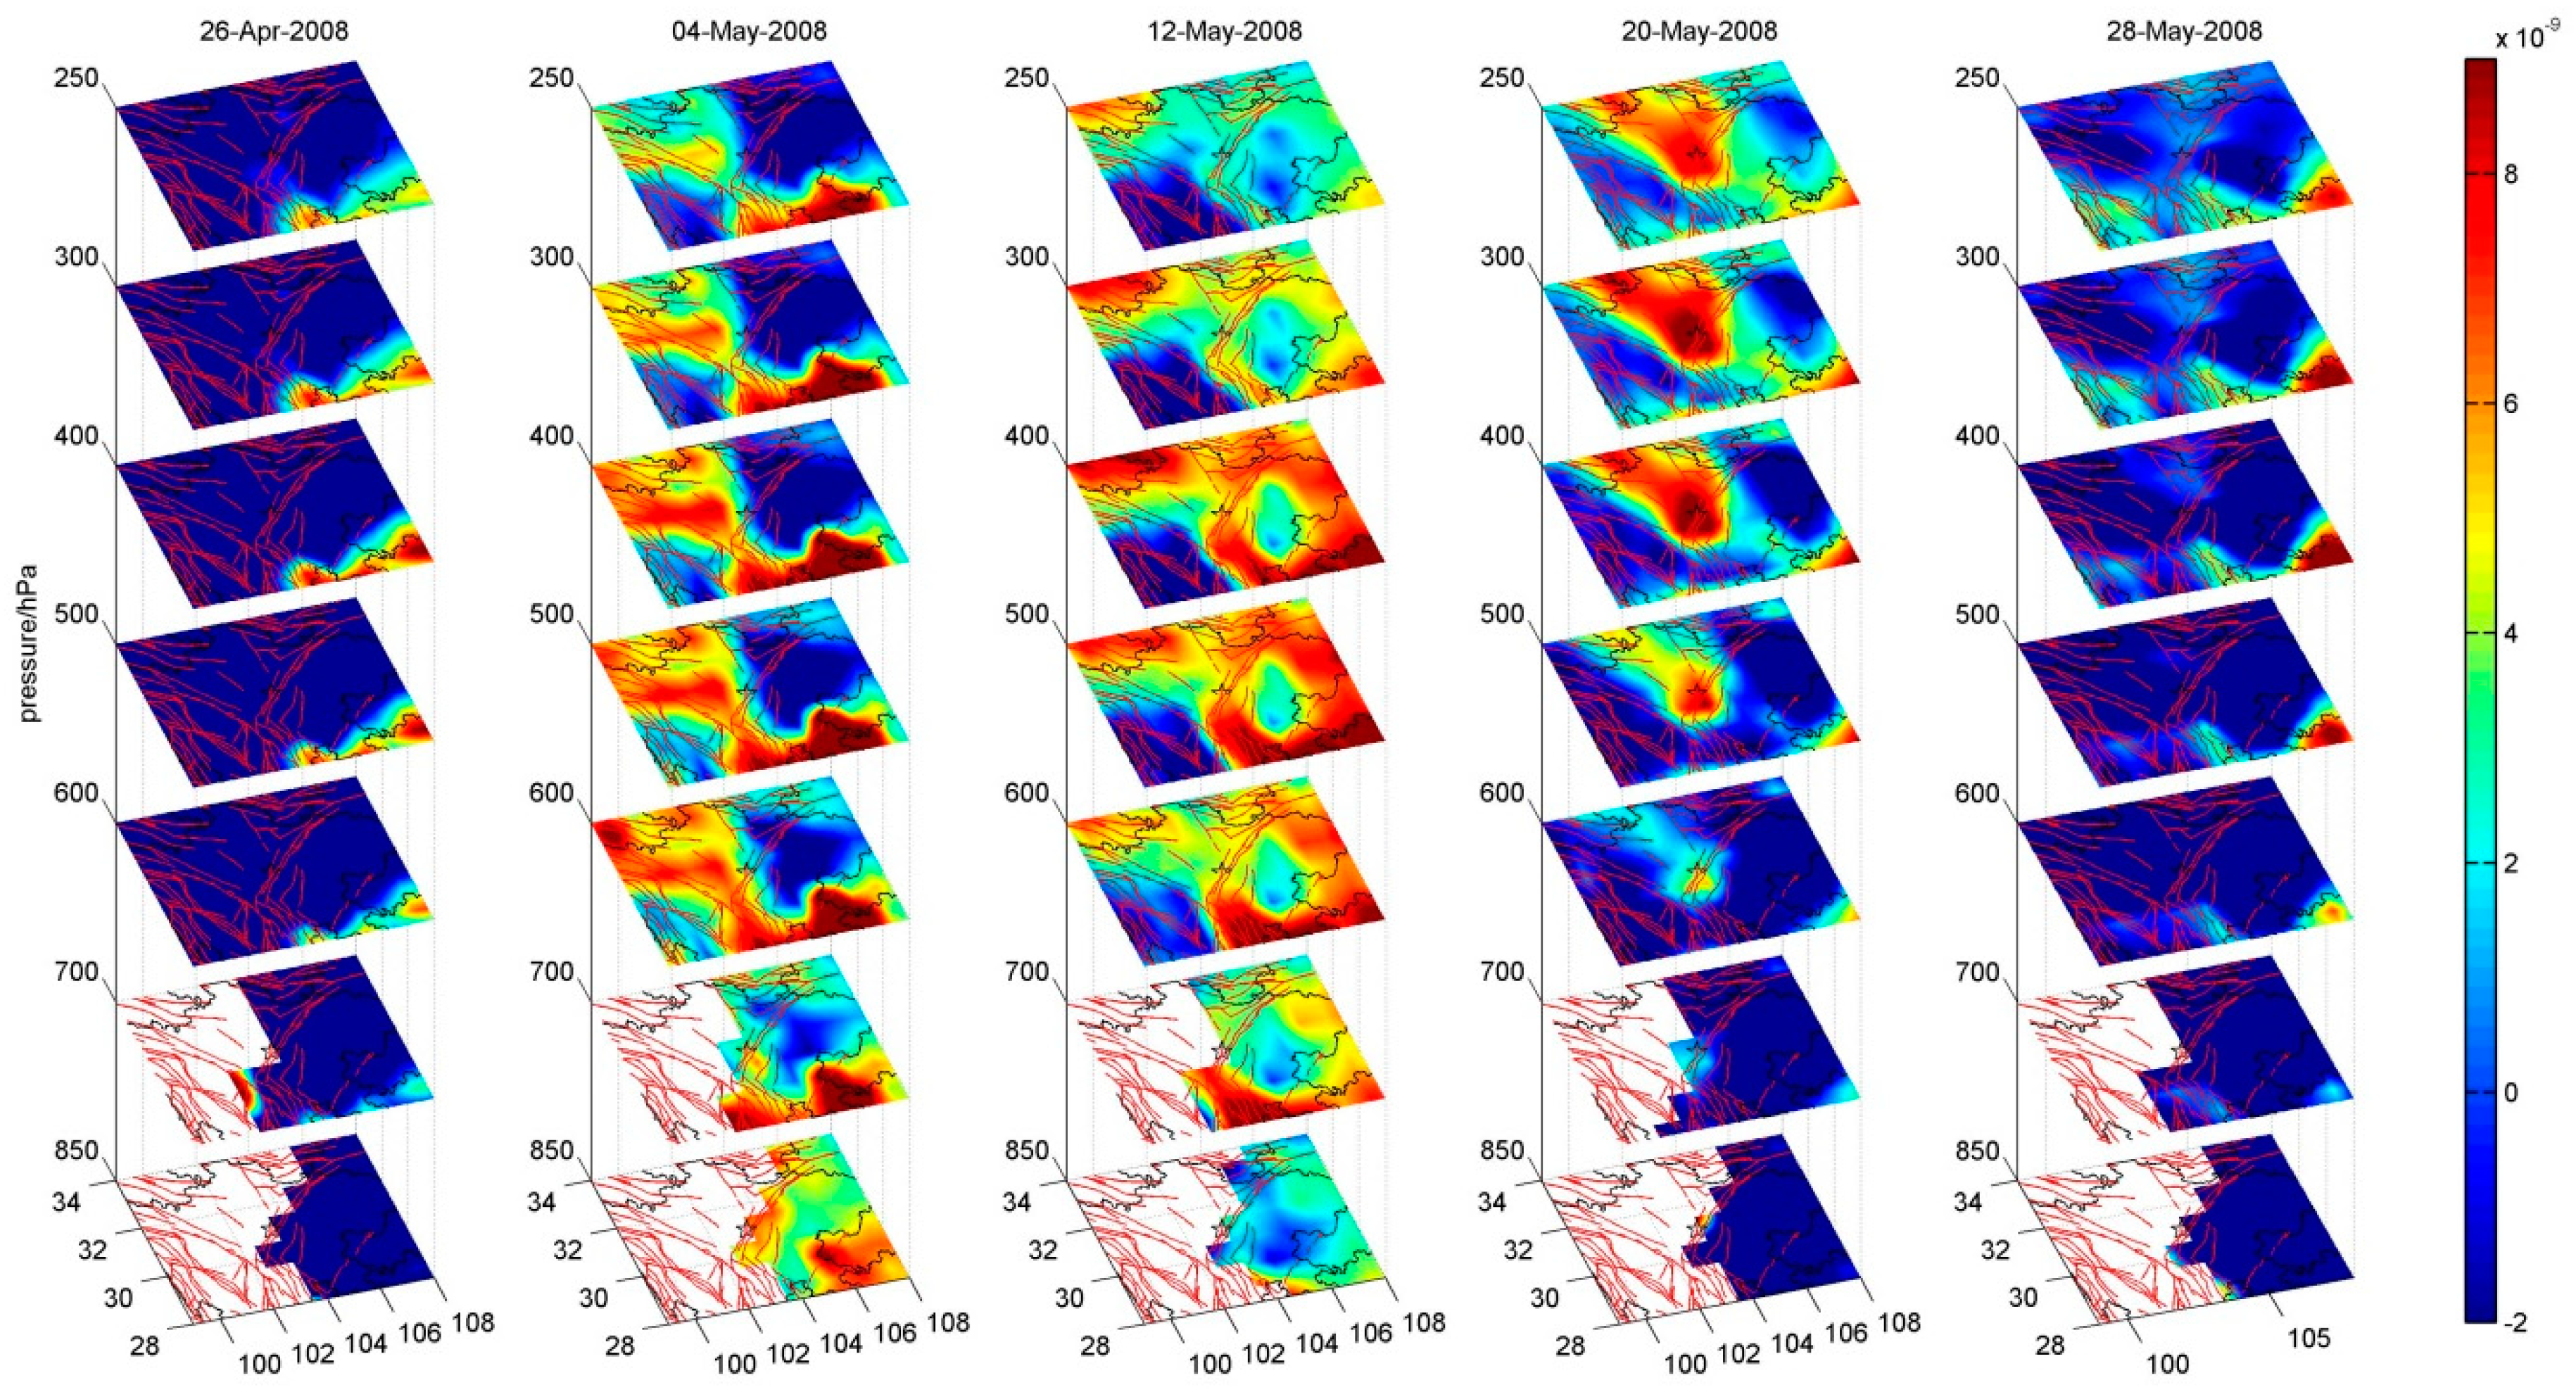
3.1. CO Variations Associated with Wenchuan MS 8.0 Earthquake
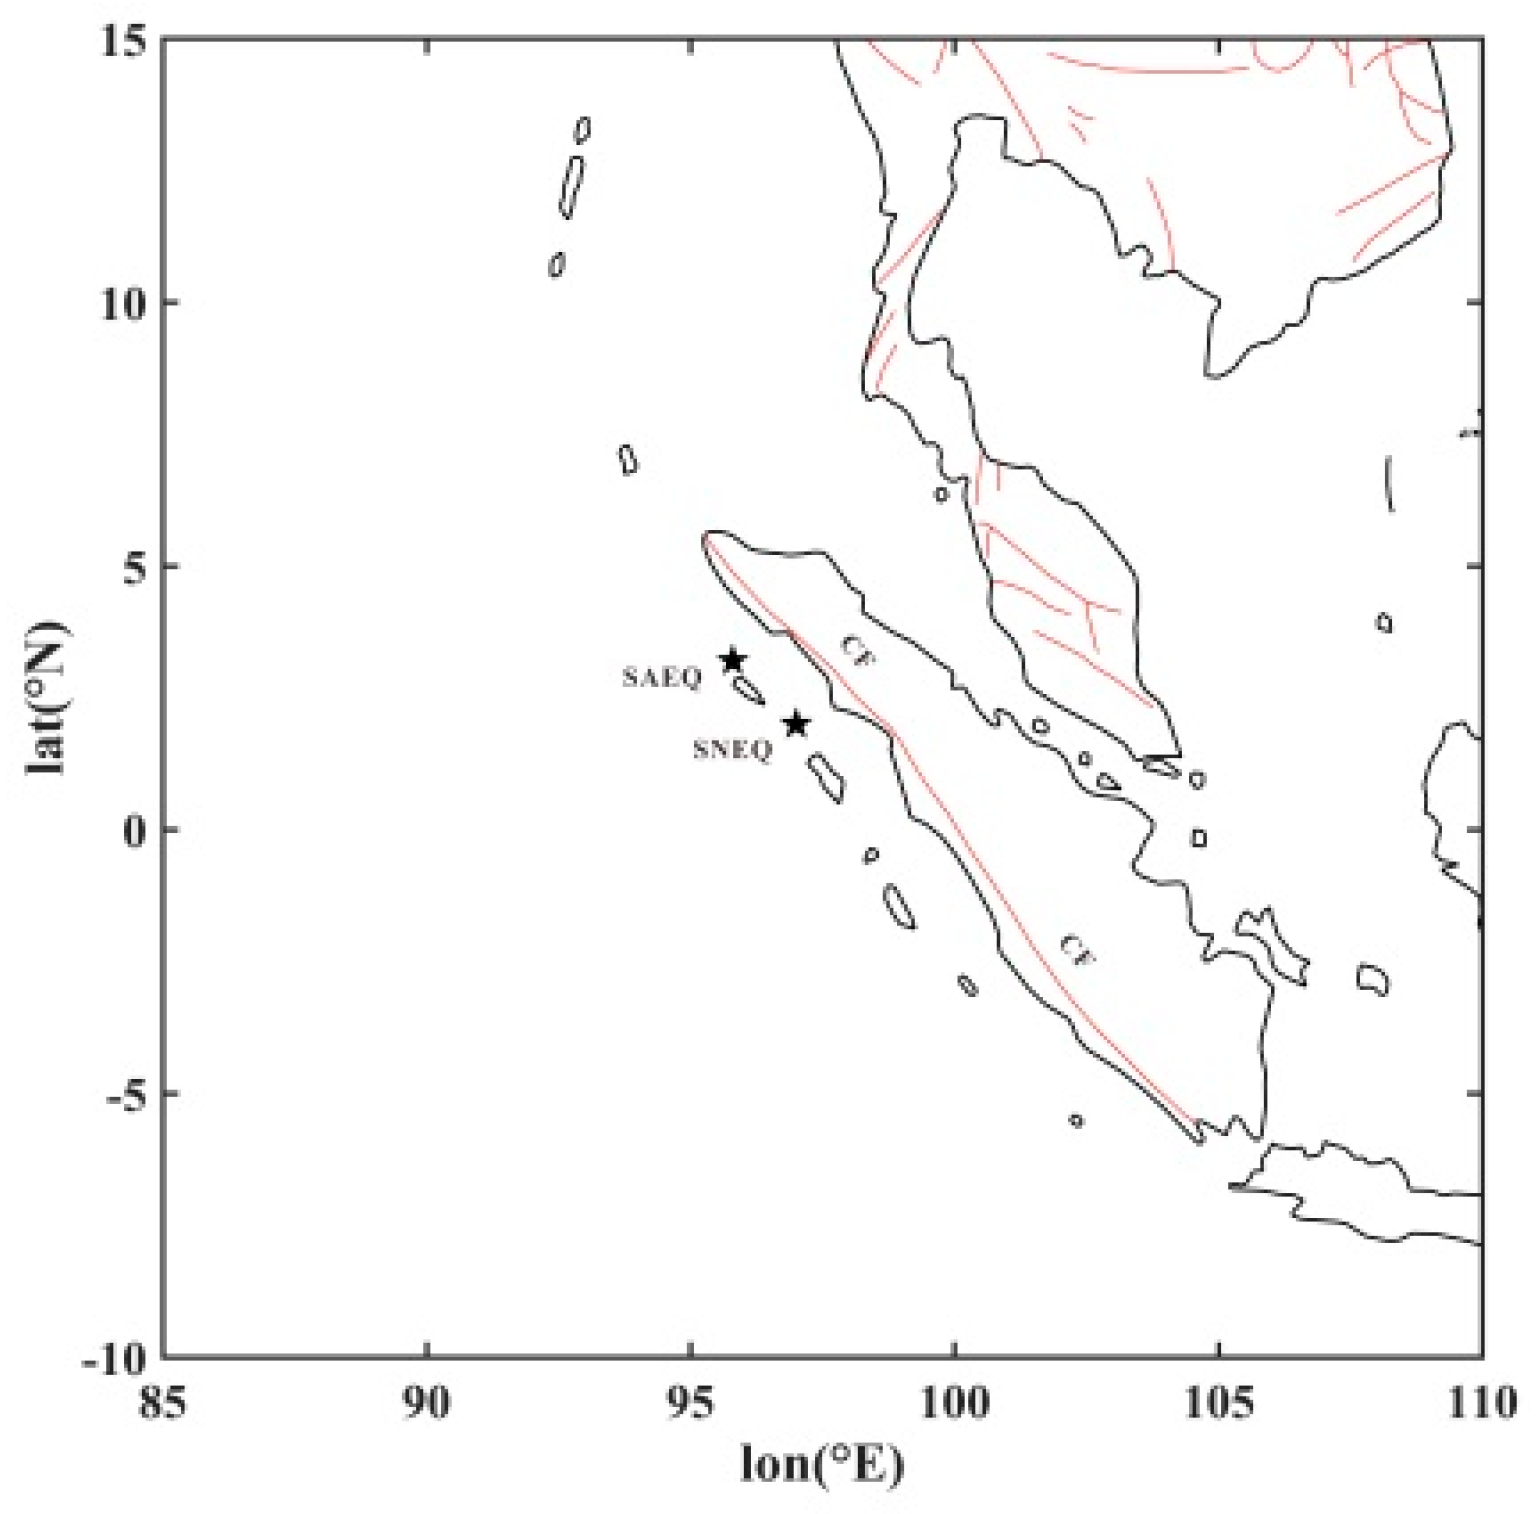
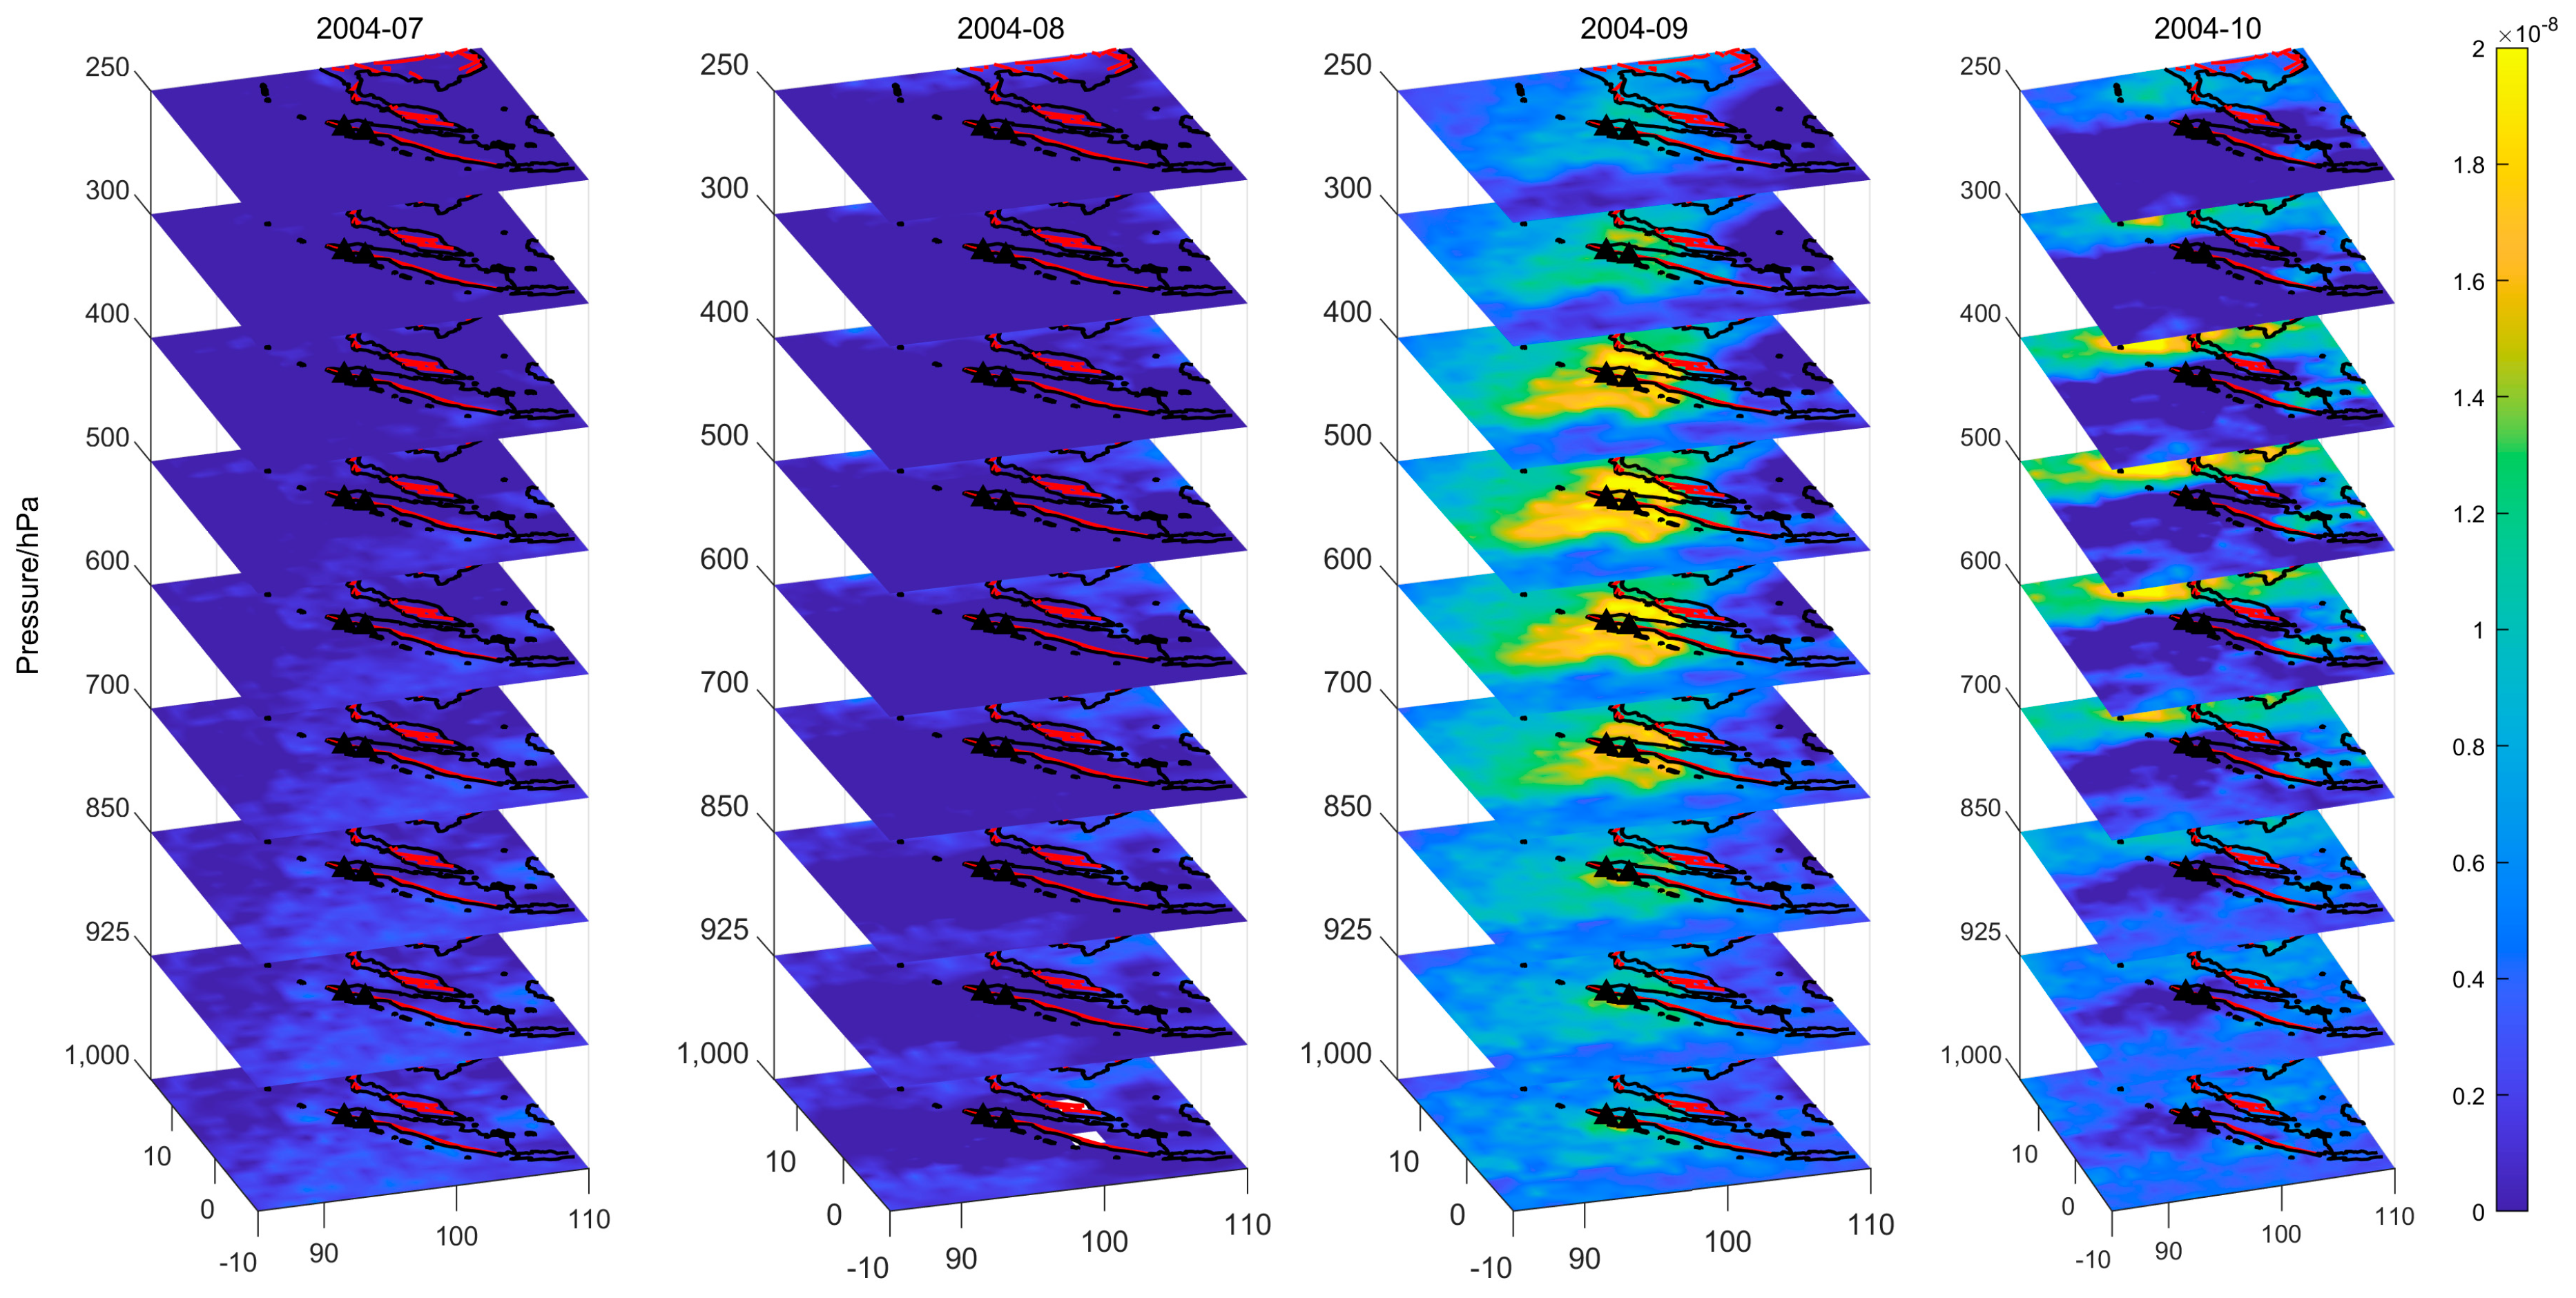
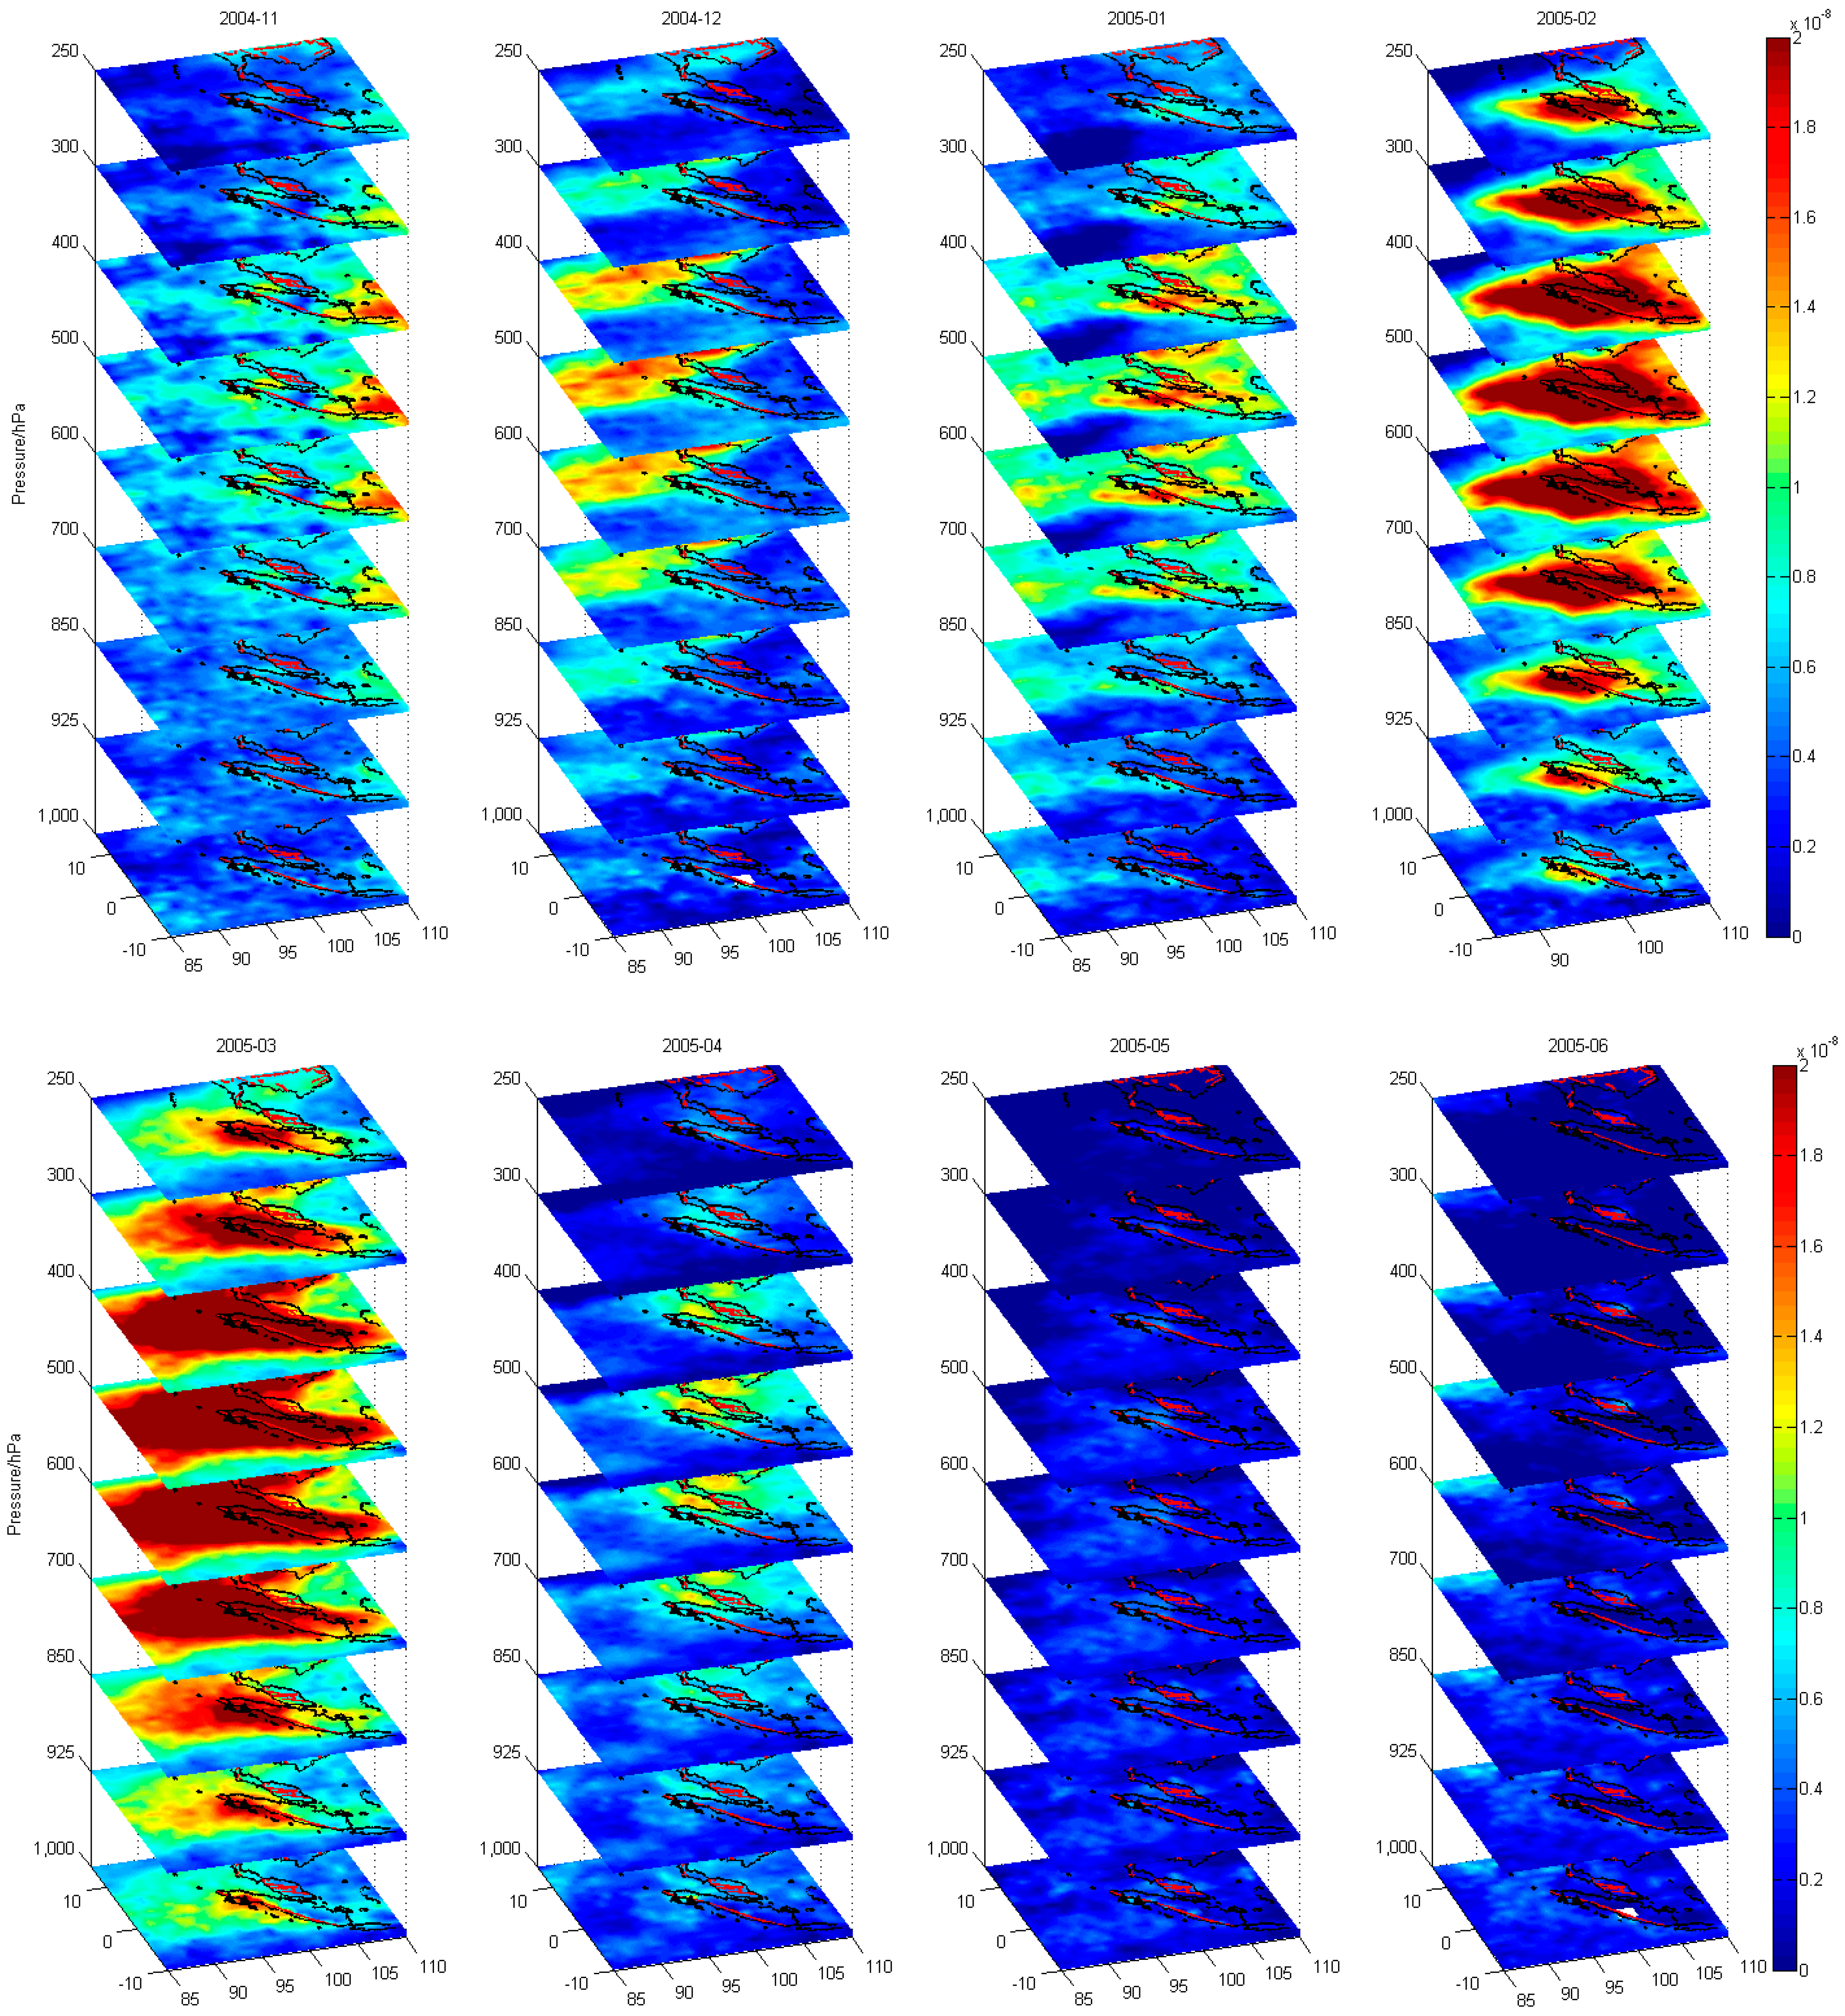
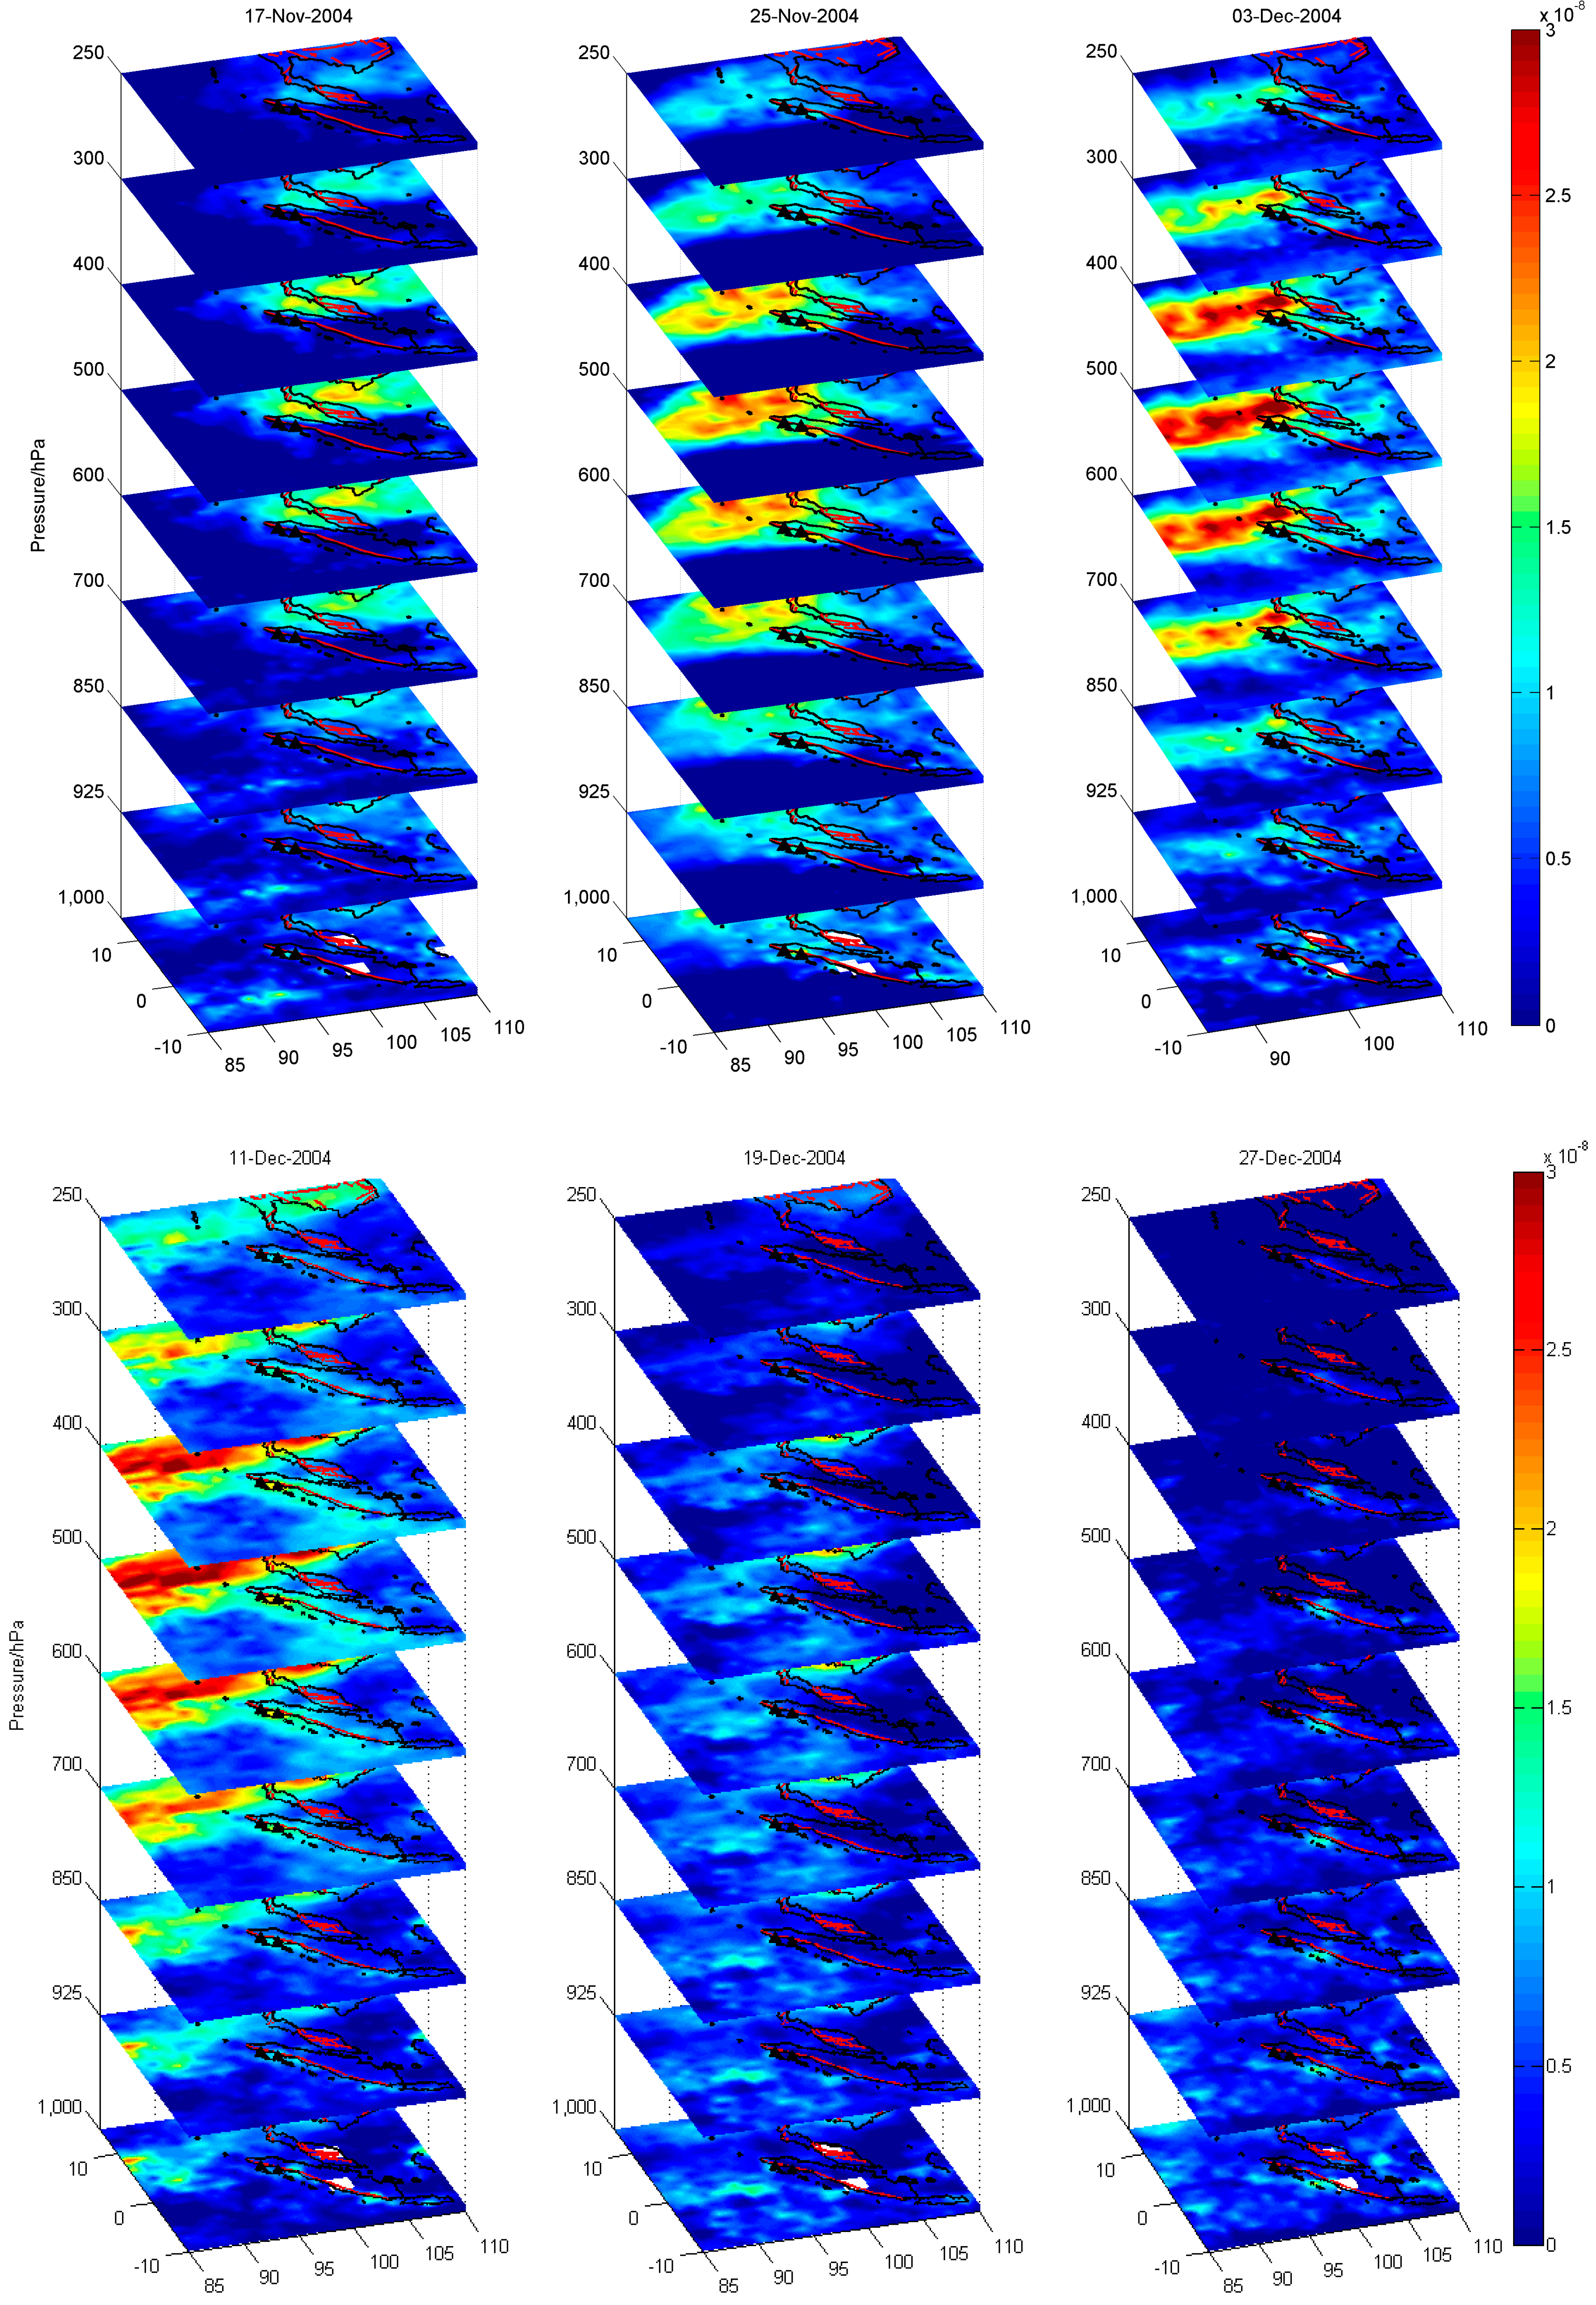
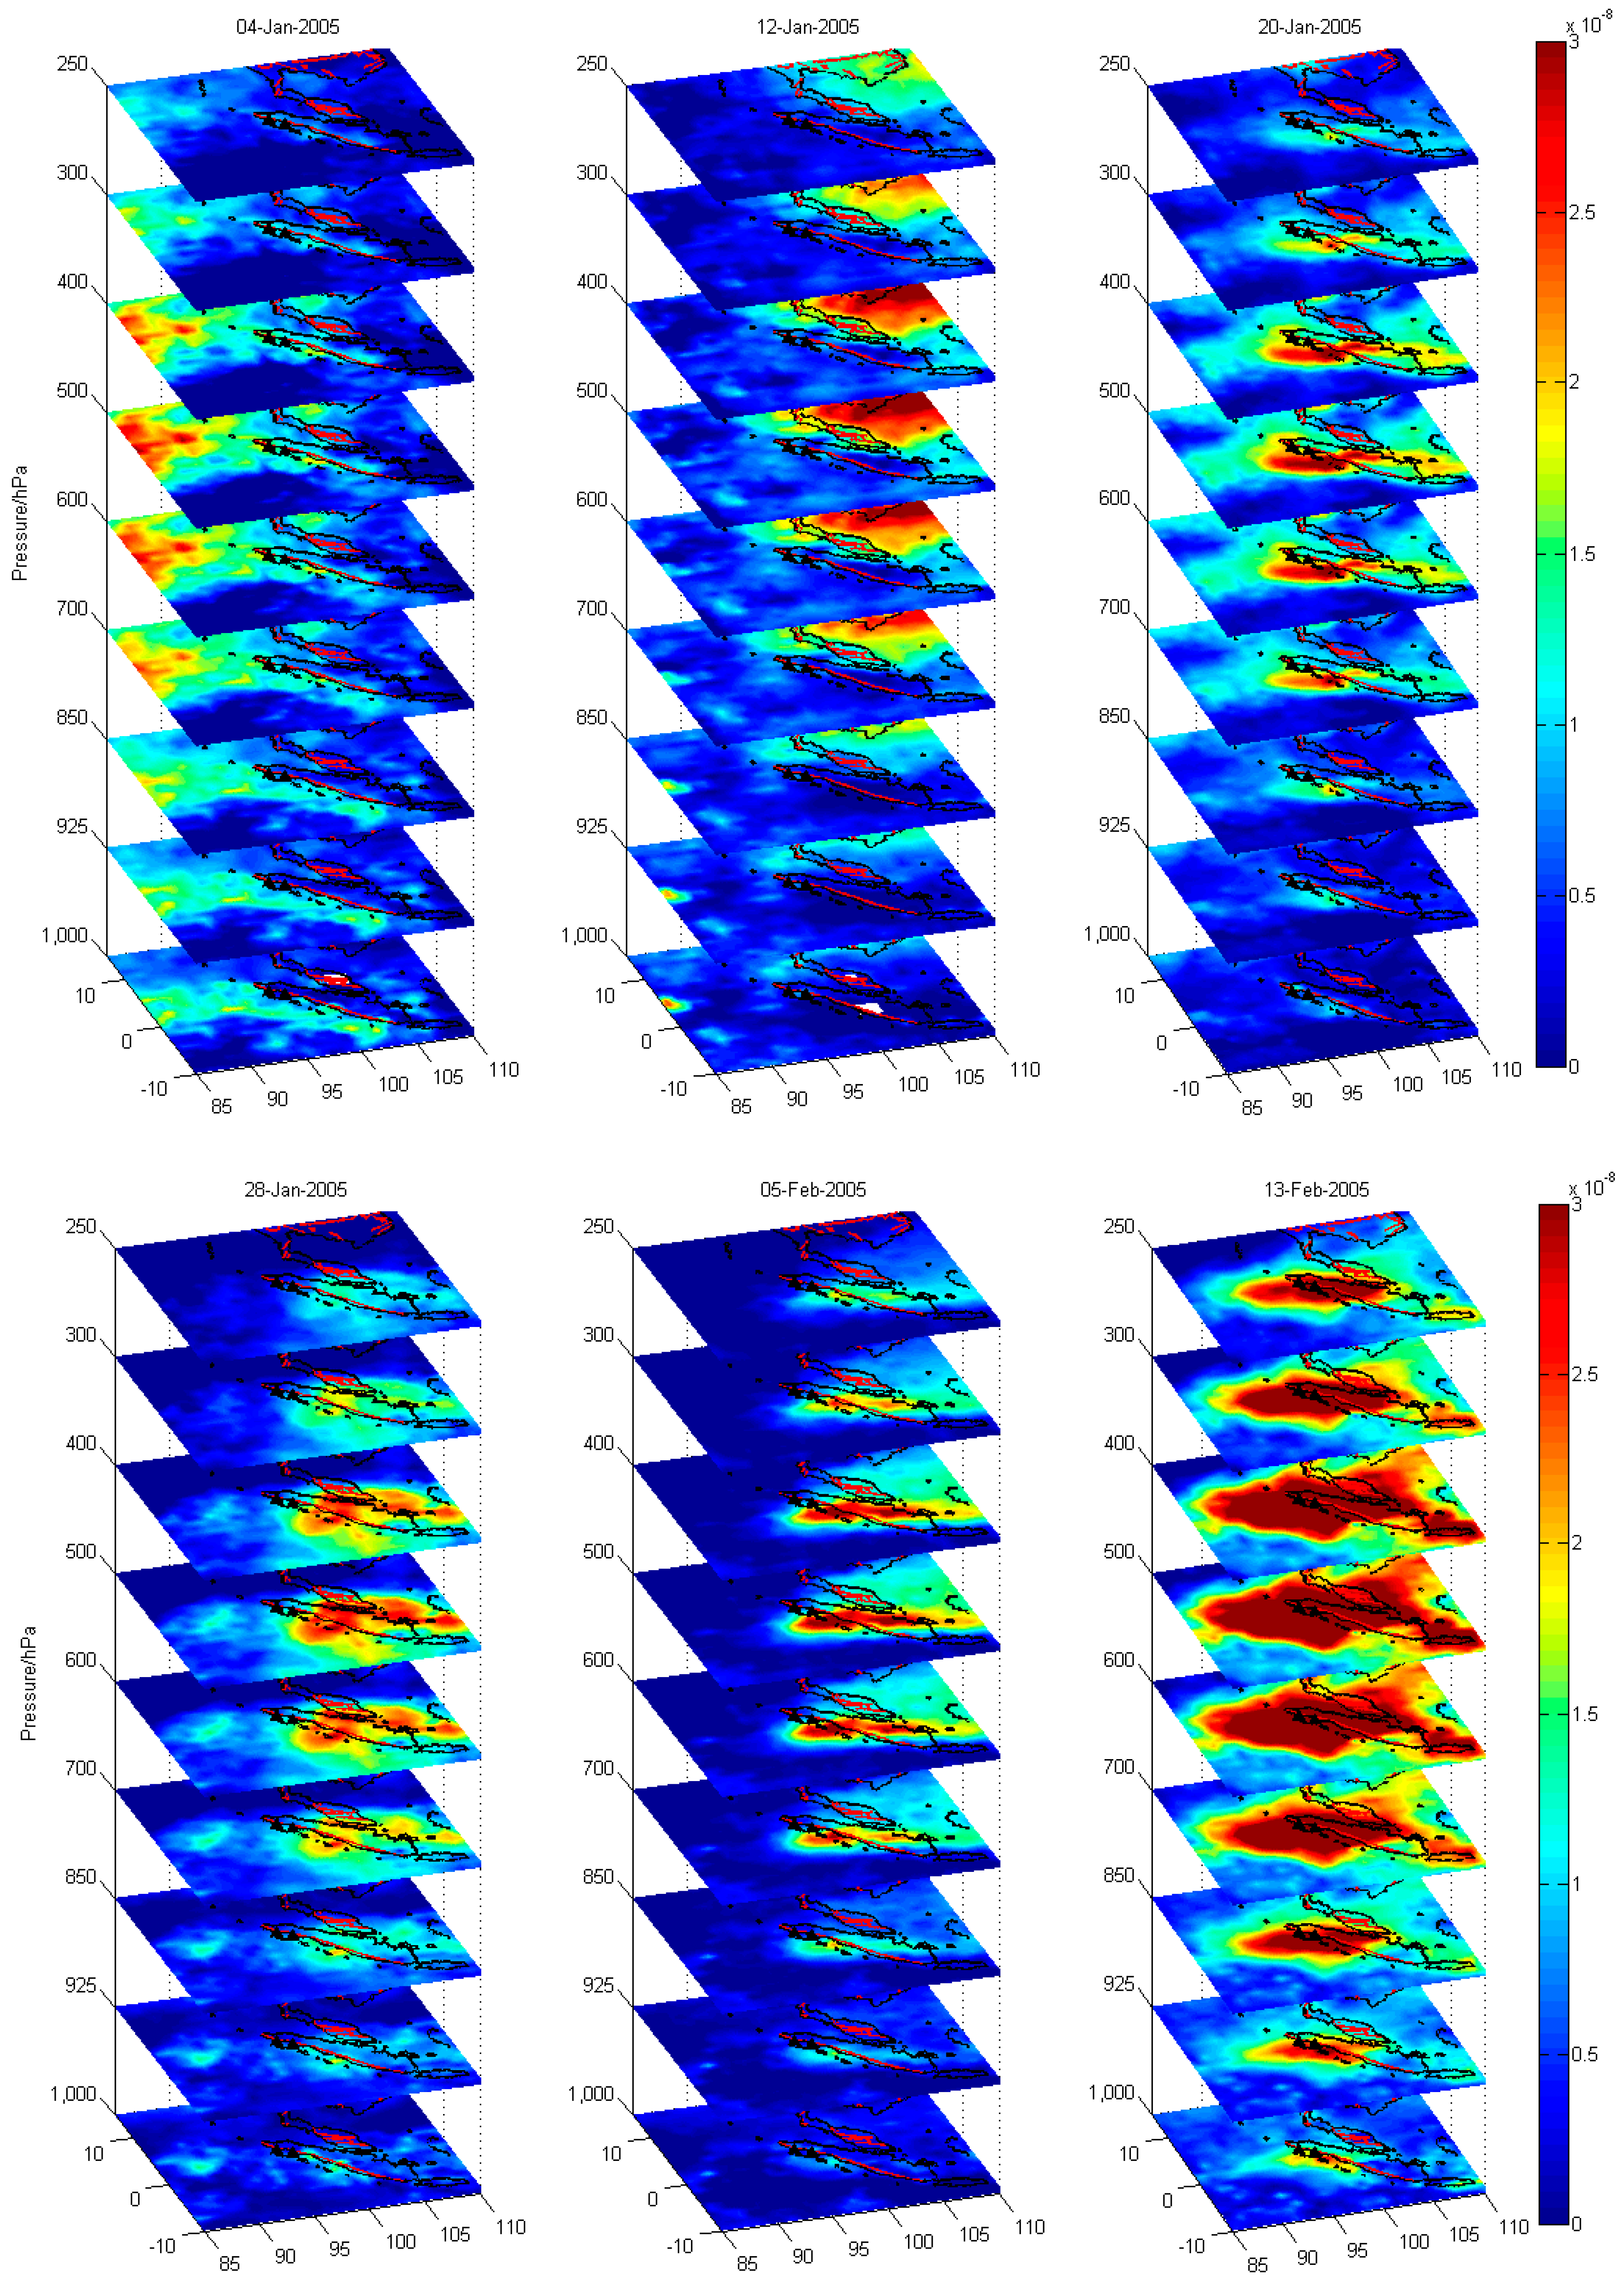
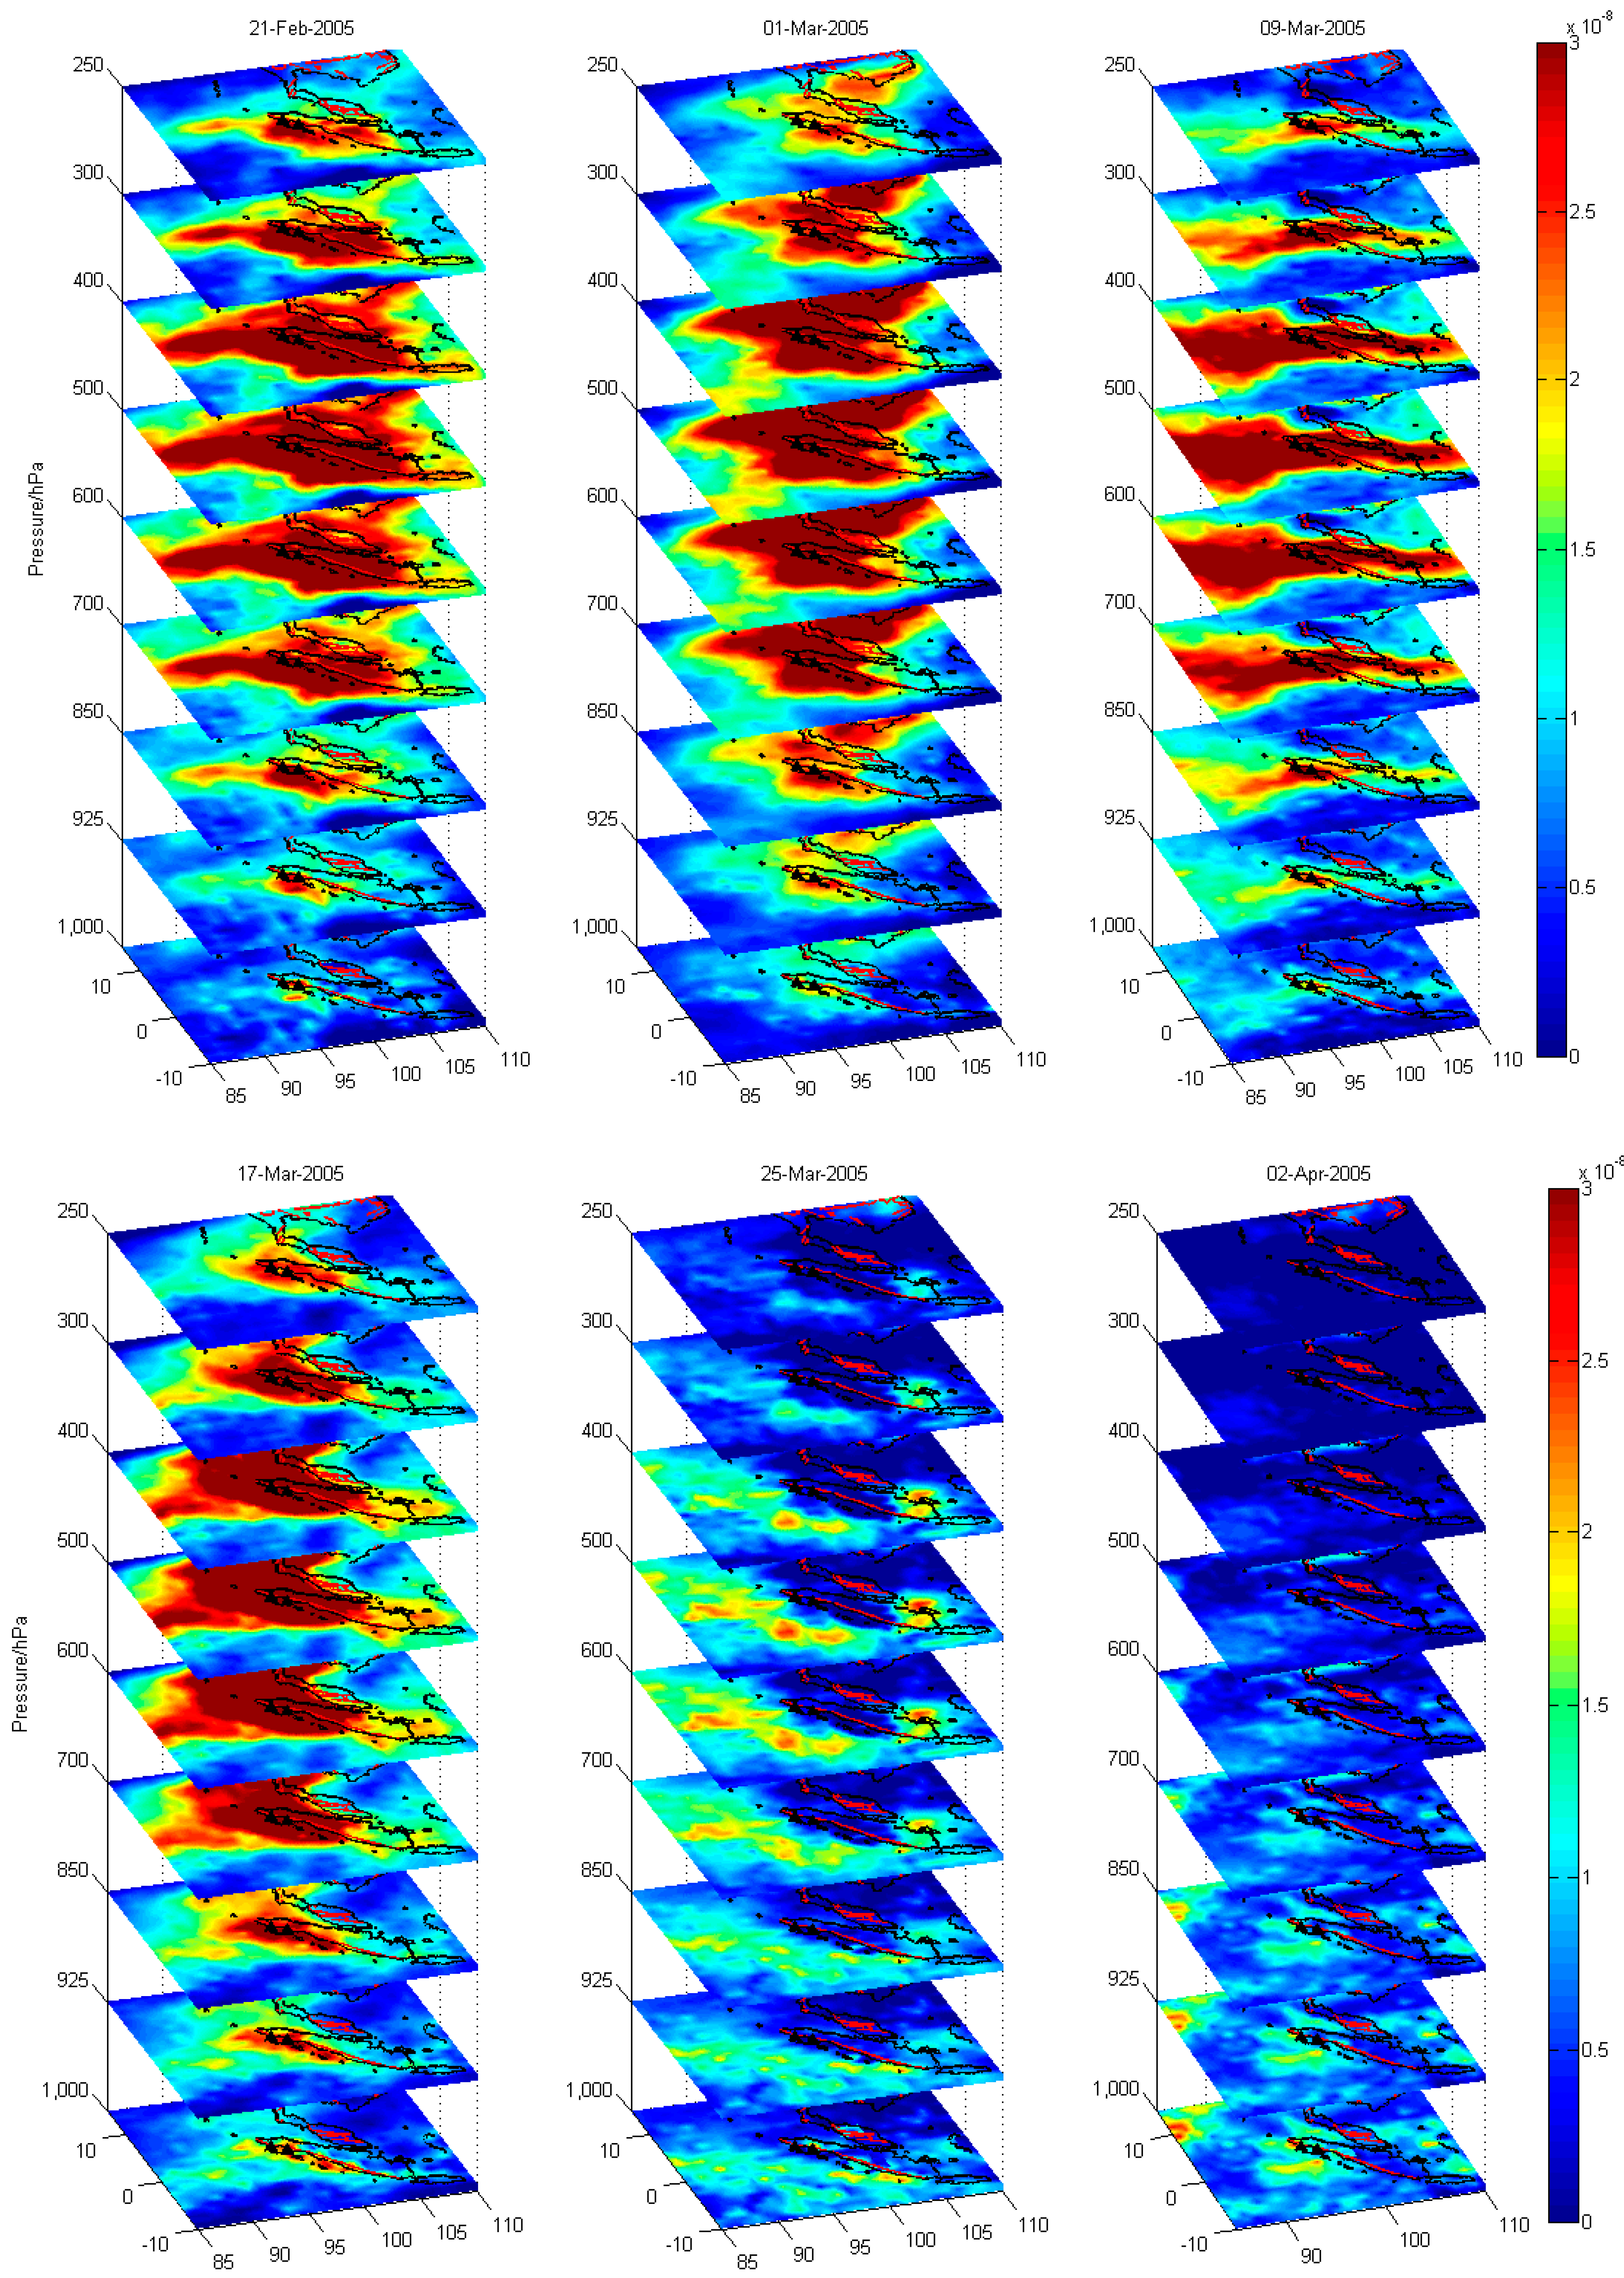
3.2. CO Variations Associated with Sumatra-Andaman MW 9.1 and Sumatra-Nias MW 8.6 Earthquakes

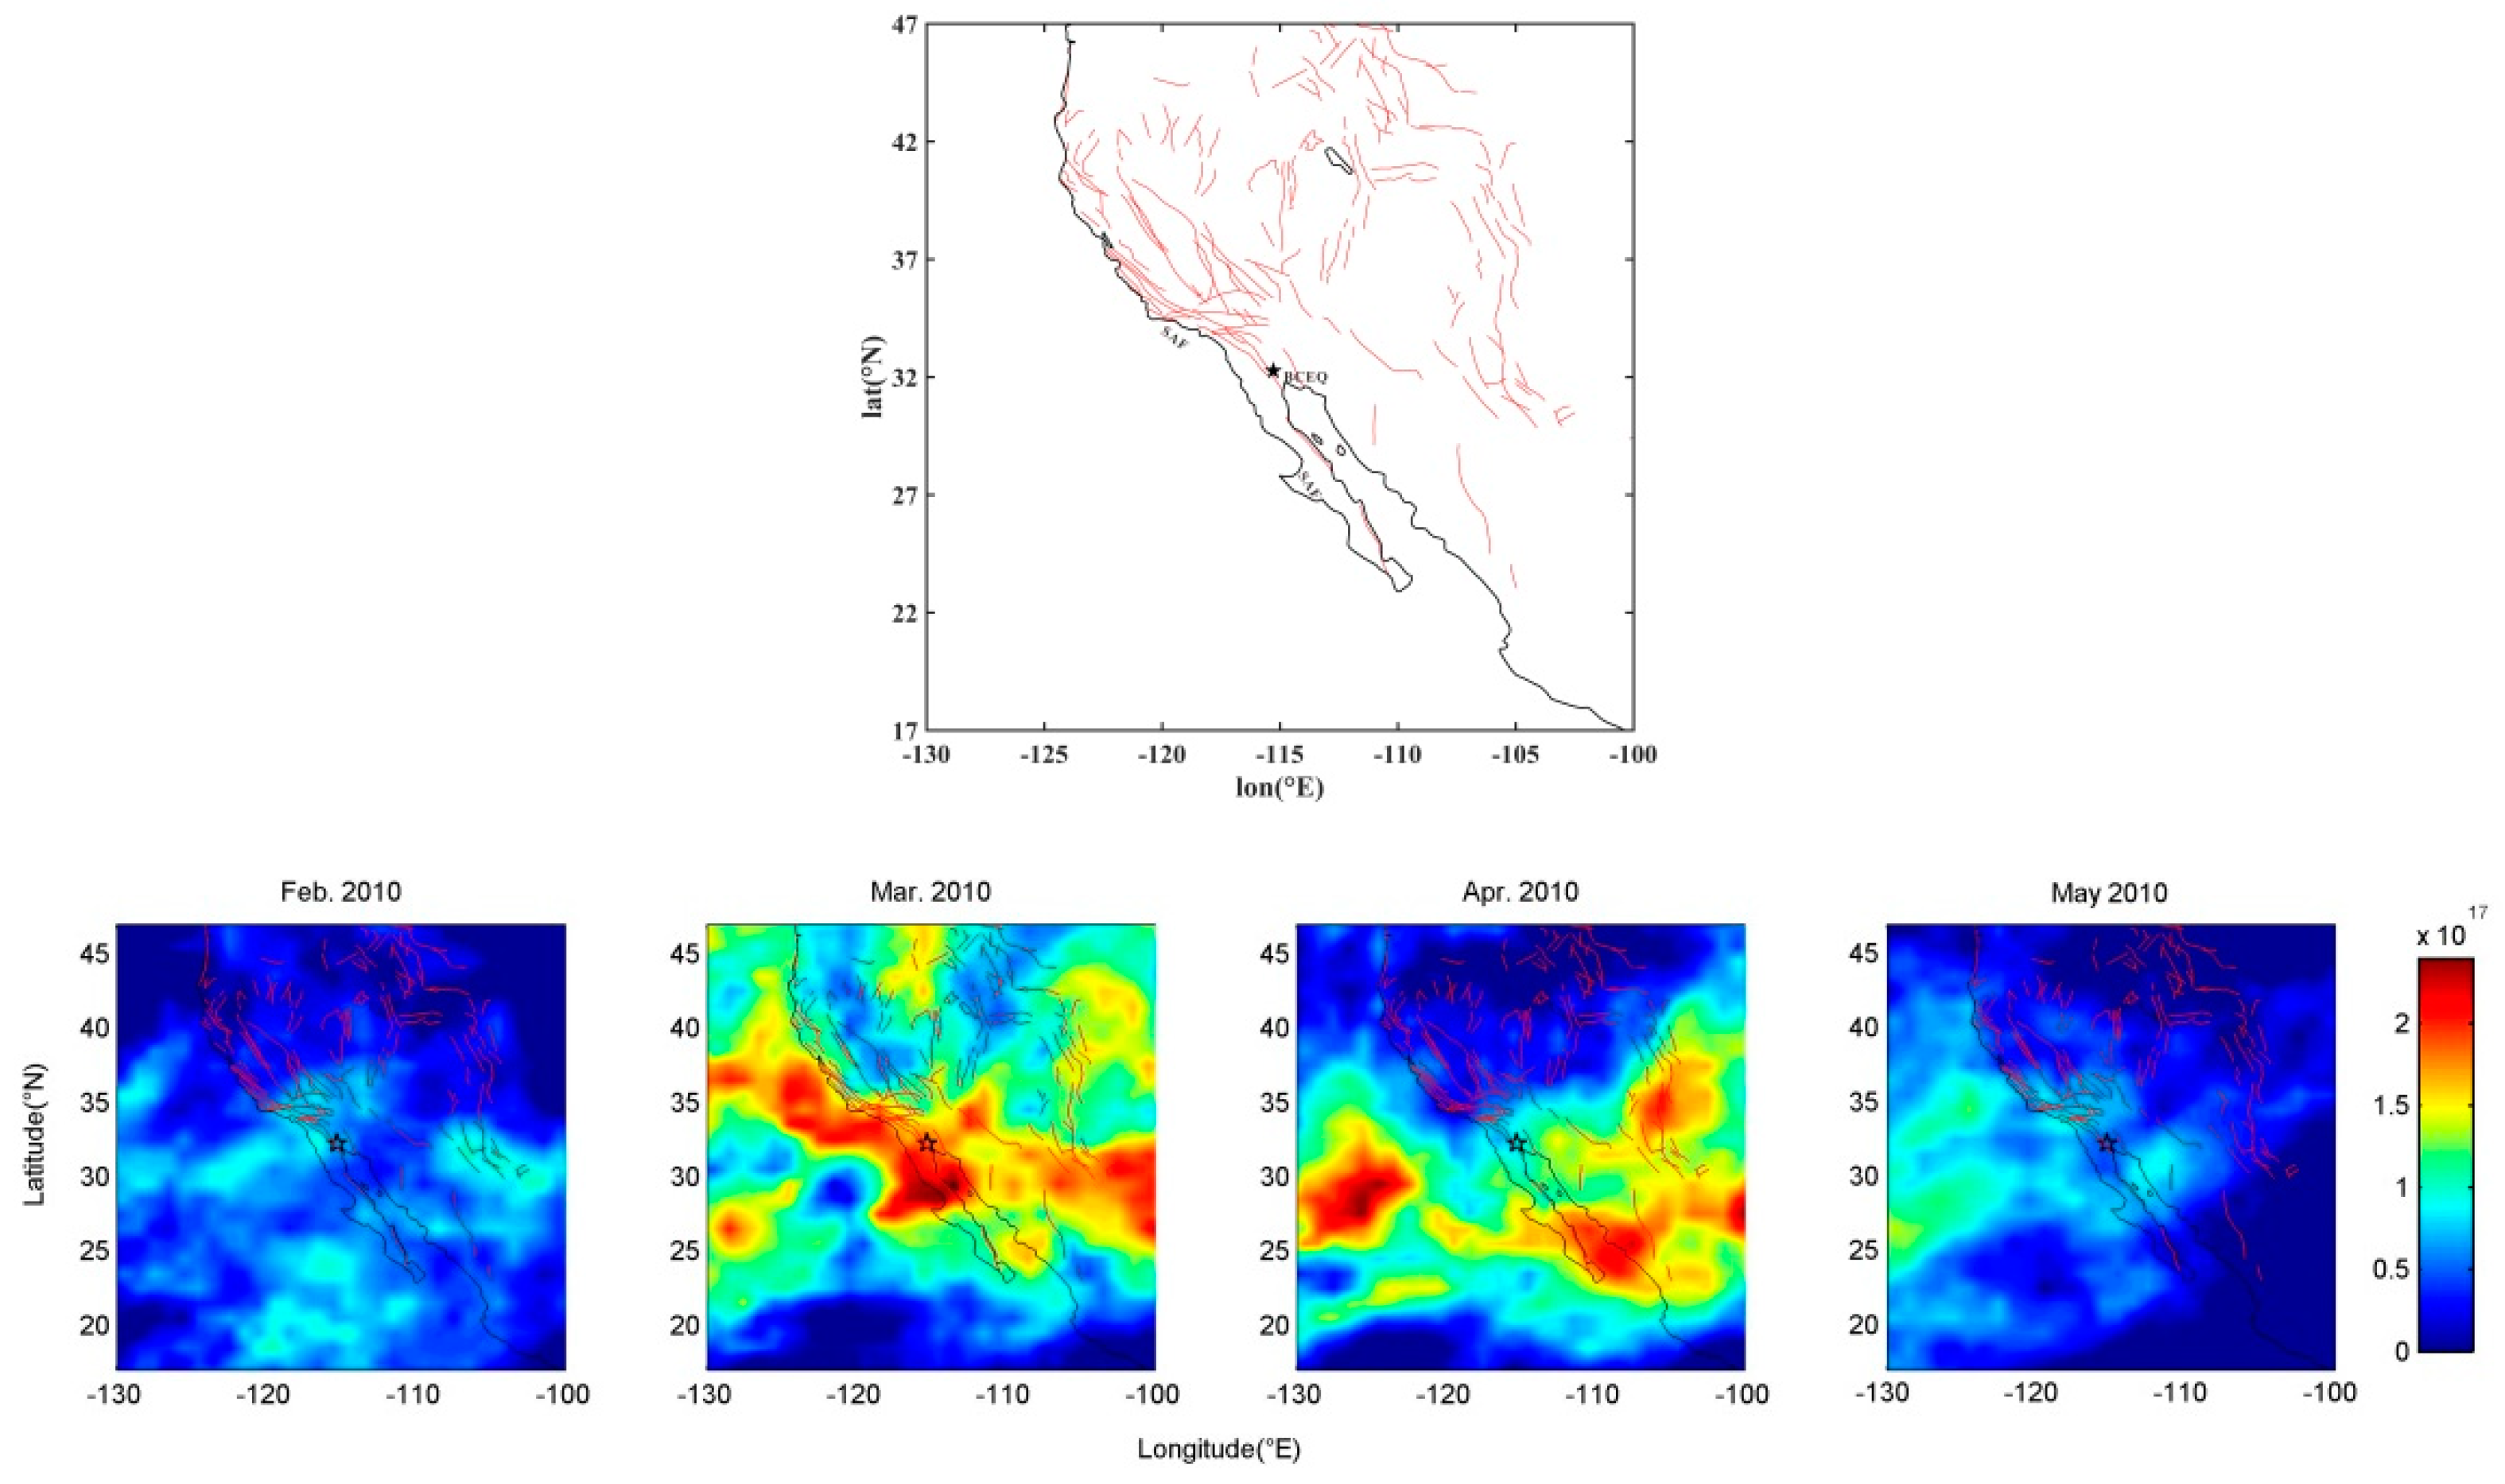
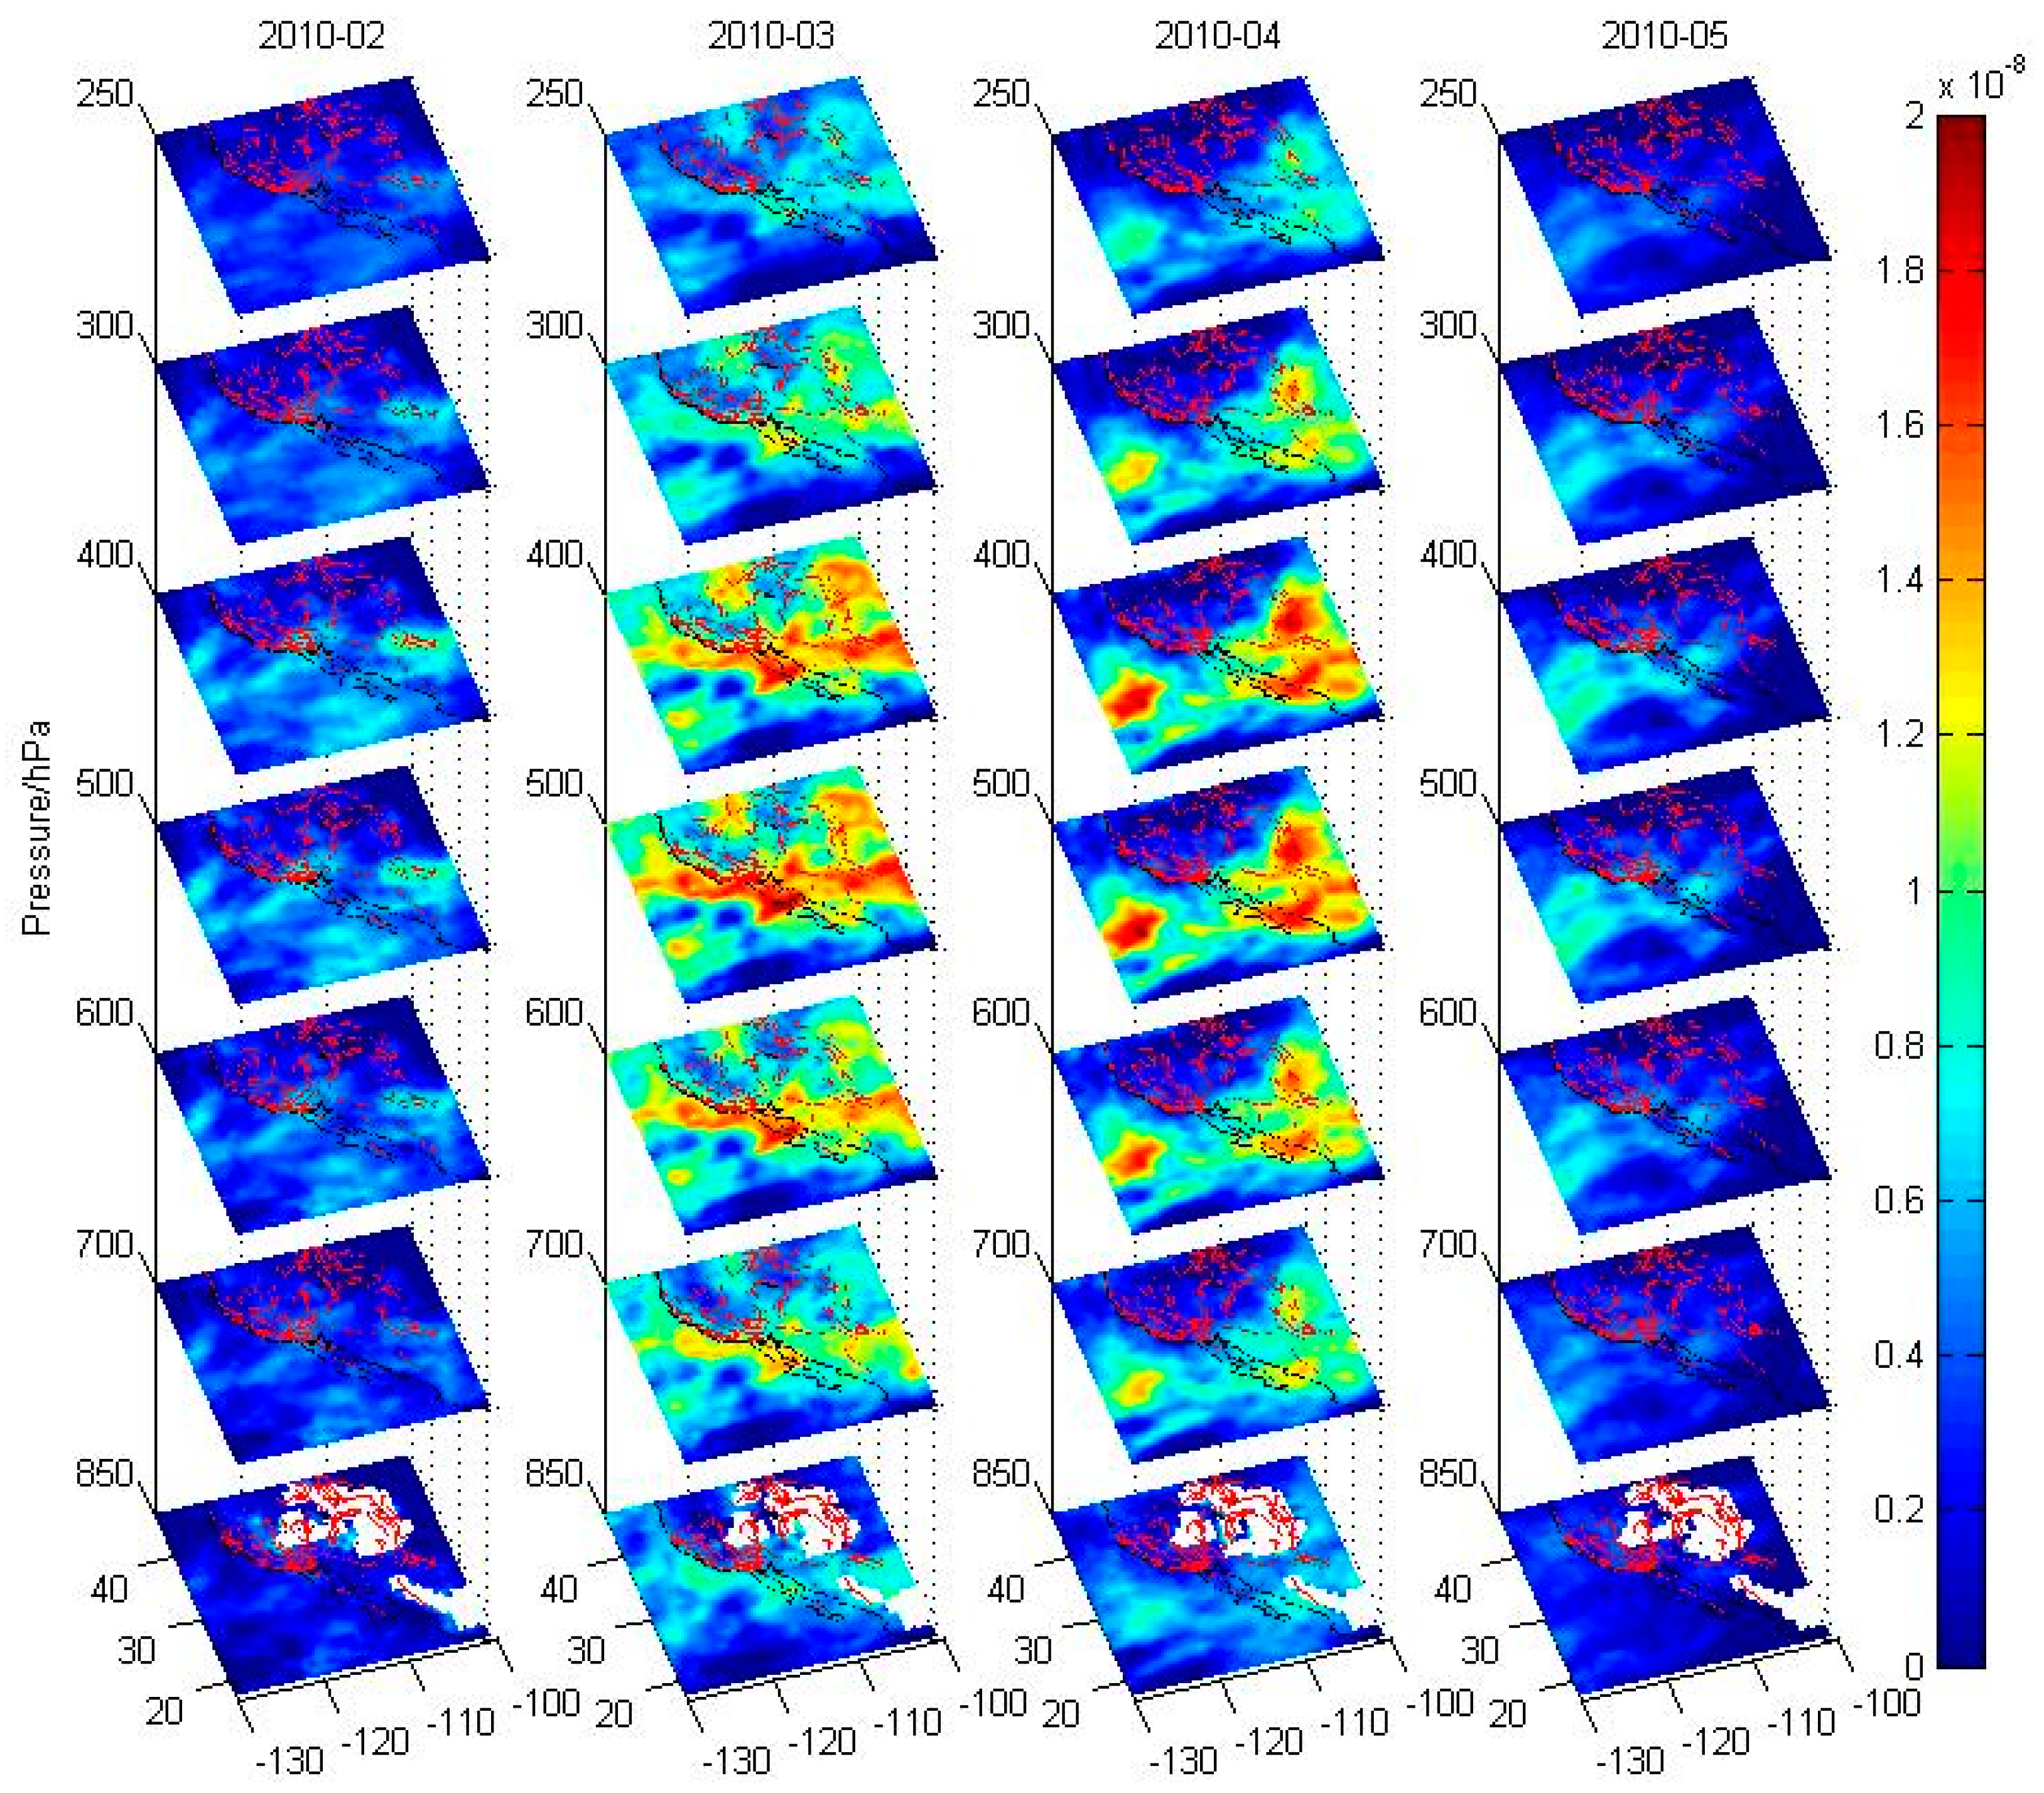
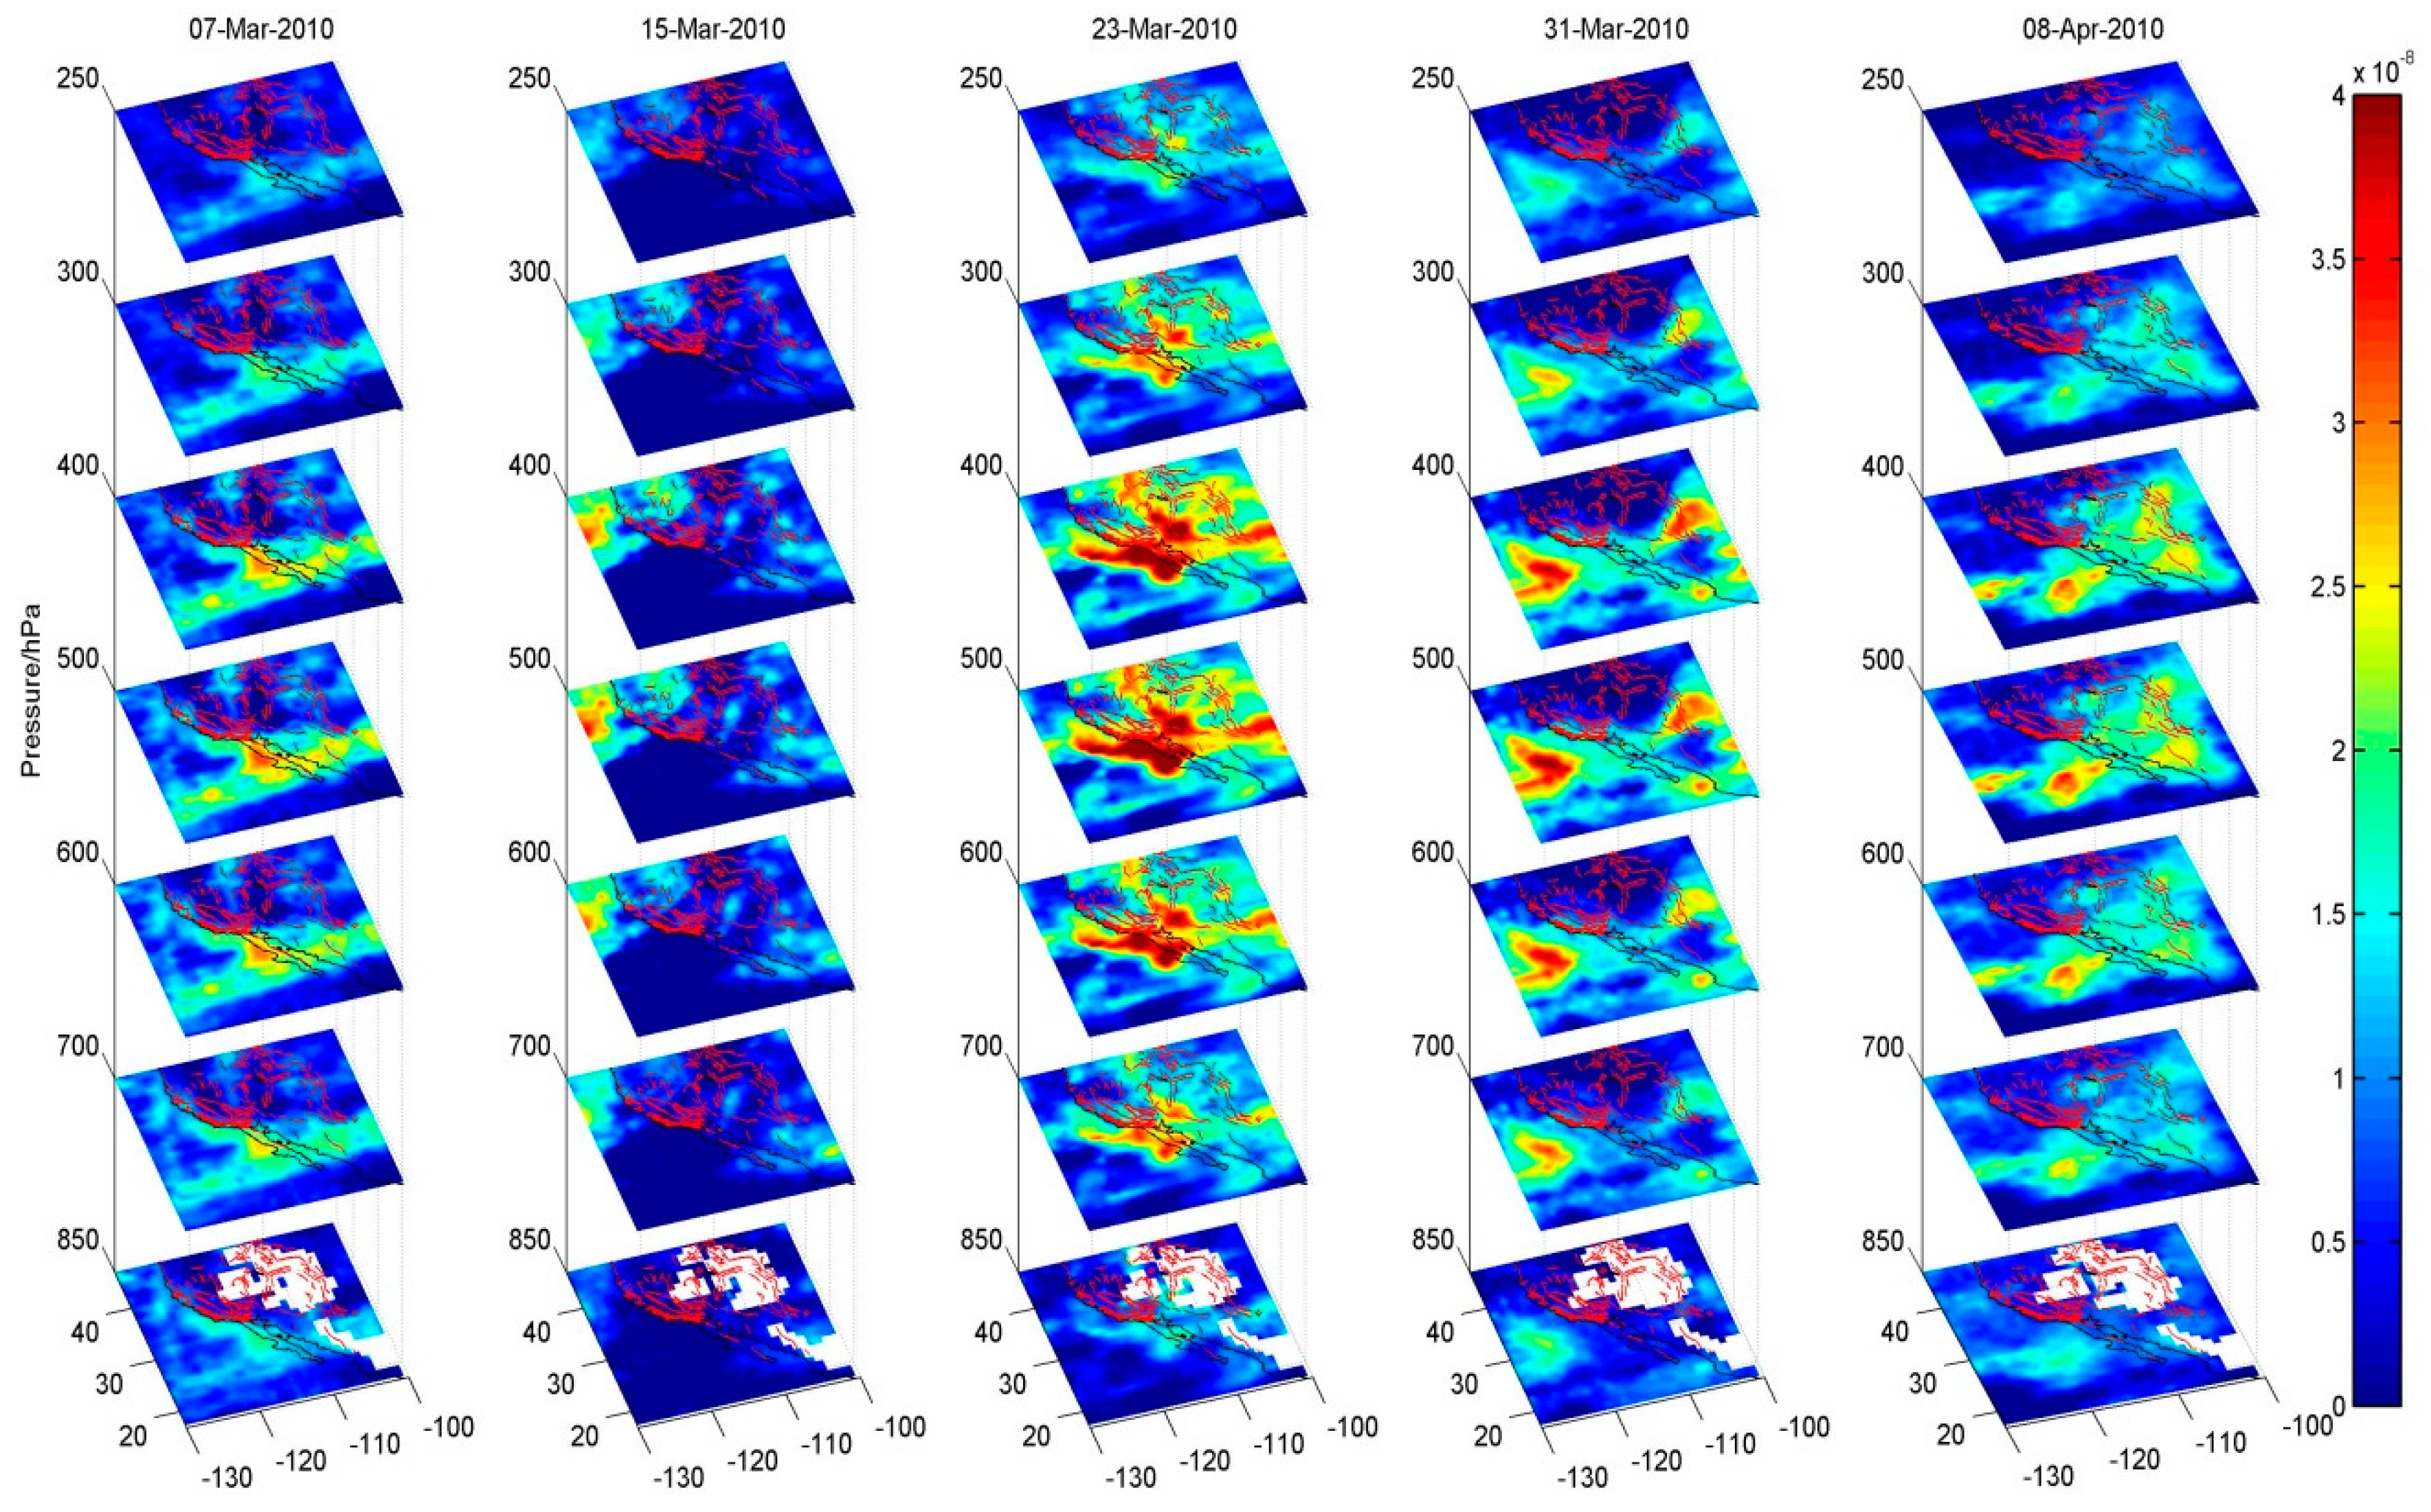
3.3. CO Variations Associated with Baja California MW 7.2 Earthquake
4. Discussions

| Time | Location | Coordinate | Magnitude MW | Tectonic Setting | Fault Type | Rupture Length km | Temporal Features | Intensity Max | Spatial Features | Tectonic Illustrations | ||
|---|---|---|---|---|---|---|---|---|---|---|---|---|
| Area/km | Time of Occurrence * | Duration | TotCO | |||||||||
| CO VMR | ||||||||||||
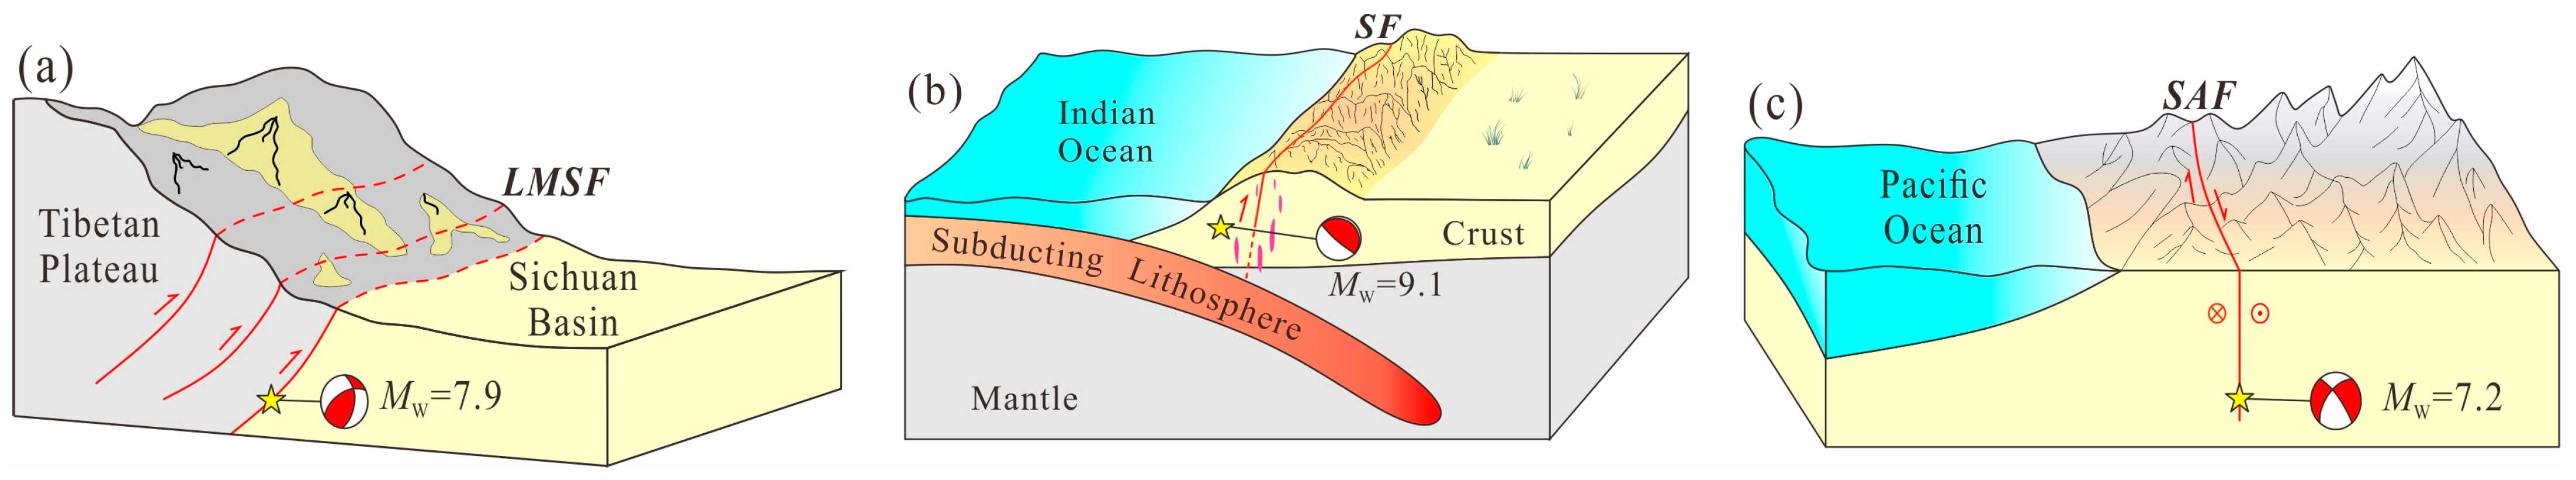
| 12 May 2008 | Wenchuan | 31.002°N, 103.322°E | 7.9 | compressional/internal continental | reverse | ~300 | 100 × 150 | −1 w~+1 w | 2 w | 8 ppb | mass-shaped /strip-shaped | Figure 10a [26,27,28] |
| mass-shaped /strip-shaped | ||||||||||||
| 26 December 2004 | Sumatra-Andaman | 3.295°N, 95.982°E | 9.1 | compressional /subduction/island | thrust and strike-slip | ~1200 | 2000 × 2000 | −3 m~+4 m | 8 m | 30 ppb | mass-shaped | Figure 10b [29,30,31] |
| mass-shaped /strip-shaped | ||||||||||||
| 4 April 2010 | Baja California | 32.286°N, 115.295°W | 7.2 | extensional/sea-land interface | strike-slip | ~75 | 500 × 1500 | −1 m~+1 w | 5 w | 20 ppb | strip-shaped/scatter-shaped | Figure 10c [32,33,34] |
| strip-shaped/scatter-shaped | ||||||||||||
5. Conclusions
Author Contributions
Funding
Data Availability Statement
Acknowledgments
Conflicts of Interest
References
- Irwin, W.P.; Barnes, I. Tectonic relations of carbon dioxide discharges and earthquakes. J. Geophys. Res. Solid Earth. 1980, 85, 3115–3121. [Google Scholar] [CrossRef]
- Toutain, J.P.; Baubron, J.C. Gas geochemistry and seismotectonics: A review. Tectonophysics 1999, 304, 12227. [Google Scholar] [CrossRef]
- Chiodini, G.; Cardellini, C.; Amato, A.; Boschi, E.; Ventura, G. Carbon dioxide Earth degassing and seismogenesis in central and southern Italy. Geophys. Res. Lett. 2004, 31, L07615. [Google Scholar] [CrossRef]
- Yang, T.F.; Walia, V.; Chyi, L.L. Variations of soil radon and thoron concentrations in a fault zone and prospective earthquakes in SW Taiwan. Radiation Measur. 2005, 40, 496–502. [Google Scholar] [CrossRef]
- Famin, V.; Nakashima, S.; Boullier, A.; Fujimoto, K.; Hirono, T. Earthquakes produce carbon dioxide in crustal faults. Earth Planetary Sci. Lett. 2008, 265, 487–497. [Google Scholar] [CrossRef]
- Zhou, X.C.; Chen, Z.; Cui, Y.J. Environmental impact of CO2, Rn, Hg degassing from the rupture zones produced by Wenchuan MS 8.0 earthquake in western Sichuan, China. Environ. Geochem. Health 2015, 38, 1067–1068. [Google Scholar] [CrossRef]
- Cui, Y.J.; Li, Y.; Si, X.Y.; Yang, L.; Liu, Z.X.; Sun, F.X.; Li, X.Y.; Zheng, H.W.; Du, J.G. Tectonic controls on near-surface variations in CH4 and CO2 concentrations along the northwestern margin of the Ordos Block, China. Geofluids 2019, 2019, 7909483. [Google Scholar] [CrossRef]
- Sun, Y.T.; Zhou, X.C.; Du, J.G.; Guo, Z.F. CO diffusive emission in the co-seismic rupture zone of the Wenchuan MS 8.0 earthquake. Geochem. J. 2020, 54, 91–104. [Google Scholar] [CrossRef]
- Li, Y.; Chen, Z.; Sun, A.H.; Liu, Z.F.; Caracausi, A.; Martinelli, G.; Lu, C. Geochemical features and seismic imaging of the tectonic zone between the Tibetan Plateau and Ordos Block, central northern China. Chem. Geol. 2023, 622, 121386. [Google Scholar] [CrossRef]
- Yang, Y.; Li, Y.; Li, Y.G.; Ji, L.Y.; Gong, Y.; Du, F.; Zhang, L.; Chen, Z. Present-Day Activity of the Anninghe Fault and Zemuhe Fault, Southeastern Tibetan Plateau, Derived from Soil Gas CO2 Emissions and Locking Degree. Earth Space Sci. 2021, 8, e2020EA001607. [Google Scholar] [CrossRef]
- Tronin, A.A. Remote sensing and earthquakes: A review. Phys. Chem. Earth Parts A/B/C 2006, 31, 138–142. [Google Scholar] [CrossRef]
- Ganguly, N.D. Variation in atmospheric ozone concentration following strong earthquakes. Int. J. Remote Sens. 2009, 30, 349–356. [Google Scholar] [CrossRef]
- Singh, R.P.; Kumar, J.S.; Zlotnicki, J.; Kafatos, M. Satellite detection of carbon monoxide emission prior to the Gujarat earthquake of 26 January 2001. Appl. Geochem. 2010, 25, 580–585. [Google Scholar] [CrossRef]
- Cui, Y.J.; Du, J.G.; Zhang, D.H.; Sun, Y.T. Anomalies of total column CO and O3 associated with great earthquakes in recent years. Nat. Hazards Earth Syst. Sci. 2013, 13, 1–7. [Google Scholar] [CrossRef]
- Cui, Y.J.; Du, J.G.; Wang, S.M.; Zhang, Y.; Li, X.Y.; Zou, Z.Y.; Jiang, L. Three-Dimensional Variations of Carbon Monoxide Concentration Associated with Wenchuan Earthquake Based on Airs Data. In Proceedings of the IGARSS 2020—2020 IEEE International Geoscience and Remote Sensing Symposium, Waikoloa, HI, USA, 26 September–2 October 2020; pp. 6615–6618. [Google Scholar]
- Cui, Y.J.; Ouzounov, D.; Hatzopoulos, N.; Sun, K.; Zou, Z.Y.; Du, J.G. Satellite observation of CH4 and CO and their abnormal variability associated with Wenchuan MS 8.0 and Lushan MS 7.0 earthquakes, in China. Chem. Geol. 2017, 469, 185–191. [Google Scholar] [CrossRef]
- Cui, Y.J.; Zheng, C.; Jiang, L.; Huang, J.N.; Sun, F.X.; Zou, Z.Y.; Du, J.G. Variations of multiple gaseous emissions associated with the great Sumatra earthquakes in 2004 and 2005. Chem. Geol. 2023, 618, 121311. [Google Scholar] [CrossRef]
- Geersen, J.; Scholz, F.; Linke, P.; Schmidt, M.; Lange, D.; Behrmann, J.H.; Volker, D.; Hensen, C. Fault zone controlled seafloor methane seepage in the rupture area of the 2010 Maule earthquake, Central Chile. Geochem. Geophys. Geosyst. 2016, 17, 4802–4813. [Google Scholar] [CrossRef]
- Jing, F.; Singh, R.P.; Shen, X.h. Land-Atmosphere-Meteorological coupling associated with the 2015 Gorkha (M 7.8) and Dolakha (M 7.3) Nepal earthquakes. Geomat. Nat. Hazards Risk. 2019, 10, 1267–1284. [Google Scholar] [CrossRef]
- Jing, F.; Singh, R.P. Changes in Tropospheric Ozone Associated with Strong Earthquakes and Possible Mechanism. IEEE J. Selected Topics Appl. Earth Obser. Remote Sens. 2021, 14, 5300–5310. [Google Scholar] [CrossRef]
- Jing, F.; Singh, R.P. Response of surface and atmospheric parameters associated with the Iran M 7.3 earthquake. IEEE J. Selected Topics Appl. Earth Obser. Remote Sens. 2022, 15, 3188003. [Google Scholar] [CrossRef]
- Liu, Y.J.; Wu, L.X.; Qi, Y.; Ding, Y.F. General features of multi-parameter anomalies of six moderate earthquakes occurred near Zhangbei-Bohai fault in China during the past decades. Remote Sens. Environ. 2023, 295, 113692. [Google Scholar] [CrossRef]
- Guo, G.M.; Cao, Y.G.; Gong, J.M. Monitoring anomaly before earthquake with MODIS and MOPITT data. Adv. Earth Sci. 2006, 2, 695–698. [Google Scholar]
- Cui, Y.J.; Du, J.G.; Zhou, X.C.; Chen, Z.; Li, Y.; Liu, L.; Xie, C.; Zhang, W.B. Geochemical anomaly of CO remote sensing associated with Baja California MW7.2 earthquake in Mexico. Bulletin of Mineralogy. Petrol. Geochem. 2011, 30, 458–464. [Google Scholar]
- Ma, W.Y.; Zhang, X.D.; Liu, J.; Yao, Y.; Zhou, B.; Yue, C.; Kang, C.L.; Lu, X. Influences of multiple layers of air temperature differences on tidal forces and tectonic stress before, during and after the Jiujiang earthquake. Remote Sens. Environ. 2018, 210, 159–165. [Google Scholar]
- Zhang, P.Z.; Xu, X.W.; Wen, X.Z.; Ran, Y.K. Slip rates and recurrence intervals of the Longmen Shan active fault zone, and tectonic implications for the mechanism of the May l2 Wenchuan earthquake, 2008, Sichuan, China. Chin. J. Geophys. 2008, 51, 1066–1073. [Google Scholar]
- Toda, S.; Lin, J.; Meghraoui, M.; Stein, R.S. 12 May 2008 M = 7.9 Wenchuan, China, earthquake calculated to increase failure stress and seismicity rate on three major fault systems. Geophys. Res. Lett. 2008, 35, L17305. [Google Scholar] [CrossRef]
- de Michele, M.; Raucoules, D.; Lasserre, C.; Pathier, E.; Klinger, Y.; Van Der Woerd, J.; De Sigoyer, J.; Xu, X.W. The MW 7.9, 12 May 2008 Sichuan earthquake rupture measured by sub-pixel correlation of ALOS PALSAR amplitude images. Earth Planets Space 2010, 62, 875–879. [Google Scholar] [CrossRef]
- Huot, G.; Singh, S.C. Seismic evidence for fluid/gas beneath the Mentawai forearc basin, Central Sumatra. J. Geophys. Res. Solid Earth. 2018, 123, 957–976. [Google Scholar] [CrossRef]
- Lay, T.; Kanamori, H.; Ammon, C.J.; Nettles, M.; Ward, S.N.; Aster, R.C.; Beck, S.L.; Bilek, S.L.; Brudzinski, M.R.; Butler, R.; et al. The great sumatra-andaman earthquake of 26 december 2004. Science 2005, 308, 1127–1133. [Google Scholar] [CrossRef]
- Fujii, Y.; Satake, K.; Watada, S.; Ho, T. Re-examination of Slip Distribution of the 2004 Sumatra–Andaman Earthquake (MW 9.2) by the Inversion of Tsunami Data Using Green’s Functions Corrected for Compressible Seawater Over the Elastic Earth. Pure Appl. Geophys. 2021, 178, 4777–4796. [Google Scholar] [CrossRef]
- Fialko, Y. Interseismic strain accumulation and the earthquake potential on the southern San Andreas fault system. Nature 2006, 441, 968–971. [Google Scholar] [CrossRef] [PubMed]
- Escobar, M.G.; Gallegos-Castillo, C.A.; Arregui-Ojeda, S.M.; Mastache-Román, E.A.; Reyes-Martínez, C.S.; Aladro-Chio, Y.H. Overview of the tectonic and seismicity in Continental Borderland (offshore) Baja California, México. J. S. Am. Earth Sci. 2023, 131, 104621. [Google Scholar] [CrossRef]
- Romero-Andrade, R.; Trejo-Soto, M.E.; Nayak, K.; Hernández-Andrade, D.; Bojorquez-Pacheco, N. Lineament analysis as a seismic precursor: The El Mayor Cucapah earthquake of April 4, 2010 (MW 7.2), Baja California, Mexico. Geodesy Geodyn. 2023, 14, 121–129. [Google Scholar] [CrossRef]
- Susskind, J.; Barnet, C.D.; Blaisdell, J.M. Retrieval of atmospheric and surface parameters from AIRS/AMSU/HSB data in the presence of clouds. IEEE Trans. Geosci. Remote Sens. 2003, 41, 390–409. [Google Scholar] [CrossRef]
- Barnet, C.; Datta, S.; Strow, L. Trace gas measurements from the Atmospheric Infrared Sounder (AIRS). In Optical Remote Sensing, OSA Technical Digest; OWB2; Optica Publishing Group: Québec, Canada, 2003. [Google Scholar]
- McMillan, W.W.; Barnet, C.; Strow, L.; Chahine, M.T.; Mccourt, M.L.; Warner, J.X. Daily global maps of carbon monoxide from NASA’s Atmospheric Infrared Sounder. Geophys. Res. Lett. 2005, 32, L11801. [Google Scholar] [CrossRef]
- Wu, L.; Qin, K.; Liu, S. GEOSS-Based Thermal Parameters Analysis for Earthquake Anomaly Recognition. Proc. IEEE 2012, 100, 2891–2907. [Google Scholar] [CrossRef]
- Qin, K.; Wu, L.X.; Zheng, S.; Liu, S.J. A Deviation-Time-Space-Thermal (DTS-T) Method for Global Earth Observation System of Systems (GEOSS)-Based Earthquake Anomaly Recognition: Criterions and Quantify Indices. Remote Sens. 2013, 5, 5143–5151. [Google Scholar] [CrossRef]
- Gold, T. Terrestrial sources of carbon and earthquake outgassing. J. Petrol. Geol. 1979, 1, 3–19. [Google Scholar] [CrossRef]
- Italiano, F.; Martinelli, G.; Plescia, P. CO2 Degassing over Seismic areas: The Role of Mechanochemical Production at the Study Case of Central Apennines. Pure Appl. Geophys. 2008, 165, 75–94. [Google Scholar] [CrossRef]
- Uysal, I.T.; Feng, Y.X.; Zhao, J.X.; Isik, V.; Nuriel, P.; Golding, S.D. Hydrothermal CO2 degassing in seismically active zones during the late Quaternary. Chem. Geol. 2009, 265, 442–454. [Google Scholar] [CrossRef]
- Van Der Meer, D.G.; Zeebe, R.E.; Van Hinsbergen, D.J.J.; Sluijs, A.; Spakman, W.; Torsvik, T.H. Plate tectonic controls on atmospheric CO2 levels since the Triassic. Proc. Natl. Acad. Sci. USA 2014, 111, 4380–4385. [Google Scholar] [CrossRef]
- Dupré, S.; Scalabrin, C.; Grall, C.; Augustin, J.-M.; Henry, P.; Şengör, A.M.C.; Görür, N.; Çağatay, M.N.; Géli, L. Tectonic and sedimentary controls on widespread gas emissions in the sea of marmara: Results from systematic, shipborne multibeam echo sounder water column imaging. J. Geophys. Res. Solid Earth 2015, 120, 2891–2912. [Google Scholar] [CrossRef]
- Fu, C.C.; Yang, T.F.; Chen, C.H.; Lee, L.C.; Wu, Y.M.; Liu, T.K.; Walia, V.; Kumar, A.; Lai, T.H. Spatial and temporal anomalies of soil gas in northern Taiwan and its tectonic and seismic implications. J. Asian Earth Sci. 2017, 149, 64–77. [Google Scholar] [CrossRef]
- Tamburello, G.; Pondrelli, S.; Chiodini, G.; Rouwet, D. Global-scale control of extensional tectonics on CO2 earth degassing. Nat. Commun. 2018, 9, 4608. [Google Scholar] [CrossRef]
- Cui, J.; Shen, X.; Zhang, J.; Ma, W.; Chu, W. Analysis of spatiotemporal variations in middle-tropospheric to upper-tropospheric methane during the Wenchuan MS = 8.0 earthquake by three indices. Nat. Hazards Earth Syst. Sci. 2019, 19, 2841–2854. [Google Scholar] [CrossRef]
- Sibson, R.H. Structural permeability of fluid-driven fault-fracture meshes. J. Struct. Geol. 1996, 18, 1031–1042. [Google Scholar] [CrossRef]
- Sun, Y.T.; Zhou, X.C.; Zheng, G.D.; Li, J.; Shi, H.Y.; Guo, Z.F.; Du, J.G. Carbon monoxide degassing from seismic fault zones in the Basin and Range province, west of Beijing, China. J. Asian Earth Sci. 2017, 149, 41–48. [Google Scholar] [CrossRef]
Disclaimer/Publisher’s Note: The statements, opinions and data contained in all publications are solely those of the individual author(s) and contributor(s) and not of MDPI and/or the editor(s). MDPI and/or the editor(s) disclaim responsibility for any injury to people or property resulting from any ideas, methods, instructions or products referred to in the content. |
© 2024 by the authors. Licensee MDPI, Basel, Switzerland. This article is an open access article distributed under the terms and conditions of the Creative Commons Attribution (CC BY) license (https://creativecommons.org/licenses/by/4.0/).
Share and Cite
Cui, Y.; Huang, J.; Zeng, Z.; Zou, Z. CO Emissions Associated with Three Major Earthquakes Occurring in Diverse Tectonic Environments. Remote Sens. 2024, 16, 480. https://doi.org/10.3390/rs16030480
Cui Y, Huang J, Zeng Z, Zou Z. CO Emissions Associated with Three Major Earthquakes Occurring in Diverse Tectonic Environments. Remote Sensing. 2024; 16(3):480. https://doi.org/10.3390/rs16030480
Chicago/Turabian StyleCui, Yueju, Jianan Huang, Zhaojun Zeng, and Zhenyu Zou. 2024. "CO Emissions Associated with Three Major Earthquakes Occurring in Diverse Tectonic Environments" Remote Sensing 16, no. 3: 480. https://doi.org/10.3390/rs16030480
APA StyleCui, Y., Huang, J., Zeng, Z., & Zou, Z. (2024). CO Emissions Associated with Three Major Earthquakes Occurring in Diverse Tectonic Environments. Remote Sensing, 16(3), 480. https://doi.org/10.3390/rs16030480