Article

Quantitative Genetic Aspects of Accuracy of Tree Biomass Measurement Using LiDAR

1
Graduate School of Agricultural and Life Sciences, The University of Tokyo, Tokyo 113-8657, Japan
2
Sumitomo Forestry Co., Ltd., Tokyo 100-8270, Japan
3
Kazusa DNA Research Institute, Kisarazu 292-0818, Japan
*
Author to whom correspondence should be addressed.
Remote Sens. 2024, 16(24), 4790; https://doi.org/10.3390/rs16244790
Submission received: 4 November 2024 / Revised: 16 December 2024 / Accepted: 20 December 2024 / Published: 22 December 2024

Abstract

:
The growing focus on the role of forests in carbon sequestration highlights the importance of accurately and efficiently measuring biophysical traits, such as diameter at breast height (DBH) and tree height. Understanding genetic contributions to trait variation is crucial for enhancing carbon storage through the genetic improvement of forest trees. Light detection and ranging (LiDAR) has been used to estimate DBH and tree height; however, few studies have explored the heritability of these traits or assessed the accuracy of biomass increment selection based on them. Therefore, this study aimed to leverage LiDAR to measure DBH and tree height, estimate tree heritability, and evaluate the accuracy of timber volume selection based on these traits, using 60-year-old larch as the study material. Unmanned aerial vehicle laser scanning (ULS) and backpack laser scanning (BLS) were compared against hand-measured values. The accuracy of DBH estimations using BLS resulted in a root mean square error (RMSE) of 2.7 cm and a coefficient of determination of 0.67. Conversely, the accuracy achieved with ULS was 4.0 cm in RMSE and a 0.24 coefficient of determination. The heritability of DBH was higher with BLS than with ULS and even exceeded that of hand measurements. Comparisons of timber volume selection accuracy based on the measured traits demonstrated comparable performance between BLS and ULS. These findings underscore the potential of using LiDAR remote sensing to quantitatively measure forest tree biomass and facilitate their genetic improvement of carbon-sequestration ability based on these measurements.

1. Introduction

In recent years, the importance of forests as carbon sinks has been increasingly recognized, particularly in the context of climate change mitigation and adaptation [1,2,3,4]. Plant biomass growth is primarily influenced by a combination of environmental and genetic factors. Quantitative genetics, a discipline that focuses on understanding the interplay between genetic and environmental factors in shaping phenotypic traits of organisms, aims to quantify the extent to which trait variations are attributable to genetic inheritance. This quantitative genetics framework is a powerful tool for dissecting the drivers of forest biomass growth, thereby enabling the differentiation between the contributions of genetic and environmental factors. Moreover, it provides insights into the extent to which biomass growth can be influenced by human-mediated genetic interventions such as tree breeding.
In quantitative genetics, genetic relationships among individuals and their phenotypic values for a particular trait are analyzed to ascertain the genetic contribution to trait variation. Traditionally, parent–progeny and pedigree relationships over multiple generations have been used as genetic relationships among individuals. Recent developments in next-generation sequencing technology have enabled scientists to identify a large number of DNA polymorphisms across many individuals and infer genetic relationships based on these polymorphisms. However, collecting phenotypic data remains limited by the number of individuals that can be studied using conventional manual measurements, making labor-saving measurements challenging. Quantitative genetic analysis requires both high efficiency and sufficient accuracy when measuring a large number of individuals. The required level of accuracy depends on the traits, population, and purpose of the analysis. Even if the measurement accuracy for an individual is reduced, the ability to measure a large number of individuals can statistically compensate for this reduction. This is because, when evaluating a trait, one approach involves accurately measuring a small number of individuals from a limited number of genotypes, while another approach is to statistically improve accuracy by measuring a larger number of individuals across many genotypes. In many quantitative genetics studies (particularly for organisms with short generation cycles), the number of individuals can be adjusted to match the research objectives. In this context, remote sensing technologies such as unmanned aerial vehicles (UAV) and other high-throughput phenotyping methods are increasingly being used for quantitative genetic analyses [5,6,7,8,9,10].
Light detection and ranging (LiDAR) technology, which has recently been increasingly used in combination with UAV remote sensing, has been studied for applications in forest management. In particular, the estimation of diameter at breast height (DBH) has been the subject of many studies because of its importance in forest management and the inefficiency of manual measurements [5,6,7]. The accurate determination of the desired plant characteristics (e.g., DBH and tree height) from remote sensing data requires advanced data analysis methods, and many studies have been conducted to improve the measurement accuracy [5,11,12,13,14,15,16,17]. The results of these studies are essential for applying remote sensing technology to plant phenotyping and quantitative genetics. However, few studies have examined the effectiveness and accuracy of remote sensing for phenotypic measurements in the quantitative genetic analysis of forest trees. Therefore, this study aimed to investigate the potential applications of LiDAR remote sensing in quantitative genetic studies of forest trees. In particular, this study used two different LiDAR platforms—backpack and UAV—and compared their accuracies. The UAV-based LiDAR remote sensing (unmanned aerial vehicle laser scanning [ULS]) is highly efficient and covers large areas. LiDAR measurement using a backpack (backpack laser scanning [BLS]) is a relatively new technique that acquires data by walking on the forest floor using a sensor attached to the backpack. Although BLS is inferior to ULS in terms of measurement efficiency, it offers greater mobility than terrestrial laser scanning (TLS) and is advantageous for acquiring data on forest structures under the canopy, such as TLS.
While LiDAR-based phenotypic data acquisition has been widely applied to quantitative genetics in agriculture, its use in forestry remains limited. This is because forest tree breeding is time-consuming due to the long generation cycles [9]. The existing examples in forestry include studies that measure heritability and genetic gain for tree height measured by LiDAR, with the most recent paper by Chendid et al., (2023) presenting a case where LiDAR was used to measure volume in a vineyard, followed by QTL analysis [18]. However, no study has measured trunk diameter using ULS and its heritability and genetic correlation, nor has any study examined the accuracy of predicting the genetic ability for timber volume using measurements derived from LiDAR and compared them across platforms. These two points are unique to this study.
Larch, a deciduous conifer, constitutes approximately 30% of Japan’s forest area according to Forestry Agency statistics for 2021 (https://www.rinya.maff.go.jp/j/kikaku/toukei/attach/pdf/youran_mokuzi2023-3.pdf, (accessed on 24 March 2024)/Japanese), and is one of the major plantation species in Japan [19]. Since the 1950s, larches have been selectively bred to promote strong and vigorous growth and the formation of straight trunks [19]. Notably, larches play a significant role in carbon sequestration. Hirano et al. (2003) demonstrated that larch forests in Japan act as carbon sinks through negative net ecosystem CO2 exchange [20]. The deciduous characteristics of larches are particularly important for ULS measurements because they facilitate trunk scanning in densely planted forests without interference from the tree canopy during defoliation seasons. This is because when trees have leaves, the dense canopy blocks the ULS laser from the sky, making it challenging to obtain point cloud data on the trunk shape. Consequently, larch is an ideal tree species for assessing the DBH measurement accuracy of LiDAR across various platforms.
In this study, we aimed to develop methods for the rapid and accurate measurement of larch biomass growth using LiDAR remote sensing. We hypothesized that the accuracy of measurements would vary depending on the LiDAR platform, considering the sensor’s ranging accuracy. We used a genetic model based on genome-wide polymorphism data to test this hypothesis. Specifically, we established methods for measuring tree location, diameter, and height using LiDAR remote sensing for 602 60-year-old larch trees. These methods were applied using both BLS and ULS remote sensing platforms, and their capabilities to measure tree height and the accuracy of diameter estimation were evaluated. Genome-wide marker data were collected from the target trees to determine their genetic relationships. Using these data, we estimated the heritability of traits and genetic correlations for different combinations of measurement methods and traits. Subsequently, we assessed the potential of LiDAR remote sensing data for the efficient selection of timber volume. Through these investigations, we aimed to evaluate the potential of LiDAR remote sensing measurements to assess forest tree biomass and contribute to genetic improvement efforts from a quantitative genetic perspective.

2. Materials and Methods

2.1. Study Site

The 602 larch trees examined in this study were planted within the test site for hybrid larches at the Fuji Iyashinomori Woodland Study Center located in Yamanakako-mura, Minamitsuru-gun, Yamanashi, Japan. The region experiences an average annual precipitation of 2355 mm and an average annual temperature of 9.9 °C, with a minimum temperature of −19.4 °C, as recorded by the Amedas Yamanaka observatory. The soil in the area is classified as gravelly volcanic immature soil, and the terrain is gently sloping.
The test site for hybrid larches was initially planted in 1955 with 1806 individuals from 15 families. Currently, 602 individuals remain. Larch is a deciduous coniferous tree with a straight trunk. The trees in the study area are 60 years old and have a breast height diameter in the range of 10–40 cm and a height ranging from 8 to 25 m. The trees were arranged in a grid of 24 rows and 76 columns, spaced 2 m apart (Figure 1A). No thinning was conducted since the initial planting. Regular management operations removed the majority of understory vegetation from the forest floor. There are few mid-story trees and shrubs in the study area. However, there are medium and tall trees in the northwestern part of the study site due to the invasion of other tree species. The herb layer is sparse but roughly less than 50 cm tall. Some trees have vines coiled around them, spreading their leaves around the tree’s trunks.

2.2. Hand-Measured Record of DBH

Manual DBH measurement records were available for 205 individuals from seven families, measured using climbing plants (Toxicodendron orientale Greene and Helianthus petiolaris Siebold et Zucc.) in 2020. Among these, three were identified as full-sib families. The values represent the diameters 1.2 m above ground level. The 2020 records were considered true values to verify the DBH measurement accuracy.
As noted in Section 2.3, data were obtained in 2021 for BLS and in 2022 for ULS. Although there is a difference of up to two years from when the hand-measured data were acquired, this difference has a minimal impact on the evaluation of measurement accuracy. Based on historical DBH records preserved at the study site, we estimate that DBH growth is approximately 0.3 cm per year. Given this small growth rate, we consider the correlation between measurements taken in different years sufficient.

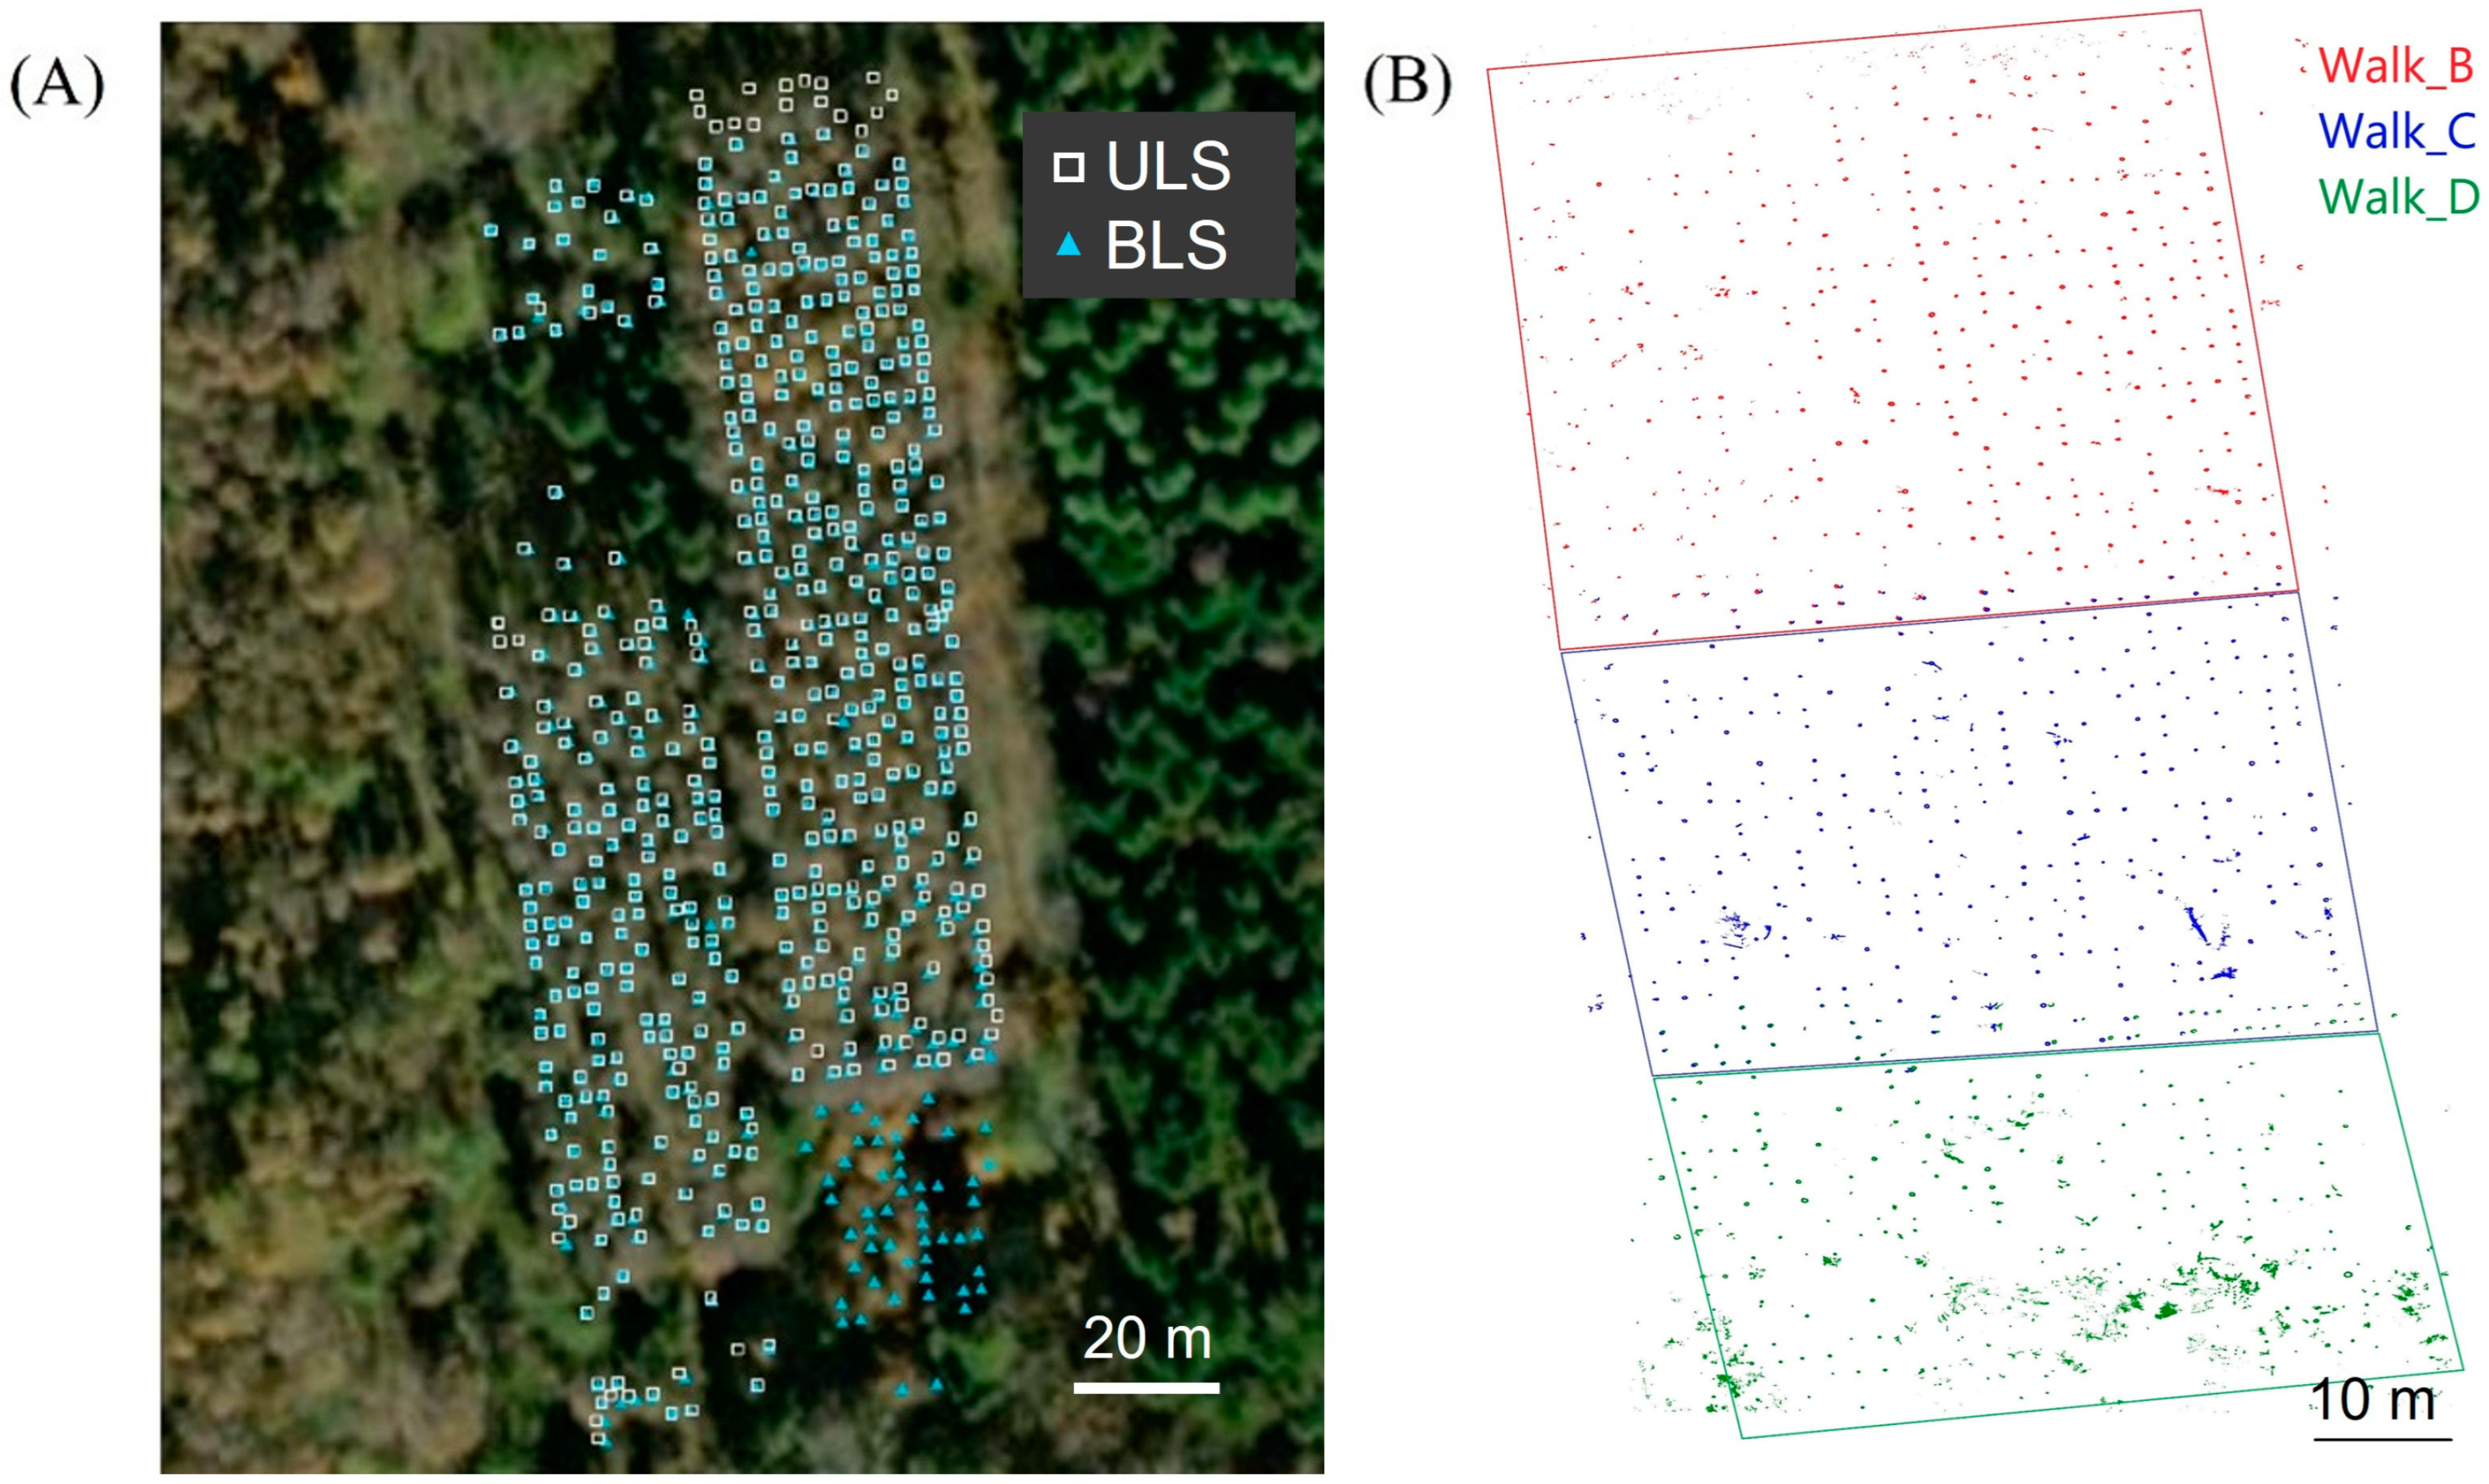
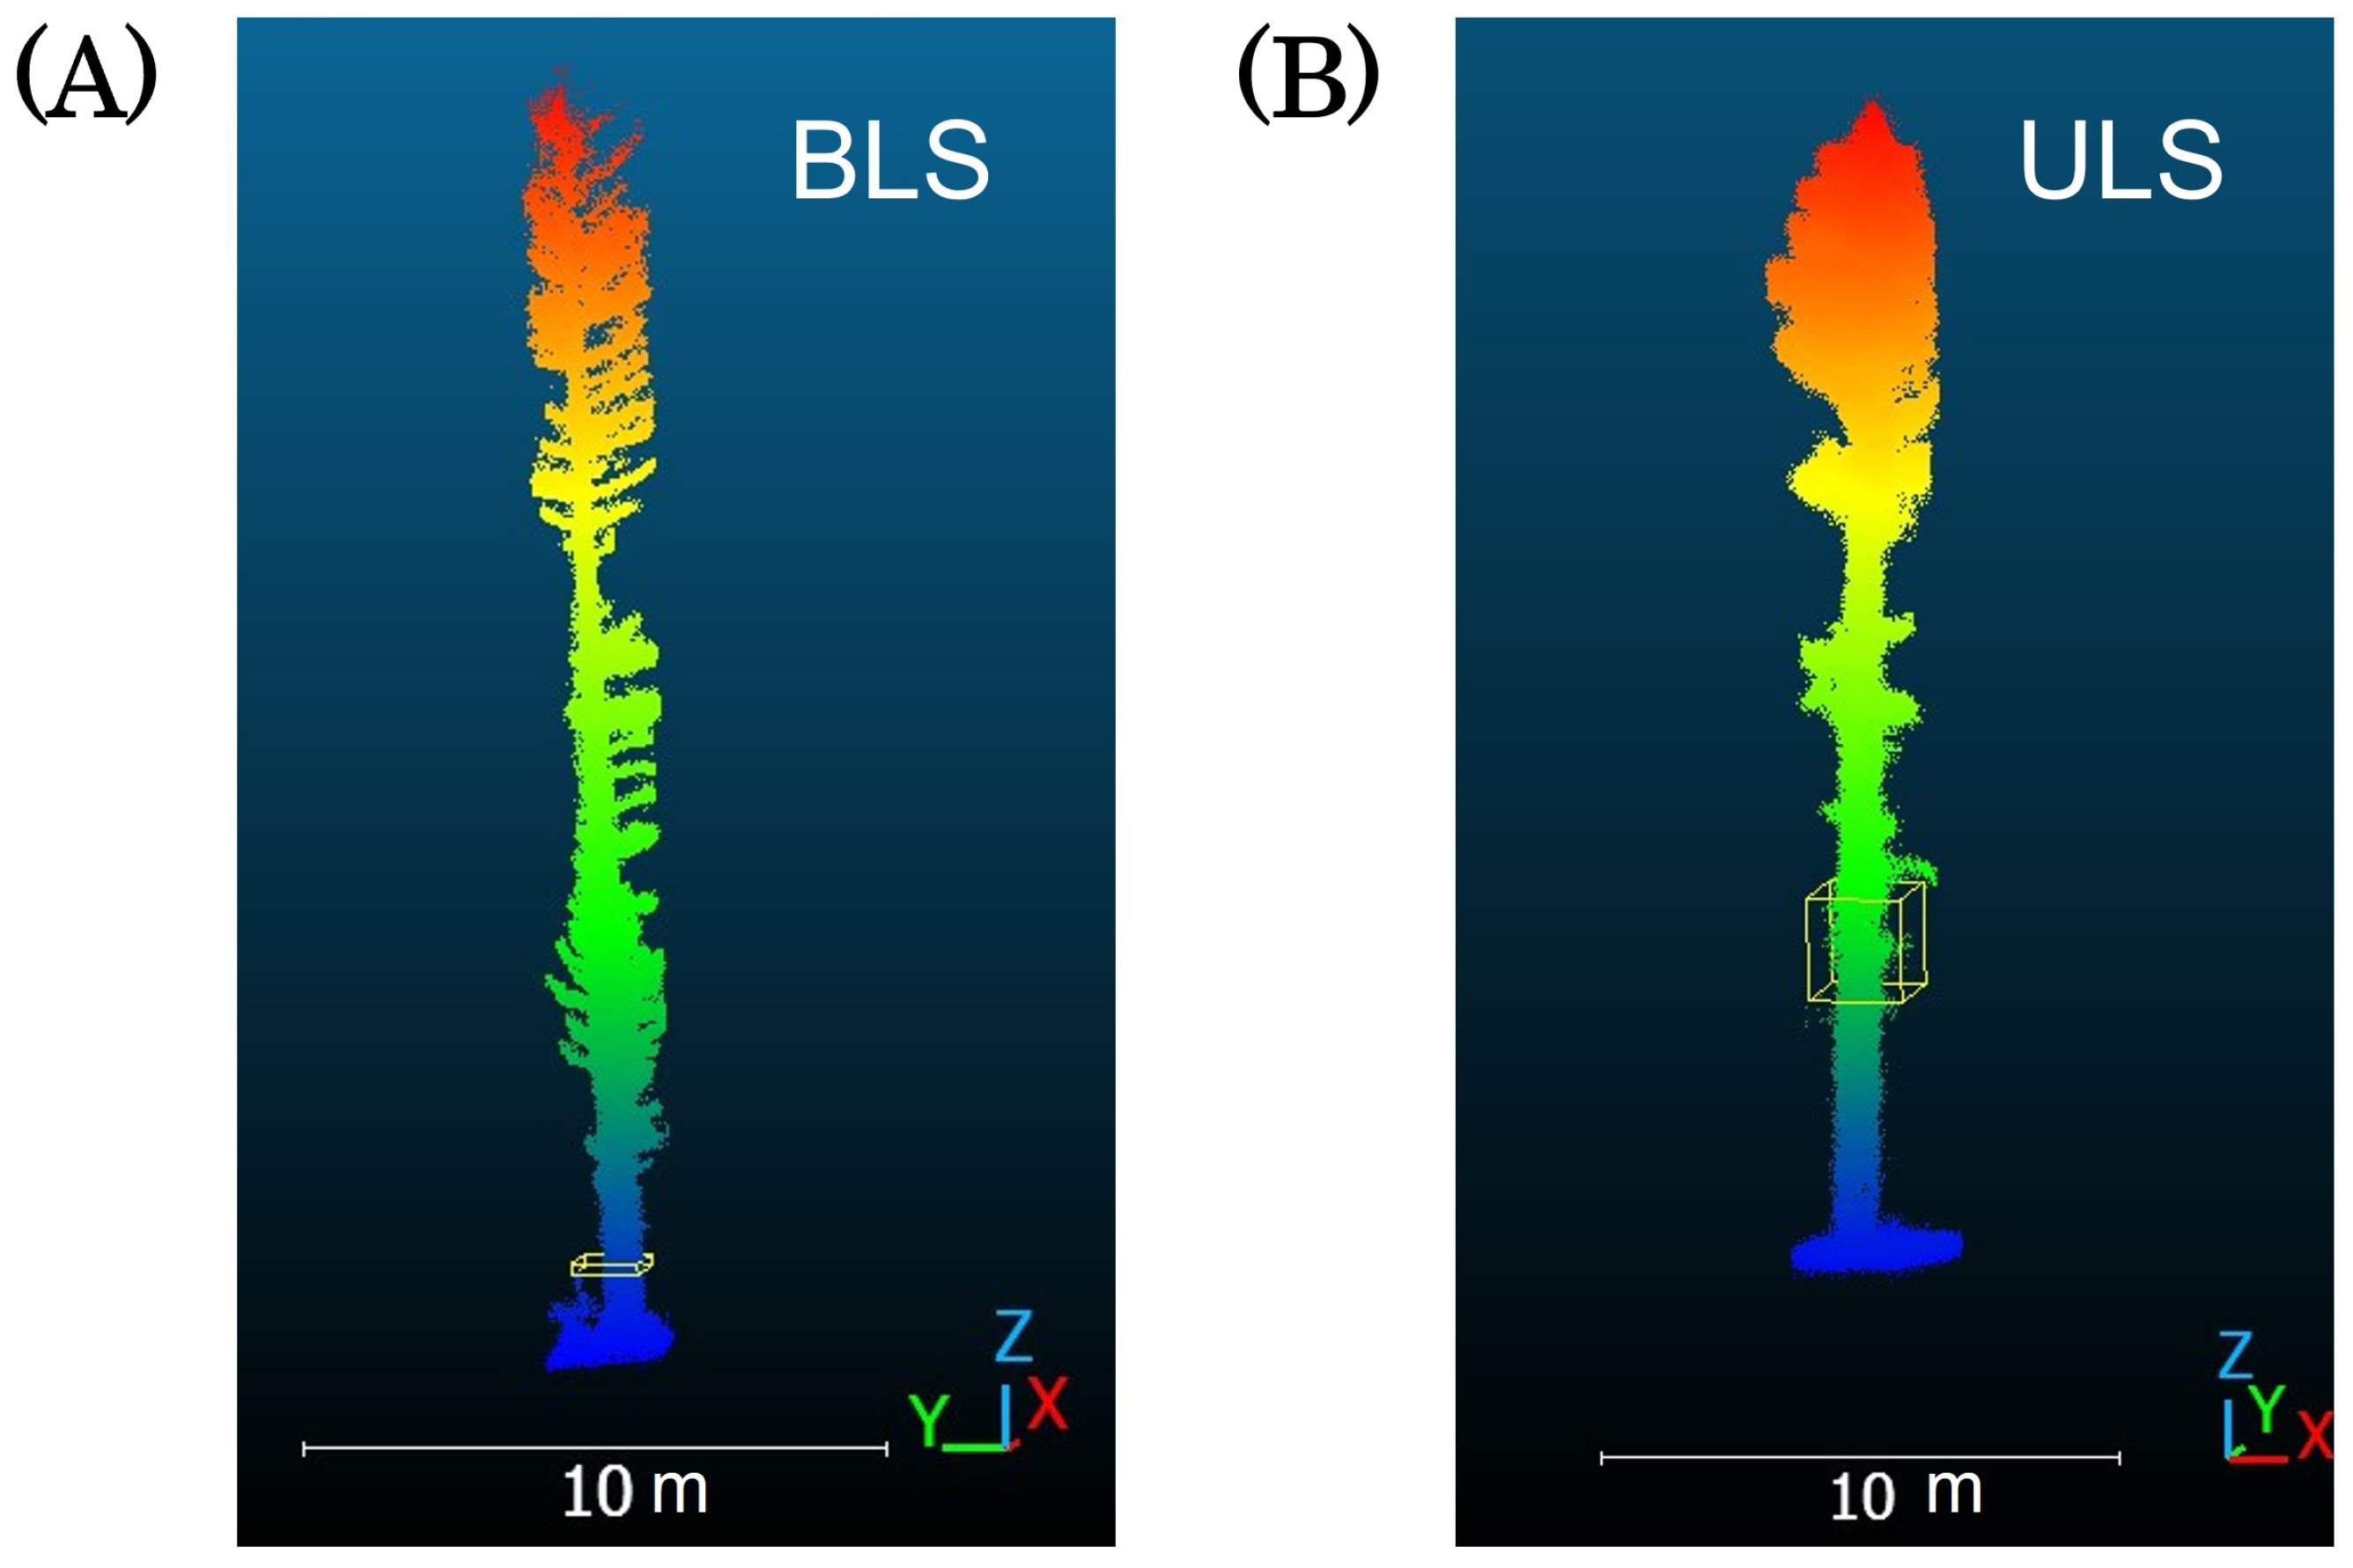
2.3. Point Cloud Data Acquisition

Point cloud data were acquired using two types of laser scanners: BLS and ULS. Table 1 presents the details of the sensors used. Both sets of point clouds were initially collected in the WGS 84 coordinate system and later transformed into Zone 8 of the Japanese plane rectangular coordinate system, with units in meters for analysis.
The BLS system used was the Leica Pegasus: Backpack, manufactured by Leica Geosystems, Heerbrugg, Switzerland. This system uses two Velodyne VLP-16 scanners, which are carried in a backpack while walking around the area to be measured. The relative accuracy of the system was reported to be 2–3 cm at a distance of 50 m, with a pulse repetition rate of 60 kHz (30 kHz per scanner). Although the absolute accuracy, when using a global navigation satellite system (GNSS) outdoors, was 5 cm, measurements taken without control points based on simultaneous localization and mapping (SLAM) without the GNSS yielded accuracies ranging from 5 to 50 cm after 10 min of walking. In this study, data were acquired using a combination of GNSS and SLAM techniques, with seven control points. The test site was partitioned into three sections along the north-south direction, referred to as Walk_B, Walk_C, and Walk_D. Point cloud data for these sections were acquired on March 10, 2021. Specifically, rows 1–31 of the larch planting matrices were captured during Walk_B, 32–56 during Walk_C, and 57–76 during Walk_D (Figure 1B). Walk_A was not used in this study because it pertains to data from a different study site.
The ULS system used was the Zenmuse L1 (DJI, Shenzhen, China), mounted on a Matrice 300 RTK drone (DJI). This LiDAR system scans from the sky, with reported horizontal and vertical accuracies of 10 cm and 5 cm, respectively, at a distance of 50 m. Point cloud data were acquired from five directions, with gimbal angles of −90° (one direction) and −45° (four directions: east, west, south, and north), flight altitudes of 50 and 70 m, and maximum echo number (number of return) set to 2 and 3. The maximum echo number indicates the total number of returns recorded for a given pulse. When set to 2, the instrument records the first and second returns for the pulse; when set to 3, it records the first, second, and third returns. If set to 1, only the first return is recorded. In cases where the pulse is partially interrupted by the canopy, this setting may not capture sufficient information about the forest structure below the canopy. Therefore, we used maximum echo numbers of 2 and 3, combining the data for analysis. The four data patterns were combined after the acquisition on 2 March 2022. The RTK positioning was performed using the DJI D-RTK2 system. The laser pulse frequency was 240 kHz for a maximum echo number of 3 and 160 kHz for a maximum echo number of 2, with a 50% overlap between the flight paths.

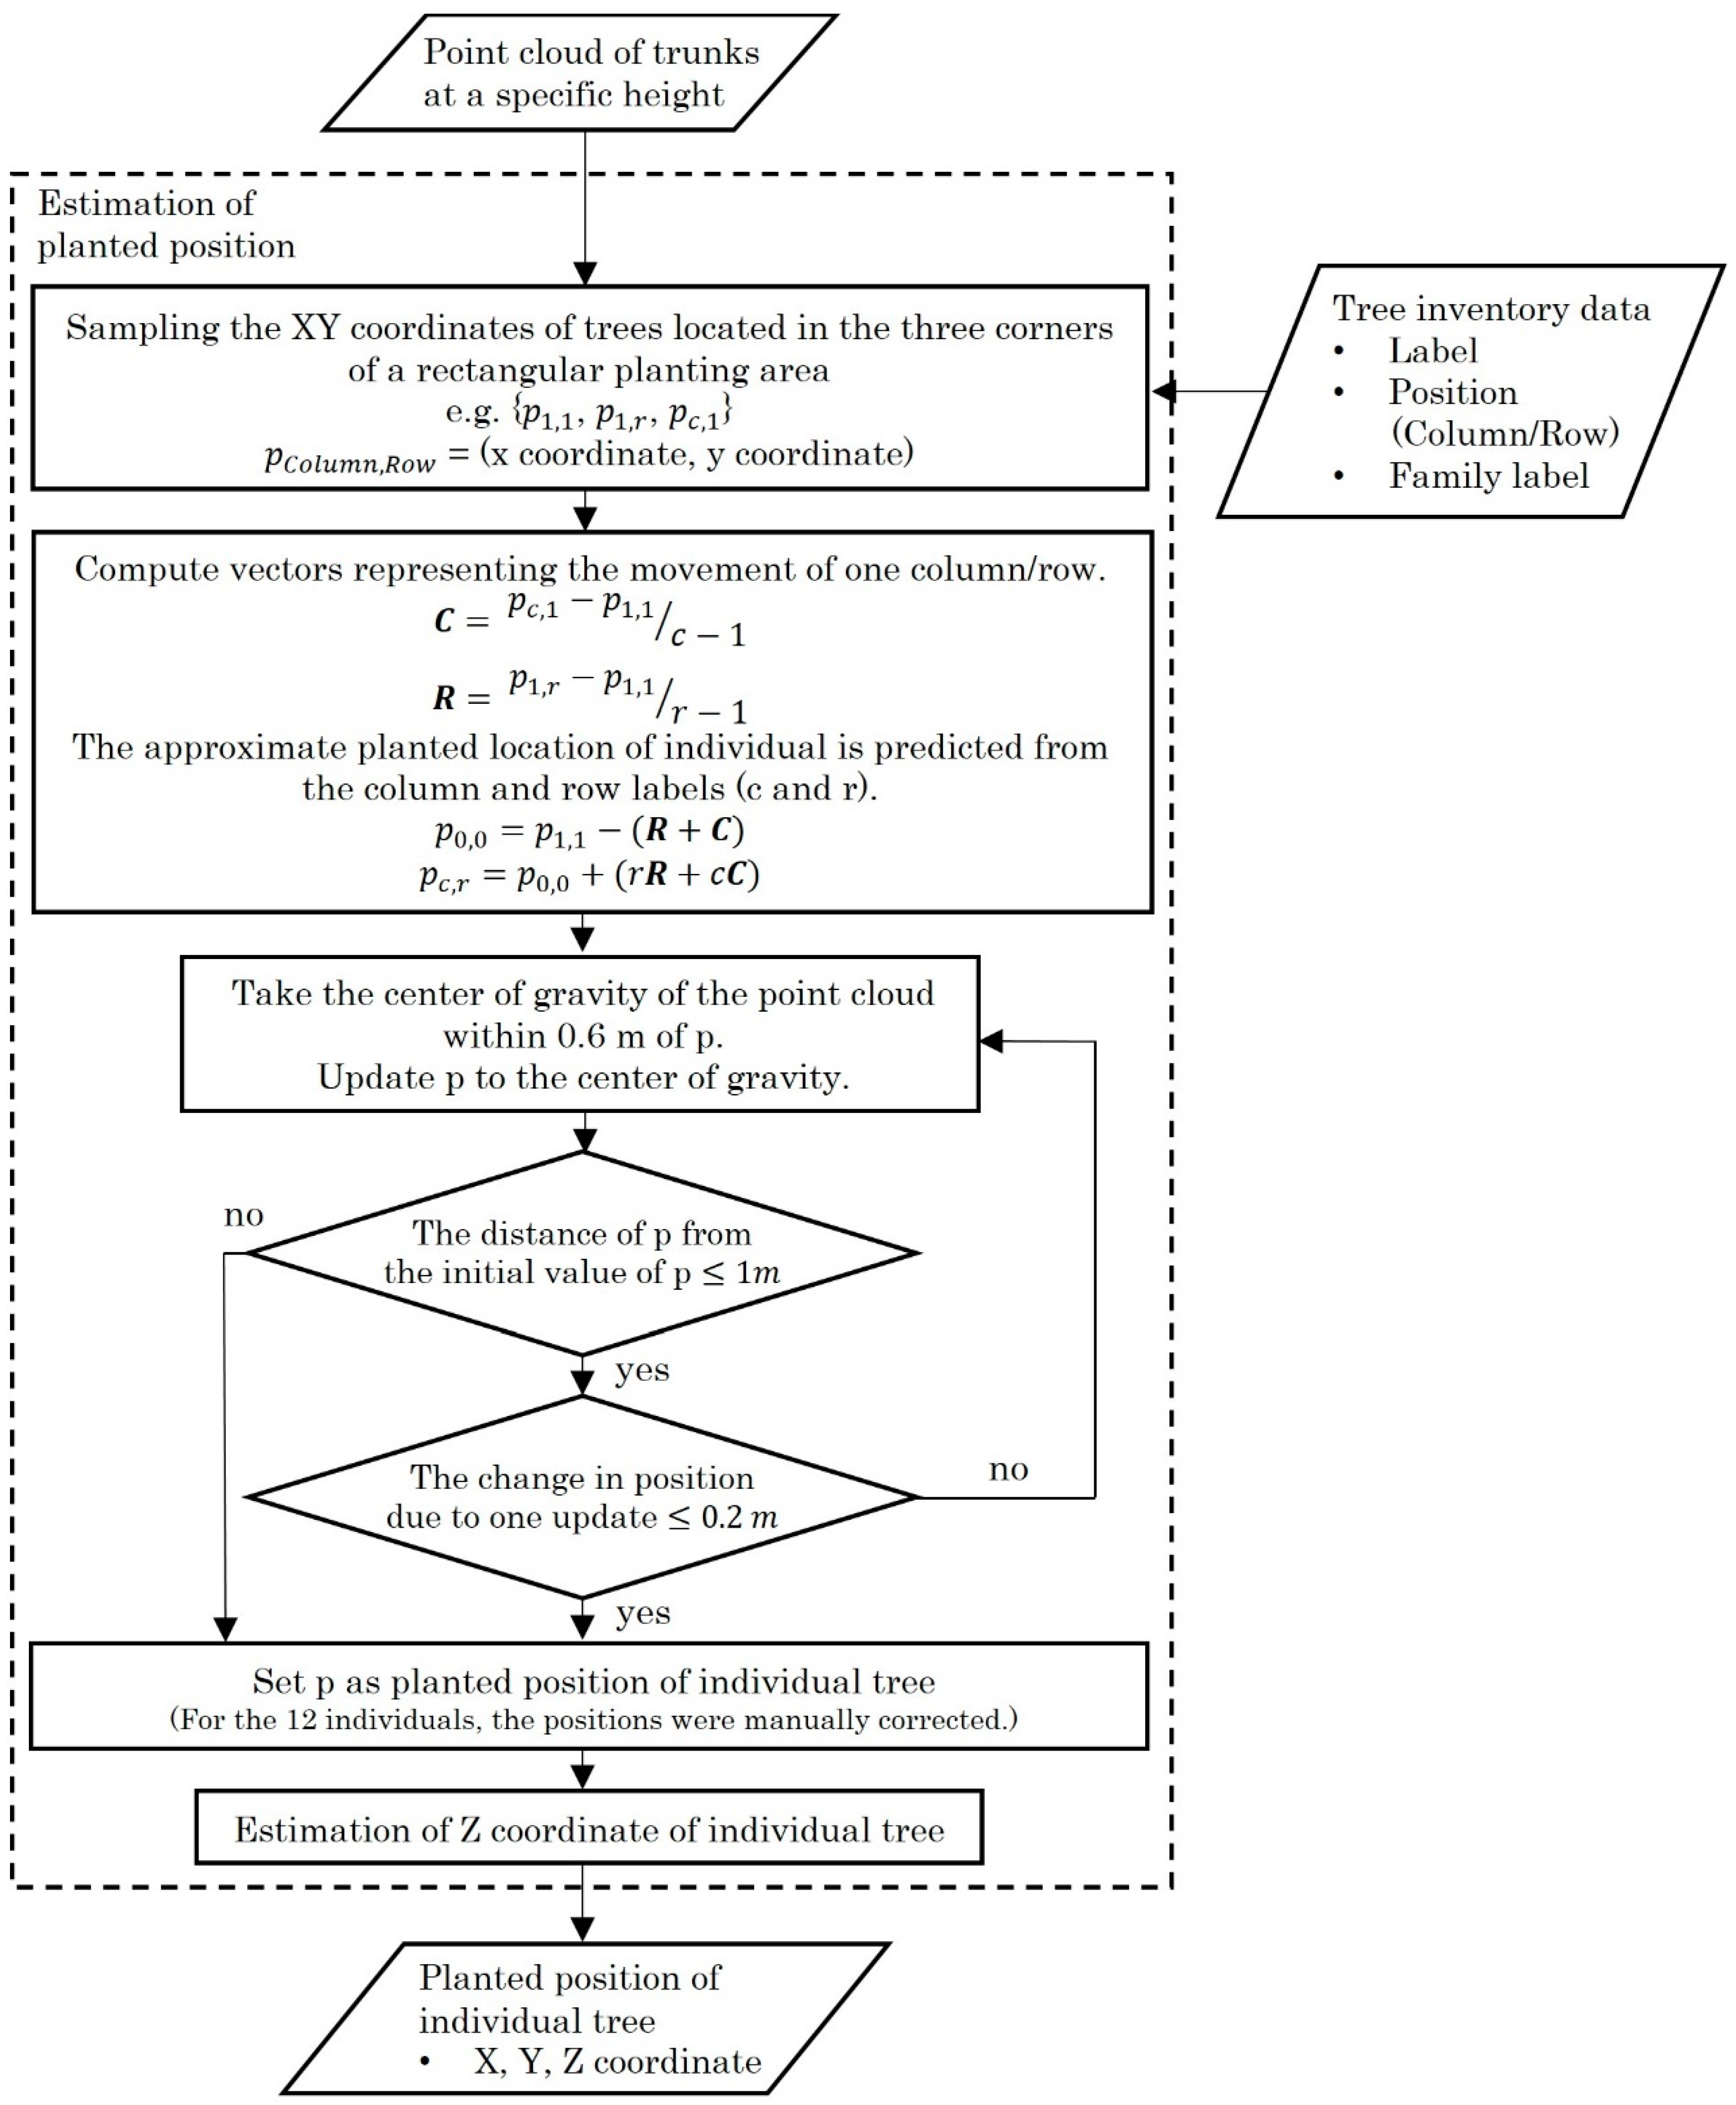
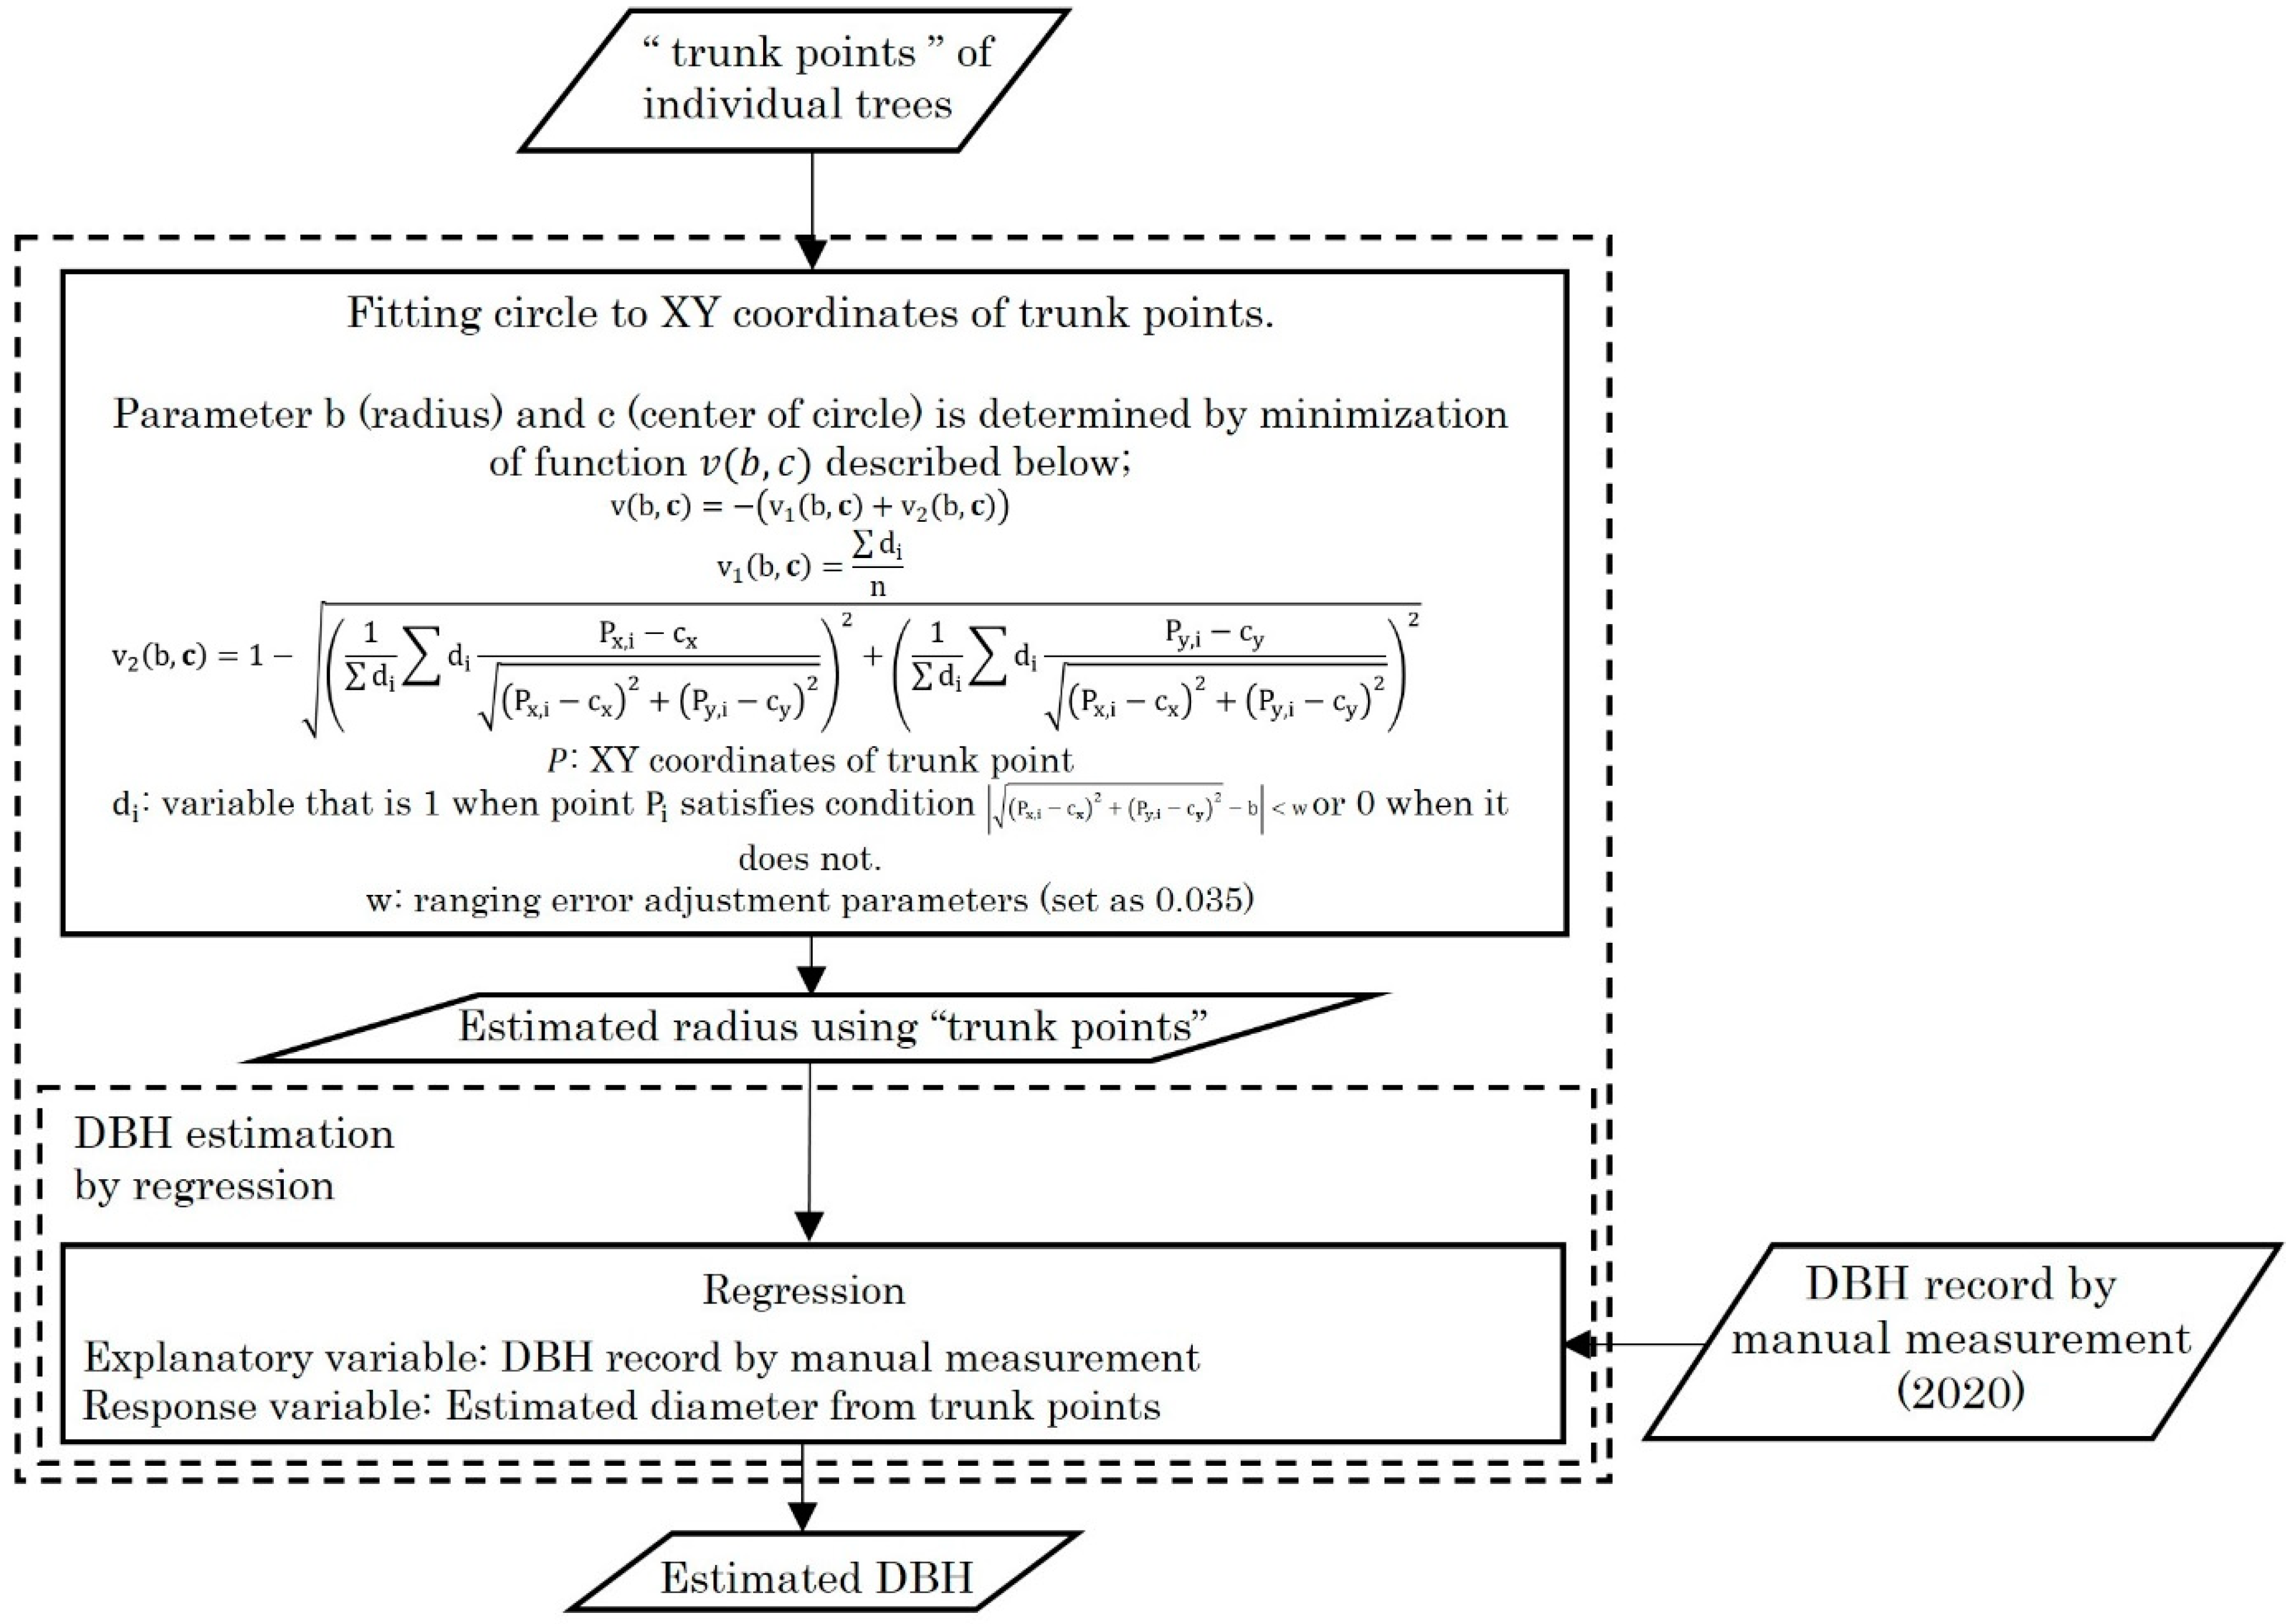
2.4. Analysis Flow of Point Cloud Data

Point cloud data collected via BLS in 2021 and ULS in 2022 were analyzed separately to estimate DBH and compare the accuracy of the two LiDAR systems. The analysis flow is shown in Figure A1, Figure A2, Figure A3 and Figure A4: Figure A1 illustrates the entire analysis flow, Figure A2 shows the location estimation of individual trees, Figure A3 elaborates on the details of the DBH estimation, and Figure A4 explains the tree height estimation.
First, the noise was eliminated using a noise filter implemented in CloudCompare [21], and the ground point clouds were classified using the Cloth Simulation Filter [22]. Subsequently, a digital terrain model (DTM) was generated using ordinary kriging. Point clouds at specific ground heights (1.1–1.3 m above ground for BLS and 5–7 m above ground for ULS) were extracted and identified as “trunk points,” as depicted in Figure 1B. The “trunk points” were used to estimate the location coordinates of individual trees. Since GNSS signals could not be received on the forest floor at the study site, tree locations were estimated using point cloud data, the regular planting pattern of trees, and relative location information obtained from field surveys. Specifically, based on the column and row information of the regular array of tree positions (see Figure 1) collected during the field survey, we visually identified the array boundaries from the trunk points visualized using CloudCompare. The XY coordinates of three corner trees were extracted as reference points. The X and Y coordinates of a tree in column i and row j were denoted as x i , j and y i , j , respectively, as shown in Equation (1). Using these three reference points, we calculated the vectors representing the XY displacement associated with one row ( R ) and one column ( C ), as described in Equations (2) and (3). The XY coordinates of the reference points at row 0 and column 0 ( p 0,0 ) were then determined using Equation (4). Based on these parameters, the approximate planting positions of the individual trees ( p c , r ) were estimated using Equation (5).
P i , j = x i , j , y i , j
C = p c , 1 p 1,1 c 1
R = p 1 , r p 1,1 r 1
p 0,0 = p 1,1 ( R + C )
p c , r = p 0,0 + r R + c C
The planting location was refined starting with the initial approximate planting location. The center of gravity of the point cloud within a 0.6 m radius from the planting location was calculated and adopted as the new planting location. This process was iterated until the distance traveled in one step was less than 0.2 m or the distance from the initial value exceeded 1 m. Subsequently, manual position adjustments were made for 12 individuals using the BLS and three individuals using the ULS as these trees were initially planted (probably due to circumstances at the planting time) outside the regular pattern and required correction. The Z-coordinates of the ground at the individual planting positions were re-determined through kriging, using the XY coordinates of the individuals. For each individual, a point cloud (comprising trunk points) with a horizontal distance of less than 0.5 m from the planting location and at a certain height above the ground (1.1–1.3 m for the BLS and 5–7 m for the ULS) was extracted (Figure 2). Point clouds of different height ranges were used on these two platforms owing to the variations in the number of point clouds. The number of point clouds acquired using the BLS in the 1.1–1.3 m above ground level range was 2,189,352, whereas the ULS detected 517,379 point clouds in the 1–3 m range above ground level. This was less than the number of BLS sensors and was insufficient for diameter estimation. The number of ULS point clouds at 5–7 m above ground level was 3,060,448, approximately six times higher than that at 1–3 m above ground level. Therefore, point clouds in the range of 5–7 m above the ground were used for position and diameter estimations using ULS.
Subsequently, the XY coordinates of the tree trunk points were used to fit a circle and estimate the tree trunk radius (Figure 3). Specifically, we minimized the function v b , c described in Equation (6), where b represents the circle radius, and c = ( c x , c y ) denotes the center XY coordinates. Function v b , c comprises two components: v 1 b , c and v 2 b , c . The function v 1 b , c quantifies the percentage of points within a distance b ± w from the center of the fitted circle, where w is a ranging error adjustment parameter (set to 0.035). The function v 2 b , c evaluates the directional variation of the points from the center of the circle, calculated as one minus the average magnitude of the position vectors from the center of the fitted circle for points falling within b ± w . The minimization was performed using the fminsearch function [23] in MATLAB (Version R2021a) [24], which estimates the minimum of an unconstrained multivariable function without derivatives. The initial values of c and b were set as the average of the center of gravity of the trunk point and their distance from it for each individual.
v b , c = v 1 b , c + v 2 b , c
v 1 b , c = d i n
v 2 b , c = 1 1 d i d i P x , i c x P x , i c x 2 + P y , i c y 2 2 + 1 d i d i P y , i c y P x , i c x 2 + P y , i c y 2 2
In Equations (6) and (7), P x , i and P y , i represent the X- and Y-coordinates of the trunk point, respectively, n denotes the number of trunk points, and d i is defined as follows: d i takes the value of 1 when point P i satisfies the condition P x , i c x 2 + P y , i c y 2 b < w , and 0 when it does not.
The measurement accuracy was assessed through linear regression using the trunk diameter estimated using the method described above as the response variable and hand measurements as the explanatory variable (Equations (9) and (10)). The root mean square error (RMSE) and coefficient of determination were calculated. For the BLS, individuals with an estimated diameter greater than 40 cm (equivalent to 18%) were identified as outliers and excluded from the analysis.
D B L S = a 1 D M a n u a l + b 1
D U L S = a 2 D M a n u a l + b 2
The estimation of tree height was performed in the following sequence using denoised point cloud data of ULS: calculation of digital surface model (DSM), detection of treetops and matching them with planting locations, and subtraction of DTM from the tree top locations. The grid size was set to 0.05 m for the DSM calculations and a window size of 2 m was set for tree top detection using the local maximum filter. Treetop positions were matched by selecting the closest candidate within 1 m of the planting location as the individual’s tree top position. Finally, the ground height at the planting location was subtracted from the Z-coordinate of the tree top location to obtain the tree height value.

2.5. Genotyping of Genome-Wide High-Density Markers

Genome-wide marker genotypes were acquired through the RAD-Seq analysis of 333 trees using DNA samples. Genomic DNA was extracted from young leaf tissues using the DNeasy Plant Mini Kit (QIAGEN, Hilden, Germany) following the manufacturer’s protocol. Base variants were identified using ddRAD-Seq reads. Library construction was performed as described by Shirasawa et al. [25], and dd-RAD-Seq sequences were obtained using the DNBSEQ-G400RS platform (MGI Tech Co., Ltd., Shenzhen, China). Reads were aligned to the published Japanese larch (Larix kaempferi) genome [26] using Bowtie 2 [27]. A variant call was conducted using bcftools 0.1.19 mpileup in SAMtools [28], followed by variant quality filtering using vcftools [29]. Missing entries in the marker genotype data were imputed using Beagle 5.4 [30].

2.6. Estimation of Heritability

Genomic heritability was estimated using genome-wide marker data for each DBH measured obtained through three methods: the DBH from hand-measured records in 2020 and the DBH estimated from BLS and ULS. Data from 43 individuals with genome-wide markers and complete phenotypic data indicating no missing entries across the four traits (three DBH measurements and tree height) were used for the estimation. Additionally, the heritability of tree height was estimated from the ULS-derived point cloud using the same individuals.
To estimate genomic heritability, markers with a frequency of three or fewer individuals, corresponding to a minor allele frequency below 0.02% were initially excluded from the genome-wide marker genotype data. Subsequently, the marker genotype scores (0, 1, 2) were standardized to have a mean of zero and a variance of one and were arranged into a matrix format as X . Rows represented individuals, and columns represented markers. The genomic relationship matrix, denoted by G , was derived from X using Equation (11).
G = X X m
In Equation (11), m represents the number of markers. The R package BGLR [31] was used to estimate parameters of a Bayesian generalized linear regression model for each of the four traits (DBH measured using the three methods and tree height), serving as response variables. Matrix G was used as the covariance structure of the multi-normal distribution to which the genetic values, specifically breeding values, adhered ( g in Equation (12)).
y = μ 1 + g + ε
In Equation (12), y represents the vector of the response variable (DBH or tree height), μ stands for the overall mean, 1 is a vector of elements equal to 1 with dimensions matching the number of individuals ( n ), g signifies the vector of breeding values accounted for by the genomic relationships, assuming a multivariate normal distribution g ~ N 0 ,   G σ g , and ε represents the vector of residuals, assuming a multivariate normal distribution ε ~ N 0 ,   I σ e . I denotes the n × n -dimensional identity matrix.
h 2 = σ g σ g + σ e
The ratio of genetic variance to total variance (genetic variance   σ g + environmental variance   σ e was estimated as the genomic heritability, as shown in Equation (13).

2.7. Genetic Correlation and Timber Volume Selection Accuracy

To assess the accuracy of timber volume selection based on remotely sensed traits, genetic correlations between these traits (including timber volume) were estimated. Calculations followed the methods outlined by Xu [32], with reference to previous studies [33,34,35].
First, a multi-trait model (Equation (14)) was applied where the phenotypes comprised the logarithms of DBH (measured by hand, BLS, ULS) and tree height values. This model estimated heritability, genetic variance, genetic correlation, and genetic variance–covariance matrices. Notably, the logarithmic values of DBH and tree height were used for subsequent calculations.
In Equation (14), y represents the vector with a length equal to the number of individuals multiplied by the number of traits (four), μ denotes the vector whose elements correspond with the overall mean, ε represents the vector of residuals, and g represents the vector of genetic effects, considering the covariance between traits and the genomic relationships, i.e., g ~ N 0 , Σ G σ g 2 , where Σ is the among-trait genetic covariance matrix to be estimated and is the Kronecker product.
y = μ + g + ε
We assessed the accuracy of the timber volume selection based on DBH ( D ) and tree height ( H ). Assuming that the main trunk of a larch tree is conical, timber volume ( V ) can be expressed as V = C D 2 H , where C is a constant. We modeled the logarithmic expression of timber volume as Equation (15), using tree height derived from the point cloud and the DBH value.
S = log V = 2 log D + log H + C
In general, the volume equation ( V = a + b · H · D 2 ) is used, but we use its logarithmic transformation here. Taking the logarithm of the relationship between V, H, and D transforms the volume equation into a linear relationship between log V , log H , and log D . This linearity allows the equation to be utilized as a selection index for breeding purposes.
Here, we assumed that S could be calculated using hand-measured DBH and that the estimated tree height was the actual value.
Subsequently, we derived an optimized equation for inferring S (referred to as the selection index I; see Equation (16)) indirectly using a linear combination of measurements in the three patterns to evaluate the accuracy of timber volume selection. Pattern 1 involved hand-measured DBH and tree height; pattern 2 involved DBH measured using BLS and tree height and pattern 3 involved DBH measured using ULS and tree height.
Where X represents the measurement pattern, P is the covariance matrix of the estimated values of the three traits, and K is the genetic covariance matrix. Phenotypes were calculated after normalization to a mean of zero and a variance of one. The optimal weight b can be expressed as shown in Equation (17), where w is the weight of the target trait, with two assigned to DBH hand measurements and one assigned to tree height measurements, according to the model equation for timber volume.
I = b X
b = P 1 K w
b represents the weight assigned to the measurements in each pattern to estimate the genetic ability of timber volume. Subsequently, the correlation coefficient between the selection index I and target trait S was calculated (Equations (18)–(20)). The correlation coefficient r represents the accuracy of estimating the genetic ability of timber volume, that is, the accuracy of timber volume selection based on the estimation. These values were calculated for the three patterns and compared.
r = c o v I , S σ I σ S = b T K w σ I σ S
σ I 2 = v a r I = b T P b
σ S 2 = v a r S = w T K w

3. Results

3.1. Tree Location Estimations

As a result of the planting location estimation of individual trees, 578 of 602 trees were estimated using BLS, whereas 546 of 602 trees were estimated using ULS (Figure 1A). Among them, 524 trees were estimated using both methods. For these 524 trees, the mean, median, and standard deviation calculated to determine the consistency of the planting locations estimated using the BLS and ULS were 0.32 m, 0.26 m, and 0.25 m, respectively.

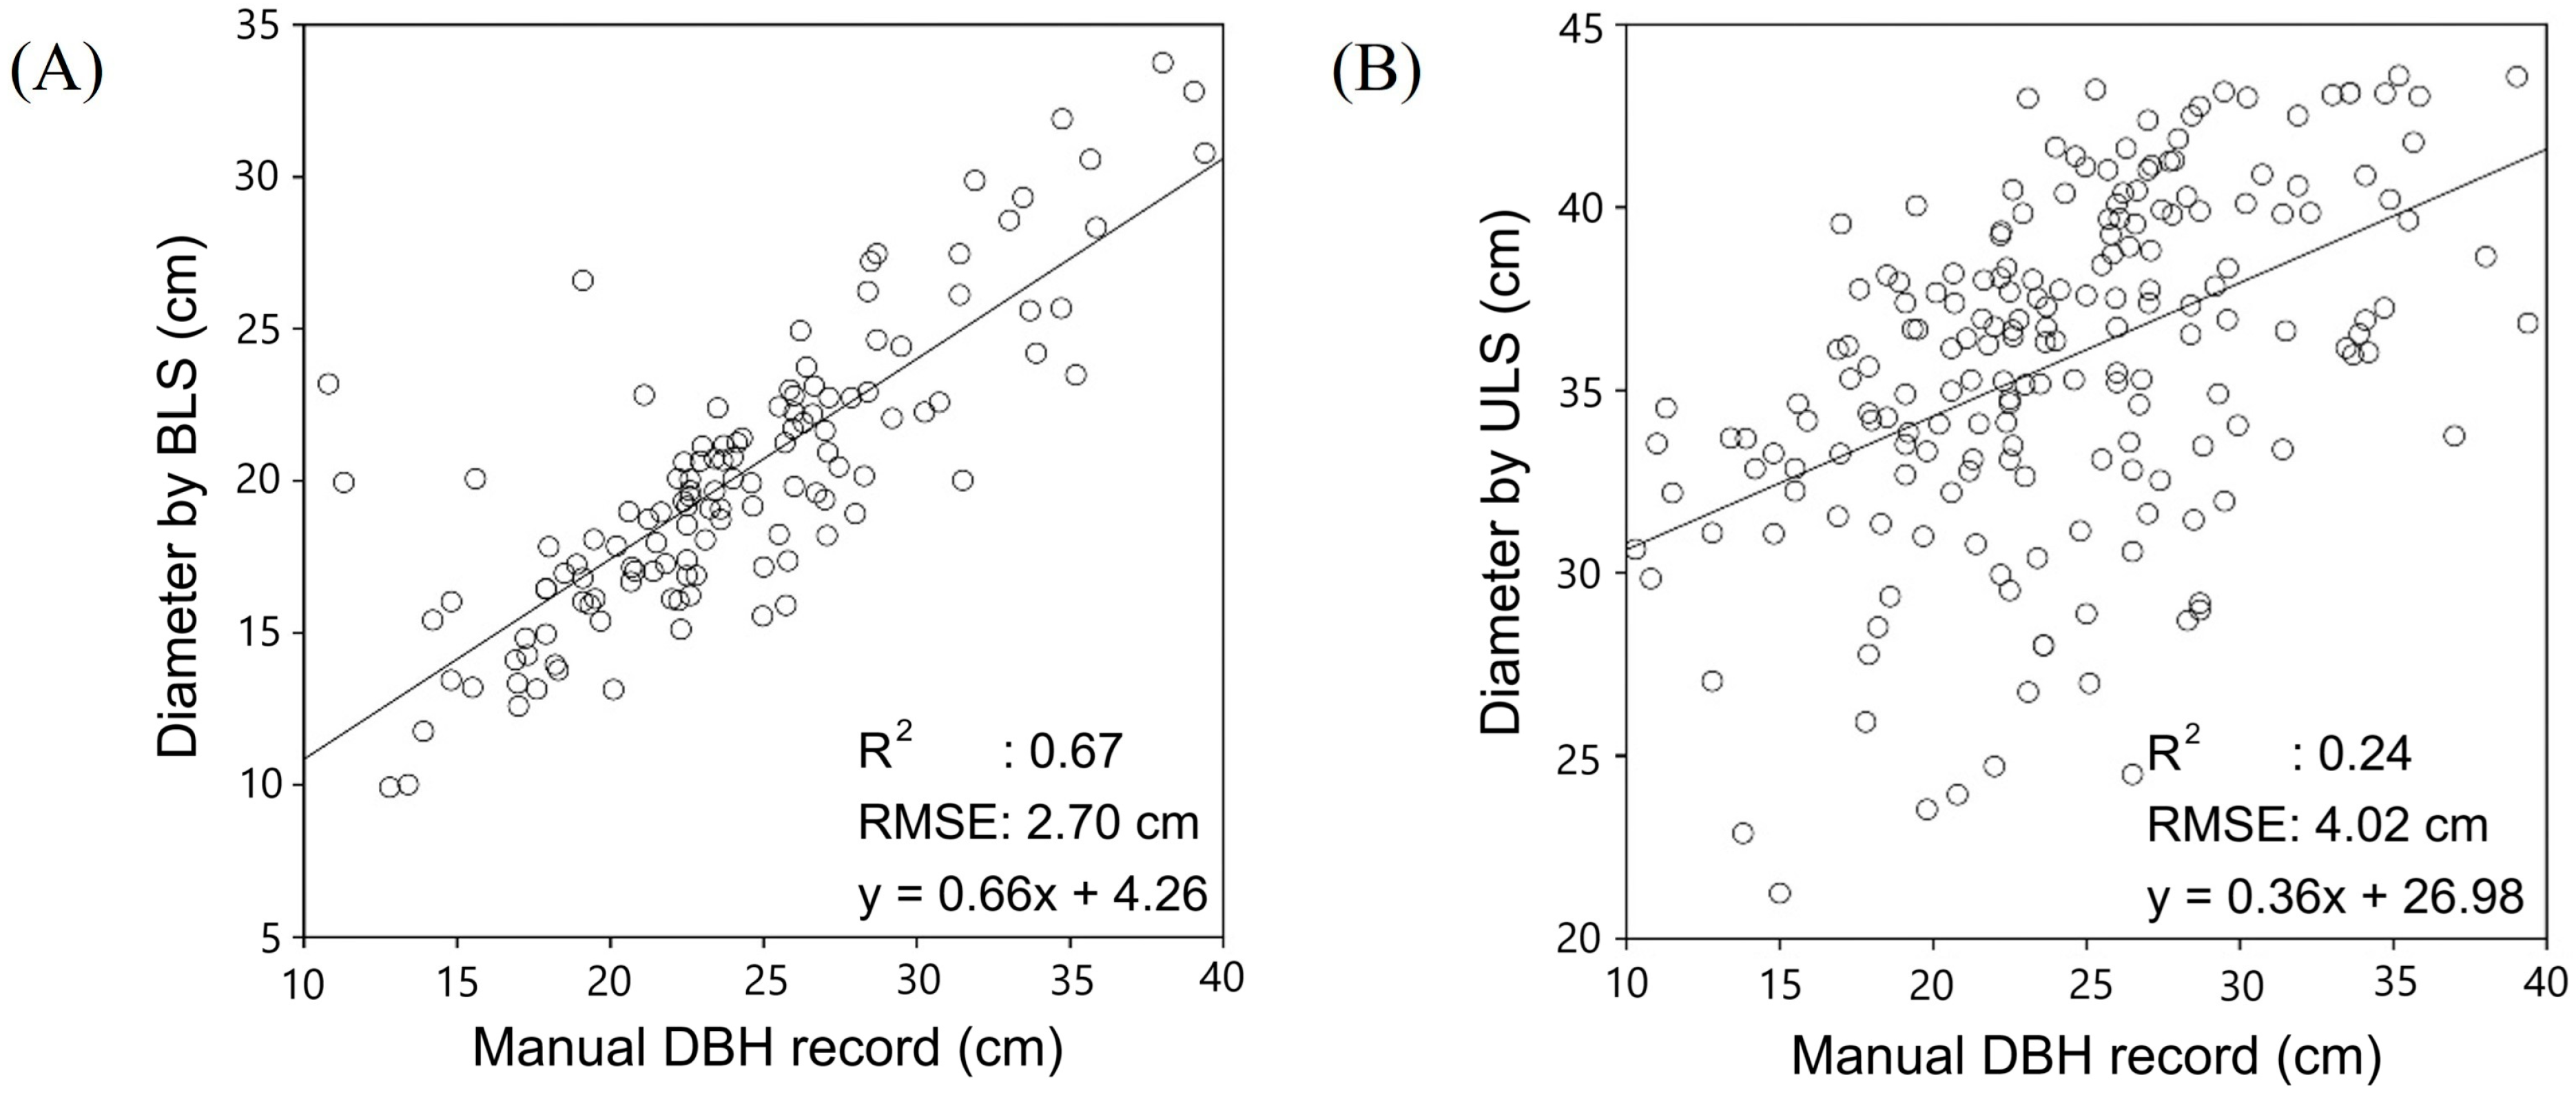
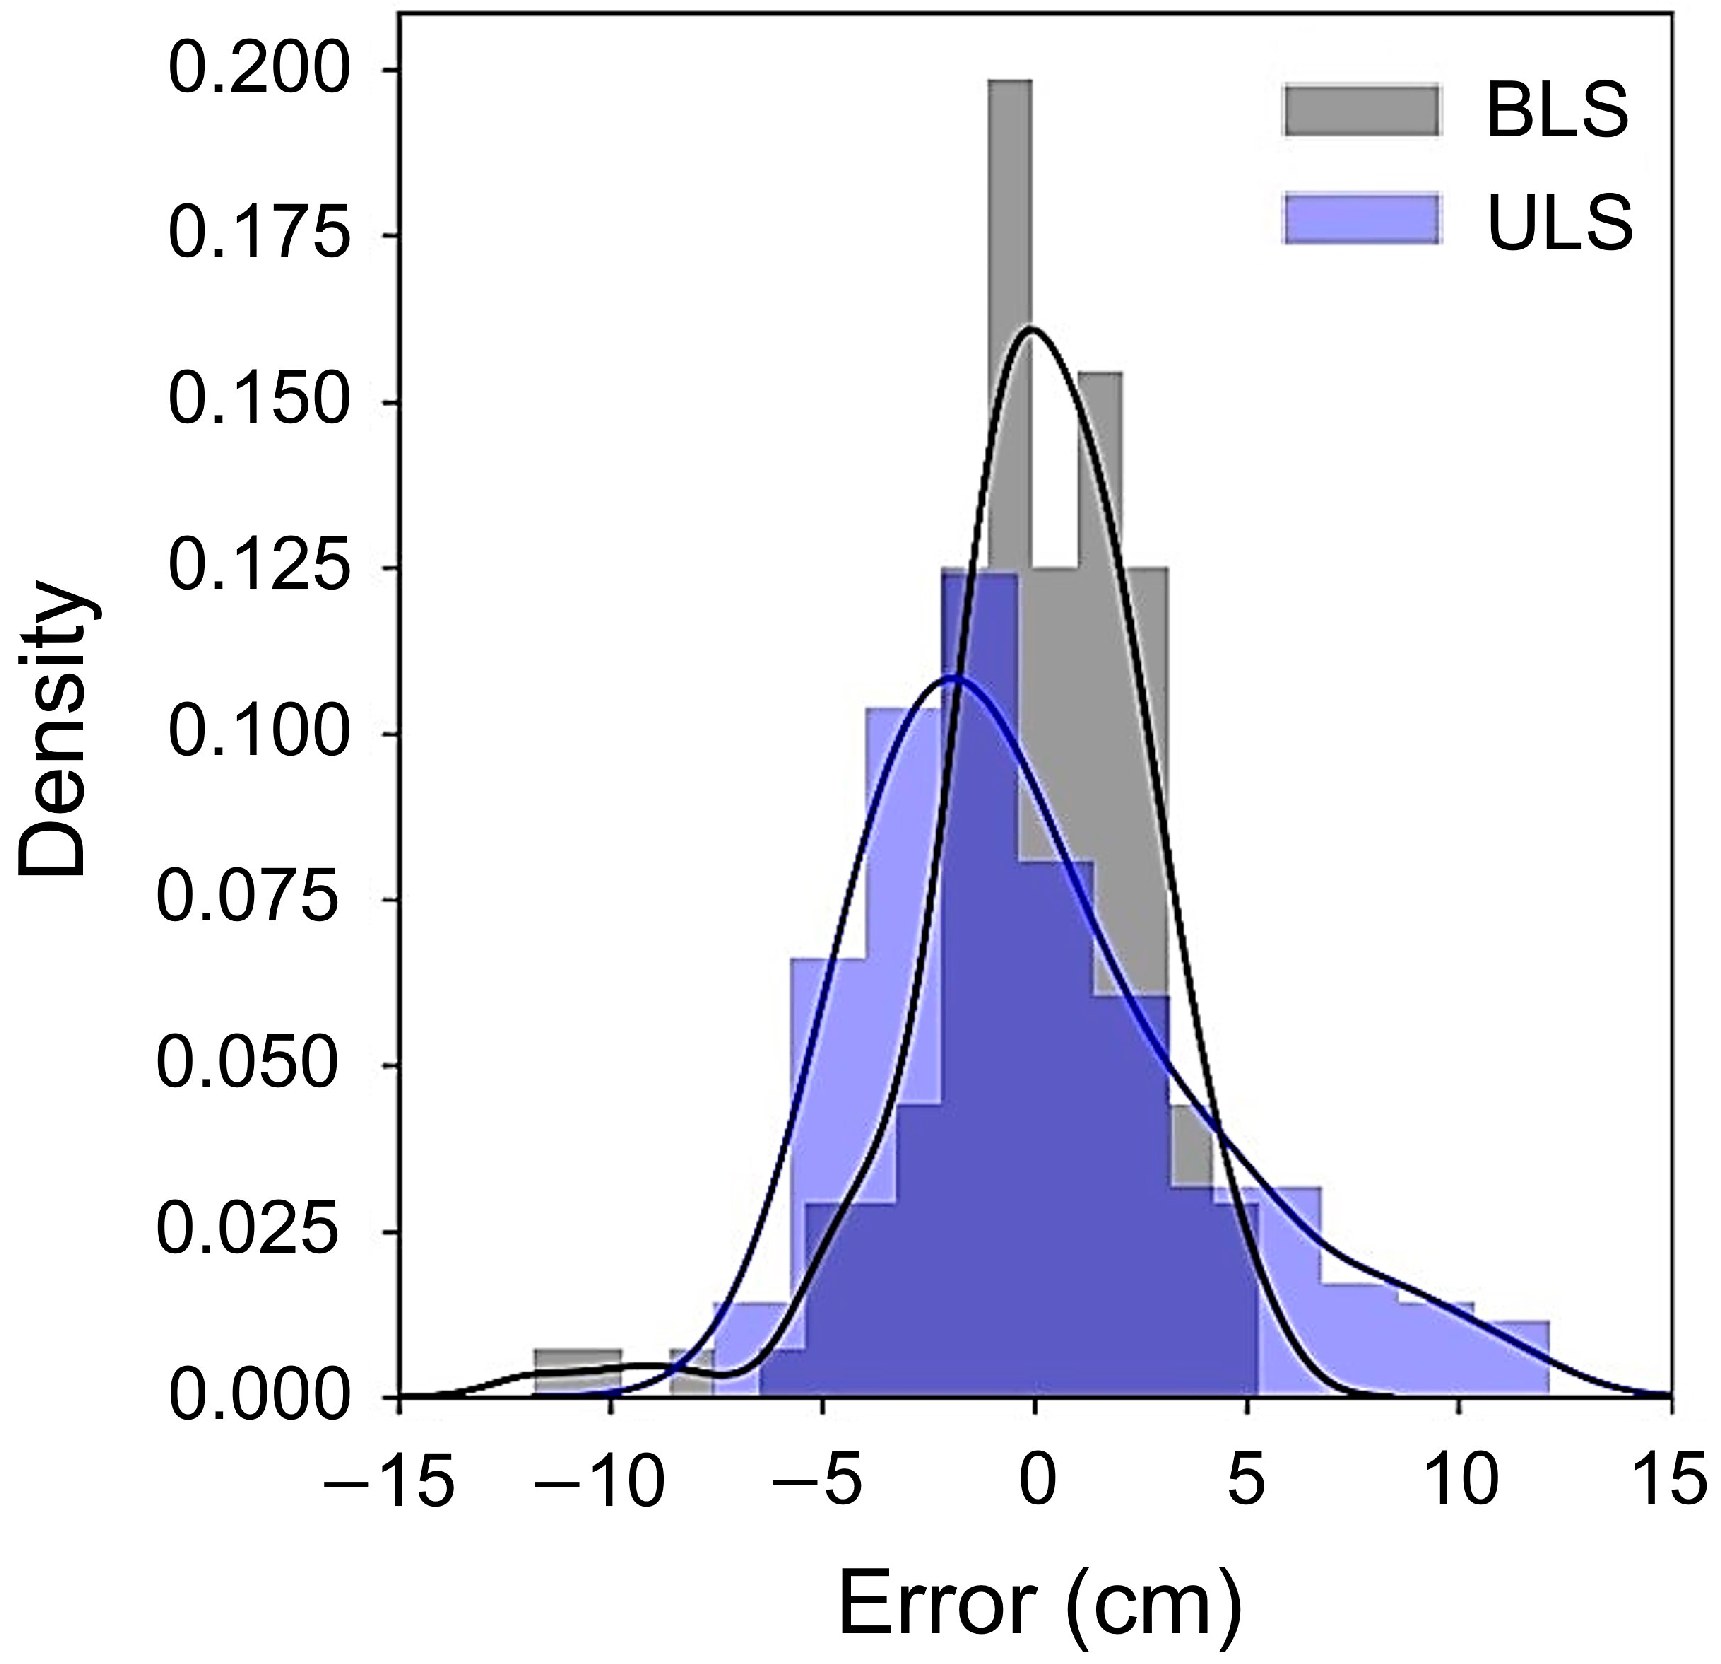
3.2. Accuracy of DBH Estimation

The accuracy of DBH estimation obtained using both BLS and ULS was validated against hand measurements (Figure 4). The estimation accuracy yielded RMSE values of 2.7 cm (13%; RMSE%) and 4.0 cm (11%), with a mean of 20.5 cm and 35.8 cm and coefficient of determination values of 0.67 and 0.24 for the BLS and ULS, respectively. Notably, BLS exhibited superior accuracy compared with that of the ULS. The median and standard deviation of the errors were recorded as 0.01 cm, and 2.7 cm for the BLS, and 0.9 cm and 4.0 cm for the ULS, respectively. This indicates that ULS tends to slightly underestimate DBH. Figure 5 illustrates histograms of the errors and their kernel densities. Major error sources included climbing plants entwined around trunks as well as understory vegetation and shrubs near the trunks. Additionally, branches could have introduced noise into the measurements. At the BLS, where the point cloud height was 1.1–1.3 m above ground level, there are almost no branches. However, at the ULS, with a point cloud height of 5–7 m, branches could appear in the trunk point cloud, potentially impacting the measurements. Although Equation (6) was constructed to mitigate the effect of branches, the reduction may not have been sufficient.

3.3. Heritability of DBH and Tree Height

The heritability of the manually measured DBH was found to be 0.60. In comparison, the heritability of DBH estimates obtained through BLS and ULS were 0.62 and 0.53, respectively. The heritability of DBH using BLS surpassed that of manually measured DBH. Additionally, the heritability of tree height estimated using ULS was 0.52. A bar plot of the estimated heritability is shown in Figure 6.

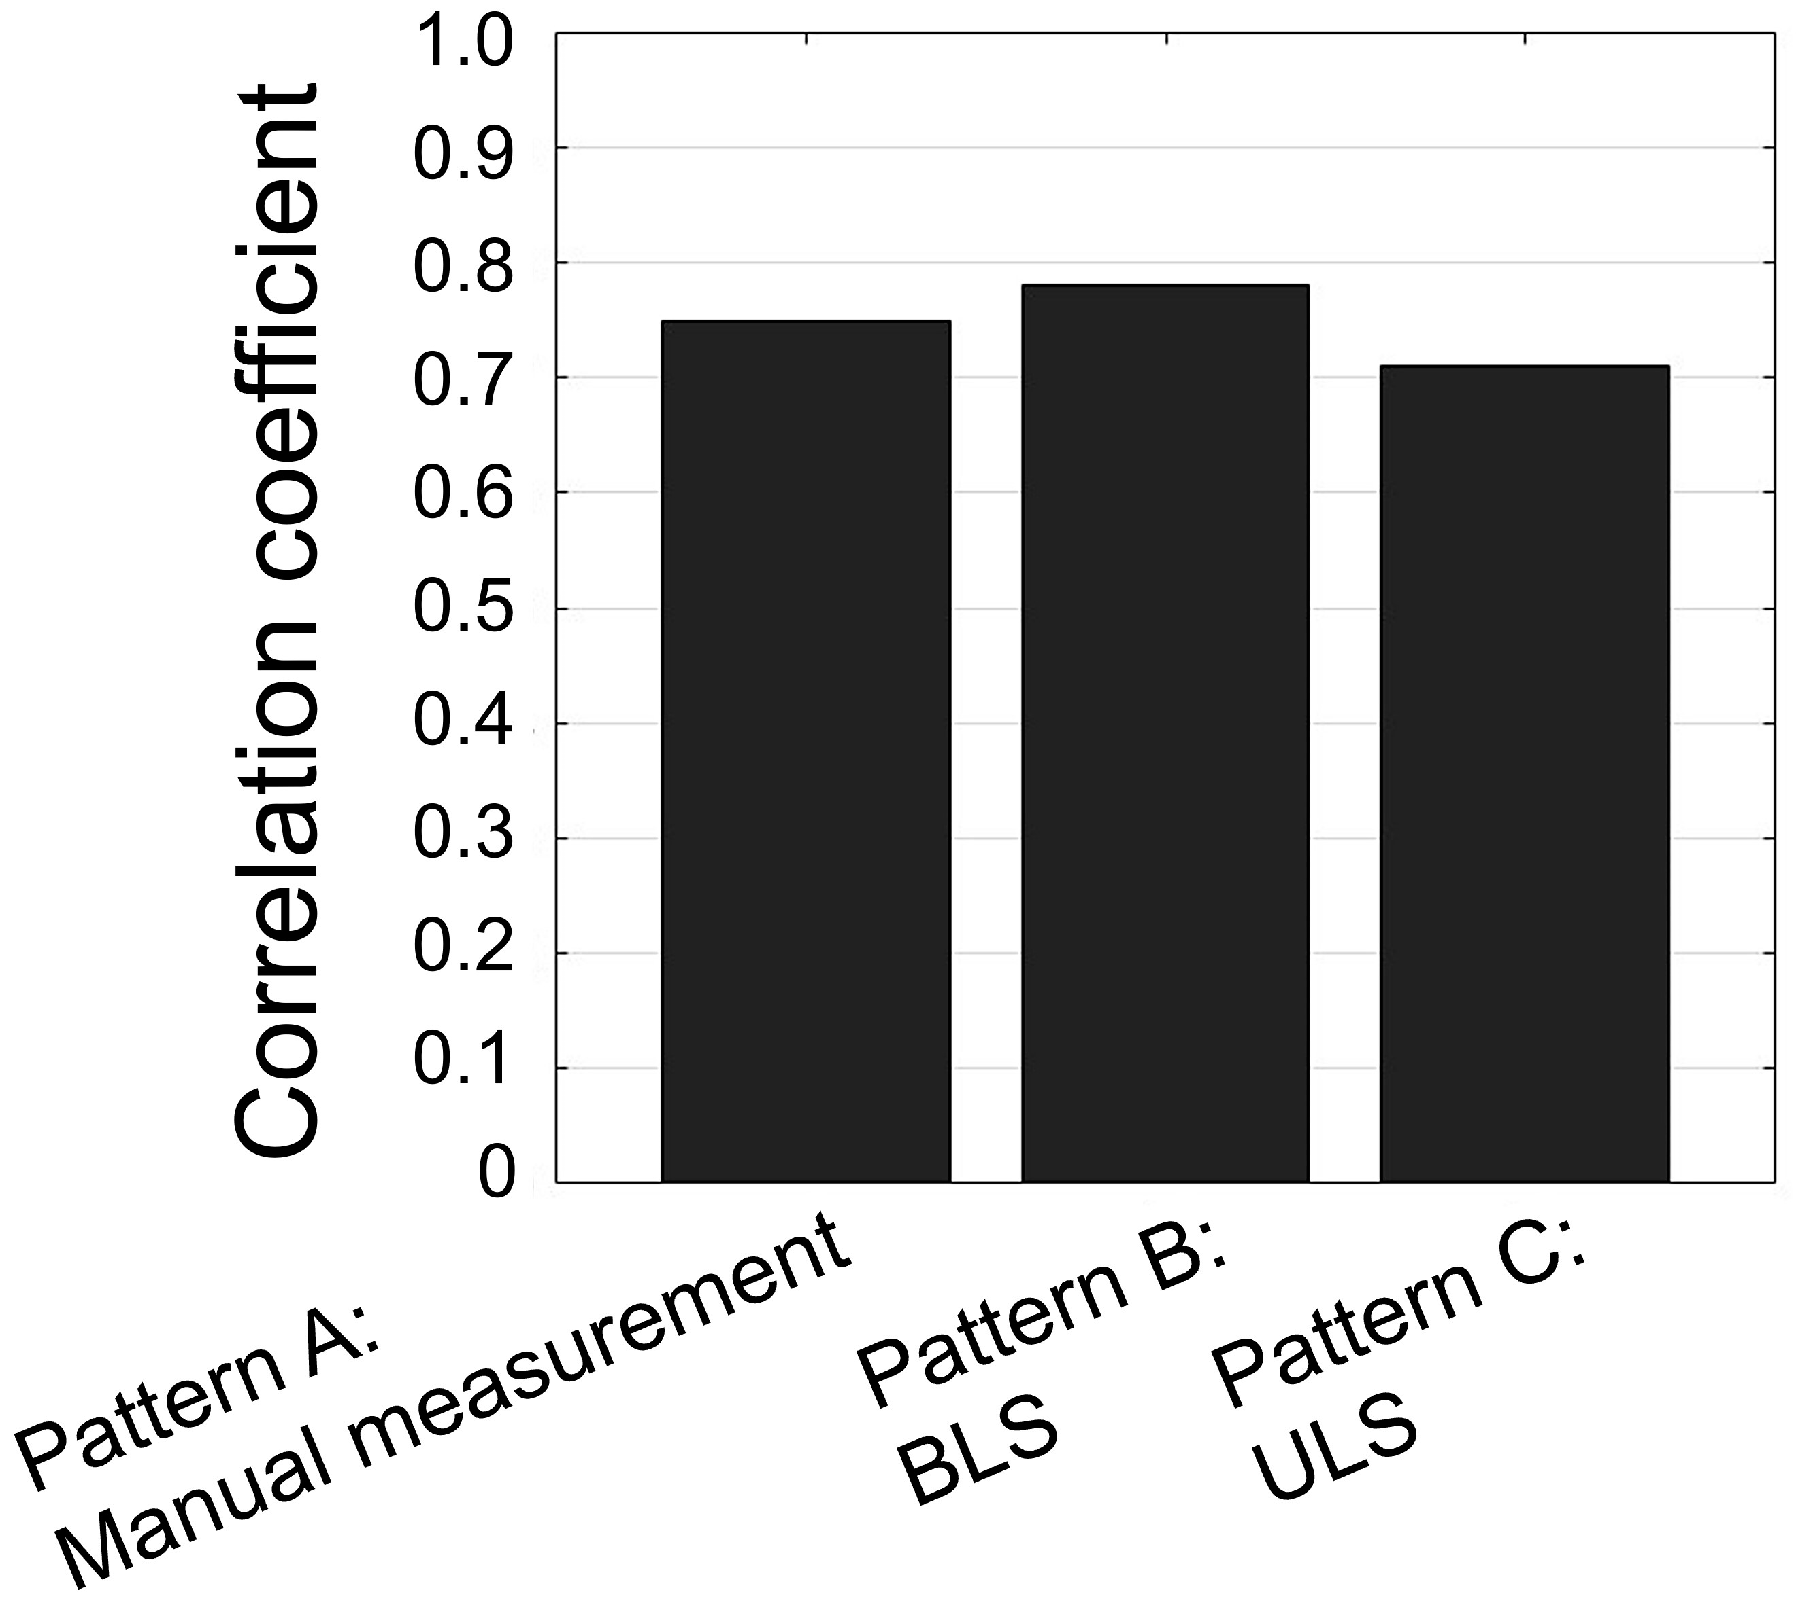
3.4. Genetic Correlation Among Traits and Accuracy of Timber Volume Selection

The genetic correlation between manually measured DBH and DBH estimated with BLS and ULS was 0.82 and 0.57, respectively (Table 2). The genetic correlation for tree height was 0.74 for manually measured DBH, whereas it was 0.66 and 0.55 for DBH estimated using BLS and ULS, respectively.
To assess the accuracy of the genetic ability estimation for timber volume, the correlation between the selection index and target trait V was calculated for the three combinations of tree height and DBH measurements using different methods.
The correlation coefficients ( r ) between selection index I and target trait V were 0.75 for pattern A using hand measurements, 0.78 for pattern B using BLS, and 0.71 for pattern C using ULS for DBH measurements (Figure 7). Notably, pattern B, which used BLS, exhibited the highest correlation.
The weights (b) in selection index I were determined to be 3.50 and 3.55 for DBH and tree height, respectively, for pattern A; 4.05 and 4.12 for pattern B and 3.49 and 4.01 for pattern C. Patterns B and C, which were based on LiDAR-based DBH measurements, indicate that selection should assign a stronger weight to DBH than that to tree height.

4. Discussion

4.1. Comparison of Accuracy with Previous Studies

This study evaluated two different platforms for measuring tree biomass-related traits: DBH and tree height. Previous studies on DBH measurements using LiDAR can be categorized into those using airborne laser scanning (ALS) (primarily with aircraft or UAVs as platforms), TLS or Mobile Laser Scanning (MLS). The BLS used in this study falls under MLS, whereas the ULS belongs to ALS.
Among studies using ALS to measure DBH, Brede et al. [11] reported a coefficient of determination of 0.96 and an RMSE of 4.24 cm (using TLS estimates as the reference value), Yao et al. [12] documented a coefficient of determination of 0.88 and an RMSE of 4.15 cm (9.65%) for coniferous trees, Popescu et al. [13] found a coefficient of determination of 0.87 and an RMSE of 4.9 cm (18%), and Dalla Corte et al. [5] achieved a coefficient of determination of 0.77 and an RMSE of 3.46 cm. Previous studies using TLS include Huabing et al. [15], who reported a coefficient of determination of 0.79 and an RMSE of 3.40 cm; Monika et al. [16], with a coefficient of determination of 0.91 and an RMSE of 9.17 cm; Sanzhang et al. [17], with an RMSE of 0.70 cm and a relative error of 2.3% and Liu et al. [14], who reported an RMSE of 3.17 cm and a mean absolute percentage error of 12% for natural forest, and 1.97 cm and 6%, respectively, for urban forests. Additionally, Zhang et al. [36] reported an accuracy of coefficient of determination 0.92 and RMSE 1.48 cm using BLS. Although the accuracy of DBH estimation may vary depending on factors such as tree species, individual characteristics, forest conditions, LiDAR accuracy, and algorithms used, the results of this study—coefficient of determination of 0.67 and RMSE of 2.3 cm (13%) for BLS, and coefficient of determination of 0.24 and RMSE of 4.0 cm (11%) for ULS—compare favorably with findings from previous studies.
The number of larch individuals used in the experiment, 602, is possibly too small to evaluate the accuracy of DBH measurements by LiDAR. However, one of our main objectives—evaluating the accuracy of biomass measurement using LiDAR from a quantitative genetic aspect—requires a sample of a mature tree population with preserved pedigree information, which is challenging to obtain in large numbers. Using trees from this study site allowed us to conduct a quantitative genetic study, though it limited the extent to which we could examine measurement accuracy.

4.2. Required Accuracy Level

Several factors must be considered when determining the requisite accuracy of DBH measurements. First, assessing the ranging accuracy of LiDAR systems is imperative. Considering the nominal accuracies of the BLS and ULS used in this study, which were 2–3 cm and 5–10 cm, respectively, the DBH measurement accuracies of 2.7 cm (13%) and 4.0 cm (11%), respectively, are justifiable. Second, although manually measured DBH is typically rounded to the nearest centimeter, it is crucial to acknowledge that this does not imply a precision level of 1 cm. Variations in the orientation, height, and tilt of the caliper against the tree trunk can introduce significant error margins in manual measurements. Additionally, for the accurate assessment of biomass accumulation in forests, simultaneous measurements of tree height and DBH are essential, as underscored in this study. Although tree height measurement accuracy was not evaluated in this study owing to the absence of true values, future accuracy verification will be indispensable for precise biomass measurement.
Furthermore, in terms of forest tree breeding, heritability has emerged as a pivotal criterion for evaluating accuracy. A measurement method that exhibits high heritability, indicating a significant proportion of genetic variation among observed variations, is required to enhance genetic improvement efficiency. Given that the genomic heritability of DBH was estimated at 0.60 from hand measurements, 0.62 from BLS, and 0.52 from ULS, it became evident that BLS provided a superior estimation of heritability compared with that of the ULS (Figure 6). The disparity between BLS and ULS can be attributed to the difference in the DBH measurement accuracy, with a coefficient of determination of 0.67 and RMSE of 2.3 cm (13%) for BLS compared with 0.24 and 4.0 cm (11%), respectively, for ULS. One explanation for the heritability of BLS exceeding that of hand measurements is the use of a point cloud from the entire circumference of the trunk for the BLS diameter estimation. In contrast, hand-measured diameters were measured in one direction and did not account for distortions in the regular trunk circle. While the difference in heritability is small and does not necessarily suggest that BLS is superior to hand measurements, it does indicate that BLS achieved a comparable accuracy level in heritability estimation to hand measurements.

4.3. Potential Accuracy of Timber Volume Selection

This study investigated the feasibility of accurately selecting timber volume as an additional criterion for evaluating the precision of LiDAR-based DBH and tree height measurements.
Timber volume measurement is pivotal in forest management, closely linked to estimating forest carbon sequestration, and is a key target for natural forest trees. In this study, timber volume was defined as 2log(D) + log(T) + C, based on tree height (H) and hand-measured DBH (D), serving as the improvement target V. Subsequently, the optimal selection index for V was derived from the linear combination of tree height and DBH measured manually and using the two types of LiDAR. The correlation between the selection index and the genetic variation of V was calculated. Three measurement patterns were assumed for the selection index calculation: Pattern A used hand-measured DBH as D, Pattern B used DBH measured with BLS as D, and Pattern C used DBH measured with ULS as D. Finally, we assessed how the accuracy of genetic variation estimation in the selection index varied across these three patterns, considering the genetic correlations among the traits.
The results revealed that the index of selection accuracy, r (correlation between the selection index and genetic variation of V), was 0.75 for hand measurements, 0.78 for BLS, and 0.71 for ULS (Figure 7). Compared with hand measurements, the accuracy was the highest when BLS was used and was slightly less accurate when ULS was used. However, the difference in the accuracy among the three methods was marginal. These findings indicate that both BLS and ULS exhibit similar performance in timber volume selection, suggesting comparable selection accuracy between the two methods. Moreover, using ULS for timber volume selection is highly practical because it allows for the simultaneous measurement of tree height and DBH, thereby streamlining the process.
When the target trait is derived from individually measured traits, the selection accuracy cannot be determined solely by the accuracy of the individual measurements. The optimal measurement methods can be explored by performing the calculations presented in this study. In particular, when a target trait can be evaluated based on traits that have not been conventionally used, such as DBH measured by LiDAR and UAV, performing evaluations akin to those in this study becomes crucial.

4.4. Differences Between Platforms and Conditions for Acquiring Point Cloud Data

The acquisition and analysis of point clouds using two different platforms, a backpack and a UAV, revealed notable differences. These variances encompass the concentration of point clouds in specific regions, resulting in discrepancies in measurable features, timeframes, and tree species.
The BLS platform acquires point clouds by emitting a laser beam approximately 2 m above the ground. Consequently, the point clouds were primarily concentrated on the ground and tree trunks. This setup renders it unsuitable for tree height estimation but well-suited for estimating DTMs and DBH. In contrast, the ULS platform emits lasers from above the area to be measured, resulting in point clouds concentrated within the tree canopy. Consequently, the point clouds for the trunk and the ground diminished, as the lasers were obstructed by the canopy. This configuration ensures highly accurate tree height measurements, but results in less accurate DBH measurements. Brede et al. [11] also noted limitations in detecting canopy tops using the TLS. Although ALS was once considered the most accurate method for measuring tree height among the previous methods underestimation of tree height remained (owing to laser pulses missing the top of the tree). A UAV with a dramatically increased point density overcame this problem and enabled more accurate tree height measurements.
Considering these characteristics, certain conditions for point cloud acquisition for diameter estimation have become apparent. For deciduous coniferous trees, such as larches, ULS measurements are recommended during the defoliation period. Conversely, for evergreen trees, the use of BLS is preferable, at least based on the point-cloud density and positioning accuracy observed in this study. Thus, platform selection should be tailored to the specific features to be measured, ensuring optimal results.

4.5. Significance and Comparison of Location Estimation

The ability to precisely measure the positions of individual trees using LiDAR represents a significant advantage, particularly in forested areas where GNSS reception is challenging due to dense canopy cover. Accurately determining planting locations using LiDAR offers valuable insights, especially when integrated with other datasets, such as passive remote sensing data [37]. Tree location information can also be used to calculate tree density within a certain area. When combined with DBH data, this information may allow us to estimate the density of trees with a DBH greater than a specific value. In cases where trees are planted in a regular pattern, as in our study, we recommend using the method proposed herein for the semiautomatic estimation of the planting location of each individual tree.
Our study found that the estimated positions obtained from both BLS and ULS exhibited good agreement, with an average difference of 0.3 m. However, the primary factor contributing to positional discrepancies could be the positioning accuracy of the BLS. As illustrated in Figure 1B, there are instances in the point cloud data acquired from Walk_B and Walk_C of the BLS where trunk positions do not align. This discrepancy implies a limitation in the positioning accuracy of BLS when used without GNSS. Pierzchała et al. [38] noted that improved SLAM techniques could enhance tree location estimation accuracy, suggesting promising avenues for refining positioning techniques such as SLAM.

4.6. Applications in Forest Management and Tree Breeding

Focusing on larch as a case study enhances the practical significance of this study by considering its importance from three perspectives: environmental conservation, forest management, and breeding. Accurate monitoring of larch growth is crucial due to its environmental, ecological and economic value.
From an environmental conservation perspective, precise biomass measurement and quantification of carbon sequestration are essential for assessing ecosystem health and carbon stocks, which are vital for climate change mitigation. These indicators are increasingly linked to carbon credit markets, providing financial incentives for sustainable forest management.
From a forest management perspective, efficient and low-labor forest inventories are critical. In regions like Japan, where forests often occupy steep terrain, manual tree-by-tree surveys are not only labor-intensive but also challenging and prone to inaccuracies, particularly in measuring tree height. These factors make it difficult to conduct comprehensive surveys across entire mountainous forests.
From a breeding perspective, developing larch varieties with superior growth and uprightness requires accurate measurements to identify promising individuals and support a rigorous selection process. Additionally, efficient measurement of large populations is necessary to increase selection intensity and improve breeding efficiency.
The features and methods developed in this study, including ULS and BLS technologies, demonstrate significant potential for larch-specific monitoring. Applying these technologies to larch research can aid in developing operational guidelines and decision-support tools, such as standardized measurement protocols and visualization systems tailored to conservation and breeding objectives. These tools will equip forest managers and breeders with practical solutions to promote sustainable forest practices.

5. Conclusions

This study explored the application of BLS and ULS for DBH measurement and genomic heritability estimation. Moreover, their accuracy was compared with that of manual measurements. We found that BLS exhibited high accuracy, with a coefficient of determination of 0.67 compared with 0.24 for the ULS. Furthermore, the heritability of DBH surpassed that of hand-measured DBH. We also assessed the accuracy of timber volume selection, which revealed comparable performance between BLS and ULS.
These findings underscore the potential of LiDAR remote sensing for biomass growth measurements and the genetic enhancement of the carbon sequestration ability of forest trees. Additionally, our analysis enabled the automatic estimation of tree locations for over 90% of the trees, leveraging coordinates from point cloud data and plantation maps. To fully evaluate the genetic potential of LiDAR remote sensing in forest management and tree breeding, further studies should investigate how various conditions, such as the presence of climbing plants and understory vegetation, planting density, tree height, and degree or absence of defoliation, affect measurement accuracy.

Author Contributions

Conceptualization, H.S. and H.I.; methodology, H.S. and H.I.; software, H.S. and S.I.; validation, H.S.; formal analysis, H.S., S.I. and M.I.; investigation, H.S., N.M., W.G. and H.I.; resources, K.K. and Y.U.; data curation, H.S. and N.M.; writing—original draft preparation, H.S.; writing—review and editing, H.I.; visualization, H.S.; supervision, H.I.; project administration, H.I. and funding acquisition, H.I. All authors have read and agreed to the published version of the manuscript.

Funding

This research was funded by SUMITOMO FORESTRY Co., Ltd.

Data Availability Statement

The raw data supporting the conclusions of this article will be made available by the authors on request.

Acknowledgments

The BLS data used in this study were kindly provided by Leica Geosystems and we express our sincerest gratitude to Leica Geosystems. We would also like to thank the Fuji Iyashinomori Woodland Study Center and technical specialists Norio Nishiyama and Ryoko Tsuji for their cooperation in obtaining the data for the test site for hybrid larches, which is under the jurisdiction of the center. We are deeply thankful to Seiji Ishibashi for providing us with hand-measured DBH data. We also thank Akiko Watanabe, Yoshie Kishida, Hisano Tsuruoka, Keishi Ozawa, Taeko Shibazaki, and Yukio Matsumoto of Kazusa DNA Research Institute for their technical assistance.

Conflicts of Interest

Authors Yamato Unno and Kazutaka Kusunoki were employed by the company Sumitomo Forestry Co., Ltd. The remaining authors declare that the research was conducted in the absence of any commercial or financial relationships that could be construed as a potential conflict of interest.

Appendix A

The analysis flow of the point cloud is delineated in Figure A1, Figure A2, Figure A3 and Figure A4, where Figure A1 illustrates the entire analysis flow, Figure A2 shows the location estimation of individual trees, Figure A3 elaborates on the details of the DBH estimation, and Figure A4 explains the tree height estimation.
Figure A1. Analysis flow of point cloud data. The procedure for estimating planting location and diameter at breast height (DBH) using point clouds acquired by backpack laser scanning is shown on the left side, and by unmanned aerial vehicle laser scanning on the right side. Abbreviations: DTM, digital terrain model; LiDAR, light detection and ranging [22].
Remotesensing 16 04790 g0a1
Figure A2. Individual location estimation in the point cloud data analysis flow.
Remotesensing 16 04790 g0a2
Figure A3. Diameter at breast height (DBH) estimation in the analysis flow of point cloud data.
Remotesensing 16 04790 g0a3
Figure A4. Tree height estimation in the point cloud data analysis flow.
Remotesensing 16 04790 g0a4

References

  1. Zhao, J.; Xie, H.; Ma, J.; Wang, K. Integrated remote sensing and model approach for impact assessment of future climate change on the carbon budget of global forest ecosystems. Glob. Planet. Chang. 2021, 203, 103542. [Google Scholar] [CrossRef]
  2. Case, M.J.; Johnson, B.G.; Bartowitz, K.J.; Hudiburg, T.W. Forests of the future: Climate change impacts and implications for carbon storage in the Pacific Northwest, USA. For. Ecol. Manag. 2021, 482, 118886. [Google Scholar] [CrossRef]
  3. Peng, C.; Zhou, X.; Zhao, S.; Wang, X.; Zhu, B.; Piao, S.; Fang, J. Quantifying the response of forest carbon balance to future climate change in Northeastern China: Model validation and prediction. Glob. Planet. Chang. 2009, 66, 179–194. [Google Scholar] [CrossRef]
  4. IPCC. Climate Change 2022: Mitigation of Climate Change. In Contribution of Working Group III to the Sixth Assessment Report of the Intergovernmental Panel on Climate Change; Shukla, P.R., Skea, J., Slade, R., Khourdajie, A.A., Diemen, R.V., McCollum, D., Pathak, M., Some, S., Vyas, P., Fradera, R., et al., Eds.; Cambridge University Press: Cambridge, UK; New York, NY, USA, 2022. [Google Scholar] [CrossRef]
  5. Dalla Corte, A.P.; Rex, F.E.; Almeida, D.R.A.d.; Sanquetta, C.R.; Silva, C.A.; Moura, M.M.; Wilkinson, B.; Zambrano, A.M.A.; Cunha Neto, E.M.d.; Veras, H.F.P.; et al. Measuring Individual Tree Diameter and Height Using GatorEye High-Density UAV-Lidar in an Integrated Crop-Livestock-Forest System. Remote Sens. 2020, 12, 863. [Google Scholar] [CrossRef]
  6. Kattenborn, T.; Hernández, J.; Lopatin, J.; Kattenborn, G.; Fassnacht, F.E. Pilot study on the retrieval of DBH and diameter distribution of deciduous forest stands using cast shadows in UAV-based orthomosaics. ISPRS Ann. Photogramm. Remote Sens. Spat. Inf. Sci. 2018, IV, 93–99. [Google Scholar] [CrossRef]
  7. Moe, K.T.; Owari, T.; Furuya, N.; Hiroshima, T.; Morimoto, J. Application of UAV Photogrammetry with LiDAR Data to Facilitate the Estimation of Tree Locations and DBH Values for High-Value Timber Species in Northern Japanese Mixed-Wood Forests. Remote Sens. 2020, 12, 2865. [Google Scholar] [CrossRef]
  8. Forsman, M.; Holmgren, J.; Olofsson, K. Tree Stem Diameter Estimation from Mobile Laser Scanning Using Line-Wise Intensity-Based Clustering. Forests 2016, 7, 206. [Google Scholar] [CrossRef]
  9. Jin, S.; Sun, X.; Wu, F.; Su, Y.; Li, Y.; Song, S.; Xu, K.; Ma, Q.; Baret, F.; Jiang, D.; et al. Lidar sheds new light on plant phenomics for plant breeding and management: Recent advances and future prospects. ISPRS J. Photogramm. Remote Sens. 2021, 171, 202–223. [Google Scholar] [CrossRef]
  10. Iglhaut, J.; Cabo, C.; Puliti, S.; Piermattei, L.; O’Connor, J.; Rosette, J. Structure from Motion photogrammetry in forestry: A review. Curr. For. Rep. 2019, 5, 155–168. [Google Scholar] [CrossRef]
  11. Brede, B.; Lau, A.; Bartholomeus, H.M.; Kooistra, L. Comparing RIEGL RiCOPTER UAV LiDAR Derived Canopy Height and DBH with Terrestrial LiDAR. Sensors 2017, 17, 2371. [Google Scholar] [CrossRef] [PubMed]
  12. Yao, W.; Krzystek, P.; Heurich, M. Tree species classification and estimation of stem volume and DBH based on single tree extraction by exploiting airborne full-waveform LiDAR data. Remote Sens. Environ. 2012, 123, 368–380. [Google Scholar] [CrossRef]
  13. Popescu, S. Estimating biomass of individual pine trees using airborne LiDAR. Biomass Bioenergy 2007, 31, 646–655. [Google Scholar] [CrossRef]
  14. Liu, L.; Zhang, A.; Xiao, S.; Hu, S.; He, N.; Pang, H.; Zhang, X.; Yang, S. Single Tree Segmentation and Diameter at Breast Height Estimation with Mobile LiDAR. IEEE Access 2021, 9, 24314–24325. [Google Scholar] [CrossRef]
  15. Huang, H.; Li, Z.; Gong, P.; Cheng, X.; Clinton, N.; Cao, C.; Ni, W.; Wang, L. Automated methods for measuring DBH and tree heights with a commercial scanning lidar. Photogramm. Eng. Remote Sens. 2011, 77, 219–227. [Google Scholar] [CrossRef]
  16. Moskal, L.M.; Zheng, G. Retrieving Forest Inventory Variables with Terrestrial Laser Scanning (TLS) in Urban Heterogeneous Forest. Remote Sens. 2012, 4, 1–20. [Google Scholar] [CrossRef]
  17. Zhou, S.; Kang, F.; Li, W.; Kan, J.; Zheng, Y.; He, G. Extracting Diameter at Breast Height with a Handheld Mobile LiDAR System in an Outdoor Environment. Sensors 2019, 19, 3212. [Google Scholar] [CrossRef]
  18. Chedid, E.; Avia, K.; Dumas, V.; Ley, L.; Reibel, N.; Butterlin, G.; Soma, M.; Lopez-Lozano, R.; Baret, F.; Merdinoglu, D.; et al. LiDAR Is Effective in Characterizing Vine Growth and Detecting Associated Genetic Loci. Plant Phenomics 2023, 5, 0116. [Google Scholar] [CrossRef]
  19. Kurinobu, S. Forest Tree Breeding for Japanese larch. Eurasian J. For. Res. 2005, 8, 127–134. [Google Scholar]
  20. Hirano, T.; Hirata, R.; Fujinuma, Y.; Saigusa, N.; Yamamoto, S.; Harazono, Y.; Takada, M.; Inukai, K.; Inoue, G. CO2 and water vapor exchange of a larch forest in northern Japan. Tellus B Chem. Phys. Meteorol. 2003, 55, 244–257. [Google Scholar] [CrossRef]
  21. CloudCompare (Version 2.11.3 (Anoia) [64-bit]) [GPL Software]. 2023. Available online: http://www.cloudcompare.org/ (accessed on 7 May 2021).
  22. Zhang, W.; Qi, J.; Wan, P.; Wang, H.; Xie, D.; Wang, X.; Yan, G. An Easy-to-Use Airborne LiDAR Data Filtering Method Based on Cloth Simulation. Remote Sens. 2016, 8, 501. [Google Scholar] [CrossRef]
  23. Lagarias, J.C.; Reeds, J.A.; Wright, M.H.; Wright, P.E. Convergence Properties of the Nelder-Mead Simplex Method in Low Dimensions. SIAM J. Optim. 1998, 9, 112–147. [Google Scholar] [CrossRef]
  24. The Math Works Inc. MATLAB (Version R2021a) [Computer Software]. 2021. Available online: https://www.mathworks.com/ (accessed on 23 March 2021).
  25. Shirasawa, K.; Hirakawa, H.; Isobe, S. Analytical workflow of double-digest restriction site-associated DNA sequencing based on empirical and in silico optimization in tomato. DNA Res. 2016, 23, 145–153. [Google Scholar] [CrossRef]
  26. Mishima, K.; Hirakawa, H.; Iki, T.; Fukuda, Y.; Hirao, T.; Tamura, A.; Takahashi, M. Comprehensive collection of genes and comparative analysis of full-length transcriptome sequences from Japanese larch (Larix kaempferi) and Kuril larch (Larix gmelinii var. japonica). BMC Plant Biol. 2022, 22, 470. [Google Scholar] [CrossRef] [PubMed]
  27. Langmead, B.; Salzberg, S.L. Fast gapped-read alignment with Bowtie 2. Nat. Methods 2012, 9, 357–359. [Google Scholar] [CrossRef]
  28. Li, H.; Handsaker, B.; Wysoker, A.; Fennell, T.; Ruan, J.; Homer, N.; Marth, G.; Abecasis, G.; Durbin, R.; 1000 Genome Project Data Processing Subgroup. The Sequence Alignment/Map format and SAMtools. Bioinformatics 2009, 25, 2078–2079. [Google Scholar] [CrossRef] [PubMed]
  29. Danecek, P.; Auton, A.; Abecasis, G.; Albers, C.A.; Banks, E.; DePristo, M.A.; Handsaker, R.E.; Lunter, G.; Marth, G.T.; Sherry, S.T.; et al. The variant call format and VCFtools. Bioinformatics 2011, 27, 2156–2158. [Google Scholar] [CrossRef] [PubMed]
  30. Browning, B.L.; Tian, X.; Zhou, Y.; Browning, S.R. Fast two-stage phasing of large-scale sequence data. Am. J. Hum. Genet. 2021, 108, 1880–1890. [Google Scholar] [CrossRef]
  31. Pérez, P.; de Los Campos, G. Genome-Wide Regression and Prediction with the BGLR Statistical Package. Genetics 2014, 198, 483–495. [Google Scholar] [CrossRef]
  32. Xu, S. Quantitative Genetics; Springer: Cham, Germany, 2022. [Google Scholar] [CrossRef]
  33. Smith, F.H. A discriminant function for plant selection. Ann. Eugen. 1936, 7, 240–250. [Google Scholar] [CrossRef]
  34. Hazel, L.N.; Lush, J.L. The efficiency of three methods of selection. J. Hered. 1942, 33, 393–399. [Google Scholar] [CrossRef]
  35. Hazel, L.N. The genetic basis for constructing selection indexes. Genetics 1943, 28, 476–490. [Google Scholar] [CrossRef]
  36. Xie, Y.; Zhang, J.; Chen, X.; Pang, S.; Zeng, H.; Shen, Z. Accuracy assessment and error analysis for diameter at breast height measurement of trees obtained using a novel backpack LiDAR system. For. Ecosyst. 2020, 7, 33. [Google Scholar] [CrossRef]
  37. Montesano, P.M.; Cook, B.D.; Sun, G.; Simard, M.; Nelson, R.F.; Ranson, K.J.; Zhang, Z.; Luthcke, S. Achieving accuracy requirements for forest biomass mapping: A spaceborne data fusion method for estimating forest biomass and LiDAR sampling error. Remote Sens. Environ. 2013, 130, 153–170. [Google Scholar] [CrossRef]
  38. Pierzchała, M.; Gigu`ere, P.; Astrup, R. Mapping forests using an unmanned ground vehicle with 3D LiDAR and graph-SLAM. Comput. Electron. Agric. 2018, 145, 217–225. [Google Scholar] [CrossRef]
Figure 1. Overview of the study site. (A) Location map of each individual tree. Individual tree locations were estimated by analyzing point clouds obtained from backpack LiDAR (BLS; depicted as light blue triangles) and UAV LiDAR (ULS; depicted as white squares). (B) Trunk point overview of BLS. The measurement area was divided into three sections in the north-south direction, from which three sets of point cloud data were acquired: Walk_B (depicted in red), Walk_C (depicted in blue), and Walk_D (depicted in green). Points at a height of 1.1–1.3 m above ground level were extracted from the acquired point clouds and are represented here as “trunk points.” Abbreviations: LiDAR, light detection and ranging; UAV, unmanned aerial vehicle.
Remotesensing 16 04790 g001
Figure 2. Schematic diagram of trunk point extraction. (A) Diagram of point cloud extraction for trunks 1.1–1.3 m above ground level from point clouds collected by BLS. (B) Diagram of point cloud extraction for trunks at 5–7 m above ground level from point cloud collected by ULS. The yellow line indicates the extraction area. The point cloud is colored according to the Z-axis value. Abbreviations: BLS, backpack laser scanning; ULS, unmanned aerial vehicle laser scanning.
Remotesensing 16 04790 g002
Figure 3. Example of circle fitting. The black circle represents the point cloud extracted from the backpack laser scanning (BLS) data for individual 247, situated at the height of 1.1–1.3 m above ground level; the blue circle depicts the circle fitted to the data, whereas the blue cross denotes its center. Coordinates are extracted from the center of the fitted circle.
Remotesensing 16 04790 g003
Figure 4. Comparison of estimated diameter with reference values. (A) Diameter 1.2 m above the ground was estimated using backpack laser scanning (BLS) and hand measurements. The horizontal axis represents the hand-measured record for 2020, whereas the vertical axis depicts the estimated diameter using BLS. (B) Comparison of diameter 6 m above the ground estimated using unmanned aerial vehicle laser scanning (ULS) and hand measurements. The horizontal axis represents the hand-measured record for 2020, and the vertical axis is the estimated diameter using ULS. Abbreviations: DBH, diameter at breast height.
Remotesensing 16 04790 g004
Figure 5. Histograms and kernel densities of DBH estimation. The errors are depicted for both the BLS (gray) and ULS (blue). Abbreviations: BLS, backpack laser scanning; ULS, unmanned aerial vehicle laser scanning; DBH, diameter at breast height.
Remotesensing 16 04790 g005
Figure 6. Genomic heritability. From left to right: DBH determined via hand measurements, BLS, and ULS and tree height determined via ULS, respectively. Abbreviations: BLS, backpack laser scanning; ULS, unmanned aerial vehicle laser scanning; DBH, diameter at breast height.
Remotesensing 16 04790 g006
Figure 7. Potential accuracy of timber volume selection. The Y-axis represents the correlation between the selection index and genetic variation, serving as a measure of the prediction accuracy of the timber volume genetic ability. From left to right: Pattern A used hand-measured diameter at breast height (DBH) as D in Equation (15), Pattern B used DBH measured with BLS as D, and Pattern C used DBH measured with ULS as D. Abbreviations: BLS, backpack laser scanning; ULS, unmanned aerial vehicle laser scanning.
Remotesensing 16 04790 g007
Table 1. Laser scanner properties.
PropertyBLSULS
Product nameLeica Pegasus: BackpackDJI Zenmuse L1 (+Matrice 300 RTK, D-RTK2)
Size73 × 27 × 31 cm15.2 × 11.0 × 16.9 cm (Zenmuse L1)
81.0 × 67.0 × 43.0 cm (Martice 300 RTK)
Weight11.9 kg0.93 ± 0.01 kg (Zenmuse L1)
6.3 kg (Martice 300 RTK)
Operating time4 h55 min (maximum flight time)
Number of points600,000 points/sMulti-return: max. 480,000 points/s
AccuracyRelative accuracy: 2−3 cm (50 m)
Absolute accuracy (outdoor): 5 cm
Absolute accuracy (indoors, e.g., with SLAM, without control point 1): 5−50 cm data 1
Lidar range accuracy: 3 cm at 100 m
Lidar system accuracy: 10 cm horizontally and 5 cm vertically at a distance of 50 m
RTK positioning accuracy: 1 cm + 1 ppm horizontally, 1.5 cm + 1 ppm vertically
FOV270° ± 15° (horizontal)
30° ± 15° (vertical)
Non-repetitive scanning pattern: 70.4° (horizontal) × 77.2° (vertical)
Repetitive scanning pattern: 70.4° (horizontal) × 4.5° (vertical)
GNSSGPS, GLONASS, BeiDou, GalileoGPS, GLONASS, BeiDou, Galileo
Laser pulse frequency10 Hz240 kHz/160 kHz
Maximum echo number (number of return)1 echo2 echo/3 echo
Flight speed-5 m/s
1 A minimum of three loops to be completed in a ten-minute walk or return trip is a requirement. BLS, backpack laser scanning; ULS, unmanned aerial vehicle laser scanning; SLAM, simultaneous localization and mapping; FOV, field of view; GNSS, global navigation satellite system; GPS, global positioning system; GLONASS, globalnaya navigatsionnaya sputnikovaya sistema.
Table 2. Genetic correlation. DBH manual represents hand-measured diameter at breast height (DBH), DBH BLS represents BLS DBH estimates, and DBH ULS represents DBH estimates using ULS.
TraitsDBH ManualDBH BLSDBH ULS
DBH BLS0.82
DBH ULS0.57
Tree height0.740.660.55
Disclaimer/Publisher’s Note: The statements, opinions and data contained in all publications are solely those of the individual author(s) and contributor(s) and not of MDPI and/or the editor(s). MDPI and/or the editor(s) disclaim responsibility for any injury to people or property resulting from any ideas, methods, instructions or products referred to in the content.

