Abstract
In recent years, drone-based Synthetic Aperture Radar (SAR) systems have emerged as flexible and cost-efficient solutions for detecting changes in the Earth’s surface, retrieving topographic data, or detecting ground displacement processes in localized areas, among other applications. These systems offer a unique combination of short and versatile revisit times and flexible acquisition geometries that are not achievable with space-borne, airborne, or ground-based SAR sensors. However, due to platform limitations and flight stability issues, they also present significant challenges regarding instrument design and data processing, particularly when generating interferometric repeat-pass datasets. This paper demonstrates the feasibility of repeat-pass interferometry using a Ku-band drone-based SAR system. The system integrates a dual-channel Ku-band Frequency Modulated Continuous Wave (FMCW) radar with cross-track single-pass interferometric capabilities, mounted on a drone platform. The proposed repeat-pass interferometric processing chain leverages an accurate Digital Elevation Model (DEM), generated from the single-pass interferograms, to precisely coregister the entire stack of acquisitions, thereby producing repeat-pass interferograms free from residual motion errors. The results underscore the potential of this system and the processing chain proposed for generating multi-temporal repeat-pass stacks suitable for repeat-pass applications.
1. Introduction
In recent decades, space-borne Synthetic Aperture Radar (SAR) systems have been used in a wide range of applications related to Earth observation [1] such as flood detection, land cover mapping, crop monitoring, wildfire delineation, or ground displacement estimation, among others. Since 2014, the launch of new constellations, such as the Copernicus Sentinel mission by the European Space Agency (ESA), has made space-borne solutions a more affordable option for monitoring large areas. However, these systems present some limitations. For current polar-orbiting SAR sensors, the look direction is either east for ascending passes or west for descending passes. This configuration can limit their ability to monitor certain areas due to geometric distortions and hinder specific applications, such as ground displacement monitoring, particularly when detecting displacements with a significant north–south component.Additionally, the revisit time, for example, 12 days for Sentinel-1, limits the capabilities for intensive monitoring in emergency situations.
In this framework, airborne SAR systems emerged as a complementary technology, enabling the analysis of the Earth’s surface from a flexible geometry and a higher revisit time. Conversely, it should be noted that flying regularly over long periods is time-consuming and has a significant economic cost, ultimately restricting the deployment of these systems primarily for research purposes. Unlike space-borne systems, airborne platforms face additional difficulties in focusing Single-Look Complex (SLC) images, which are impacted by factors such as non-linear motion, residual motion errors due to the current Global Navigation Satellite System (GNSS) accuracy, and unknown topography. These factors hinder coregistration and the generation of repeat-pass interferograms free of phase artifacts. To address these issues, various strategies have been proposed to estimate and compensate these errors, enabling the generation of repeat-pass stacks with airborne platforms [2,3,4,5]. Currently, several airborne SAR systems exploit multiple repeat-pass Interferometric Synthetic Aperture Radar (InSAR) applications, including high-resolution and high-accuracy Digital Elevation Models (DEMs) [6], for retrieving ground displacement [4,7,8,9] or in estimating biomass using SAR tomography [10,11].
To achieve shorter revisit times compared to space-borne or airborne SAR systems, Ground-based Synthetic Aperture Radar (GBSAR) sensors represent an effective solution [12,13,14,15,16,17,18], as they provide near real-time monitoring. This capability is particularly valuable for applications requiring continuous observation, especially in scenarios where the immediate detection of ground displacement is critical. Additionally, data processing is significantly simplified, as GBSAR systems do not require motion compensation or coregistration for repeat-pass stack generation as all acquisitions follow the same trajectory. However, these systems face limitations due to their acquisition geometry. Being sensitive only to displacements along the line of sight (LOS), GBSAR systems often struggle with achieving optimal sensitivity when they cannot be positioned in locations that provide an appropriate viewing geometry. Furthermore, their deployment can be challenging in remote or difficult-to-access areas, limiting their applicability in certain scenarios. Lastly, these sensors are restricted to monitoring small-scale areas, unlike space-borne or airborne SAR systems, which are capable of covering larger regions.
In this context, the SAR community is actively exploring the potential of integrating SAR sensors into multicopter drones [19,20,21,22,23,24,25,26]. These platforms provide a cost-efficient solution with a unique combination of versatile revisit times and flexible acquisition geometries unattainable by aircraft, satellites, and ground-based sensors, thereby offering significant advantages in SAR and InSAR applications. However, drone-based SAR systems also face specific challenges and limitations. Their deployment is significantly constrained by weather conditions such as heavy rain, poor visibility, or strong wind, limiting operational capabilities. Flight autonomy and legal restrictions on the maximum flying height above ground restrict their usage to local areas, although larger than those covered by GBSAR. Furthermore, the design and the integration of the radar, the antennas, and the Inertial Navigation System (INS) must account for the weight and size constraints imposed by the drone platform, requiring compact and lightweight electronics. Lastly, as with all airborne SAR systems, inaccuracies in the topographic information required during the processing, coupled with position uncertainties and deviations from the flight path, cause phase errors unique to each acquisition, which, if not properly estimated and compensated for, hinder the generation of reliable repeat-pass interferograms.
In the field of drone-based repeat-pass interferometry, several key studies have been published. An L-band drone-based SAR was used in [19] to obtain repeat-pass interferograms with no residual phase errors using an accurate DEM and the Time-Domain Backprojection (TDBP) algorithm. Similarly, in [20], an L-band system was employed to retrieve the displacement of a Corner Reflector (CR) with an accuracy of approximately 6 mm. At higher frequency bands, [21] presented an X-band system that relied on the TDBP and an autofocus algorithm to compensate for motion errors before interferogram formation. An ultra-wideband radar, combined with a patch-wise coherent cross-correlation strategy, was used in [22] to estimate height for a very localized area. Finally, the authors of [23] introduced a 24 GHz SAR sensor and a processing chain capable of generating coherent change detection maps for very localized areas, relying on CRs.
Although repeat-pass interferometry with drone-based SAR systems has shown promise at lower frequency bands, achieving consistent results at higher frequencies remains challenging. Existing processing strategies for coregistering high-frequency drone-based SAR datasets rely on CRs and have only been applied in small, controlled environments [21,22,23]. To address these challenges, this article proposes a Ku-band SAR system and a dedicated processing chain, both designed to enable the coregistration of SLCs obtained in real-world scenarios, demonstrating the feasibility of generating repeat-pass datasets at the Ku band with a drone-based SAR system.
The article describes in detail the SAR-Drone system and the key processing steps, where the effectiveness in generating repeat-pass interferograms will be validated by analyzing a real multi-temporal dataset. The proposed system comprises a Ku-band radar mounted on a hexacopter drone with a cross-track interferometric configuration. The shorter wavelength reduces the cross-track baseline requirements compared to lower frequency InSAR systems, allowing for easier antenna integration into the drone. However, the higher frequency also presents challenges due to increased sensitivity to unknown motion errors and topography which must be addressed during data processing. The proposed interferometric processing chain tackles these challenges by utilizing the cross-track baseline to update the input heights prior to coregistering the entire stack of SLCs. Moreover, the article proposes a method that exploits a stack of single-pass interferograms to improve the estimation of unknown topography. Finally, the proposed coregistration step consists of using an implementation of the multisquint algorithm [2], relying solely on the data themselves without the need for CRs or strong scatterers, allowing for a flexible deployment in any area.
This paper is organized as follows. First, Section 2 introduces the radar, antennas, and drone platform. In Section 3, the proposed interferometric processing chain is described in detail, aiming to obtain a reliable stack of coregistered SLCs and repeat-pass interferograms free of residual errors. In Section 4, the results obtained with the system and the proposed interferometric processing chain in a real-world scenario are presented. Finally, Section 5 provides a discussion of the results, the main conclusions, and future lines of work.
2. Ku-Band SAR-Drone System Description
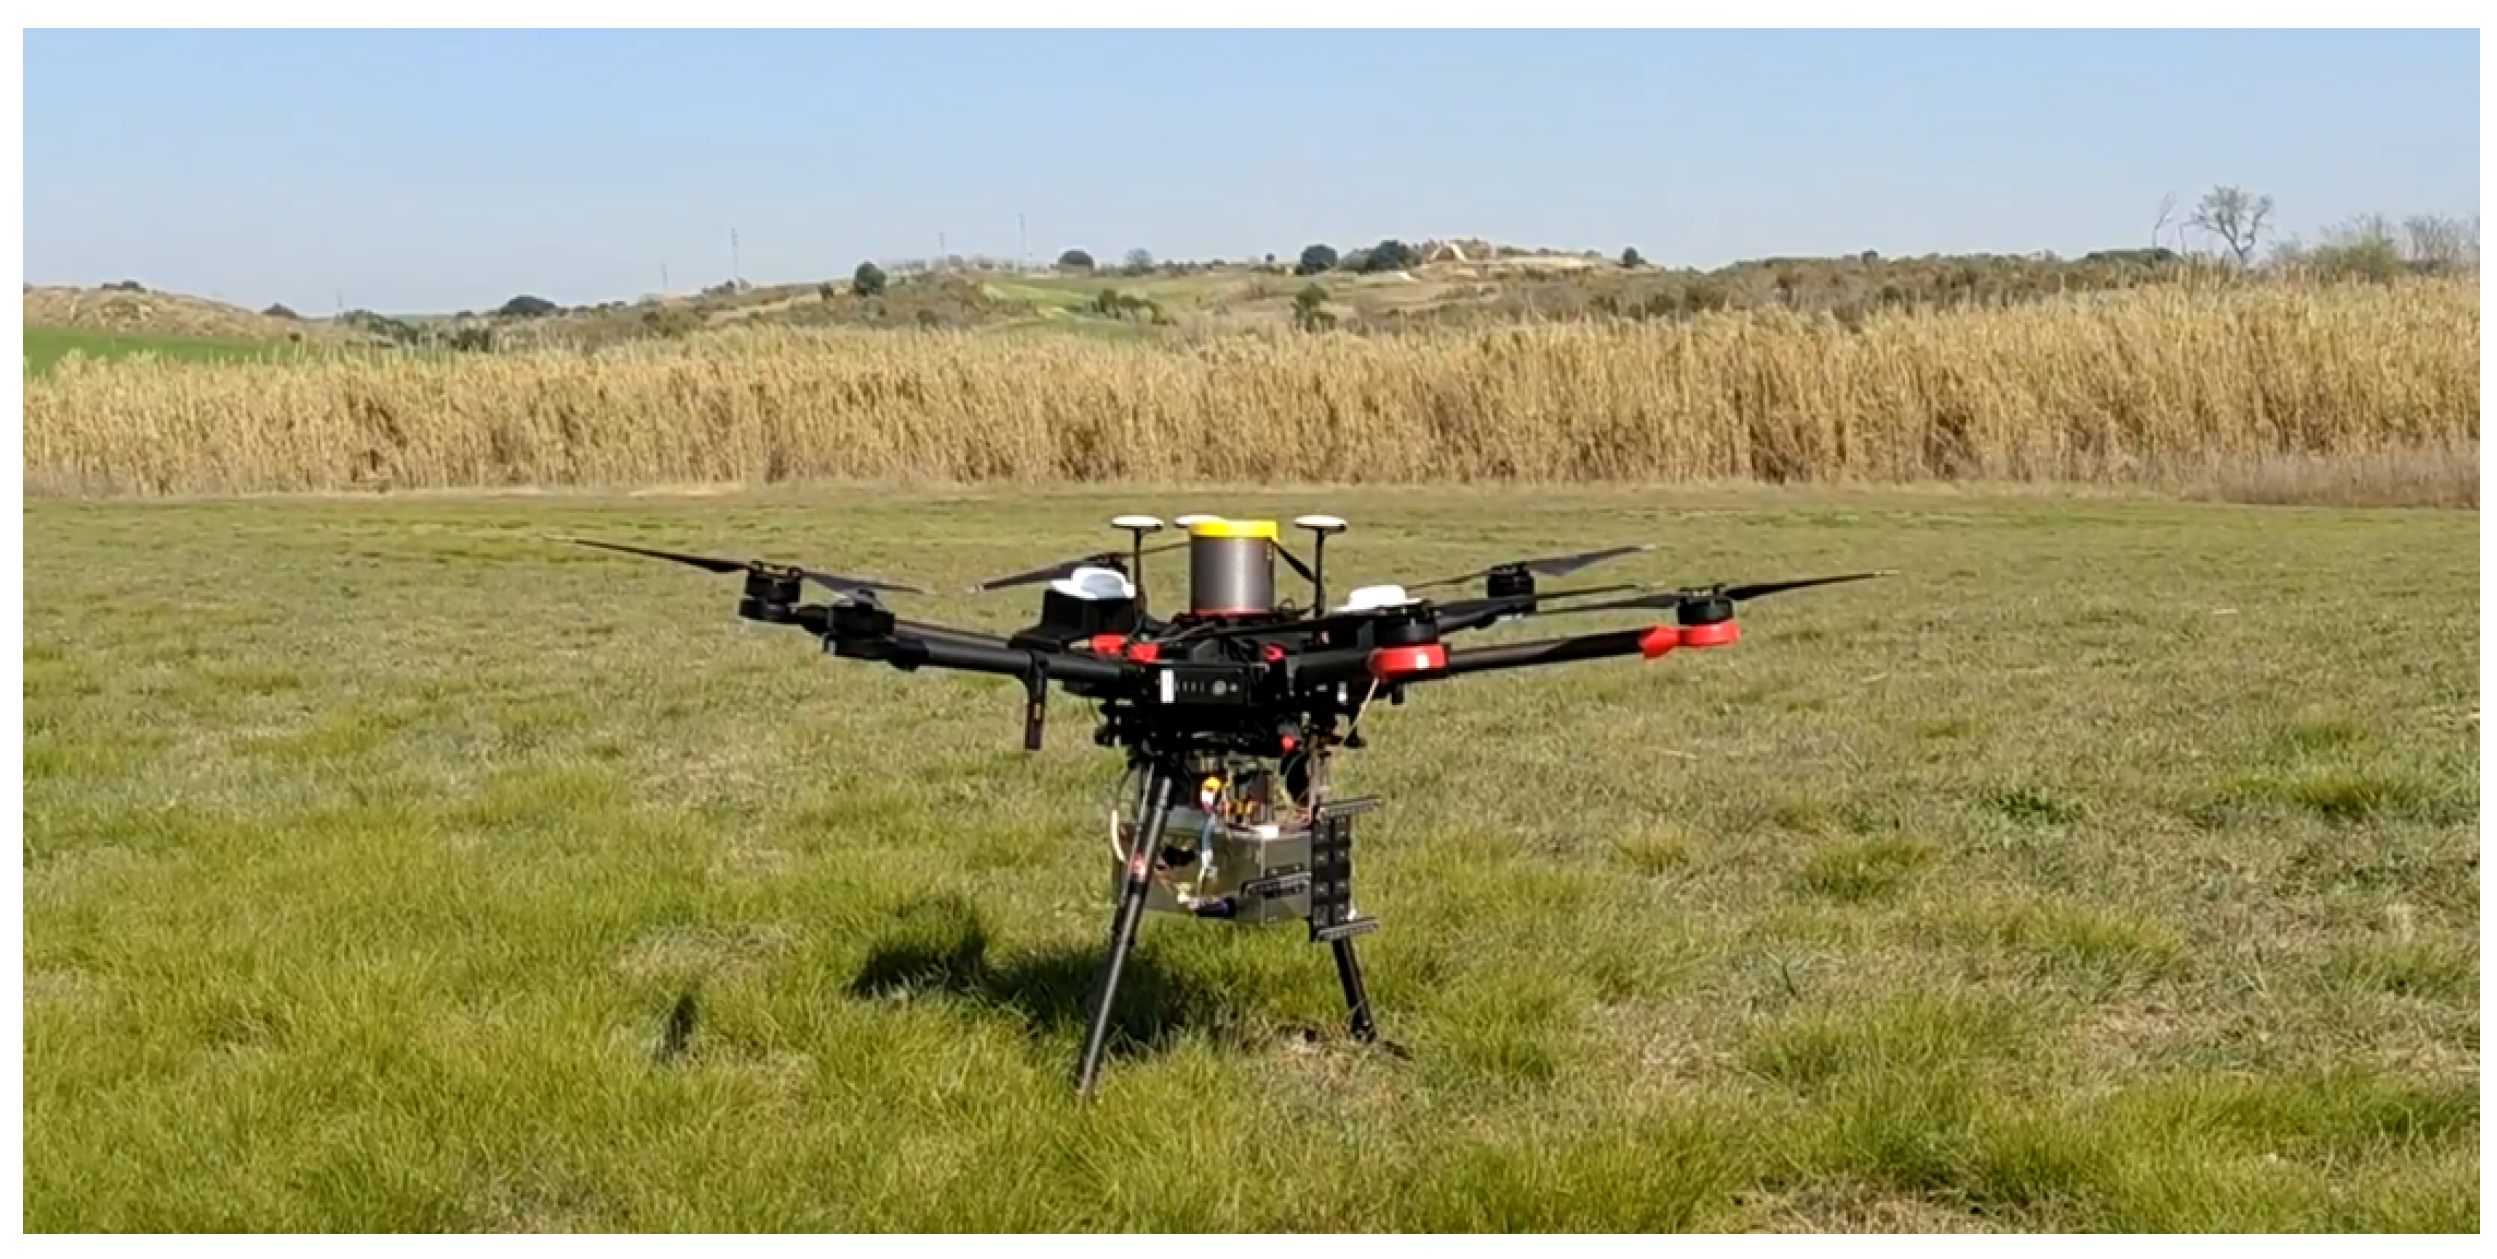
The SAR-Drone system, entirely developed by the authors, consists of a lightweight and compact dual-receiver Ku-band radar integrated into a hexacopter drone together with a navigation system comprised of a Global Navigation Satellite System (GNSS) receiver and an INS. The system is shown in Figure 1.
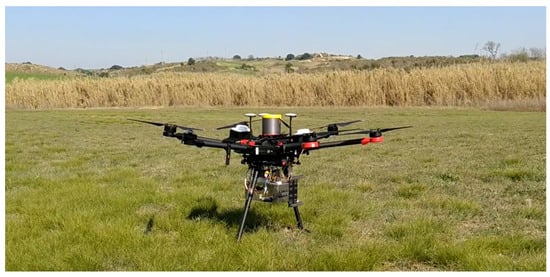
Figure 1.
SAR-Drone ready to take off. All the radar electronics and Ku-band antennas are mounted below the drone platform.
The electronics and the navigation system are integrated into an enclosure designed to be mounted on the drone, considering weight and size limitations and overall aerodynamics. Moreover, three Ku-band antennas, one transmitter, and two receivers are fixed on one face of the enclosure, forming a cross-track baseline.
The radar system integration on the drone platform has been engineered to enable communication with the drone’s navigation system and trigger a radar acquisition only when required. This design allows starting and stopping an acquisition during the execution of a pre-programmed flight line, thereby automating the monitoring of the Area Of Interest (AOI).
2.1. Radar
The radar system consists of a Ku-band Frequency Modulated Continuous Wave (FMCW) radar with two receiving channels. The FMCW design has been chosen over a pulsed radar because it has several advantages when used in low-altitude systems that do not need to sample more than a few kilometers of range. One of the main advantages lies in the range pulse compression, which is carried out in hardware at the receiving channel by mixing the received signal with a copy of the transmitted chirp. The mixing operation relaxes the sampling frequency as well as the transmitted power budget compared to a pulsed radar design [27].
The size and weight of the radar electronics are severely constrained by the drone platform, in contrast to radar systems mounted on airplanes where these limitations are significantly relaxed [28,29,30]. To overcome these constraints, all radar electronics have been designed in a Printed Circuit Board (PCB), allowing for significant size and weight reduction compared to radar designs using modular Radio Frequency (RF) components.
The electronics are divided into four modules, each designed on a separate PCB as follows:
- The power supply and clock distribution module generates the voltages used through the system as well as the clock signals needed by the transmitter to generate the chirp and by the acquisition module to sample the data.
- The transmitter module generates a linear chirp with configurable sweep time, Pulse Repetition Frequency (PRF), and output power to provide flexibility in system configuration. The chirp pulse is synthesized by Direct Digital Synthesis (DDS) and up-converted to Ku-band by using a frequency multiplier. The final stage consists of an amplification module before the chirp is delivered to the transmit antenna.
- The receiver module comprises two down-converters that first amplify the signal coming from the two receiving antennas and then performs the pulse compression. The gain of the receiving chain is designed to be configurable to minimize signal saturation in most scenarios.
- The acquisition module of the system consists of a Field-Programmable Gate Array (FPGA), a Linux-based computer, a Solid State Drive (SSD), two Ethernet ports, and one USB port. The module configures the RF components, monitors the transmitted power and temperature, configures the navigation system, and manages the radar data acquisition, which is sampled and saved into the SSD.
To conclude this section related to the radar description, its main specifications are detailed in Table 1. Notice that the range resolution is fixed at 0.75 m and, although highly configurable, the rest of the parameters are set to sample 5 km in range.

Table 1.
Ku-band radar specifications.
2.2. Antennas
The system uses three identical microstrip patch array antennas, one as a transmitter and two as receivers. The two receiving antennas are mounted with a cross-track baseline of 15 cm, providing single-pass interferometric capabilities with a height of ambiguity ranging from 20 m in the near range to 110 m in the far range.
The antenna pattern is designed with two main objectives: first, to maximize the swath, and second, to achieve a common Doppler bandwidth in repeat-pass acquisitions that guarantees the desired azimuth resolution while minimizing decorrelation caused by non-overlapping Doppler spectra [31].
A large elevation beamwidth is needed to maximize the antennas’ footprint on the ground since current European UAS flight regulations limit the maximum allowed height above ground to 120 m. Therefore, the elevation beamwidth is designed to be 70 degrees, which, when combined with the tilt of the antennas, results in a look angle ranging from 15 degrees to 85 degrees. Hence, the maximum achievable swath, ignoring target backscattering and Signal to Noise Ratio (SNR) limitations, is approximately 1.5 km. The designed azimuth beamwidth is 11 degrees and has been derived by considering the typical Doppler centroid frequency variations and the desired theoretical azimuth resolution of 0.1 m.
2.3. Drone Platform
The drone is a hexacopter capable of flying for up to 15 min at a speed of 10 m per second with a load of approximately 5 kg, which is the total payload introduced by the radar and the navigation system. In this context, the capabilities of the platform directly restrict the dimensions, weight, and power consumption of the radar but also its subsystems, as they are closely related to the final autonomy of the system.
The flying performance of the drone has been characterized using radar and navigation data to define the design requirements necessary for employing the system in repeat-pass interferometric applications and to assess its potential performance limitations.
Following this argument, the Doppler centroid frequency variations and the height of ambiguity are of special interest in repeat-pass applications due to their significant impact on coherence and height sensitivity [31,32,33], which greatly determine the system’s capabilities to estimate height or ground displacements:
- On the one hand, the measured drone’s Doppler frequency standard deviation typically ranges around 60 Hz. This variation is largely influenced by both velocity and attitude deviations:
- -
- Velocity: The standard deviation of the nominal velocity in the track coordinate is 0.36 m/s, while in the cross-track and vertical coordinates it is 0.1 m/s.
- -
- Attitude: The typical standard deviations in yaw, pitch, and roll of the platform are 0.8 deg, 3.3 deg, and 1.3 deg, respectively.
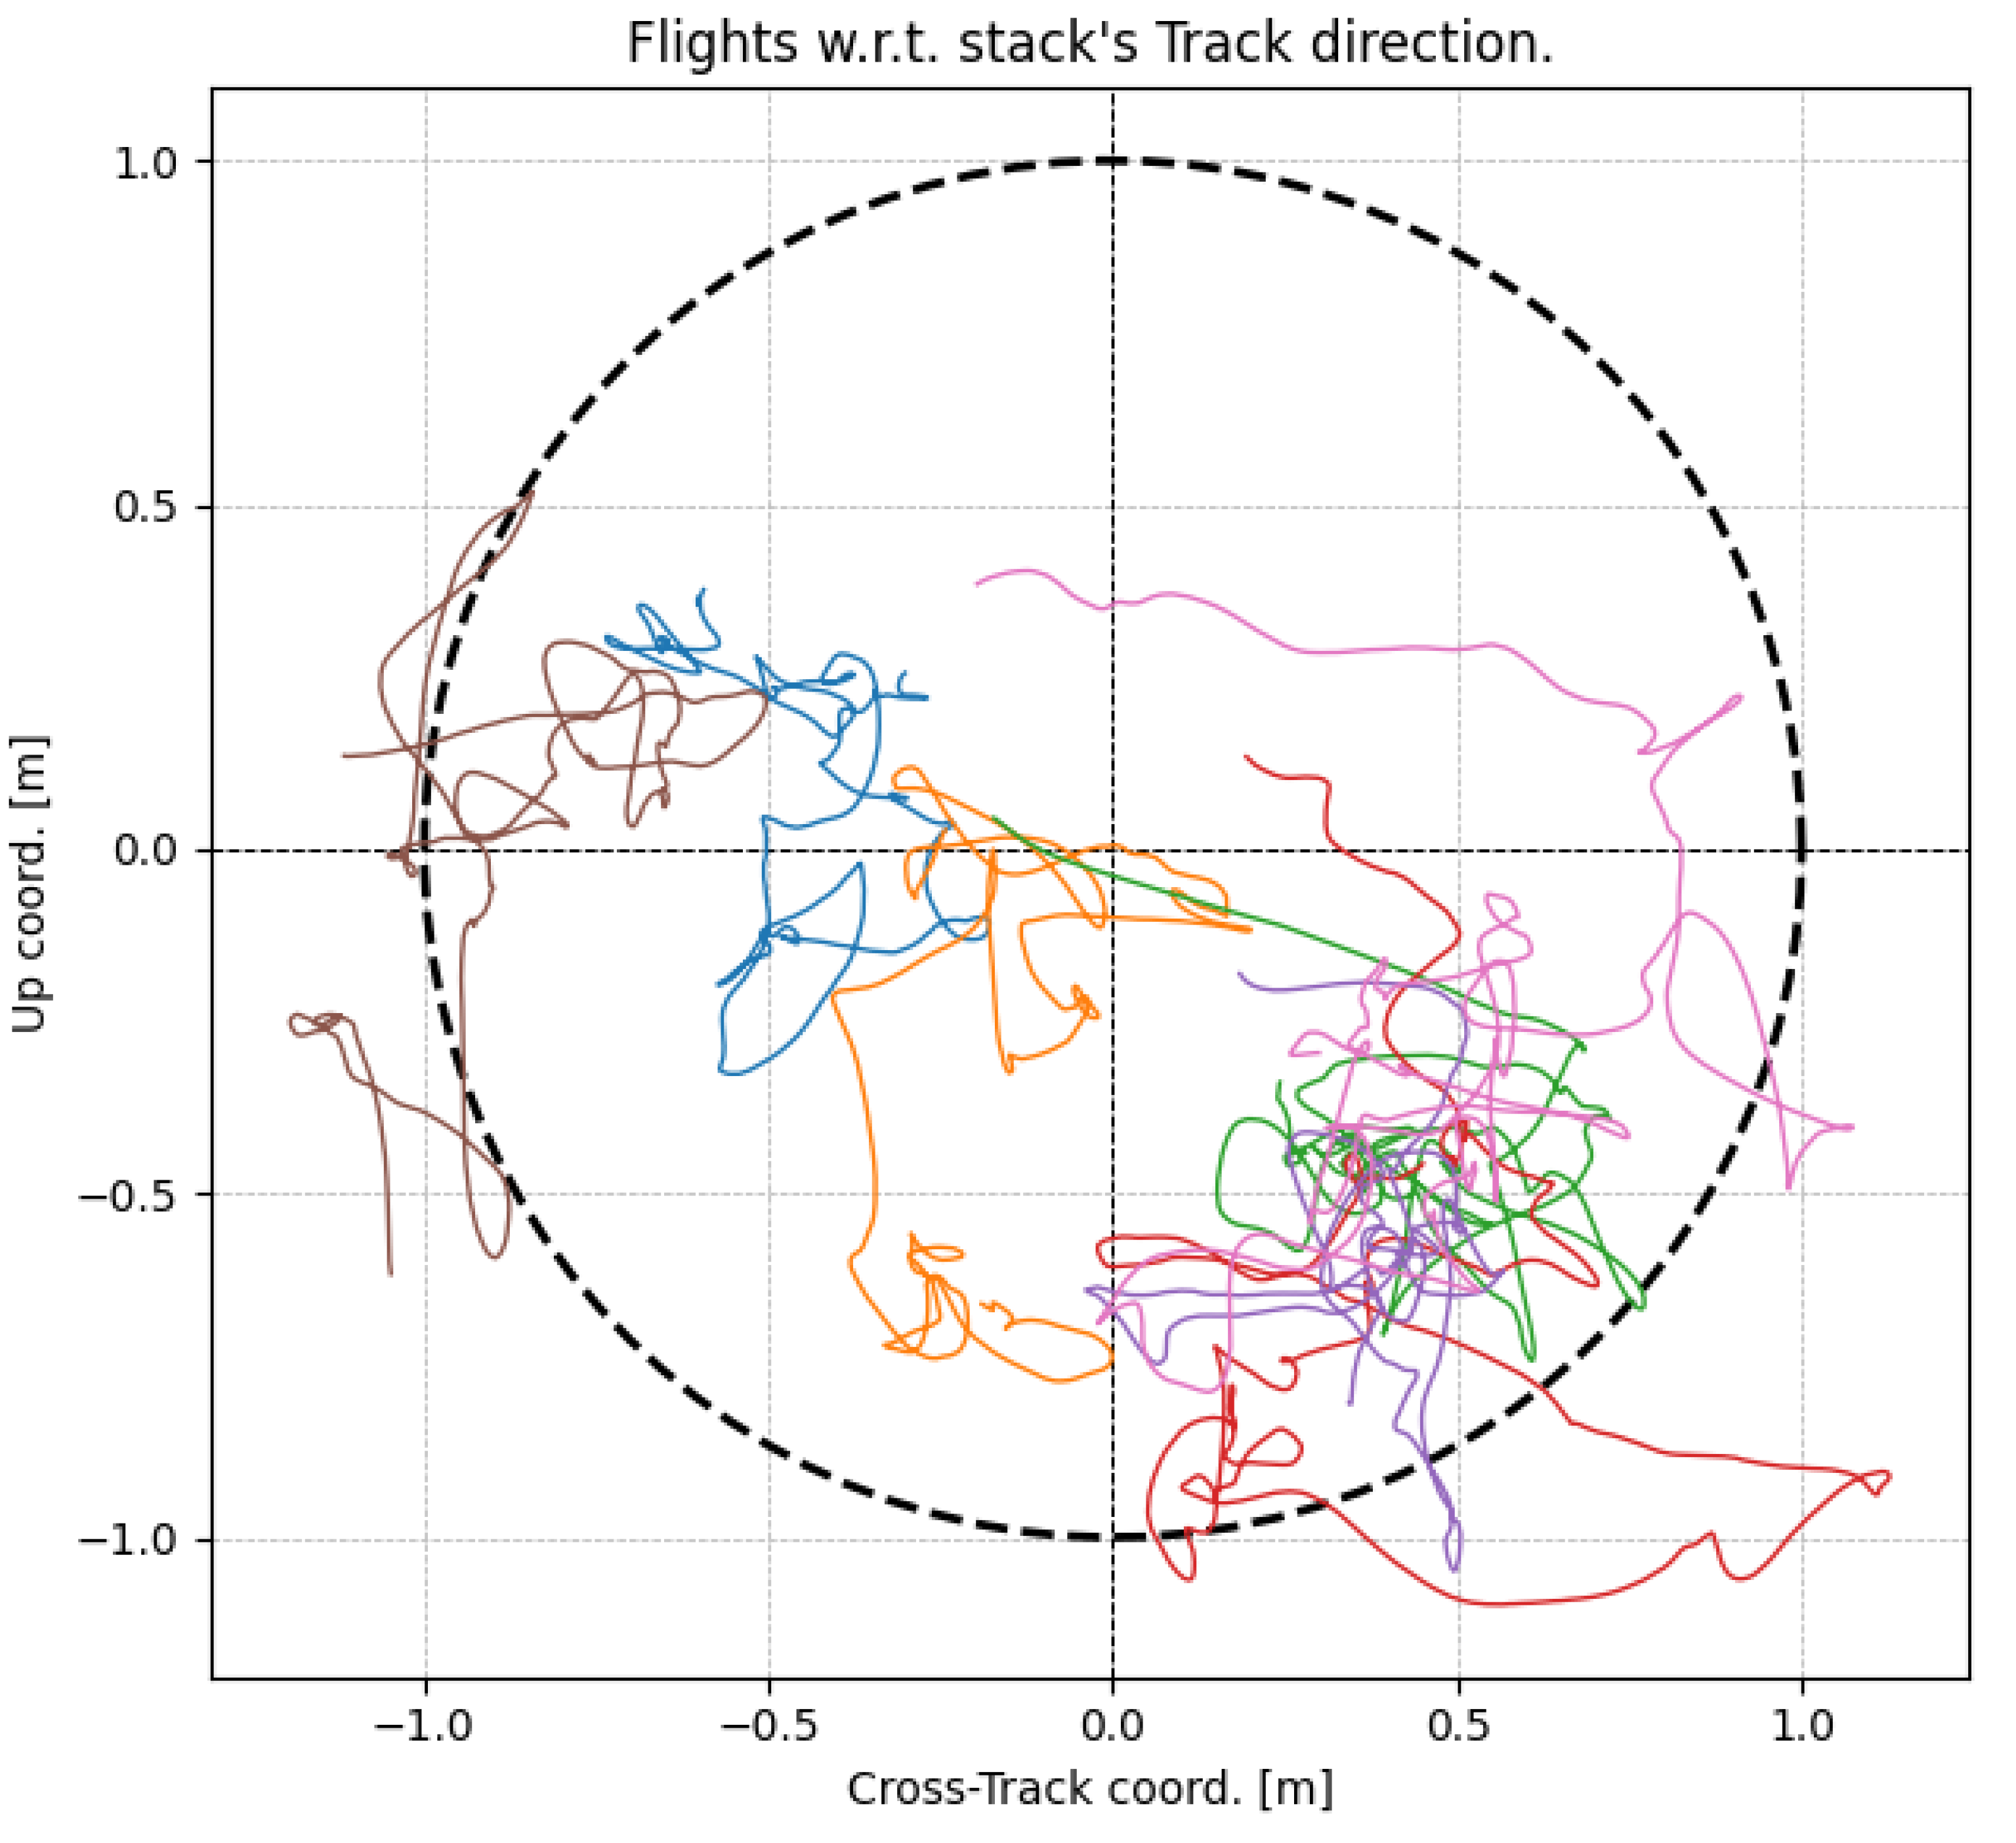
- On the other hand, the height of ambiguity depends on the cross-track perpendicular baseline determined by the repeat-pass flight tube. The drone’s typical difference between the 5th and the 95th percentile is 1.8 m in the cross-track coordinate and 1.3 m in the vertical coordinate. The baselines typically achieved by the platform correspond to a minimum height of ambiguity of 2 m in the near range. An example of the flight tube of a repeat-pass flight is shown in Figure 2. The critical baseline, which exhibits significant variability with range due to the wide range of look angles covered by the system’s swath, is 2.5 m in the near range and extends beyond 100 m in the far range. It is important to note that the critical baseline can be reached in the first range bins for certain passes. These acquisitions are considered outliers and discarded in the processing.
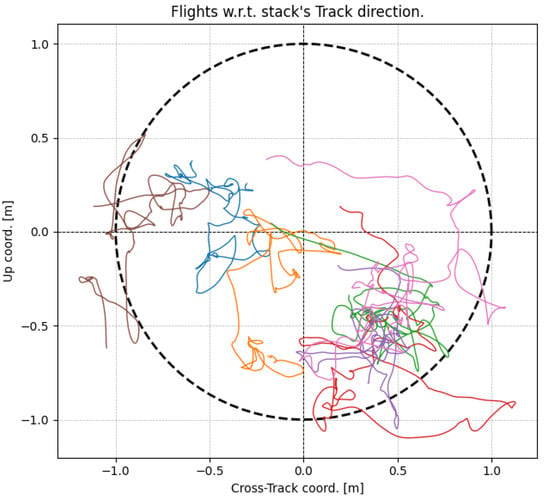 Figure 2. Drone’s flight tube. Seven data acquisitions were conducted along the same programmed flight line. Each acquisition is represented by a distinct color.
3. Repeat-Pass Interferometric SAR-Drone Processing
In this section, the repeat-pass interferometric SAR-Drone processing flow proposed in the paper is presented. The objective is to provide a detailed description of the processing required to generate a stack of repeat-pass interferograms free from residual motion errors and processing artifacts, making them suitable for multi-temporal applications.
Beforehand, the technological challenges associated with processing SAR data obtained via a drone platform, ranging from the focusing of the SLCs to their proper coregistration and interferogram generation, are reviewed.
The focusing quality of the TDBP algorithm is affected by the combination of several aspects inherent in any airborne system: flight deviations within the synthetic aperture, inaccuracies in the topographic information used as input, or position uncertainties [34]. While the TDBP can be seen as a perfect 2D matched filter when both the topography and the antenna positions are perfectly known, this is not typically fulfilled when using an airborne platform. Specifically, since the SAR-Drone system operates at the Ku band, it is especially affected by focusing errors due to its short wavelength of 17.44 mm. Notice that this wavelength is shorter compared to existing airborne repeat-pass systems [11,19,28,35,36,37] and is comparable to current GNSS precision. Furthermore, if the input DEM does not have enough accuracy, due to both local errors and global height biases, the resulting focusing quality can be significantly degraded in terms of phase errors and shifts in the impulse response function [8,34]. Finally, since the errors due to the combination of flight track deviations, DEM inaccuracies, and antenna position uncertainties are unique to each SLC, the focusing errors are not shared between SLCs, thereby affecting the coherence and phase of repeat-pass interferograms. For this reason, the coregistration between SLCs is performed to estimate and compensate for the relative errors, improving the interferogram coherence and reducing phase artifacts. There are several approaches in the literature dedicated to analyzing the coregistration of a pair of SLCs in airborne systems [2,5,38]. Among these, the multisquint algorithm [2] is used in this work, which assumes that all errors between two SLCs are caused purely by antenna position errors, the so-called Residual Motion Error (RME), and therefore applies the derived correction as a baseline correction. Since not all relative errors between SLCs are due to GNSS errors, as discussed above, the multisquint algorithm can introduce a baseline error [8] which, if not corrected, biases the interferometric information.
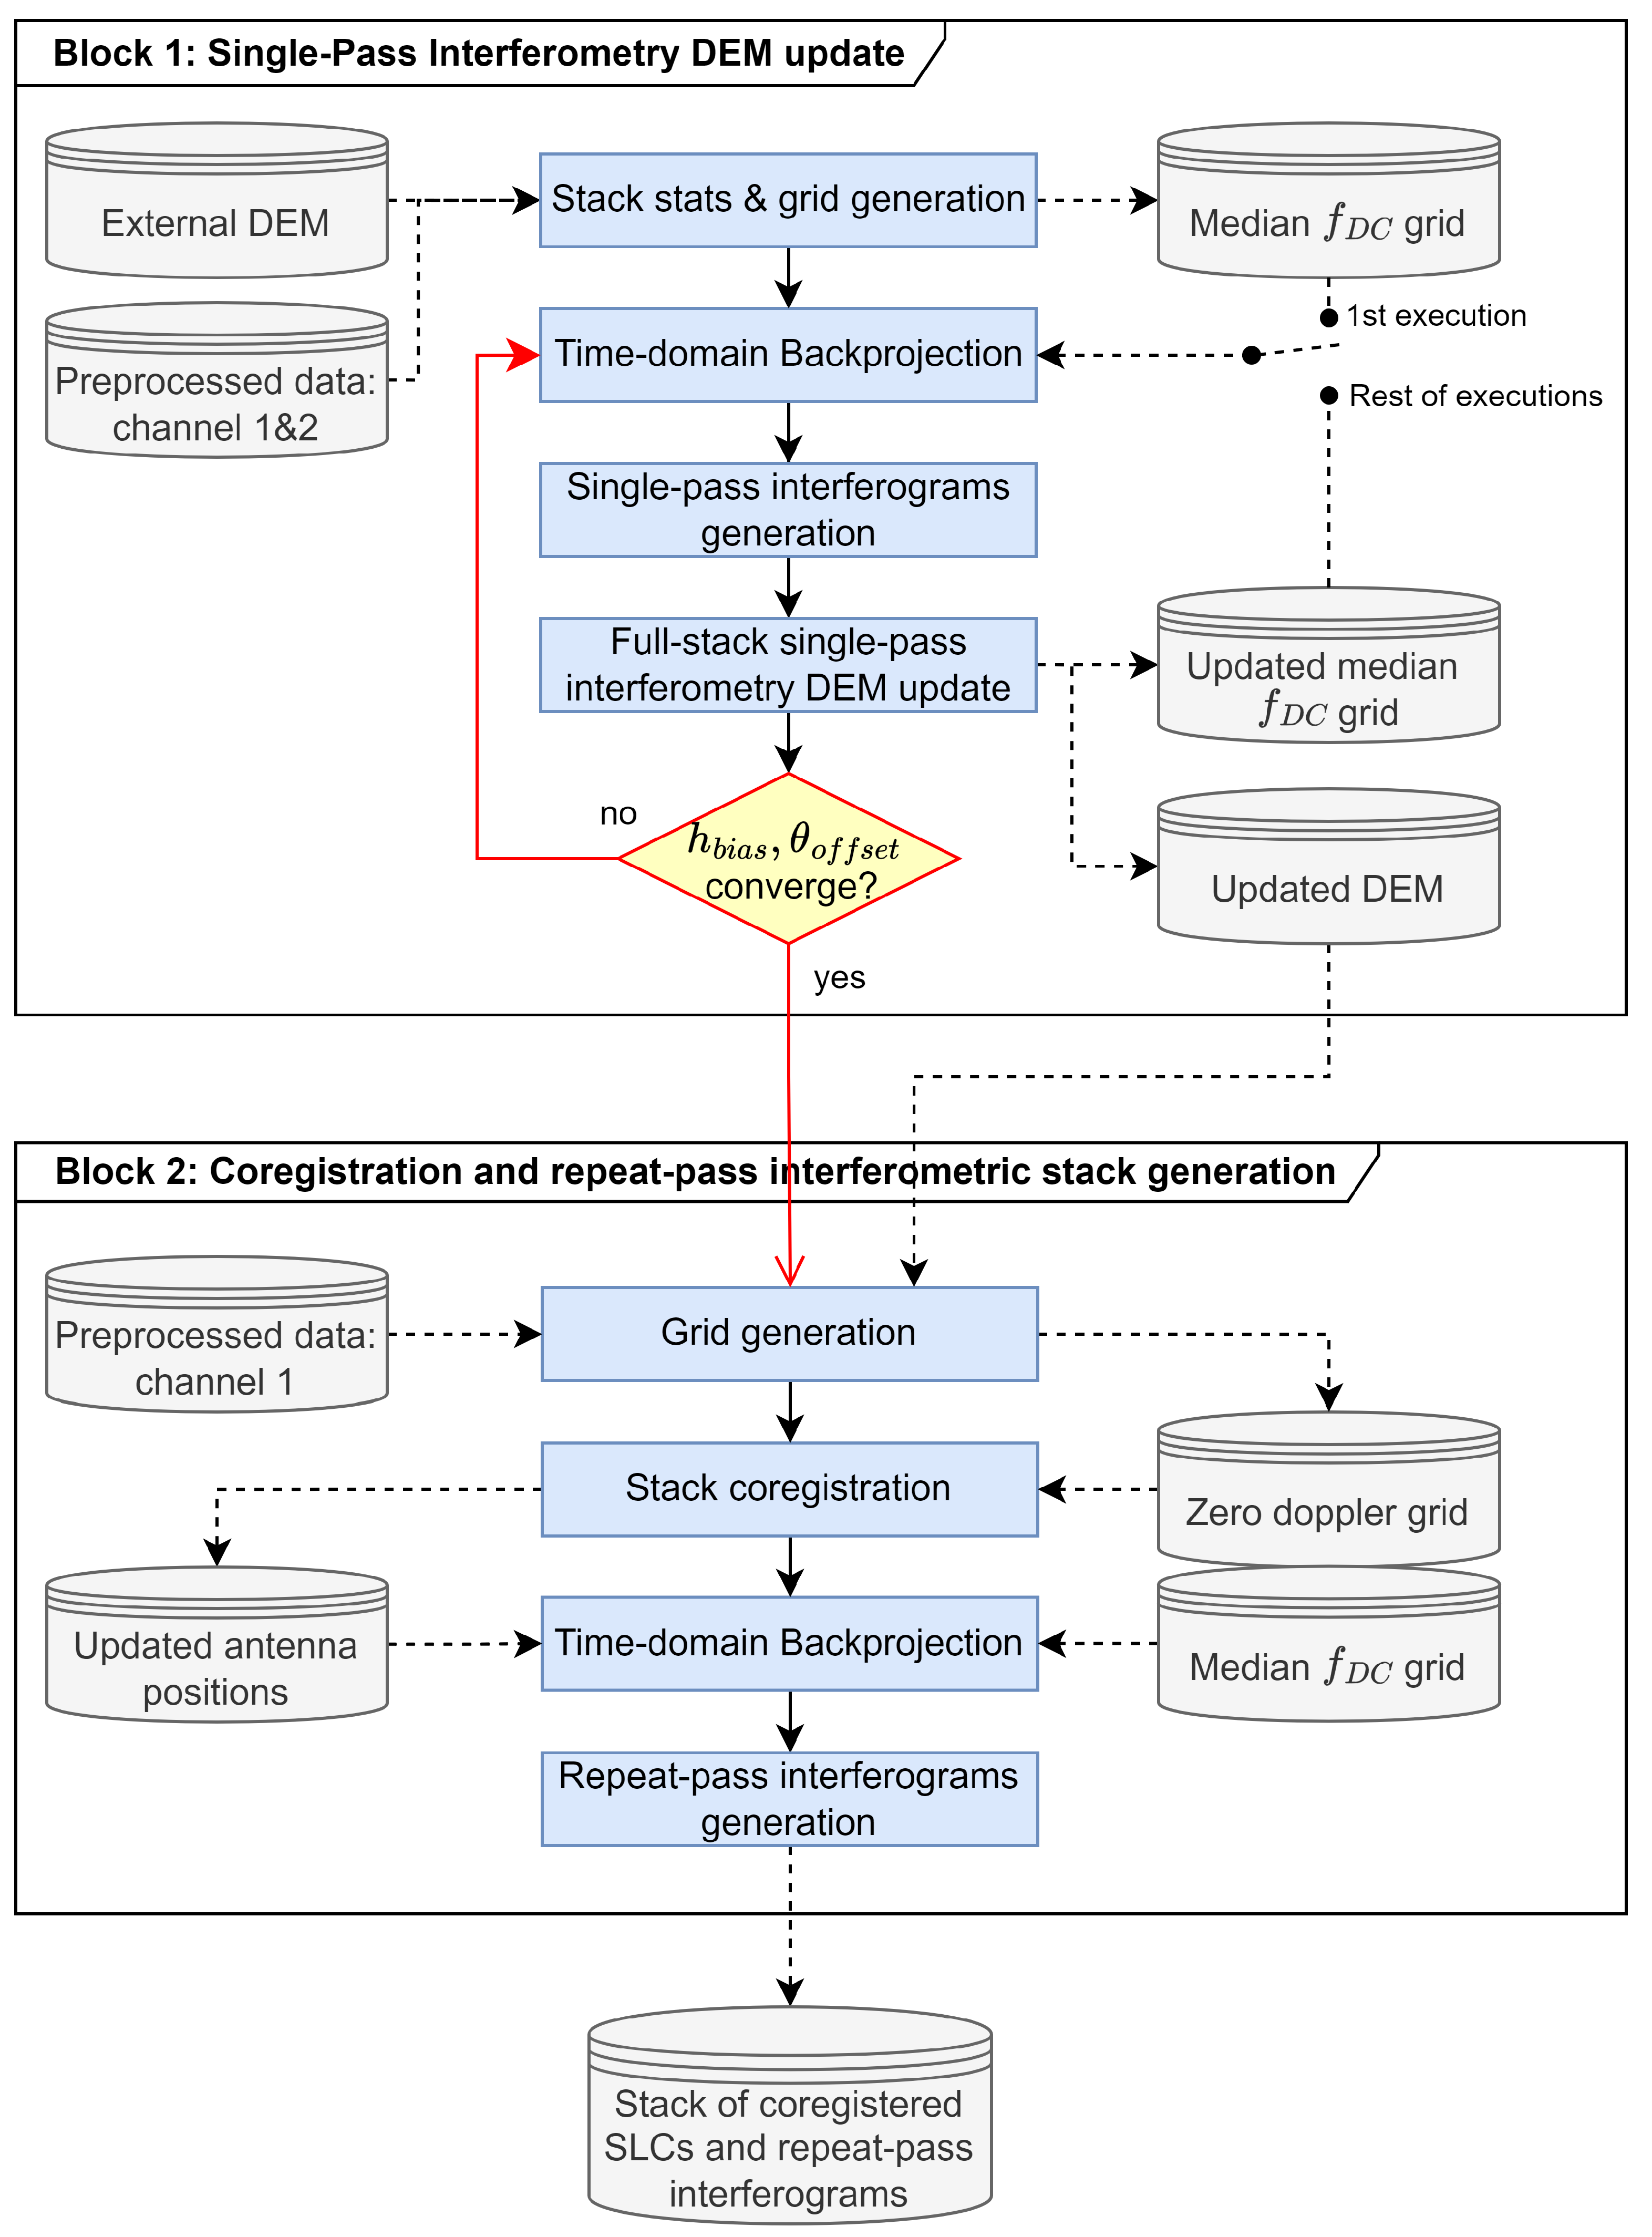
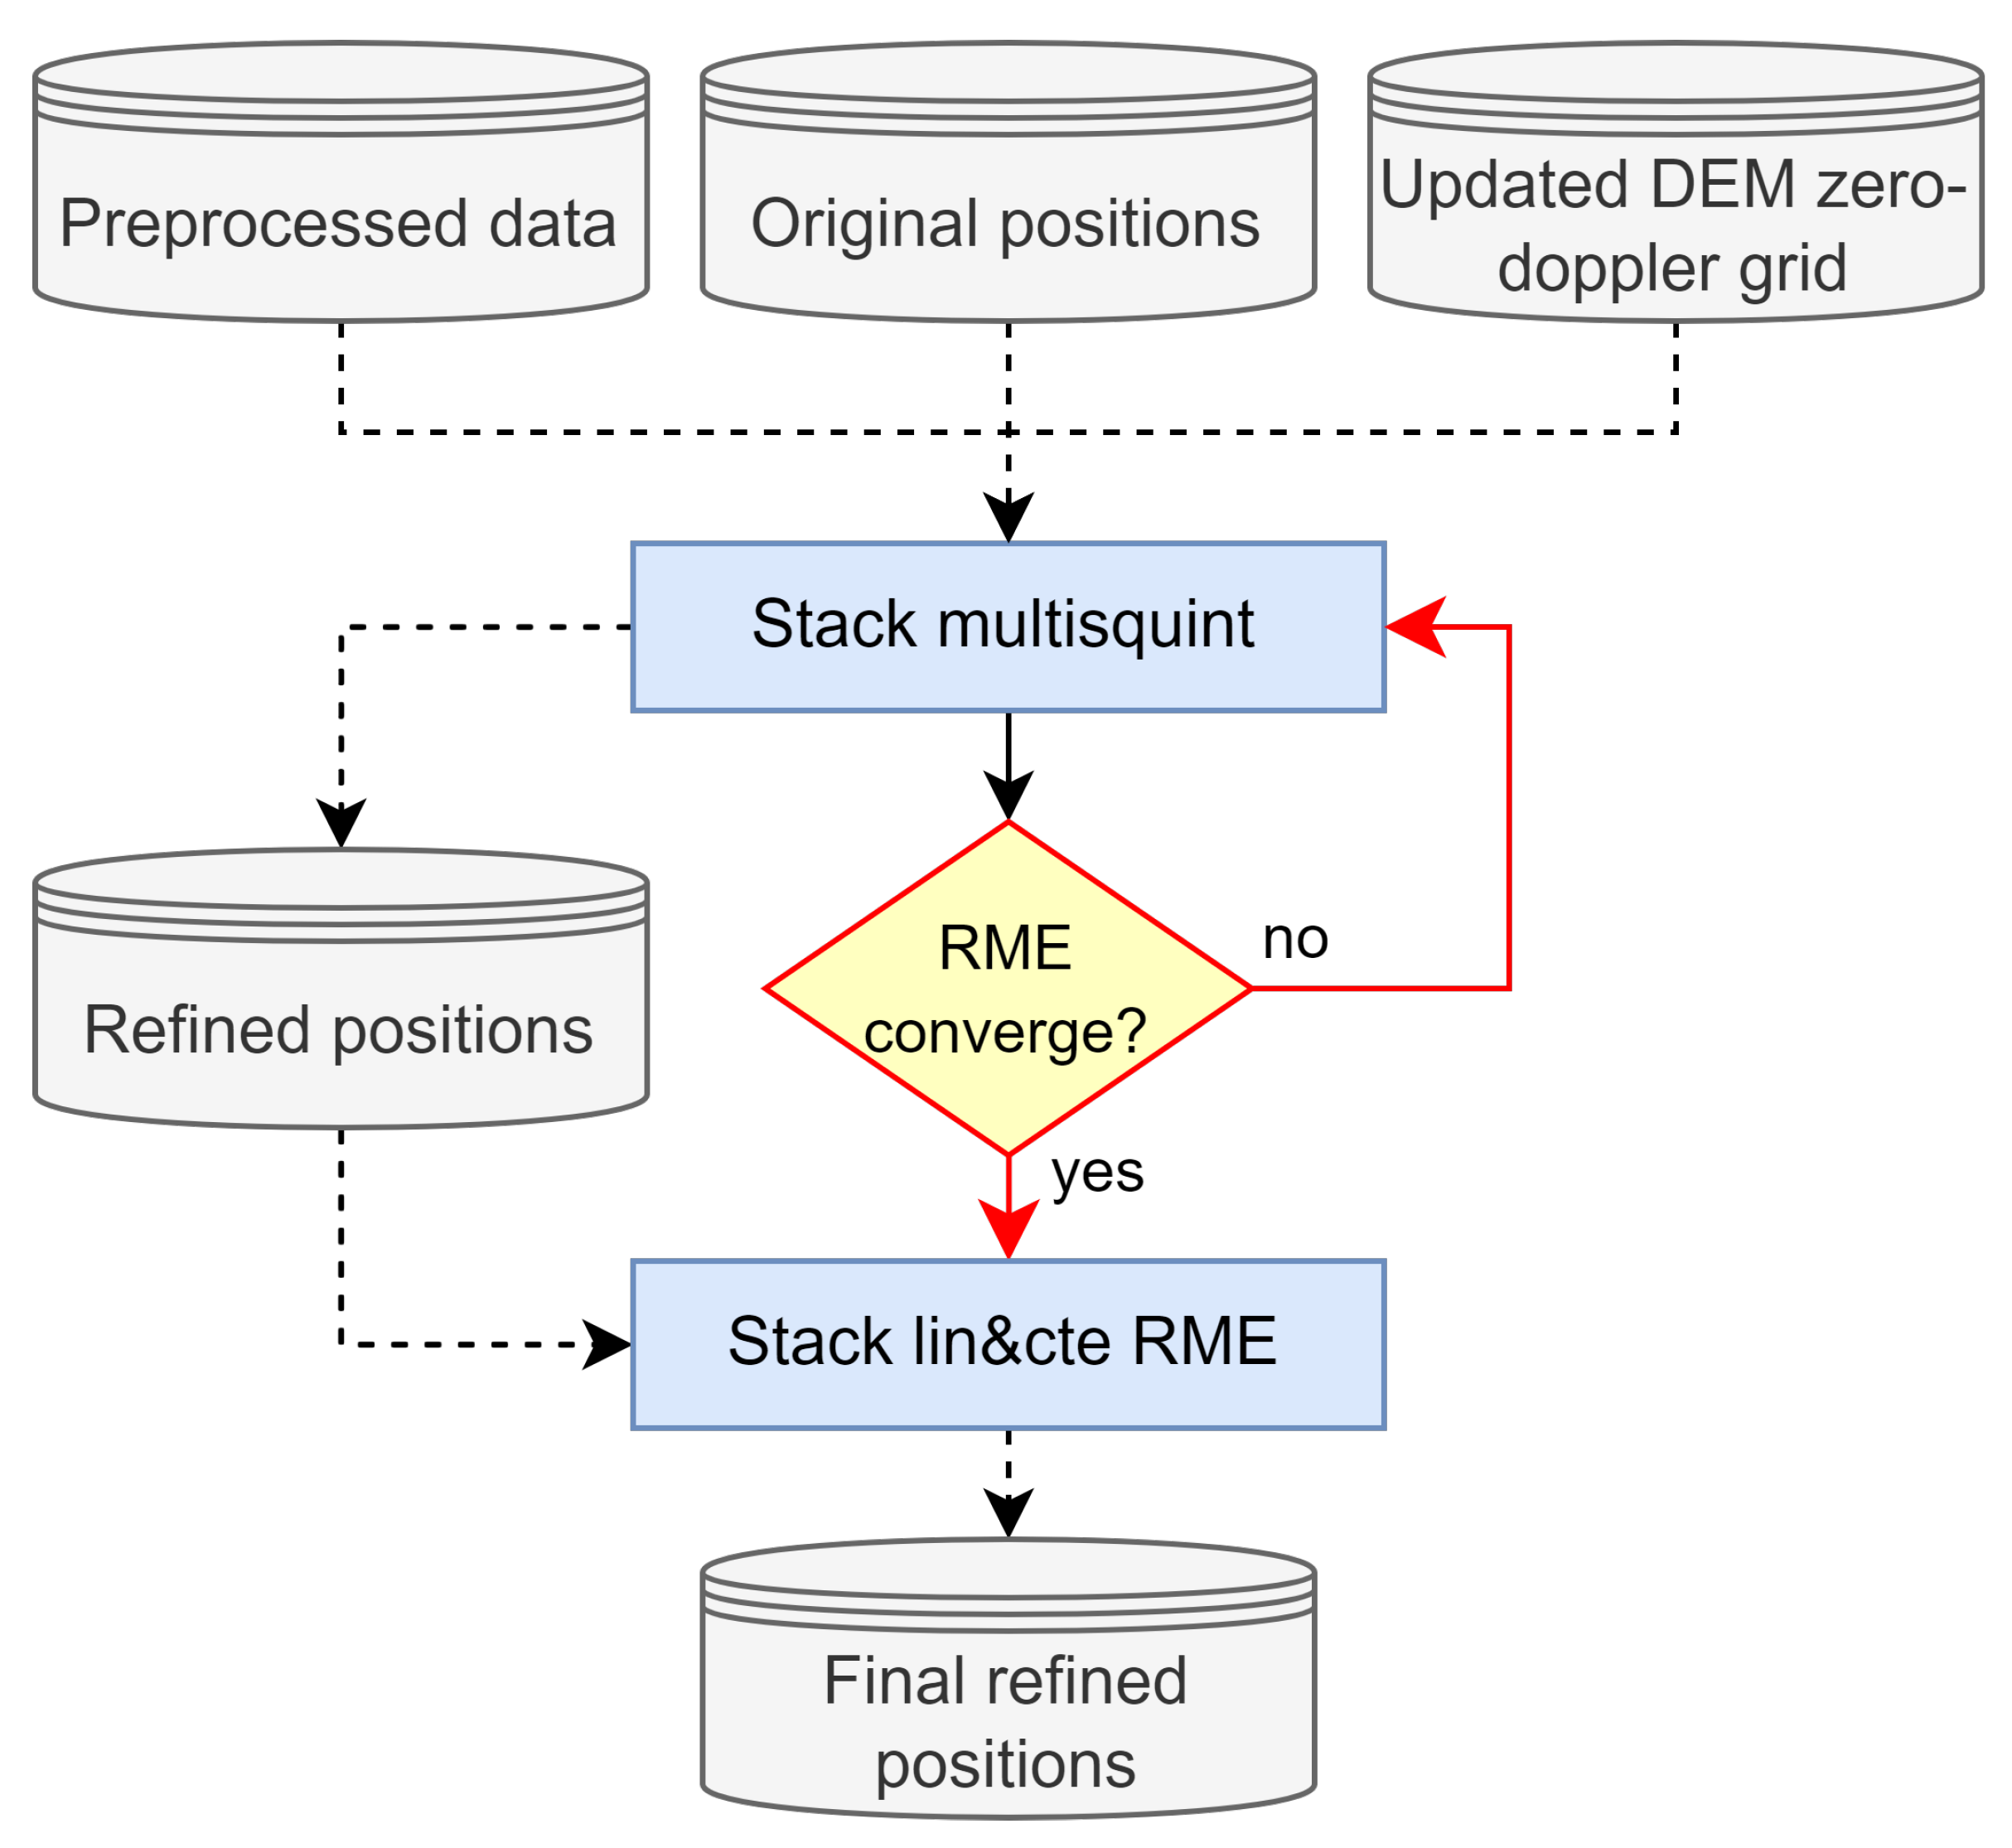
The subsequent discussion proposes a repeat-pass interferometric processing flow designed to address the aforementioned challenges and generate a reliable repeat-pass interferometric stack. The processing chain, depicted in Figure 3, is divided into two main blocks as follows:
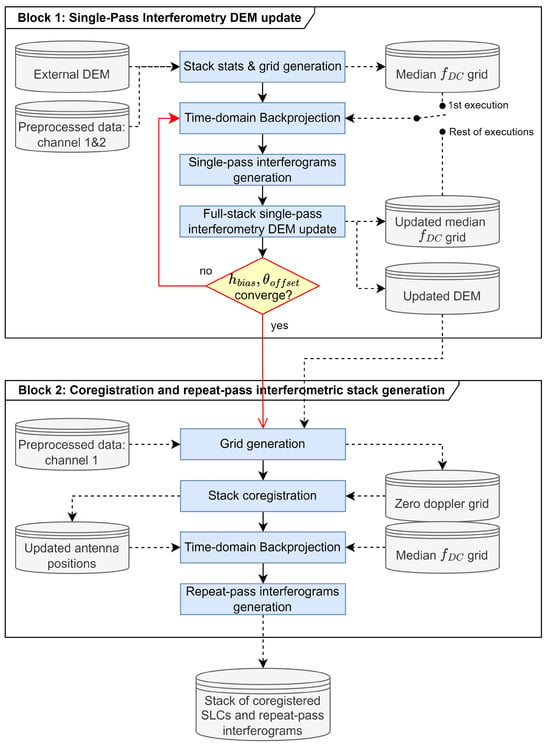
Figure 3.
Repeat-pass interferometric processing block diagram.
- The first block exploits the cross-track single-pass interferometric capabilities of the SAR-Drone system and corrects for any DEM errors by performing a refined estimation of the topography using the entire dataset of single-pass interferograms.
- The second block utilizes the refined DEM provided by the first block to minimize focusing errors, enabling a more accurate coregistration of the stack of acquisitions by estimating the residual antenna position errors. As a result, repeat-pass interferograms free of residual motion errors and topographic residues are generated.
The key steps of each of the two processing blocks introduced previously are explained in depth in the following subsections. For the first block, the height estimation process is detailed, while for the second block, aspects which are crucial for generating a repeat-pass interferogram stack, such as coregistration, are described comprehensively.
3.1. Single-Pass Interferometry DEM Update Processing Block
The first block begins by reading the preprocessed data and an input DEM as follows:
- The preprocessed data include the radar raw data of both channels, the antenna positions and orientation interpolated to each pulse timestamp, and the Doppler centroid frequency and Doppler bandwidth estimated using both the range compressed and the navigation data.
- The DEM is obtained externally as a reference for the existing topography. The Shuttle Radar Topography Mission (SRTM) [39] or the TanDEM-X [40] databases are excellent options.
At this stage, individual Doppler and navigation statistics of each acquisition, as well as common statistics of the entire stack, are generated and used to detect and remove any outlier acquisitions. Then, a slant-range grid centered at the median Doppler centroid frequency is generated by backward geocoding of the input DEM followed by forward geocoding. With this grid, all acquisitions are focused through the TDBP algorithm using the median Doppler centroid and the estimated common Doppler bandwidth of the stack to minimize decorrelation due to non-common spectra. An implementation of the TDBP in CUDA is used to focus all acquisitions [41,42]. This approach greatly reduces the computation time compared to a CPU-based implementation, achieving execution times similar to frequency domain algorithms.
Once all the SLCs have been focused, the single-pass interferograms and interferometric matrices needed to estimate heights, e.g., the phase-to-height mapping matrices or geometrical matrices, such as range or look angle, are computed. Then, refined topographic information is estimated using all available single-pass interferograms.
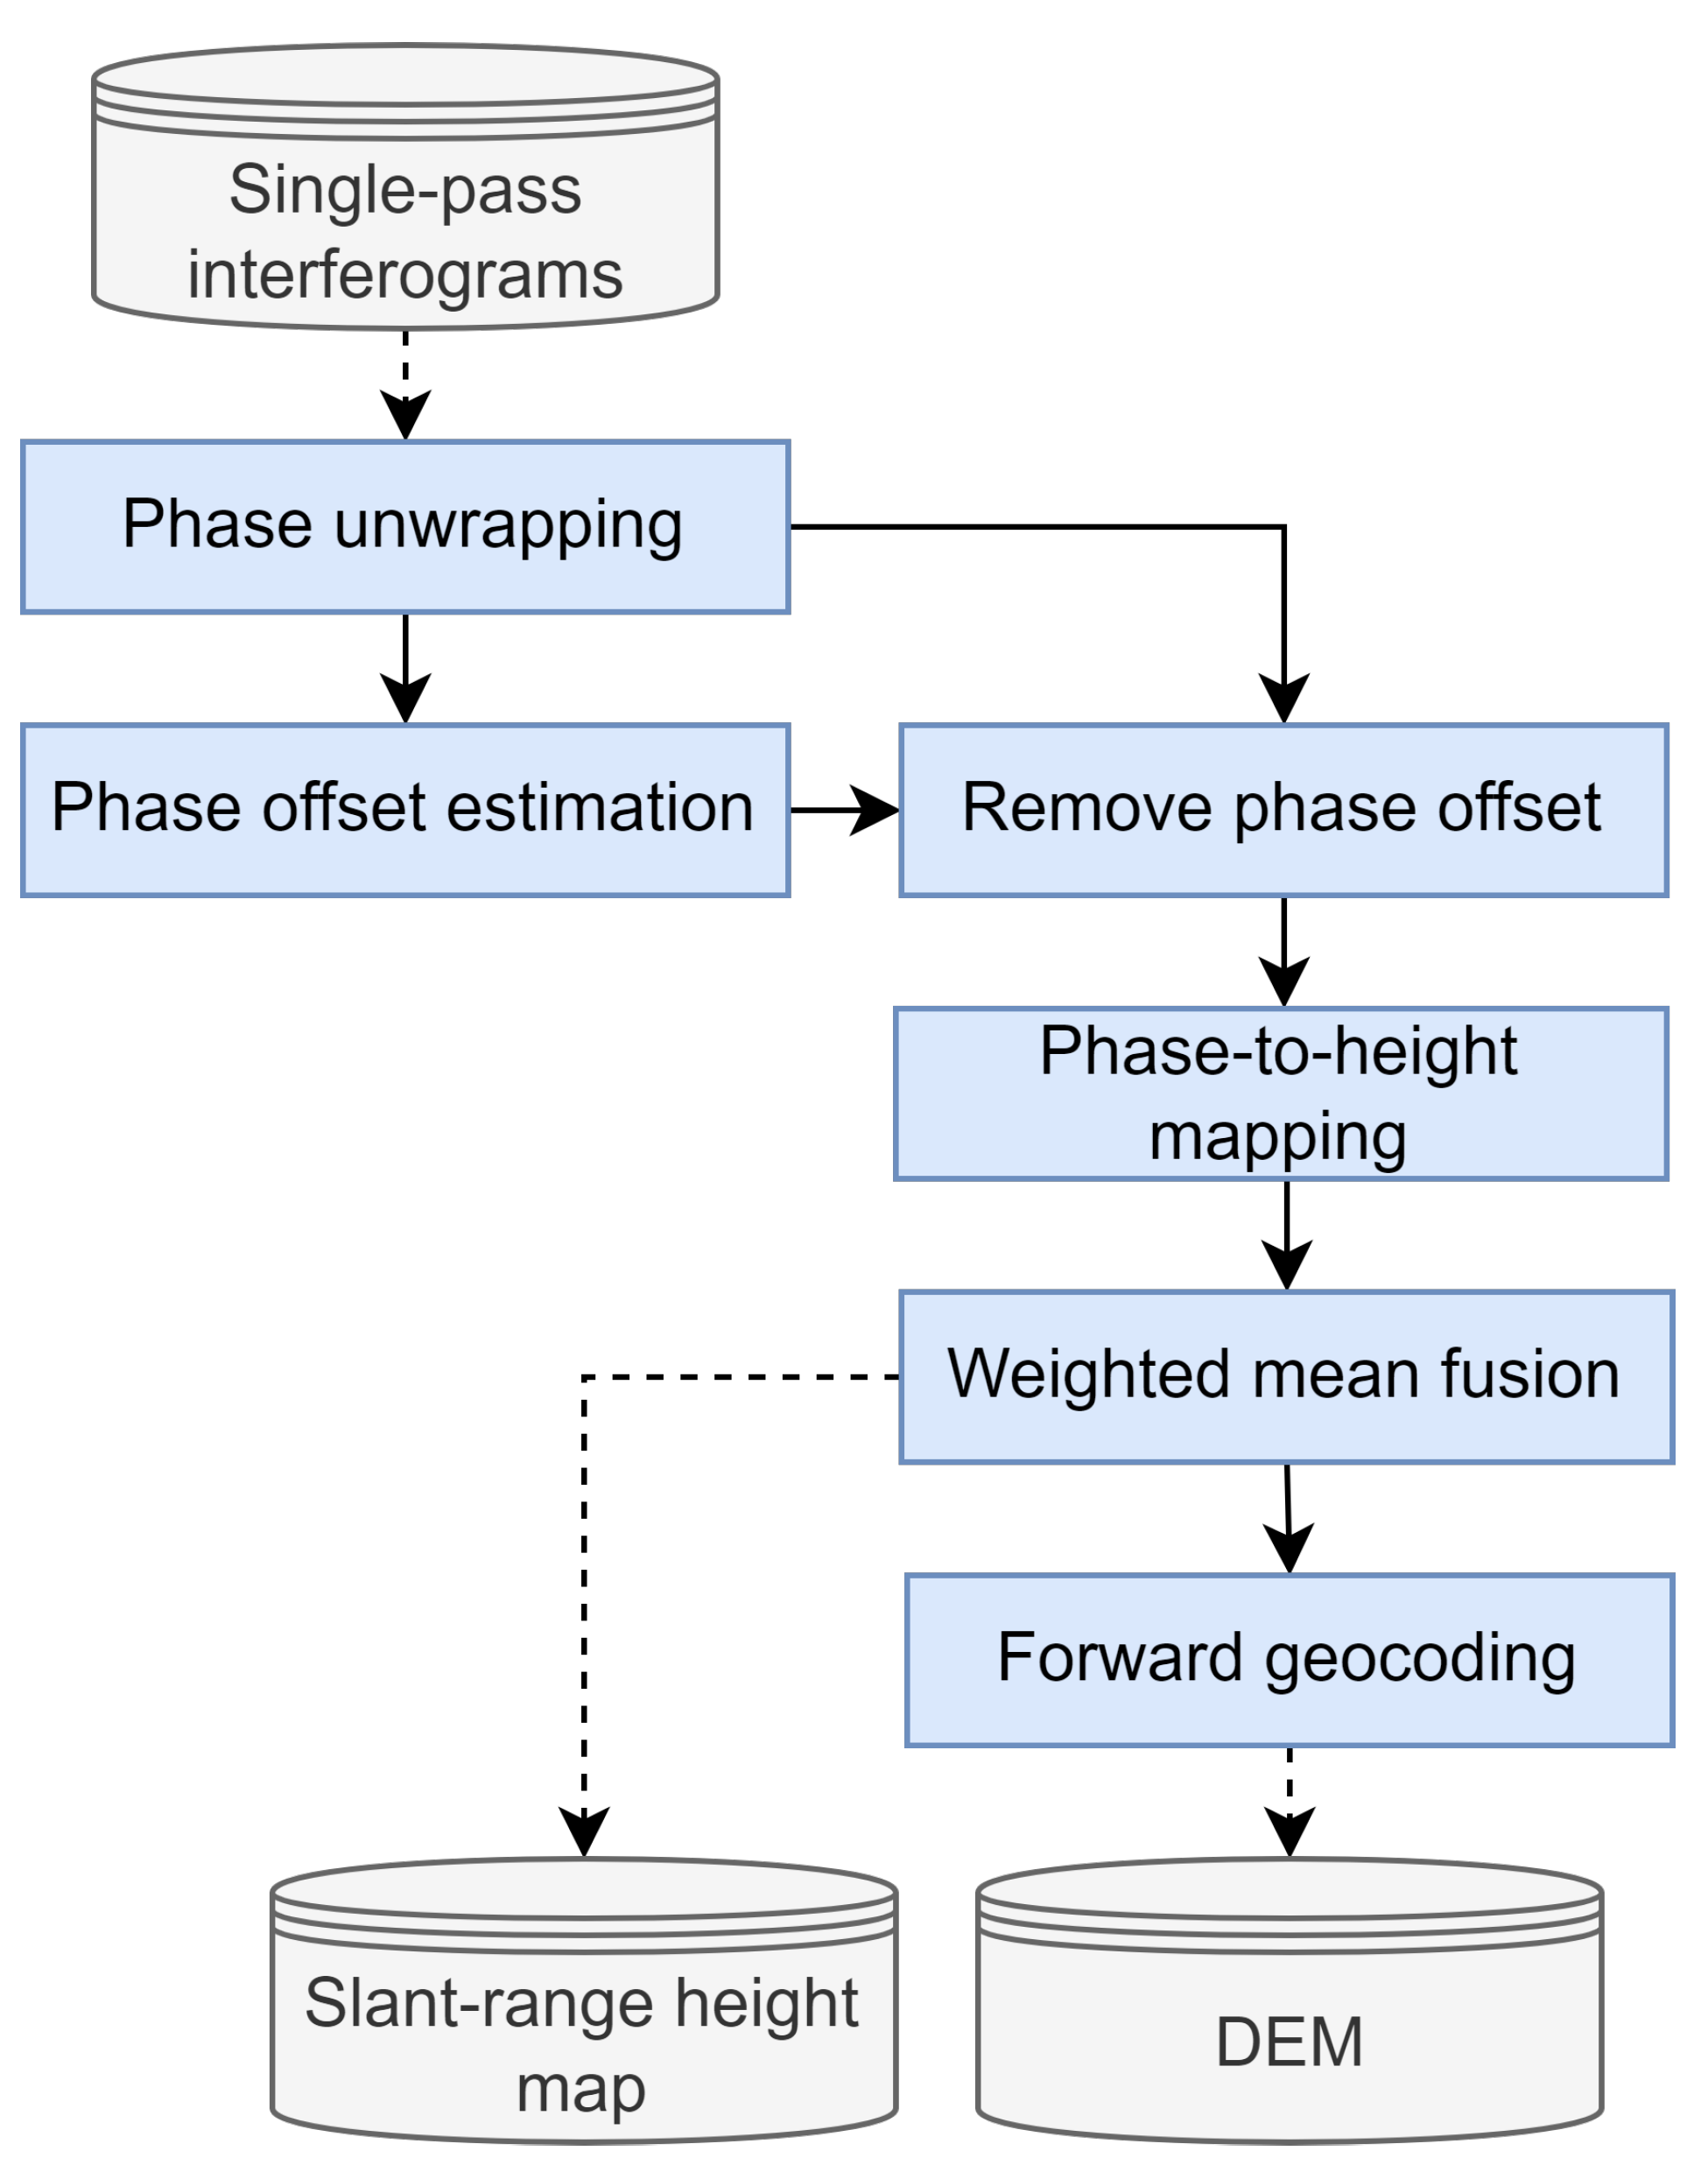
The height estimation module relies on exploiting the sensitivity of single-pass interferograms to topography, which offers numerous advantages compared to the inclusion of repeat-pass interferograms in this process: they are not affected by Atmospheric Phase Screen (APS), the RME is negligible, and most of the focusing errors are shared between the two SLCs; therefore, their contribution is canceled in the interferogram. Moreover, the height sensitivity is consistent throughout the entire flight line due to the fixed baseline, especially compared to the sensitivity variations of repeat-pass interferograms of the SAR-Drone system, where the track deviations are comparable to the maximum baselines allowed to avoid strong decorrelation. Furthermore, there is no temporal decorrelation, which might be significant at the Ku-band, especially for certain land covers such as vegetated areas where just a few minutes [43] can lead to totally decorrelated image sectors. The processing scheme proposed to estimate a new height map using a set of single-pass interferograms is illustrated in Figure 4.
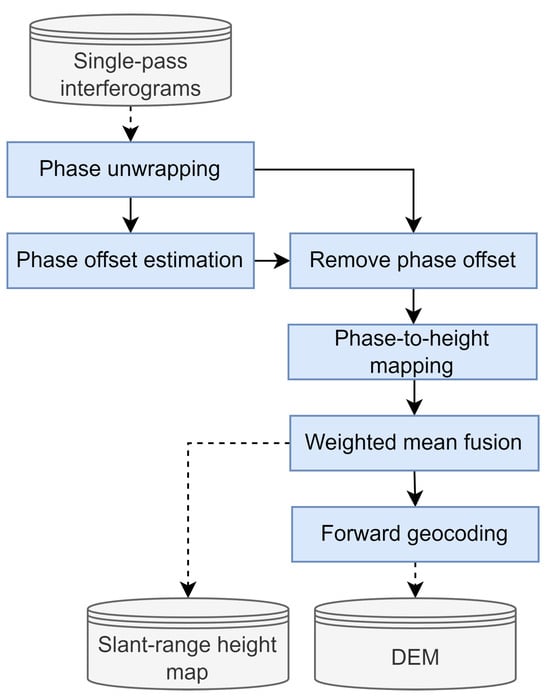
Figure 4.
Height map estimation block diagram.
The height estimation input is a set of single-pass interferograms and their height-to-phase matrices, K, i.e., the matrices of the phase sensitivity to height for each pixel, which, for the single-pass case, where the transmit antenna is shared between receivers, follows the expression [44]
where is the wavelength, is the perpendicular baseline between the two receive channels, r is the mean range from the antennas to the target, and is the mean look angle.
The estimation starts by phase unwrapping all interferograms. Since the TDBP algorithm uses an external DEM to focus the data, the phases are only sensitive to the difference between the input DEM and the real topography. Combined with the SAR-Drone system’s short baseline, no rapid phase fringe patterns should be present in most scenarios, and therefore, no major phase unwrapping errors are expected.
Prior to mapping phases to height, the next step is to estimate the phase offset of each interferogram caused by differences in the electrical lengths between the two receivers and by the lack of absolute reference of the phase unwrapping. If it is not properly estimated and compensated, the resulting height map will be biased. In [45], the authors propose a method for jointly estimating the phase offset of a single interferogram and any global height bias in the input DEM. An extension of this method is proposed here, which exploits the entire stack of interferograms and is described as follows.
The unwrapped single-pass phase for an interferogram i can be modeled as
where x and r represent the azimuth and range indices, respectively, h is the height difference between the actual topography and the input DEM, is the phase offset, and n is the phase noise term. The height term can be separated into a global height bias and the local topography contribution,
The contribution of the local topography, , can be assumed negligible for most scenarios as long as the processing uses an input DEM. However, the height bias, , being a global term, will bias the phase offset estimation and needs to be considered. Hence, the estimation of the phase offset is jointly estimated with the height bias resulting in
While and can be independently estimated for each interferogram via least squares, it can also be extended to the entire stack by leveraging the fact that the height bias is common to all interferograms. Assuming there are a total of I interferograms, each one with L pixels, the following linear system of equations can be defined:
where , , is the vector of height sensitivity of the i-th interferogram, and is the unwrapped phase of the i-th interferogram. Note that all vectors are L-dimensional. The system can be solved via weighted least squares, using the inverse of the phase variance as the weights.
Once the phase offsets for each interferogram are known and subtracted from the unwrapped phases, the phases are mapped to heights and fused using a weighted mean, using the inverse of the height variance as weights. Assuming there are no topographic changes between acquisitions and that the height variance is correctly estimated, the weighted mean improves the height standard deviation of the resulting estimation. A forward geocoding is applied to the final fused height map to retrieve the new slant-range grid, the geocoding coordinates, and the new DEM.
As indicated in the proposed processing strategy shown in Figure 3, the entire processing flow can be executed iteratively by refocusing the acquisitions using the new grid to obtain a new dataset of refined interferograms and better height estimations. Typically, two iterations are sufficient to achieve the precision in heights required for the subsequent processing block.
3.2. Coregistration and Repeat-Pass Interferometry Processing Block
Repeat-pass interferometric applications such as height or ground displacement estimation rely on the quality of the phase. Therefore, the coregistration of all acquisitions within a dataset is mandatory to maximize the interferograms’ coherence and minimize phase screens due to processing errors.
The SAR-Drone system, like any other airborne SAR system, is affected by RME due to inaccuracies in the navigation system. However, the SAR-Drone system is especially susceptible to these errors since the wavelength, 17.44 mm, is comparable to the positioning standard deviations of current commercial navigation systems, 10 to 20 mm. For this reason, repeat-pass interferograms before coregistration can be significantly decorrelated, compared to lower frequency radars. Furthermore, as mentioned in previous sections, other focusing phase errors in the acquisitions will also affect the interferograms, the residual topography being significant among all of them.
The second processing block begins with the generation of a new slant-range grid using the refined DEM, obtained in the first processing block. It is followed by the coregistration, depicted in Figure 5.
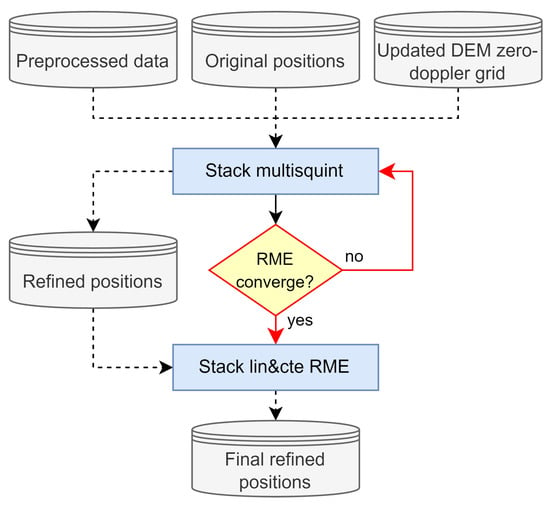
Figure 5.
Coregistration block diagram.
The first coregistration step consists of iteratively applying the multisquint algorithm that estimates the relative high-frequency RME between SLC pairs [2]. The subsequent paragraphs provide a detailed description of the algorithm’s theoretical basis.
The repeat-pass interferogram phase before the coregistration of two SLCs focused within the same slant-range grid and aligned in the along-track direction can be modeled as
where is the range difference between the two SLCs in the line of sight, is the residual phase due to differences between each SLC phase, is the global phase offset due to processing and RF differences, and the phase noise term has been neglected. The residual phase can be separated into a combination of several phase contributions,
The term represents the RME phase due to differences in antenna positioning errors between each SLC. The term corresponds to the difference of focusing phase errors due to residual topography between the two SLCs. The term is the True Coregistration Error (TCE), accounting for any along-track displacement that occurred between acquisitions [46,47]. Finally, encompasses the sum of all other focusing phase error differences between the SLCs.
The multisquint bases the estimation of the residual phase on the observation of the same position on the ground from multiple squint angles, corresponding to different sub-apertures. Each sub-aperture is centered at a different Doppler centroid and uses a fraction of the total common Doppler bandwidth. In this context, when two sub-apertures are generated for each of the interferogram’s SLC, two interferograms, one for each sub-aperture, can be generated with the phase,
where the subscripts and refer to the sub-apertures. If the SLCs are focused using the same grid, the differential interferogram between the two sub-aperture interferograms can be generated [48] and the resulting phase can be described as,
Therefore, the phase of the differential interferogram is the difference between the residual error at two different positions in the along-track direction, each error corresponding to the integrated error along the synthetic aperture centered at the selected Doppler centroid frequency of each sub-aperture. Consequently, an approximation of the derivative of the residual error is obtained after scaling the differential phase by the sub-aperture separation [48].
The main limitation of using the differential interferogram to estimate the residual error lies in the inability of retrieving the error in decorrelated areas. Hence, before proceeding to estimate the residual error based on the differential phase, the multisquint algorithm exploits the fact that multiple differential interferograms, formed using adjacent pairs of sub-aperture interferograms, can be coherently added to reduce the phase noise and minimize the decorrelated regions, therefore increasing the pixels available to use in the estimation of the errors [2]. The phase of the coherent sum, the multisquint phase, is then assumed to contain only the derivative of the RME. Consequently, a correction for the cross-track and vertical antenna positions can be estimated for each azimuth position via least squares using the model [2],
The term is the multisquint phase, is the scaling factor corresponding to the sub-aperture separation, and the cross-track and vertical components of the RME are represented by and , respectively.
Note that the multisquint phase estimates the derivative of the RME; hence, the retrieved values need to be integrated along the azimuth and low-frequency errors cannot be estimated. Furthermore, while the multisquint phase model, shown in Equation (11), assumes only the RME, the phase is sensitive to all residual errors, as shown in Equation (10). Hence, the three other contributions will bias the baseline correction retrieved by the multisquint phase if not properly accounted for. First, the contribution due to residual topography can be estimated and corrected with further processing steps as indicated in [8]. However, this contribution is neglected in this work since the interferometric SAR-Drone processing chain generates a refined DEM by exploiting single-pass interferometry. The second contribution, the TCE, can be estimated by an extension of the multisquint algorithm as described in [46]. However, no along-track displacement is expected in the first test sites imaged with the SAR-Drone system; hence, it is also neglected in this paper. Finally, it is assumed that the rest of the error contributions, , are not significant enough to bias the estimation. Therefore, low bias is expected in the retrieved baseline corrections.
Up to this point, the multisquint processing flow can be summarized as follows: it begins by using the TDBP to focus several sub-apertures for each acquisition. Next, the sub-aperture interferograms and differential interferograms are generated, followed by the computation of the multisquint coherent sum. Finally, the derivative of the error is estimated via least squares for each along-track position, and the result is integrated.
At this stage, the high-frequency RME is obtained for a single interferometric pair and used to correct the original antenna positions of the interferogram’s slave SLC. The updated positions are then further refined by iteratively refocusing the slave SLC and applying the multisquint until the estimated RME converges.
The entire stack is coregistered by selecting one SLC as the master of the stack. The multisquint is applied only to the interferograms containing the master SLC, and the antenna positions’ corrections are applied to the slave SLCs. This ensures that any combination of SLCs is free from RME, thereby achieving the coregistration of the entire stack [8].
Once the high-frequency RME is estimated and the interferograms are re-generated using the corrected antenna positions, the second step of the coregistration allows for the estimation of the lower frequency RME, the so-called constant and linear baseline errors [2,6]. At this stage, the repeat-pass phase can be modeled as,
The first two terms correspond to the expansion of in Equation (6), representing the projection of ground displacement onto the LOS vector as , and the residual topography, h, not included in the processing DEM. Furthermore, the remaining RMEs are depicted as and , which are the constant and linear baseline error phase contributions, respectively. The lower frequency RMEs are estimated as four unknowns: the cross-track and vertical components of the constant error, and the cross-track and vertical components of the linear error. Since the SLCs have been focused using the TDBP algorithm with an accurate DEM, which is the case when using the heights estimated via the single-pass phases, the residual topography contribution can be neglected. Likewise, the ground displacement contribution can also be neglected since no ground displacement comparable to the imaged area is expected for most scenarios. Therefore, the remaining baseline errors are jointly estimated with the phase offset via least squares using the unwrapped repeat-pass phases and the model [6],
where is the unwrapped repeat-pass phase, is the cross-track component of the constant error, is the cross-track component of the linear error, is the vertical component of the constant error, and is the vertical component of the linear error.
Using the same approach as with the multisquint algorithm, the linear and constant RME is estimated for the interferometric pairs containing the selected master SLC of the stack. The corrections are then applied to the slave SLCs. As a result, each RME is compensated for each interferometric pair, resulting in the coregistration of all acquisitions.
The final step of this processing block involves using the last refined positions to focus all acquisitions and to generate repeat-pass interferograms, which should only contain fringes related to residual topographic errors not estimated in the first block, atmospheric artifacts, and potential ground displacement.
4. Interferometric Data Processing Results
This section presents the results obtained using the Ku-band SAR-Drone system and the proposed data processing scheme described in the previous section.
The area selected for the performance analysis is a quarry near Sallent, a mining town located in Catalunya, Spain. No major mining activities are being conducted in this scenario, and therefore, no large ground displacement processes are expected.
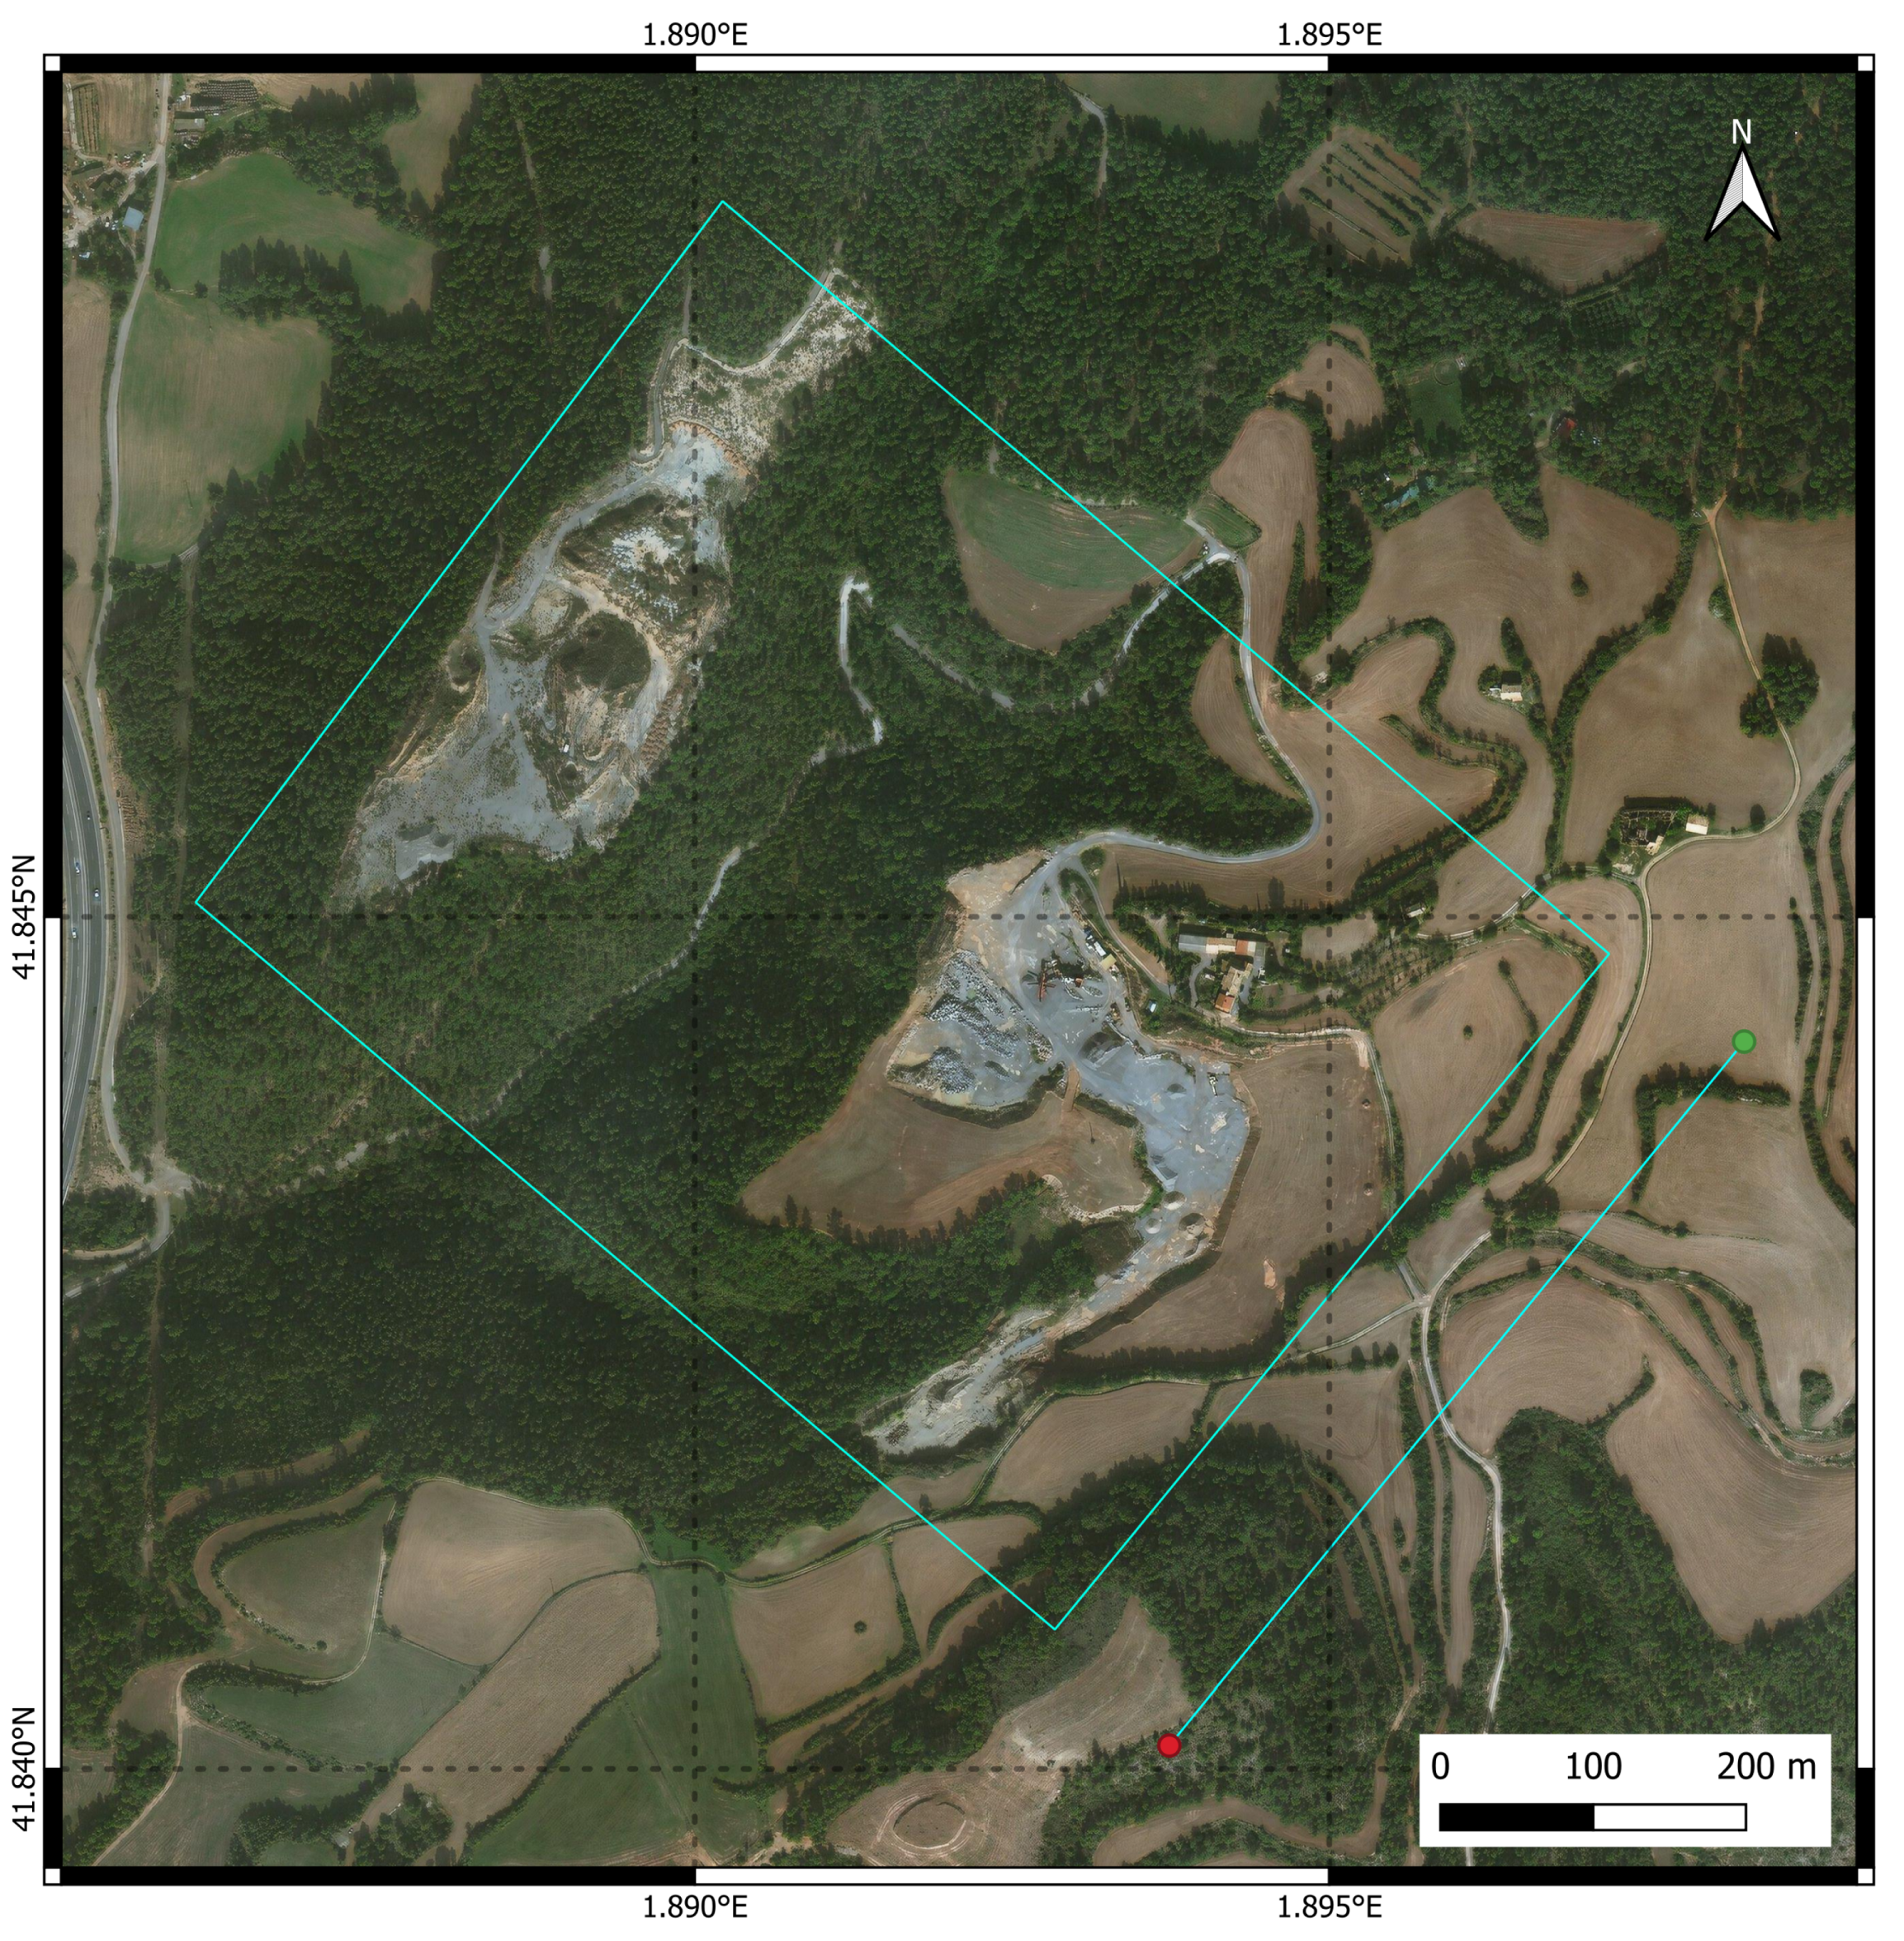
The designed flight plan consists of a single straight flight line of approximately 600 m, which is flown automatically by the drone and repeated for the entire duration of its batteries. The imaged scenario, the flight line, and the approximate swath are shown in Figure 6. The green and red dots indicate the beginning and the end of the flight line, respectively, and the cyan rectangle represents the swath of the system. The main features observed in the imaged site are the quarry, located in the near range of the swath, a dense pine forest and a valley in the mid-range, and bare soil fields mostly in the far range. Note that the optical image used to illustrate the characteristics of the illuminated scenario does not exactly correspond to the date of the deployment of the SAR-Drone system.
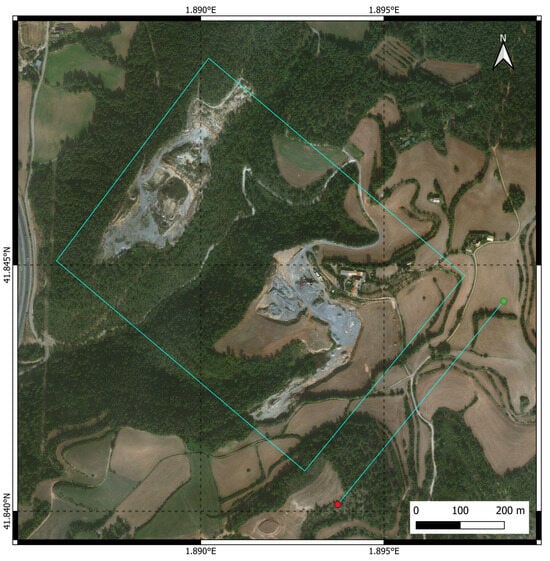
Figure 6.
Aerial image of the area observed by the SAR-Drone system. The swath is represented by the rectangle. The start and end coordinates of the flight line are marked by the green and red dots, respectively. The quarry, a pine forest, a valley, and bare soil fields can be observed along the swath.
The dataset used in this section of the paper has been acquired by repeating the presented flight plan four times resulting in a set of eight acquisitions with a maximum temporal baseline of 90 min.
In the following, the results obtained using the Ku-band SAR-Drone system and the interferometric processing proposed in the paper are presented.
4.1. Single-Pass Interferometry DEM Update Analysis
In this section, the benefits of using the methodology proposed in Section 3.1 to update the input DEM are discussed, highlighting the impact on repeat-pass interferograms.
The processing begins by discarding two out of the eight acquisitions due to Doppler variations, followed by the generation of the slant-range grid using the SRTM DEM [39] as the input DEM. Next, the TDBP algorithm, described in Section 3.1, is used to focus all acquisitions.
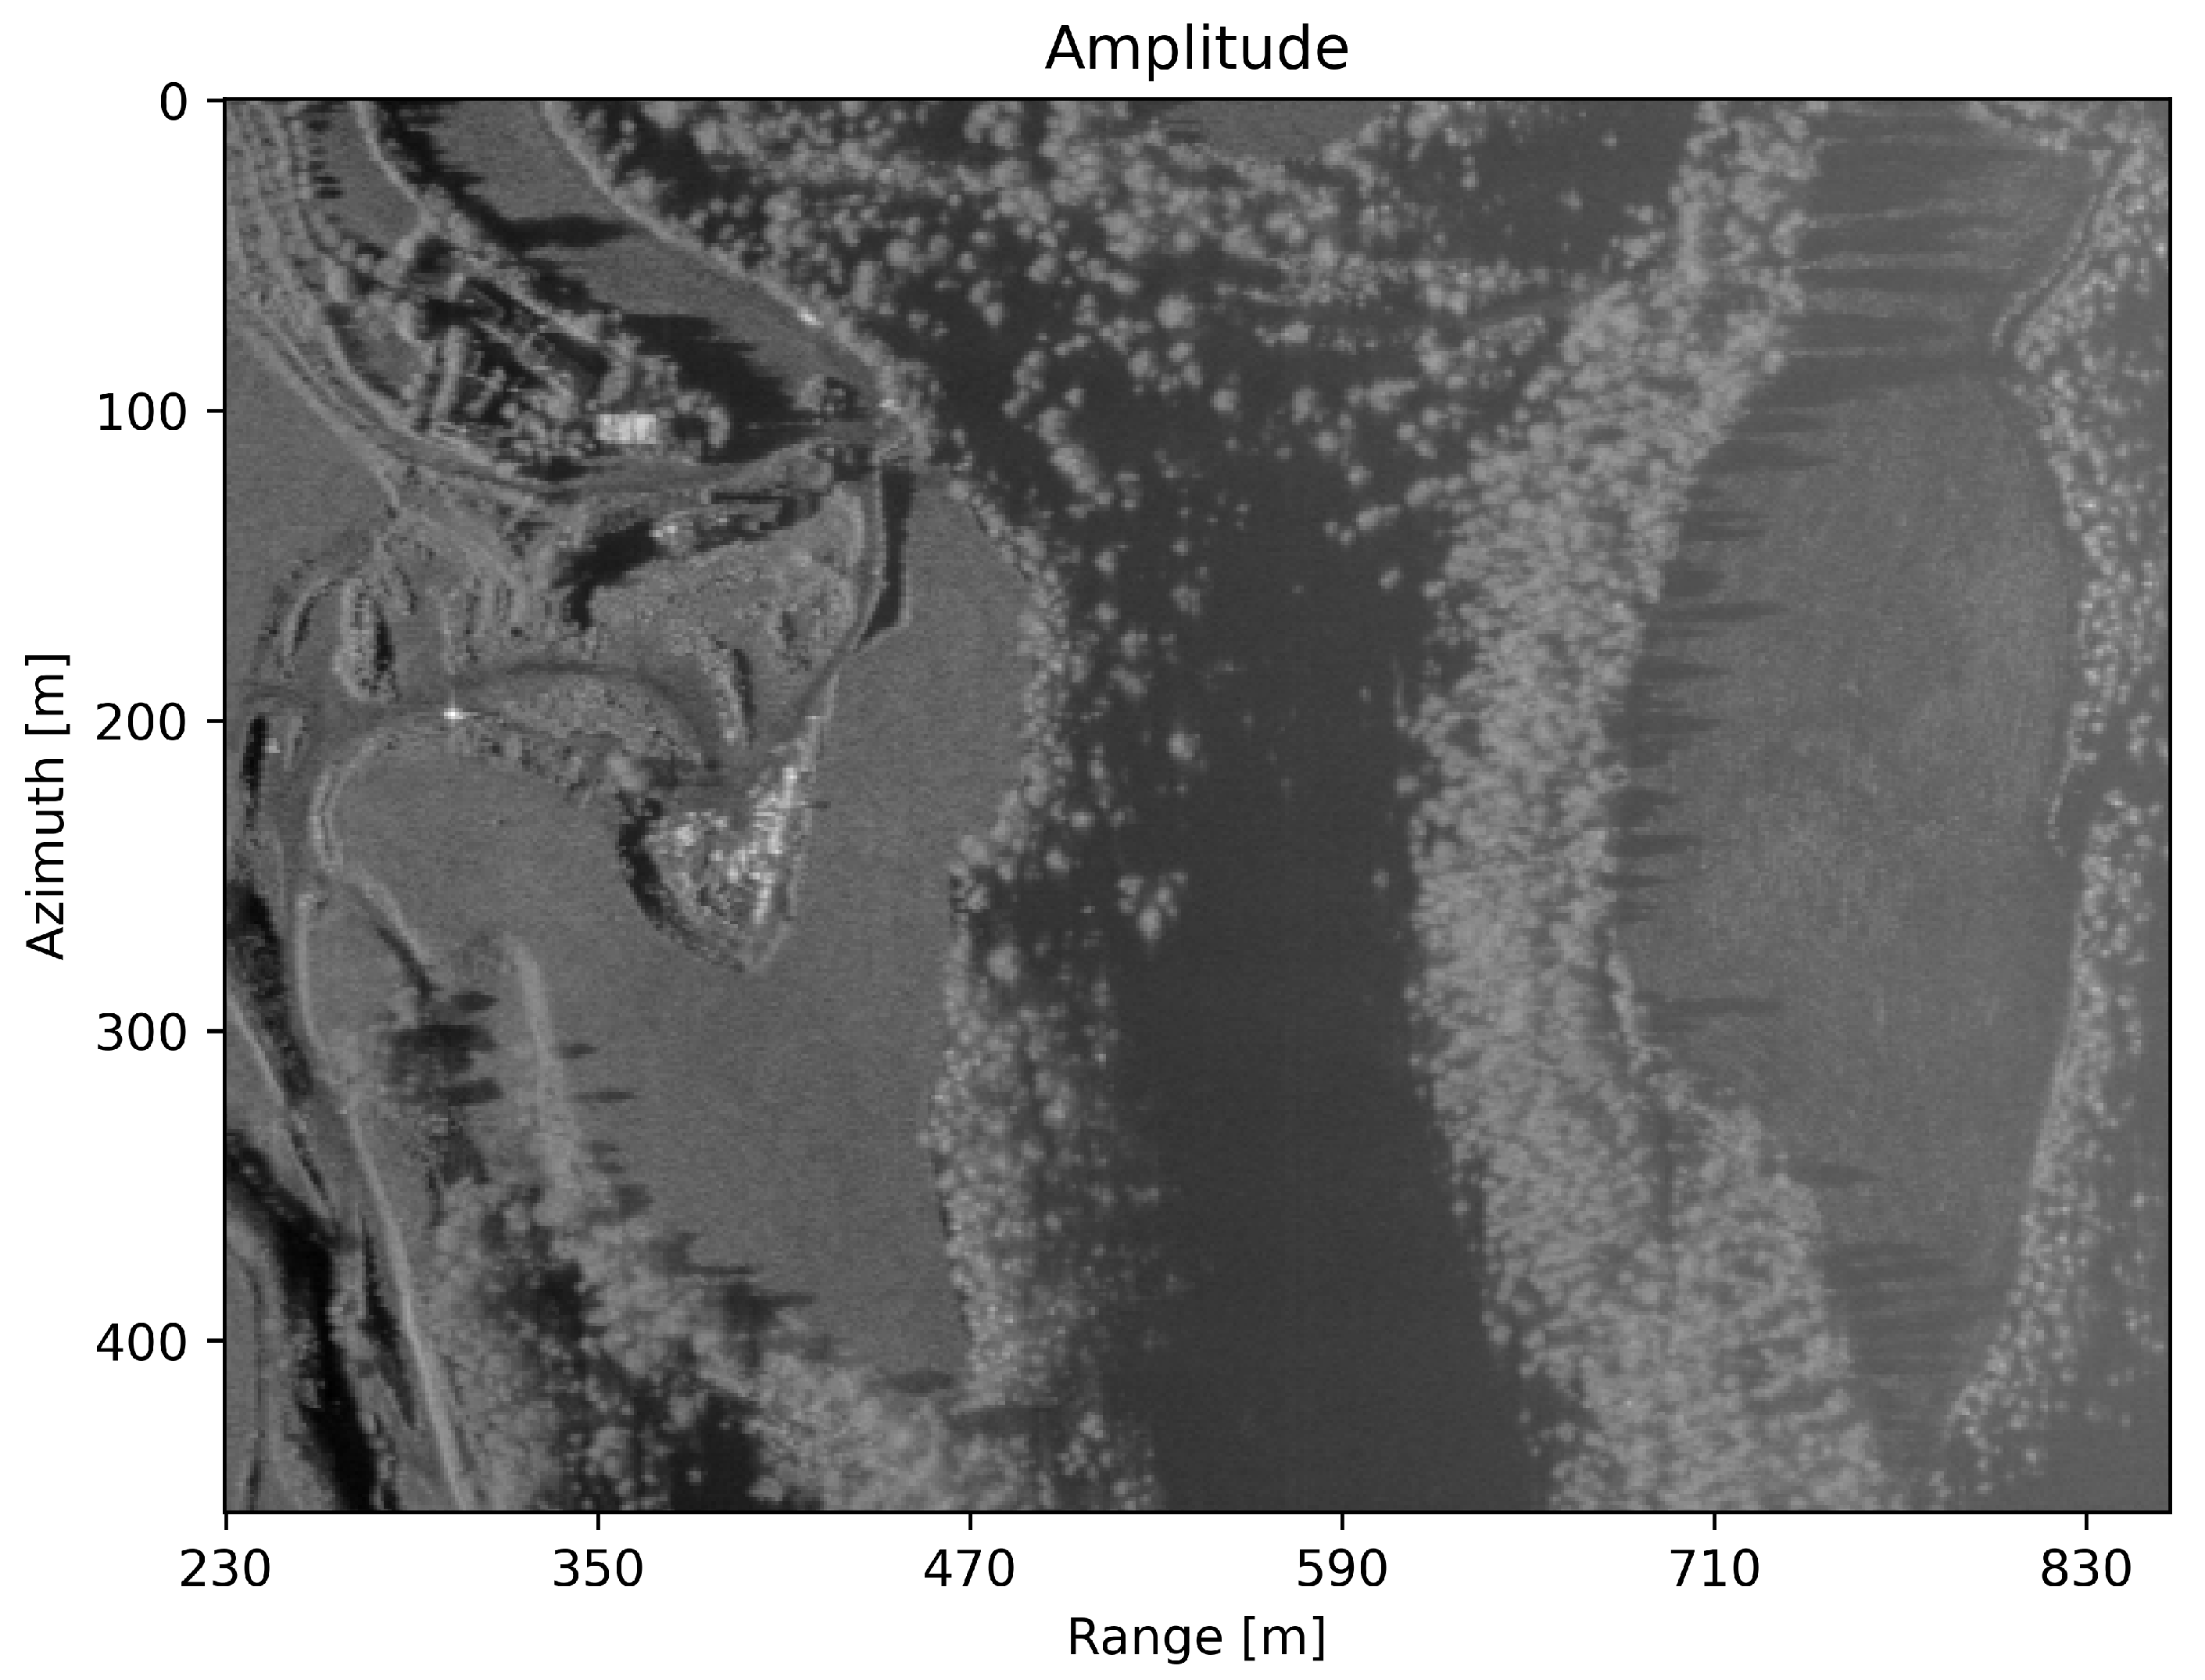
Figure 7 shows the SAR amplitude of one of the acquisitions with a multi-look of 12 × 2, 12 samples in azimuth and 2 samples in range. As mentioned in Section 2.2, the height above ground is limited to 120 m, which greatly impacts the usable swath, as can be seen in the far range of the SLC, where the SNR is degraded. Furthermore, large shadowing areas are common, as can be easily noticed in the mid-range of the SLC.
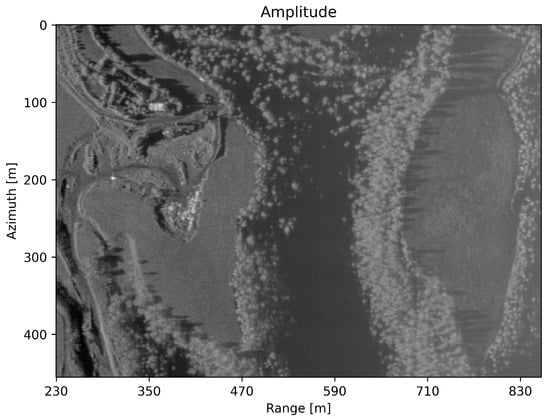
Figure 7.
Multi-looked Single-Look Complex (SLC) amplitude. The multi-look is 12 samples in azimuth and 2 in range, resulting in a pixel size of 1.2 m × 1.2 m.
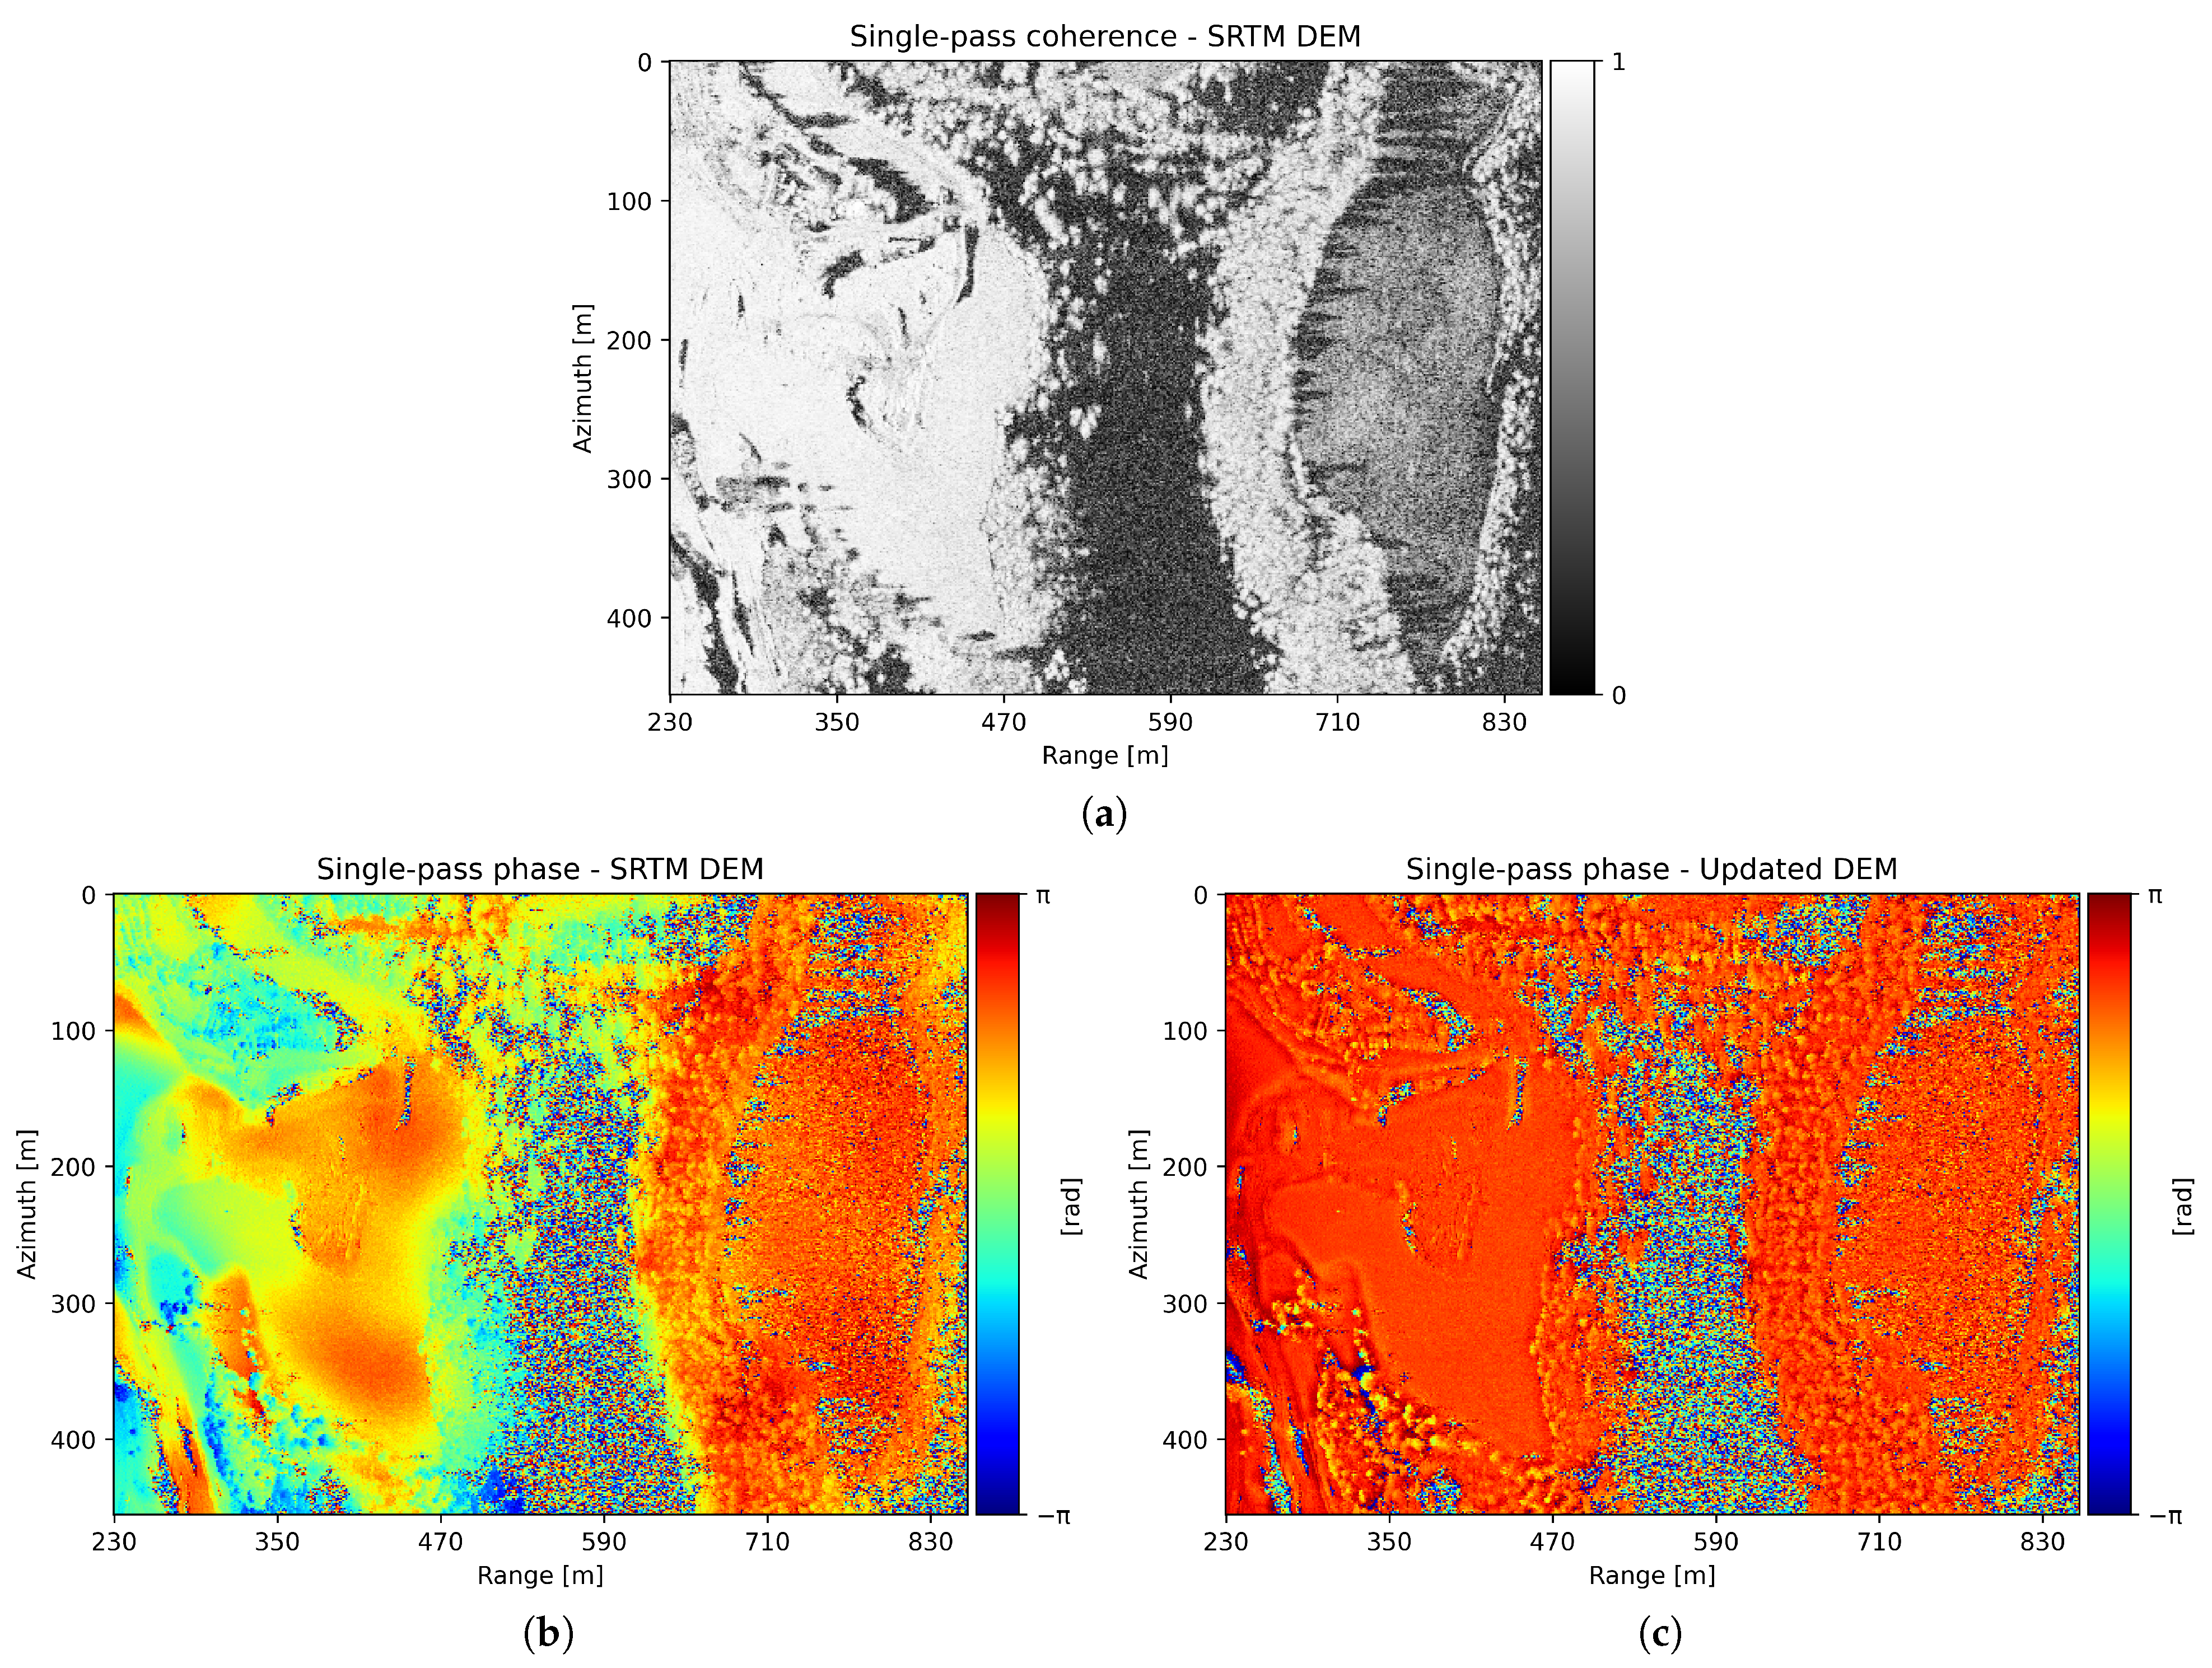
The focusing of the SLCs is followed by the generation of the single-pass interferograms. The different interferometric phases and coherences presented throughout the paper correspond to the multi-looked version of 12 × 2, 12 samples in azimuth and 2 samples in range. The coherence of one of the stack’s single-pass interferograms is shown in Figure 8a. As observed, the coherence is lower at the far range, which is expected due to a lower SNR compared to the near range, mainly caused by larger incidence angles. In addition, shadowing areas exhibit low coherence as expected. The phase of the single-pass interferograms, depicted in Figure 8b, shows local phase variations due to topography, a range phase ramp caused by the height bias present in the SRTM DEM, and a global phase offset. Finally, single-pass interferograms are used to estimate the topography, the height bias, and the phase offset, leading to an update of the input SRTM DEM. This updated DEM is used to compute a new slant-range grid, which is then exploited by the TDBP algorithm to focus the entire stack of acquisitions. Subsequently, the interferograms are generated again. The resulting single-pass interferogram phase is shown in Figure 8c. Since all topography is now included in the updated DEM, the remaining phase is constant with a mean different from zero, caused by the phase offset due to differences in the electrical paths of the two receiving channels.
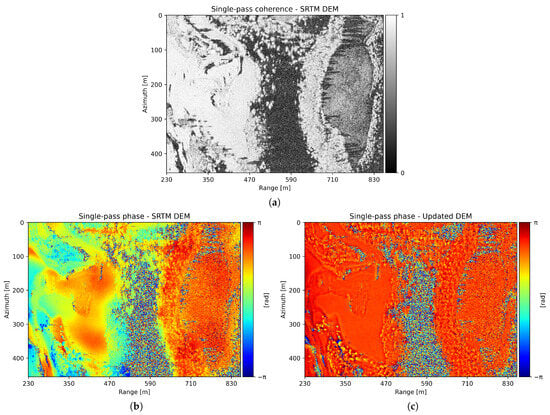
Figure 8.
(a) Single-pass coherence. (b) Single-pass phase using the Shuttle Radar Topography Mission (SRTM) Digital Elevation Model (DEM). (c) Single-pass phase using the DEM updated with the stack of single-pass interferograms.
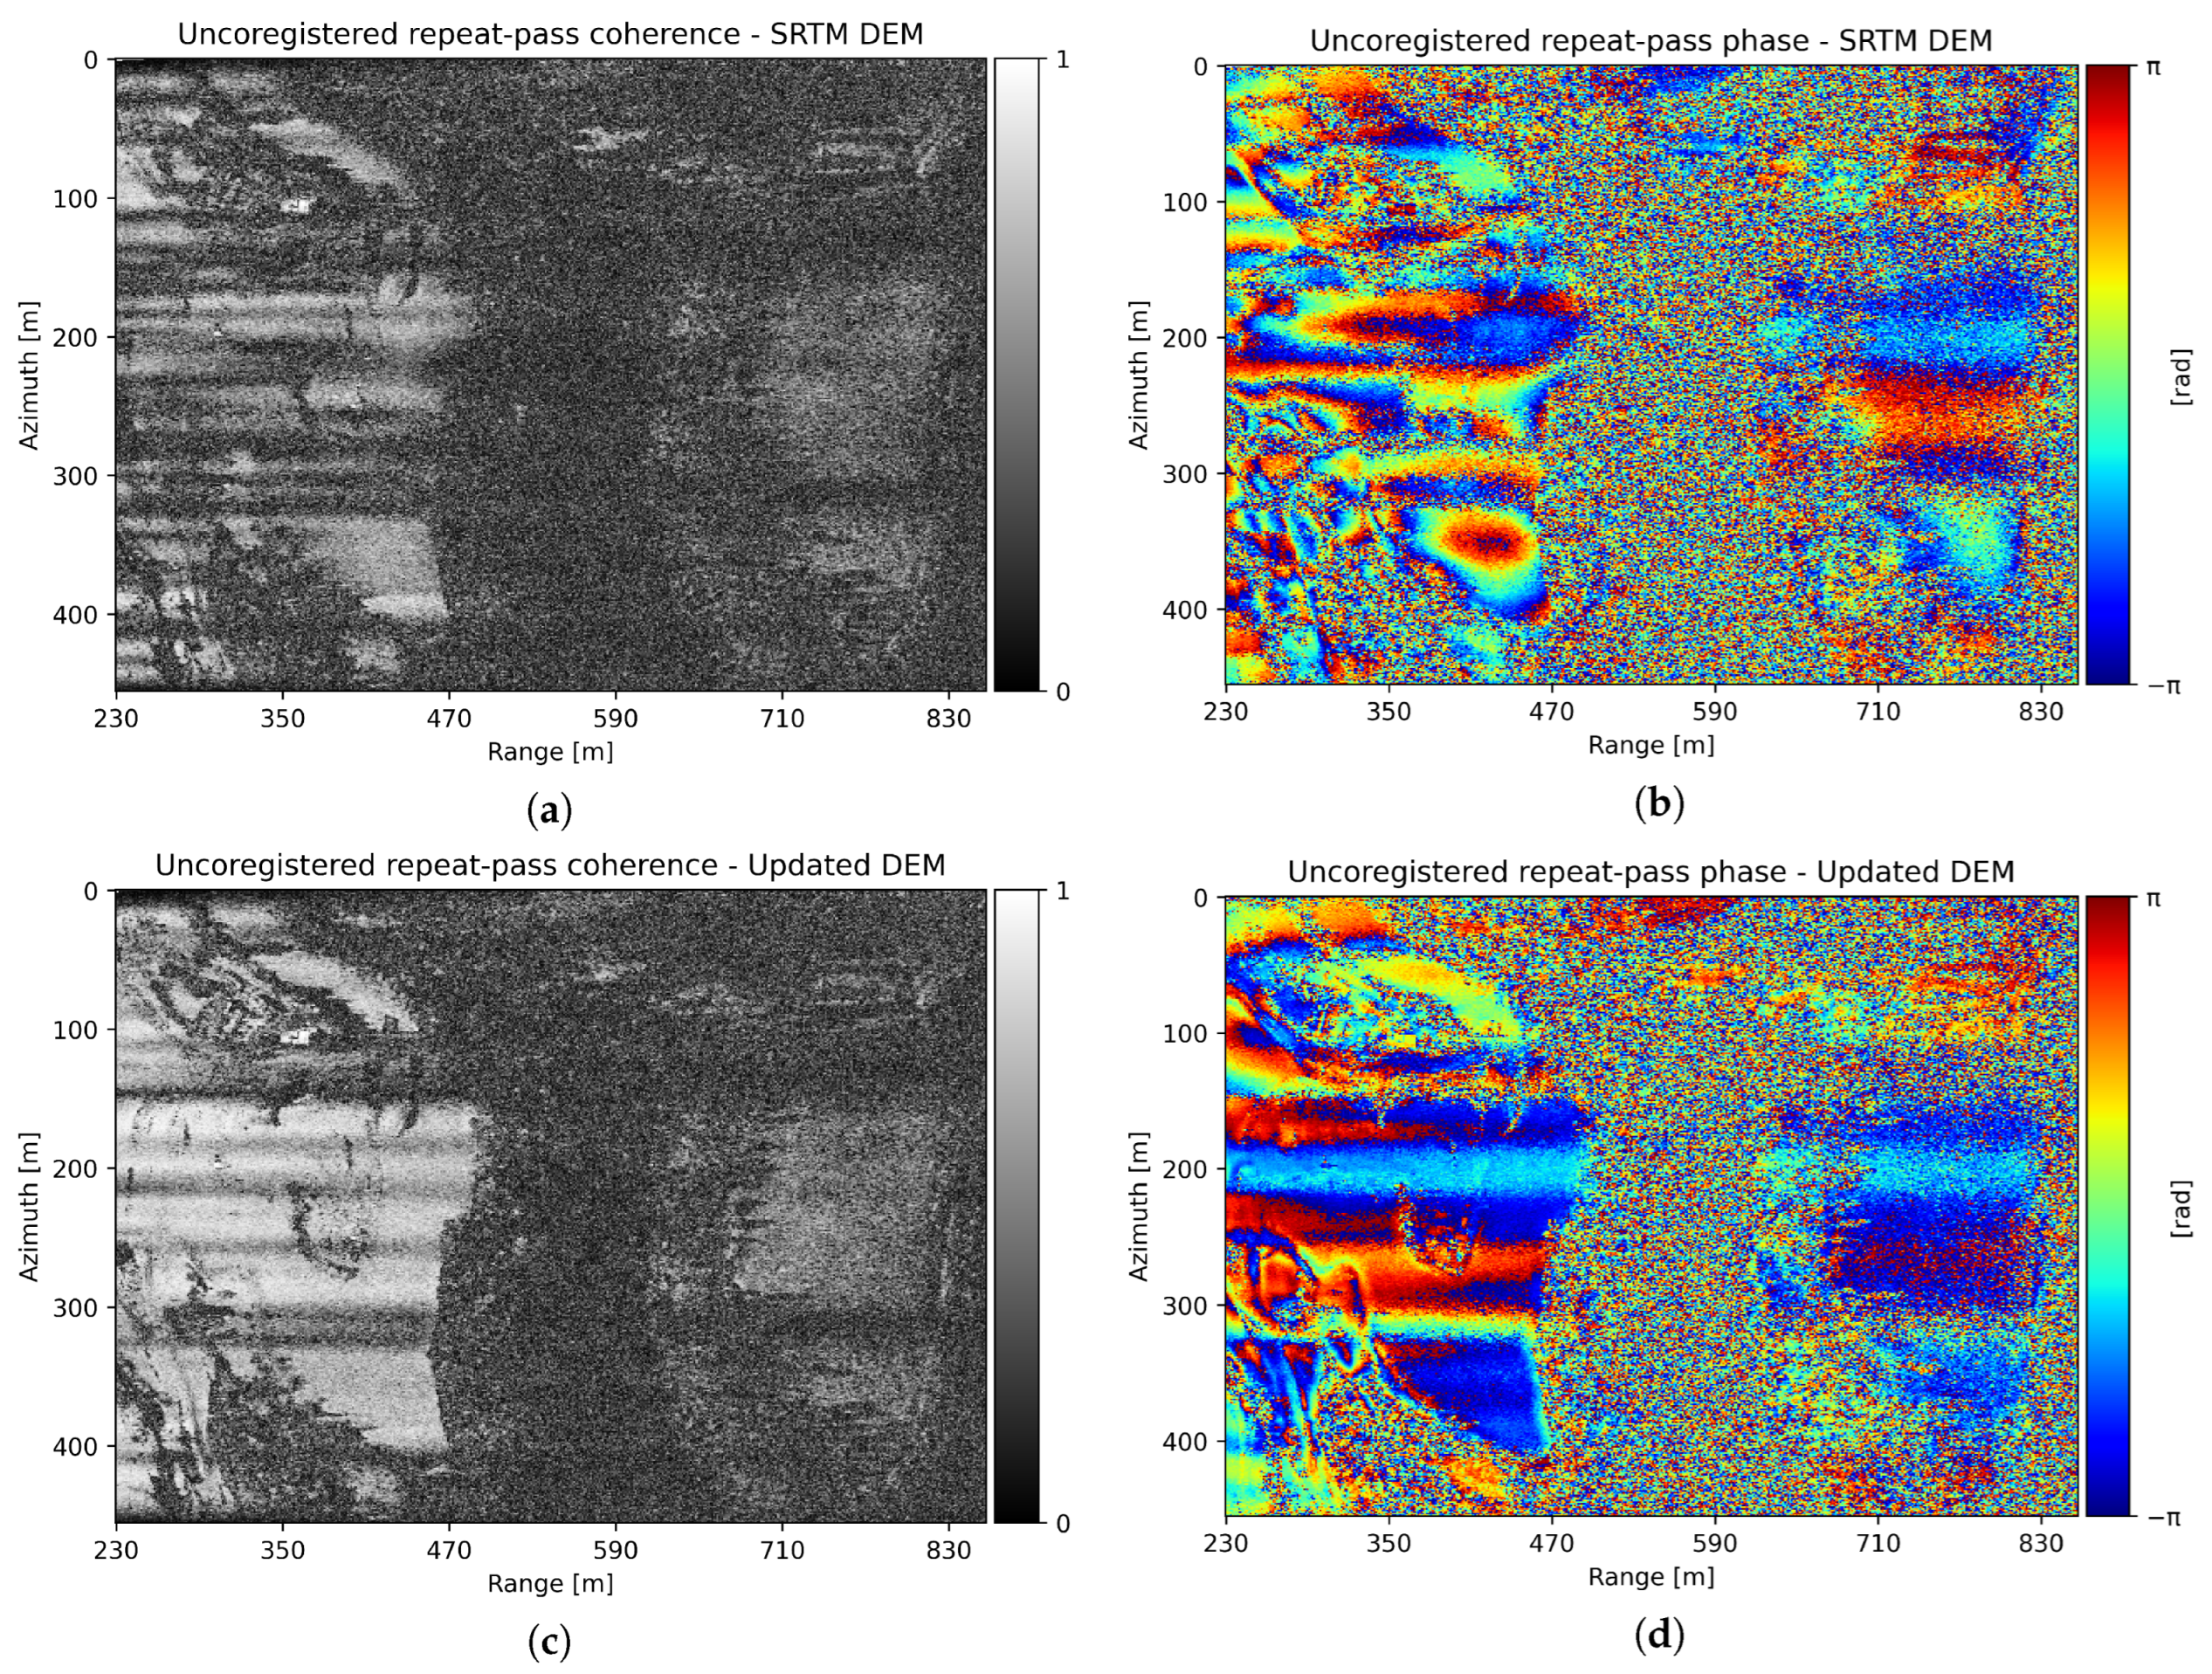
To conclude this analysis, the impact of correcting the input DEM on the uncoregistered repeat-pass interferograms is demonstrated based on the obtained results. One of the primary reasons to update the input topography with refined heights is to minimize focusing errors and increase the coherence between repeat-pass interferograms before coregistration. The effect of using the updated heights on the repeat-pass interferograms is illustrated by comparing the coherences of Figure 9a,c, where a significant increase can be appreciated. Furthermore, the phase fringe pattern, as illustrated in Figure 9b,d, is significantly different since the phase contributions related to focusing phase errors due to incorrect heights and topography, proportional to the perpendicular baseline of the interferogram, are minimized.
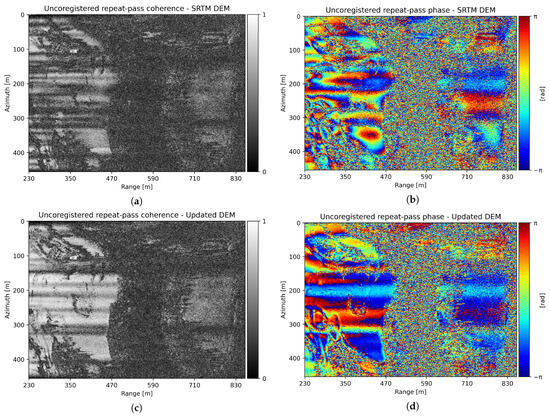
Figure 9.
(a) Uncoregistered repeat-pass coherence using the SRTM DEM. (b) Uncoregistered repeat-pass phase using the SRTM DEM. (c) Uncoregistered repeat-pass coherence using the updated DEM. (d) Uncoregistered repeat-pass phase using the updated DEM.
4.2. Coregistration and Repeat-Pass Interferometric Stack Generation Analysis
In this section, the benefits of both using the updated DEM obtained previously to minimize focusing errors, and applying the multisquint coregistration algorithm explained in Section 3.2, are presented. The objective is to obtain coherent repeat-pass interferograms free of phase artifacts, where only residual topography, atmospheric-related phase screens, and ground displacement contributions are present. For this purpose, the results obtained from coregistering two datasets, one using the SRTM DEM and the other using the updated DEM, are compared and discussed in detail throughout this section.
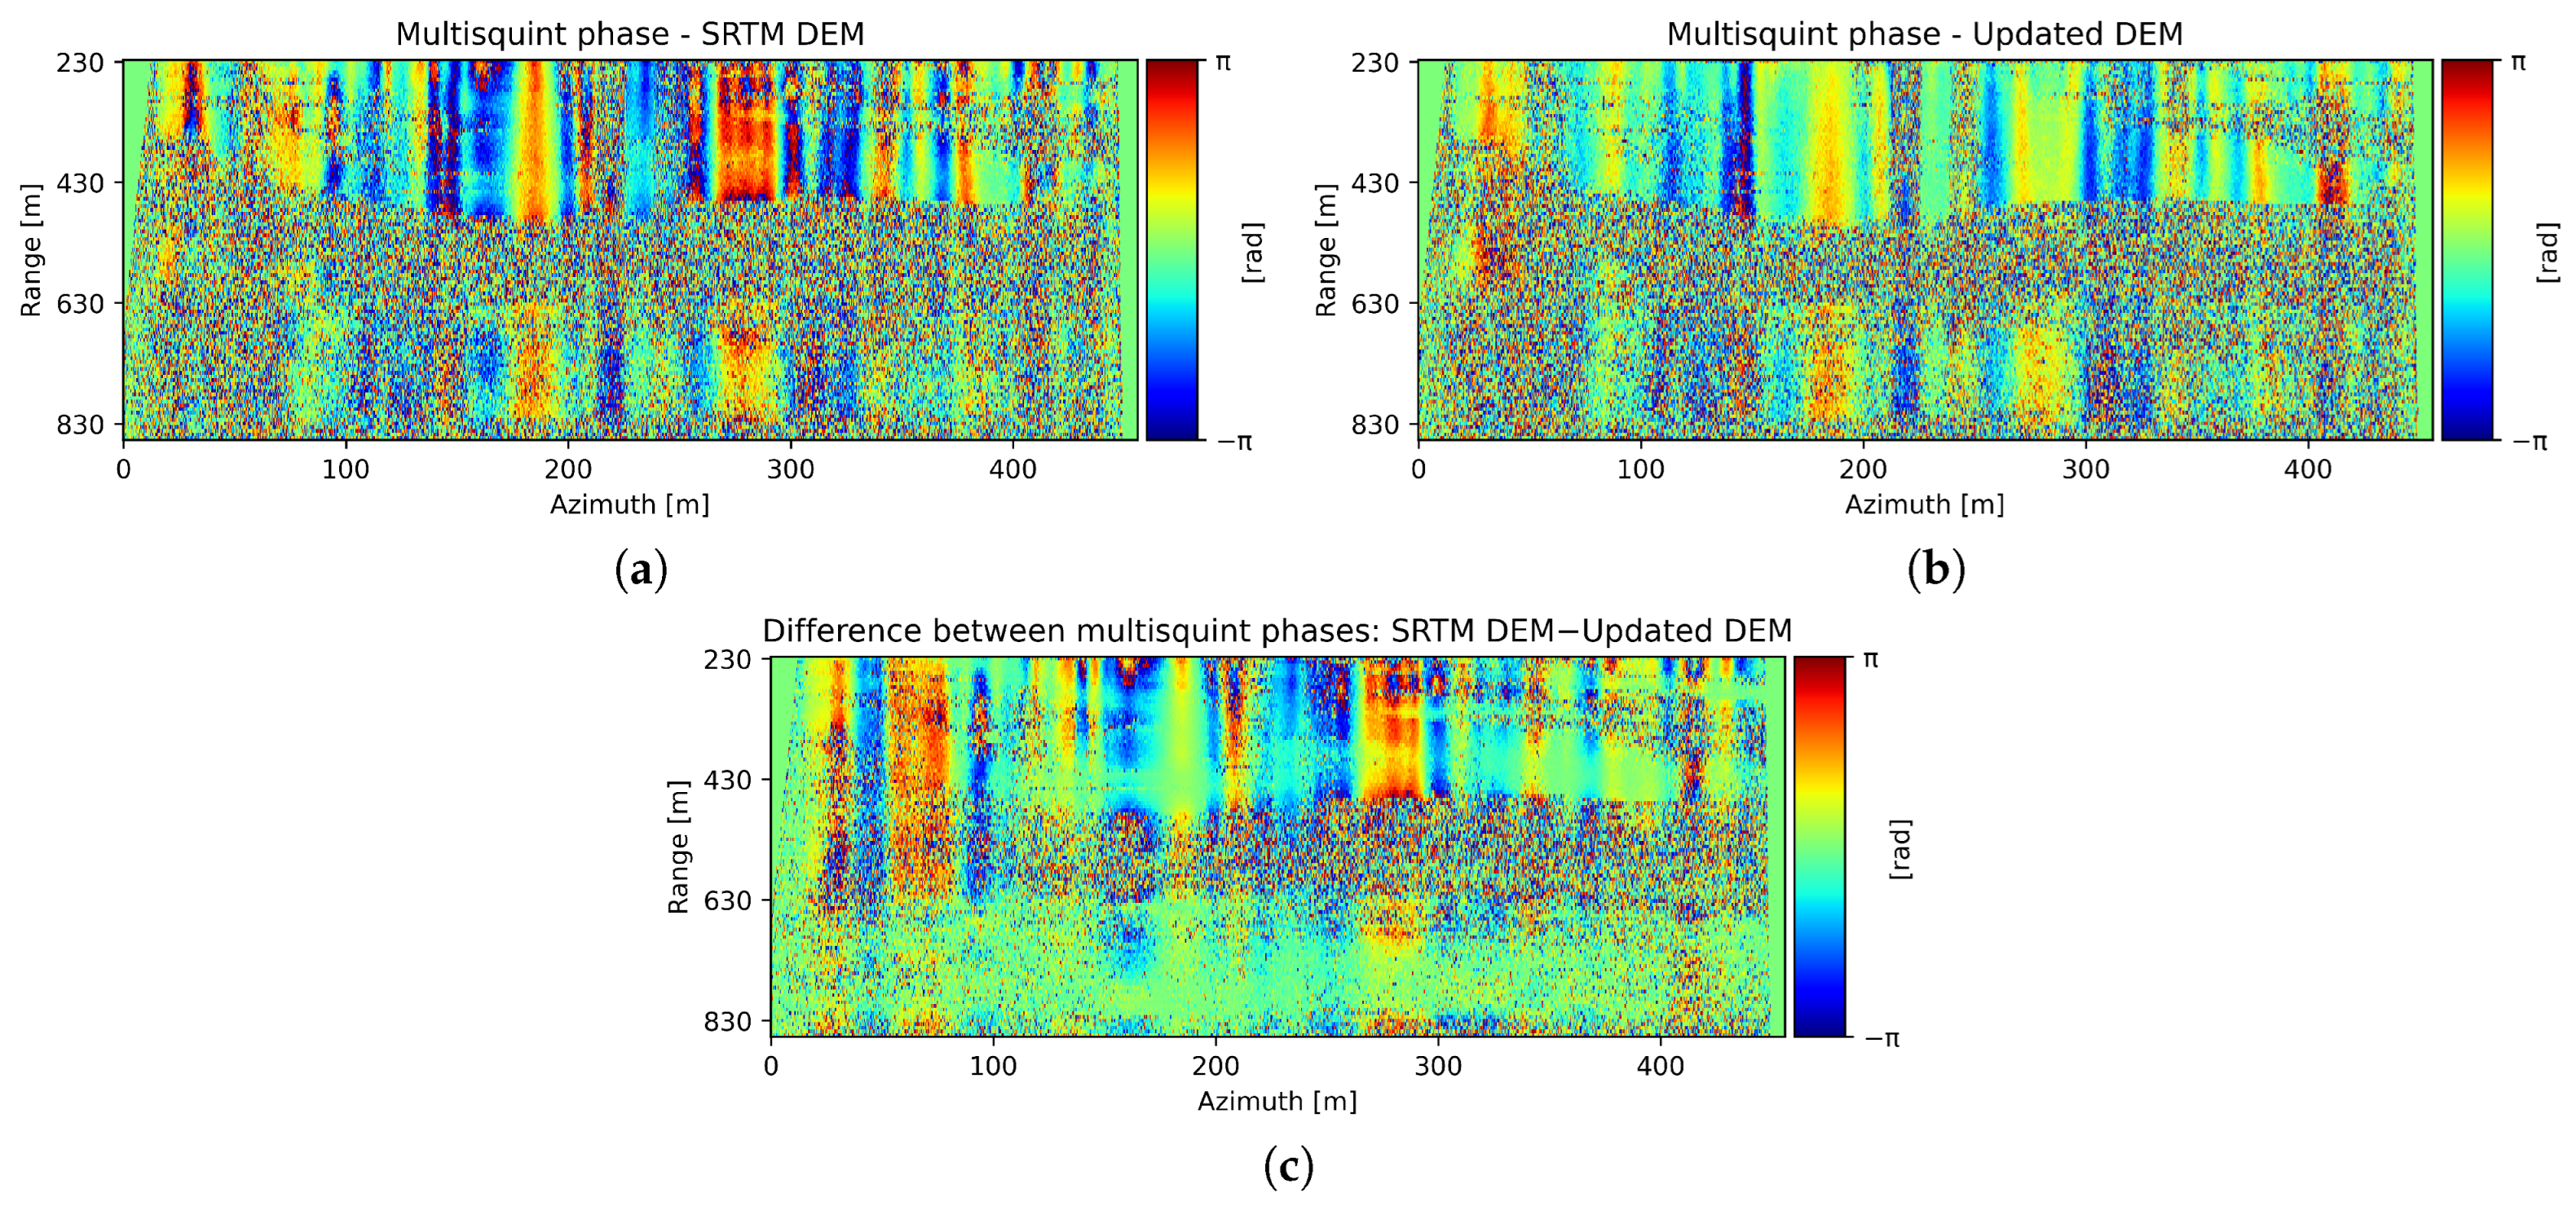
First, the impact of DEM errors in the multisquint coregistration algorithm and how they bias the retrieved RME and, therefore, the interferometric perpendicular baseline, are analyzed. Figure 10a,b show the obtained multisquint phases, i.e., the derivative of the RME between two acquisitions, using the SRTM DEM and the updated DEM for the same interferogram. A qualitative comparison of the two multisquint phases and their difference, depicted in Figure 10c, reveals large discrepancies. These differences translate into an erroneous component in the derivative of the RME for the SRTM DEM case, which is incorrectly estimated as a baseline correction, causing a bias in the corrected baseline of the coregistered acquisition pair.
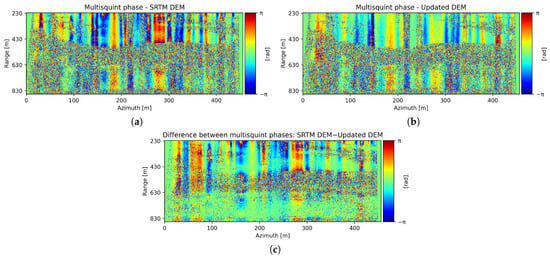
Figure 10.
(a) Multisquint phase using the SRTM DEM as the input DEM in the coregistration. (b) Multisquint phase using the updated DEM as the input DEM in the coregistration. (c) Difference between the SRTM DEM and the updated DEM multisquint phases.
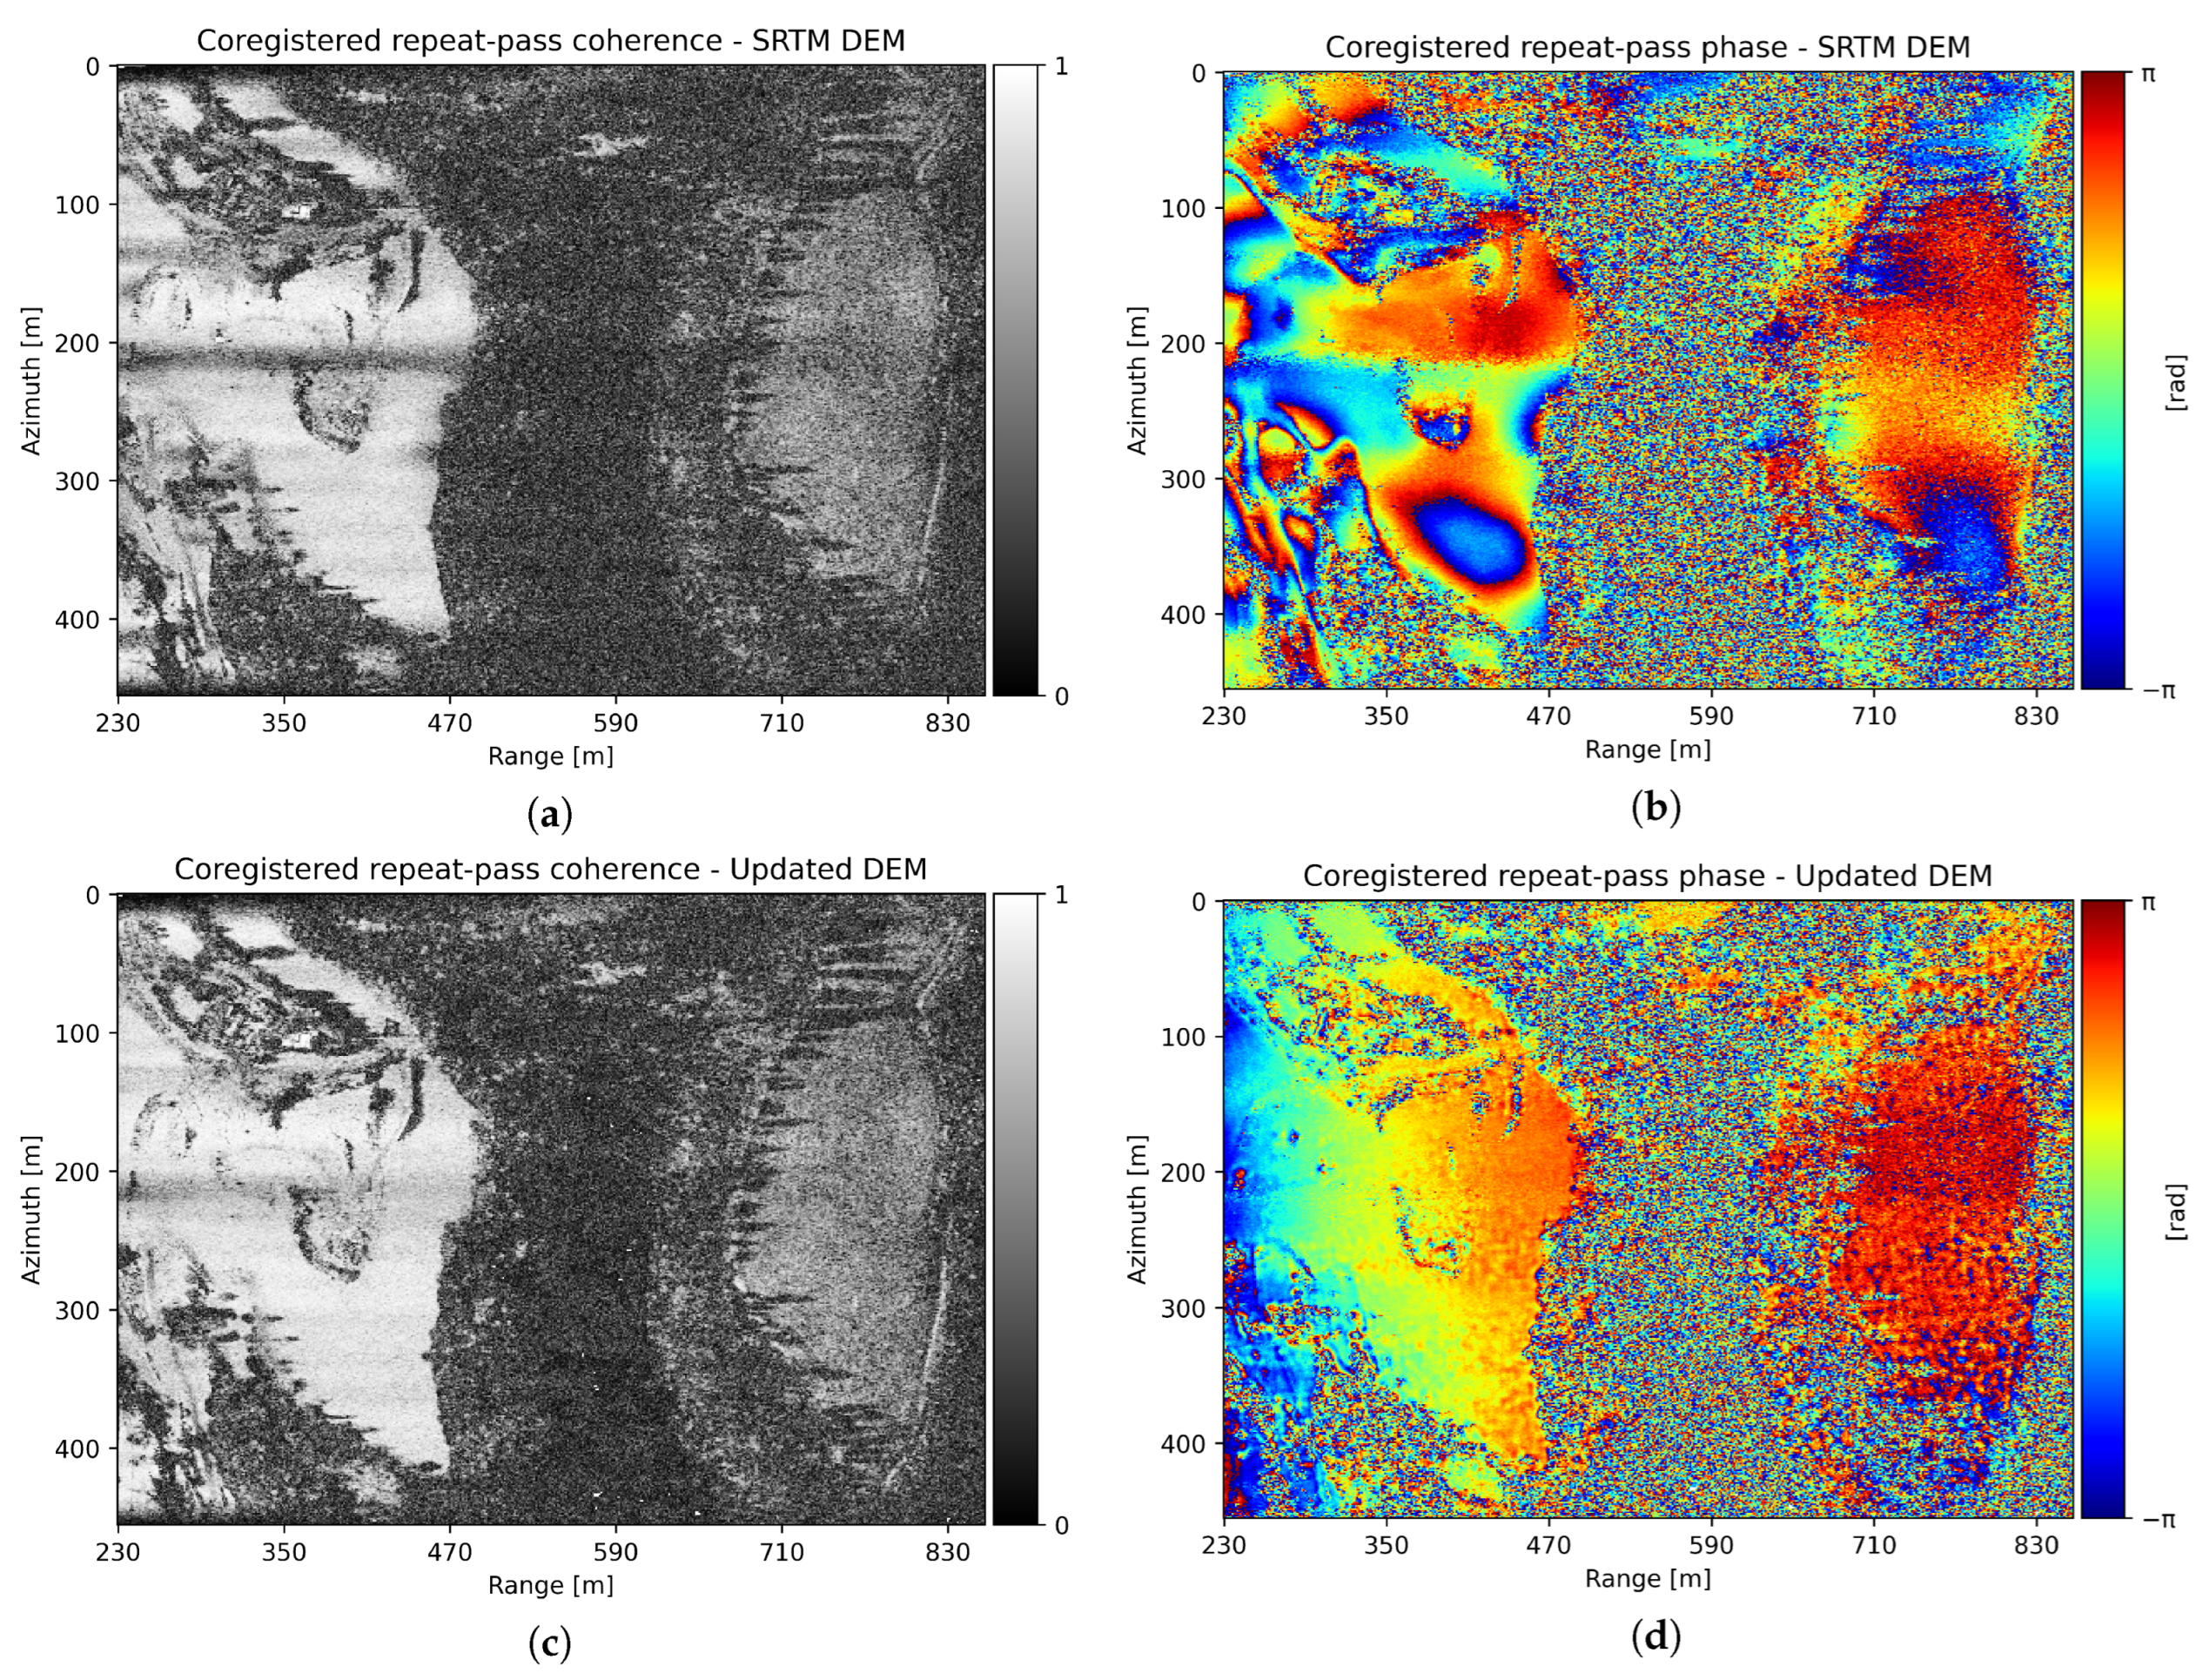
After retrieving the RME using the multisquint phases shown in Figure 10a,b, the linear and constant errors are estimated for each case. Then, the SLCs are refocused using the new antenna positions, and finally, the coregistered repeat-pass interferograms are computed. The coherences and phases of the coregistered interferograms obtained using the SRTM DEM and the updated DEM are depicted in Figure 11. The comparison of both interferograms reveals noticeable differences, showing better coregistration results in the interferogram generated using the updated DEM as follows:
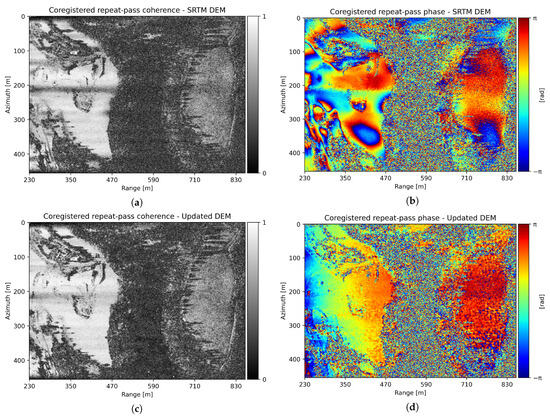
Figure 11.
(a) Coregistered repeat-pass coherence using the SRTM DEM. (b) Coregistered repeat-pass phase using the SRTM DEM. (c) Coregistered repeat-pass coherence using the updated DEM. (d) Coregistered repeat-pass phase using the updated DEM.
- The coherence of the SRTM DEM interferogram, shown in Figure 11a, exhibits a discontinuity in azimuth. In contrast, the same discontinuity is significantly minimized in the updated DEM interferometric coherence, illustrated in Figure 11c. The same effect is appreciated in the interferometric phases depicted in Figure 11b and Figure 11d, respectively.
The primary reason for the differences in coregistration quality between the two interferograms is the difference in coherence between the uncoregistered interferograms, leading to a noisier multisquint phase, which in turn results in RME estimates with a higher standard deviation.
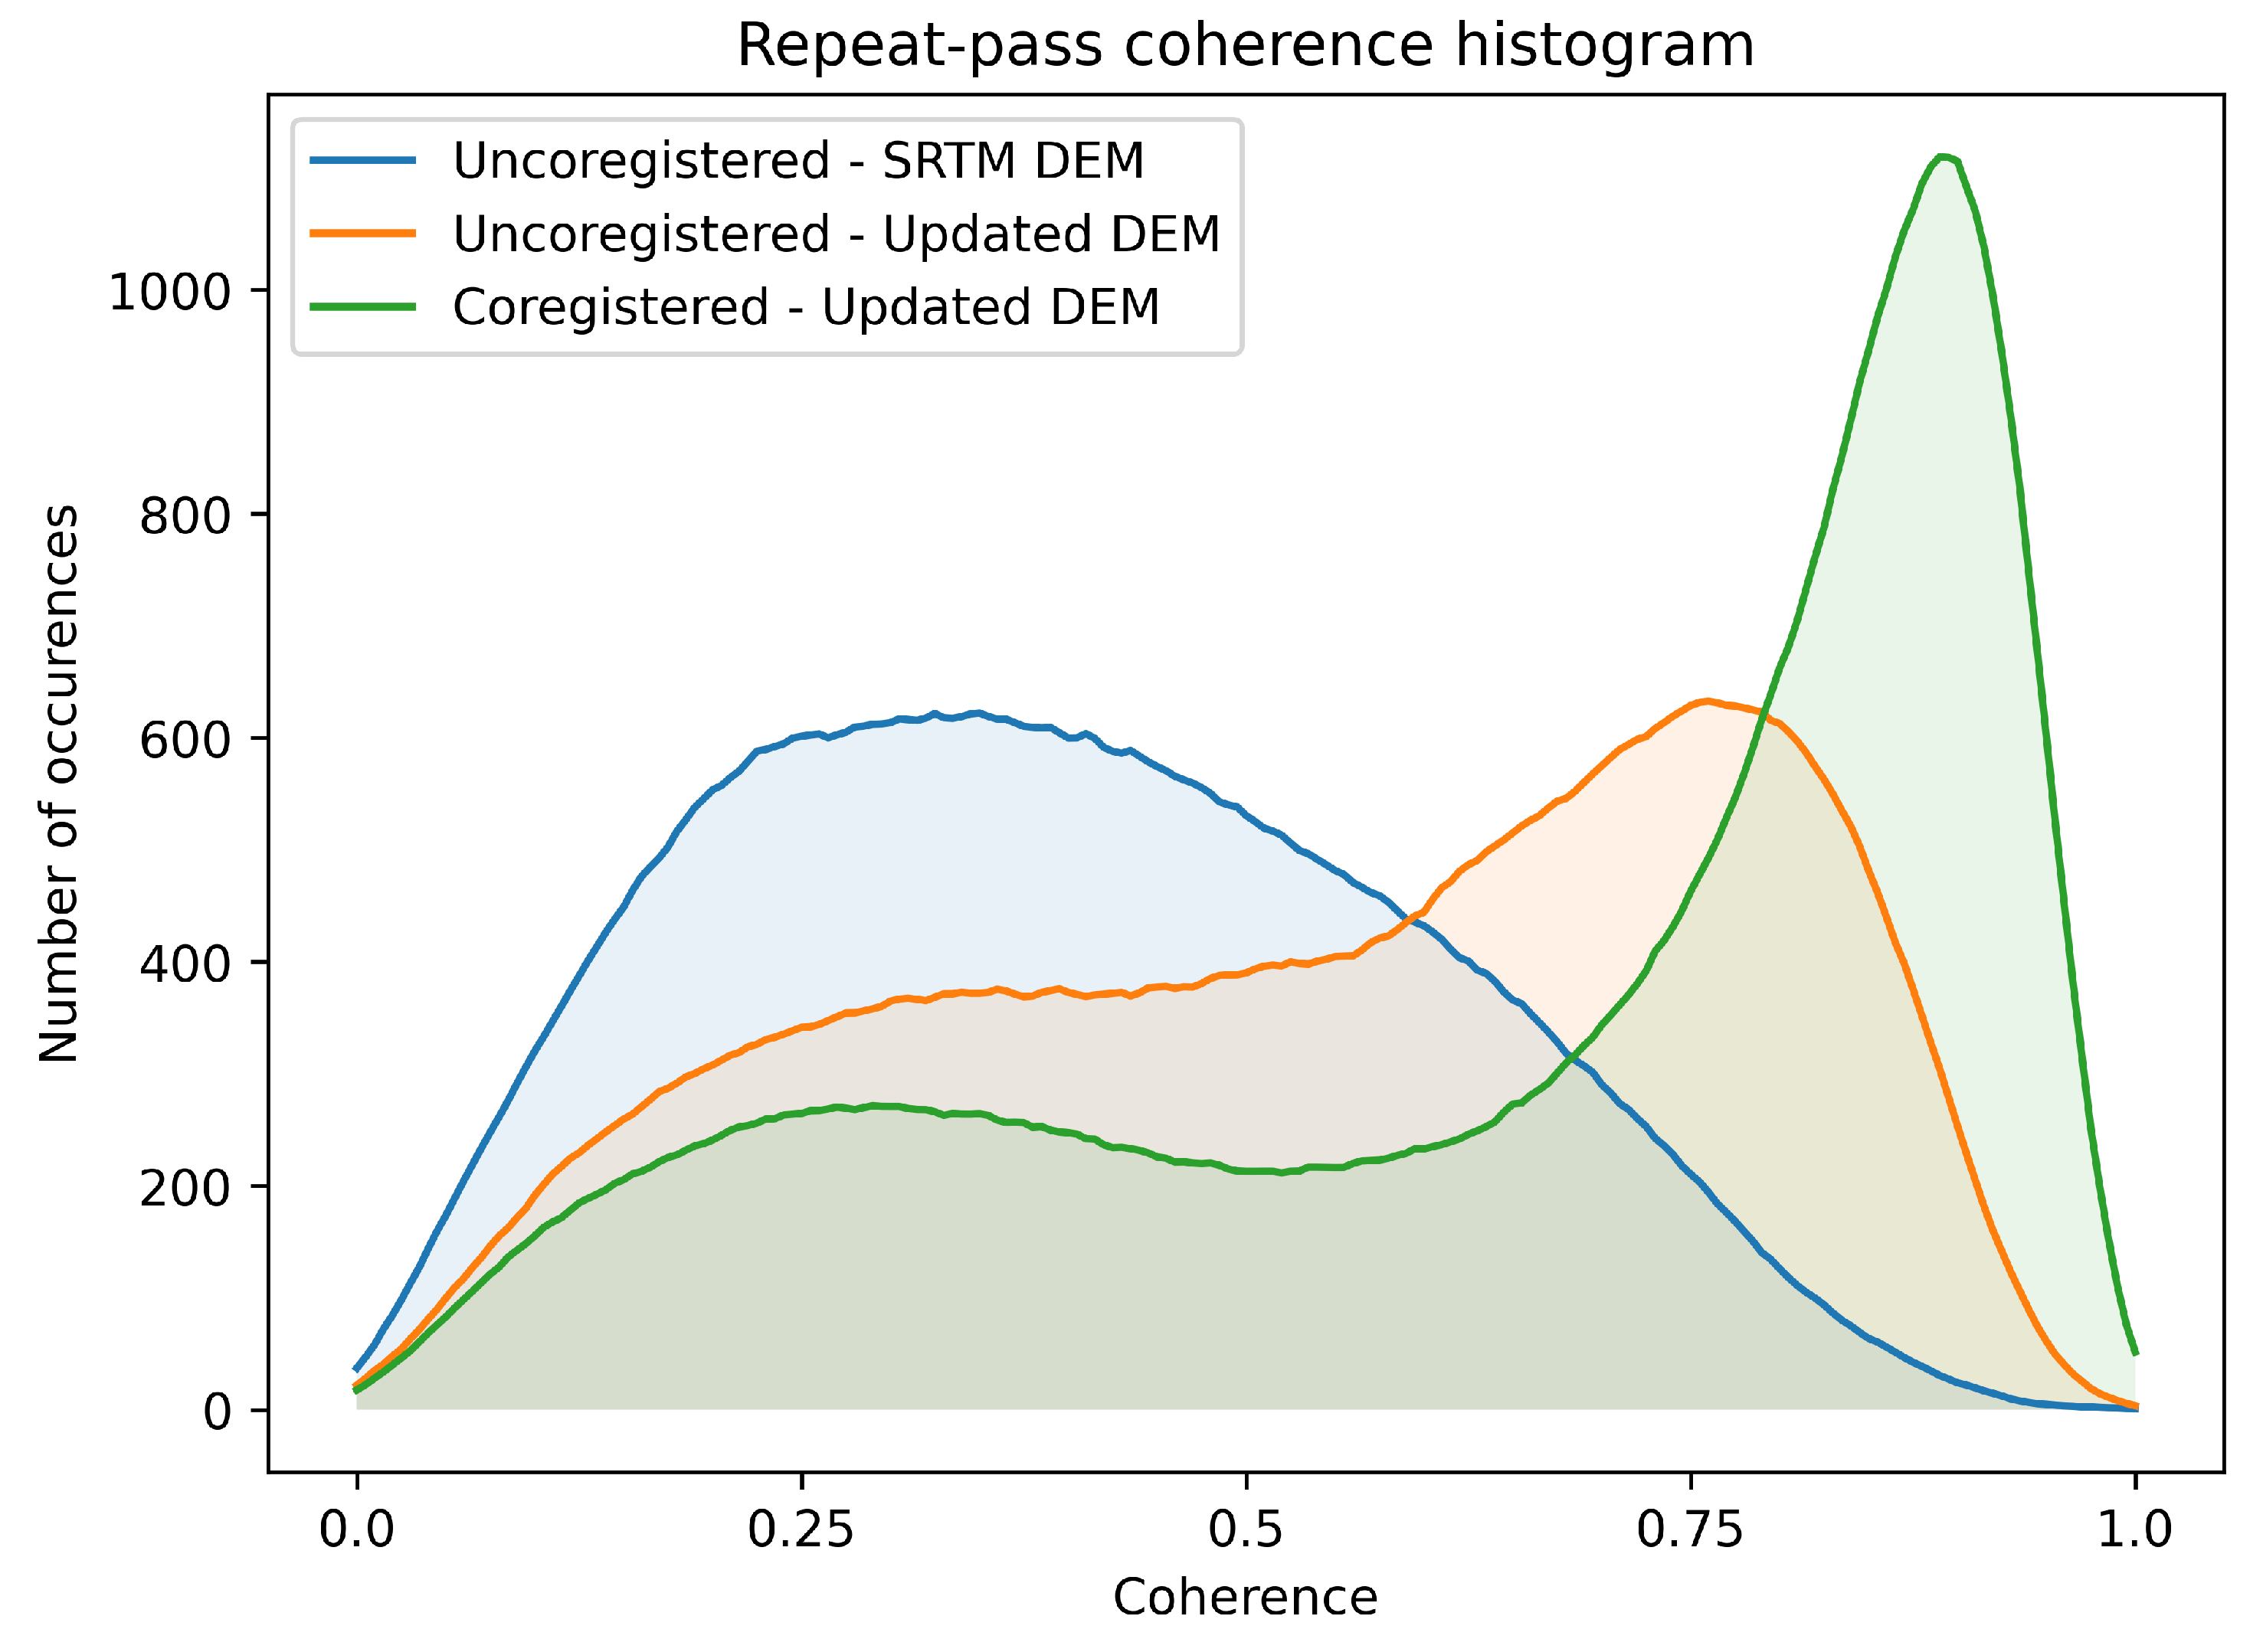
To continue with the analysis, an extended description of the repeat-pass results obtained using the proposed processing chain is provided. As observed in Figure 11c, areas affected by shadowing and a low SNR exhibit low coherence, similar to the single-pass case. Additionally, the entire pine forest shows no coherence since vegetated areas decorrelate within minutes at the Ku band [43]. The histogram of the coherence of the repeat-pass interferogram at the different stages of the processing chain is depicted in Figure 12. To better show the improvement in the coherence, vegetated areas and areas affected by shadowing have been masked out. The blue histogram, with a mean value of 0.40 and mode of 0.35, is the coherence of the uncoregistered interferogram using the SRTM DEM. The orange curve corresponds to the uncoregistered interferogram coherence after the DEM update and has a mean of 0.54 and mode of 0.76. Finally, the green histogram is the coherence of the coregistered interferogram using the updated DEM and the mean is 0.65 and the mode is 0.89, representing a significant improvement compared to the initial uncoregistered interferogram.
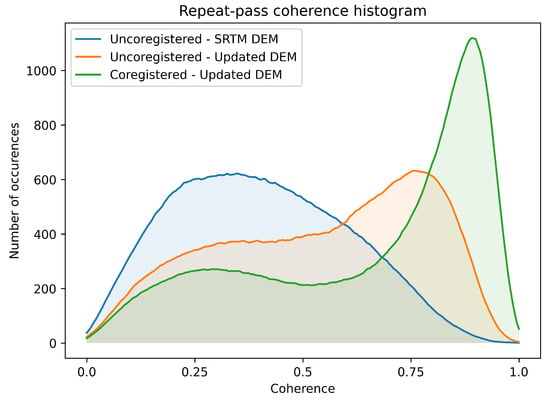
Figure 12.
Repeat-pass coherence histograms at different stages of the processing. The blue histogram corresponds to the repeat-pass coherence at the beginning of the processing chain, before the update of the SRTM DEM. The orange histogram is generated using the uncoregistered interferogram coherence after the DEM update. The green histogram corresponds to the coherence of the coregistered interferogram using the updated DEM.
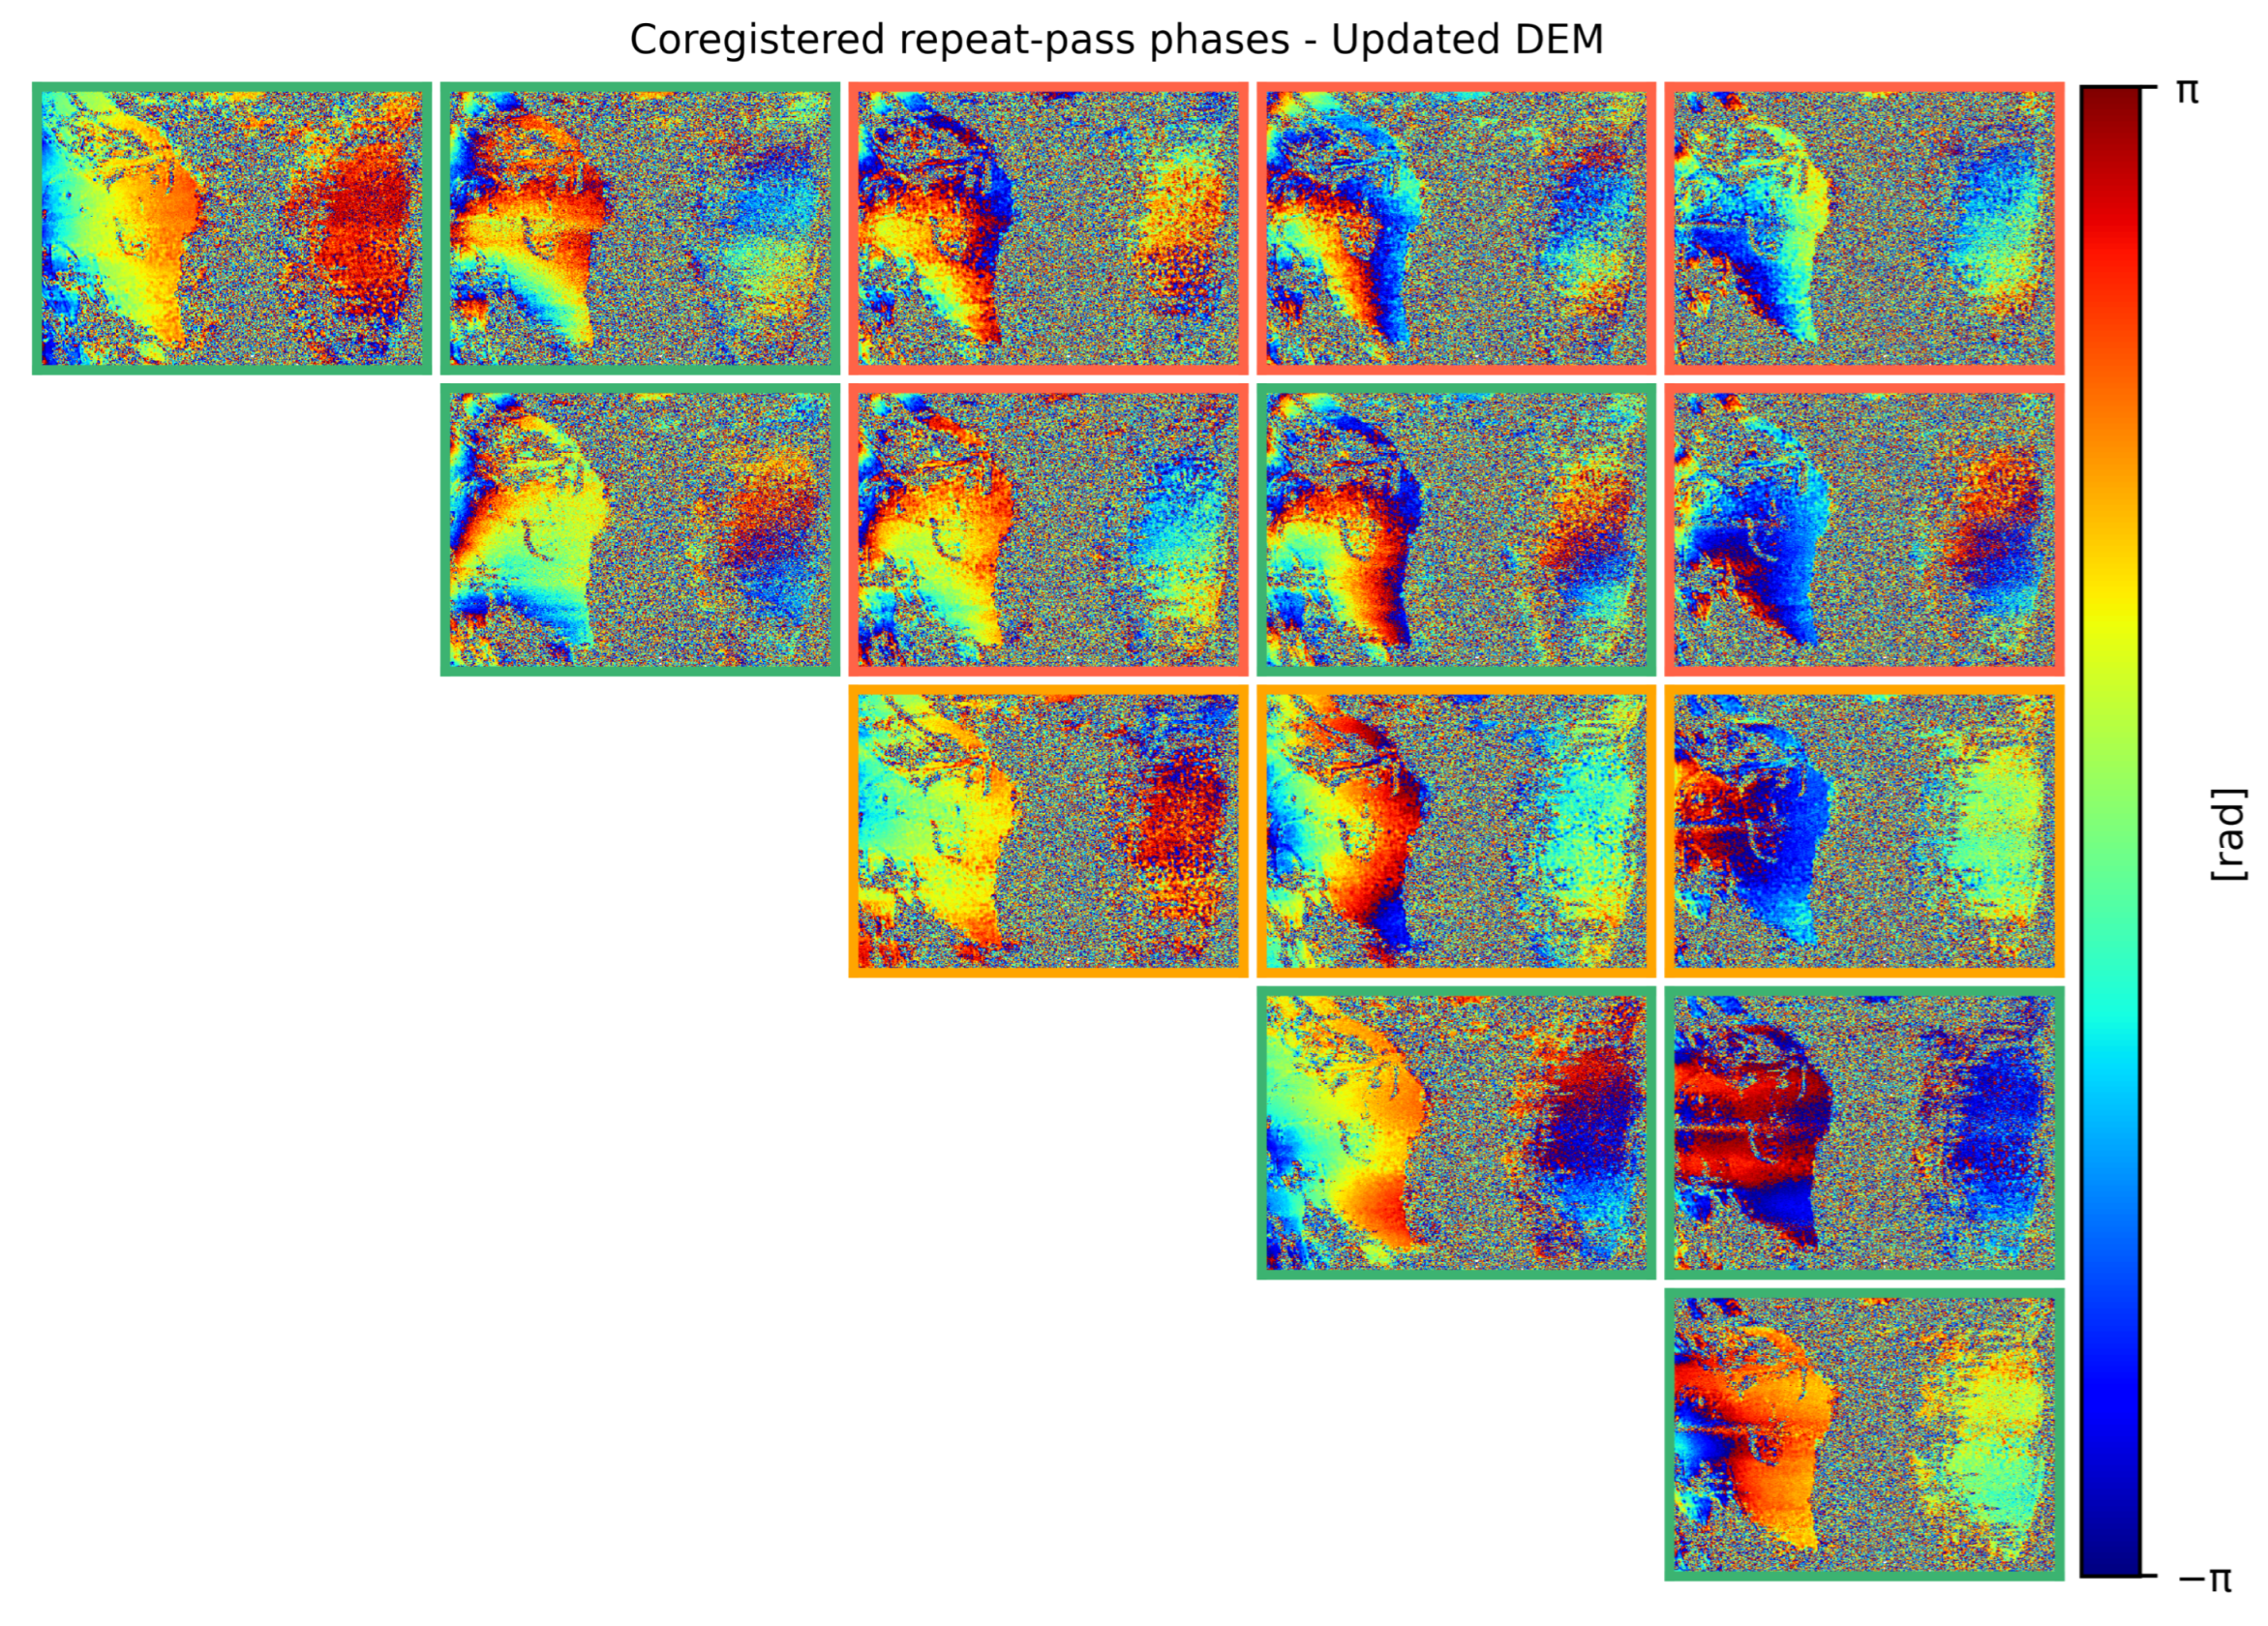
To demonstrate the effectiveness of the proposed processing chain, the phases of the coregistered interferograms for the entire stack of acquisitions are illustrated in Figure 13. Each interferogram’s frame is color-coded to indicate the corresponding median perpendicular baseline: green for baselines below 25 cm, orange for baselines between 25 cm and 50 cm, and red for baselines larger than 50 cm. The phases generally show a low-frequency fringe pattern related to uncompensated RME. No other significant phase contributions, such as ground displacement, APS, topography, or other processing artifacts, are present. The absence of ground displacement phase contributions is attributed to a short temporal baseline and low activity in the quarry, resulting in no displacement processes occurring in the area. Indeed, due to the short temporal baseline, there is no APS contribution, as atmospheric conditions remain constant during the entire duration of the flights. Furthermore, while phase contributions from the topography are expected in interferograms with higher height sensitivity than the single-pass case, these are greatly minimized as several single-pass interferograms are used to update the heights, effectively reducing the final standard deviation of the updated height maps. Therefore, a non-significant contribution from the topography is expected for most of the repeat-pass interferograms, even for perpendicular baselines significantly larger than the fixed single-pass cross-track baseline.
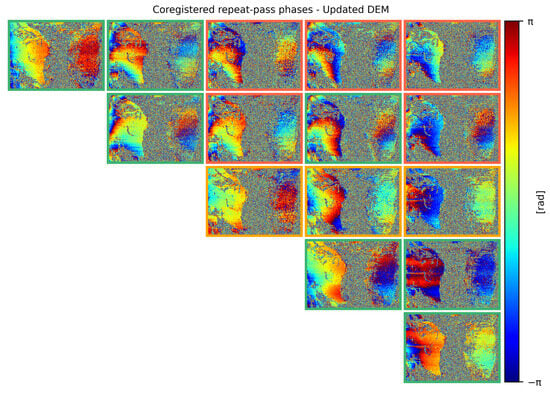
Figure 13.
Phases of the coregistered acquisitions of the entire dataset using the single-pass updated DEM. Each interferogram’s frame is color-coded based on its median perpendicular baseline. The green color indicates baselines below 25 cm, the orange between 25 cm and 50 cm, and the red larger than 50 cm.
To conclude this section, statistics of the relative error between the retrieved height sensitivities after RME estimation when coregistering using the SRTM DEM and the updated DEM are presented. First, the height sensitivity of each interferogram is calculated. Then, the relative error between sensitivities is computed, taking the updated DEM dataset as the reference. The obtained median and 90th percentile height sensitivity relative errors are presented in Table 2. The errors are classified for different ranges of perpendicular baselines. As expected, the bias has a larger impact on interferograms with shorter baselines since the error is comparable to the baseline. For instance, for baselines below 25 cm, the median height sensitivity relative error is 0.12, and the 90th percentile is 0.60.

Table 2.
Statistics of the relative error between the retrieved height sensitivities after Residual Motion Error (RME) estimation when coregistering using the SRTM DEM and the updated DEM.
These results demonstrate the effectiveness of the proposed interferometric processing chain which takes advantage of the single-pass interferometric capabilities of the SAR-Drone system. As shown in this section, the processing provides two key benefits: it maximizes the coregistration quality, allowing for the generation of artifact-free interferograms, and minimizes the baseline bias induced by the multisquint algorithm.
5. Discussion
This paper has presented the Ku-band SAR-Drone system and its associated interferometric processing chain, demonstrating, for the first time to the best of the authors’ knowledge, the feasibility of performing repeat-pass interferometry using a Ku-band SAR sensor mounted on a drone platform.
First, the SAR-Drone, an SAR instrument comprising a Ku-band dual-channel radar, antennas, and a navigation system, all integrated into a hexacopter drone, has been described. The instrument has been specifically designed to be mounted in a drone taking into account platform limitations such as low payload weight and autonomy, restricted flying height above the ground, and non-linear motion. As a consequence, the antenna pattern has been optimized to maximize the swath and to compensate the typical Doppler variations due to the drone’s motion. Additionally, the system takes advantage of the shorter baseline required to achieve height ambiguities to the order of tens of meters, compared to lower frequency SAR systems, thus incorporating a cross-track baseline. As has been discussed, the cross-track baseline is exploited in the data processing to update the input DEM to minimize the processing errors caused by the coupling of non-linear motion, DEM errors, and position uncertainties, which are more significant at the Ku band. The system’s flight performance has also been characterized, showing that the typical repeat-pass baseline remains below the critical baseline, thereby validating the viability of repeat-pass interferometry.
An interferometric processing chain aimed at generating a stack of repeat-pass interferograms from the measurements acquired by the Ku-band SAR-Drone system has been proposed. It begins by updating the heights of the input DEM, where an extension of the phase offset estimation method described in [45] has been introduced. The proposed approach exploits the entire stack of single-pass interferograms, utilizing the fact that the height bias is common across all acquisitions. The height estimation is followed by the coregistration, where the multisquint algorithm and the estimation of linear and constant baseline errors described in [2] and previously applied in airborne SAR systems have been proposed to coregister drone-based SAR data. It has been also evaluated how the bias in the retrieval of RME caused by unknown topography is minimized by the proposed strategy.
An assessment of the SAR-Drone and its processing chain for successfully coregistering a set of SLCs to obtain a multi-temporal stack of coherent interferograms has been conducted by deploying the system in a real scenario and processing the acquired dataset. The results show a substantial increase in repeat-pass coherence after updating the DEM, with its mode increasing from 0.35 to 0.76. Moreover, the effectiveness of the coregistration has been validated, as the coherence mode further increased from 0.76 to 0.89 after coregistration. Additionally, the phases of all repeat-pass interferograms have shown no major residual motion errors. The results further confirm that the baseline, and thus the height sensitivity, can be biased by up to 60% in small baseline interferograms if the heights are not updated prior to coregistration. These findings demonstrate that the coregistration process significantly benefits from the single-pass interferometric configuration of the SAR-Drone, which allows for the accurate estimation of topography, yielding superior results in terms of repeat-pass interferogram quality and reduced interferometric baseline bias compared to using an outdated DEM.
The system and the processing chain described have demonstrated their capability to generate high-quality repeat-pass interferograms at the Ku band, opening up new possibilities for exploiting a wide range of repeat-pass applications in the future as follows:
- First, the quality of the high-resolution coregistered SLCs and the repeat-pass coherences demonstrate that change detection applications are feasible. For instance, the system could be deployed in scenarios requiring rapid response such as during natural disasters. Although the system’s operation is limited in poor weather conditions and over large areas, especially compared to space-borne SAR sensors, the drone’s ability to fly on demand is particularly valuable when rapid and frequent updates are needed in the affected areas.
- Furthermore, the presented data exhibit the potential for generating high-resolution and high-quality DEMs using repeat-pass interferograms with high height sensitivity and short temporal baselines, achieving standard deviations on the order of decimeters. In this context, the system can take advantage of acquiring data from different points of view to minimize the areas with no data or high standard deviation estimates due to radar geometric distortions and a low SNR, thereby improving the overall coverage and quality of the DEM.
- Finally, the overall coregistration quality, resulting in highly coherent repeat-pass interferograms, enables the effective estimation of ground displacement. The SAR-Drone, operating at the Ku band and capable of flying as often as needed, provides the ability to detect and monitor ground displacement processes within just a few hours, whereas lower frequency SAR systems may take days due to decreased sensitivity to displacement. However, the monitoring of vegetated areas remains limited at the Ku band due to decorrelation. Moreover, while the system offers rapid response capabilities, it cannot match the real-time performance of GBSAR systems, primarily due to the time required for data processing. Despite these limitations, the SAR-Drone addresses a critical challenge faced by space-borne SAR and GBSAR systems by allowing ground displacement to be estimated from multiple points of view. This capability potentially enables the retrieval of the full 3D displacement vector, rather than just its projection onto the LOS of the SAR sensor.
Future work will explore the aforementioned applications and limitations, which will help to fully leverage the capabilities of the Ku-band SAR-Drone system presented in this paper. In particular, the impact of the short wavelength, while beneficial for achieving better sensitivity to displacement, makes the system more prone to decorrelation in regions with dense vegetation or significant temporal variability. Additionally, the system’s limited flight autonomy and sensitivity to weather conditions restrict its applicability in large-scale environments when compared to space-borne or airborne SAR systems.
Author Contributions
Conceptualization, G.R.-C., M.L.C., R.I. and J.D.; methodology, G.R.-C., M.L.C., L.Y. and G.M.; instrument design and validation, G.R.-C., M.L.C., A.H., Á.G. and A.G.-Z.; algorithm development, G.R.-C., L.Y., G.M., E.M. and R.I.; validation, G.R.-C., L.Y., G.M., D.M., G.C. and A.F.; formal analysis, G.R.-C., L.Y. and G.M.; data collection, G.R.-C. and M.L.C. All authors reviewed and improved the manuscript. All authors have read and agreed to the published version of the manuscript.
Funding
This research was partially funded by the European Commission via the Executive Agency for Small and Medium-sized Enterprises (EASMEs) through grant H2020SMEPh2-830344.
Institutional Review Board Statement
Not applicable.
Informed Consent Statement
Not applicable.
Data Availability Statement
The datasets presented in this article are not readily available because they are owned by Dares Technology and are not publicly accessible.
Acknowledgments
The authors wish to thank the technical teams for their support.
Conflicts of Interest
All authors are employed by Dares Technology.
Abbreviations
The following abbreviations are used in this manuscript:
| AOI | Area Of Interest |
| APS | Atmospheric Phase Screen |
| CR | Corner Reflector |
| DDS | Direct Digital Synthesis |
| DEM | Digital Elevation Model |
| FMCW | Frequency Modulated Continuous Wave |
| FPGA | Field-Programmable Gate Array |
| GBSAR | Ground-based Synthetic Aperture Radar |
| GNSS | Global Navigation Satellite System |
| INS | Inertial Navigation System |
| InSAR | Interferometric Synthetic Aperture Radar |
| LOS | Line of Sight |
| PCB | Printed Circuit Board |
| PRF | Pulse Repetition Frequency |
| RF | Radio Frequency |
| RME | Residual Motion Error |
| SAR | Synthetic Aperture Radar |
| SLC | Single-Look Complex |
| SNR | Signal to Noise Ratio |
| SRTM | Shuttle Radar Topography Mission |
| SSD | Solid State Drive |
| TCE | True Coregistration Error |
| TDBP | Time-Domain Backprojection |
References
- Moreira, A.; Prats-Iraola, P.; Younis, M.; Krieger, G.; Hajnsek, I.; Papathanassiou, K.P. A tutorial on synthetic aperture radar. IEEE Geosci. Remote Sens. Mag. 2013, 1, 6–43. [Google Scholar] [CrossRef]
- Reigber, A.; Prats, P.; Mallorqui, J.J. Refined estimation of time-varying baseline errors in airborne SAR interferometry. IEEE Geosci. Remote Sens. Lett. 2006, 3, 145–149. [Google Scholar] [CrossRef]
- de Macedo, K.A.C.; Scheiber, R.; Moreira, A. An Autofocus Approach for Residual Motion Errors with Application to Airborne Repeat-Pass SAR Interferometry. IEEE Trans. Geosci. Remote Sens. 2008, 46, 3151–3162. [Google Scholar] [CrossRef]
- Perna, S.; Wimmer, C.; Moreira, J.; Fornaro, G. X-Band Airborne Differential Interferometry: Results of the OrbiSAR Campaign Over the Perugia Area. IEEE Trans. Geosci. Remote Sens. 2008, 46, 489–503. [Google Scholar] [CrossRef]
- Tebaldini, S.; Rocca, F.; d’Alessandro, M.M.; Ferro-Famil, L. Phase Calibration of Airborne Tomographic SAR Data via Phase Center Double Localization. IEEE Trans. Geosci. Remote Sens. 2016, 54, 1775–1792. [Google Scholar] [CrossRef]
- Pinheiro, M.; Reigber, A.; Scheiber, R.; Prats-Iraola, P.; Moreira, A. Generation of Highly Accurate DEMs Over Flat Areas by Means of Dual-Frequency and Dual-Baseline Airborne SAR Interferometry. IEEE Trans. Geosci. Remote Sens. 2018, 56, 4361–4390. [Google Scholar] [CrossRef]
- Prats, P.; Reigber, A.; Mallorqui, J.; Blanco, P.; Moreira, A. Estimation of the Deformation Temporal Evolution Using Airborne Differential SAR Interferometry. In Proceedings of the 2006 IEEE International Symposium on Geoscience and Remote Sensing, Denver, CO, USA, 31 July–4 August 2006; pp. 1894–1897. [Google Scholar] [CrossRef]
- Prats, P.; Reigber, A.; Mallorqui, J.J.; Scheiber, R.; Moreira, A. Estimation of the Temporal Evolution of the Deformation Using Airborne Differential SAR Interferometry. IEEE Trans. Geosci. Remote Sens. 2008, 46, 1065–1078. [Google Scholar] [CrossRef]
- Delbridge, B.; Bürgmann, R.; Fielding, E.; Hensley, S. Kinematics of the slumgullion landslide from UAVSAR derived interferograms. In Proceedings of the 2015 IEEE International Geoscience and Remote Sensing Symposium (IGARSS), Milan, Italy, 26–31 July 2015; pp. 3842–3845. [Google Scholar] [CrossRef]
- Hensley, S.; Chapman, B.; Lavalle, M.; Hawkins, B.; Riel, B.; Michel, T.; Muellerschoen, R.; Lou, Y.; Simard, M. Uavsar L-Band and P-Band Tomographic Experiments in Boreal Forests. In Proceedings of the IGARSS 2018—2018 IEEE International Geoscience and Remote Sensing Symposium, Valencia, Spain, 22–27 July 2018; pp. 8679–8682. [Google Scholar] [CrossRef]
- Tebaldini, S.; d’Alessandro, M.M.; Ulander, L.M.; Bennet, P.; Gustavsson, A.; Coccia, A.; Macedo, K.; Disney, M.; Wilkes, P.; Spors, H.J.; et al. TomoSense: A unique 3D dataset over temperate forest combining multi-frequency mono- and bi-static tomographic SAR with terrestrial, UAV and airborne lidar, and in-situ forest census. Remote Sens. Environ. 2023, 290, 113532. [Google Scholar] [CrossRef]
- Rudolf, H.; Leva, D.; Tarchi, D.; Sieber, A. A mobile and versatile SAR system. In Proceedings of the IEEE 1999 International Geoscience and Remote Sensing Symposium. IGARSS’99 (Cat. No.99CH36293), Hamburg, Germany, 28 June–2 July 1999; Volume 1, pp. 592–594. [Google Scholar] [CrossRef]
- Leva, D.; Nico, G.; Tarchi, D.; Fortuny, J.; Sieber, A. Temporal analysis of a landslide by means of a ground-based SAR Interferometer. IEEE Trans. Geosci. Remote Sens. 2003, 41, 745–752. [Google Scholar] [CrossRef]
- Luzi, G.; Pieraccini, M.; Mecatti, D.; Noferini, L.; Guidi, G.; Moia, F.; Atzeni, C. Ground-based radar interferometry for landslides monitoring: Atmospheric and instrumental decorrelation sources on experimental data. IEEE Trans. Geosci. Remote Sens. 2004, 42, 2454–2466. [Google Scholar] [CrossRef]
- Rödelsperger, S.; Coccia, A.; Vicente, D.; Meta, A. Introduction to the new metasensing ground-based SAR: Technical description and data analysis. In Proceedings of the 2012 IEEE International Geoscience and Remote Sensing Symposium, IGARSS 2012, Munich, Germany, 22–27 July 2012; pp. 4790–4792. [Google Scholar] [CrossRef]
- Aguasca, A.; Broquetas, A.; Mallorqui, J.J.; Fabregas, X. A solid state L to X-band flexible ground-based SAR system for continuous monitoring applications. In Proceedings of the IGARSS 2004. 2004 IEEE International Geoscience and Remote Sensing Symposium, Anchorage, AK, USA, 20–24 September 2004; Volume 2, pp. 757–760. [Google Scholar] [CrossRef]
- Iglésias, R.; Aguasca, A.; Fàbregas, X.; Mallorquí, J.J.; Monells, D.; López-Martínez, C.; Pipia, L. Ground-Based Polarimetric SAR Interferometry for the Monitoring of Terrain Displacement Phenomena-Part I: Theoretical Description. IEEE J. Sel. Top. Appl. Earth Obs. Remote. Sens. 2015, 8, 980–993. [Google Scholar] [CrossRef]
- Iglésias, R.; Aguasca, A.; Fàbregas, X.; Mallorquí, J.J.; Monells, D.; López-Martínez, C.; Pipia, L. Ground-Based Polarimetric SAR Interferometry for the Monitoring of Terrain Displacement Phenomena-Part II: Applications. IEEE J. Sel. Top. Appl. Earth Obs. Remote. Sens. 2015, 8, 994–1007. [Google Scholar] [CrossRef]
- Frey, O.; Werner, C.L.; Coscione, R. Car-borne and UAV-borne mobile mapping of surface displacements with a compact repeat-pass interferometric SAR system at L-band. In Proceedings of the IGARSS 2019—2019 IEEE International Geoscience and Remote Sensing Symposium, Yokohama, Japan, 28 July–2 August 2019; pp. 274–277. [Google Scholar] [CrossRef]
- Luebeck, D.; Wimmer, C.; Moreira, L.F.; Alcântara, M.; Oré, G.; Góes, J.A.; Oliveira, L.P.; Teruel, B.; Bins, L.S.; Gabrielli, L.H.; et al. Drone-borne Differential SAR Interferometry. Remote Sens. 2020, 12, 778. [Google Scholar] [CrossRef]
- Lort, M.; Aguasca, A.; Lopez-Martinez, C.; Marín, T.M. Initial evaluation of SAR capabilities in UAV multicopter platforms. IEEE J. Sel. Top. Appl. Earth Obs. Remote Sens. 2017, 11, 127–140. [Google Scholar] [CrossRef]
- Mustieles Pérez, V.; Kanz, J.; Bonfert, C.; Grathwohl, A.; Lamberti, L.L.; Kim, S.; Krieger, G.; Villano, M. Experimental Demonstration of UAV-Based Ultra-Wideband Multi-Baseline SAR Interferometry. In Proceedings of the European Conference on Synthetic Aperture Radar, EUSAR, Munich, Germany, 26 April 2024; pp. 1156–1161. [Google Scholar]
- Bekar, A.; Bekar, M.; Baker, C.J.; Antoniou, M. Coherent Change Detection for High-Resolution Drone-Borne SAR at 24 GHz. IEEE J. Sel. Top. Appl. Earth Obs. Remote Sens. 2024, 17, 84–94. [Google Scholar] [CrossRef]
- Moreira, L.; Lübeck, D.; Wimmer, C.; Castro, F.; Góes, J.A.; Castro, V.; Alcântara, M.; Oré, G.; Oliveira, L.P.; Bins, L.; et al. Drone-Borne P-band Single-Pass InSAR. In Proceedings of the 2020 IEEE Radar Conference (RadarConf20), Florence, Italy, 21–25 September 2020; pp. 1–6. [Google Scholar] [CrossRef]
- Yan, J.; Guo, J.; Lu, Q.; Wang, K.; Liu, X. X-band mini SAR radar on eight-rotor mini-UAV. In Proceedings of the 2016 IEEE International Geoscience and Remote Sensing Symposium (IGARSS), Beijing, China, 10–15 July 2016; pp. 6702–6705. [Google Scholar] [CrossRef]
- Baqué, R.; Castet, N.; Nouvel, J.F.; Duteil, G.; Henrion, J.; Boisot, O.; de Milly, X. ONERA SAR-Light UAV Platform Latest Developments and SAR Results. In Proceedings of the 2023 20th European Radar Conference (EuRAD), Berlin, Germany, 20–22 September 2023. [Google Scholar] [CrossRef]
- Jankiraman, M. FMCW Radar Design; Artech House Radar Library, Artech House: Norwood, MA, USA, 2018. [Google Scholar]
- Hensley, S.; Wheeler, K.; Sadowy, G.; Jones, C.; Shaffer, S.; Zebker, H.; Miller, T.; Heavey, B.; Chuang, E.; Chao, R.; et al. The UAVSAR instrument: Description and first results. In Proceedings of the 2008 IEEE Radar Conference, Rome, Italy, 26–30 May 2008; pp. 1–6. [Google Scholar] [CrossRef]
- Horn, R.; Jaeger, M.; Keller, M.; Limbach, M.; Nottensteiner, A.; Pardini, M.; Reigber, A.; Scheiber, R. F-SAR—Recent upgrades and campaign activities. In Proceedings of the 2017 18th International Radar Symposium (IRS), Prague, Czech Republic, 28–30 June 2017; pp. 1–10. [Google Scholar] [CrossRef]
- Dubois-Fernandez, P.; du Plessis, O.; le Coz, D.; Dupas, J.; Vaizan, B.; Dupuis, X.; Cantalloube, H.; Coulombeix, C.; Titin-Schnaider, C.; Dreuillet, P.; et al. The ONERA RAMSES SAR system. In Proceedings of the IEEE International Geoscience and Remote Sensing Symposium, Toronto, ON, Canada, 24–28 June 2002; Volume 3, pp. 1723–1725. [Google Scholar] [CrossRef]
- Gatelli, F.; Guamieri, A.; Parizzi, F.; Pasquali, P.; Prati, C.; Rocca, F. The Wavenumber Shift in SAR Interferometry. IEEE Trans. Geosci. Remote Sens. 1994, 29, 855–865. [Google Scholar] [CrossRef]
- Rodriguez, E.; Martin, J.M. Theory and design of interferometric synthetic aperture radars. IEEE Proc. F (Radar Signal Process.) 1992, 139, 147. [Google Scholar] [CrossRef]
- Zebker, H.A.; Villasenor, J. Decorrelation in interferometric radar echoes. IEEE Trans. Geosci. Remote Sens. 1992, 30, 950–959. [Google Scholar] [CrossRef]
- Duersch, M.I.; Long, D.G. Analysis of time-domain back-projection for stripmap SAR. Int. J. Remote Sens. 2015, 36, 2010–2036. [Google Scholar] [CrossRef]
- Chapin, E.; Chau, A.; Chen, J.; Heavey, B.; Hensley, S.; Lou, Y.; Machuzak, R.; Moghaddam, M. AirMOSS: An Airborne P-band SAR to measure root-zone soil moisture. In Proceedings of the 2012 IEEE Radar Conference, Atlanta, GA, USA, 7–11 May 2012; pp. 0693–0698. [Google Scholar] [CrossRef]
- Reigber, A.; Jager, M.; Fischer, J.; Horn, R.; Scheiber, R.; Prats, P.; Nottensteiner, A. System status and calibration of the F-SAR airborne SAR instrument. In Proceedings of the 2011 IEEE International Geoscience and Remote Sensing Symposium, Vancouver, BC, Canada, 24–29 July 2011. [Google Scholar] [CrossRef]
- de Macedo, K.A.C.; Wimmer, C.; Barbin, S.E.; Perna, S. Airborne D-InSAR at X-band: Results with the complete repeat-pass processing methodology. In Proceedings of the 2009 IEEE International Geoscience and Remote Sensing Symposium, Cape Town, South Africa, 12–17 July 2009; Volume 4, pp. IV-861–IV-864. [Google Scholar] [CrossRef]
- de Macedo, K.A.C.; Scheiber, R.; Moreira, A. An autofocus approach for residual motion errors with application to airborne repeat-pass SAR interferometry. In Proceedings of the 2007 IEEE International Geoscience and Remote Sensing Symposium, Barcelona, Spain, 23–28 July 2007; pp. 4886–4889. [Google Scholar] [CrossRef]
- Cooper, G. The shuttle radar topography mission: A new source of near-global digital elevation data. Explor. Geophys. 2005, 36, 334–340. [Google Scholar]
- Fiedler, H.; Krieger, G.; Zink, M.; Younis, M.; Bachmann, M.; Huber, S.; Hajnsek, I.; Moreira, A. The TanDEM-X mission: An overview. In Proceedings of the 2008 International Conference on Radar, Adelaide, SA, Australia, 2–5 September 2008; pp. 60–64. [Google Scholar] [CrossRef]
- Stringham, C. GPU Processing for UAS-Based LFM-CW Stripmap SAR. ISPRS J. Photogramm. Remote Sens. 2014, 80, 1107–1115. [Google Scholar] [CrossRef]
- Lagoy, D. Time Domain SAR Processing with GPUS for Airborne Platforms. Master’s Thesis, University of Massachusetts Amherst, Amherst, MA, USA, 2017. [Google Scholar]
- Frey, O.; Werner, C.; Caduff, R. Car-borne Mobile Mapping of Ground Motion by Means of Repeat-Pass SAR Interferometry: Case Studies and Application Development Based on L-Band and Ku-band SAR Data Acquisitions. In Proceedings of the IGARSS 2023—2023 IEEE International Geoscience and Remote Sensing Symposium, Pasadena, CA, USA, 16–21 July 2023; pp. 1902–1905. [Google Scholar] [CrossRef]
- Bamler, R.; Hartl, P. Synthetic aperture radar interferometry. Proc. IEEE 1998, 14, R1–R54. [Google Scholar] [CrossRef]
- Esposito, C.; Pauciullo, A.; Berardino, P.; Lanari, R.; Perna, S. A Simple Solution for the Phase Offset Estimation of Airborne SAR Interferograms Without Using Corner Reflectors. IEEE Geosci. Remote Sens. Lett. 2017, 14, 379–383. [Google Scholar] [CrossRef]
- Prats, P.; Andres, C.; Scheiber, R.; de Macedo, K.A.C.; Fischer, J.; Reigber, A. Glacier displacement field estimation using airborne SAR interferometry. In Proceedings of the 2007 IEEE International Geoscience and Remote Sensing Symposium, Barcelona, Spain, 23–28 July 2007. [Google Scholar] [CrossRef]
- Prats, P.; Scheiber, R.; Reigber, A.; Andres, C.; Horn, R. Estimation of the Surface Velocity Field of the Aletsch Glacier Using Multibaseline Airborne SAR Interferometry. IEEE Trans. Geosci. Remote Sens. 2009, 47, 419–430. [Google Scholar] [CrossRef]
- Prats, P.; Reigber, A.; Mallorqui, J.; Broquetas, A. Efficient detection and correction of residual motion errors in airborne SAR interferometry. In Proceedings of the IGARSS 2004. 2004 IEEE International Geoscience and Remote Sensing Symposium, Anchorage, AK, USA, 20–24 September 2004; Volume 2, pp. 992–995. [Google Scholar] [CrossRef]
Disclaimer/Publisher’s Note: The statements, opinions and data contained in all publications are solely those of the individual author(s) and contributor(s) and not of MDPI and/or the editor(s). MDPI and/or the editor(s) disclaim responsibility for any injury to people or property resulting from any ideas, methods, instructions or products referred to in the content. |
© 2024 by the authors. Licensee MDPI, Basel, Switzerland. This article is an open access article distributed under the terms and conditions of the Creative Commons Attribution (CC BY) license (https://creativecommons.org/licenses/by/4.0/).

