Abstract
The satellite–ground bistatic configuration, which uses geosynchronous synthetic aperture radar (GEO SAR) for illumination and ground equipment for reception, can achieve wide coverage, high revisit, and continuous illumination of interest areas. Based on the analysis of the signal characteristics of GEO satellite–ground bistatic SAR (GEO SG-BiSAR), it is found that the bistatic echo signal has problems of azimuth spectrum aliasing and 2-D spatial variability. Therefore, to overcome those problems, a novel SAR imaging method for a GEO SG-BiSAR system with severe azimuth spectrum aliasing and 2-D spatial variability is proposed. Firstly, based on the geometric configuration of the GEO SG-BiSAR system, the time-domain and frequency-domain expressions of the signal are derived in detail. Secondly, in order to avoid the increasing cost caused by traditional multi-channel reception technology and the processing burden caused by inter-channel errors, the azimuth deramping is executed to solve the azimuth spectrum aliasing of the signal under the special geometric structure of GEO SG-BiSAR. Thirdly, based on the investigation of azimuth and range spatial variability characteristics of GEO SG-BiSAR in the Range Doppler (RD) domain, the azimuth spatial variability correction strategy is proposed. The signal corrected by the correction strategy has the same migration characteristics as monostatic radar. Therefore, the traditional chirp scaling function (CSF) is also modified to solve the range spatial variability of the signal. Finally, the two-dimensional spectrum of GEO SG-BiSAR with modified chirp scaling processing is derived, followed by the SPECAN operation to obtain the focused SAR image. Furthermore, the completed flowchart is also given to display the main composed parts for GEO SG-BiSAR imaging. Both azimuth spectrum aliasing and 2-D spatial variability are taken into account in the imaging method. The simulated data and the real data obtained by the Beidou navigation satellite are used to verify the effectiveness of the proposed method.
1. Introduction
GEO SAR has many advantages such as stable orbital characteristics, wide beam coverage, and strong continuous observation ability [1,2,3,4]. Therefore, the GEO satellite is suitable to be used as an illumination source. The GEO SG-BiSAR system is a novel and special system configuration that uses GEO SAR as the illumination source and ground stationary reception, which can be applied for continuous observation. However, with the complicated time-varying bistatic geometric configuration, the traditional SAR processing methods cannot be used directly to deal with the GEO SG-BiSAR imaging. On the one hand, the understellar points of GEO SAR are complicated curves, such as an “8” shape or water drop, which are very different from the characteristics of a low orbit satellite. On the other hand, the time-varying relative positions and velocities of the GEO transmitter and ground receiver result in serious azimuth and range spatial variability issues in the GEO SG-BiSAR system. Although the time-domain back projection algorithms and its improved algorithms [5,6,7] can deal with the bistatic SAR imaging, the efficiency should be further improved for real-time processing. Therefore, the more efficient algorithms should be investigated. In this paper, we will focus on the modified CS in RD domain for GEO SG-BiSAR imaging.
Assuming that there are no synchronization errors of the GEO SG-BiSAR, the ground receiver obtains bistatic echoes through beamforming technology. Due to the stationary receiver, the Doppler bandwidth of the bistatic echoes is not affected by the ground receiver radar. The Doppler bandwidth contribution is provided by GEO SAR. With the long integration time and the wide beam coverage, the azimuth bandwidth is aliased, which is caused by the low pulse repetition frequency. Carrara et al. [8] and Lanari et al. [9] proposed azimuth preprocessing methods for monostatic SAR imaging. However, due to the differences in GEO SG-BiSAR Doppler bandwidth formulation, these methods need to be improved for GEO SG-BiSAR processing. Pu et al. [10] proposed an orthogonal sparse and rank-one pursuit (OSRanP) algorithm that utilized the sparsity and low rankness of the SAR image to obtain the original SAR image. However, this method requires constructing the observation matrix for the scene recovery, which leads to an enormous storage space and computing resource. To avoid the calculations’ complexity and heavy storage of the observation matrix, Sun et al. [11] proposed a decoupling observation model and the modified alternating direction method of multipliers (M-ADMM). Furthermore, An et al. [12] proposed an M-ADMM method with multiple receiving channels combined with the sparse recovery theory. However, these methods apply the multi-receiving technique to deal with Doppler aliasing. The receiving channel errors also increase the computational complexity of SAR processing. In this paper, we first present the geometric model of GEO SG-BiSAR and then introduce a geometric method to calculate the azimuth modulation frequency in azimuth aliasing preprocessing. Finally, the azimuth spectrum aliasing of the radar echo signal is solved by using the reference function based on azimuth deramping processing [9].
Due to the different minimum slant ranges between the targets and GEO satellites within the same bistatic range cell, those targets with different azimuth positions will have different range migration (RCM) curves and a different Doppler frequency (FM). Therefore, the bistatic echoes exhibit spatial variability in both azimuth and range. The traditional CS algorithm is also modified to deal with this spatial variability. In previous studies on a small bistatic angle system, Wong and Yeo [13] proposed a nonlinear frequency modulation scale (NLCS) method to estimate the azimuth modulation frequency within the same bistatic range cell. In order to adapt a large bistatic angle system, Qiu et al. [14] proposed a local fitting method to improve the perturbation function. Furthermore, considering the squint angle varying and cubic phase term of the transmitter, Zeng [15] analyzed the range modulation frequency of a LEO–ground bistatic experiment. Their methods were proposed for strip mode, so these methods are ineffective for GEO SAR with sliding spotlight mode. Tang et al. [16] addressed an improved nonlinear chirp scaling (NLCS) algorithm that introduced a cubic perturbation function in the azimuth domain and used modified an NLCS algorithm to complete azimuth compression. Sun et al. [17] proposed a range model based on one-stationary equivalence (RMOSE), and a 2-D frequency-domain imaging algorithm was proposed to solve the problem of the 2-D spatial variance of GEO bistatic echoes. But those methods cannot be used to process the azimuth Doppler aliasing signal. Considering the azimuth Doppler aliasing, Wang and Lu [18] adopted azimuth multi-channel to obtain non-aliasing SAR echoes. However, this method is not applicable for a single-channel SAR system. Tian et al. [19] analyzed a unified algorithm for SS and TOPS modes in a GEO transmitter stationary and LEO receiver movement bistatic configuration. Due to the difference between this configuration and the GEO SG-BiSAR, this method cannot be directly applied to the GEO SG-BiSAR processing. Therefore, we propose a novel SAR imaging method for the GEO SG-BiSAR system with severe azimuth spectrum aliasing and 2-D spatial variability in this paper. Finally, we can obtain the focused SAR image through SPECAN operation.
On the basis of previous analysis, an imaging method for a GEO SG-BiSAR system was proposed to solve severe azimuth spectrum aliasing and two-dimensional spatial variability. Firstly, we obtained the azimuth frequency modulation rate through system geometric configuration, which is used to deal with the azimuthal aliasing of echoes. Secondly, in order to solve the azimuth spatial variation caused by the slant range between the targets and receiver, an azimuth spatial variation correction strategy was proposed. The corrected signal had the same receiving slant range within the same range cell, which means that the processed GEO SG-BiSAR signal had the same range spatial variation properties as the monostatic radar. Therefore, the traditional monostatic chirp scaling (CS) algorithm was modified to solve the range spatial variability of the signal. Finally, the focused SAR image was obtained in the azimuth frequency domain through SPECAN operation followed by the azimuth compression. The proposed method considers both the azimuth spectrum aliasing and two-dimensional spatial variability compared with the state-of-the-art method. In addition, the corrected signal of the azimuth spatial variation had the same signal properties as the monostatic radar. There was no need to consider the design of bistatic configurations in the practical experiments.
The paper is arranged as follows. In Section 2, we introduce the geometric configuration and signal model of GEO SG-BiSAR in detail. In Section 3, the geometric method and reference function are given to solve the azimuth Doppler aliasing problem. In Section 4, based on our investigation of 2-D spatial variability, we propose an azimuth spatial variation correction method and modified CS function for the GEO SG-BiSAR. In Section 5, the two-dimensional spectrum of the GEO SG-BiSAR signal with modified CS processing is analyzed. The performance investigation of the GEO SG-BiSAR imaging is given in Section 6 with the simulated data and the real data obtained by the Beidou navigation satellite. A brief conclusion is presented in the final section.
2. Spatial Observation Geometry and Signal Model of GEO SG-BiSAR System
In this section, we introduce the spatial observation geometry of a GEO SG-BiSAR system. And the corresponding bistatic echo signal model is also established. Furthermore, we analyze the echo signal expressions in the time domain and two-dimensional frequency domain.
2.1. Spatial Observation Geometry of GEO SG-BiSAR System
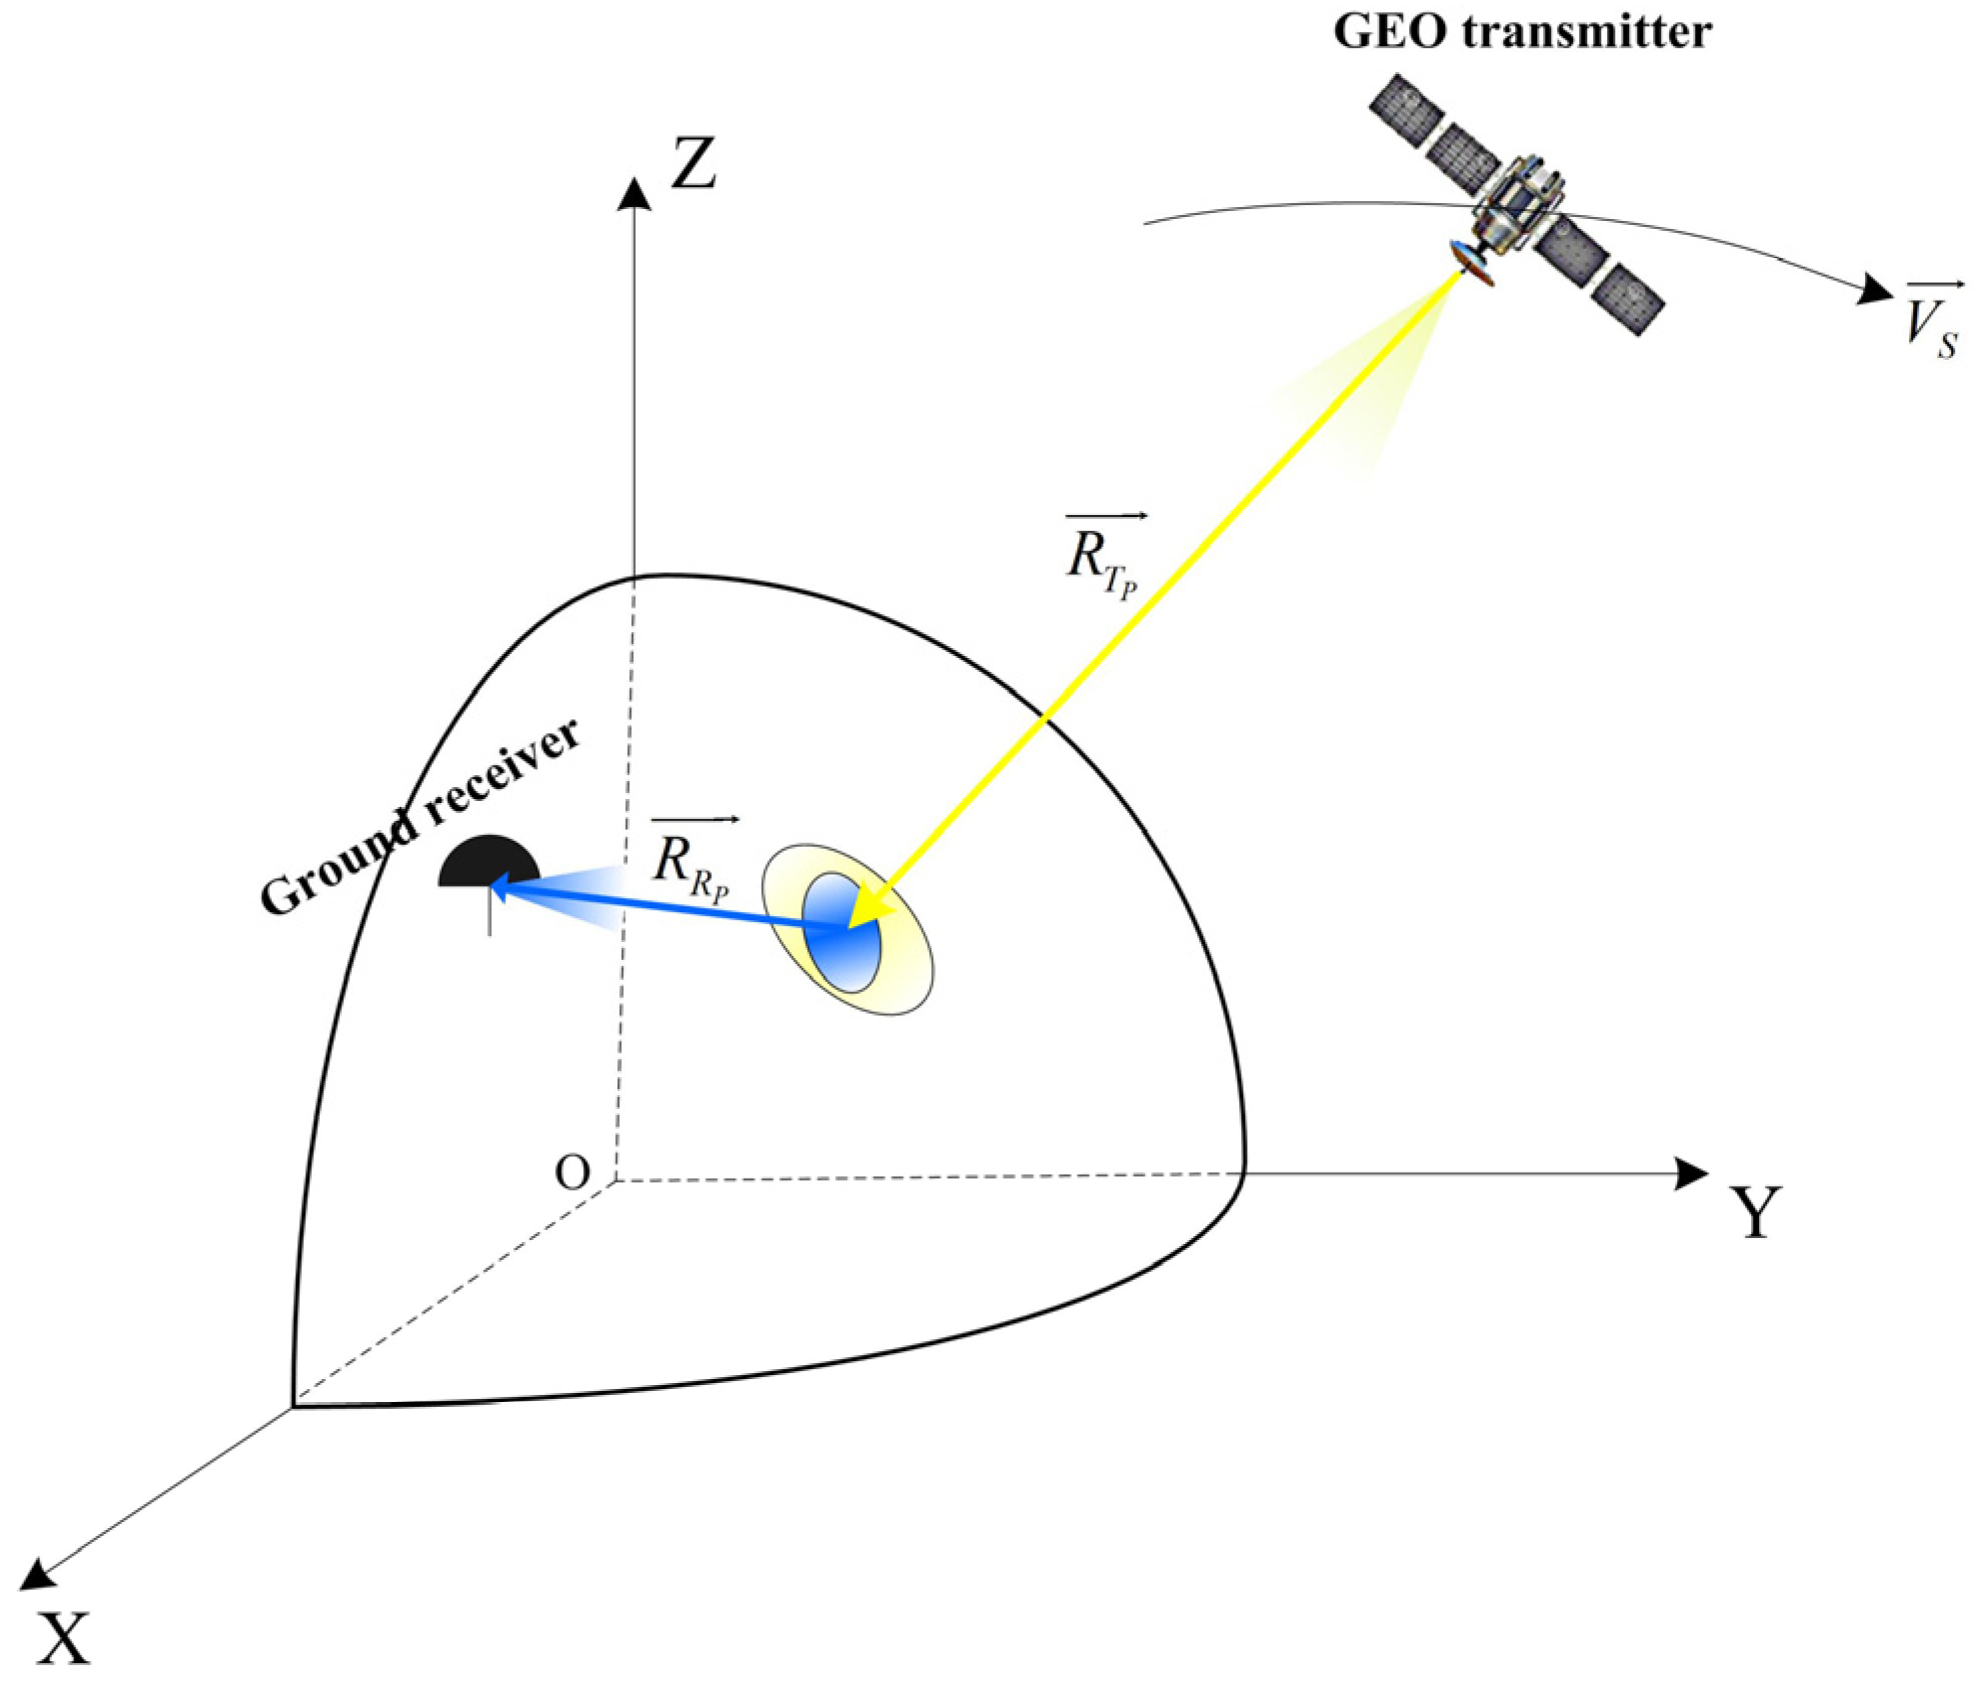
The geocentric fixed coordinate system is often used in spaceborne SAR system research. The Earth’s center is defined as the coordinate origin. The X-axis passes through the intersection of the equatorial plane and the Greenwich meridian. The Z-axis points north along the Earth’s rotation axis. The Y-axis is determined by the right-hand Cartesian coordinate system.
The GEO SG-BiSAR spatial observation geometric model is shown as Figure 1. We assume that is an illuminated point target, is the velocity of GEO SAR, the distance between the GEO transmitter and the target is , the distance between the ground receiver and target is , and the azimuth time is ; then, the bistatic slant ranges from target to the GEO transmitter and ground receiver are:
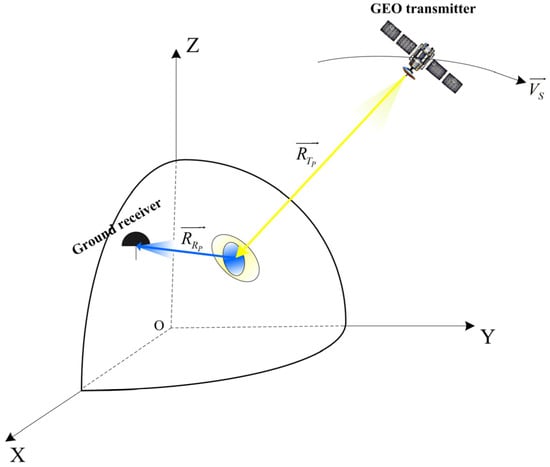
Figure 1.
Spatial observation geometric model of the GEO SG-BiSAR system.
2.2. Characteristics’ Analysis of GEO SG-BiSAR Echo Signal
The radar echoes of the target are expressed as:
where is the range window function of the transmitted signal, is the azimuth window function, is the range modulation frequency, is the carrier frequency, is the speed of light, and is the range time.
Firstly, we perform range Fourier transform on (2) to obtain the range spectrum:
where is the range frequency. We assume that is the integral phase of (3); then:
Based on the principle of the stationary phase (POSP), we can obtain the relationship between the range time and frequency by calculating the partial derivative of over :
Combining (4) and (6), we obtain:
Due to the inherent double radical of the GEO SG-BiSAR echo signal, it is difficult for us to obtain the two-dimensional spectrum expression. Neo et al. [20] proposed that the double radical slant range can be expanded into a Taylor series at an azimuth time of zero. Then, the high-order approximate expression of the stationary phase point can be obtained by using the series inversion method. Finally, we can obtain an accurate high-order approximate two-dimensional spectrum expression of GEO SG-BiSAR echoes by controlling the number of terms in the series expansion. Based on Neo’s ideas, many researchers have subsequently launched a series of bistatic studies [21,22].
Next, we perform azimuth Fourier transform on (7) to obtain the two-dimensional spectrum expansion:
where is the azimuth frequency. According to the series inversion method (Appendix A), . Therefore, the integral phase of (8) is
We can obtain the stationary phase point by calculating the partial derivative of over :
where
Combining (12) and (13), we obtain the fourth-order and below integral phases about
In order to decouple the range frequency and azimuth frequency , the two-dimensional spectral phase term of (14) is further expanded into a polynomial about . Ignoring the higher-order term of , we obtain:
The four coefficient terms about in (15) are explained as follows.
- i.
- The first coefficient term in (15) is independent of the range frequency domain , which is the azimuth modulation term:
- ii.
- The second coefficient term is the first-order term about the range frequency domain , which represents the range migration curve of the target:
- iii.
- The third coefficient term is the quadratic term about the range frequency domain , which is the range pulse compression term:
- iv.
- The fourth coefficient term is the cubic term about the range frequency domain :
Therefore, the two-dimensional spectrum of a GEO SG-BiSAR echo signal can be expressed as:
Based on the characteristics of the GEO SG-BiSAR echo signal, specific SAR imaging processing strategies will be investigated in the subsequent section.
3. Azimuth Deramping Preprocessing of GEO SG-BiSAR
As a result of the GEO SG-BiSAR understellar point trajectories with an “8” shape or water drop shape, the echoes will acquire a large Doppler bandwidth with a long integration time. In this situation, the azimuth spectrum is aliased, caused by the low pulse repetition frequency. Carrara and Lanari proposed azimuth preprocessing algorithms to eliminate spectral aliasing in a monostatic SAR system. Due to the difference between this configuration and GEO SG-BiSAR, those algorithms cannot be directly applied to the GEO SG-BiSAR azimuth preprocessing. To solve this problem, a geometric azimuth preprocessing method was proposed. In this method, we assume that the Doppler history of a central scene target is and the target is continuously illuminated by a GEO transmitter . Then, the azimuth frequency modulation rate can be expressed as:
Based on the variation characteristics of the GEO SG-BiSAR Doppler frequency, the dechirp signal used for integrating can be obtained as:
The azimuth Doppler aliasing is eliminated by the convolution of (7) and (22).
where represents the azimuth convolution operation, represents the updated azimuth frequency, and is the azimuth time corresponding to a new azimuth frequency .
From (23), we can see that the two exponential terms in the integral sign represent two operations. The first exponential term is the multiplication of and , which represents the deramping operation. The second exponential term is a linear phase about , which is called the IFFT kernel. The IFFT operation is completed by combining the IFFT kernel and integral sign. The exponential term outside the integral sign is a constant phase, which will not affect the SAR imaging. The azimuth time and frequency are updated after the azimuth spectrum aliasing elimination. In order to be consistent with Section 2, Section 4, and Section 5, it should be noted that and are used to represent the updated azimuth time and frequency.
4. Two-Dimensional Spatial Variation Analysis and Correction of GEO SG-BiSAR
In this section, we will focus on the two-dimensional spatial variation characteristics of bistatic echoes. Firstly, we introduce the Range Doppler (RD) positioning function of the GEO SG-BiSAR system. On this basis, two-dimensional spatial variation characteristics were analyzed in the RD domain. Secondly, a translation method was proposed to solve the azimuth spatial variation in the GEO SG-BiSAR echo signal. Finally, a modified chirp scaling function was derived for the range variation correction.
4.1. Range Doppler Positioning Function of GEO SG-BiSAR System
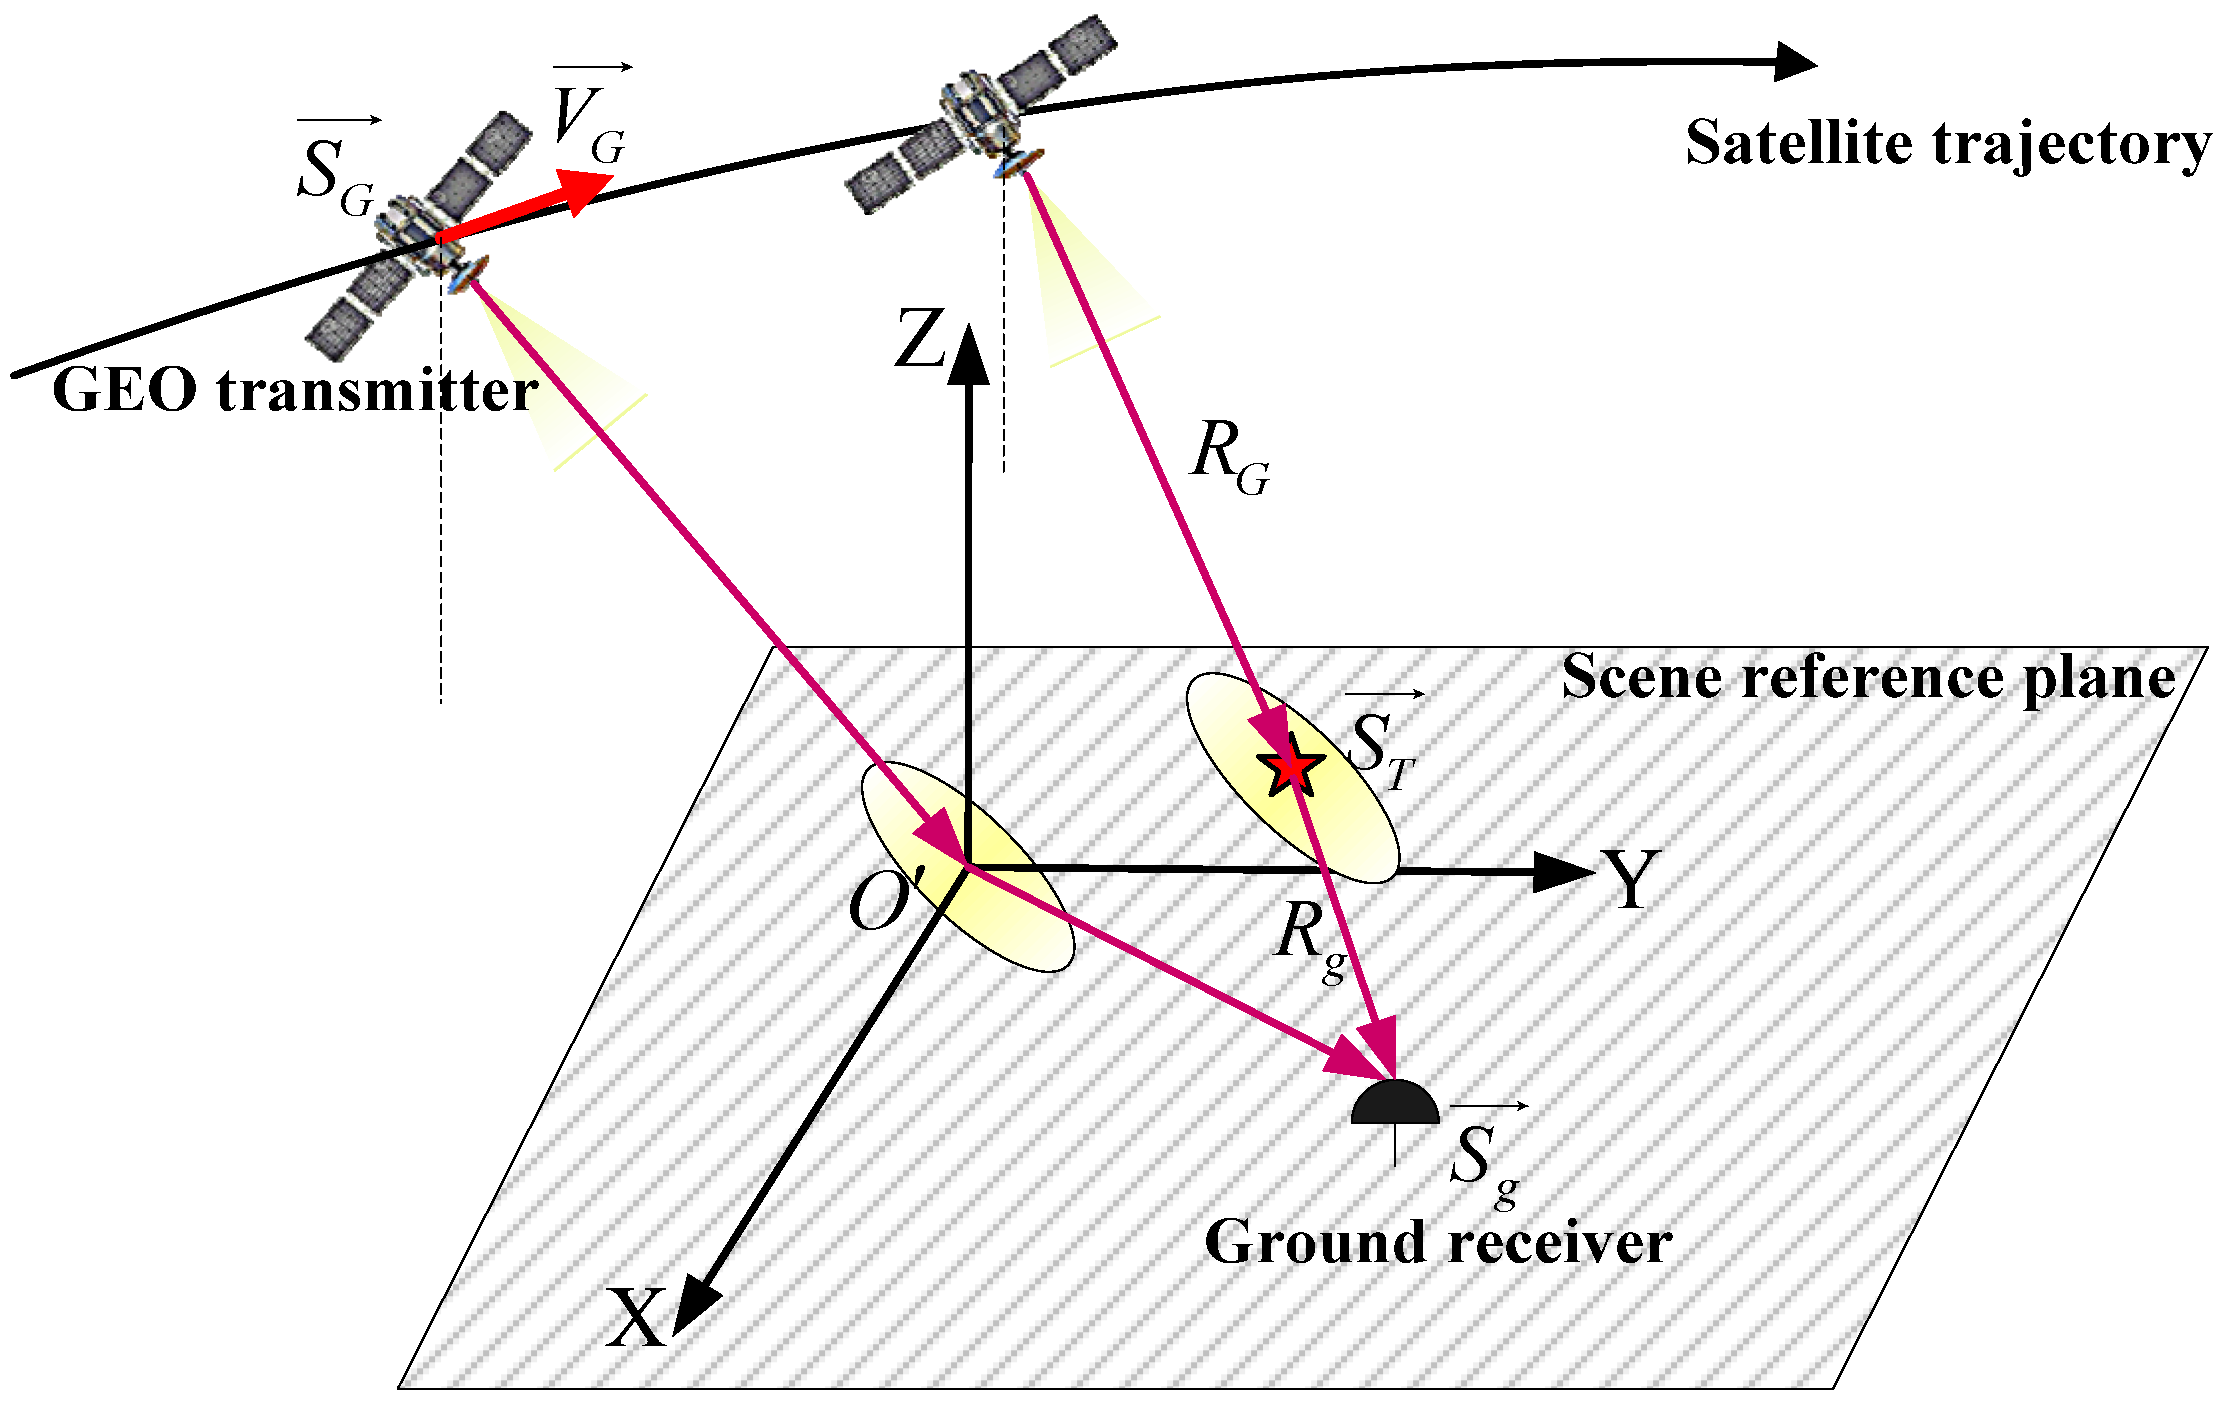
The RD positioning mode of GEO SG-BiSAR can clearly be seen in a target ontology coordinate system. As shown in Figure 2, the central target of the illumination scene is defined as the coordinate origin. The connection between the central target and Earth’s center is defined as the Z-axis, which points toward the target. The projection of the GEO SAR velocity in the Z-axis vertical direction is the Y-axis. The X-axis is determined by the right-hand Cartesian coordinate system.
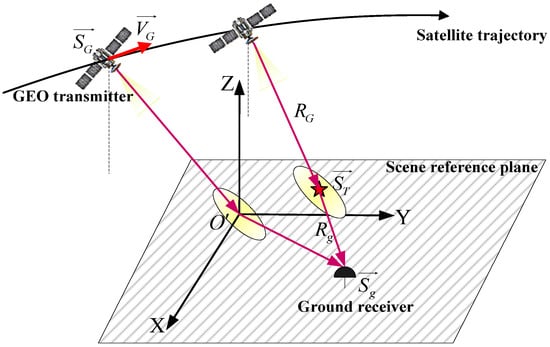
Figure 2.
RD position model of GEO SG-BiSAR system.
We assume that and represent the position and velocity of the GEO transmitter, the position of the ground receiver is , and the position of the red pentagram is . can be obtained by solving three positioning equations, as below:
where is the target position, and are the Earth’s equatorial radius and polar radius, respectively, and are the distance from the GEO transmitter and ground receiver to the target, respectively, is the signal wavelength, and is the Doppler center of the signal.
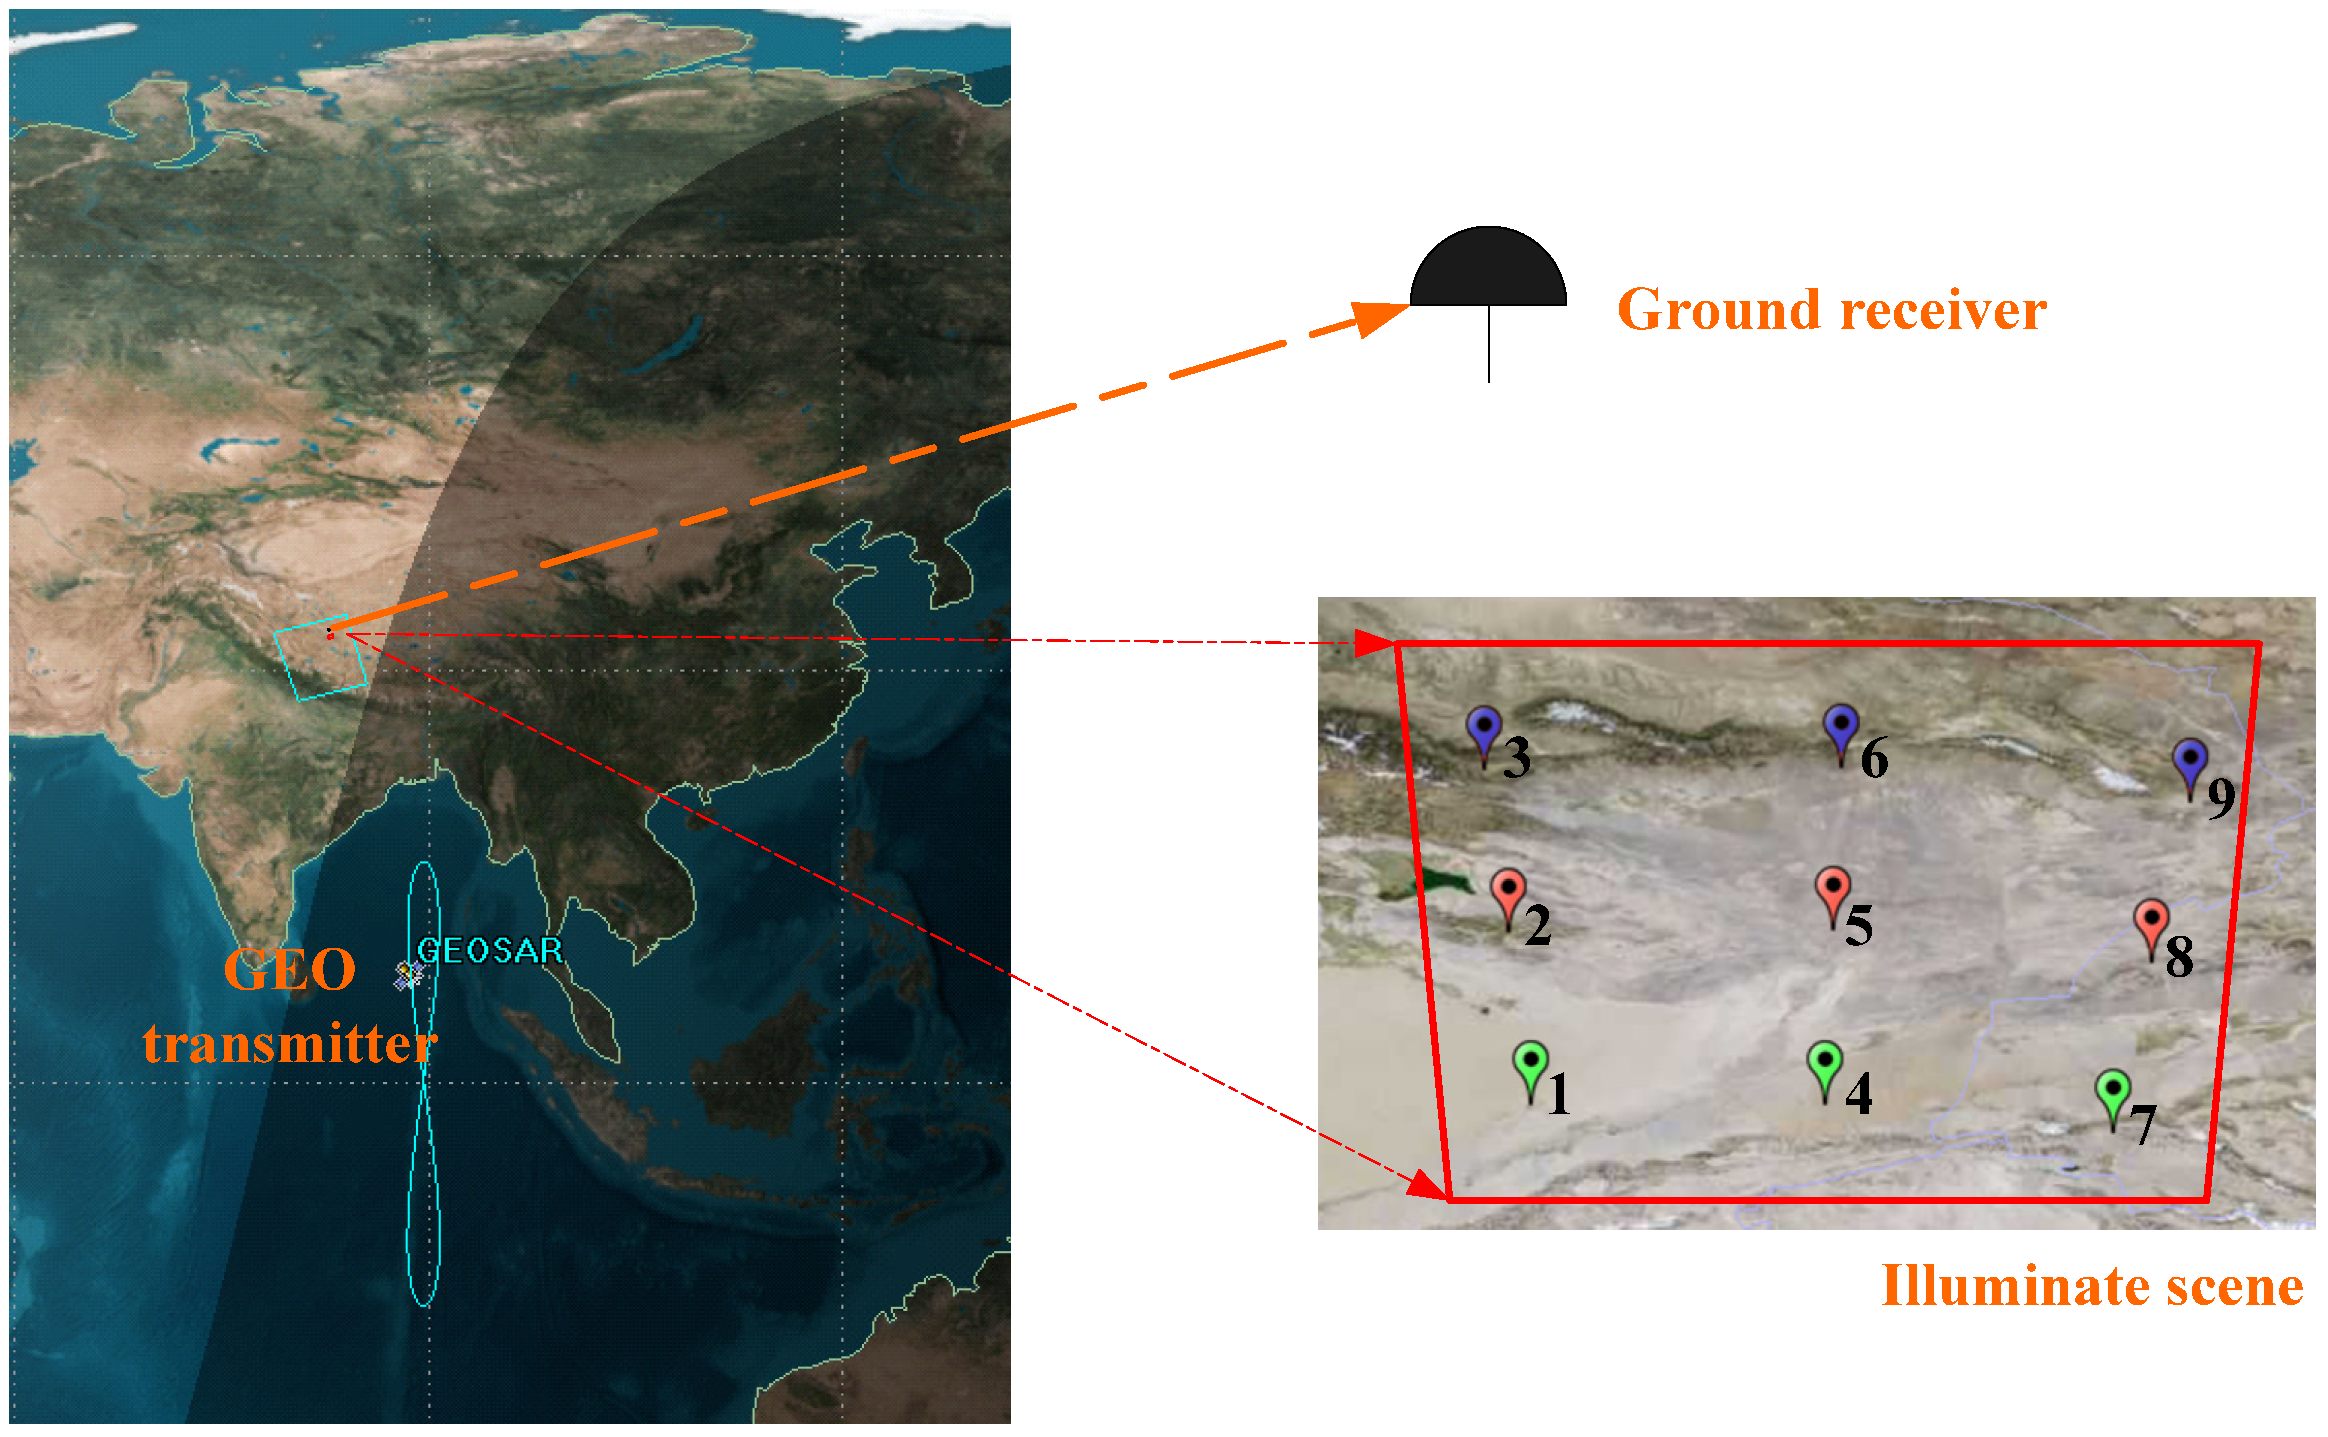
The nine target positions can be obtained by using the Newton iteration method (Appendix B). The longitude and latitude coordinates of these targets are marked with different colored icons on the map, as shown in Figure 3. Targets with the same colored icons are considered to have the same minimum slant range as the GEO transmitter. In (20), due to the variation in the target geographical location, and are varying. That is to say, targets within the same bistatic range cell have a different transmitting slant range and receiving slant range . Therefore, the bistatic echoes exhibit spatial variability in both the azimuth and range. The traditional CS algorithm was also modified to deal with this spatial variability.
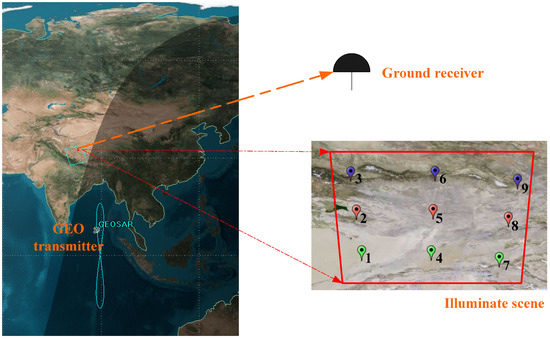
Figure 3.
Target position obtained from GEO SG-BiSAR RD positioning equations.
4.2. Azimuth Spatial Variation Analysis and Correction of GEO SG-BiSAR
As mentioned above, the azimuth targets 2, 5, and 8 in Figure 3 have the same minimum slant range . We assume that , , and are the slant ranges of these targets to the ground receiver. It is obvious that these ranges are different from each other. We suppose as the reference range . If we can adjust these slant range differences and rearrange them with the same receiving range , the azimuth spatial variation in the signal will be corrected. In this situation, the CS method can be used to correct the range spatial variation.
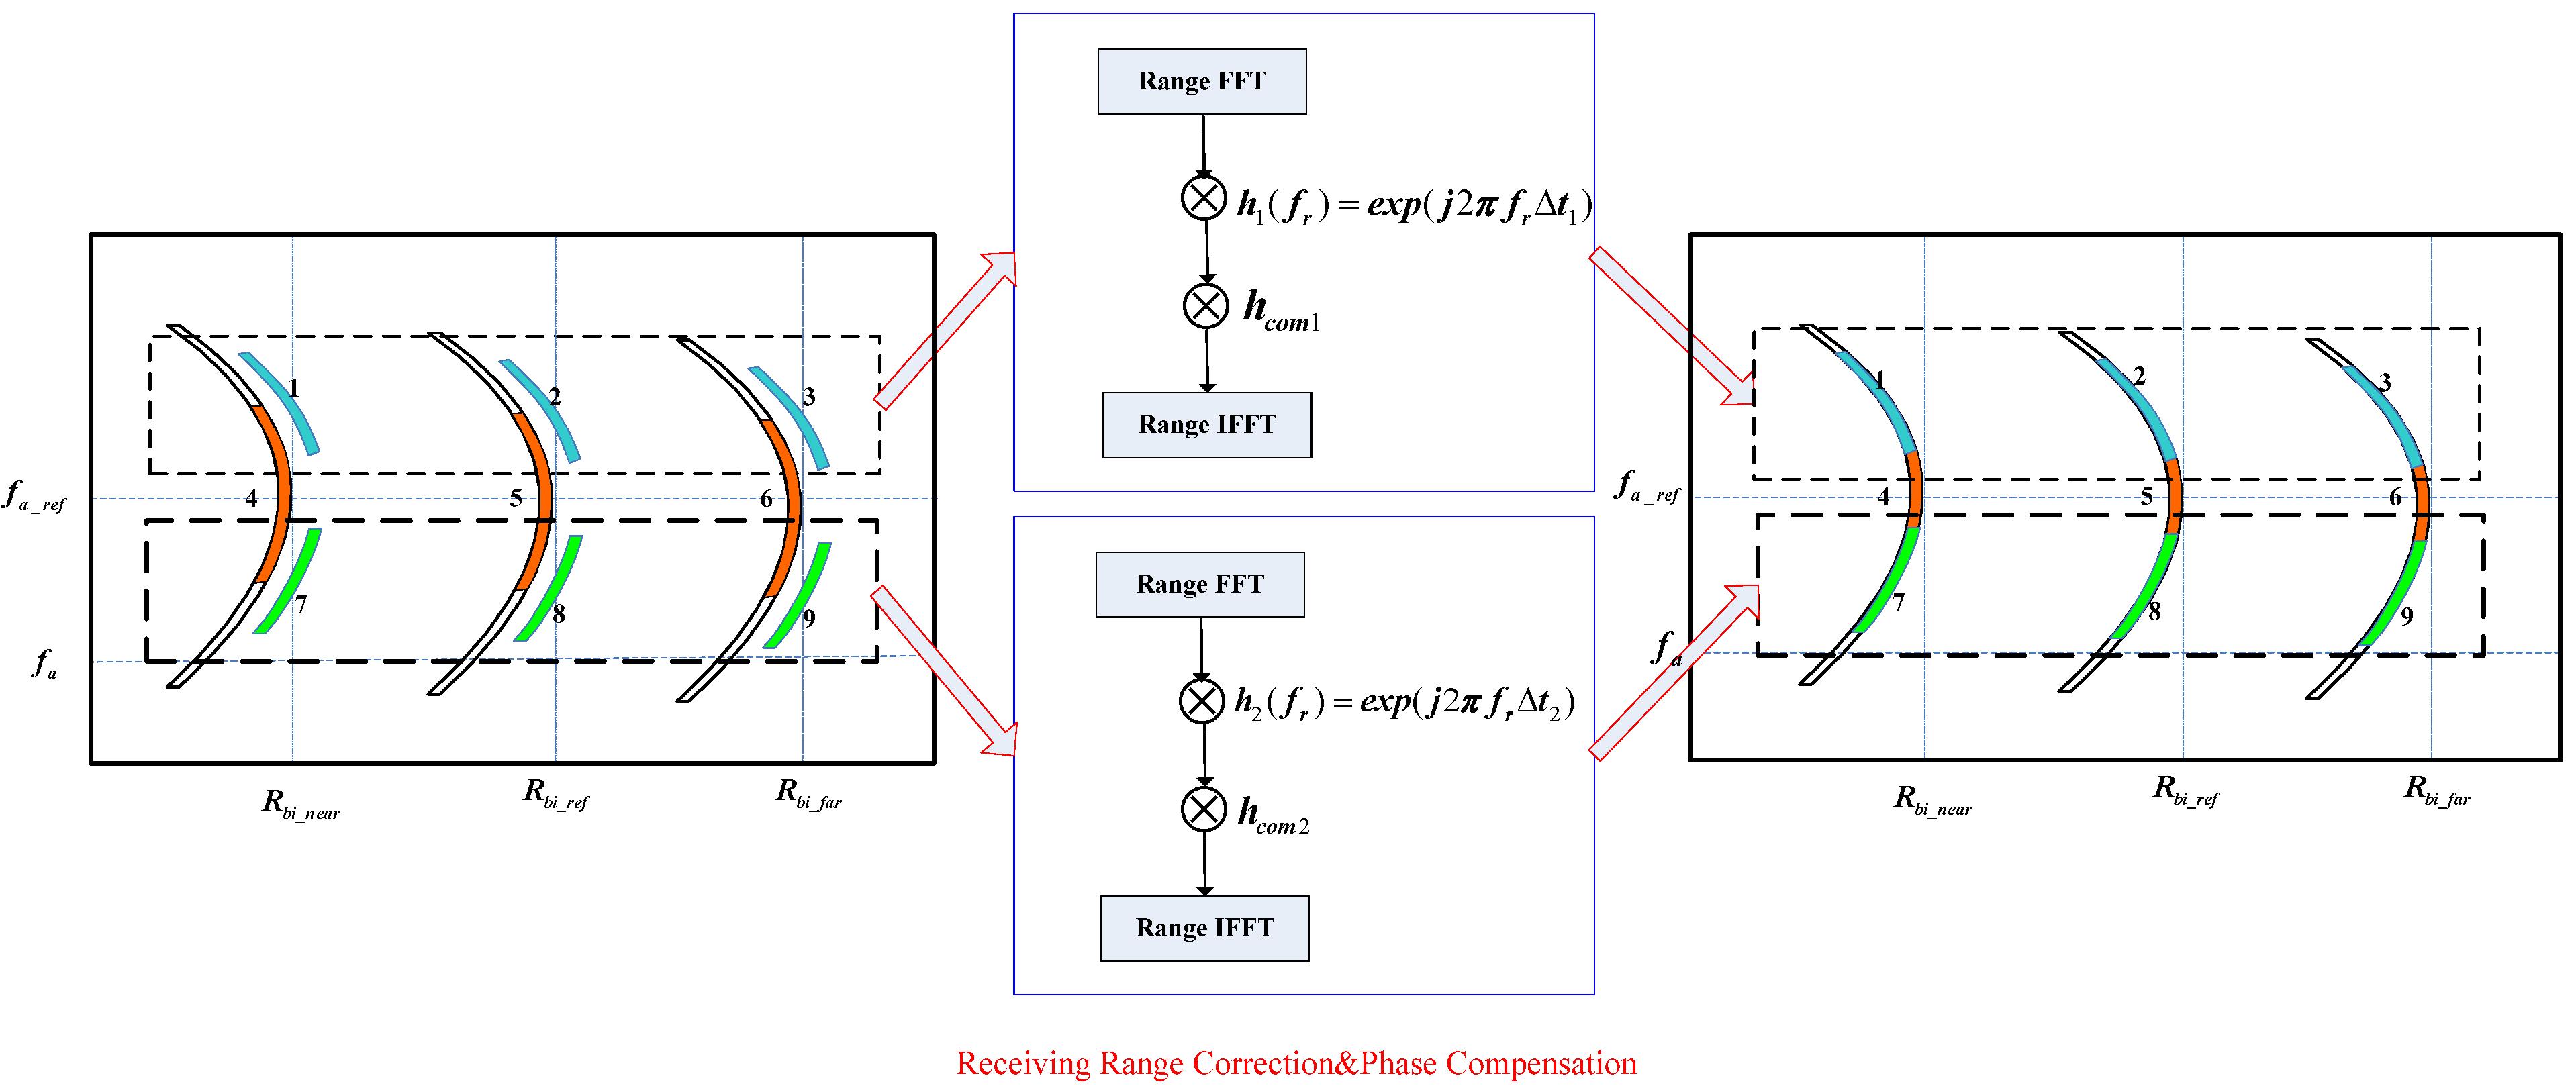
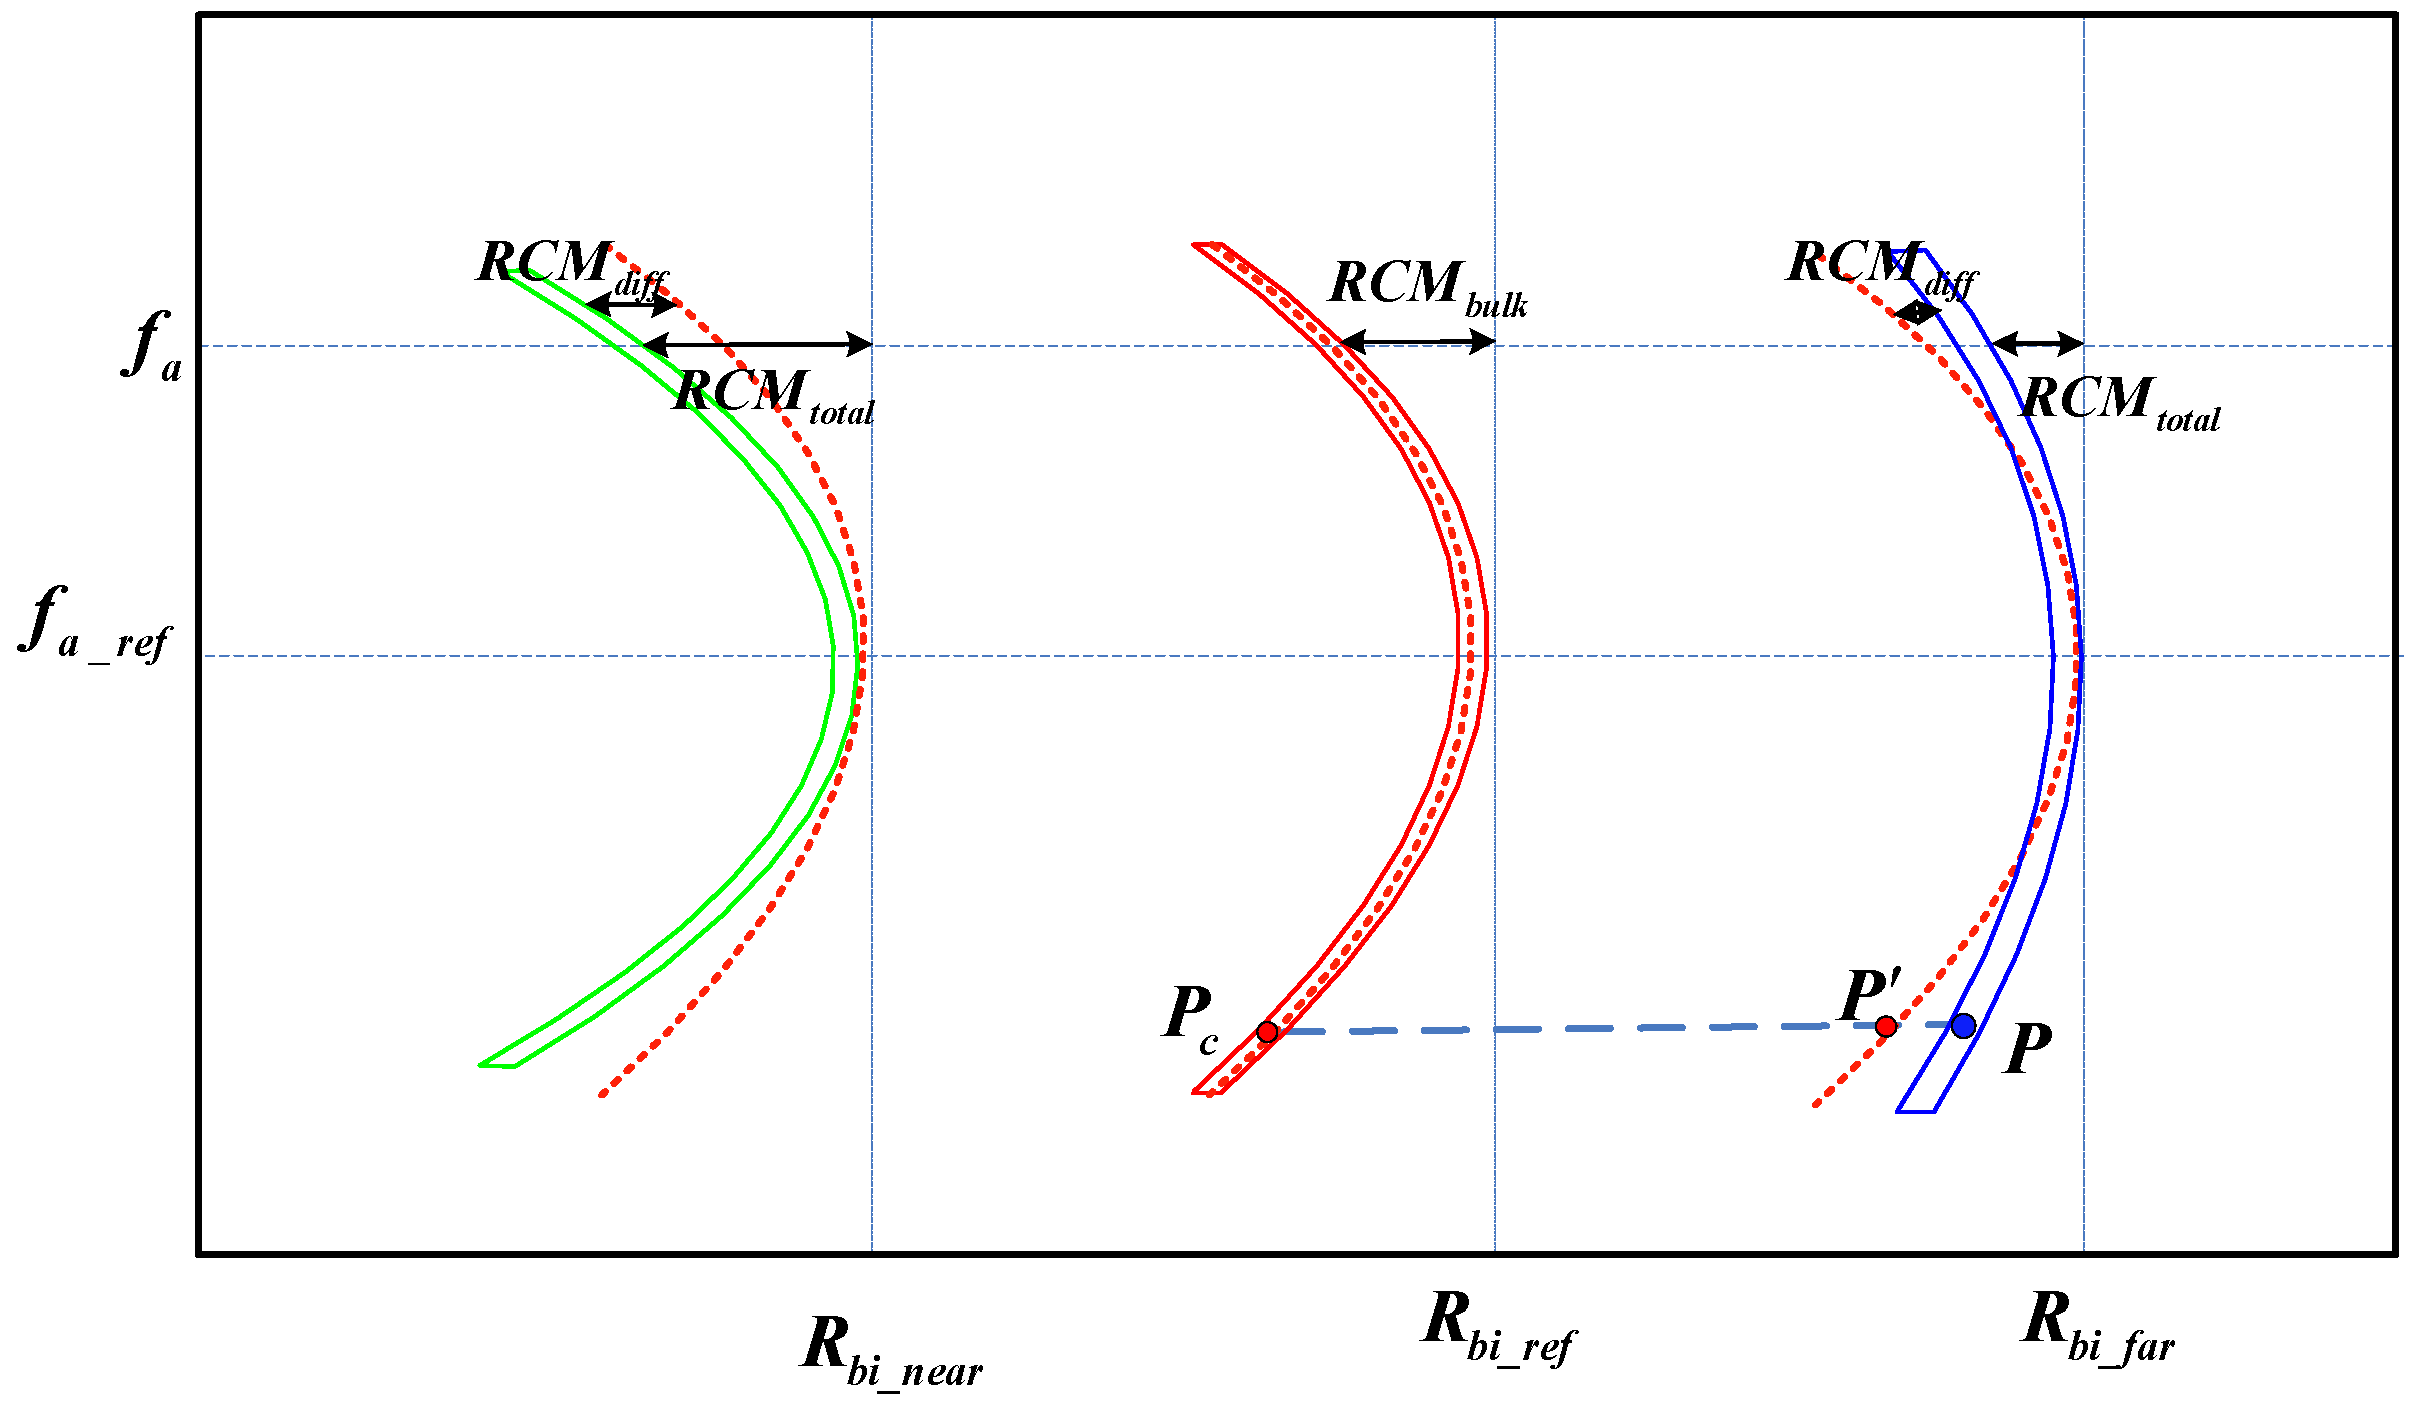
In Figure 4, three target clusters are used to explain the azimuth spatial variation correction of GEO SG-BiSAR. The vertical direction in this figure represents the Doppler frequency axis . The is the azimuthal reference frequency. The horizontal direction represents different a bistatic range cell. , , and are the near, reference, and far bistatic range cells, respectively, where .
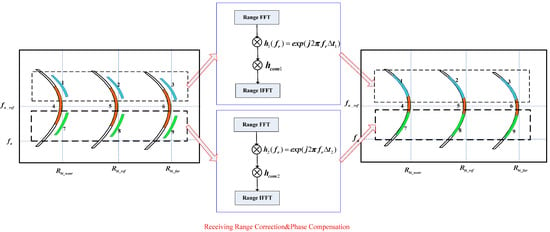
Figure 4.
Azimuth spatial variation correction process for GEO SG-BiSAR.
The azimuth spatial variation correction steps are shown in Figure 4. Firstly, we intercepted signals with a consistent Doppler frequency in the RD domain to illustrate the correction process, such as the targets 1, 2, and 3. Secondly, the intercepted signals were transformed into a two-dimensional frequency domain through a range Fourier transform (FFT), followed by multiplying a linear phase . Finally, the signals returned to the RD domain again through an inverse Fourier transform (IFFT). According to the difference between the target cluster receiving range and the reference target cluster receiving range, the time variable of the targets 1–3 was calculated as:
It is worth noting that we needed to perform phase compensation for the signal, which completes azimuth spatial correction. This phase compensation function is:
Similarly, the time variable of the targets 7–9 and the phase compensation function are
After the above azimuth spatial correction processing, the target clusters with the same minimum slant range had the same receiving range . Therefore, it can be considered that the bistatic SAR signals had the same signal characteristics with the monostatic SAR. The modified CS algorithm can be used for range spatial variation correction to ensure targets with the same minimum slant range are located at the same range cell.
4.3. Range Spatial Variation Analysis and Correction of GEO SG-BiSAR
The core of the CS algorithm is to uniformly correct the range migration of a target within a different range cell. Generally, the CS algorithm is processed in the RD domain, and the reference range is the bistatic slant range of scene central target. Therefore, based on (20), we needed to derive the RD domain expression of the GEO SG-BiSAR signal. Due to the difficulty of directly performing range IFFT, we first performed a cubic phase compensation for the two-dimensional frequency domain signal. The cubic phase compensation function is as follows:
Then, we have
By range IFFT transformation, the RD domain expression of the GEO SG-BiSAR signal is obtained as:
where is the range migration curve. The relationship between and the range reflects the range spatial variability of the GEO SG-BiSAR signal.
Due to the complexity of GEO SG-BiSAR spatial observation geometry, it was difficult for us to obtain the analytical expression of relative to . From the reference [23], we can see that the analytical expression can be obtained by numerical calculation, and the process is as follows: We place a certain number of targets (usually a few dozen) along the range direction within the illuminated scene. Then, we calculate the range migration curve sequence under the same azimuth frequency , where , is the bistatic range of target , and the number of placed targets is . By linear fitting, the numerical relationship among the range migration curve sequence, , and can be expressed as:
By performing the above operation on all azimuth frequencies, we can obtain the values of and .
The receiving range error of the target clusters with the same minimum slant range was eliminated by the azimuth spatial correction of GEO SG-BiSAR; the distribution of these target clusters within the RD domain is shown in Figure 5. The curved degree of the target clusters in different range cells was varying, that is to say, the signal exhibited range spatial variation. To solve this problem, we first analyzed the consistent range migration (), overall range migration (), and complementary range migration () of the GEO SG-BiSAR signal. The CS algorithm was modified for the GEO SG-BiSAR signal processing.
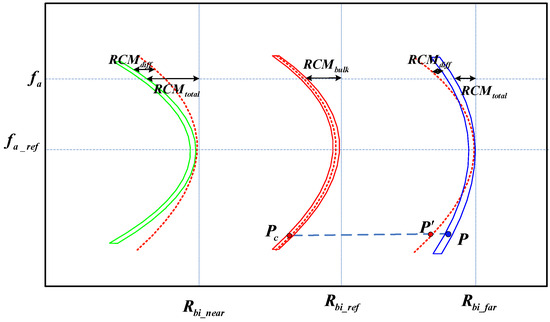
Figure 5.
Range spatial variation schematic diagram of GEO SG-BiSAR signal.
In Figure 5, the ranges from the vertical, gray, dashed line to the near-end green, reference-end red, and far-end blue solid boxes are represented as . Moving the red, dashed curve to the near end and far end, we can observe the characteristics of range spatial variation. We assume that the range between the vertical, gray, dashed line and the red, solid curve is and the difference between and is defined as . According to (32), the different RCM expressions can be expressed as:
where represents the range migration, which can be compensated by multiplying the CSF. The derivation of the CSF for GEO SG-BiSAR is as follows: combining (31) and (32), the target locates in the range cell (in unit of time) as follows:
If the range time of target is designated as original time, then we get:
Expressing the range migration with , we obtain
The CSF of the GEO SG-BiSAR system is obtained by integration:
Multiplying the azimuth variation corrected signal with , the signal in the RD domain has the same , which will be eliminated through a unified range migration correction.
This 2-D spatial variation correction method may be affected by the imaging scenes’ terrain. Without a reference digital elevation model (DEM), we can focus SAR images by using the average elevation. When the reference DEM is known, the proposed methods can be used based on scene segmentation to complete the 2-D spatial variation correction processing and obtain well-focused SAR images.
5. Modified CS Processing and Azimuth Compression of GEO SG-BiSAR
The azimuth preprocessed signal is aliasing in the azimuth time domain, so we obtain the focused SAR image by the SPECAN operation in the azimuth frequency domain. Based on the previous sections, we obtain the flowchart of the GEO SG-BiSAR imaging with severe azimuth spectrum aliasing and 2-D spatial variability.
5.1. Two-Dimensional Spectrum of GEO SG-BiSAR Signal with Modified CS Processing
As is shown in Section 4.3, multiplying the Range Doppler signal (31) with the CS function (37), we can obtain the range variation corrected signal:
Furthermore, we obtain the two-dimensional frequency spectrum expression by range FFT. According to the POSP principle, the integral phase is:
Calculating the partial derivative of over , the relationship between and can be obtained as follows:
Submitting into (39), we obtain the two-dimensional frequency spectrum expression in ascending power of successively:
Organizing (42), we obtain:
Therefore, the two-dimensional spectrum expression of the signal is:
The exponential terms in (44) are explained as follows:
- The first phase is the azimuth Doppler frequency modulation term. It is a function of the transmitting minimal slant range and the receiving slant range . We assume that the term is denoted as , which will be compensated in azimuth compression.
- The second phase is the range modulation term. It is a quadratic function of . Range compression is achieved by compensating for this phase. We assume this term to be .
- The third phase term is the linear phase of , which is the peak position of the range compressed signal.
- The fourth phase term represents the consistent range migration after CS scaling processing. The range migration correction of the entire scene is completed by compensating the phase. We assume this term to be .
- The fifth and sixth phase terms are residual phases caused by the CS scaling processing. They are functions of the bistatic range and the azimuth frequency . We assume that these terms are uniformly denoted as , which will be compensated in azimuth compression.
5.2. Azimuth Compression of GEO SG-BiSAR Signal
For the traditional monostatic CS processing, the final step is phase compensation by an azimuth matching filter in the RD domain; then, we obtain the focused SAR image in the azimuth time domain by azimuth IFFT. The azimuth preprocessed signal is aliasing in the azimuth time domain, so the azimuth compression of the monostatic SAR is ineffective for the GEO SG-BiSAR signal. Combining the idea of SPECAN processing, we can obtain the focused SAR in the azimuth frequency domain.
After range compression, consistent range migration correction, residual phase compensation, and azimuth phase compensation, we can construct a transfer function as follows:
Then, the signal expression is as follows
where “” represents conjugate operation. At this point, the signal ( is removed in the above processing) is no longer aliasing in the azimuth time domain. It can be directly converted to the azimuth time domain through azimuth IFFT, and the signal becomes:
After compensating the phase in (47), we transform the signal into the azimuth frequency domain through FFT to obtain the focused SAR image.
5.3. GEO SG-BiSAR Imaging Flowchart
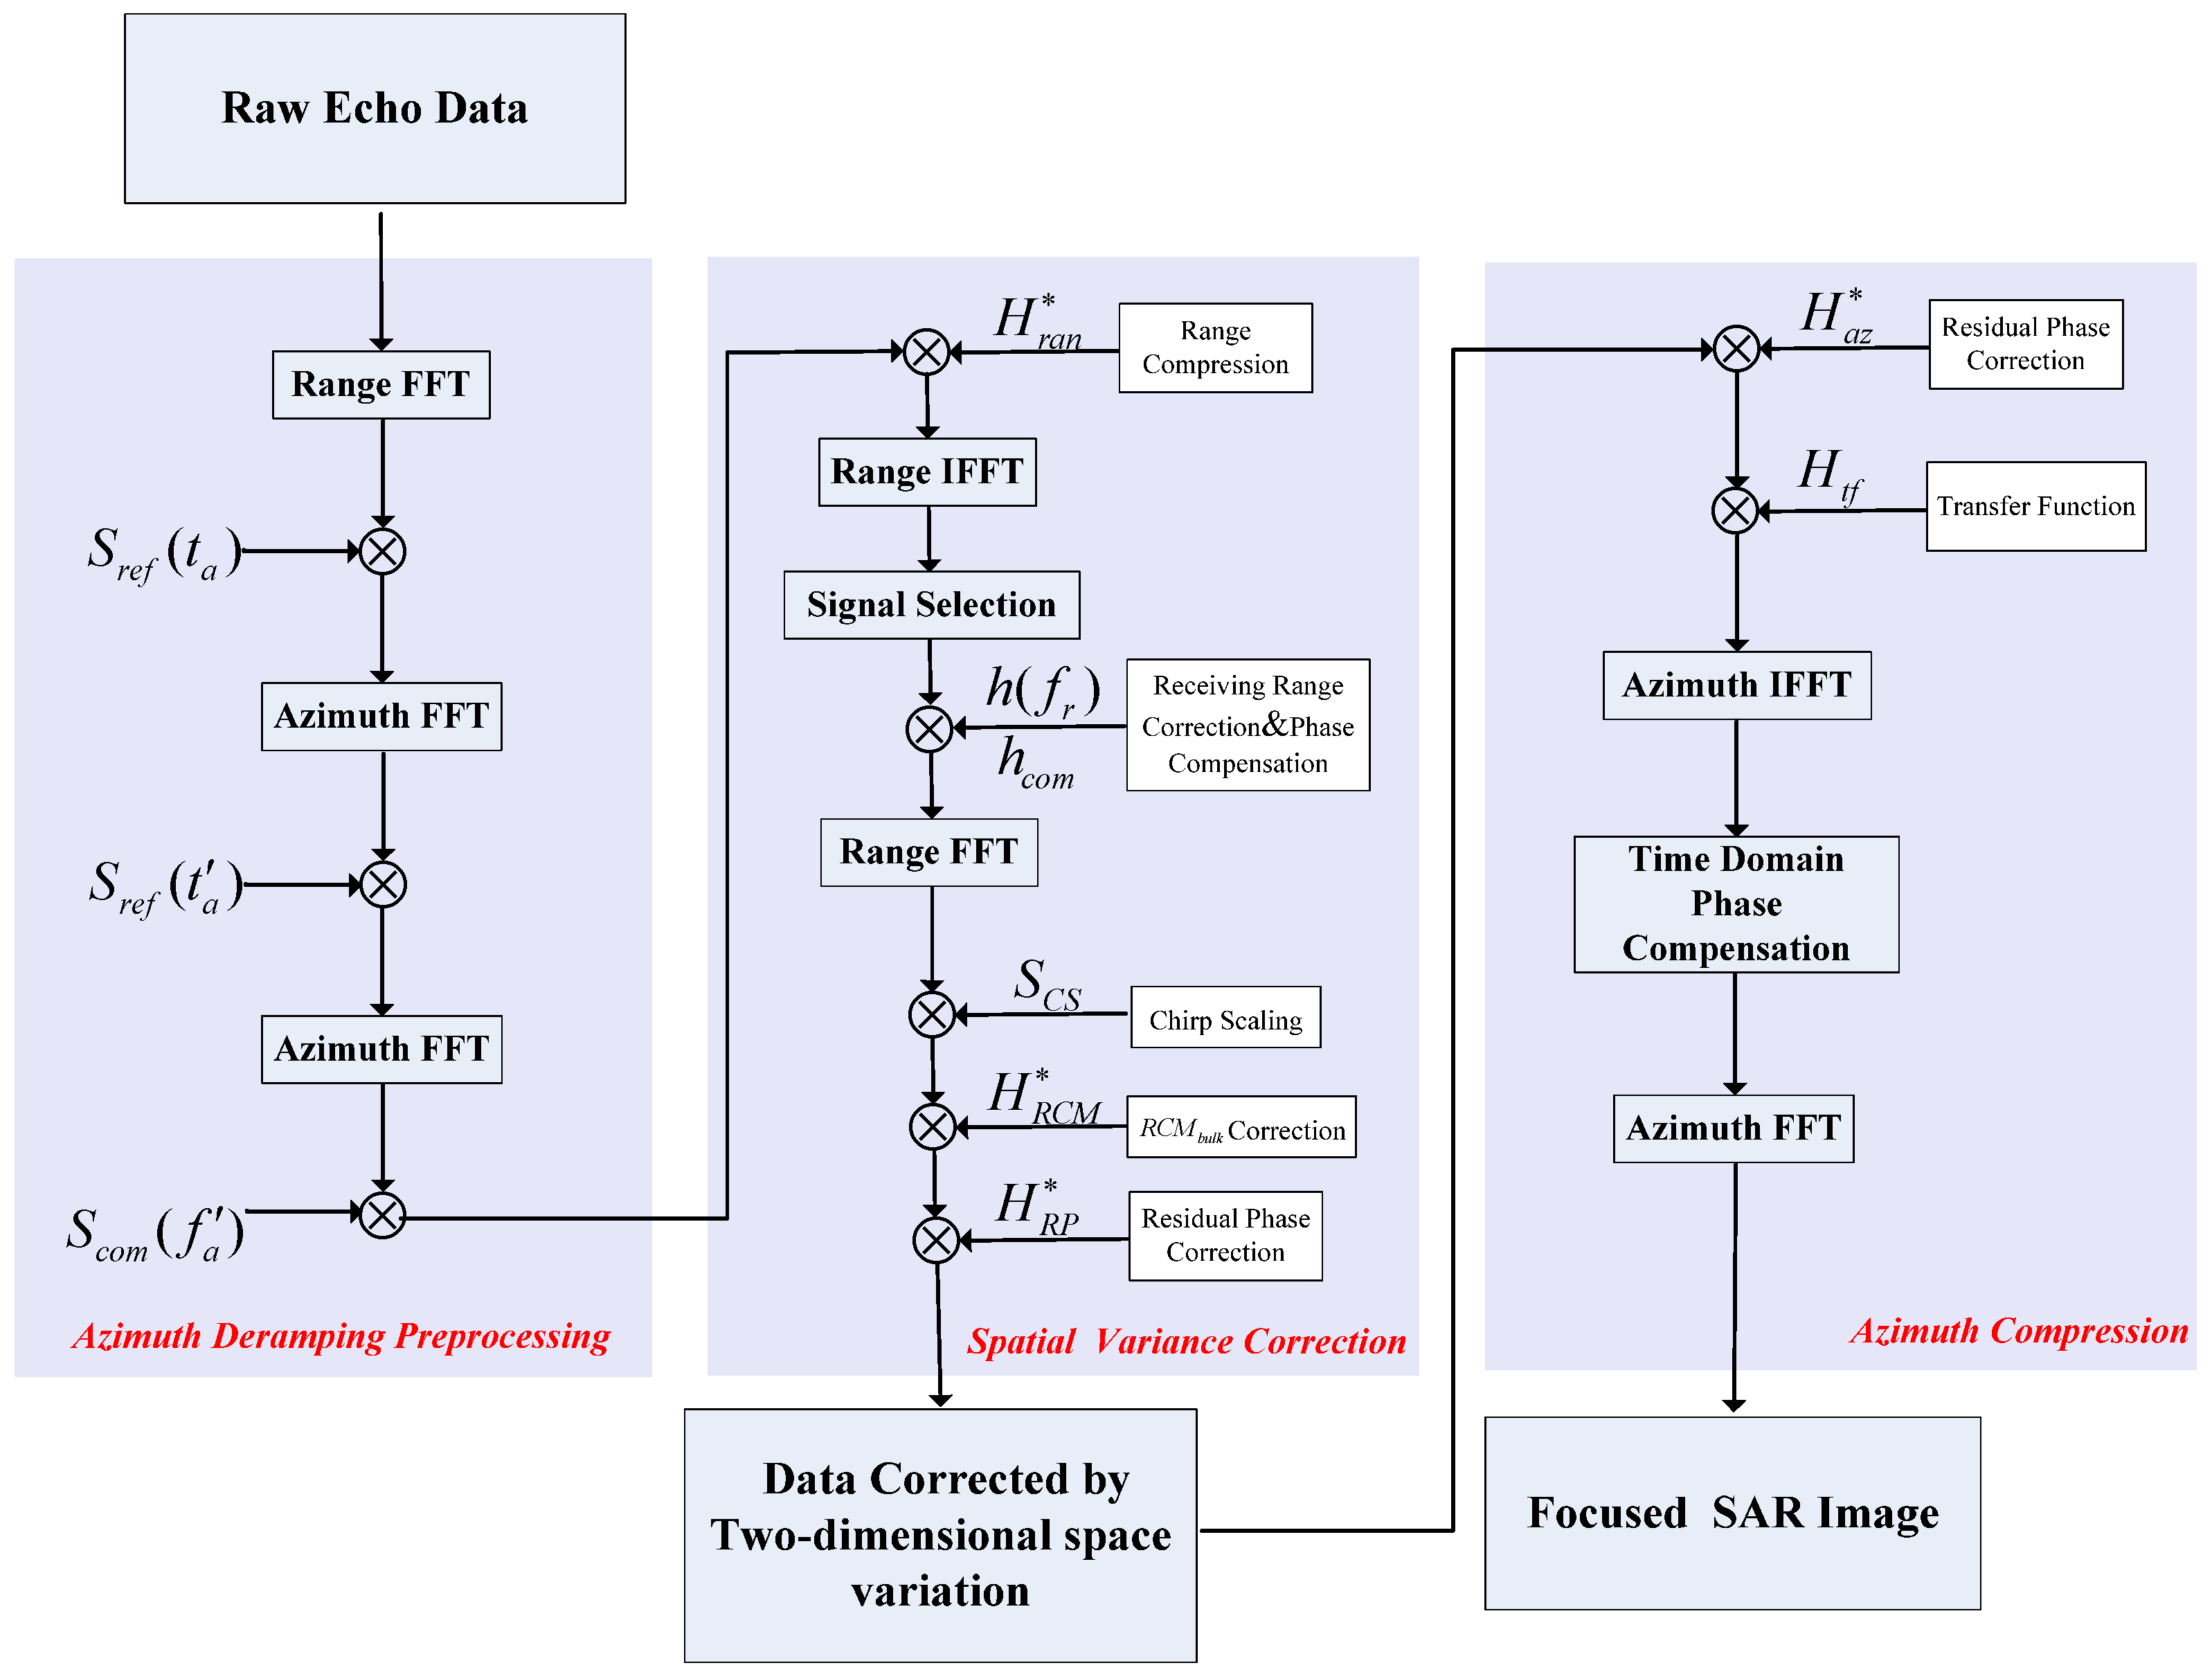
In order to illustrate the entire imaging process more clearly, we give a flowchart in Figure 6. Several key processing modules are marked with purple, block diagrams, such as azimuth deramping preprocessing, two-dimensional spatial correction, and azimuth compression.
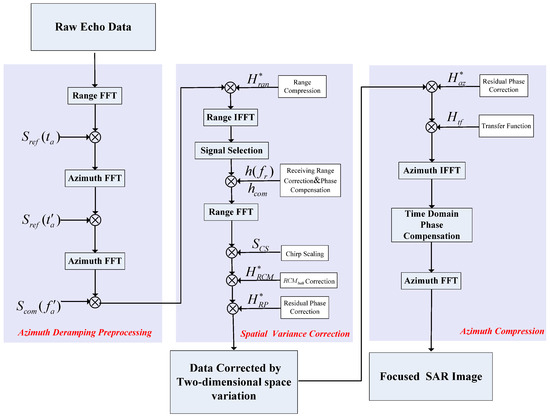
Figure 6.
Processing flowchart for GEO SG-BiSAR imaging.
The GEO SG-BiSAR imaging method mainly includes three steps.
- STEP 1. The azimuth deramping preprocessing is used to deal with the azimuth aliasing of the GEO SG-BiSAR raw echoes.
- STEP 2. The spatial variability correction strategy is proposed to solve the azimuth and range spatial variability of GEO SG-BiSAR in the RD domain.
- STEP 3. Based on the SPECAN operation, the azimuth compression is completed to obtain the final SAR image in azimuth frequency domain.
6. Experiment Results and Analysis
6.1. Imaging Results and Analysis of GEO SG-BiSAR Simulation Data
In this section, we will complete the imaging of the GEO SG-BiSAR simulation data by the modified CS imaging method. The simulation parameters of the GEO SG-BiSAR are shown in Table 1.

Table 1.
Simulation parameters of GEO SG-BiSAR system.
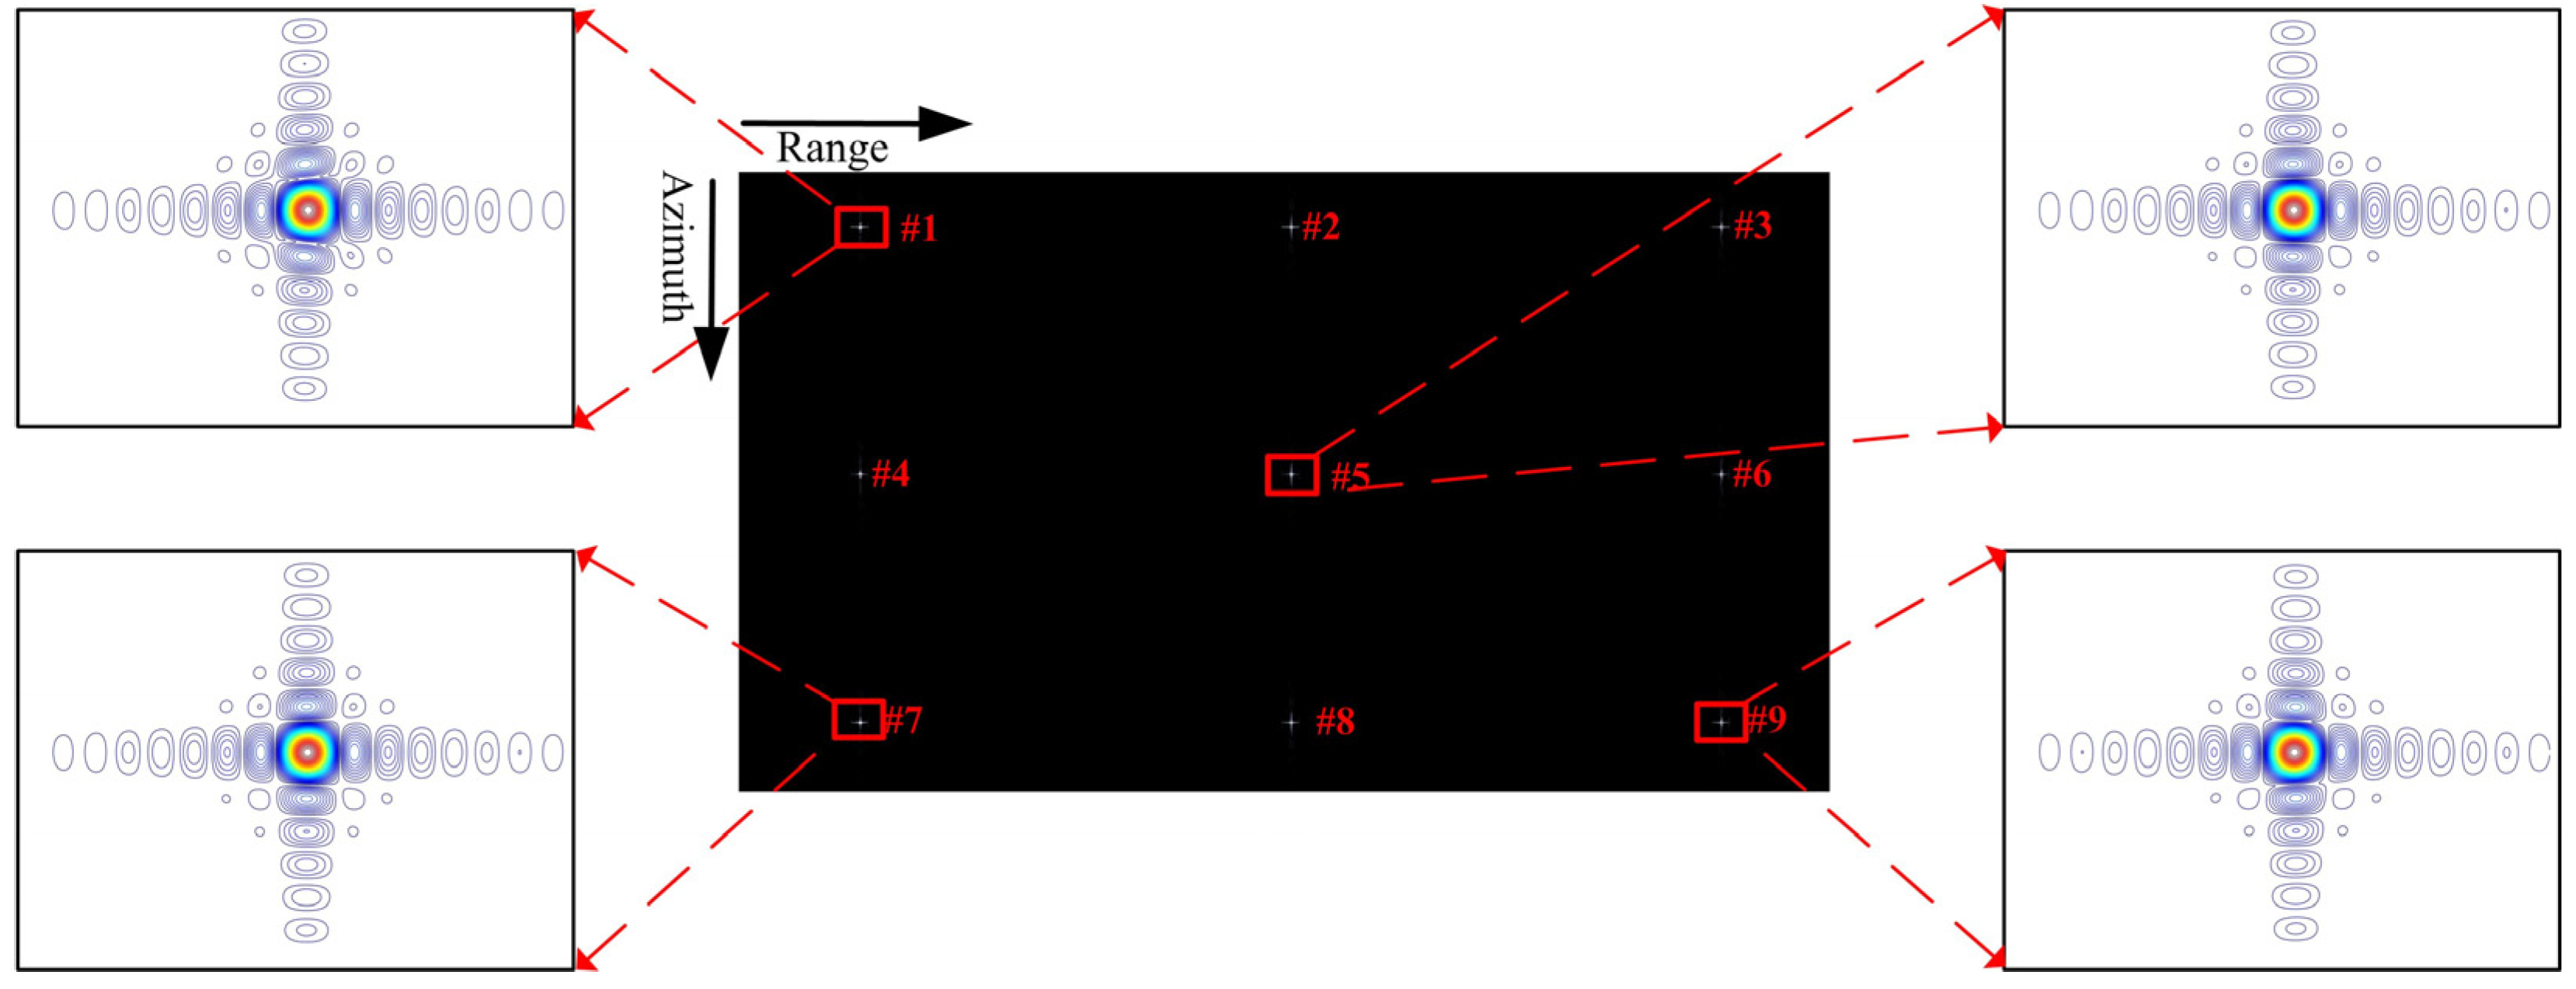
As shown in Figure 3, we set 3 3 points in the illuminated scene of 5 km (in azimuth) 5 km (in range). And, based on the processing steps in Section 5.3, we obtained the processing results of the GEO SG-BiSAR simulation data.
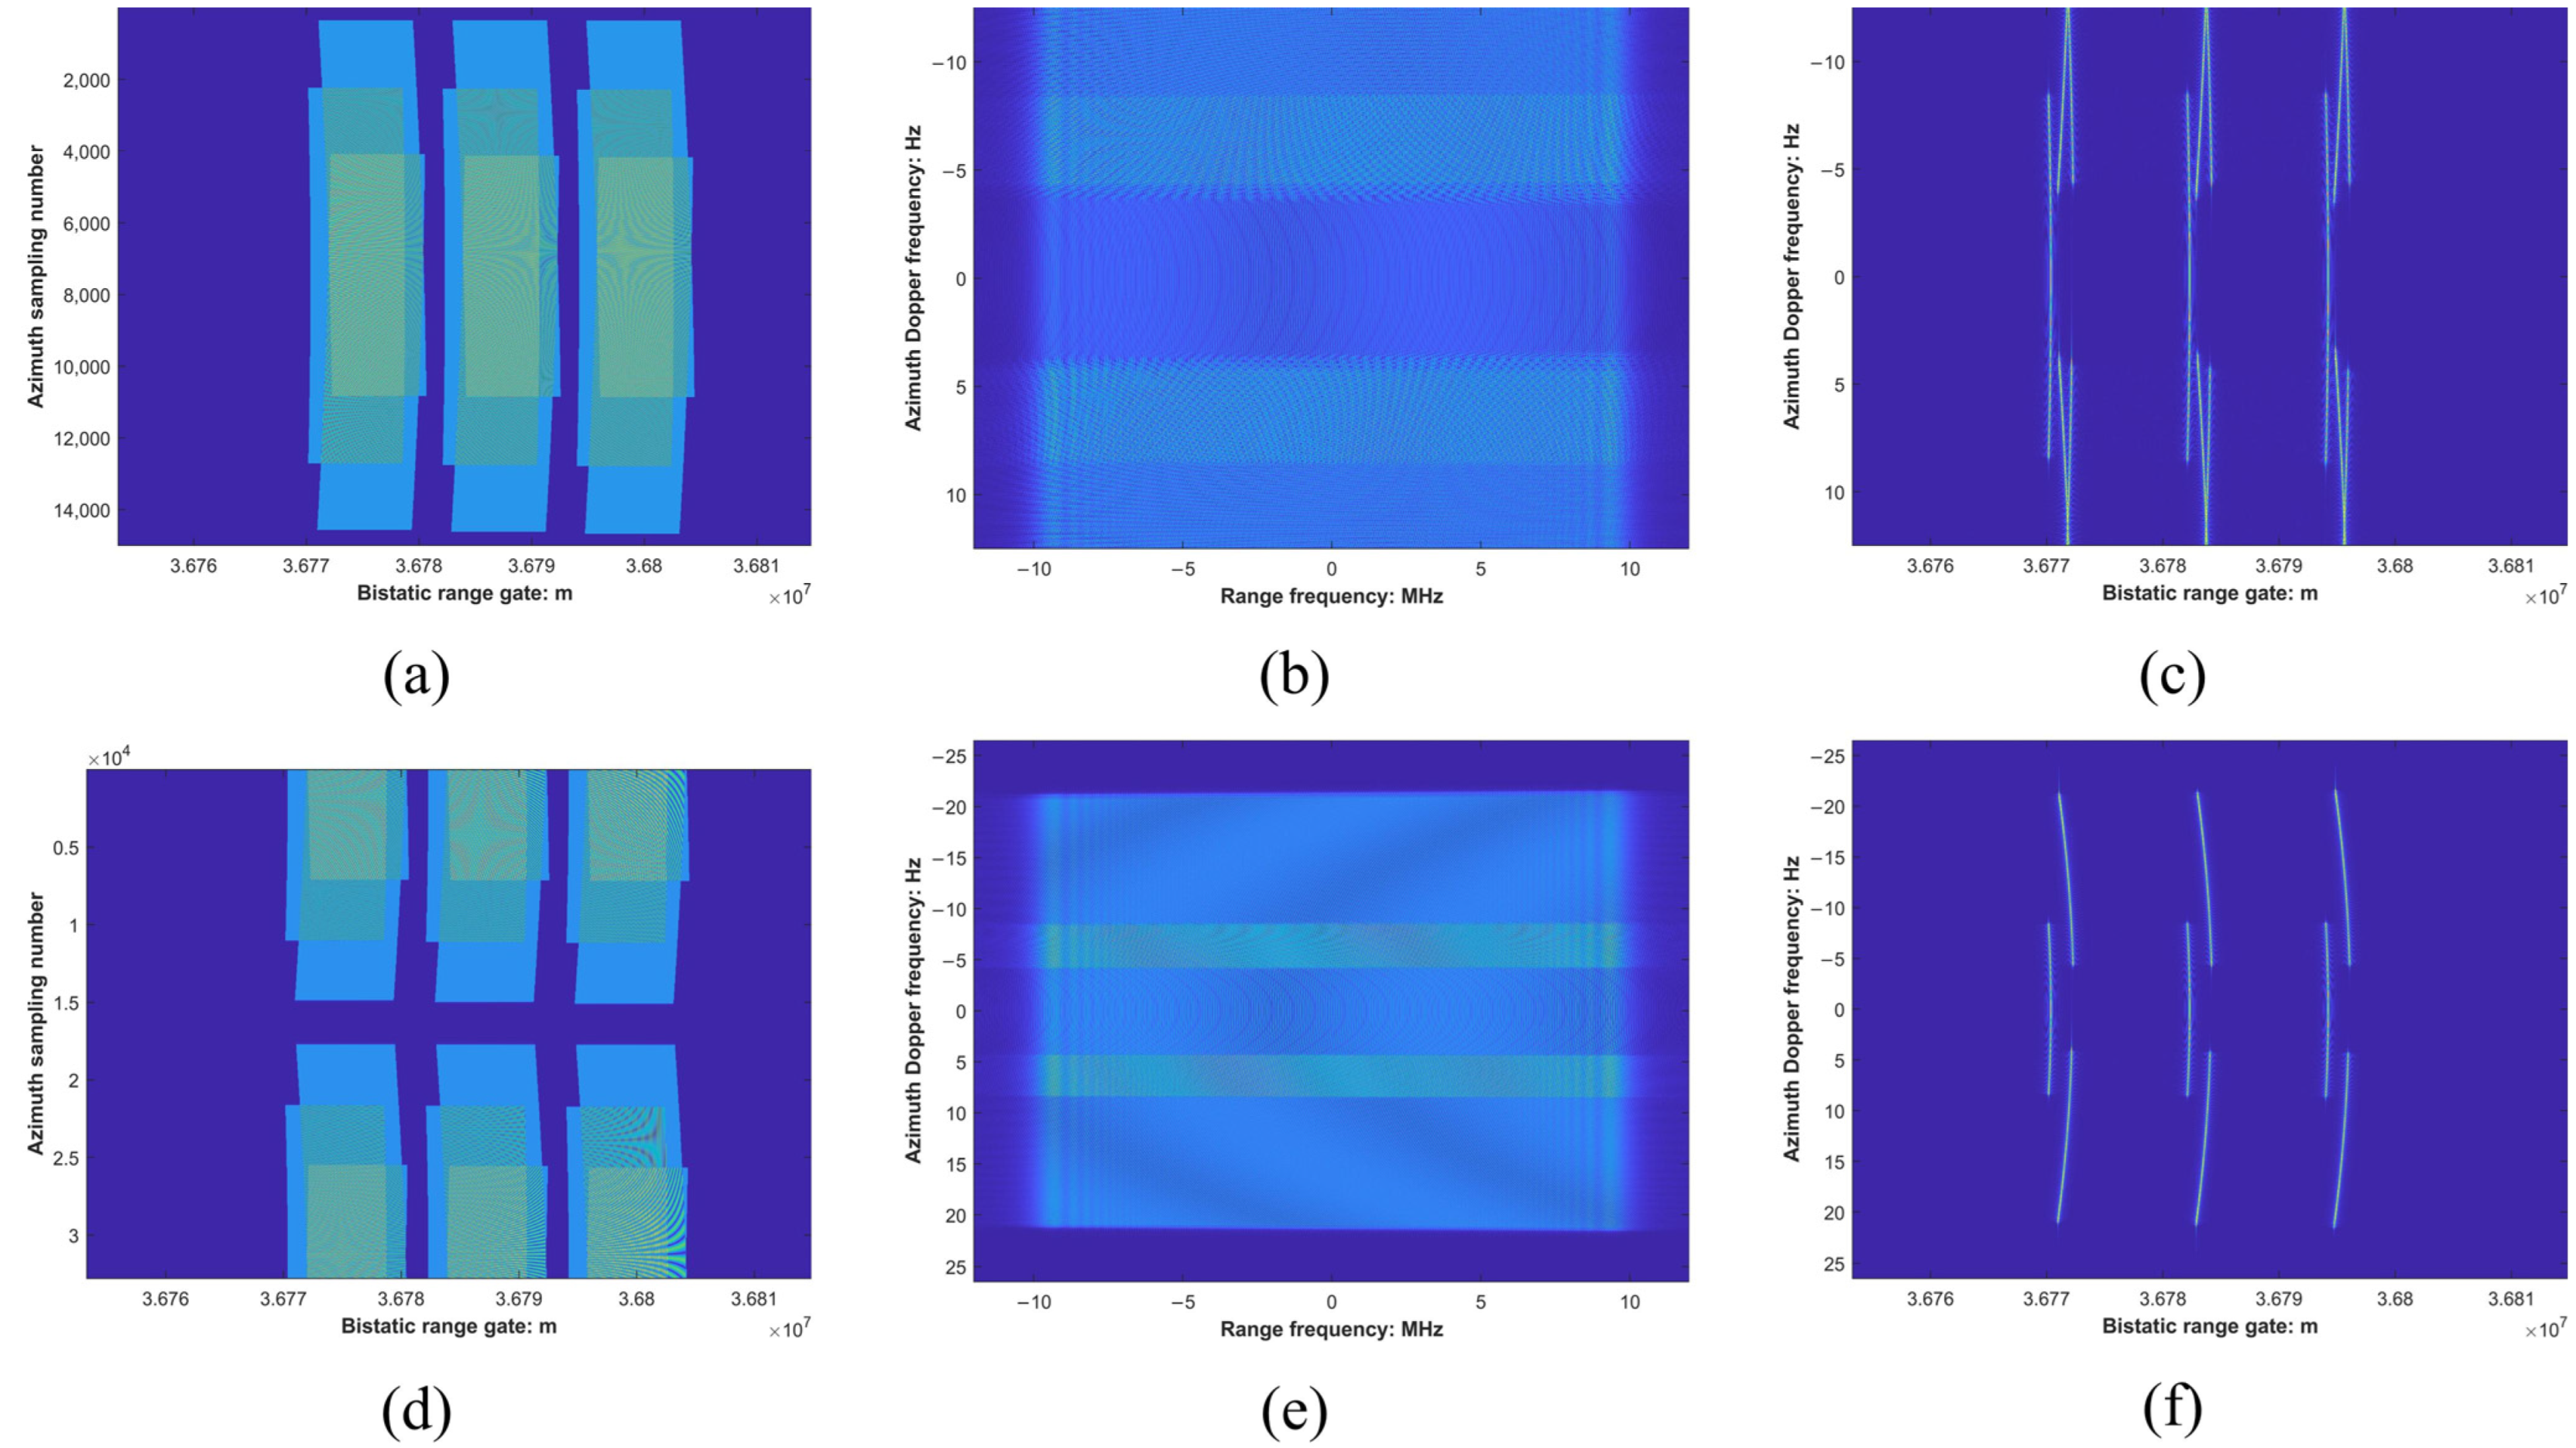
Figure 7a–c and Figure 7d,e are the signals before and after azimuth deramping preprocessing, respectively. Figure 7a is the raw echo data of GEO SG-BiSAR. Figure 7b is the echo signal in the RD domain. Due to the low pulse repetition frequency, the azimuth spectrum of signal is aliasing. Figure 7c is the signal after range compression. Figure 7d is the azimuth deramping preprocessed signal in the time domain. Figure 7e is the azimuth deramping preprocessed signal in the RD domain. According to Figure 7d,e, it can be seen that the azimuth deramping preprocessed signal was aliasing in the azimuth time domain and not in the azimuth frequency domain. Therefore, we had to combine the SPECAN operation to obtain the focused SAR image in the azimuth frequency domain, as detailed in Section 5.2. Figure 7f is the range compressed result of the azimuth deramping preprocessed signal.
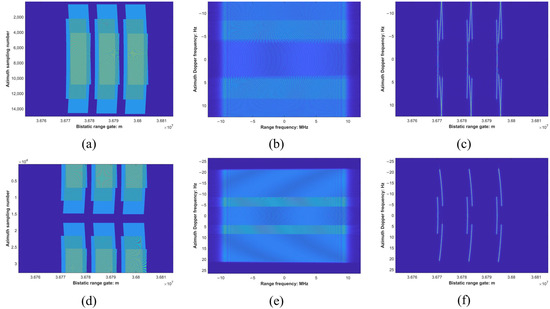
Figure 7.
Signals before and after azimuth deramping preprocessing. (a) Raw echo data. (b) Echo signal in the RD domain. (c) Signal after range compression. (d) Azimuth deramping preprocessed signal in time domain. (e) Azimuth deramping preprocessed signal in RD domain. (f) The range compression result of the azimuth deramping preprocessed signal.
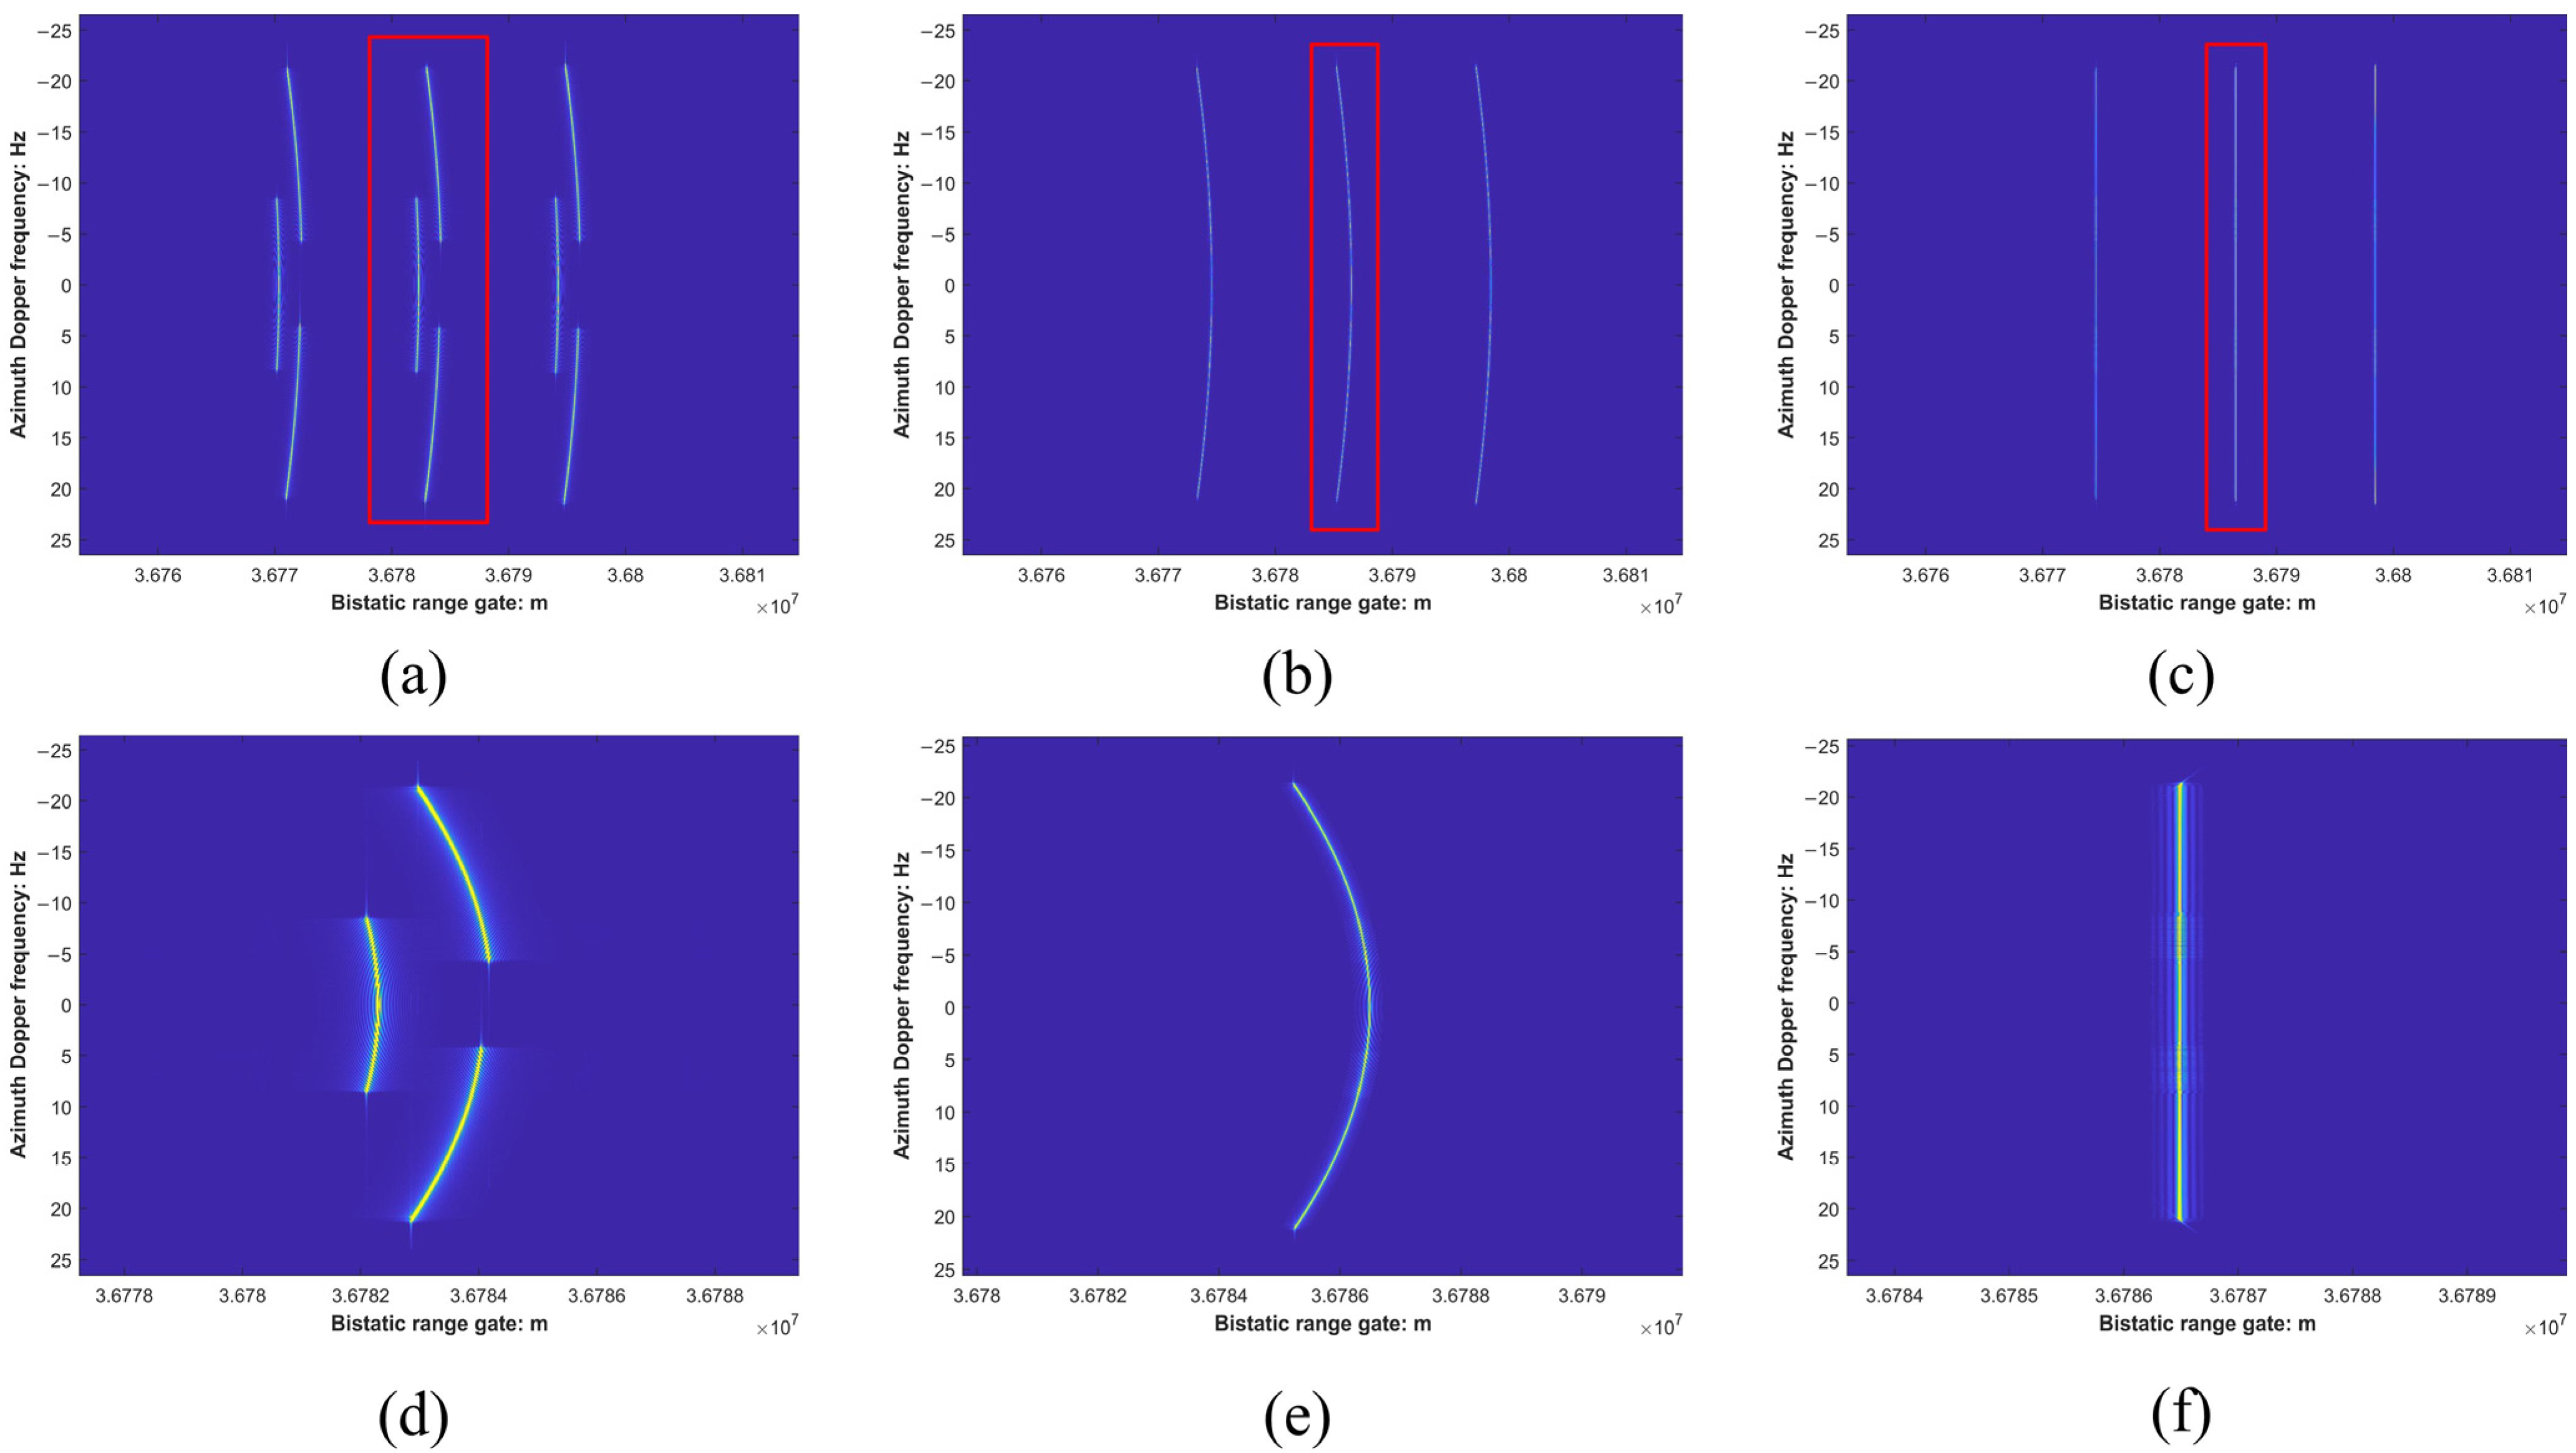
Figure 8a–c are the two-dimensional spatial correction results of the azimuth preprocessed signal. Figure 8d–f are the magnified results of the red, block diagrams in Figure 8a–c, respectively, which allowed us to observe clearly the signal migration changes. Consistent with Figure 7f, Figure 8a is the range compression result of the azimuth deramping preprocessed signal. Figure 8b is the signal after the range spatial variation correction, where targets with the same minimum slant range were constrained within the same range migration curve. Figure 8c is the signal after the range spatial variation correction, where the range migration curve of signal was straight in the RD domain. Finally, we obtained the focused SAR image by the azimuth compression processing, as shown in Figure 9.
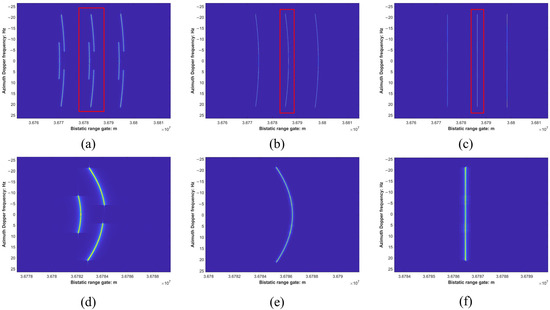
Figure 8.
The two-dimensional spatial correction results of the azimuth preprocessed signal. (a) The range compression result of the azimuth preprocessed signal. (b) Signal after azimuth spatial variation correction. (c) Signal after range spatial variation correction. (d) The enlarged result of the red, block diagram in (a). (e) The enlarged result of the red, block diagram in (b). (f) The enlarged result of the red, block diagram in (c).
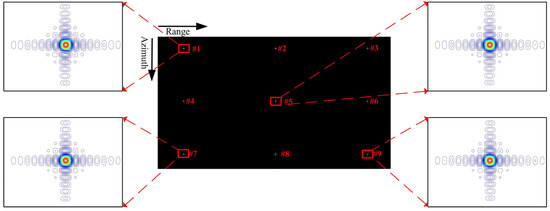
Figure 9.
SAR imaging result of the GEO SG-BiSAR simulation data.
The theoretical resolution of the point target is (azimuth range). The imaging performance of the nine targets is shown in Table 2. PSLR means the peak–sidelobe ratio. ISLR means the integral–sidelobe ratio. From the processing results of Figure 9 and Table 2, we can see that the focused result of the GEO SG-BiSAR simulation data was close to the theoretical value, which verifies the correctness of the proposed SAR imaging method of GEO SG-BiSAR.

Table 2.
Point target imaging performance of GEO SG-BiSAR simulation data.
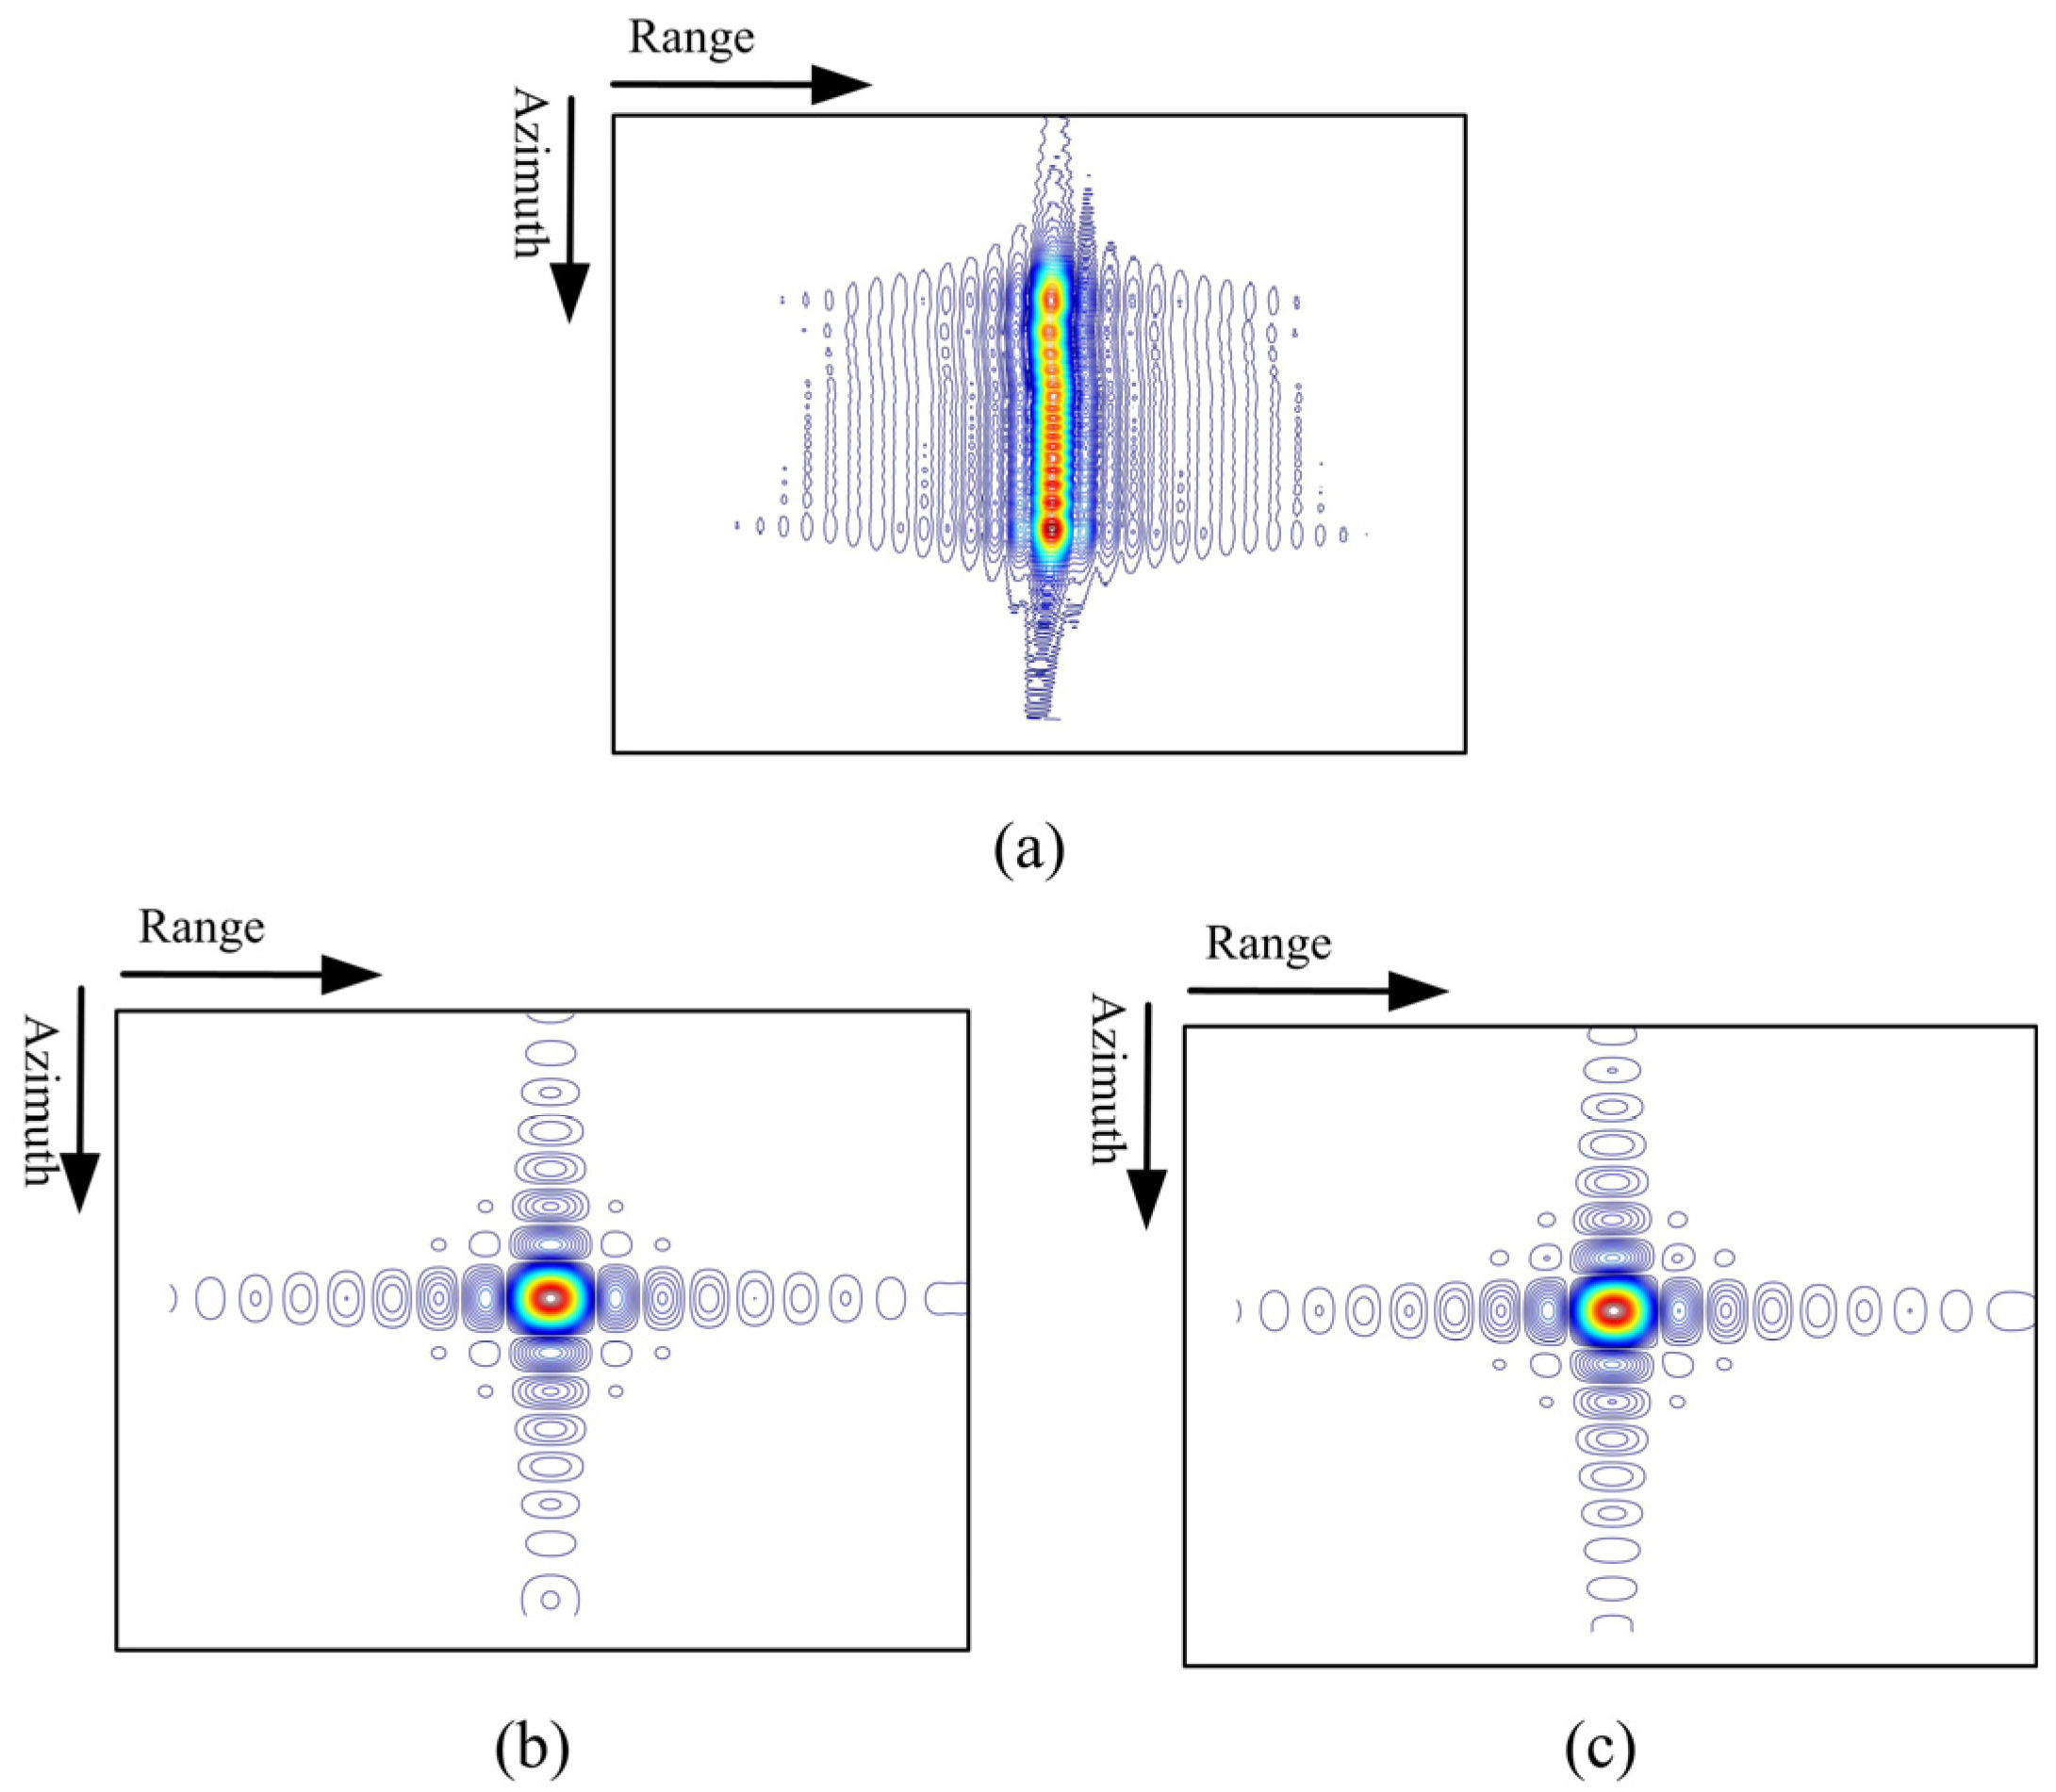
Furthermore, we compared the imaging results of traditional bistatic NLCS method [24], back projection (BP) imaging method, and the proposed processing method using point target 5 as an example, as is shown in Figure 10. From Figure 10a, it can be seen that the NLCS method could not be used for the GEO SG-BiSAR imaging. In Section 3, the azimuth deramping preprocessed signal was aliasing in the azimuth time domain, while the NLCS method was suitable for the case that the signal was not aliasing in both the time and frequency domains. It is known that BP does not rely on the range approximation assumption and can be employed with an arbitrary orbit. By comparing the focused results shown in Figure 10b,c, the focused point obtained by the proposed method was consistent with that of the BP method.
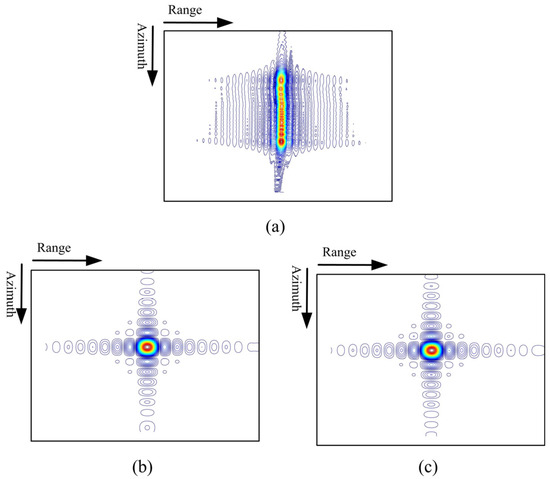
Figure 10.
Comparison of imaging results obtained by traditional NLCS, BP, and the proposed method. (a) Imaging result of NLCS method. (b) Imaging result of BP method. (c) Imaging result of our proposed method.
6.2. Imaging Results and Analysis of Beidou Navigation Satellite Measured Data
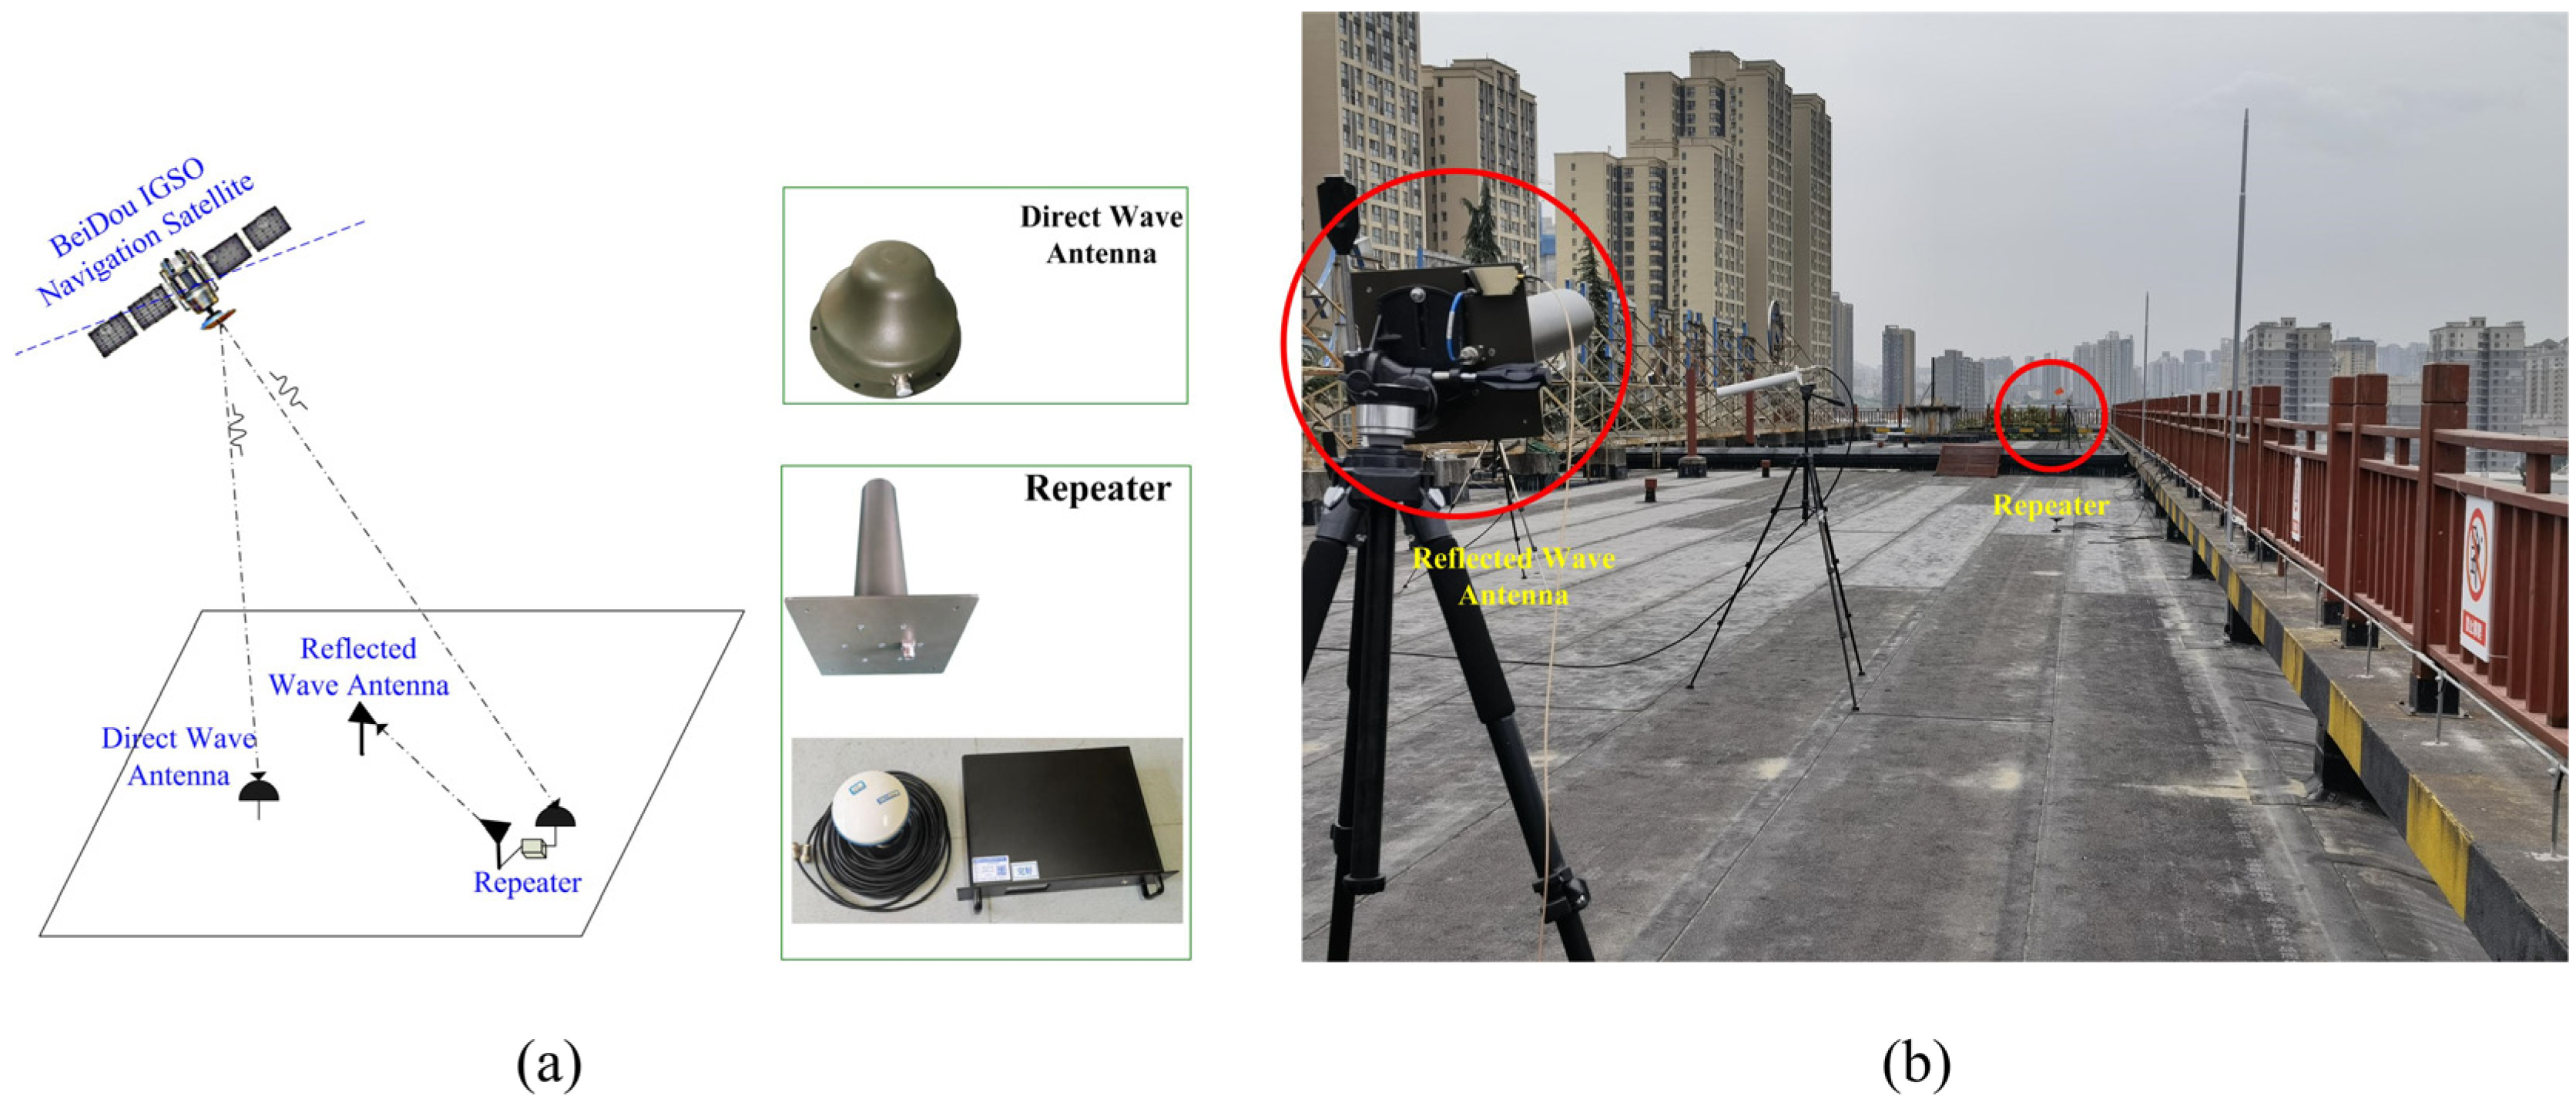
In order to further verify the feasibility of the novel SAR imaging method for the GEO SG-BiSAR system, the verification was executed by a satellite-to-ground bistatic configuration, which was composed of the Beidou-3 inclined geosynchronous orbit (IGSO) navigation satellite and the ground-stationary receiver. The publicly available service signal of the Beidou-3 navigation satellite is the B3I signal, which is composed of a “ranging code + data code”. The transmission signal adopts the binary phase shift keying (BPSK) modulation mode with the bandwidth of 20.46 MHz [25]. In our experiment, we found that the Beidou navigation signal strength on Earth’s surface is very small, about −163 dBW [26]. Therefore, the ground reflected signal was too weak to perform imaging processing. To achieve the SAR imaging of the Beidou navigation signal, we placed an active repeater in the experiment field to purify and amplify the ground direct wave signal and then transmit it to the reflected wave receiving antenna. The repeater can be equivalent to a strong scattering point for ground imaging and resolution evaluation. The main parameters of the GEO SG-BiSAR navigation satellite experiment are shown in Table 3. The geometry configuration and optical photos of the navigation experiment are shown in Figure 11.

Table 3.
GEO SG-BiSAR navigation satellite experimental parameters.
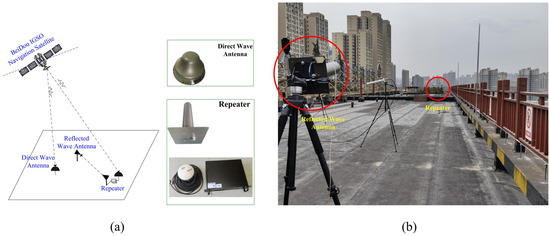
Figure 11.
GEO SG-BiSAR navigation satellite experiment. (a) Experimental geometry configuration. (b) Optical photos of roof experiment field.
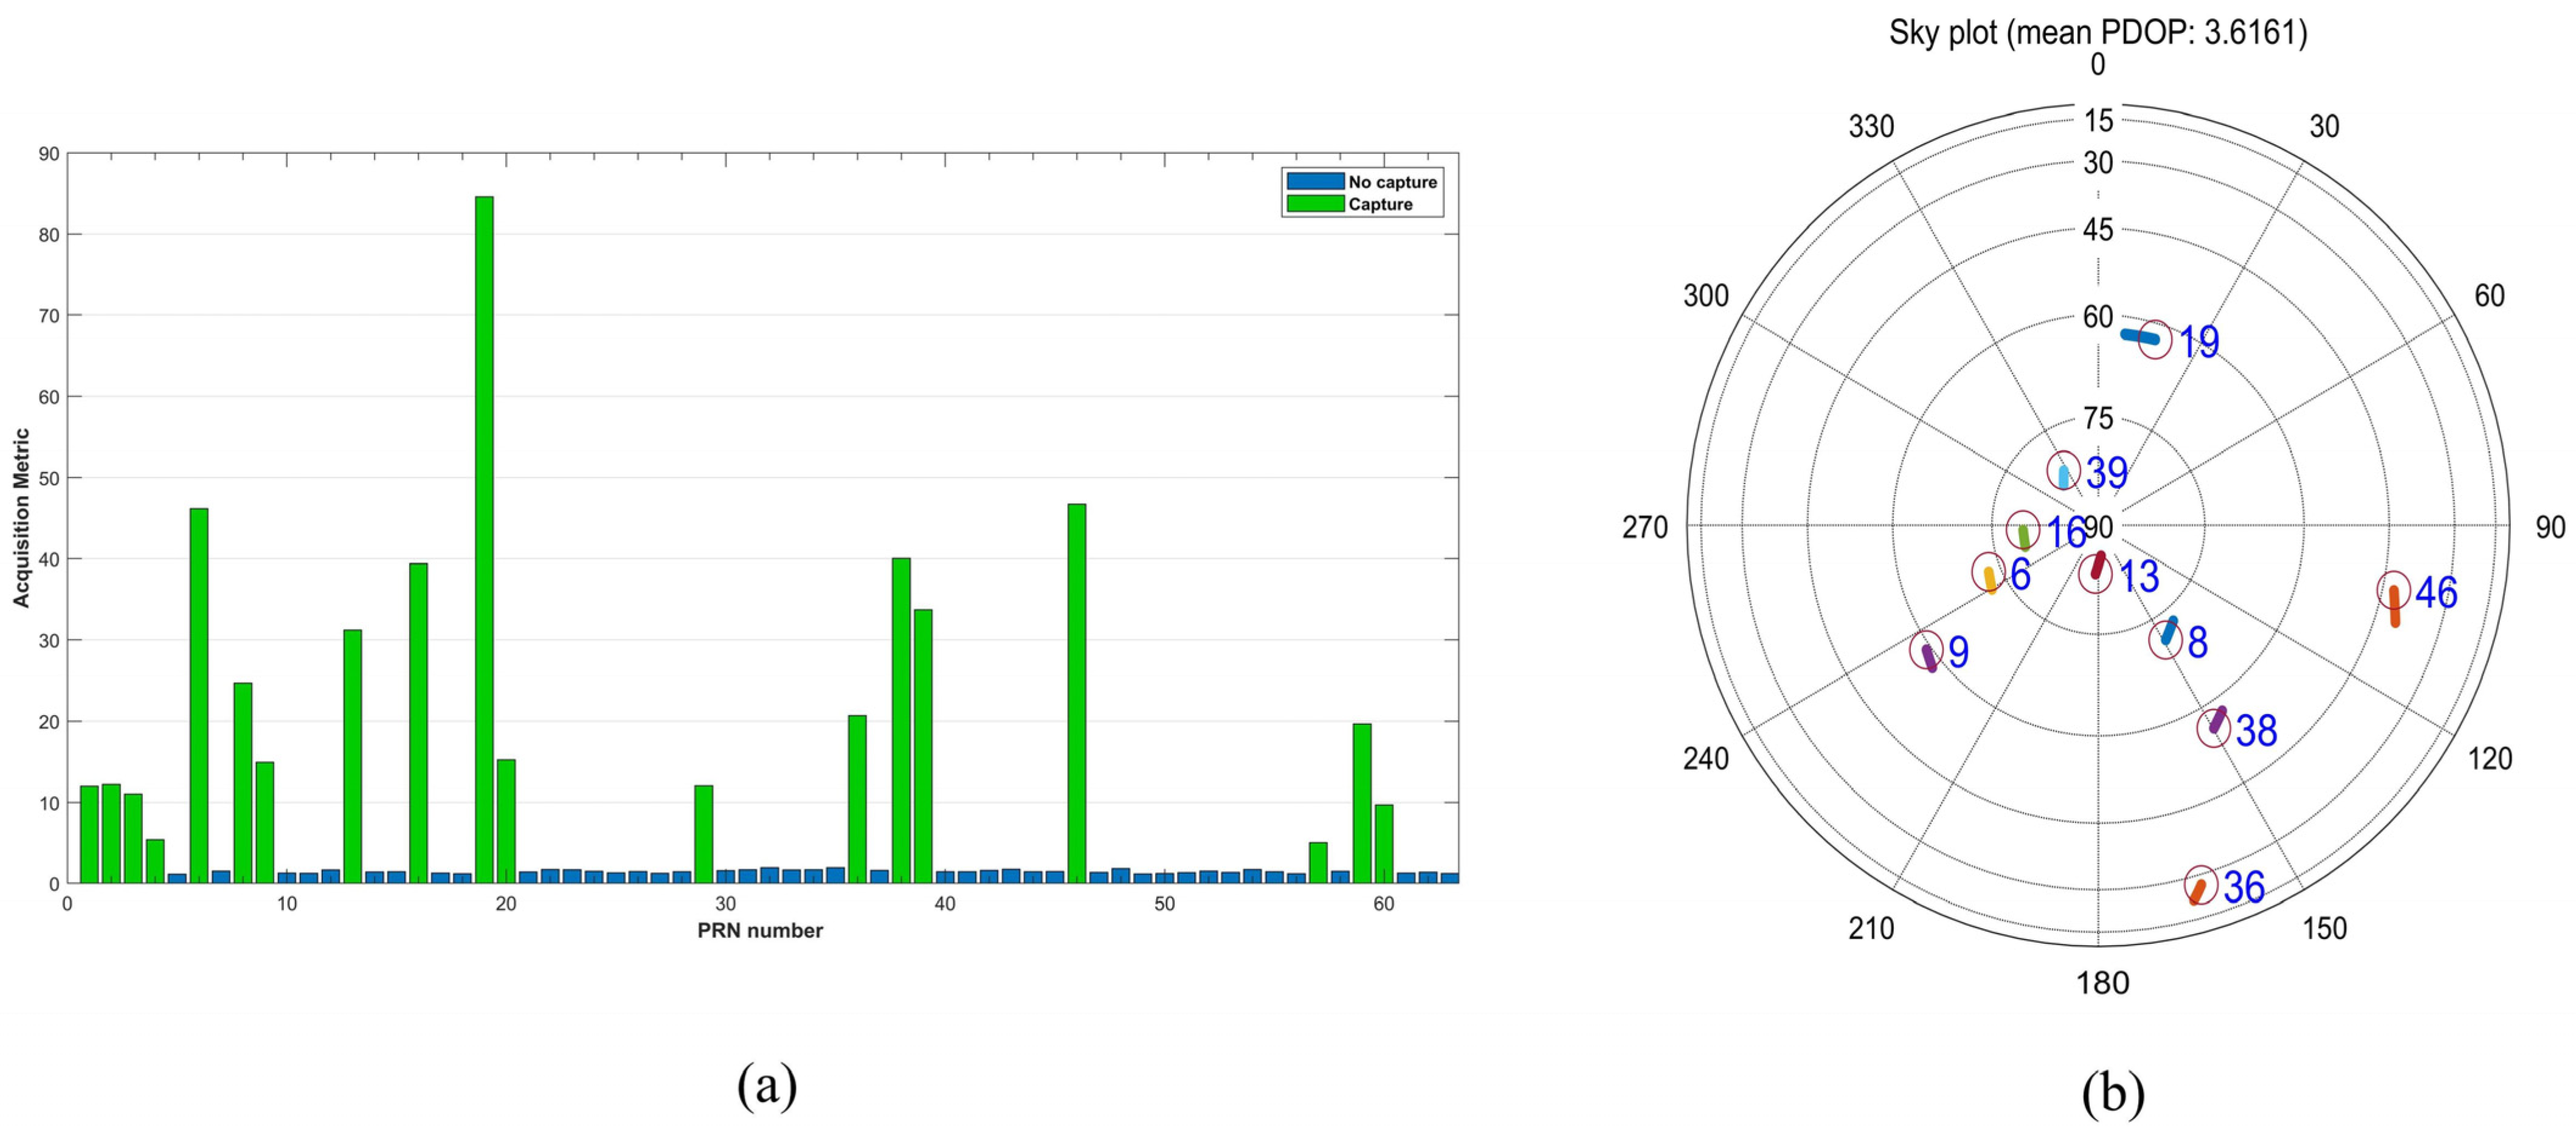
The ephemeris and ionospheric parameters of the Beidou-3 IGSO navigation satellite are broadcasted in the navigation message. Therefore, we needed to preprocess the navigation signal to obtain these parameters. Preprocessing includes three steps: capture, tracking, and decoding localization. Figure 12a is the capture results of the GEO SG-BiSAR navigation satellite. As shown in Figure 12a, the captured IGSO navigation satellite numbers (PRN) are 6, 8, 9, 13, 16, 38, and 39. Figure 12b is the sky plot of visible satellites during the experiment. According to the sky plot, IGSO satellites numbered 6, 9, and 16 are located in the southwest direction of the experiment field and satellites numbered 8, 13, and 38 are located in the southeast direction. Considering the signal-to-noise ratio of the IGSO navigation satellite signal, we adopted the satellite numbered 13 to analyze the imaging results of the GEO SG-BiSAR navigation satellite experiment.
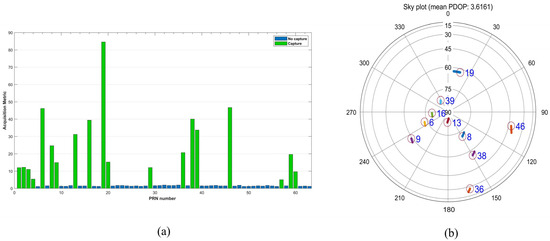
Figure 12.
Preprocessing results of the GEO SG-BiSAR navigation satellite experiment. (a) Capture result of the GEO SG-BiSAR navigation satellite. (b) Sky plot of the GEO SG-BiSAR navigation satellite.
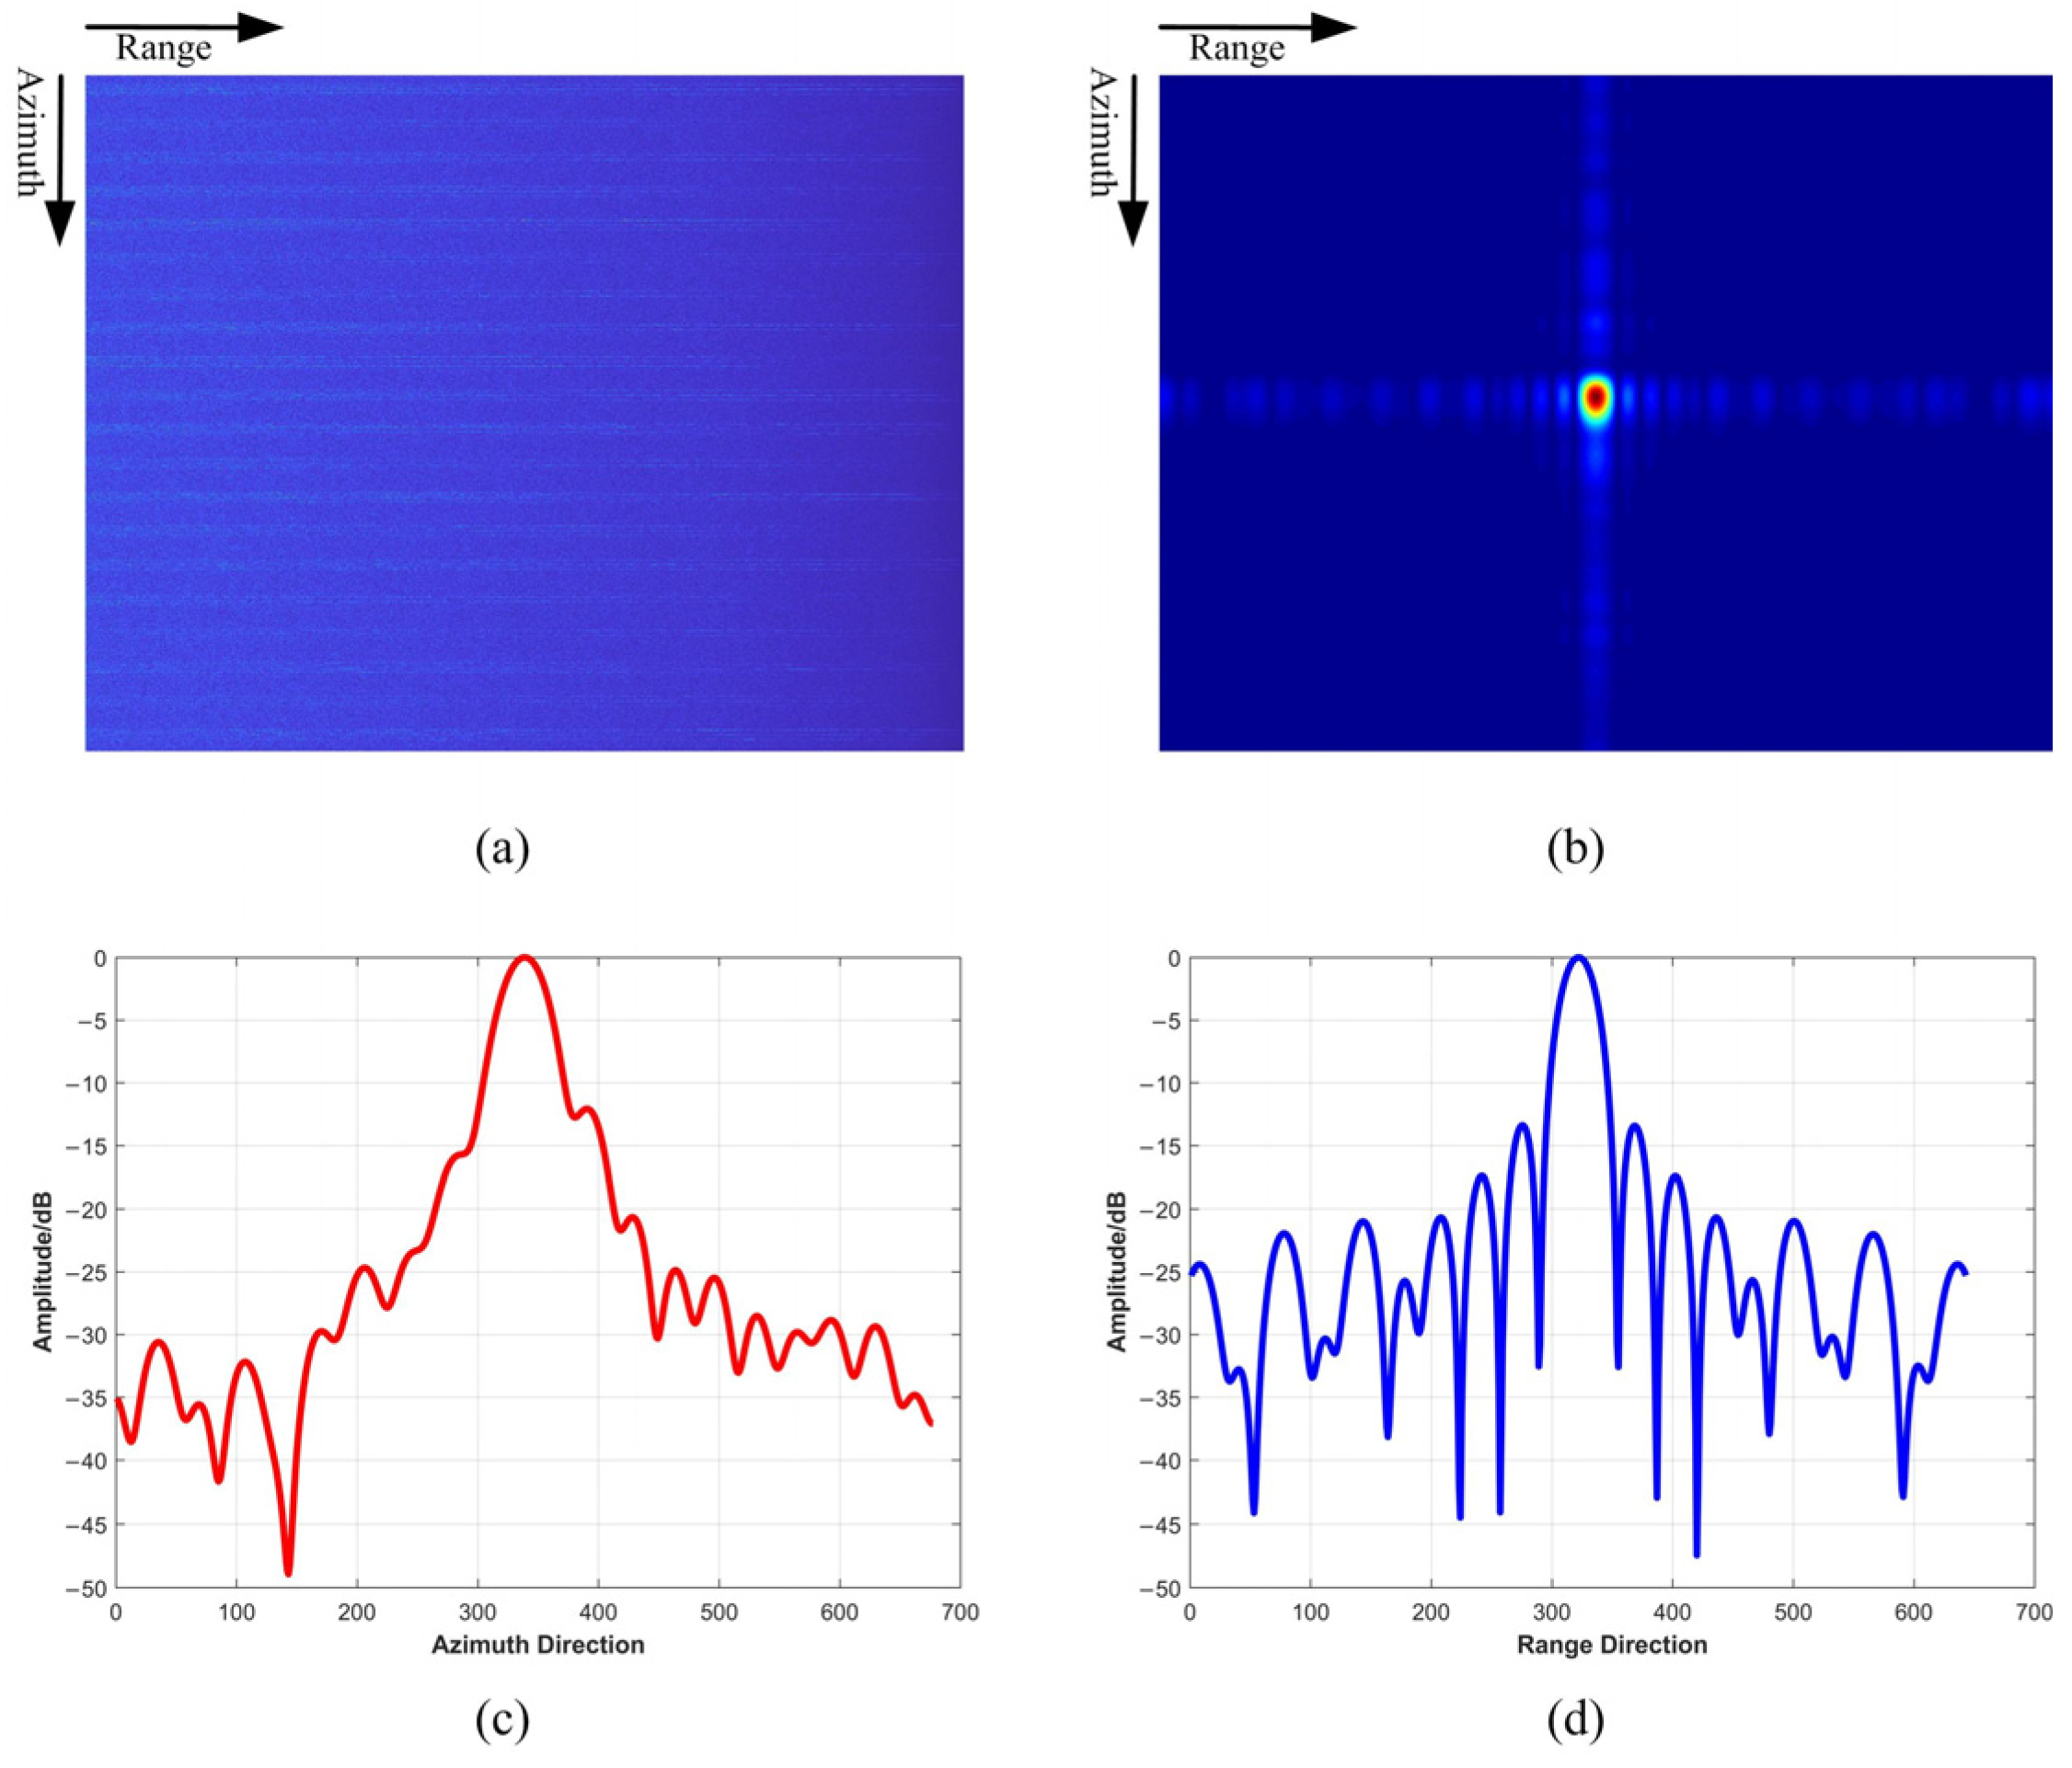
The navigation signal is a continuous wave signal, which is different from the traditional linear frequency modulated (LFM) pulse radar. Before the SAR imaging, we divided the continuous navigation signal into the two-dimensional time-domain SAR signal according to the B3I signal characteristic, as shown in Figure 13a. After completing time, space, and frequency synchronization [27], we could obtain the focused SAR image by using the imaging method proposed in this article, as shown in Figure 13b. Figure 13c,d are the pulse response of a strong scattering point in the azimuth and range directions, respectively. It can be seen that the two-dimensional compression results were both approximate to the sinc shape. The imaging performance of the strong scattering point was compared with the theoretical resolution, as shown in Table 4. According to the broadening ratio of resolution in the azimuth and range directions, we found that the processing result of the measured data was closer to the theoretical value. The theoretical value of the azimuth and range resolutions were calculated:
where represents the transmission signal wavelength, is the synthesis angular of the scene central target within the synthetic aperture time, and is the transmission signal bandwidth.
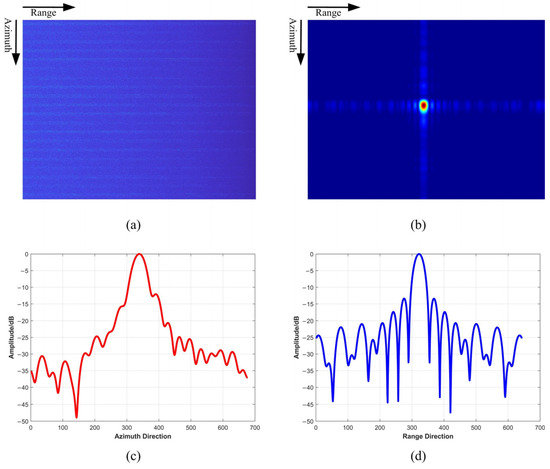
Figure 13.
Imaging results of the GEO SG-BiSAR navigation satellite experiment. (a) Two-dimensional time-domain SAR signal. (b) The focused image of the repeater signal. (c) Azimuth pulse response of strong scattering point in (b). (d) Range pulse response of strong scattering point in (b).

Table 4.
Imaging performance of the GEO SG-BiSAR navigation satellite experiment.
The main reason for the errors’ existence is the non-precision satellite orbit data and the certain hardware delay, which could not be accurately corrected. The imaging result of the navigation satellite experiment further verified the correctness of the proposed SAR imaging method of GEO SG-BiSAR.
7. Conclusions
Through the investigation of the GEO SG-BiSAR system in this paper, we found the echo signals of GEO SG-BiSAR have severe azimuth spectrum aliasing and 2-D spatial variability problems. In order to obtain the focused SAR image, we proposed a novel SAR imaging method. Firstly, the deramping preprocessing was executed to deal with the azimuth spectrum aliasing problem of the GEO SG-BiSAR echoes. Secondly, based on the azimuth spatial variability characteristic of GEO SG-BiSAR signals in the RD domain, we proposed an azimuth spatial variability correction strategy. Thirdly, the traditional CS function was modified to deal with the range spatial variability problem. Finally, the two-dimensional spectrum of GEO SG-BiSAR with modified CS processing was derived. Due to the fact that the deramping preprocessed signal was aliasing in the time domain, we obtained the focused SAR image in the azimuth frequency domain by the SPECAN operation. In addition, we give the SAR imaging processing flowchart of the GEO SG-BiSAR system, which clearly and intuitively illustrates three main components of GEO SG-BiSAR imaging processing: deramping preprocessing, two-dimensional spatial correction processing, and azimuth compression processing. The processing results of simulated data showed that the proposed method can focus SAR images as well as the BP imaging algorithm. The processing results of the Beidou navigation satellite measured data further validated the effectiveness of the proposed method.
Author Contributions
Conceptualization, J.X.; Methodology, J.T., Z.S. and J.X.; Validation, J.T. and Y.L.; Formal analysis, Y.L.; Investigation, J.T.; Data curation, B.Z.; Writing—original draft, J.T.; Writing—review & editing, Z.S. and Y.L.; Supervision, B.Z.; Project administration, Z.S. and B.Z. All authors have read and agreed to the published version of the manuscript.
Funding
This research received no external funding.
Data Availability Statement
No new data were created or analyzed in this study. Data sharing is not applicable to this article.
Conflicts of Interest
The authors declare no conflict of interest.
Appendix A
In this appendix, we will introduce the series inversion method: if a function can be represented by a series without constant term, such as:
its inverse function can also be expressed in the following series form
Combining (A1) and (A2), we obtain:
Then, we have:
More expressions for the expansion term can be obtained from references [28,29]. In the GEO SG-BiSAR system, we assume that , so the coefficient solution formulas are as follows:
If the partial derivatives of at the central moment are , , , , , etc., then
Appendix B
In this appendix, we will introduce the Newton iteration method: we assume that the position and velocity of the GEO transmitter are and , and are the position and velocity of ground receiver, and is the position of the target, so the slant range between the GEO transmitter and target is
In addition, the slant range between the ground receiver and target is:
The Range Doppler positioning equations of the GEO SG-BiSAR system are transformed into the following functional form:
When , , and is the zero of , the first two Taylor expansions of can be approximated as:
According to Newton’s iterative method, if (A16) is set to 0, is a new approximate zero of . The iterative formula can be obtained:
where is the Jacobian matrix, , and the elements in this matrix are as follows:
Substituting (A18)–(A22) into (A17), we can calculate the new zero. Next, we repeat the above iterative steps until in smaller than the set iteration accuracy (such as ).
References
- Tomiyasu, K.; Pacelli, J.L. Synthetic aperture radar imaging from an inclined geosynchronous orbit. IEEE Trans. Geosci. Remote Sens. 1983, 3, 324–329. [Google Scholar] [CrossRef]
- Available online: https://spacenews.com/china-launches-first-geosynchronous-orbit-radar-satellite/ (accessed on 20 June 2024).
- Madsen, S.N.; Edelstein, W.; DiDomenico, L.D.; LaBrecque, J. A geosynchronous synthetic aperture radar; for tectonic mapping, disaster management and measurements of vegetation and soil moisture. In Proceedings of the IEEE 2001 International Geoscience and Remote Sensing Symposium (Cat. No. 01CH37217), Sydney, NSW, Australia, 9–13 July 2001; pp. 447–449. [Google Scholar]
- Sun, G.; Xing, M.; Wang, Y.; Yang, J.; Bao, Z. A 2-D Space-Variant Chirp Scaling Algorithm Based on the RCM Equalization and Subband Synthesis to Process Geosynchronous SAR Data. IEEE Trans. Geosci. Remote Sens. 2014, 52, 4868–4880. [Google Scholar]
- Munson, D.; O’Brien, J.; Jenkins, W. A tomographic formulation of spotlight-mode synthetic aperture radar. Proc. IEEE 1983, 71, 917–925. [Google Scholar] [CrossRef]
- Sanz-Marcos, J.; Mallorqui, J.; Broquetas, A. Bistatic parasitic SAR processor evaluation. In Proceedings of the 2004 IEEE International Geoscience and Remote Sensing Symposium, Anchorage, AK, USA, 20–24 September 2004; Volume 6, pp. 3666–3669. [Google Scholar]
- Zhang, H.; Tang, J.; Wang, R.; Deng, Y.; Wang, W.; Li, N. An accelerated backprojection algorithm for monostatic and bistatic SAR processing. Remote Sens. 2018, 10, 140. [Google Scholar] [CrossRef]
- Carrara, W.; Goodman, R.; Ricoy, M. New algorithms for widefield SAR image formation. In Proceedings of the 2004 IEEE Radar Conference (IEEE Cat. No. 04CH37509), Philadelphia, PA, USA, 29 April 2004; pp. 38–43. [Google Scholar]
- Lanari, R.; Tesauro, M.; Sansosti, E.; Fornaro, G. Spotlight SAR data focusing based on a two-step processing approach. IEEE Trans. Geosci. Remote Sens. 2001, 39, 1993–2004. [Google Scholar] [CrossRef]
- Pu, W.; Wu, J. OSRanP: A Novel Way for Radar Imaging Utilizing Joint Sparsity and Low-Rankness. IEEE Trans. Comput. Imag. 2020, 6, 868–882. [Google Scholar] [CrossRef]
- Sun, Z.; An, H.; Wu, J.; Yang, J. A Novel Unambiguous Imaging Method for Geosynchronous Spaceborne-Airborne Bistatic SAR. In Proceedings of the 2021 IEEE International Geoscience and Remote Sensing Symposium IGARSS, Brussels, Belgium, 11–16 July 2021; pp. 2975–2978. [Google Scholar]
- An, H.; Wu, J.; Teh, K.; Sun, Z.; Yang, J. Geosynchronous Spaceborne–Airborne Bistatic SAR Imaging Based on Fast Low-Rank and Sparse Matrices Recovery. IEEE Trans. Geosci. Remote Sens. 2022, 60, 5207714. [Google Scholar] [CrossRef]
- Wong, F.; Tat, S.; Ngee, L. New applications of non-linear chirp scaling in SAR data processing. IEEE Trans. Geosci. Remote Sens. 2000, 1, 96–98. [Google Scholar]
- Qiu, X.; Hu, D.; Ding, C. An improved NLCS algorithm with capability analysis for one-stationary BiSAR. IEEE Trans. Geosci. Remote Sens. 2008, 46, 3179–3186. [Google Scholar] [CrossRef]
- Zeng, T.; Hu, C.; Wu, L.; Liu, F.; Tian, W.; Zhu, M.; Long, T. Extended NLCS algorithm of biSAR systems with a squinted transmitter and a fixed receiver: Theory and experimental confirmation. IEEE Trans. Geosci. Remote Sens. 2013, 51, 5019–5030. [Google Scholar] [CrossRef]
- Tang, W.; Huang, B.; Zhang, S.; Wang, W.; Liu, W. Focusing of Spaceborne SAR Data Using the Improved Nonlinear Chirp Scaling Algorithm. In Proceedings of the IGARSS 2020—2020 IEEE International Geoscience and Remote Sensing Symposium, Waikoloa, HI, USA, 26 September–2 October 2020; pp. 6555–6558. [Google Scholar]
- Sun, Z.; Wu, J.; An, H.; He, X. Geosynchronous Spaceborne–Airborne Bistatic SAR Data Focusing Using a Novel Range Model Based on One-Stationary Equivalence. IEEE Trans. Geosci. Remote Sens. 2021, 2, 1214–1230. [Google Scholar] [CrossRef]
- Wang, Y.; Lu, Z. Spaceborne azimuth multichannel BiSAR with geosynchronous transmitter and LEO receiver: High-Resolution wide-swath image formation. IEEE Access 2019, 7, 176291–176305. [Google Scholar] [CrossRef]
- Tian, F.; Suo, Z.; Wang, Y.; Lu, Z.; Wang, Z.; Li, Z. A Unified Algorithm for the Sliding Spotlight and TOPS Modes Data Processing in Bistatic Configuration of the Geostationary Transmitter with LEO Receivers. Remote Sens. 2022, 14, 2006. [Google Scholar] [CrossRef]
- Neo, Y.L.; Wong, F.H.; Cumming, I. A two-dimensional spectrum for bistatic SAR processing using series reversion. IEEE Geosci. Remote Sens. Lett. 2007, 4, 93–96. [Google Scholar] [CrossRef]
- Liu, B.; Wang, T.; Wu, Q.; Bao, Z. Bistatic SAR Data Focusing Using an Omega-K Algorithm Based on Method of Series Reversion. IEEE Trans. Geosci. Remote Sens. 2009, 47, 2899–2912. [Google Scholar]
- Wong, F.H.; Cumming, I.G.; Neo, Y.L. Focusing Bistatic SAR Data Using the Nonlinear Chirp Scaling Algorithm. IEEE Trans. Geosci. Remote Sens. 2008, 46, 2493–2505. [Google Scholar] [CrossRef]
- Hu, C.; Liu, Z.; Zeng, T. An Accurate Geosynchronous Orbit SAR Imaging Focusing Method. J. Ordnance Ind. 2010, 31, 28–32. [Google Scholar]
- Zhang, Q.; Chang, W.; Li, X. An extended NLCS algorithm for Bistatic fixed-receiver SAR imaging. In Proceedings of the 7th European Radar Conference, Paris, France, 30 September–1 October 2010; pp. 252–255. [Google Scholar]
- Available online: http://www.beidou.gov.cn/yw/xwzx/201802/t20180209_14125.html (accessed on 5 March 2024).
- Tian, W.; Zeng, T.; Hu, C. BiSAR imaging technology based on navigation signals. J. Radar 2013, 2, 39–45. [Google Scholar] [CrossRef]
- Ti, J.; Suo, Z.; Wang, T. Time frequency synchronization error estimation method for navigation satellite ground dual base SAR. J. Xidian Univ. 2023, 50, 42–53. [Google Scholar]
- Morse, P.M.; Feshbach, H. Methods of Theoretical Physics, 1st ed.; Mc Graw-Hill: New York, NY, USA, 1953. [Google Scholar]
- Dwight, H.B. Table of Integrals and Other Mathematical Data, 4th ed.; Macmillan: New York, NY, USA, 1961. [Google Scholar]
Disclaimer/Publisher’s Note: The statements, opinions and data contained in all publications are solely those of the individual author(s) and contributor(s) and not of MDPI and/or the editor(s). MDPI and/or the editor(s) disclaim responsibility for any injury to people or property resulting from any ideas, methods, instructions or products referred to in the content. |
© 2024 by the authors. Licensee MDPI, Basel, Switzerland. This article is an open access article distributed under the terms and conditions of the Creative Commons Attribution (CC BY) license (https://creativecommons.org/licenses/by/4.0/).

