Abstract
The corner reflector is an effective means of interference for radar seekers due to its high jamming intensity, wide frequency band, and combat effectiveness ratio. Properly arranging multiple corner reflectors in an array can form dilution jamming that resembles ships, substantially enhancing the interference effect. This results in a significant decline in the precision attack efficiency of radar seekers. Hence, it is critical to accurately identify corner reflector array. The common recognition methods involve extracting features on the high-resolution range profile (HRRP) and polarization domain. However, the former is constrained by the number of corner reflectors, while the latter is affected by the accuracy of polarization measurement, both of which have limited performance on the identification of corner reflector array. In terms of the evident variations in physical structures, there must be differences in their scattering characteristics. To highlight the differences, this paper proposes a new method based on the concept of mismatched filtering, which involves changing the frequency modulation slope of the chirp signal in the filter. Then, the variance of width and intervals within a specific scope are extracted as features to characterize these differences, and an identification process is designed in combination with the support vector machine. The simulation experiments demonstrate that the proposed method exhibits stable discriminative performance and can effectively combat dilution jamming. Its accuracy rate exceeds 0.86 when the signal-to-noise ratio is greater than 0 dB. Compared to the HRRP methods, the recognition accuracy of the proposed algorithm improves 15% in relation to variations in the quantity of corner reflectors.
1. Introduction
In the field of radar electronic countermeasures, chaff jamming and corner reflector are the primary methods of passive jamming [1]. In contrast to the chaff jamming, corner reflector has the advantages of long−lasting interference duration and stable interference effects. In addition, corner reflector exhibits a number of advantageous properties with regard to scattering characteristics, spectral characteristics, polarization properties, and resistance to the technique of coherent accumulation. In recent years, the continuous advancement of structure and surface reflection materials has led to significant improvements in the performance metrics of corner reflectors, including coverage frequency bands, omnidirectionality, and the cost−effectiveness ratio of interference [2]. Consequently, many countries have devoted greater attention to the development of corner reflectors and deployed them in a variety of scenarios where they are used to counter the radar detection.
The corner reflector is composed of several orthogonal metallic planes that enable the incident wave to reflect multiple times. This property results in the corner reflector exhibiting a pronounced backward radar cross−section and the generation of a robust jamming signal [3]. Proper assignment of multiple corner reflectors can simulate false targets similar to ships, which will substantially enhance the interference effect [4,5,6]. Consequently, the array of corner reflectors has attracted greater interest [7,8]. According to the jamming performance, corner reflector array can be classified into two types: dilution jamming and centroid jamming [9,10]. The former takes effect in the tracking stage, in which the corner reflectors released by the ship are in the same resolution unit with ship. The radar echoes of the corner reflector are typically more pronounced than those of the ship, which results in a bias towards the corner reflector in the tracking direction. The dilution jamming is aimed at the seeking stage, generating multiple false targets covering the detection area of radar. The distance between the corner reflector array and the ship is sufficiently large to permit the clear division of two targets. In contrast to centroid jamming, the implementation of dilution jamming is less constrained, presenting a more significant and challenging issue. Consequently, it is of paramount importance to devise an identification method for the dilution jamming.
It is important to note that the distinction between corner reflectors and ships is not sufficiently obvious, which has made the identification of corner reflectors a challenging problem. A number of studies have been conducted to extract features from different domains with the objective of characterizing the differences between dilution jamming and ship. These domains can be mainly divided into the time domain, frequency domain, and polarization domain.
In the time domain, the majority of studies focus on the extraction of features in the high−resolution range profile (HRRP) [11,12]. The HRRP can be employed to reflect the construction information of the target, including its geometric shape, size, and material composition [13]. Ref. [14] extracted the features in HRRP such as radial size, scattering symmetry, and number of scattering points. Nevertheless, the efficacy of the HRRP method is constrained by the observation angle and spatial geometry, which may not yield expected precision in practical applications. In the frequency domain, the focus is typically on the variances in the motion characteristics. Due to the differing velocity and fluctuation of the corner reflector compared to the ship, the identification of the reflector is typically achieved through doppler frequency shift [15] or micro−doppler frequency shift [16,17]. However, the former cannot easily achieve the expected performance in the context of trailing the corner reflectors, given that the velocity of the corner reflector array closely matches that of the ship. And the latter cannot perform well in complex sea conditions. In the polarization domain, the polarization decomposition theory is widely used [18,19]. This method is one of the important parts of radar polarization technology, extracting the characteristics of the object by decomposing polarization data into various components [20,21]. Nevertheless, real targets exhibit pronounced angular sensitivity in their scattering responses, which makes it difficult to accurately measure the polarization scattering matrix based on polarization decomposition [22]. In order to reduce the impact of azimuth sensitivity of target polarization scattering response, some studies have employed polarimetric roll-invariant features for the identification of corner reflectors [23,24,25].
In light of the limitations of single−domain approaches, recent studies have sought to enhance performance by focusing on multi−dimensional joint features. The authors of [7], based on the theory of polarization modulation, extracted the correlation characteristic parameters on the polarization range 2D image. Simulation results indicate that this method has stable recognition performance. Ref. [26] proposed a novel method of discrimination for corner reflector arrays based on the time−spatial−polarization joint domains. Ref. [8] optimized features and proposed new characteristics in the polarization domain and HRRP. Then, based on the measured data, this paper provided performance analyses of different features and their combinations. However, this method has certain reference value but lacks universality.
Considering the aforementioned constraints, this paper utilizes a novel method based on mismatched filter, which involves modifying the frequency modulation slope of the linear frequency modulated (LFM) signal in the filter. The LFM signal is the most prevalent waveform employed in radar systems. Nevertheless, in comparison to the sophisticated waveforms proposed in recent years [27,28], it is relatively ineffective in mitigating interference and spoofing in radar detection. It is of great value to optimize the signal processing in order to enhance the radar performance [29]. In some previous studies, this technology was nearly applied at the transmitter by modifying the frequency modulation slope of the transmitting LFM signal to enhance the complexity of the waveform. This method resulted in the interference signal being mismatched with the transmitted signal, preventing it from acquiring the corresponding gain of pulse compression. It has since developed many applications, such as anti−interference [30] and defect detection [31]. On the contrary, we utilize the side effect of this technology to broaden the main lobe of the signal output, thereby reducing the degree of compression compared to matched filter. This will amplify the potential differences in scattering characteristics between ships and corner reflector arrays, thus improving the identification performance. Subsequently, this paper extracts the pertinent characteristics and develops an identification method in conjunction with the support vector machine (SVM). The advantages of this approach are as follows.
- Stable performance. The recognition process aims to utilise the structural dissimilarities between the two targets in order to achieve recognition, rather than relying on some intuitive features, such as length or the number of scattering points, which is applicable to complex environments. Compared to the methods applied in HRRP, the proposed method is not limited to some environmental factors, such as the number of corner reflectors or the observation angle. In contrast to the aforementioned frequency domain features, this approach is not limited to scenarios where there are differences in the speed of targets.
- Strong applicability. The primary objective of this method is to enhance the performance of the LFM radar, which is a common waveform in radar systems. Nevertheless, the efficacy of polarization decomposition is contingent upon the availability of a fully polarimetric radar and a signal possessing a high degree of polarization isolation, both of which are essential for the accurate measurement to guarantee its performance. The methods employed in the frequency domain similarly necessitate the capacity for coherent integration.
The remaining sections of this article are organized as follows. In Section 2, we establish the signal model and introduce the principle of mismatched filter by changing the frequency modulation slope. In Section 3, we mainly simulate the output of the ship and corner reflector array based on the proposed mismatch filter, identify the differences, and extract corresponding characteristics. Subsequently, based on the extracted features, we propose an identification method combine with SVM. In Section 4, based on the electromagnetic simulation data, we use the proposed method to evaluate the identification performance under different parameters, and compare with other methods in different conditions. In Section 5, some conclusions are drawn.
Notations: We use bold lowercase letters for vectors and bold uppercase letters for matrices. represents the conjugate operation. ⊗ denotes the convolution operation. denotes the modulus. The letter j denotes the imaginary unit (i.e., ). The letter c is the velocity of light.
2. Mismatched Filter by Changing Frequency Modulation Slope
2.1. Signal Model
The signal used in this paper is the common LFM signal, and its base band format can be expressed as below.
In Equation (1), is the frequency modulation slope of the LFM signal, where and B, respectively, denote the pulse width and bandwidth. When , it is up−chirp; when , it is down−chirp. In addition, is the function of rectangular pulse, which can be expressed as below.
When there exist targets within the detection range, the echoes can be represented as , where I is the number of equivalent scattering points, represents the intensity of the ith scattering point, denotes the time delay of the ith scattering point.
According to the usual process [32], the impulse response of the matched filter is an LFM signal, and the slopes of instantaneous frequency are opposite to K. For the signal in Equation (1), its matched filter impulse response is . To simplify the process of analysis, we set , , and . When the echo passes through the matched filter, the filter output can be expressed as
It is evident that pulse compression can enhance the signal−to−noise ratio (SNR) and further highlight targets. However, the scattering characteristics of targets and interference can also be compressed, which can make it challenging to clearly distinguish them in the range profile. Therefore, in this paper, we propose using mismatched filtering to enhance and highlight these differences.
2.2. Mismatched Filter by Modifying Frequency Modulation Slope
In this paper, the way to change the frequency modulation slope is to modify the bandwidth but maintain the time width, as shown in Figure 1a. And the modified slope can be denoted as , where characterizes the degree of change in bandwidth. The format of the modified LFM signal can be expressed as follows.
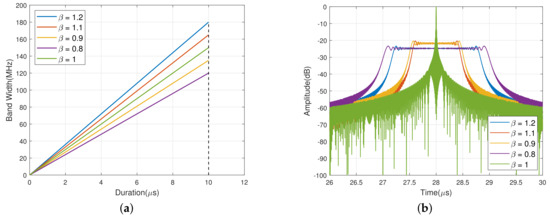
Figure 1.
The mismatched filter by modifying frequency modulation slope. (a) Time−frequency scheme of LFM signal in mismatched filter. (b) The outputs of different modulation factor.
To further simplify the analysis process, we use the same settings as Equation (3). The output of the radar echo passing through this mismatched filter can be expressed as
In Equation (5), is the rectangular envelope, and its value is 1 in the range . By using the method of stationary phase to analyze Equation (5), we can obtain its approximate analytical expression as follows.
where is the sign function.
From Equation (6), it can be observed that the width of main lobe of the output after mismatched filtering is approximately , while the one of pulse compression output is , resulting in a ratio of between them. Since the time−bandwidth product of the LFM signal is much greater than 1, it can be inferred that the width of main lobe is significantly broadened after reception by changing the frequency modulation slope. Likewise, the output amplitude of pulse compression is , so the decrease ratio of amplitude can be expressed as .
Then, we take an example of LFM signal with a bandwidth of and a time duration of 10 s to validate the derivation above. The frequency modulation factors chosen for the LFM signal in mismatched filter are , , , and . The filtered outputs of those factors are as graphed in Figure 1.
Now use the formula to express the deviation level of frequency modulation slope. Roughly speaking, Figure 1b shows that the larger the deviation level, the smaller the output amplitude. And it can be observed that at a given deviation level, the main lobe widens to a lesser extent when the modulation factor is greater than 1. When the deviation level equals , the decrease amplitude is near , which is close to the theoretical value.
2.3. Analysis on Echoes Simulated from Simple Scattering Points
The mismatched filter illustrated in Section 2.2 can largely broaden the width of the main lobe, compared with pulse compression. Next, we simulate the mismatched filtering output of multiple scattering points to investigate the effects of this method on reflecting distribution, types, or other information of those scattering points.
Based on geometrical theory of diffraction (GTD) [33], we can establish backward scattering characteristics of the target and reconstruct the echo signal according to the transmitted signal. The backward scattering characteristics can be expressed as
where I is the number of scattering points, represents the intensity of the ith scattering point, is the initial frequency of the transmitted signal, denotes the type of the ith scattering point, is the position of the ith scattering point.
Subsequently, four distinct scenarios are designed, with the requisite details presented in Table 1. The modulation factor−range two−dimensional images of these above scenarios are shown in Figure 2. The bandwidth of the LFM signal used in this simulation is , with a pulse duration of .

Table 1.
Four types of scenarios.
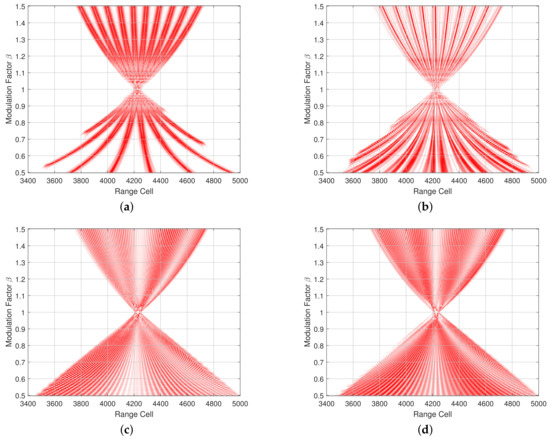
Figure 2.
The modulation factor−range two−dimensional images of different scenarios. (a) Scenario 1. (b) Scenario 2. (c) Scenario 3. (d) Scenario 4.
Figure 2 illustrates the outputs of multiple mismatched filters, which are based on the received signal from scattering points with varying distributions and types. In these images, we perform a process of normalization at each value of modulation factor in order to concentrate on the precise acquisition of alterations in the amplitude distribution. Comparing Figure 2a with Figure 2c, it can be observed that the former output amplitude is more concentrated and evenly distributed, forming a striped pattern. Conversely, the diagram of the latter exhibits a wrinkled pattern. In the same way, analyzing Figure 2a,b, we can find that the type of scatter points also contributes to a more intricate amplitude variation. However, the most significant factor influencing the output of the matched filter is the spatial distribution of the scattering points, which is closely related to the physical structure of the target. Consequently, based on this mismatched filter, we can capture the scattering characteristics of targets, including their structure and type, to a certain extent.
3. Character Extraction and Identification
The objective of this section is to employ this mismatched filter to distinguish between corner reflector arrays and ships and to succinctly summarize the discernible features. Then based on these features, an identification method is proposed.
3.1. Target Echo Acquisition
Due to the paucity of measured data concerning the scenarios of corner reflector arrays or ships at sea, we have employed electromagnetic simulation software (CST Studio Suite 2021) to acquire the backward scattering characteristics of the target. Figure 3 presents a pair of range profiles obtained through electromagnetic simulation software, which separately denote ship and corner reflector array. The blue solid lines in Figure 3 represent the range profiles acquired by electromagnetic simulation software. It is observed that the range profile of the ship is manifested as a few pronounced peaks, interspersed with a relatively weak region. In contrast, the range profile of the corner reflector array appears as a combination of similarly strong peaks. This is due to the complex and large structure of the ship, which can be considered as the superposition of echoes from multiple scattering centers. The scattering characteristics of these centers are usually different. The corner reflector is typically composed of multiple trihedral angles, with a simple structure and strong symmetry. This can be considered as strong scattering points with similar scattering characteristics.
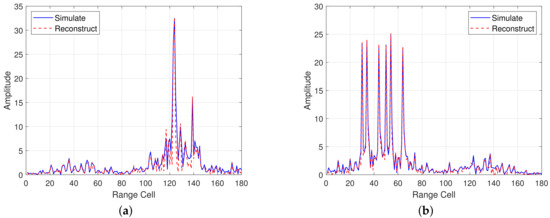
Figure 3.
Simulated range profile and reconstructed range profile. (a) Ship. (b) Corner reflector array.
Due to the limitations imposed by the computational speed and time constraints, the number of sampling frequency points employed in the simulation of the one−dimensional range profile did not match that of the transmitted LFM signal, which is unable to generate the radar echoes through convolution in the frequency domain. Nevertheless, there are currently many methods for inverting the target echoes based on range profile [34,35]. In this paper, we utilize the total least squares−estimating signal parameter via rotational invariance techniques (TLS−ESPRIT) to reconstruct the range profile and to acquire the radar echoes [36,37]. The following outlines the brief operational processes.
The initial step is to utilize the electromagnetic simulation software to obtain the frequency response of the target. Based on this frequency response, the TLS−ESPRIT algorithm is employed to extract the parameters of the equivalent scattering centers, including amplitude, type, and relative position. Subsequently, the frequency response of the target is reconstructed based on the frequency sampling vector, according to the GTD listed in Equation (7). Finally, multiply the reconstructed frequency response with the transmitted signal in the frequency domain, and the target echoes can be obtained by Fourier transform.
The red dashed lines in Figure 3 are the reconstructed range profiles. A comparison of the reconstructed results with the electromagnetic calculations reveals that they only differ in regions heavily affected by clutter. Furthermore, the amplitudes at the peak positions are essentially consistent, which demonstrates the effectiveness of the aforementioned reconstruction method.
3.2. Character Extraction
Based on the reconstructed echoes of the target, we conduct the proposed mismatched filter through changing the frequency modulation slope. The bandwidth of the LFM signal used in this Section is , with a pulse duration of .
From Figure 4, it can be observed that the image of the ship is concentrated on one side, while the image of the corner reflector array is more evenly distributed, consisting of multiple bright bands. The differences displayed in Figure 3 illustrate that the mismatched filter has the capacity to amplify the discrepancies between ship and corner reflector arrays to a considerable extent, which renders it more conducive to the process of identification.
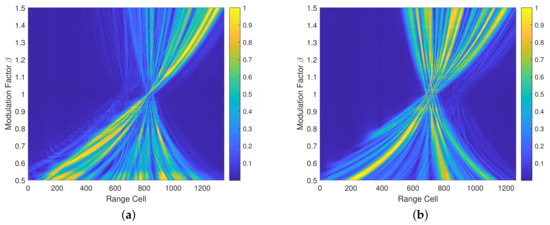
Figure 4.
Modulation factor−range two−dimensional image. (a) Ship. (b) Corner reflector array.
In order to facilitate the process of identification, this section employs a process of feature extraction, whereby the intuitive distribution differences are translated into mathematical expressions. It can be observed from Figure 4 that the differences are concentrated on the distribution of bright bands, where the points with larger amplitude are located. Therefore, in order to accurately characterize the distinction, only those points whose normalized amplitude falls within a specific range are retained.
Figure 5 illustrates the points within the range of −5 dB. As the preceding analysis, the points of the ship are concentrated on one side, whereas those of the corner reflector array are evenly and densely distributed. It can be observed that when is less than 1, the widening of the image becomes more pronounced compared to when is greater than 1. This is consistent with the analysis presented in Section 2.2. However, if the widening is too large, it will lead to excessive superposition in the outputs of the mismatched filter, thereby affecting the effectiveness of feature extraction. Consequently, in the following sections, this paper will only focus on the cases in which is greater than 1.
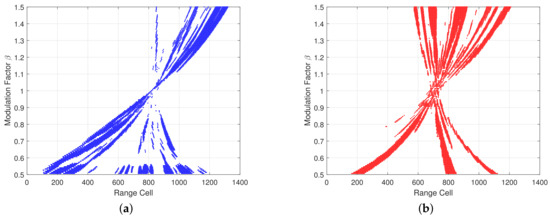
Figure 5.
The distribution of points within the range of −5 dB. (a) Ship. (b) Corner reflector array.
Subsequently, this paper identifies two features that can be used to distinguish between ships and corner reflector arrays, based on the observed distribution differences.
(1) Variance of width.
A comparison of Figure 5a and Figure 5b reveals that the widths of the −5 dB regions in the ship are largely disparate, while those of the corner reflector array are relatively similar. Consequently, this paper calculates the variance of width to characterize this difference, which can be expressed as
where N refers to the number of regions under the modulation factor , is the width of the ith region, expresses the average width of the regions. In this feature, the summary of the width is used to normalize the variance.
(2) Variance of intervals.
Similarly, it can be demonstrated that the regions of the ship are relatively concentrated, with a few bright bands that are far apart. In contrast, the regions of the corner reflector array are more evenly distributed. Therefore, the variance of intervals is used to characterize the distribution characteristics, with the formula depicted below.
where represents the interval between the ith region and the th region, denotes the average interval, L represents the total width under the modulation factor . Figure 6 takes the condition of in Figure 5a as an example, where the specific meanings of interval and width are explained.
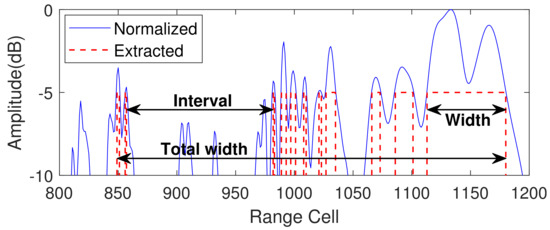
Figure 6.
The intuitive illustration of the two extracted features.
3.3. Identification Method Based on SVM
SVM is a classifier used for solving binary classification problems [38]. It achieves non−linear classification through kernel functions that map data into higher dimensions, aiming to find a separation hyperplane that correctly divides the training data with the maximum geometric margin. SVM exhibits many unique advantages in addressing small sample sizes, non−linearity, and high−dimensional pattern recognition tasks. Compared to the SVM classifiers with linear kernel function, the SVM classifier using Gaussian radial basis kernel function has advantages such as diverse boundaries and higher classification accuracy. Therefore, this paper will use SVM based on the Gaussian radial basis kernel function to distinguish corner reflector arrays. The SVM identification process of corner reflector arrays is illustrated in Figure 7.
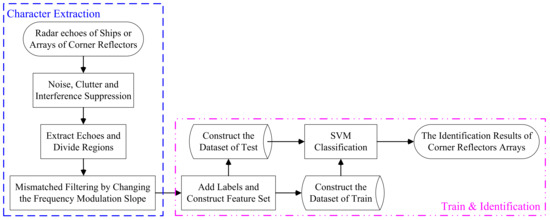
Figure 7.
The identification process of corner reflector array.
The identification process can be divided into two parts. The initial stage of the process involves the extraction of characteristics. Firstly, the methods for interference suppression should be employed in order to moderate the influence of strong noise and clutter. Secondly, the search radius should be set to half of the maximum target size, after which the number of targets in the range profile can be determined. In the event that multiple targets exist, it is necessary to split their regions separately. Finally, the frequency modulation slope is modified in order to construct the mismatched filter, which is then employed to generate the modulation factor−range two−dimensional image and calculate the proposed features.
The second part is to train and to identify the corner reflector array. At first, add the appropriate labels in order to construct the training dataset of ships and corner reflector arrays. The format of the training dataset for SVM classifier can be expressed as , where and separately represent the variance of width and intervals. And is the label set, where represents ships and represents corner reflector arrays. The SVM classifier can be used to train an optimal SVM classification model through simulated data of corner reflector arrays or ships on the sea surface. Subsequently, this model will be employed to identify corner reflector arrays within the testing dataset.
4. Simulation Experiment Analysis
4.1. Data Acquisition
In the experiments, we still utilize the electromagnetic simulation software (CST Studio Suite 2021) to obtain the backward scattering characteristics of different targets. Multiple models are employed to ensure the validity of the results, as illustrated in Figure 8. The shape parameters of four ship models are listed in Table 2.

Figure 8.
The models of ships and corner reflector arrays. (a) Ship 1. (b) Ship 2. (c) Ship 3. (d) Ship 4. (e) Corner reflector array 1. (f) Corner reflector array 2.

Table 2.
Shape parameters of four ship models.
Considering the scenario of dilution jamming, the corner reflector array is positioned in alignment with the ship’s navigation direction on the sea surface, with a sufficient distance between them to ensure that both can be divided. Set the direction along the bow of the ship as in azimuth angle, and downward from the deck as in pitch angle. The bandwidth of the LFM signal used in these simulations is , with a pulse duration of , and the center frequency is . The electromagnetic scattering data utilized in this paper are confined to the pitch angle range of to and azimuth angle range of to . In this method, the polarization information is not utilized. Consequently, the data employed in this method comprise only those of the same polarization type, both for the transmission and reception. To better approximate the ship’s output, we also place one or two groups of identical corner reflector arrays to acquire similar length in range profile. The details of simulation experiments are listed in Table 3. It is important to note that the training dataset is derived from data generated by a single model with corresponding numbers, as indicated in Table 3. And the testing dataset comprises data simulated from each sub−row in Table 3.

Table 3.
Groups of simulation data.
4.2. Identification Based on a Single Modification Factor
To further investigate the application conditions of this method and seek better discrimination performance, we first perform the identification process under a single modification factor . In this section, we choose seven modification factors and calculate the proposed characters within the range of −5 dB. Meanwhile, we also test the condition of within different ranges of selection area. Considering the impact of noise with varying amplitudes on classification accuracy, this paper introduces white Gaussian noise with varying SNR and employs 20 Monte Carlo simulations to compute the accuracy rate. The accuracy rates of these tests are graphed in Figure 9.
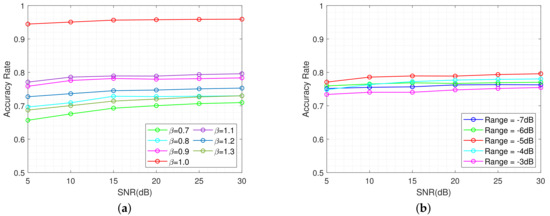
Figure 9.
The identification performance of single modulation factor. (a) Different modulation factor but within the same range of −5 dB. (b) Same modulation factor within different ranges.
In Figure 9a, the red line represents the recognition accuracy rate under the condition of , which can also be regarded as the matched filter scenario. It is evident that the proposed features also demonstrate excellent discriminative performance on HRRP. But this performance is also constrained by some factors such as the quantity of corner reflectors, which will be discussed in Section 4.5. In addition, the bright−colored lines represent the conditions of factor greater than 1, and the dark−colored lines represent the conditions of factor less than 1. It can be observed that at the same deviation level , there is a deterioration in identification performance when the modulation factor is less than 1.
Meanwhile, we can observe that the recognition performance under other single modulation factors is not satisfactory, with an accuracy rate that falls below 0.8 in each case. Figure 9b demonstrates that there is a better identification performance within the range of −5 dB. Nevertheless, the accuracy rate within each range remains not ideal.
The suboptimal discriminative performance under the condition of a single modulation factor is primarily attributable to the widening of the main lobe. The proposed mismatched filter does indeed amplify the differences of scattering characteristics to a certain extent. However, due to the effects of attenuation and superposition, it is more susceptible to the influence of incidental factors, thus making it difficult to accurately guarantee its performance under individual modulation factors. From Figure 9a, we can also find that the greater the extent of main lobe widening, the more unstable the robustness of its performance under this modulation factor.
4.3. Identification Based on a Range of Modulation Factors
Due to the unsatisfactory and unstable identification performance under a single modulation factor, this part will perform the identification process on a range of modulation factors. Consequently, the proposed features will be acquired by calculating the mean value of features in different modulation factors, thereby characterizing the average fluctuation of distribution differences.
As demonstrated in Section 4.2, the identification process exhibits a better performance when is set to 1 and the range is selected to be −5 dB. Accordingly, this section sets the range of modulation factor as 1 to 1.1, with a step size of 100 (exclusive of ). Based on the training dataset, the distributions of the two features for ships and corner reflectors arrays are, respectively, depicted below.
Figure 10 reveals a clear disparity in the distribution of the two features. In both characteristics, the values of the corner reflector arrays are relatively low, concentrated near the X−axis. In contrast, the ship’s values exhibit a higher concentration, with a higher interquartile range compared to the corner reflector arrays. From the joint distribution in Figure 11, it can be observed that the feature points of corner reflector arrays are relatively concentrated, clustered near the origin. On the contrary, the ones of ships are relatively dispersed, forming an arc−shaped distribution with only a few overlapping regions. Consequently, subsequent validations of the method’s performance will be conducted under these parameters.
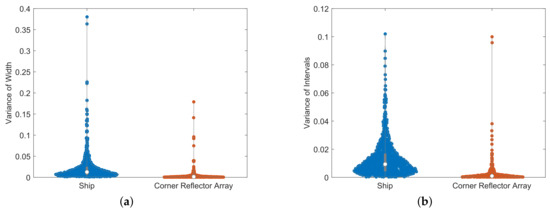
Figure 10.
The distribution of characteristics. (a) The variance of width. (b) The variance of intervals.
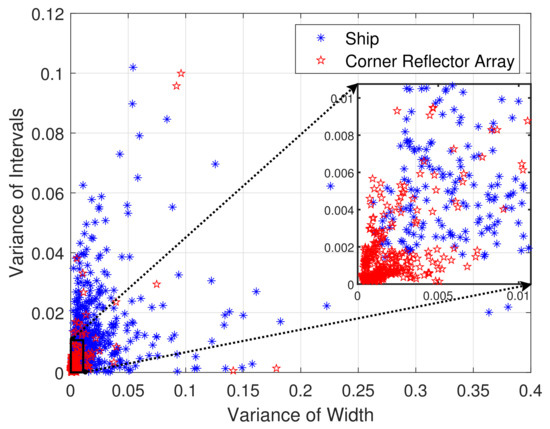
Figure 11.
The joint distribution of the two features.
To further demonstrate the advantages of this method, several comparative methods were employed in this experiment. It is very regrettable to note that since electromagnetic simulation software is unable to accurately simulate the scattering characteristics of targets in motion, identification methods based on frequency domain features cannot be introduced for comparison, such as doppler frequency and micro−motion period. These methods for comparison in this section include the HRRP methods in [8], polarization decomposition method including Cloude decomposition [39] and Krogager decomposition [40], polarization−invariant method [41], and the method utilizing correlation characteristic parameters from the polarization−range 2D image [7].
Krogager decomposition divides the polarimetric scattering matrix of scattering points into three components: odd scattering, second−order scattering with rotation angle, and helix scattering. Thus, we choose the first two as discriminative features for the SVM classifier. In the method of Cloude decomposition, we utilize the scattering entropy and average scattering angle as the features for identification. Regarding the feature selection of polarization invariants, we chose three more important features based on the results in [24], which are the shape factor, depolarization coefficient, and target aspect ratio.
In the context of simulation experiment scenarios, the angular size of the corner reflector array and the ship are nearly similar on the HRRP. Consequently, the other comparative experiment primarily utilizes two HRRP features in [8]. The two features are total half−peak breadth (THPB) and mean differential amplitude (MDA), and their expressions are as follows.
In Equations (10) and (11), represents the region of the target location, k represents the number of peaks above the threshold within the region, refers to the half−peak width of the ith peak, is the amplitude at the ith range unit.
Figure 12 shows the discriminative accuracy rate of various methods under different SNR conditions, and Table 4 is the numerical comparison table. When SNR is greater than −5 dB, it is evident that the identification accuracy of the proposed method is higher than other methods, almost exceeding 0.86 when the SNR is between −5 and 30. When the influence of noise is minimal, the accuracy of the proposed method can be approximated to 0.9. Compared to the methods in polarization, the proposed method and the HRRP method are significantly impacted by SNR, especially at a low SNR. This is mainly because the features selected in this method are the distribution characteristics within the area above the −5 dB region, which is relatively easily affected by strong noise or clutter. However, the polarization methods usually analyze the scattering matrix of peaks on polarization HRRP, which is minimally affected by noise. Nevertheless, it is noteworthy that the proposed method has demonstrated enhanced robustness with regard to noise in comparison to the HRRP method in [8].
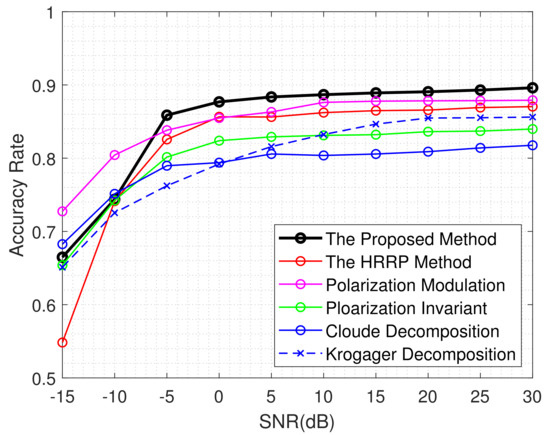
Figure 12.
The identification performance of different methods. Where the HRRP method is in Ref. [8], polarization modulation is in Ref. [7], polarization invariant is in Ref. [41], Cloude decomposition is in Ref. [39], krogager decomposition is in Ref. [40].

Table 4.
The comparison table of different methods.
However, it should be pointed out that the method in the polarization domain has extremely high requirements for measurement accuracy and utilizes information from multiple channels. Consequently, the polarization method has extremely high requirements on equipment, such as polarization measurement error and polarization isolation. On the contrary, the proposed method only requires multiple mismatched filters of the transmitted signal. Meanwhile, this method has relatively low requirements on target echoes, which can be combined with the common suppression method for noise, clutter, and interference. These methods include time−domain cancellation [42], blind source separation [43], cyclic cancellation [44], and so on. Therefore, in a low−SNR environment, it is first necessary to focus on improving the radar’s noise resistance and target detection effectiveness, and then find solutions to suppress noise.
Considering that Gaussian noise may not easily simulate actual radar environments, we simulate the noise under other distribution functions to further assess the identification performance of the proposed method. These distribution functions include Rayleigh distribution, K−distribution, lognormal distribution, and Weibull distribution. In order to get closer to the actual situation, we simulate these distribution functions under different sea conditions. The data are simulated under these distribution functions with reference to the method in [45] and the parameters given in [46], which is most similar to the amplitude distribution of the IPIX dataset [47]. The identification performance under different distribution functions is plotted in Figure 13.
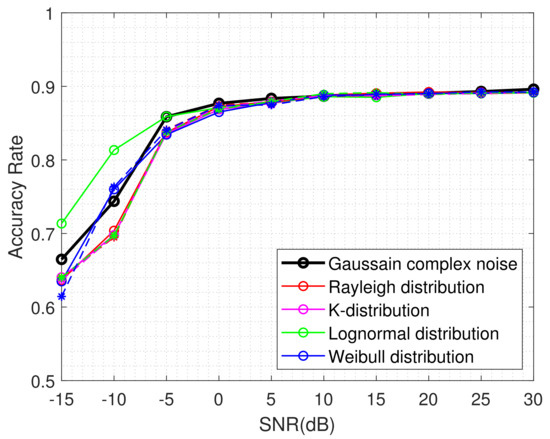
Figure 13.
The identification performance under noise of different distributions.
The black solid line in Figure 13 demonstrates the identification performance under the Gaussian complex noise. In other colors of lines, the solid lines represent the accuracy rate under high sea condition, and the dashed lines are the identification performance under low sea condition. The proposed method exhibits a superior performance under lognormal distribution in high sea conditions, while the other methods exhibit comparable performance. In comparison to the identification performance under other distributions, the maximum discrepancy in accuracy rate under Gaussian complex noise does not exceed 0.012 when SNR is greater than 0 dB. Therefore, in the remainder of this paper, we will still use Gaussian complex noise to study the identification performance under different SNR.
4.4. Stability Tests under Different Conditions
The efficacy of the proposed method is contingent upon two parameters: the range of modulation factor and the range of point extraction. The impact of varying these two factors on the identification performance will be investigated in the following context. In this section, we denote as the degree of range variation, which is the ratio of changed amount to the original range. In the circumstances of different , the step size is maintained at 100.
Figure 14a illustrates the accuracy rate of different ranges of modulation factors. It can be observed that the identification performance remains relatively consistent across different ranges, with differences within 0.01. Similarly, Figure 14b demonstrates that the accuracy rate of identification varies slightly when the range of point extraction is above −3 dB, with differences within 0.015. Nevertheless, when the range of point extraction is equal to −3 dB, there is a slight decline in identification performance. This is attributed to the excessively high threshold setting, which results in a limited extraction area for the feature points. Consequently, this inadequate coverage fails to accurately represent the scattering characteristics of targets. However, in general, the proposed method demonstrates good robustness with respect to the variation of the two parameters.
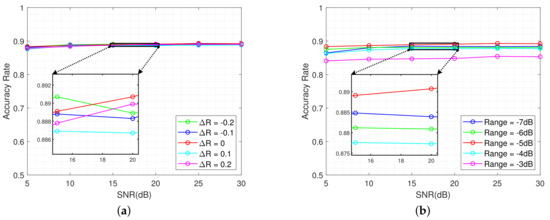
Figure 14.
The identification performance under different parameters. (a) Different range of modulation factors but within the same range of −5 dB. (b) Different range of point extraction but within the same range of modulation factors.
The HRRP−based method is significantly affected by the observation angle. Therefore, it is imperative to investigate the recognition performance of the proposed method when subjected to varying observation angles or the pitch and yaw angles of the ship.
As indicated in Section 4.1, the electromagnetic scattering data utilized in this paper are confined to the pitch angle range of 20° to 90° and azimuth angle range of 0° to 70°, with steps of 10°. To further validate the performance of the method under different pitch and yaw angles, we designed relevant experiments based on the simulation data. By extracting a portion of the data from specific angles to serve as the test set, while using the remaining portion as the training set, we can evaluate the identification performance at new angles.
Figure 15 illustrates the identification performance under two sorts of conditions, which only change pitch angles or yaw angles. The designation “Train X & Test X” indicates that the condition employs X groups of angles for training and utilizes other X groups of angles for testing, resulting in a total of eight. To mitigate the impact of strong noise, SNR was set to a range of 5 to 30. Each condition was randomly sampled eight times, and the mean accuracy rate was calculated.
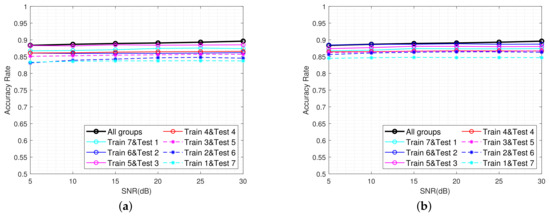
Figure 15.
The identification performance of different conditions. (a) Training and testing using different pitch angles. (b) Training and testing using different yaw angles.
As can be seen from Figure 15, the recognition accuracy rate in each condition is higher than 0.83. When there are more training data, containing data from more angles, the recognition performance is better. However, the difference in recognition accuracy under different conditions is not large, and the maximum discrepancy does not exceed 0.05. This phenomenon indicates that when the training data do not contain the current angle of the ship, this method can still maintain good recognition performance. It is further explained that this method mainly relies on the structural differences between targets for identification, and its performance is less affected by factors such as yaw and pitch angles.
4.5. Stability Tests under Different Quantities of Corner Reflectors
This section compares the proposed method with the HRRP method in [8] to examine the stability of the discriminative performance when different quantities of corner reflectors are employed in the testing set. Furthermore, the method that utilizes the proposed features under the matched filter scenario is included as a comparison method. Based on the training dataset simulated from the single models presented in Table 3, the two−dimensional distributions of features for each method are plotted in Figure 16. To avoid the influence of strong noise, this section set the SNR as 5 to 30.
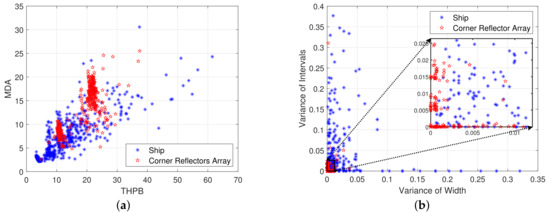
Figure 16.
The two−dimensional distribution of different methods. (a) The HRRP method in [8]. (b) The proposed features in HRRP.
Comparing Figure 11 with Figure 16a,b, it can be observed that in the proposed method, the feature points of the corner reflector array are more concentrated in the area near the origin. However, in the other methods that extract features based on HRRP, they are centralized into several regions. This difference may be related to the number of corner reflectors. To validate this hypothesis, several sets of experiments were designed to assess the discriminative performance of each method when the training and testing datasets have different quantities of corner reflectors.
Table 3 presents the simulated dataset, comprising two sets of corner reflector arrays with different quantities, prompting us to conduct two sets of experiments. In each experimental set, the SVM classifier will be trained with simulated data using a specific quantity of corner reflectors, after which it will be tested with simulated data from a different quantity. From this process, we can conduct the assessment of discriminative performance across varying numbers of corner reflectors, based on different methods. The following diagrams illustrate the distribution of the testing dataset across varying quantities of corner reflector arrays, all under a SNR of 25 dB.
From Table 3, we can find that the dataset generated from a single group of corner reflector arrays is considerably smaller than that derived from two groups. Consequently, the number of feature points in the second row is markedly less than that in the first row in Figure 17. Due to the compressive property induced by pulse compression and the stretching variation of the range profile across different observation angles, the features proposed in this paper for matched filter scenarios may yield numerous meaningless values, necessitating filtration. As depicted in Figure 17c,f, it is evident that the number of feature points in this condition is comparatively fewer than in the other two methods.
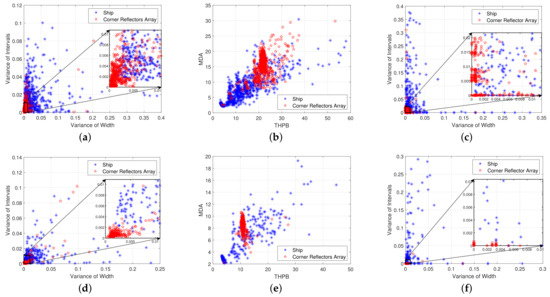
Figure 17.
The two−dimensional distribution of different methods under different quantities of corner reflectors. (a,d) Based on the proposed method. (b,e) Based on the HRRP method in [8]. (c,f) Based on the proposed features in HRRP.
Analyzing the vertical subplots in Figure 17, we can find that in the proposed method, the distribution areas of different quantities of corner reflectors are largely similar. However, under the other two methods, there are significant differences in the feature distribution among different quantities of corner reflectors. These figures suggest that the method proposed in this paper is less affected by variations in the quantity of corner reflectors. Subsequently, we will plot the identification accuracy rate under two sets of experiments in order to further compare the robustness of each method on this condition.
The dash lines in Figure 18 represent the identification performance under the condition where the quantity of corner reflector is held constant, whereas the solid line illustrates the alternative case. Correspondingly, the solid line denotes the experiment group. Comparing Figure 18a with Figure 18b, it can be observed that there exists an overall decrease in accuracy in the right graph. This is because the training dataset used in Figure 18b only consists of data from a single corner reflector array, resulting in a relatively small sample size, which may have led to a less effective identification performance.
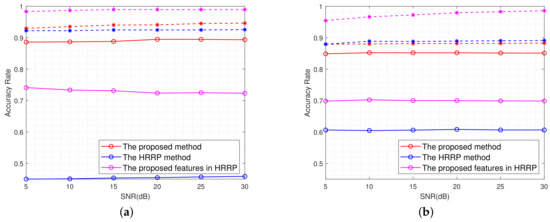
Figure 18.
The identification accuracy rate of different methods under two sets of experiments. (a) A single array of corner reflectors. (b) Two arrays of corner reflectors.
We can observe that when the testing dataset contains data from different quantities of corner reflectors, the proposed method in this paper exhibits the smallest variation in accuracy. Specifically in Figure 18b, the variation is within the range of . In contrast, extracting features on the HRRP is significantly influenced by the quantity of corner reflectors, as evidenced by the sharp decrease in Figure 18. It is illustrated that the proposed method demonstrates good robustness with respect to variations in the quantity of corner reflectors.
5. Conclusions
To address the challenge of passive interference from corner reflector arrays in the anti−ship scenarios, this paper proposes a mismatched filtering method based on changing frequency modulation slope. Through analysis of the mismatched filtering output of simple scattering points in different distributions or types, it can be seen that the proposed method is capable of reflecting the scattering characteristics of the target to some extent. Then, based on the simulation data, we separately construct modulation factor−range two−dimensional images of ships and corner reflector arrays. Focusing on the differences in these images, this paper extracts the variance of width and intervals in a certain region as characteristics and designs an identification process based on the SVM. The results of numerical experiments conducted under different SNR conditions demonstrate that the proposed method exhibits excellent identification performance, consistently exceeding 0.86 when the SNR is greater than 0 dB. In terms of comparative experimental results among different methods, the proposed method is observed to exhibit superior discriminative performance when SNR exceeds 0 dB. In contrast to the method that extracts features in HRRP, this method demonstrates good robustness with respect to variations in the quantity of corner reflectors and is less susceptible to noise.
In the future, measured data will be collected to investigate the performance of the method in actual scenarios. Additionally, the data will be augmented by both simulation and measured data, seeking to enhance the performance of the method by developing a more effective classifier. In the meantime, additional research will focus on optimizing methods for area selection to enhance accuracy rate and exploring interference suppression techniques for application in environments with high levels of noise or clutter. The deployment strategy of corner reflector arrays will be optimized in order to make them more similar to ships in scattering characteristics or range profile to further validate the proposed method. Finally, we will be make efforts to combine other domain information, such as polarization, with the intention of enhancing the identification performance.
Author Contributions
Conceptualization, L.X. and F.W.; methodology, L.X. and F.W.; software, L.X., N.L. and R.P.; data curation, F.W. and L.X.; supervision, F.W., C.P. and Z.S.; writing–original draft preparation, L.X.; writing–review and editing, F.W., N.L. and C.P.; resources, Z.S., C.P. and Y.L. All authors have read and agreed to the published version of the manuscript.
Funding
This research was funded by the National Natural Science Foundation of China (No. 61921001 and No. 62301580).
Data Availability Statement
All data in this paper are generated by simulation and the details have been presented in Section 4.1.
Conflicts of Interest
The authors declare no conflicts of interest.
References
- Li, H.; Chen, S. Electromagnetic scattering characteristics and radar identification of sea corner reflectors: Advances and prospects. J. Radars 2023, 12, 738–761. [Google Scholar]
- Wu, L.; Xu, J.; Hu, S.; Liu, Z. High-frequency backscattering properties of quasi-omnidirectional corner reflector: The great-icosahedral-like reflector. AIP Adv. 2022, 12, 105225. [Google Scholar] [CrossRef]
- Zhang, Z.; Zhang, J.; Qu, S.; Du, H. Research on radar corner reflector: Advances and perspectives. Aerodyn. Missile J. 2014, 4, 64–70. [Google Scholar]
- Luo, Y.; Guo, L.X.; Zuo, Y.; Liu, W. Time-domain scattering characteristics and jamming effectiveness in corner reflectors. IEEE Access 2021, 9, 15696–15707. [Google Scholar] [CrossRef]
- Jiang, T.; Luo, J.; Yu, Z. Research on corner reflector array fitting method for ship scattering characteristics. In Proceedings of the 2023 IEEE 2nd International Conference on Electrical Engineering, Big Data and Algorithms (EEBDA), Changchun, China, 24–26 February 2023. [Google Scholar]
- Zhang, J.; Hu, S.; Wu, L.; Fan, X.; Yang, Q. Air-floating corner reflectors dilution jamming placement position. In Proceedings of the 2019 IEEE 8th Data Driven Control and Learning Systems Conference (DDCLS), Dali, China, 24–27 May 2019. [Google Scholar]
- Wu, G.; Wang, L.; Pang, C.; Li, Y.; Wang, X. Radar polarization modulation countermeasures for combined corner reflector: Anti diluted jamming. Acta Electron. Sin. 2022, 50, 2969–2983. [Google Scholar]
- Han, J.; Yang, Y.; Lian, J.; Wu, G.; Wang, X. Identification method of corner reflector based on polarization and HRRP feature fusion for radar seeker. J. Syst. Eng. Electron. 2023; in press. [Google Scholar]
- Tang, G.; Li, H.; Gan, R.; Yuan, R. Analysis of corner reflector under naval battlefield. Electron. Inf. Warf. Technol. 2015, 30, 39–45+84. [Google Scholar]
- Wang, L.; Jiang, N.; Sun, Y. The mechanism analyzing and use of corner reflector against anti-ship missiles. In Proceedings of the 2017 5th International Conference on Mechatronics, Materials, Chemistry and Computer Engineering (ICMMCCE 2017), Chongqing, China, 24–25 July 2017. [Google Scholar]
- Zhou, X.; Zhu, J.; Yu, W.; Cui, T. Time-domain shooting and bouncing rays method based on beam tracing technique. IEEE Trans. Antennas Propag. 2015, 63, 4037–4048. [Google Scholar] [CrossRef]
- Yuan, H.; Fu, X.; Zhao, C.; Xie, M.; Gao, X. Ship and Corner Reflector Identification Based on Extreme Learning Machine. In Proceedings of the 2019 IEEE International Conference on Signal, Information and Data Processing (ICSIDP), Chongqing, China, 11–13 December 2019. [Google Scholar]
- Zeng, Z.; Sun, J.; Han, Z.; Hong, W. Radar HRRP target recognition method based on multi-input convolutional gated recurrent unit with cascaded feature fusion. IEEE Geosci. Remote Sens. Lett. 2022, 19, 4026005. [Google Scholar] [CrossRef]
- Lv, F. Dynamic Echo Simulation and Characteristic Analysis of Sea Surface Targets. Master Dissertation, Xidian University, Xi’an, China, 2019. [Google Scholar]
- Cui, K.; Wang, W.; Chen, X.; Yuan, N. A kind of method of anti-corner reflector interference for millimeter wave high resolution radar system. In Proceedings of the 2016 Progress in Electromagnetic Research Symposium (PIERS), Shanghai, China, 8–11 August 2016. [Google Scholar]
- Shi, F.; Li, Z.; Zhang, M.; Li, J. Analysis and Simulation of the Micro-Doppler Signature of a Ship with a Rotating Shipborne Radar at Different Observation Angles. IEEE Geosci. Remote Sens. Lett. 2022, 19, 1504405. [Google Scholar] [CrossRef]
- Hanif, A.; Muaz, M.; Hasan, A.; Adeel, M. Micro-Doppler Based Target Recognition With Radars: A Review. IEEE Sens. J. 2022, 22, 2948–2961. [Google Scholar] [CrossRef]
- Fang, M.; Zhu, Y.; Huang, M.; Fu, Q. Sea surface target polarization feature extraction based on modified odd-time and even-time scattering models. In Proceedings of the 2013 2nd International Conference on Measurement, Information and Control, Harbin, China, 16–18 August 2013. [Google Scholar]
- Liang, Z.; Yu, Y.; Zhang, B. Anti-corner reflector array method based on pauli polarization decomposition and BP neural network. In Proceedings of the 2021 IEEE 2nd International Conference on Pattern Recognition and Machine Learning (PRML), Chengdu, China, 16–18 July 2021. [Google Scholar]
- Cloude, S.R.; Pottier, E. A review of target decomposition theorems in radar polarimetry. IEEE Trans. Geosci. Remote Sens. 1996, 34, 498–518. [Google Scholar] [CrossRef]
- Krogager, E. New decomposition of the radar target scattering matrix. Electron. Lett. 1990, 26, 1525–1532. [Google Scholar] [CrossRef]
- Chen, S.; Li, Y.; Wang, X.; Xiao, S.; Sato, M. Modeling and Interpretation of Scattering Mechanisms in Polarimetric Synthetic Aperture Radar: Advances and perspectives. IEEE Signal Proc. Mag. 2014, 31, 79–89. [Google Scholar] [CrossRef]
- Li, H.; Li, M.; Cui, X.; Chen, S. Man-made target structure recognition with polarimetric correlation pattern and roll-invariant feature coding. IEEE Geosci. Remote Sens. Lett. 2022, 19, 8024105. [Google Scholar] [CrossRef]
- Liang, Z.; Wang, Y.; Zhao, X.; Xie, M.; Fu, X. Identification of ship and corner reflector in sea clutter environment. In Proceedings of the 2020 15th IEEE International Conference on Signal Processing (ICSP), Beijing, China, 6–9 December 2020. [Google Scholar]
- Chen, S.; Wu, G.; Dai, D.; Wang, X.; Xiao, S. Roll-Invariant Features in Radar Polarimetry: A Survey. In Proceedings of the IGARSS 2019–2019 IEEE International Geoscience and Remote Sensing Symposium, Yokohama, Japan, 28 July–2 August 2019. [Google Scholar]
- He, Y.; Yang, H.; He, H.; Yin, J.; Yang, J. A Ship Discrimination Method Based on High-Frequency Electromagnetic Theory. Remote Sens. 2022, 14, 3893. [Google Scholar] [CrossRef]
- Yu, K.; Zhu, S.; Lan, L.; Zhu, J.; Li, X. Mainbeam Deceptive Jammer Suppression With Joint Element-Pulse Phase Coding. IEEE Trans. Veh. Technol. 2024, 73, 2332–2344. [Google Scholar] [CrossRef]
- Wang, F.; Li, N.; Pang, C.; Li, Y.; Wang, X. Algorithm for Designing PCFM Waveforms for Simultaneously Polarimetric Radars. IEEE Trans. Geosci. Remote Sens. 2024, 62, 5100716. [Google Scholar] [CrossRef]
- Jin, L.; Wang, J.; Zhong, Y.; Wang, D. Optimal Mismatched Filter Design by Combining Convex Optimization with Circular Algorithm. IEEE Access 2022, 10, 56763–56772. [Google Scholar] [CrossRef]
- Mattingly, R.G.; Martone, A.F.; Metcalf, J.G. Techniques for Mitigating the Impact of Intra-CPI Waveform Agility. IEEE Trans. Radar Syst. 2024, 2, 24–40. [Google Scholar] [CrossRef]
- Liu, G.; Gao, W.; Liu, W.; Xu, J.; Li, R.; Bai, W. LFM-Chirp-Square pulse-compression thermography for debonding defects detection in honeycomb sandwich composites based on THD-processing technique. Nondestruct. Test. Eval. 2024, 39, 832–845. [Google Scholar] [CrossRef]
- Dai, H.; Zhao, Y.; Su, H.; Wang, Z.; Bao, Q.; Pan, J. Research on an intra-pulse orthogonal waveform and methods resisting interrupted-sampling repeater jamming within the same frequency band. Remote Sens. 2023, 15, 3673. [Google Scholar] [CrossRef]
- Kouyoumjian, R.G.; Pathak, P.H. A uniform geometrical theory of diffraction for an edge in a perfectly conducting surface. IEEE Trans. Signal Process. 1974, 62, 1448–1461. [Google Scholar] [CrossRef]
- Ghasemi, M.; Sheikhi, A. Joint Scattering Center Enumeration and Parameter Estimation in GTD Model. IEEE Trans. Antenn. Propag. 2020, 68, 4786–4798. [Google Scholar] [CrossRef]
- Hu, P.; Xu, S.; Zou, J.; Chen, Z. Parameter estimation of GTD model using iterative adaptive approach. In Proceedings of the 2017 IEEE SENSORS, Glasgow, UK, 29 October–1 November 2017. [Google Scholar]
- Chen, S.; Pan, M. Analytical Model and Real-Time Calculation of Target Echo Signals on Wideband LFM Radar. IEEE Sens. J. 2021, 21, 10726–10734. [Google Scholar] [CrossRef]
- Li, S.; Wang, X.; Fu, Z.; Zhang, J. Extraction of scattering center parameter and RCS reconstruction based on the improved TLS-ESPRIT algorithm of Hankel matrix. J. Syst. Eng. Electron. 2021, 43, 62–73. [Google Scholar]
- Zhou, Z. Machine Learning, 1st ed.; Tsinghua University Press: Beijing, China, 2016; pp. 121–139. [Google Scholar]
- Lu, Z.; Wang, Z.; Dan, B. Ship target identification method based on the characteristic of target polarimetric HRRP of radars. In Proceedings of the 2022 Global Reliability and Prognostics and Health Management (PHM-Yantai), Yantai, China, 13–16 October 2022. [Google Scholar]
- Zhu, Z.; Tang, G.; Cheng, Z.; Huang, P. Discrimination method of ship and corner reflector based on polarization decomposition. Shipboard Electron. Countermeas. 2010, 33, 15–21. [Google Scholar]
- Wang, M.; Xie, M.; Su, Q.; Fu, X. Identification of ship and corner reflector based on invariant features of the polarization. In Proceedings of the 2019 IEEE 4th International Conference on Signal and Image Processing (ICSIP), Wuxi, China, 19–21 July 2019. [Google Scholar]
- Shi, Y.; Shui, P. Target detection in high-resolution sea clutter via block-adaptive clutter suppression. IET Radar Sonar Navigat. 2011, 5, 48–57. [Google Scholar] [CrossRef]
- Chen, M.; Li, L.; Geng, Z.; Xie, X. Single-channel Blind Source Separation Algorithm Based on Water Area Noise Characteristics. In Proceedings of the 2022 IEEE International Conference on Mechatronics and Automation (ICMA), Guilin, China, 7–10 August 2022. [Google Scholar]
- Lv, M.; Zhou, C. Study on Sea Clutter Suppression Methods Based on a Realistic Radar Dataset. Remote Sens. 2019, 11, 2721. [Google Scholar] [CrossRef]
- Zhu, J.; Tang, J. K-distribution Clutter Simulation Methods Based on Improved ZMNL and SIRP. J. Radars 2014, 3, 533–540. [Google Scholar] [CrossRef]
- Gao, Z.; Zhang, A. Simulation Analysis of Typical Amplitude Distribution Model of Sea Clutter. Ship Electron. Eng. 2018, 38, 76–79. [Google Scholar]
- The McMaster IPIX Radar Sea Clutter Database. Available online: http://soma.mcmaster.ca/ipix/ (accessed on 29 May 2024).
Disclaimer/Publisher’s Note: The statements, opinions and data contained in all publications are solely those of the individual author(s) and contributor(s) and not of MDPI and/or the editor(s). MDPI and/or the editor(s) disclaim responsibility for any injury to people or property resulting from any ideas, methods, instructions or products referred to in the content. |
© 2024 by the authors. Licensee MDPI, Basel, Switzerland. This article is an open access article distributed under the terms and conditions of the Creative Commons Attribution (CC BY) license (https://creativecommons.org/licenses/by/4.0/).