
Multiple Close-Range Geomatic Techniques for the Kinematic Study of the La Paúl Rock Glacier, Southern Pyrenees

 , ,
, ,  , , , and
Abstract
:1. Introduction
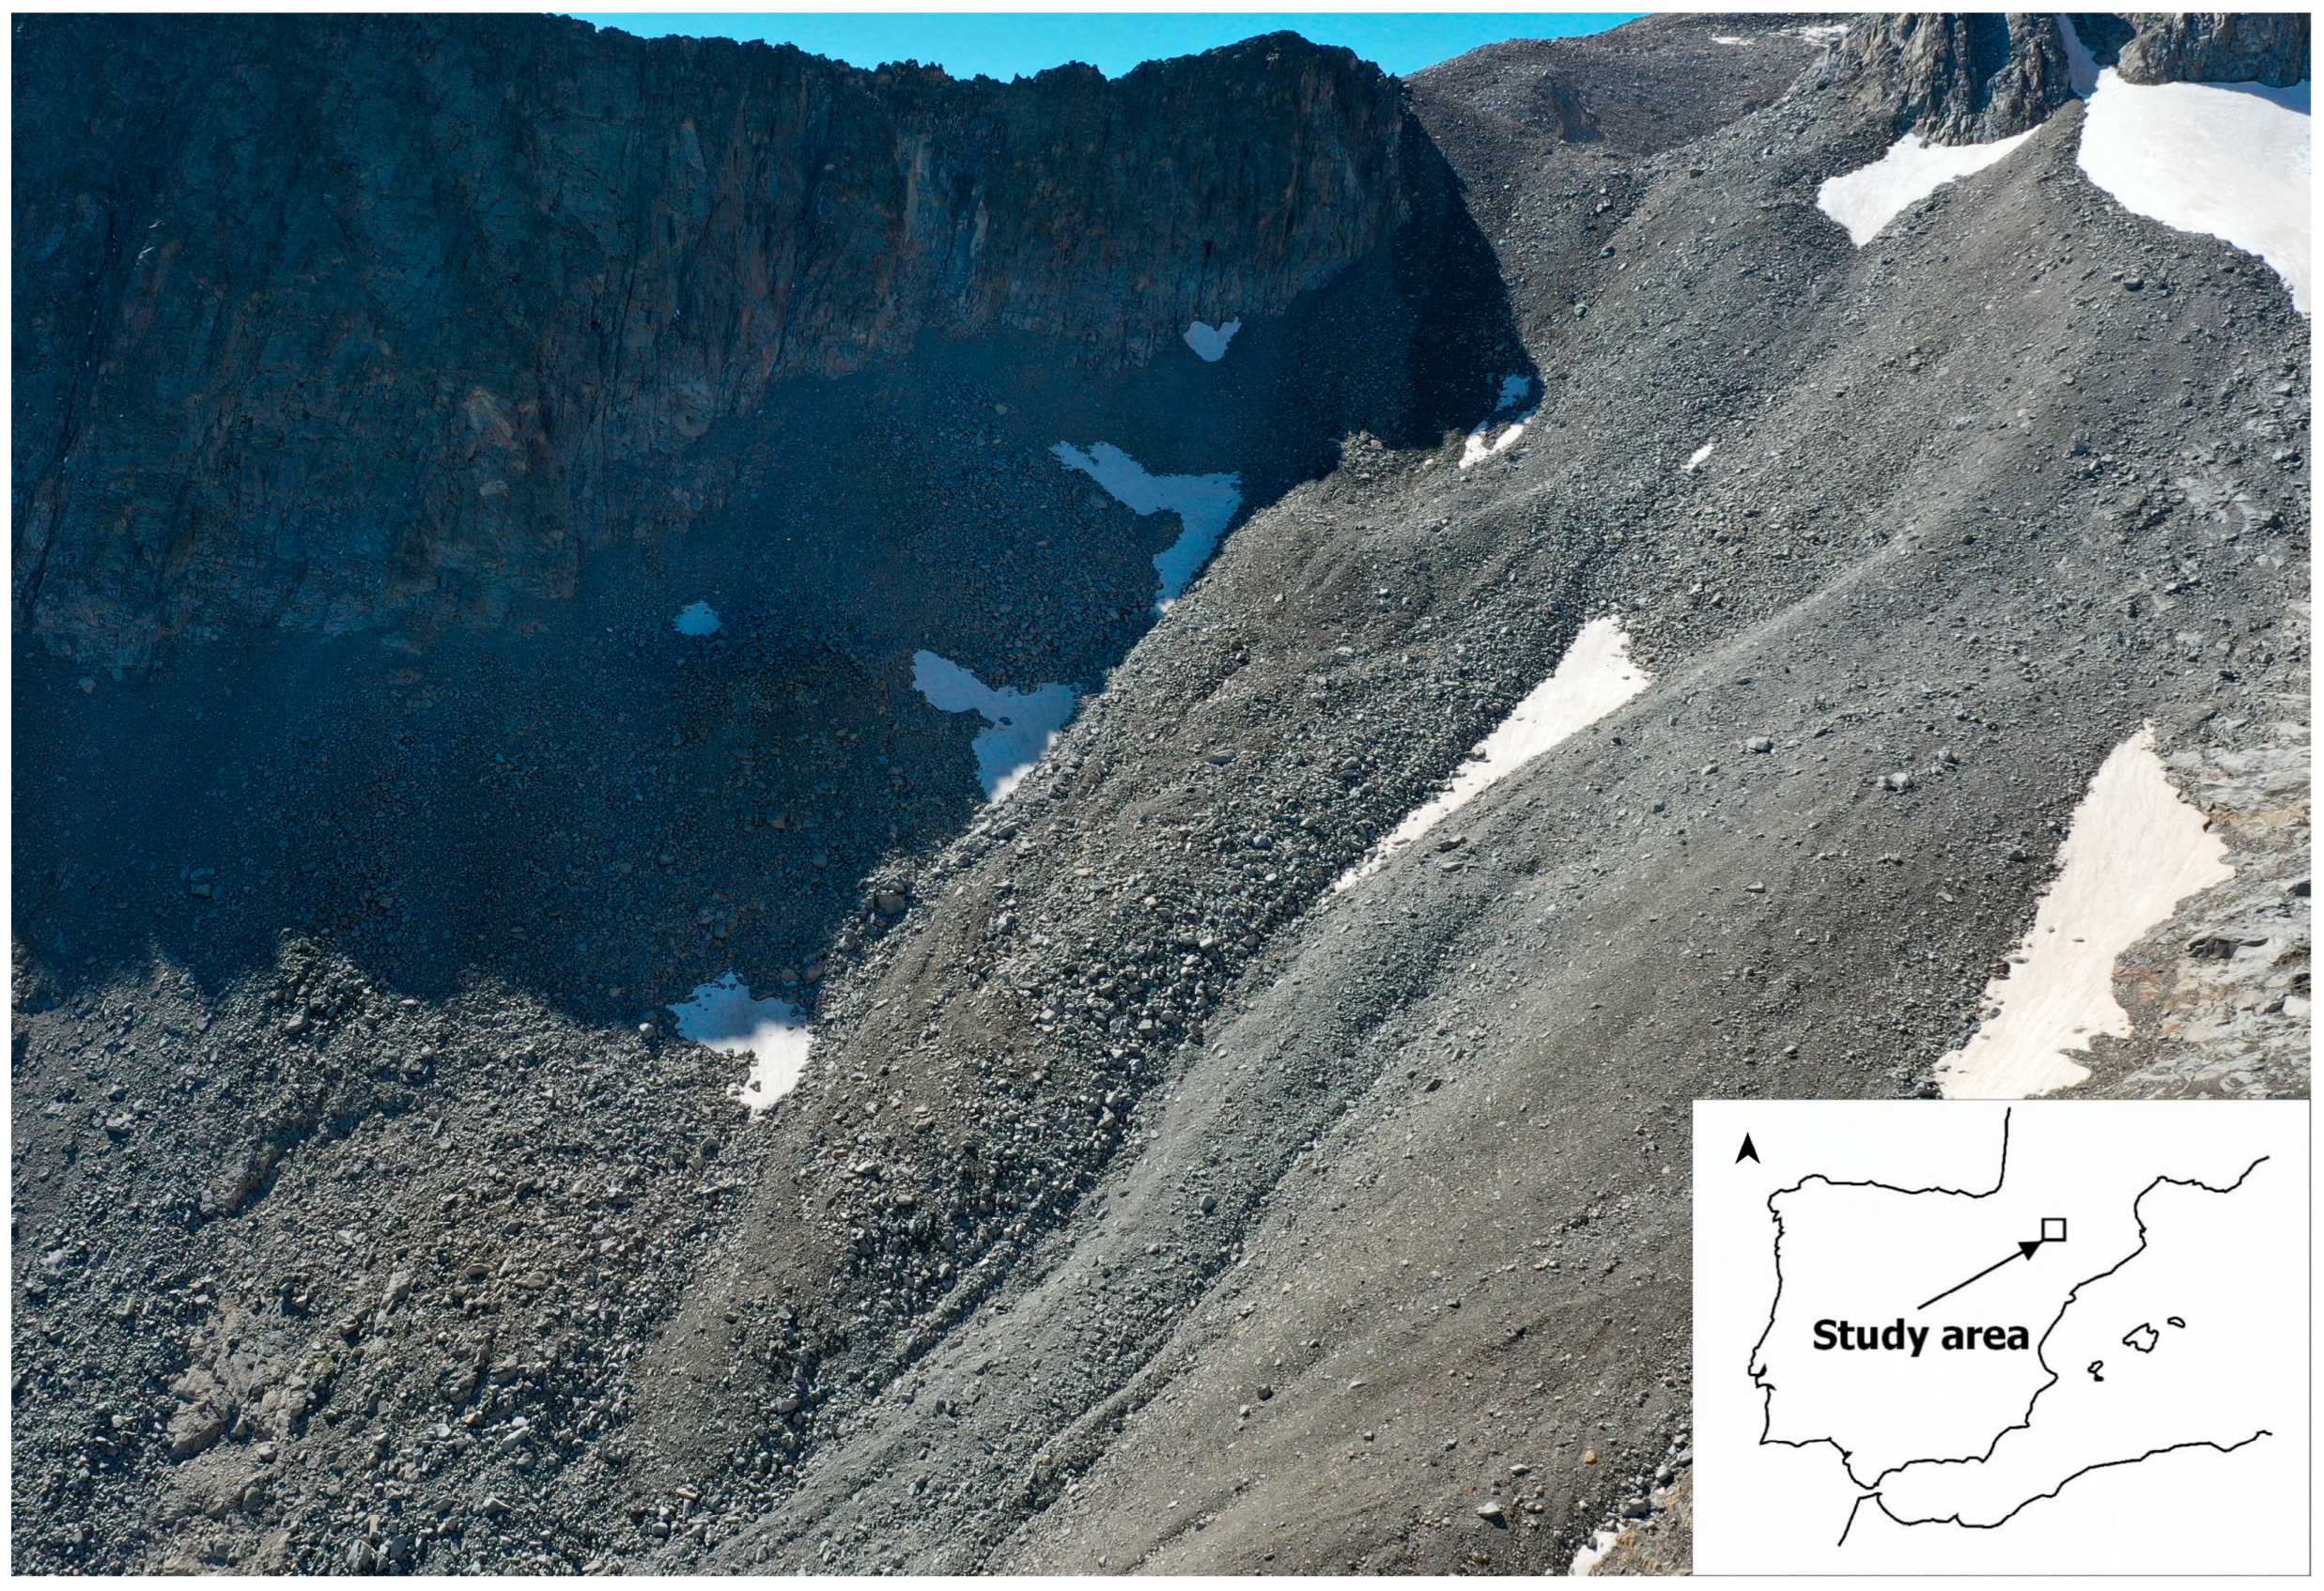
2. Study Site
3. Materials and Methods
3.1. GNSS Surveys
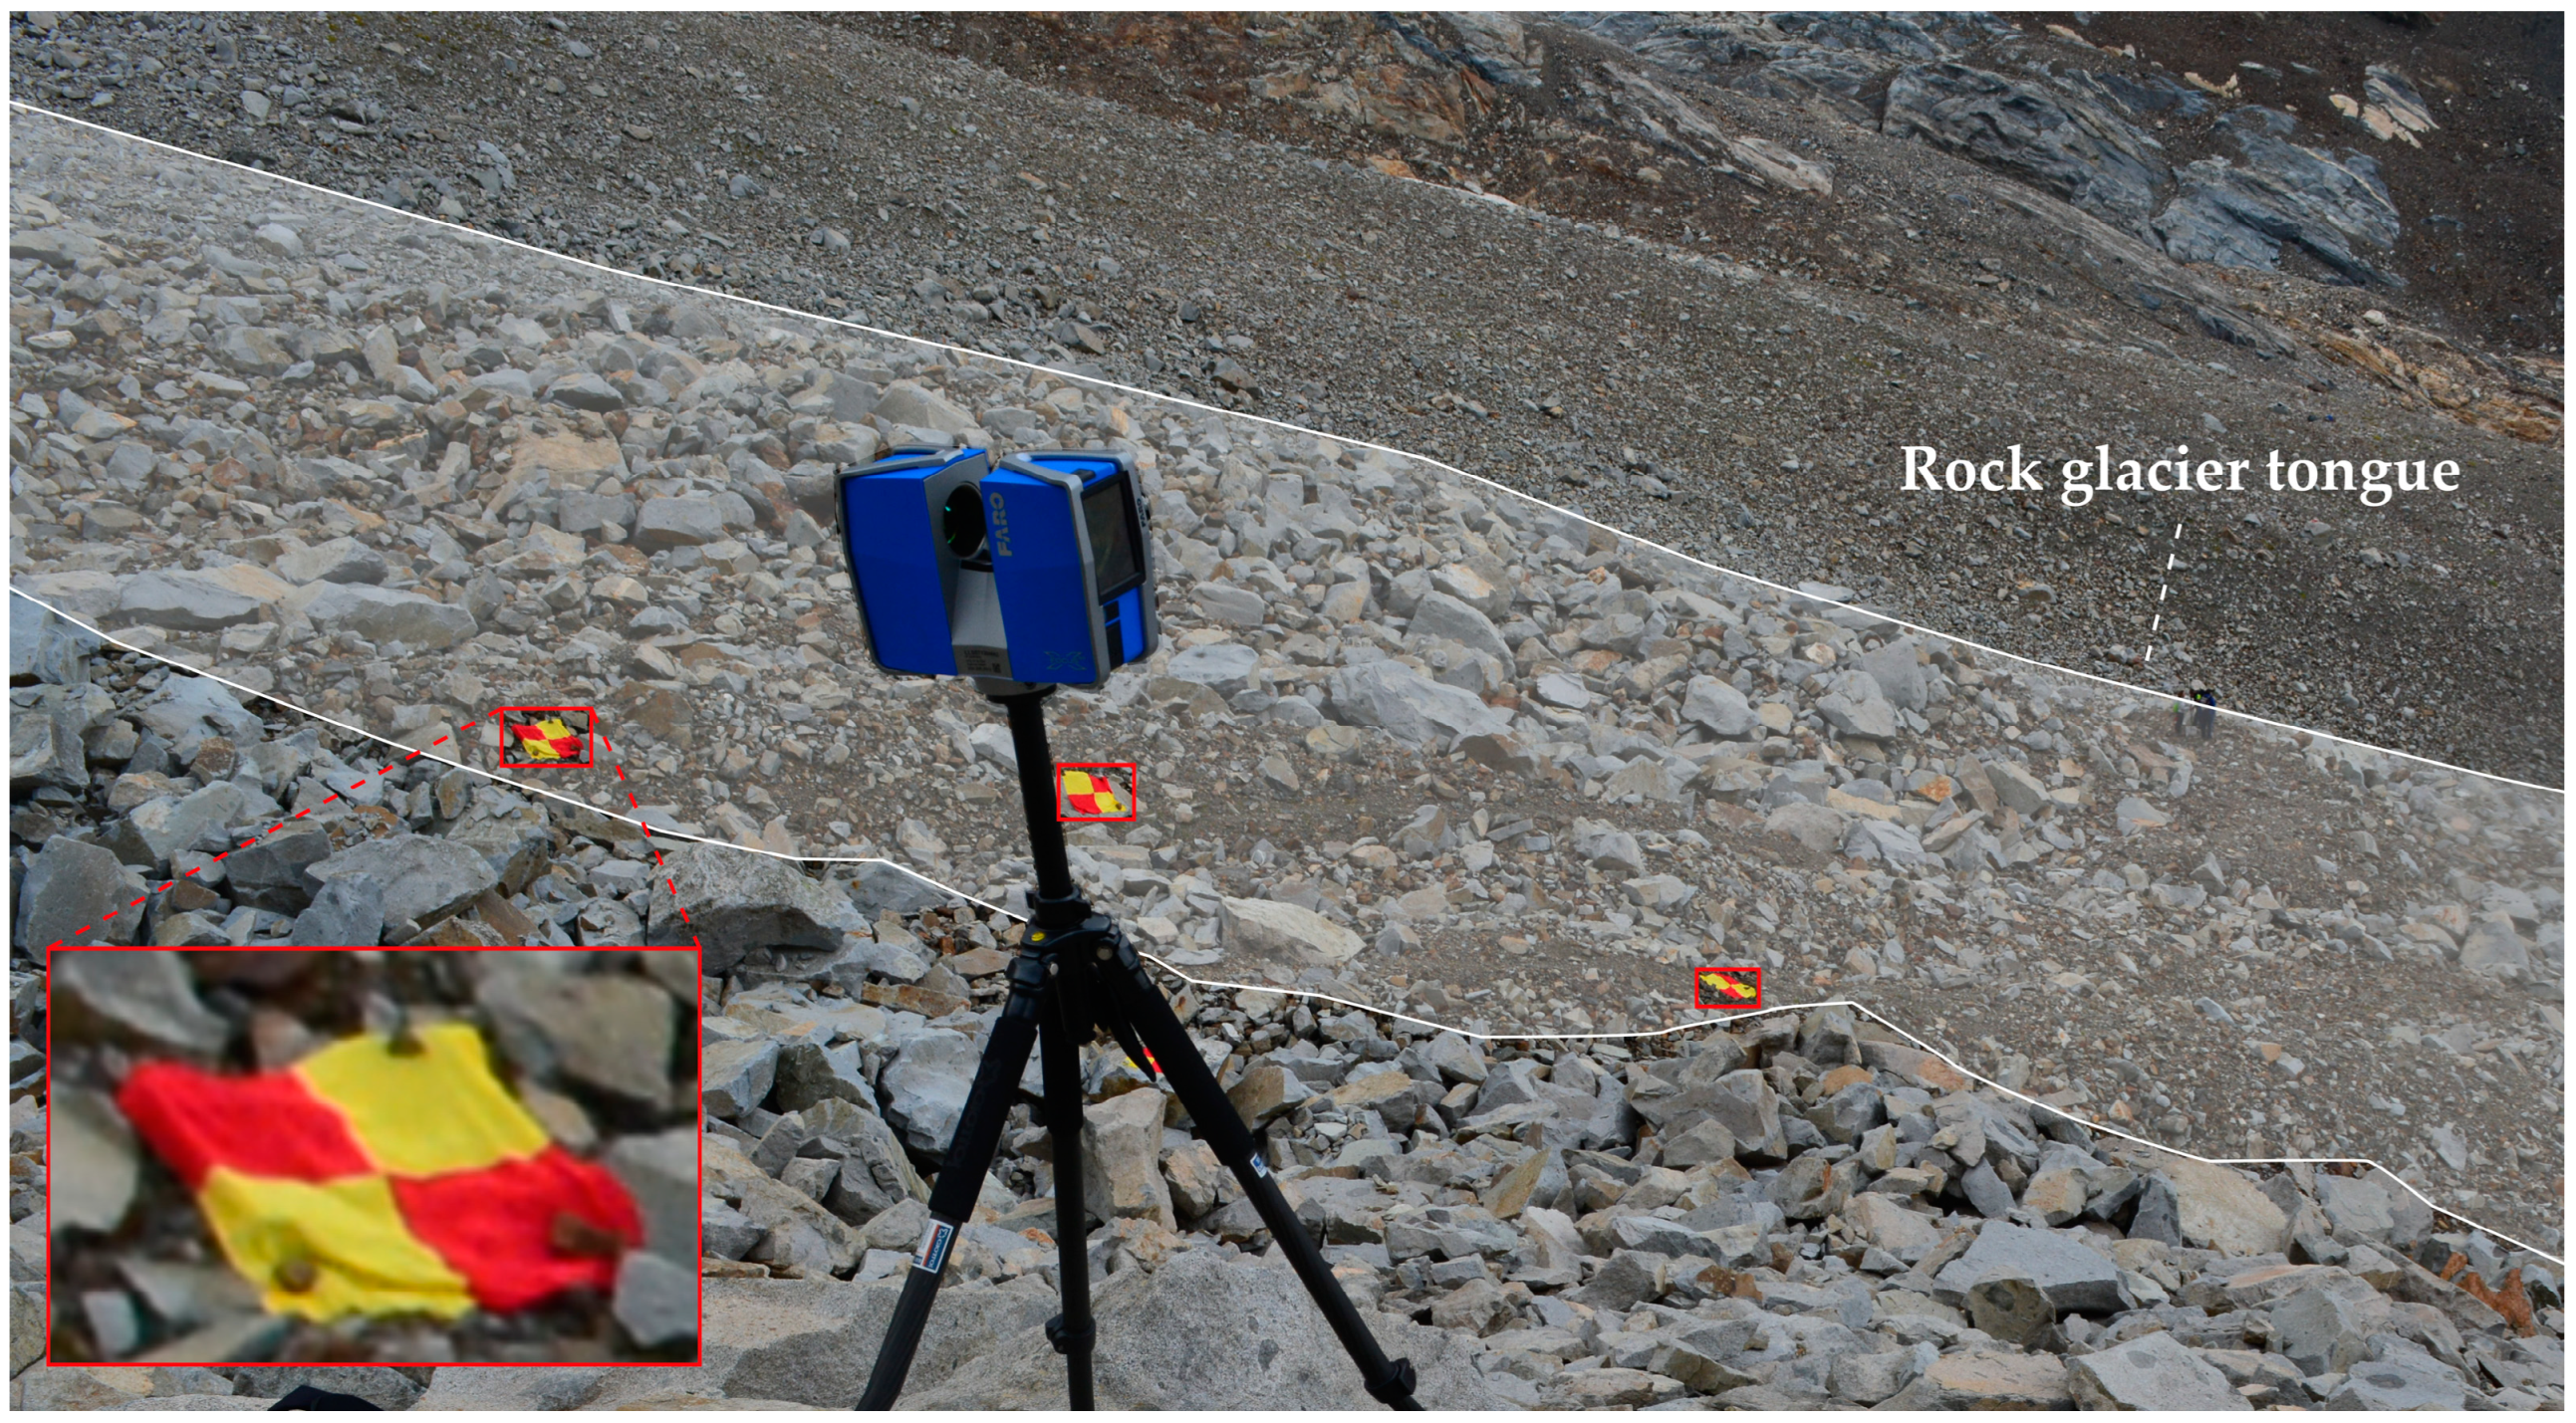
3.2. TLS Surveys
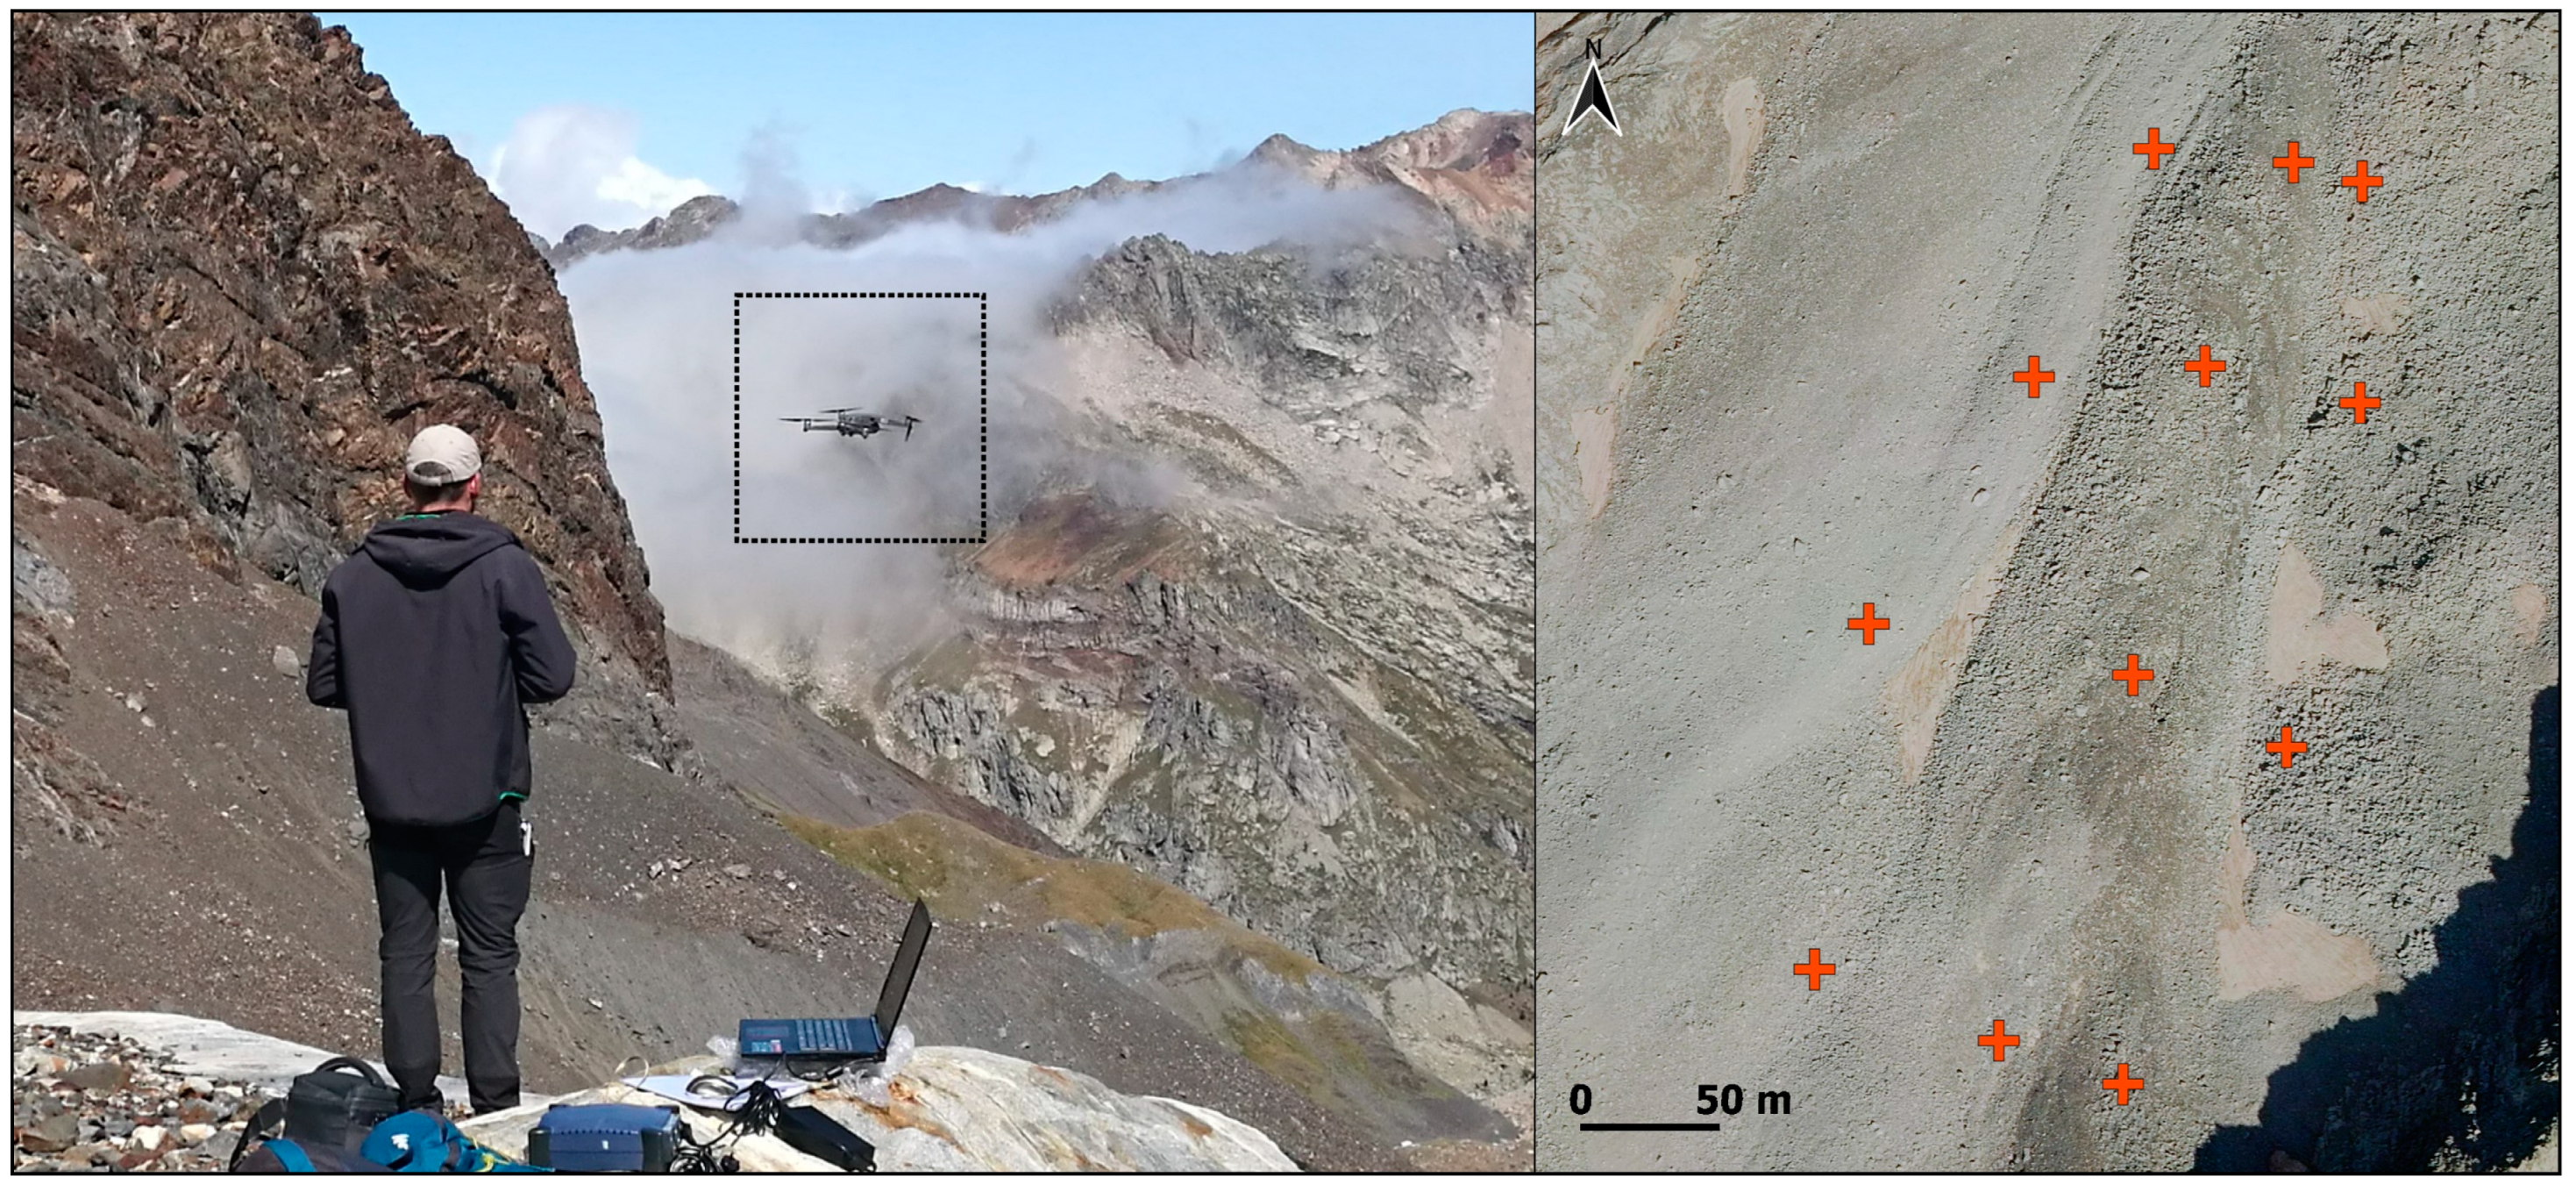
3.3. AP-UAV Surveys
4. Results
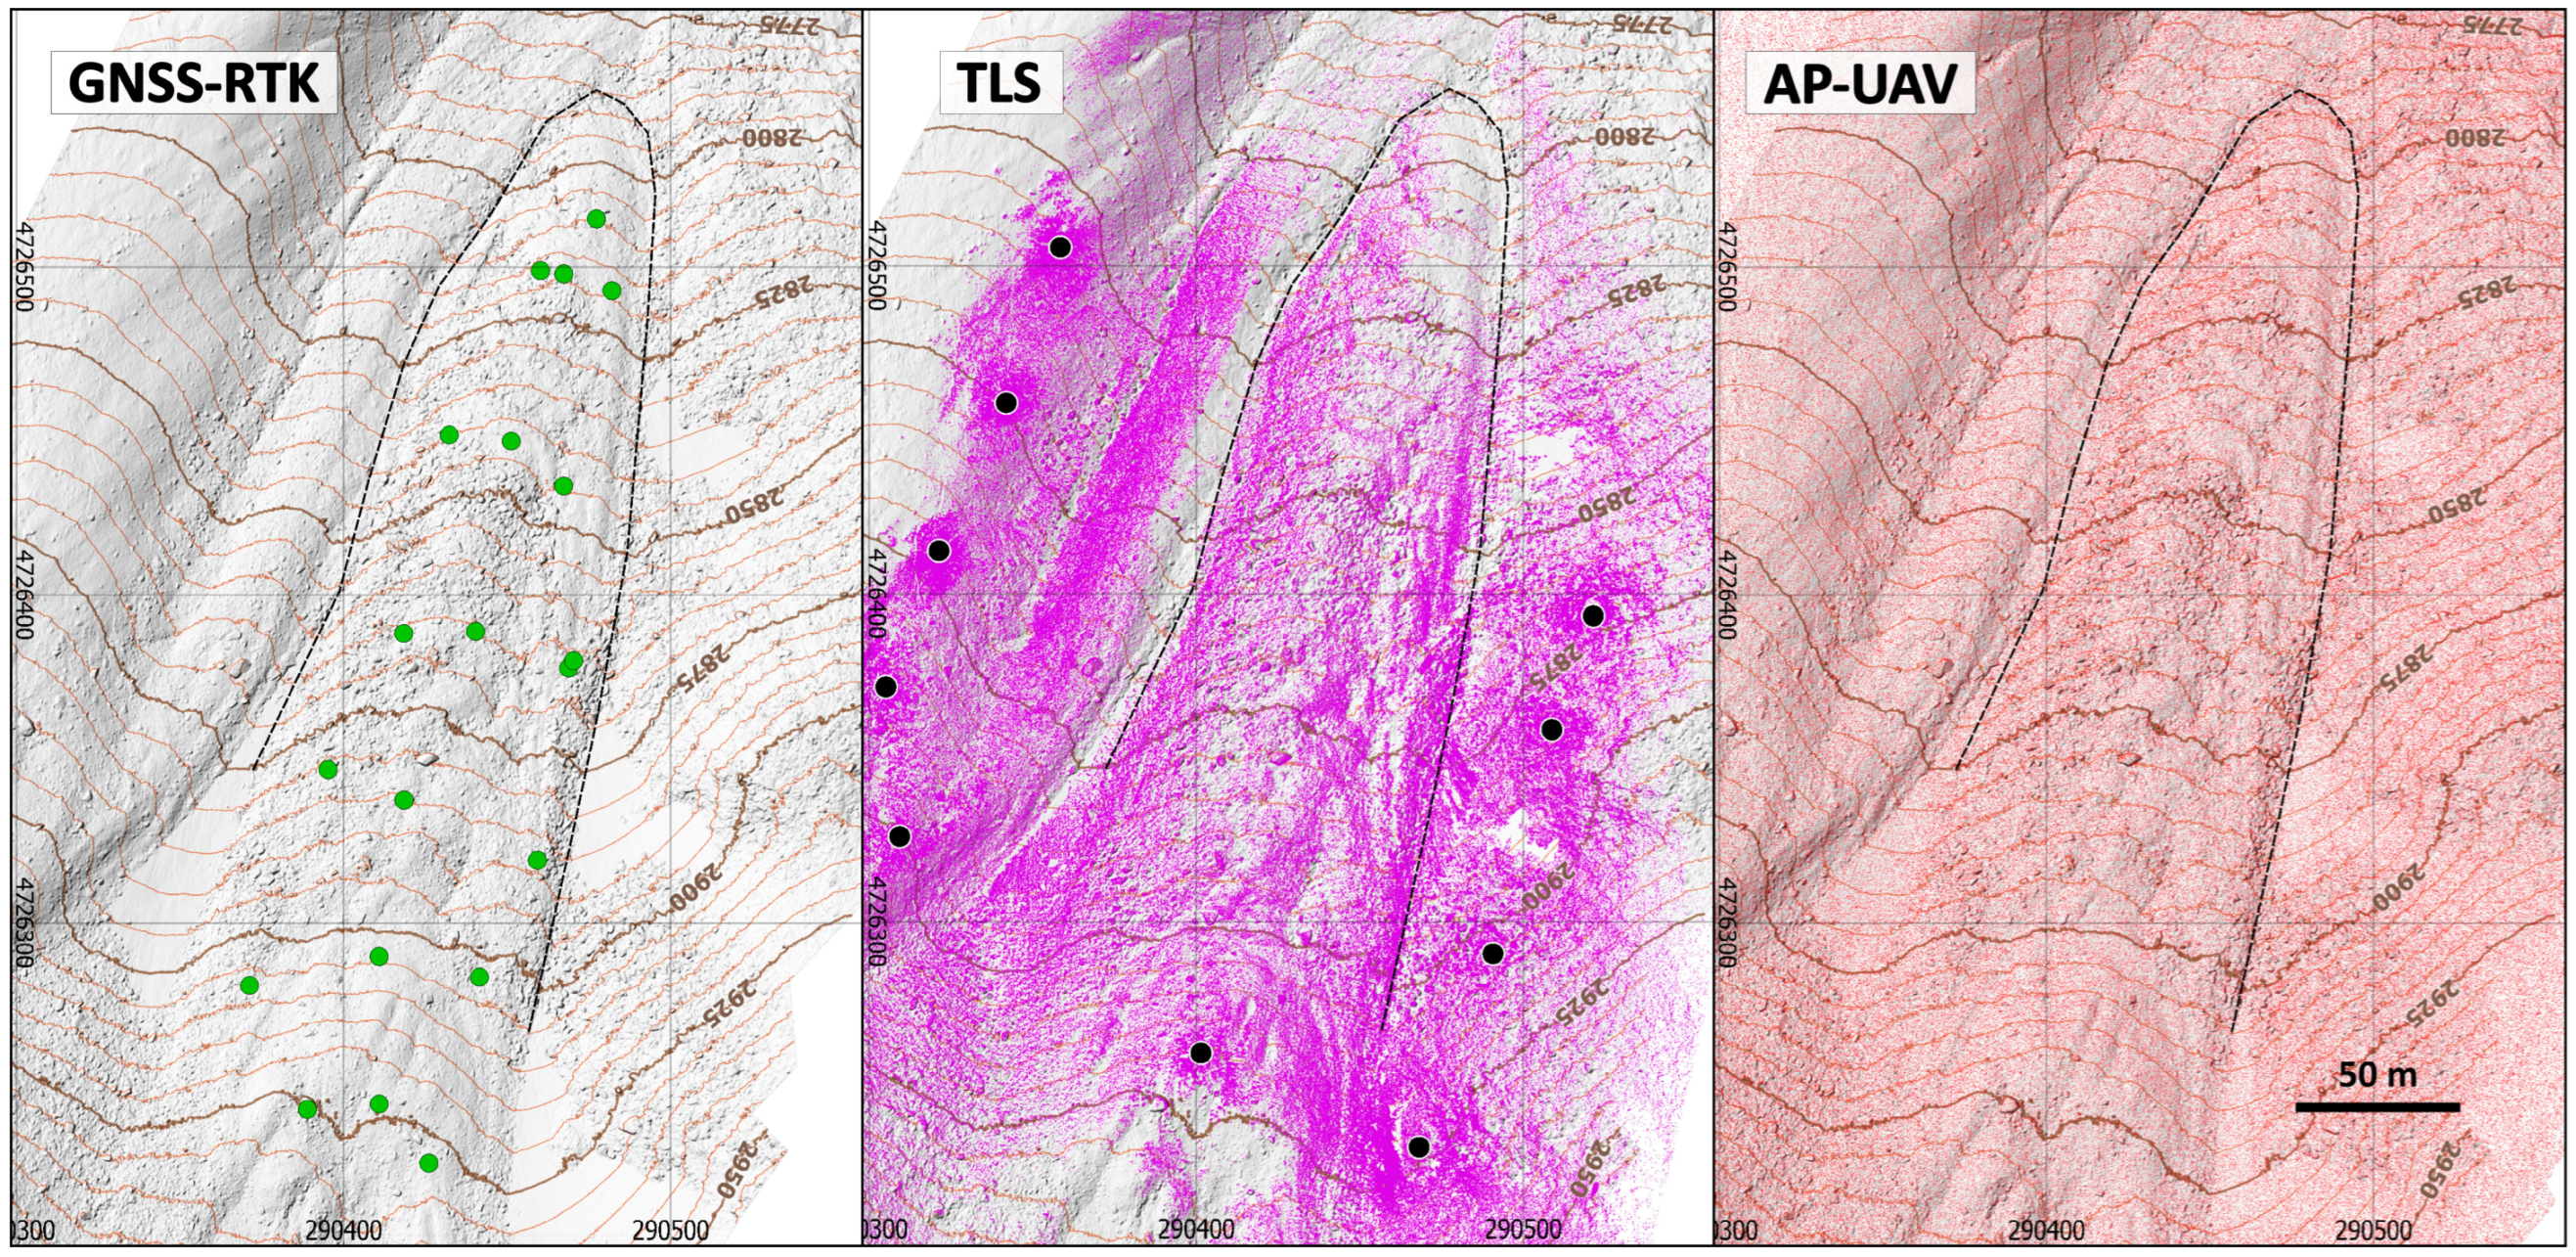
4.1. Surveys Quality
4.2. Rock Glacier Surveys
4.3. Rock Glacier Changes
5. Discussion
6. Conclusions
Supplementary Materials
Author Contributions
Funding
Data Availability Statement
Acknowledgments
Conflicts of Interest
References
- Barsch, D. Rockglaciers. Indicators for the Present and Former Geoecology in High Mountain Environments; Springer Series in Physical Environment; Springer: Berlin/Heidelberg, Germany, 1996; ISBN 978-3-642-80095-5. [Google Scholar]
- Sorg, A.; Kääb, A.; Roesch, A.; Bigler, C.; Stoffel, M. Contrasting Responses of Central Asian Rock Glaciers to Global Warming. Sci. Rep. 2015, 5, 8228. [Google Scholar] [CrossRef] [PubMed]
- Schaffer, N.; MacDonell, S.; Réveillet, M.; Yáñez, E.; Valois, R. Rock Glaciers as a Water Resource in a Changing Climate in the Semiarid Chilean Andes. Reg. Environ. Chang. 2019, 19, 1263–1279. [Google Scholar] [CrossRef]
- Johnson, G.; Chang, H.; Fountain, A. Active Rock Glaciers of the Contiguous United States: Geographic Information System Inventory and Spatial Distribution Patterns. Earth Syst. Sci. Data 2021, 13, 3979–3994. [Google Scholar] [CrossRef]
- Marcer, M.; Cicoira, A.; Cusicanqui, D.; Bodin, X.; Echelard, T.; Obregon, R.; Schoeneich, P. Rock Glaciers throughout the French Alps Accelerated and Destabilised since 1990 as Air Temperatures Increased. Commun. Earth Environ. 2021, 2, 81. [Google Scholar] [CrossRef]
- Konrad, S.K.; Humphrey, N.F.; Steig, E.J.; Clark, D.H.; Potter, N., Jr.; Pfeffer, W.T. Rock Glacier Dynamics and Paleoclimatic Implications. Geology 1999, 27, 1131–1134. [Google Scholar] [CrossRef]
- Müller, J.; Vieli, A.; Gärtner-Roer, I. Rock Glaciers on the Run—Understanding Rock Glacier Landform Evolution and Recent Changes from Numerical Flow Modeling. Cryosphere 2016, 10, 2865–2886. [Google Scholar] [CrossRef]
- Winkler, S.; Lambiel, C. Age Constraints of Rock Glaciers in the Southern Alps/New Zealand—Exploring Their Palaeoclimatic Potential. Holocene 2018, 28, 778–790. [Google Scholar] [CrossRef]
- Staub, B.; Delaloye, R. Using Near-Surface Ground Temperature Data to Derive Snow Insulation and Melt Indices for Mountain Permafrost Applications. Permafr. Periglac. Process. 2017, 28, 237–248. [Google Scholar] [CrossRef]
- Vivero, S.; Pellet, C. The Rock Glacier Inventories and Kinematics (RGIK) Action Group: Status and Future Directions. In Proceedings of the 10th International Conference on Geomorphology, ICG2022-478, Coimbra, Portugal, 12–16 September 2022. [Google Scholar]
- Serrano, E.; Agudo, C.; Martinez De Pisón, E. Rock Glaciers in the Pyrenees. Permafr. Periglac. Process. 1999, 10, 101–106. [Google Scholar] [CrossRef]
- Serrano, E.; de Sanjosé-Blasco, J.J.; Gómez-Lende, M.; López-Moreno, J.I.; Pisabarro, A.; Martínez-Fernández, A. Periglacial Environments and Frozen Ground in the Central Pyrenean High Mountain Area: Ground Thermal Regime and Distribution of Landforms and Processes. Permafr. Periglac. Process. 2019, 30, 292–309. [Google Scholar] [CrossRef]
- Serrano, E.; San José, J.J.; Agudo, C. Rock Glacier Dynamics in a Marginal Periglacial High Mountain Environment: Flow, Movement (1991–2000) and Structure of the Argualas Rock Glacier, the Pyrenees. Geomorphology 2006, 74, 285–296. [Google Scholar] [CrossRef]
- Serrano, E.; de Sanjosé, J.J.; González-Trueba, J.J. Rock Glacier Dynamics in Marginal Periglacial Environments. Earth Surf. Process. Landf. 2010, 35, 1302–1314. [Google Scholar] [CrossRef]
- Chueca, J.; Julián, A. Movement of Besiberris Rock Glacier, Central Pyrenees, Spain: Data from a 10-Year Geodetic Survey. Arct. Antarct. Alp. Res. 2005, 37, 163–170. [Google Scholar] [CrossRef]
- González García, M.; Serrano, E.; Sanjosé Blasco, J.J.; González Trueba, J.J. Surface Dynamic and Current Status of the Madaleta Rock Glacier (Pyrenees). Cuad. Investig. Geogr. 2013, 37, 81–94. [Google Scholar] [CrossRef]
- de Sanjosé, J.J.; Berenguer, F.; Atkinson, A.D.J.; De Matías, J.; Serrano, E.; Gómez-ortiz, A.; González-garcía, M.; Rico, I. Geomatics Techniques Applied to Glaciers, Rock Glaciers, and Ice Patches in Spain (1991–2012). Geogr. Ann. Ser. A Phys. Geogr. 2014, 96, 307–321. [Google Scholar] [CrossRef]
- Martínez-Fernández, A.; Serrano, E.; Sanjosé, J.J.; Gómez-Lende, M.; Pisabarro, A.; Sánchez, M. Geomatic Methods Applied to the Change Study of the La Paúl Rock Glacier, Spanish Pyrenees. ISPRS-Int. Arch. Photogramm. Remote Sens. Spat. Inf. Sci. 2019, XLII-2/W13, 1771–1775. [Google Scholar] [CrossRef]
- Fey, C.; Krainer, K. Analyses of UAV and GNSS Based Flow Velocity Variations of the Rock Glacier Lazaun (Ötztal Alps, South Tyrol, Italy). Geomorphology 2020, 365, 107261. [Google Scholar] [CrossRef]
- Vivero, S.; Hendrickx, H.; Frankl, A.; Delaloye, R.; Lambiel, C. Kinematics and Geomorphological Changes of a Destabilising Rock Glacier Captured from Close-Range Sensing Techniques (Tsarmine Rock Glacier, Western Swiss Alps). Front. Earth Sci. 2022, 10, 1017949. [Google Scholar] [CrossRef]
- Serrano, E.; Agudo, C.; Delaloyé, R.; González-Trueba, J.J. Permafrost Distribution in the Posets Massif, Central Pyrenees. Nor. Geogr. Tidsskr. 2001, 55, 245–252. [Google Scholar] [CrossRef]
- Serrano, E.; González Trueba, J.J.; Sanjosé, J.J. Dynamic, Evolution and Structure of Pyrenean Rock Glaciers. Cuad. Investig. Geogr. 2011, 37, 145–170. [Google Scholar] [CrossRef]
- Lugon, R.; Delaloye, R.; Serrano, E.; Reynard, E.; Lambiel, C.; González-Trueba, J.J. Permafrost and Little Ice Age Glacier Relationships, Posets Massif, Central Pyrenees, Spain. Permafr. Periglac. Process. 2004, 15, 207–220. [Google Scholar] [CrossRef]
- Martínez Fernández, A. Monitorización de Glaciares y Glaciares Rocosos Pirenaicos: Más de una Década Aplicando Técnicas Geomáticas en La Paúl y Maladeta. Ph.D. Thesis, Universidad de Valladolid, Valladolid, Spain, 2023. [Google Scholar] [CrossRef]
- ERGNSS Red Geodésica Nacional de Estaciones de Referencia GNSS (ERGNSS)—IGN. Available online: https://www.ign.es/web/ign/portal/gds-gnss-estaciones-permanentes (accessed on 23 September 2020).
- Chapter 2—Geometric Processing and Positioning Techniques. In Advanced Remote Sensing, 2nd ed.; Liang, S.; Wang, J. (Eds.) Academic Press: Cambridge, MA, USA, 2020; pp. 59–105. ISBN 978-0-12-815826-5. [Google Scholar]
- QGIS Development Team QGIS Geographic Information System. Open Source Geospatial Foundation Project 2021. Available online: https://qgis.org/ (accessed on 12 December 2023).
- Martínez-Fernández, A.; Serrano, E.; Pisabarro, A.; Sánchez-Fernández, M.; de Sanjosé, J.J.; Gómez-Lende, M.; Lázaro, G.R.; Benito-Calvo, A. The Influence of Image Properties on High-Detail SfM Photogrammetric Surveys of Complex Geometric Landforms: The Application of a Consumer-Grade UAV Camera in a Rock Glacier Survey. Remote Sens. 2022, 14, 3528. [Google Scholar] [CrossRef]
- Lague, D.; Brodu, N.; Leroux, J. Accurate 3D Comparison of Complex Topography with Terrestrial Laser Scanner: Application to the Rangitikei Canyon (N-Z). ISPRS J. Photogramm. Remote Sens. 2013, 82, 10–26. [Google Scholar] [CrossRef]
- IPA Action Group: Rock Glacier Inventories and Kinematics; RGIK Optional Kinematic Attribute in Standardized Rock Glacier Inventories (Version 3.0.1); 2022; 8p, Available online: https://www.unifr.ch/geo/geomorphology/en/research/ipa-action-group-rock-glacier/ (accessed on 12 December 2023).
- Kenner, R.; Chinellato, G.; Iasio, C.; Mosna, D.; Cuozzo, G.; Benedetti, E.; Visconti, M.G.; Manunta, M.; Phillips, M.; Mair, V.; et al. Integration of Space-Borne DInSAR Data in a Multi-Method Monitoring Concept for Alpine Mass Movements. Cold Reg. Sci. Technol. 2016, 131, 65–75. [Google Scholar] [CrossRef]


| 2013 | 2014 | 2015 | 2016 | 2017 | 2018 | 2019 | 2020 | |
|---|---|---|---|---|---|---|---|---|
| GNSS | ||||||||
| TLS | ||||||||
| AP-UAV |
| 2013–2020 | ||||
|---|---|---|---|---|
| Point ID | Velocity (cm/y) | Total Displacement (cm) | ||
| XY | Z | XY | Z | |
| 1 | 32 | −15 | 222 | −103 |
| 2 | 40 | −18 | 280 | −126 |
| 3 | 66 | −21 | 459 | −144 |
| 4 | 28 | −16 | 193 | −111 |
| 5 | 45 | −28 | 312 | −198 |
| 6 | 32 | −14 | 223 | −96 |
| 7 | 16 | −10 | 112 | −69 |
| 8 | 35 | −19 | 173 | −97 |
| 9 | 35 | −14 | 173 | −85 |
| 10 | 37 | −18 | 187 | −105 |
| 11 | 37 | −18 | 256 | −125 |
| 12 | 17 | −6 | 122 | −43 |
| 13 | 13 | −11 | 89 | −75 |
| 14 | 30 | −18 | 209 | −124 |
| 15 | 37 | −27 | 260 | −188 |
| 16 | 38 | −27 | 265 | −186 |
| 17 | 33 | −29 | 234 | −203 |
| 18 | 38 | −31 | 264 | −220 |
| 19 | 22 | −23 | 156 | −160 |
| 20 | 31 | −30 | 214 | −209 |
| Mean | 33 | −20 | 220 | −133 |
| TLS Point Cloud | 2016–2017 | 2017–2018 | 2018–2019 | 2019–2020 |
|---|---|---|---|---|
| M3C2 distance (cm; mean ± SD) | 20 ± 11 | 18 ± 16 | 22 ± 18 | 18 ± 10 |
Disclaimer/Publisher’s Note: The statements, opinions and data contained in all publications are solely those of the individual author(s) and contributor(s) and not of MDPI and/or the editor(s). MDPI and/or the editor(s) disclaim responsibility for any injury to people or property resulting from any ideas, methods, instructions or products referred to in the content. |
© 2023 by the authors. Licensee MDPI, Basel, Switzerland. This article is an open access article distributed under the terms and conditions of the Creative Commons Attribution (CC BY) license (https://creativecommons.org/licenses/by/4.0/).
Share and Cite
Martínez-Fernández, A.; Serrano, E.; de Sanjosé Blasco, J.J.; Gómez-Lende, M.; Sánchez-Fernández, M.; Pisabarro, A.; Atkinson, A. Multiple Close-Range Geomatic Techniques for the Kinematic Study of the La Paúl Rock Glacier, Southern Pyrenees. Remote Sens. 2024, 16, 134. https://doi.org/10.3390/rs16010134
Martínez-Fernández A, Serrano E, de Sanjosé Blasco JJ, Gómez-Lende M, Sánchez-Fernández M, Pisabarro A, Atkinson A. Multiple Close-Range Geomatic Techniques for the Kinematic Study of the La Paúl Rock Glacier, Southern Pyrenees. Remote Sensing. 2024; 16(1):134. https://doi.org/10.3390/rs16010134
Chicago/Turabian StyleMartínez-Fernández, Adrián, Enrique Serrano, José Juan de Sanjosé Blasco, Manuel Gómez-Lende, Manuel Sánchez-Fernández, Alfonso Pisabarro, and Alan Atkinson. 2024. "Multiple Close-Range Geomatic Techniques for the Kinematic Study of the La Paúl Rock Glacier, Southern Pyrenees" Remote Sensing 16, no. 1: 134. https://doi.org/10.3390/rs16010134
APA StyleMartínez-Fernández, A., Serrano, E., de Sanjosé Blasco, J. J., Gómez-Lende, M., Sánchez-Fernández, M., Pisabarro, A., & Atkinson, A. (2024). Multiple Close-Range Geomatic Techniques for the Kinematic Study of the La Paúl Rock Glacier, Southern Pyrenees. Remote Sensing, 16(1), 134. https://doi.org/10.3390/rs16010134