Abstract
Landsat 9 (L9) was launched on 27 September 2021. This spacecraft contained two instruments, the Operational Land Imager-2 (OLI-2) and Thermal Infrared Sensor-2 (TIRS-2), that allow for a continuation of the Landsat program and the mission to acquire multi-spectral observations of the globe on a moderate scale. Following a period of commissioning, during which time the spacecraft and instruments were initialized and set up for operations, with the initial calibration performed, the mission moved to an operational mode This operational mode involved the same cadence and methods that were performed for the Landsat 8 (L8) spacecraft and the two instruments onboard, the Operational Land Imager-1 (OLI-1) and Thermal Infrared Sensor-1 (TIRS-1), with respect to calibration, characterization, and validation. This paper discusses the geometric operational aspects of the L9 instruments during the first year of the mission and post-commissioning, and compares these same geometric activities performed for L8 during the same time frame. During this time, optical axes of the two sensors, OLI-1 and OLI-2, were adjusted to stay aligned with the spacecraft’s Attitude Control System (ACS), and the TIRS-1 and TIRS-2 instruments were adjusted to stay aligned with the OLI-1 and OLI-2 instruments, respectively. In this paper, the L9 operational adjustments are compared to the same operational aspects of L8 during this same time frame. The comparisons shown in this paper will demonstrate that both instruments aboard L8 and L9 performed very similar geometric qualities while fully meeting the expected requirements. This paper describes the geometric differences between the L9 imagery that was made available to the public prior to the reprocessing campaign that was performed using the new calibration updates to the sensor and to ACS and TIRS-to-OLI alignment parameters. This reprocessing campaign of L9 products involved data acquired from the launch of the spacecraft up to early 2023.
1. Introduction
Landsat 8 (L8) and Landsat 9 (L9) contain the same instrument payloads, the Operational Land Imager (OLI) and Thermal Infrared Sensor (TIRS), with similar but not replica satellite buses [1,2]. Therefore, both missions have the same engineering designs from a spacecraft and set of instruments’ perspective. This is especially true from a purely geometric standpoint. Because of these consistencies, their geometric calibration, characterization and processing steps are the same for both spacecrafts and their sets of instruments. Some of the key operational geometric aspects for both the spacecrafts and instruments, from a calibration and characterization standpoint, are discussed within this paper. Throughout this paper, the Operational Land Imager and Thermal Infrared Sensor that are both present aboard the two spacecrafts will be listed as OLI or TIRS, respectively, when the discussion pertains to either sets of instruments. Otherwise, OLI or TIRS will be followed by one or two designations, with one signifying the instrument aboard the L8 spacecraft and the second signifying the instrument aboard the L9 spacecraft when it is appropriate to differentiate a specific set of these instruments.
An important aspect of the analysis described within this paper pertains to how operations were handled between the beginning of 2022 and the end of 2022 for the L8 and L9 missions. With a similar design and architecture, the expectation was that the L9 spacecraft and the instruments onboard would behave in a manner similar to that observed for the L8 mission. Although expected, this was not guaranteed; therefore, for the 2022 timeframe, only a small subset of calibration activities was performed with regards to updates for L9. A suite of updates was then implemented at the beginning of 2023 based on any updates needed between the end of the L9 commissioning, which was the beginning of 2022, and up to the first quarter of 2023. Once this suite of calibration updates was performed for the 2022 to early 2023 timeline, a reprocessing of the archive of the L9 data occurred with these new updated calibration parameters [3,4]. As L8 was entering into its ninth year of operations, and within a given United States Geological Survey (USGS) Collection, the goal was to maintain calibrations and updates throughout 2022 to keep with the current mission processing and calibration criteria associated with the collection philosophy [5]. This paper therefore represents a timeline of approximately one year, where L9 and its instruments were monitored for calibration updates and then those updates were applied to the archive as a post-processing set of updates. L8 and its instruments maintained a collection-based cadence of performing quarterly updates throughout that same time period based on predictions performed during the monitoring of the spacecraft and instruments’ behavior. For L8, these geometric calibrations were updates of predictions placed within the production environment; whereas, for L9, these calibration updates were measured, placed within the production environment, and then the archive was reprocessed based on the measured calibration updates. Once this reprocessing occurred for the L9 archive, it was placed within the collection cadence under the same premise as conducted for L8.
1.1. Spacecraft and Instrument Characteristics
Both the L8 and L9 spacecraft are equipped with a Global Positioning System (GPS) unit, Star Tracker, and Inertial Reference Unit (IRU), which are part of the Attitude Control System (ACS). These sensors attempt to keep the navigation reference frame aligned with the orbital coordinate system, such that nominal science data collections are pointing nadir towards Earth. The OLI and TIRS instruments aboard the two spacecrafts are pushbroom instruments made up of separate but overlapping linear arrays called Sensor Chip Assemblies (SCA). The SCAs, when combined, complete an across-track field of view for both instruments that covers the nominal 185 km swath width. OLI collects Visible and Near Infrared (VNIR) and Short-Wave Infrared (SWIR) wavelengths at a 30 m ground distance along with a panchromatic 15 m band. The TIRS sensor collects two long-wave thermal spectral channels centered at 10.9 and 12 μm at a 100 m ground distance. The staggering of the SCAs for each instrument in the along-track direction allows for an SCA-to-SCA overlap in the across-track field of view. This staggering of the SCAS in the along-track direction means that each band within an SCA will be imaging locations on the Earth at different times and sensor angles, requiring excellent spacecraft stability and ancillary data accuracy for good instrument and band registration. The differing angular viewing geometry for each band within each SCA means that precision terrain corrected imagery is needed to remove the parallax of each SCA to perform characterization and calibration while creating seamless data products. A Level-1 Terrain Precision (L1TP) image is generated by correcting the Level-1 Systematic Terrain (L1GT) image line-of-sight model based on measured offsets between Ground Control Chips (GCPs) and the imagery. Corrections to the spacecraft attitude and ephemeris are determined through a non-linear least squares procedure that minimizes the differences between the measured locations of the control points and their true ground locations. Figure 1 and Figure 2 show the focal plane layout for the OLI and TIRS instruments, respectively.

Figure 1.
Operational Land Imager (OLI) focal plane layout. Each sensor is made up of 14 individual linear arrays or Sensor Chip Assemblies (SCAs). The placement of the Short-Wave Infrared (SWIR) and Visible and Near Infrared (VNIR) are designated within the figure.
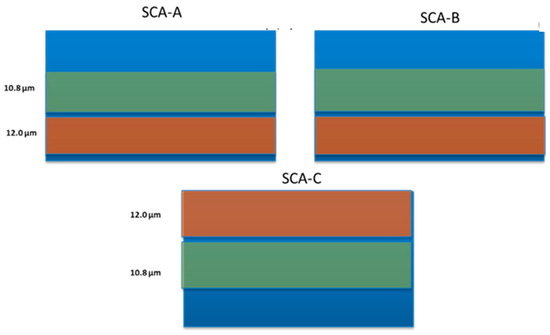
Figure 2.
Thermal Infrared Sensor (TIRS) focal plane layout. Each sensor is made up of three individual linear arrays or Sensor Chip Assemblies (SCAs).
1.2. Processing Systems and Reference Imagery
The USGS has developed two Landsat processing systems. One is based on product generation and termed Landsat Product Generation System (LPGS), and one is based on the calibration, characterization, and validation of the Landsat spacecrafts and instruments and termed the Image Assessment System (IAS). From a geometric perspective, two types of ground control reference datasets are used within these two processing systems. LPGS uses the USGS Collection 2 (C2) Ground Control Library, which will be referred to as the C2 GCPs within this paper. This ground control is primarily used for product generation due to its global distribution and density throughout the globe. Statistics generated from the LPGS offer the user community an understanding of the geometric characteristics of the products distributed. The IAS uses ground control, which is termed as the Geometric Supersite ground control and sparsely distributed throughout the globe but considered more accurate than that of the C2 GCPs. For some geometric applications, the C2 GCPs are used within the IAS; however, for the calibration routines requiring the higher accuracy reference imagery, the Geometric Supersite ground control is used. Prior to the reprocessing of the Landsat archive for the creation of the C2 archive, the Landsat ground control was block adjusted to better align it to that of the Sentinel ground control, while at the same time approximately doubling the number of ground control points by adding L8 OLI-1 chips to the library [6,7,8]. This adjustment was performed based on the Global Reference Imagery (GRI) created by the Sentinel-2 mission which is implemented within their product generation system. By “harmonizing” the Landsat ground control to the GRI, the co-registration was substantially improved between products generated from the two programs and as well as the accuracy of the GCPs used within the LPGS.
The location of the Geometric Supersites globally is shown in Figure 3. This imagery is composed of USGS Digital Orthophoto Quadrangle (DOQ) data, GPS-controlled Satellite pour l’Observation de la Terre (SPOT) imagery or the Australian Geographic Reference Image (AGRI) provided by Geoscience Australia [9,10]. The C2 GCPs are shown in Figure 4 and often used for a further verification of the calibration. The C2 GCPs are made up of imagery from the Enhanced Thematic Mapper Plus (ETM+) aboard L7 and the OLI-1 aboard L8. Figure 4 demonstrates both the distribution and the density of the C2 GCPs. The Geometric Supersites are estimated to provide an absolute accuracy of approximately 6 m, whereas the C2 GCPs are estimated to provide an absolute accuracy of approximately 9.5 m.
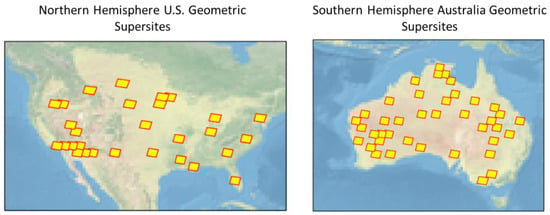
Figure 3.
Distribution of Geometric Supersites. Images are mosaics of high-resolution Digital Ortho Photo Quadrangles, Satellite pour l’Observation de la Terre, or Geoscience Australia Reference Imagery. These high-resolution images are subsampled to 15 m image and ground control and used for calibration of the Landsat instruments and spacecrafts.
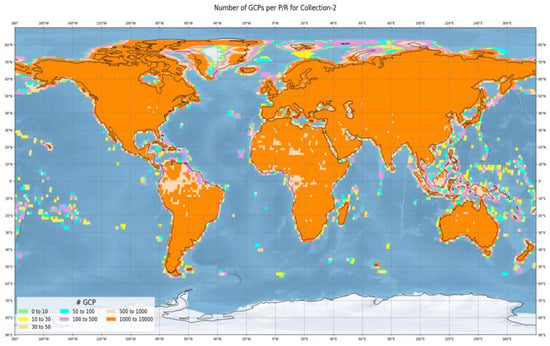
Figure 4.
Density of the U.S. Geological Survey (USGS) collection 2 Ground Control Library. Ground Control Chips (GCPs) are 30 m in resolution and are used in generating USGS Landsat products for distribution to the user community.
1.3. Calibration Updates
During 2022, L8 had one OLI-1 to spacecraft sensor alignment and one TIRS-1 to OLI-1 alignment performed. This change occurred during the second quarter of 2022. During 2022, L9 had quarterly updates performed for both the OLI-2 to spacecraft sensor alignment and the TIRS-2 to OLI-2 alignment. These calibration updates are shown in Table 1.

Table 1.
Calibration updates for Landsat 8 (L8) and Landsat 9 (L9) that were performed in 2022. Because the L8 updates were based on updates to the predicted alignment parameters, the 4th quarter (Q4) of 2021 is listed in the table and given only from a reference perspective that pertained to the previous quarter. Static is listed for L9 for the 4th quarter of 2021 because the calibration parameters were held constant after commissioning and not updated until the end of 2022, at which point both the sensor and TIRS-2 alignment were updated for each quarter.
2. Materials and Methods
The Landsat IAS was designed and built to verify requirements during the mission commissioning phase, in addition to calibrating, characterizing, and validating instrument and spacecraft performance during operations, as well as determining the product accuracy for the science data produced from the USGS LPGS. From a geometry perspective, the IAS uses a set of image correlation routines to mensurate between images created from an instruments’ science data against either Landsat-generated science data or reference imagery (Geometric Supersites) as part of the calibration activities [11,12]. The key geometric calibration and characterization processes discussed in this paper are (1) Sensor Alignment, which aligns the OLI optical axis with the spacecraft Attitude Control System (ACS), (2) within instrument band alignment, (3) instrument-to-instrument alignment (TIRS-to-OLI), and (4) the accuracy of the L1TP products generated based on the type of ground control used in the registration step. The processes involved for band alignment, sensor alignment, and inter sensor alignment will be briefly described. A more thorough explanation of the processes along with the other geometric capabilities of the IAS can be found in the Landsat 8 and 9 Algorithm Description Document (ADD) [13]. The ADD document also address the resampling process needed for generating the imagery for characterization, calibration, and products which combine an Akima resampling step with a cubic convolution step; these are both needed to obtain the subpixel adjustments required for a band alignment.
2.1. Sensor Alignment
The Sensor Alignment algorithm, which refers to the OLI-to-Spacecraft alignment, uses a time sequence of results generated by the precision correction process to estimate the orientation of the OLI coordinate system relative to the spacecraft attitude determination coordinate system. Analyzing a time sequence of measured alignment results makes it possible to smooth out random scene-to-scene pointing errors to estimate, and correct for, any underlying systematic alignment errors. Part of the logic within the precision correction step takes the solution output and converts it to apparent alignment errors for each individual scene. These individual scene alignment parameters can then be filtered for outliers, smoothed into a long-term trend, and used within the LPGS to improve upon the accuracy of the L1GT products created. An Architecture Diagram is shown for this process in Figure 5. Precision estimated alignment results are extracted from both the IAS and LPGS databases. Outliers are removed based on the number of GCPs used in the precision solution step. Once outliers are removed, a weighted average is calculated over the data, with the roll, pitch, and yaw values being used to determine a new alignment matrix.
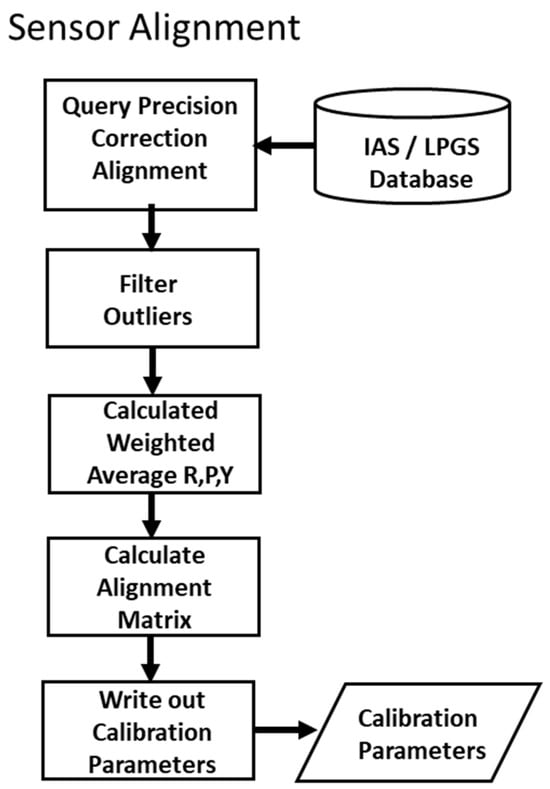
Figure 5.
An Architecture Diagram for the Landsat 8 and 9 Sensor Alignment algorithm is shown. The precision correction results for all the Level-1 Terrain Precision (L1TP) images are extracted from the Image Assessment System (IAS) and Landsat Product Generation System (LPGS) databases. The individual estimated alignment parameters for the L1TPs are filtered for outliers, and a weighted average is calculated over a given time range. These weighted averages are used to determined new roll (R), pitch (P), and yaw (Y) calibration parameters.
2.2. Band Characterization
The Band Characterization algorithm measures the displacement between any two bands within or across the two instruments. If Band Characterization is used in determining alignment within one of the instruments, the algorithm works by choosing tie point locations within band pairs of each SCA. These tie point locations are used for extracting windows of imagery from each band and performing a grey scale or least squares correlation on the image windows extracted. From these band characterization results, a calibration update computation step can be performed determining line-of-sight model corrections to the Legendre coefficients that adjust the original line-of-sight model to minimize the residual per SCA and band deviations calculated. A calibration update is only performed if the offsets can produce a measurable change in line-of-sight coefficients. An Architecture Diagram is shown for this process in Figure 6. An L1TP image is used as the input and the image-to-image correlation is executed for each band combination based on the type of band characterization that is to be performed. For band combinations of differing resolutions, the higher resolution band is always treated as the reference band, and the resolution is reduced to match that of the lower resolution search band. Each band combination is measured within OLI as a method of oversampling the displacement measured of the band alignment within the instrument. An outlier rejection is performed on these measurements based on a chosen tolerance and the Student’s t-test distribution. Statistics such as the mean, standard deviation, and maximum and minimum values for each SCA and band combination are reported, providing inputs into any necessary calibration parameter updates that may be needed.
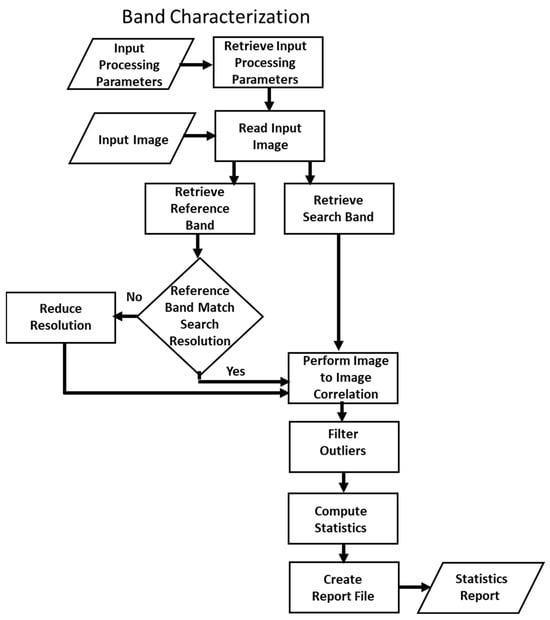
Figure 6.
An Architecture Diagram for the Landsat 8 and 9 Band Characterization algorithm is shown. The displacement between each band combination is measured using image-to-image correlation techniques. The statistics for these displacements are calculated and used in determining any necessary inter instrument or between instrument calibration parameter changes that may be needed.
2.3. TIRS Alignment
The TIRS Alignment algorithm uses an OLI short-wave infrared (SWIR) band image as a reference, comparing it to a SCA-separated TIRS 10.8 µm band image. An L1TP image is used for the comparison. Each SCA of the TIRS instrument in the L1TP image is compared to the SCA-combined OLI reference band to measure both systematic full-scene TIRS-to-OLI misregistration and SCA-specific deviations from the scene-average registration perspective. The measured deviations are used to estimate corrections to the TIRS-to-OLI alignment matrix and to the 10.8 µm band Legendre polynomial coefficients that model the lines-of-sight for each SCA. An Architecture Diagram is shown for this process in Figure 7. The displacement between the SWIR band (band 6) of the OLI instrument and the 10.8 µm (band 10) of the TIRS instrument is measured. This band combination was chosen through an analysis based on the best band combination for the image correlation step between the two instruments. This analysis was determined through both the Landsat 8 mission as well as the previous Landsat missions Landsat 5 (L5) and Landsat (L7), which also contained a thermal band. An outlier rejection is performed on these measurements based on a chosen tolerance and the Student’s t-test distribution. These measured displacements between these two bands are used to adjust the orientation parameters between the TIRS and OLI instruments. These new orientation parameters are based on adjusting the TIRS line of sight’s to better align the instrument optical axis to that of the OLI instrument optical axis. The statistics associated with this orientation for prior and post adjustments are determined.
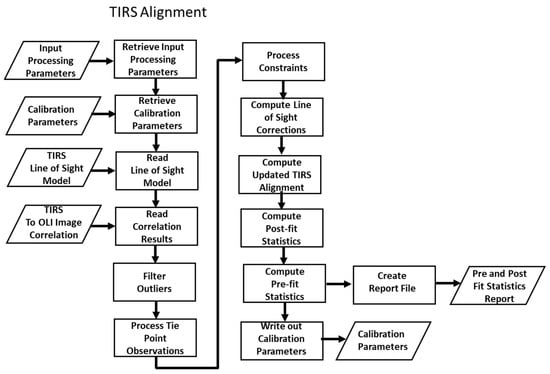
Figure 7.
An Architecture Diagram for the Landsat 8 and 9 Thermal Infrared Sensor (TIRS) Alignment algorithm is shown. The alignment between the Short-Wave Infrared (SWIR) band of the Operational Land Imager (OLI) and 10.8 µm band of TIRS is determined through this process. Image to image correlation is performed between the two bands. These measured offsets are used to determine new alignment parameters between the two instruments.
2.4. Geometric Accuracy
Geometric accuracy assessment, or geometric characterization, analyzes the results of measurements derived between a set of ground control chips with a L1TP image. This set of validation ground control is taken from either the C2 GCPs or the Geometric Supersite GCPs but is not used in the precision correction step in creating the L1TP. Statistics are computed for these measurements for each L1TP image for which these validation GCPs are available. The results provide a measure of the accuracy of the L1TP that is distributed to the user community.
2.5. Calibration Parameter File
The new parameters discussed within this paper for L8 and L9 are placed within the Calibration Parameter File (CPF), which is accessed for generating all Level-1 products within the LPGS and IAS. A nominal length of 3 months for what is termed an active CPF is used; this is the time range with respect to the number of image acquisitions that are part of a particular CPF and can be used in generating Level-1 products within LPGS. This nominal 3 month time frame for a CPF leads to the often-used term of a quarterly CPF; it is also referred to as the effective dates for a CPF. On occasion, a CPF must be broken within a calendar quarter to accommodate a given change within the spacecraft or one of the instruments that is outside a 3 month cadence, but the emphasis is to keep the number of CPFs to a more manageable number by striving for only generating a given CPF for a 3 month time range [14].
2.6. Image-to-Image Correlation
The mensuration process for all geometric calibration and characterization is essentially the same. The image-to-image correlation is performed between two sets of images or image chips. Most of these geometric processes refer to a search and reference image or chip with the reference term identifying “truth” for the calibration or characterization procedure. Several criteria are used in determining whether the image-to-image correlation step was successful. These criteria include the search offsets that are allowable, the measured displacement, and the strength of the correlation peak. The sub-pixel location of the measured offset is calculated by fitting a second order polynomial around the discrete correlation surface and solving for the fractional peak location of the fitted polynomial within that discrete surface. The total offset measured is then the integer location of the correlation peak plus the sub-pixel location calculated. Even with the automated outlier steps, a visual inspection of graphics or the calculated statistics will often determine the path to be taken for updates to the calibration parameters. Numerous investigations and papers have explored the impact of noise within correlation processes or the ability to make quality measured offsets between two signals or images [15,16,17,18]. Clouds, snow, and even landscape change can affect the results of the correlation and hence the quality of the measurements achieved, which in many ways can be viewed as noise within the mensuration step itself. For calibration and characterization, imagery that are daylit cloud and snow free are stressed as input datasets into the processes. For steps that involve procedures, such as inter band comparisons, carefully chosen locations with landscapes whose spectral responses are conducive to these types of measurements are chosen. However, even with a robust set of input data and outlier logic on the mensuration, when considering landscape changes between the two datasets and the inherent errors associated with the image correlation steps, often observations and results based on a basic concept of changes of less than a 0.1 instantaneous field of view (IFOV) are set as being the upper threshold for the ability to measure offsets between the two datasets. Under this scenario, “characterization” has been performed, and the measured offsets are within the noise of what can be assessed between the two datasets. For these conditions, no calibration updates may be the chosen path within the set operations to be performed. This scenario then represents that either the spacecraft or instrument, or both, have unchanged calibration parameters from those previously calculated, such that the CPF and the contents within it do not change.
For L9 and the updating of the calibration parameters for reprocessing, a verification of the CPFs was performed prior to the reprocessing of the archive. Scenes were chosen such that they would represent the change expected when reprocessed (they need to fall on the trend line that is to be removed), they needed to be cloud-free, they needed to be known to produce strong precision correction results, and they needed to be well distributed geographically. For strong precision correction results, this meant that the precision step needed to keep a large number of GCPs in the solution while also having low standard deviations for their post fit statistics between the search and reference imagery. Because the Geometric Supersites are a small set of ground controls with respect to the C2 GCPS, in terms of global coverage, and because all the good quality Geometric Supersites used in the calibration process were also selected for verification, the Geometric Supersite datasets chosen for verification were not considered as independent validations of the new calibration parameters. Instead, the verification of the new L9 calibration parameters involved examining the output for the newly generated characterization statistics and comparing that against the expected outcome. On the other hand, the verification of the L8 calibration updates was different. Because the new calibration parameters for L8 are predicted values, no datasets are available that represent the actual imagery for which the CPFs will be applied. In this sense, although cloud-free L8 scenes that are considered “good candidates” for verification are chosen, the analysis focuses on inspecting changes within the data that are on the same scale as expected changes rather than being able to examine the data that will be obtained from the parameter changes. As a more general verification across missions, the imagery is also visually inspected along with the analysis of inspecting items such as new characterization and calibration statistics. An example of the TIRS-2 image that was inspected, with coastlines being viewed for any type of artifacts, is shown in Figure 8.
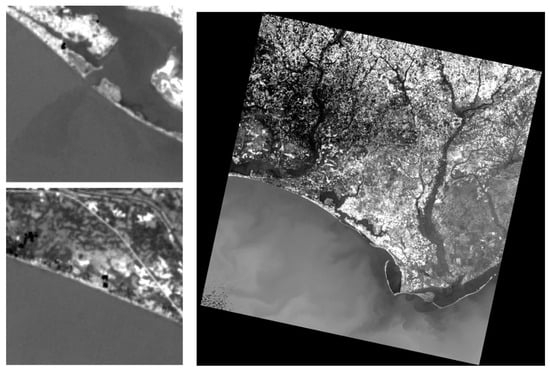
Figure 8.
An example of the Thermal Infrared Sensor-2 (TIRS-2) imagery that was inspected after calibration updates but prior to the reprocessing of the archive. Features, such as coastlines and interior urban regions, were inspected for any type of geometric issues being present.
Although it does not change the results or comparisons between the missions that are presented within this paper, there were more acquisitions over the Geometric Supersites for L8 than for L9 during the 2022 timeline of the study due to several factors, such as the fact that the L9 mission had just transitioned to an operational schedule and was still determining the final image acquisition plan. Candidates were Geometric Supersite images with less than 1% cloud cover. L8 contained 90 more scenes for analysis when compared to that of L9. The L9 mission continues further into the missions’ operational mode differences in the number of candidate scenes for the Geometric Supersites between it, and L8 are expected to decrease.
3. Results
This section will discuss the sensor alignment, band alignment, and OLI-TIRS alignment for both L8 and L9 missions. The geometric accuracy of the products will also be discussed, which is a result of the outcome of all the calibration steps being performed towards an end goal of producing the best science quality data available.
3.1. Sensor Alignment
Sensor alignment involves using both the IAS and LPGS geodetic accuracy results to estimate the orientation of the OLI coordinate system relative to the spacecraft attitude determination coordinate system. New estimates were determined for L9 from 1 January 2022 to 31 December 2022 for each quarter of the year (every 3 months). A new estimate was performed for only the first to second quarter transition of 2022 for L8. Figure 9 shows the geodetic accuracy reports for the L9 mission for both the Geometric Supersites and the C2 GCPs. An interval average is shown with the data to help demonstrate any possible trends that may be present. The figures and the contrasting difference in the number of points and number of outliers between the Geometric Supersite and C2 GCPs is apparent within the plots. The Geometric Supersites results are produced only on scenes with low cloud scores (less than 1%). Attempts were also made to avoid any seasonal issues such as heavy snow cover that may reduce the efficiency of the correlation step when the image is measured against ground control that is not the same type of seasonal landscape as the ground control. By contrast, the C2 GCP results are based on all the images that go to an L1TP within the LPGS and that are distributed to the science community. These scenes are not directly screened for cloud cover during L1TP generation. The correlation and precision solution itself will produce a level of outlier rejection with the mensuration step, rejecting poor image-to-image correlation results, with the added help that the precision solution is constrained to only determining corrections based on an apriori expected set of correction parameters. However, to produce as many L1TPs as possible, a smaller set of constraints is used on these LPGS-generated data, meaning that some of the solutions lack the confidence in their results when compared to those produced using the Geometric Supersites. Figure 9 shows the geodetic accuracy pre-fit mean results prior to performing any calibration update to the data with respect to new orientation parameters. A visible offset is present in the along-track direction. There is a smaller noticeable offset in the across-track direction. The cause for these offsets has not been directly identified. Investigations continue to try to determine the root cause. An important aspect of these plots is that both show similar trends, indicating not only that an OLI-2 sensor alignment needs to be performed but also that both sets of ground control can be used for determining the new alignment parameters. Because the Geometric Supersites are more limited in the number of GCPs available, there may be days where only a handful of scenes of cloud-free scenes, or possibly none, are available for trending. This is unlike the C2 GCP results, where hundreds of scenes trended each day with results. This difference in the number of scenes trended per day produces breaks in the plots for the Geometric Supersites and their calculated interval averages. The C2 GCP interval averages are a smoother set of data due to the much denser set of measurements. The C2 GCP results show a larger variability around the mean results within the plot when compared with the Geometric Supersite results. This variability is due to clouds, snow, and landscape change between the imagery, as well as the ground control increasing the uncertainty in the C2 GCP-related measurements.
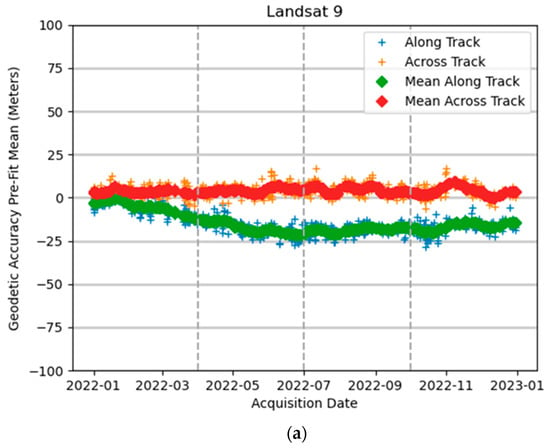
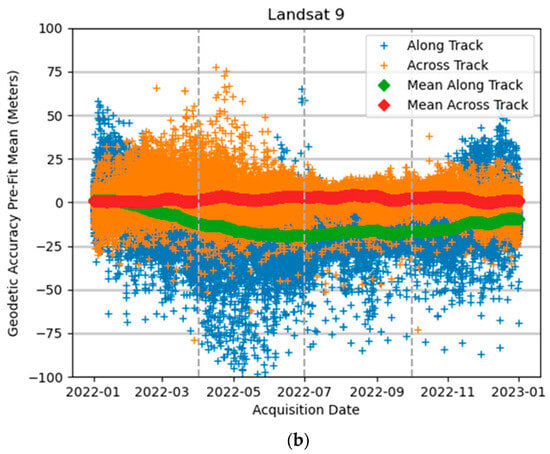
Figure 9.
Landsat 9 geodetic accuracy results. Top graphic (a) shows the geodetic accuracy pre-fit along- and across-track mean results based on the Geometric Supersite ground control. The bottom graphic (b) shows the geodetic accuracy pre-fit mean along- and across-track results based on the Landsat collection 2 Ground Control. These results represent values prior to any calibration updates that were performed. Both graphs are results for Landsat 9.
Figure 10 shows the estimated OLI-2 per-scene sensor alignment parameters based on the Geometric Supersite ground control and their precision correction geodetic accuracy results presented in Figure 9. A note for this plot and subsequent plots is that a nominal 30 m OLI multispectral pixel has an IFOV of 42.5 micro-radians (μrads), indicating that the changes to the alignment are small—approximately one multispectral pixel. These values shown in Figure 10 represent estimates that would be used in generating the calibration parameters that would be updated within the CPF for the OLI interior orientation parameters. Table 2 shows the new OLI-2 alignment parameters based on the estimated alignment parameters from the Geometric Supersite and C2 GCPs. During the final step of calculating alignment parameters, C2 GCP results are filtered for outliers, which consists of removing large spurious results from the calculations. To calculate the new alignment parameters, a weight of 0.8 is given to the Geometric Supersite results and a weight of 0.2 is given to the C2 GCP results. Averages from this weighting are used over time ranges that are based on the effective time ranges of the CPFs that are to be generated. The OLI sensor alignment updates to the CPF are performed based on noticeable changes and trends within the geodetic accuracy reports, along with magnitudes that are in the range of 10 m or more. The requirement for geodetic accuracy of the 65 m 90 Percent Circular Error (CE90) is larger than what has been the achievable accuracy within the systems, such that this criterion is consistently met [19,20]. Therefore, adjustments to the sensor alignment in the 15–25 m range are typically performed to keep it within the range of one 30 m multispectral pixel.
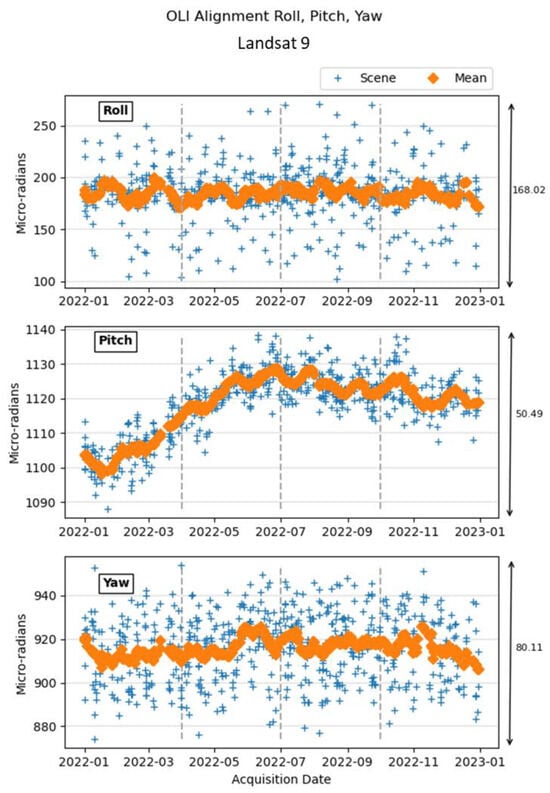
Figure 10.
Estimated Landsat 9 (L9) Operational Land Imager-2 (OLI-2) sensor alignment parameters based on the results calculated from the Geometric Supersites given in units of micro-radians. From top to bottom, the angles represent the roll, pitch, and yaw alignment parameters. These results are used to calculate the final roll, pitch, and yaw alignment numbers that will be placed in the Calibration Parameter File (CPF) for product generation. The values represent the time range from 1 January 2022 up to 1 January 2023 and calculations performed prior to the reprocessing campaign that occurred in early 2023.

Table 2.
Landsat 9 (L9) Operational Land Imager-2 (OLI-2) sensor alignment parameters based on the results generated from the instruments’ first year of operational activities. The values of roll, pitch, and yaw given in units of micro-radians (μrad). These values were used in the L9 reprocessing campaign that occurred in the spring of 2023.
Applying the new sensor alignment parameters estimated from the plots in Figure 10 and shown in Table 2 to the L9 archive, produces geodetic accuracy results shown in Figure 11. The large trend that was present in Figure 10 is now absent. These results are representative of what the user community can expect for geodetic accuracy results of the L1GT products after the reprocessing campaign.
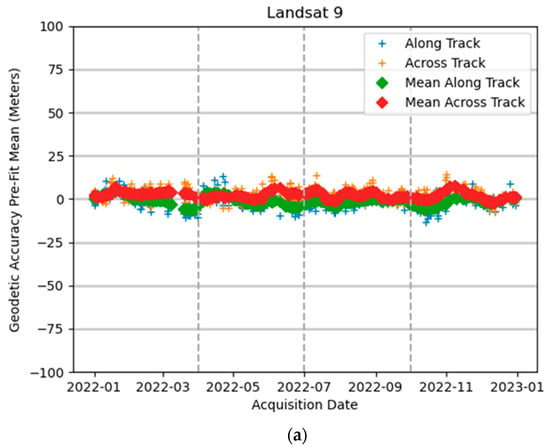
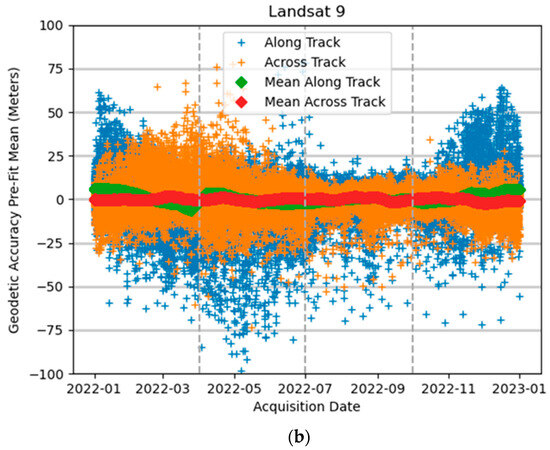
Figure 11.
Landsat 9 geodetic accuracy results. Top graphic (a) shows the geodetic accuracy pre-fit along- and across-track mean results based on the Geometric Supersite ground control. The bottom graphic (b) shows the geodetic accuracy pre-fit mean along- and across-track results based on the Collection 2 ground control. Both graphs are results for Landsat 9 (L9). These results represent a calibration update that was performed on the Operational Land Imager-2 (OLI-2) and was part of the reprocessing of the L9 products that occurred in the spring of 2023.
The same geometric processes and data are trended for L8 that were previously discussed for L9. The same procedures were performed for OLI-1 and the sensor alignment as was conducted for OLI-2. The equivalent geodetic accuracy pre-fit mean results that were shown for L9 in Figure 11 are shown for L8 in Figure 12. A L8 update to the OLI-1 sensor alignment parameters was performed within the first quarter of 2022 and the second quarter of 2022 time-frame. This update was performed as a predicted trend that occurred within the data, and as such was an estimate of the behavior from the previous quarters.
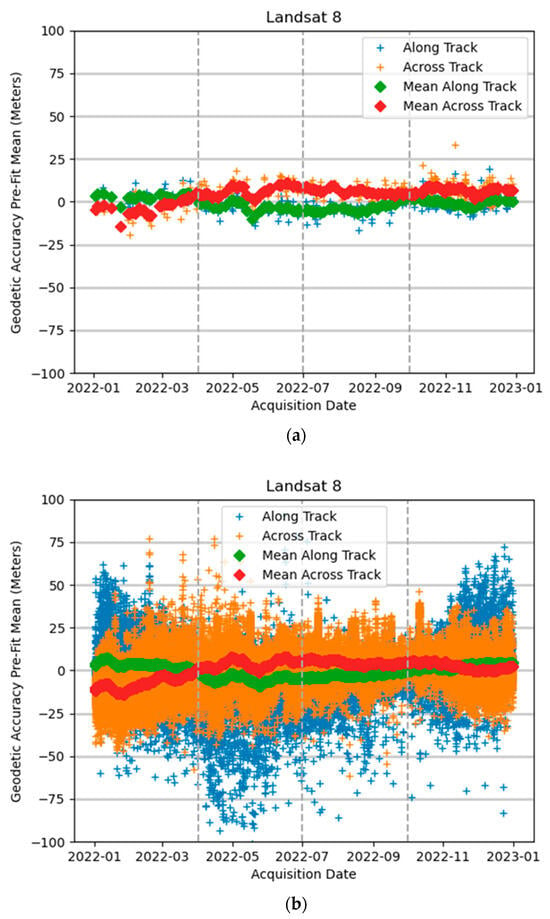
Figure 12.
Landsat 8 geodetic accuracy results. Top graphic (a) is the geodetic accuracy pre-fit along- and across-track mean results based on the Geometric Supersite ground control for the Landsat 8 (L8) Operational Land Image-1 (OLI-1). The bottom graphic (b) is the geodetic accuracy pre-fit mean along- and across-track results based on the Collection 2 ground control. Both graphs are results for Landsat 8.
The estimated OLI-1 per-scene sensor alignment parameters based on the Geometric Supersite ground control and their precision correction geodetic accuracy results are shown in Figure 13. These values represent estimates that would be used in generating the predicted calibration parameters that would be updated within the CPF. Table 3 shows the new alignment parameters based on the estimated alignment parameters from the Geometric Supersite and C2 GCPs. This table for L8 represents the predicted alignment parameters based on the estimated values shown in Figure 13. The same methods and algorithms used to generate the values shown in Table 2 for OLI-2 are used in those for determining the values for OLI-1 listed in Table 3.
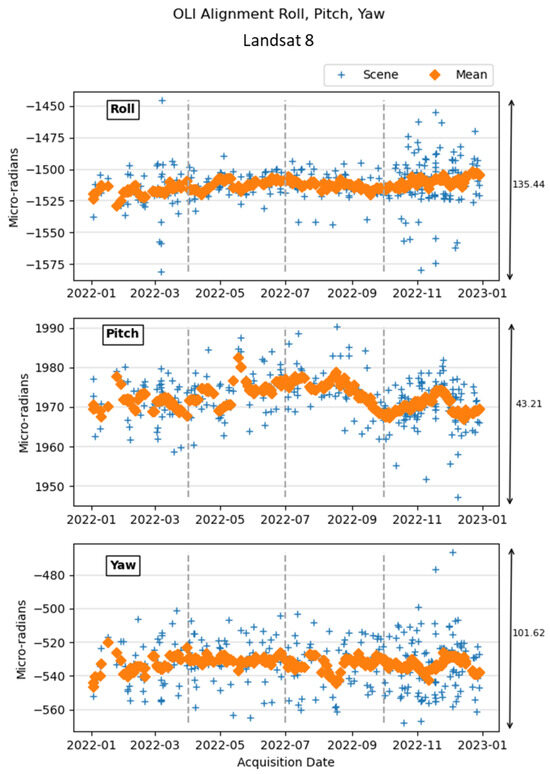
Figure 13.
Estimated Landsat 8 (L8) Operational Land Imager-1 (OLI-1) sensor alignment parameters based on the results calculated from the Geometric Supersites given in units of micro-radians. From top to bottom, the angles represent the roll, pitch, and yaw alignment parameters. These results are used to calculate the final roll, pitch, and yaw alignment numbers that will be placed in the Calibration Parameter File (CPF) for product generation. For L8, these numbers are used to predict values that will be put in the CPF for forward processing and product generation.

Table 3.
Landsat 8 (L8) Operational Land Imager-1 (OLI-1) senor alignment parameters, roll, pitch, and yaw. Values are given in units of micro radians (μrad). An update was made with respect to the transition from first quarter of 2022 (1 January 2022) and second quarter of 2022 (1 April 2022).
3.2. Band Alignment
The band-to-band characterization results for OLI-2 are shown in Figure 14. These results were measured prior to the OLI-2 sensor alignment update. Within Figure 14, each individual band combinations LE90 is shown in both the line and sample direction. The results shown are below the 4.5 m LE90 requirements. The calculated LE90 values were 3.177 and 3.182 m in the line and sample directions, respectively. These band-to-band characterization numbers are based on 440 scenes. The magnitude of the measured band offsets is small and below the instrument requirements; therefore, no OLI-2 line-of-sight updates were needed.
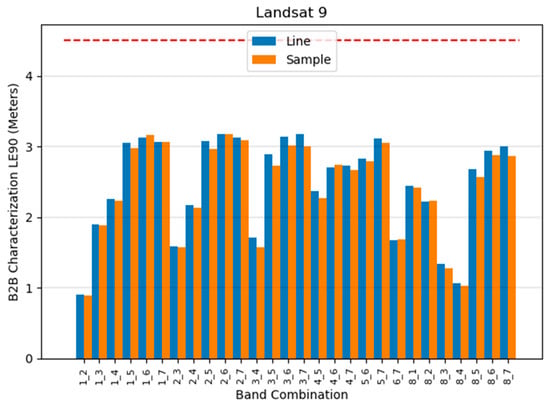
Figure 14.
Landsat 9 (L9) Operational Land Imager-2 (OLI-2) band-to-band characterization results. Each band combination is shown for the line and sample direction. Results are given in units of meter (m) and 90 Percent Linear Error (LE90). The dotted red line represents the band registration requirement for the OLI-2 instrument of 4.5 m LE90. The plot was generated, and the numbers were calculated prior to an OLI-2 sensor alignment update. The results represent the time range from 1 January 2022 to 1 January 2023.
The OLI-2 sensor alignment only adjusts the instruments’ optical axis to the spacecrafts’ attitude control system which will change the accuracy of the L1GTs. This sensor alignment calibration update will therefore change the band-to-band characterization numbers calculated but will not change the outcome. Essentially no line-of-sight update will be needed based on the OLI-2 sensor alignment performed. The L9 reprocessing of the archive provides an opportunity to determine whether this is indeed the case by providing band-to-band characterization trended data both before and after the sensor alignment update that was performed. This is unlike what is typically conducted for L8 operations, where updates are predicted and verified through forward processing. Figure 15 shows the same band-to-band characterization results as Figure 14, with the same imagery processed with the same characterization routines, but with the exception that sensor alignment for the instrument has been updated. As can be observed from Figure 14 and Figure 15, the sensor alignment had no effect on the band-to-band characterization results. These new band characterization numbers were determined to be 3.177 and 3.177 m LE90 in the line and sample directions, respectively. These band-to-band characterization numbers are based on 440 scenes.
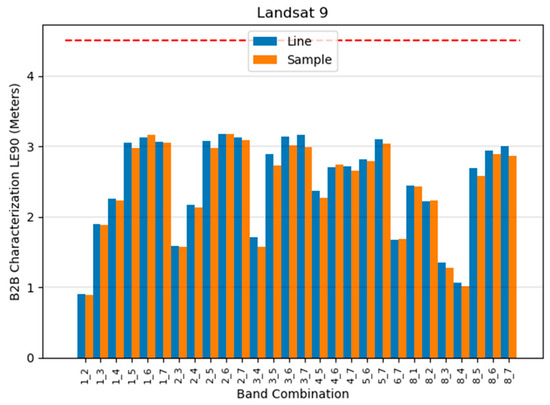
Figure 15.
Landsat 9 (L9) Operational Land Imager-2 (OLI-2) band-to-band characterization results. Each band combination is shown for the line and sample direction. Results are given in units of meter (m) and 90 Percent Linear Error (LE90). The dotted red line represents the band registration requirement for the OLI instrument which is 4.5 m LE90. The plot was generated, and the numbers were calculated after the OLI-2 sensor alignment update that was discussed in Section 3.1 Sensor Alignment. The results represent the time range from 1 January 2022 to 1 January 2023.
The L8 OLI-1 band characterization results are shown in Figure 16. Like the L9 OLI-2 results, all the bands were within the requirements. There is no need to update the instrument line-of-sight parameters. The OLI-1 calculated band characterization numbers were determined to be 3.311 and 3.203-m LE90 in the line and sample directions, respectively. These band-to-band characterization numbers are based on 529 scenes.
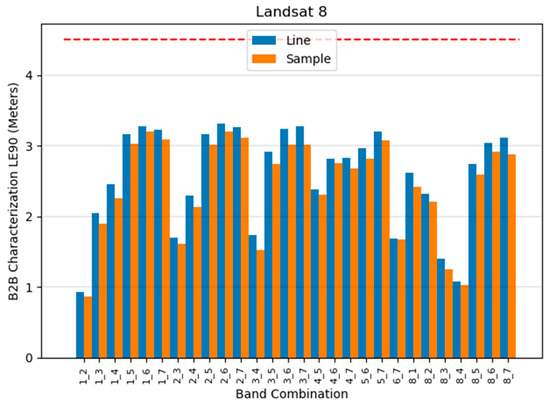
Figure 16.
Landsat 8 (L8) Operational Land Imager-1 (OLI-1) band-to-band characterization results. Each band combination is shown for the line and sample direction. Results are given in units of meter (m) and 90 Percent Linear Error (LE90). The dotted red line represents the band registration requirement for the OLI instrument which is 4.5 m LE90. The results represent the time range from 1 January 2022 to 1 January 2023.
One aspect of the OLI instrument that was not part of the previously discussed band-to-band characterization was the cirrus bands’ relationship to the other OLI bands. One reason for this is that the cirrus band is not part of the 4.5 m LE90 requirement for OLI, where the other bands are subject to this requirement. The cirrus band acquisitions often do not have any ground features present, as the cirrus clouds will absorb and prevent any surface features to be present in the imagery. These characteristics of the cirrus band means that good clear imagery for characterization is difficult to find. Even on the rare occasion that there are visible features present within the cirrus band, snow cover and other landscape features can make these acquisitions poor candidates for any band-to-band characterization. As high altitude, dry, and arid regions are the best candidates for the use of the cirrus band characterization, snow can be especially problematic for these acquisitions. This results in only a handful of scenes for which the cirrus band can even be considered for characterization, making the assessment difficult. Due to these issues, the previous band-to-band characterization results did not include the cirrus band. The OLI-2 calculated band characterization numbers were determined to be 4.247 and 4.102 m LE90 in the line and sample directions, respectively, when the cirrus band is included in the assessment. The OLI-1 calculated band characterization numbers were determined to be 4.016 and 4.008 m LE90 in the line and sample directions, respectively. Even with the limited numbers of data, which are carefully screened and deemed “good” quality cirrus imagery, the band characterization results associated with using the cirrus band are higher than those omitting it due to the additional measurement-induced errors belonging to the lower signal response for the cirrus band compared to that of the other multispectral bands. For this band-to-band characterization involving the cirrus band, 37 cirrus scenes were used for L9, where 26 cirrus scenes were used for L8.
The TIRS band-to-band characterization is run with basically the same processes as those conducted for the OLI instruments. The only differences are with respect to numbers that are generated and the values that are part of the requirements for that instrument. The lower resolution of the TIRS bands produce larger measured values in the band characterization calculations, and the corresponding requirements are larger for this instrument than those for OLI instruments. Like the OLI instruments, the premise behind performing updates to the line-of-sights is based on the band characterization. The band characterization numbers are inspected against the requirements; values that are close to or exceed those requirements would drive further analysis and most likely changes to the line-of-sight parameters. Of note regarding the TIRS band-to-band characterization is that with only two bands for this instrument (band 10 and 11) the analysis is somewhat easier due to only one set of numbers in the analysis.
Figure 17 shows the L9 TIRS-2 band-to-band characterization results prior to any alignment updates. As will be discussed in Section 3.3, TIRS-to-OLI Alignment updates were performed with respect to the alignment between the two instruments. Like that discussed for the OLI-2 band alignment, although OLI-2 and an OLI-2 to TIRS-2 alignment adjustment would change the numbers calculated for the band-to-band characterization of the TIRS instrument, the outcome from the analysis would not change. The measured band-to-band characterization of TIRS-2 prior to any alignment calibration updates was 8.161 and 7.600 m LE90 in the line and sample directions, respectively. These band-to-band characterization numbers are based on 151 scenes. As can be observed from Figure 17 and comparing these results to the requirement of 18 m LE90, a line-of-sight calibration update is not needed.
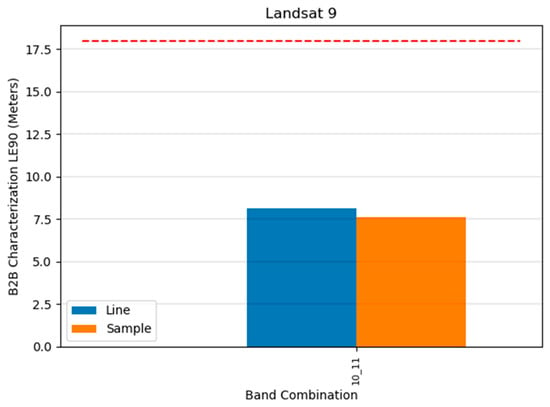
Figure 17.
Landsat 9 (L9) Thermal Infrared-2 (TIRS-2) band-to-band characterization results. Each band combination is shown for the line and sample directions. Results are given in units of meter (m) and 90 Percent Linear Error (LE90). The dotted red line represents the band registration requirement for the TIRS instrument, which is 18.0 m LE90. The plot was generated, and the numbers were calculated prior to the OLI-2 sensor alignment update that was discussed in Section 3.1 OLI Sensor Alignment and prior to the TIRS-to-OLI alignment discussed in Section 3.3. The results represent the time range from 1 January 2022 to 1 January 2023.
Figure 18 shows the L8 TIRS-1 band-to-band characterization results. The measured band-to-band characterization was 7.584 and 8.268 m LE90 in the line and sample directions, respectively. These band-to-band characterization numbers are based on 209 scenes. As can be observed from the figure and comparing these results to the requirement of 18 m LE90, performing a line-of-sight calibration update is not needed.
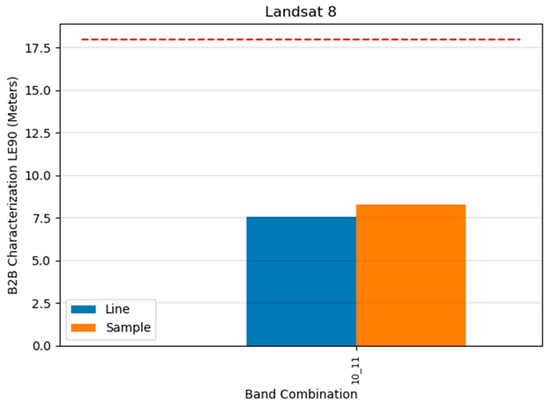
Figure 18.
Landsat 8 Thermal Infrared-1 (TIRS-1) band-to-band characterization results. Each band combination is shown for the line and sample direction. Results are given in units of meter (m) and 90 Percent Linear Error (LE90). The dotted red line represents the band registration requirement for the TIRS instrument which is 18.0 m LE90. The results represent the time range from 1 January 2022 to 1 January 2023.
3.3. TIRS-to-OLI Alignment
The TIRS-to-OLI alignment has shown seasonal dependencies as such unlike the other calibration activities performed for the other geometric aspects of L8 and L9 these seasonal changes are expected within the calibration activities. This seasonal dependency had been observed in the L8 TIRS-to-OLI alignment and was implemented as a set of calibration updates within the C2 processing flow for production generation [21,22]. Although this seasonal change between instruments was small, on the order of 8 μrad, it was thought that L9 might show the same type of pattern of behavior. If present, this seasonal pattern would show up as a difference in the winter and summer set of instrument-to-instrument orientation parameters. The cause for these season patterns has not been directly identified. Investigations continue to try to determine the root cause.
The L9 TIRS-to-OLI measured band-to-band characterization is shown in Figure 19 and entails measuring offsets between OLI-2 band 6 and TIRS-2 band 10. These results are broken up into quarterly bins to help identify any possible seasonal dependencies within the data. The estimated L9 TIRS-to-OLI orientation parameters are shown in Figure 20 and are calculated from the measured offsets given in Figure 19. The measured offsets have a slight difference in values between the line and sample directions for two of the quarters. However, at a scale of only a few meters, it is difficult to infer any type of calibration update needing to be applied. Overall, these measured offsets are below the 30 m LE90 requirement. With respect to the L9 TIRS-to-OLI alignment and requirements, the measured values were calculated as 18.851 and 17.311 m LE90 in the line and sample directions, respectively. The higher LE90 numbers for the inter-sensor characterization when compared to the within-sensor characterization can be attributed to the differing spectral response of the bands used in the characterization step, the lower resolution of the TIRS instrument (100 m), and the characterization step resampling the TIRS imagery to 30 m to match the native resolution of the OLI band. These L9 TIRS-to-OLI characterization numbers were based on 71 scenes. These values represent the TIRS-to-OLI alignment prior to the reprocessing that was performed for L9.
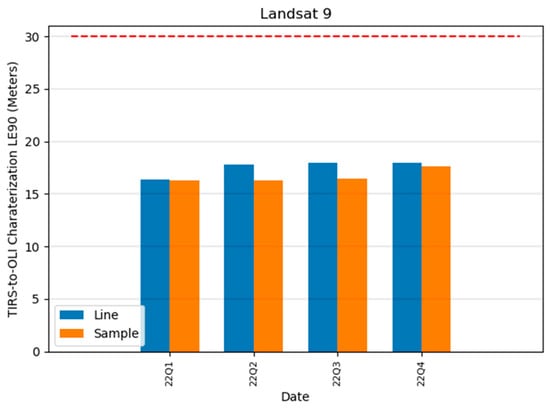
Figure 19.
Landsat 9 (L9) Thermal Infrared-2 (TIRS-2) and Operational Image-2 (OLI-2) alignment measured through OLI-2 SWIR-to-TIRS-2 10.8 µm band characterization. Values are given with respect to 90 Percent Linear Error (LE90) in units of meters (m). Results are broken up by 3-month time ranges along with line and sample direction. The dotted red line represents the requirement for L9 TIRS-to-OLI alignment of 30 m LE90. These results are for the time range from 1 January 2022 to 1 January 2023 and are prior to the reprocessing campaign that occurred in early 2023.
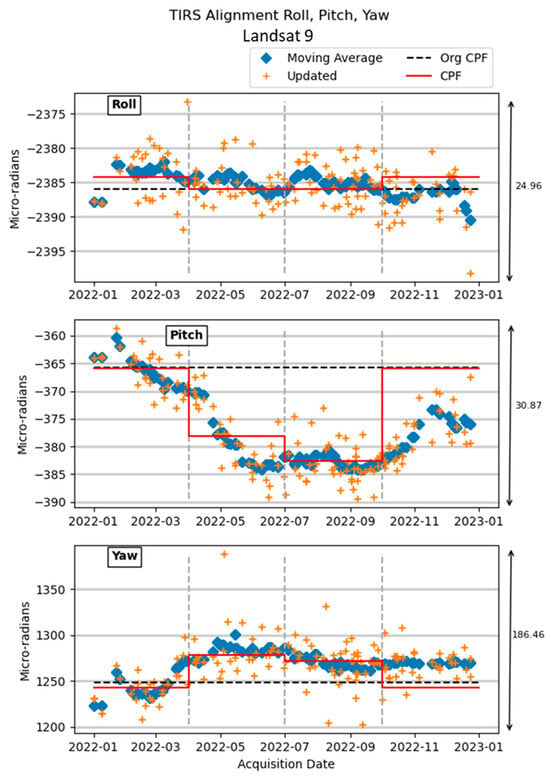
Figure 20.
Estimated Landsat 9 (L9) Thermal Infrared-2 (TIRS-2) to Operational Land Imager-2 (OLI-2) alignment parameters based on the results calculated from the Geometric Supersites given in units of micro-radians. From top to bottom, the angles represent the roll, pitch, and yaw alignment parameters. These results are used to calculate the final roll, pitch, and yaw alignment numbers that will be placed in the Calibration Parameter File (CPF) for product generation. The black dotted line represents alignment parameters prior to a calibration update. The solid red line represents the updated calibration parameters. The values represent the time range from 1 January 2022 to 1 January 2023, and calculations were performed prior to the resampling campaign that occurred in early 2023.
For TIRS-to-OLI alignment, a better measure of any possible calibration update needing to be performed resides within inspecting the inter-instrument orientation parameters calculated for each dataset characterized. These inter-instrument orientation parameters for L9 are shown in Figure 20. We expected the seasonal pattern present in the L8 TIRS-to-OLI alignment to be exhibited in the L9 TIRS-to-OLI alignment as well, due to the two instruments being essentially a clone of one another. The results in Figure 20 show a small dip for the pitch values that is similar to what has been measured in the L8 TIRS-to-OLI alignment. To help identify the calibration update that was needed for the reprocessing of L9, the CPF values prior to the calibration update are shown as a dotted black line, and the updated calibration parameters are shown with a solid red line. A moving interval window of the alignment parameters is also shown within the plot to help identify short-term trends. In order to begin the reprocessing of the L9 archive at the beginning of 2023, the last quarter of the L9 TIRS-to-OLI alignment parameters needed to be predicted. This prediction was higher than what was finally measured for this quarter, hence the pitch CPF parameter (shown with the solid red line in Figure 20) ended up being approximately 8 µrad higher than that measured between the two instruments.
New L9 TIRS-to-OLI orientation parameters were calculated based on the values shown in Figure 20. These new orientation parameters were used in the reprocessing campaign, and the new L9 TIRS-to-OLI-measured band-to-band characterization results based on these orientation parameters are shown in Figure 21. With respect to the measured L9 TIRS-to-OLI results and requirements, the LE90 measured values were calculated as 17.280 and 17.373 m LE90 in the line and sample directions, respectively. These L9 TIRS-to-OLI characterization numbers were based on 71 scenes.
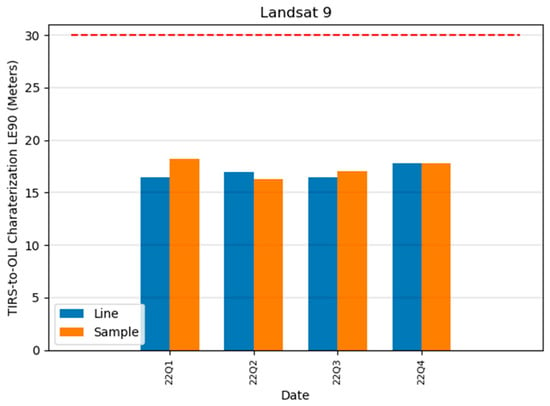
Figure 21.
Landsat 9 (L9) Thermal Infrared-2 (TIRS-2) and Operational Image-2 (OLI-2) alignment measured through OLI-2 SWIR-to-TIRS-2 10.8 µm band characterization. Values are given with respect to 90 Percent Linear Error (LE90) in units of meters (m). Results are broken up by 3-month time ranges along with line and sample direction. The dotted red line represents the requirement for L9 TIRS-to-OLI alignment of 30 m LE90. These results are for the time range from 1 January 2022 to 1 January 2023 and are after the reprocessing campaign that occurred in early 2023.
Like the OLI sensor alignment calibration updates and the inter instrument band alignment, the TIRS-to-OLI alignment updates will not affect the results for the TIRS band alignment (the within-instrument alignment). The reprocessing campaign that occurred in early 2023 for L9 provides an opportunity to determine that this is indeed the case. Figure 22 shows the TIRS-2 band-to-band characterization measurements after the L9 TIRS-to-OLI alignment updates. The measured band-to-band characterization of TIRS-2 post-alignment calibration updates was 8.144 and 7.457 m LE90 in the line and sample directions, respectively. These band-to-band characterization numbers were based on 151 scenes.
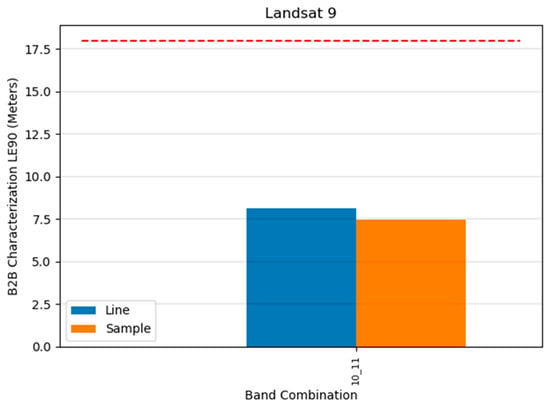
Figure 22.
Landsat 9 (L9) Thermal Infrared-2 (TIRS-2) band-to-band characterization results. Each band combination is shown for the line and sample direction. Results are given in units of meters (m) and 90 Percent Linear Error (LE90). The dotted red line represents the band registration requirement for the TIRS instrument of 18.0 m LE90. The plot was generated, and the numbers were calculated after the OLI-2 sensor alignment update that was discussed in Section 3.1 OLI Sensor Alignment and the L9 TIRS-to-OLI alignment that was discussed in Section 3.3. The results represent the time range from 1 January 2022 to 1 January 2023.
The L8 TIRS-to-OLI measured band-to-band characterization is shown in Figure 23. Like the L9 results, the L8 results are grouped into quarterly bins to help identify any possible seasonal dependencies within the data. The estimated L8 TIRS-to-OLI orientation parameters are shown in Figure 24 and calculated from the measured offsets given in Figure 23. These measured offsets are less than the 30 m LE90 requirement. With respect to the TIRS-to-OLI alignment and requirements, the measured values were calculated as 19.060 and 17.120 m LE90 in the line and sample directions, respectively. These L8 TIRS-to-OLI measurements were based on 193 scenes. The predicted calibration parameters are shown with a solid red line. A moving interval window of the alignment parameters is also shown within the plot to help identify short-term trends. The small out-of-phase values in the plots between the CPF and measured values are associated with a small change in the alignment that followed a safehold for the instrument. This small change caused an offset in the alignment parameters predicted and an out-of-phase characteristic of the seasonal pattern present. Changes over the lifetime of the mission are tracked in quarterly reports in the Landsat 8 Geometric Performance Summary that can be used in tracking this seasonal dependency. These reports are made publicly available, as are timelines, lifetime trends, and discussions on events occurring within the mission that affect data or data delivery [22,23].
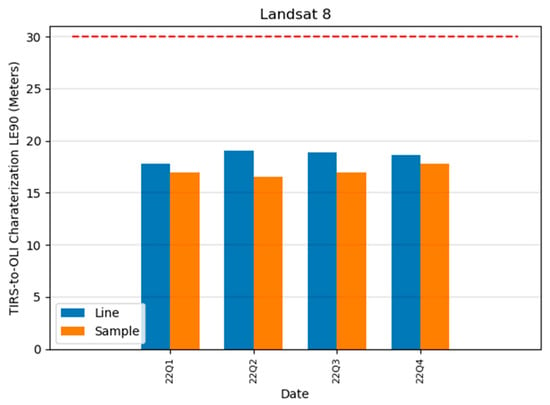
Figure 23.
Landsat 8 (L8) Thermal Infrared-1 (TIRS-1) and Operational Image-1 (OLI-1) alignment measured through OLI-1 SWIR-to-TIRS-1 10.8-µm band characterization. Values are given with respect to 90 Percent Linear Error (LE90) in units of meters (m). Results are broken up by 3-month time ranges in the line and sample directions. The dotted red line represents the requirement for L8 TIRS-to-OLI alignment of 30 m LE90. These results are for the time range from 1 January 2022 to 1 January 2023.
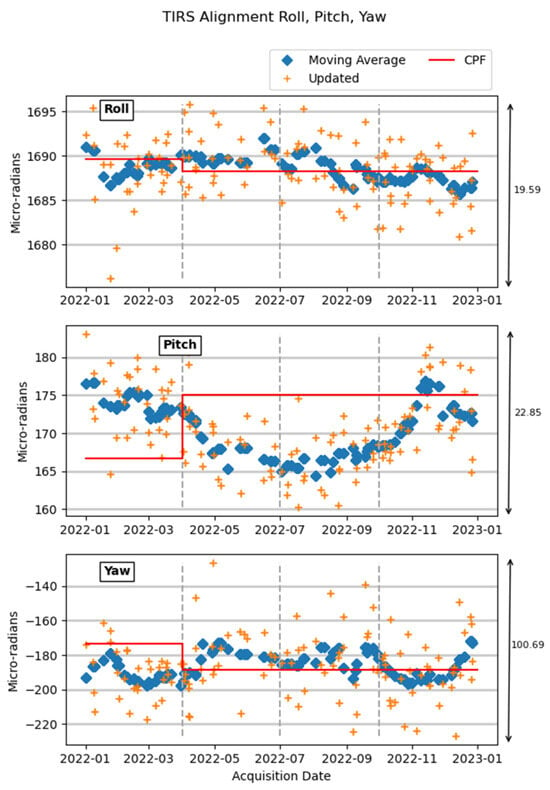
Figure 24.
Estimated Landsat 8 (L8) Thermal Infrared-1 (TIRS-1) to Operational Land Imager-1 (OLI-1) alignment parameters based on the results calculated from the Geometric Supersites given in units of micro-radians. From top to bottom, the angles represent the roll, pitch, and yaw alignment parameters. These results are used to calculate the final roll, pitch, and yaw alignment numbers that will be placed in the Calibration Parameter File (CPF) for product generation. The values represent the time range from 1 January 2022 to 1 January 2023.
3.4. Geometric Accuracy
Figure 25 shows the L9 geometric accuracy results for the Geometric Supersites and C2 GCPs, respectively. The requirement for Geometric Accuracy for L8 and L9 is 12 m CE90. For the Geometric Supersites, the geometric accuracy was calculated as 5.609 m CE90. For the C2 GCPs, the geometric accuracy was calculated as 7.200 m CE90. These geometric accuracy numbers are based on 420 scenes. Only acquisitions where results are present for Geometric Accuracy using both sets of control are shown. The difference between these two measurements is one indication of the difference in accuracy between the two sets of ground control. Of note is that the Geometric Supersites are within geographic regions where the C2 GCPs are likely to be more accurate than at other locations. The Geometric Supersites also try to avoid regions such as high or low latitude where snow and ice can make even generating ground control difficult or could be adversely affected by the landscape changes that could be present within the scene. Although the Geometric Supersite cannot completely avoid being affected by these factors, effects occur much less frequently with this dataset.
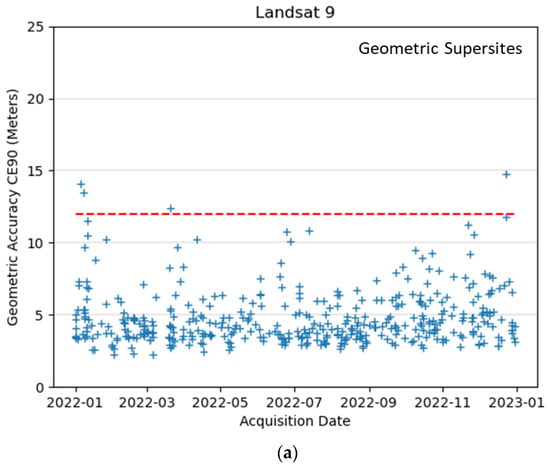
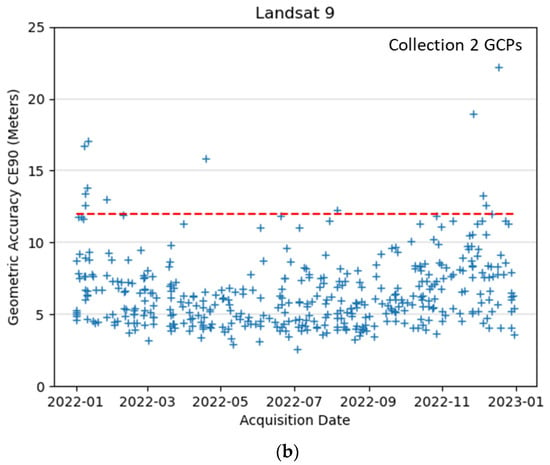
Figure 25.
Landsat 9 (L9) geometric accuracy. The top plot (a) shows the Geometric Supersite geometric accuracy 90 Percent Circular Error (CE90) in meters (m). The bottom plot (b) shows the U. S. Geological Survey (USGS) Collection 2 Ground Control Library geometric accuracy of CE90 in meters. These values represent Level-1 Terrain Precision (L1TP) products after the calibration updates and the reprocessing that occurred in early 2023 for the L9 archive. The dotted red line represents the geometric accuracy requirement for L9, which is 12.0 m CE90. The values represent the time range from 1 January 2022 to 1 January 2023.
Figure 26 shows the L8 geometric accuracy results for the Geometric Supersites and C2 GCPs, respectively. For the Geometric Supersites, the geometric accuracy was calculated as 5.186 m CE90. For the C2 GCPs, the geometric accuracy was calculated as 6.642 m CE90. These geometric accuracy numbers are based on 243 scenes. Only acquisitions where results are present for both Geometric Accuracy and the C2 GCPs are shown.
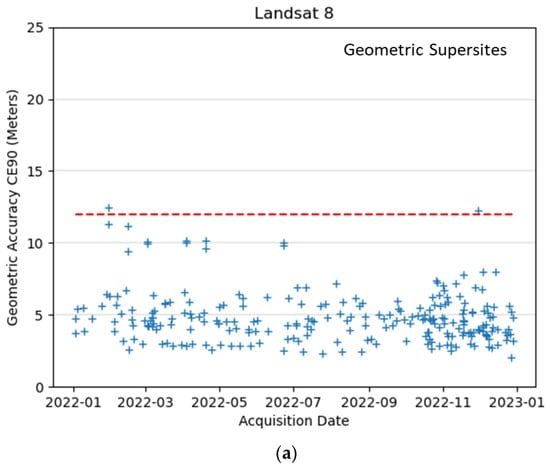
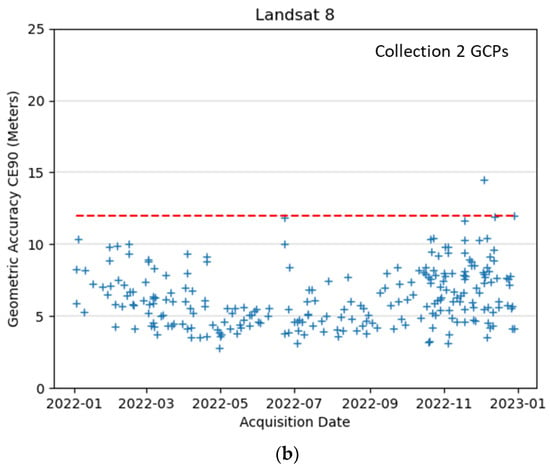
Figure 26.
Landsat 8 (L8) geometric accuracy. The top plot (a) shows the Geometric Supersite geometric accuracy with 90 Percent Circular Error (CE90) in meters (m). The bottom plot (b) shows the U.S. Geological Survey (USGS) Collection 2 Ground Control Library geometric accuracy of CE90 in meters. The dotted red line represents the geometric accuracy requirement for L8 which is 30.0 m CE90. The values represent the time range from 1 January 2022 to 1 January 2023.
4. Conclusions
Within this paper, the first year of L9 operations was discussed with respect to geometric calibration, characterization, and validation. This time frame pertained to the calendar year 2022. These L9 results were compared against the same geometric aspects for that of L8. During this time period, the L9 geometric calibration was held static until towards the end of 2022, after which calibration updates were applied to a reprocessing campaign that the USGS performed of the archive. This reprocessing of the L9 archive, a year after the L9 launch, was performed to ensure consistency in the calibration performed between missions. For L8, the calibration cadence was kept within the C2 philosophy, which meant calibration updates were based on predicted changes to the spacecraft and instruments that would need to be performed to keep it within the collection 2 geometric performance criteria. The key performance metrics measured and discussed in this paper were band-to-band characterization, TIRS-to-OLI alignment, and Geometric Accuracy. The results from these geometric metrics are listed in Table 4. The two Landsat missions, L8 and L9, produce consistent and accurate results, allowing for products from both missions to be used interchangeably by the science community, which in turn allows for an 8-day revisit cycle for Landsat imagery.

Table 4.
Geometric performance for Landsat 8 and 9 for the Operational Land Imagery (OLI) and Thermal Infrared Sensor (TIRS) in five geometric metrics. These values are from the date range from 1 January 2022 to 1 January 2023. The Geometric Supersites were used for the ground control during the derivation of these numbers. The Landsat 9 numbers are those associated with the reprocessing of the archive that occurred in early 2023.
Author Contributions
Methodology, M.J.C., R.R., M.N.H., A.D. and K.R. All authors have read and agreed to the published version of the manuscript.
Funding
Work performed under USGS contract G15PC00012.
Data Availability Statement
The Level-1 products discussed and used within the analysis of this paper can be accessed through Earth Explorer https://earthexplorer.usgs.gov/ (accessed on 25 December 2023).
Conflicts of Interest
Authors Rajagopalan Rengarajan, Md Nahid Hasan, Alexander Denevan and Kathryn Ruslander were employed by the company KBR. The remaining author declares that the research was conducted in the absence of any commercial or financial relationships that could be construed as a potential conflict of interest.
Abbreviations
| ACS | Attitude Control System |
| ADD | Algorithm Description Document |
| AGRI | Australia Global Reference Imagery |
| C2 | Collection 2 |
| CE90 | 90 Percent Circular Error |
| CPF | Calibration Parameter File |
| DOQ | Digital Orthophoto Quadrangle |
| ETM+ | Enhanced Thematic Mapper Plus |
| GCP | Ground Control Chip |
| GPS | Global Positioning System |
| GRI | Global Reference Imagery |
| IAS | Image Assessment System |
| IFOV | Instantaneous Field of View |
| IRU | Inertial Reference Unit |
| L1TP | Level-1 Terrain Precision |
| L1GT | Level-1 Systematic Terrain |
| L5 | Landsat 5 |
| L7 | Landsat 7 |
| L8 | Landsat 8 |
| L9 | Landsat 9 |
| LE90 | 90 Percent Linear Error |
| LPGS | Landsat Product Generation System |
| OLI | Operational Land Imager |
| SCA | Sensor Chip Assembly |
| SPOT | Satellite pour l’Observation de la Terre |
| SWIR | Short-Wave Infrared |
| TIRS | Thermal Infrared Sensor |
| VNIR | Visible and Hear Infrared |
| USGS | U.S. Geological Survey |
References
- Knight, E.J.; Kvaran, G. Landsat-8 Operational Land Imager Design, Characterization and Performance. Remote Sens. 2014, 6, 10286–10305. [Google Scholar] [CrossRef]
- Reuter, D. The Thermal Infrared Sensor (TIRS) On Landsat 8: Design Overview and Pre-launch Characterization. Remote Sens. 2014, 7, 1135–1153. [Google Scholar] [CrossRef]
- Choate, M.J.; Rengarajan, R.; Storey, J.C.; Lubke, M. Landsat 9 Geometric Commissioning Calibration Updates and System Performance Assessment. Remote Sens. 2023, 15, 3524. [Google Scholar] [CrossRef]
- Choate, M.J.; Rengarajan, R.; Hasan, N. Early in Mission Landsat 9 Geometric Performance. In Proceedings of the SPIE Optical Engineering and Applications, San Diego, CA, USA, 21–25 August 2022; Volume 12332. [Google Scholar] [CrossRef]
- USGS. Landsat Collections. Available online: https://www.usgs.gov/landsat-missions/landsat-collections (accessed on 8 February 2023).
- Rengarajan, R.; Sampath, A.; Storey, J.C.; Choate, M.J. Validation of geometric accuracy of Global Land Survey (GLS) 2000 data. Photogramm. Eng. Remote Sens. 2015, 81, 131–141. [Google Scholar] [CrossRef]
- Rengarajan, R.; Storey, J.C.; Choate, M.J. Harmonizing the Landsat Ground Reference with the Sentinel-2 Global Reference Image Using Space-Based Bundle Adjustment. Remote Sens. 2020, 12, 3132. [Google Scholar] [CrossRef]
- Storey, J.C.; Rengarajan, R.; Choate, M.J. Bundle Adjustment Using Space-Based Triangulation Method for Improving the Landsat Global Ground Reference. Remote Sens. 2019, 11, 1640. [Google Scholar] [CrossRef]
- AGRI: The Australian Geographic Reference Image. Geoscience Australia, Canberra. 2011. Available online: http://dx.doi.org/10.4225/25/5524BA4A047FE (accessed on 7 January 2023).
- USGS GeoData Digital Orthophoto Quadrangles. Available online: https://pubs.usgs.gov/fs/2001/0057/report.pdf (accessed on 24 September 2023).
- Schowengerdt, R. Remote Sensing Models and Methods for Image Processing; Third Addition; Academic Press: Waltham, MA, USA, 2007. [Google Scholar]
- Tian, Q.; Huhns, M. Algorithms for Subpixel Registration. Comput. Vis. Graph. Image Process. 1986, 35, 220–223. [Google Scholar] [CrossRef]
- USGS. Landsat 8 and 9 Cal/Val Algorithm Description Document; Version 3.0, Document Number LDCM-ADEF-001; U. S. Geological Survey: Sioux Falls, SD, USA, 2013. Available online: https://www.usgs.gov/media/files/landsat-8-9-calibration-validation-algorithm-description-document (accessed on 24 September 2023).
- Landsat Calibration Parameter Files. Available online: https://www.usgs.gov/landsat-missions/landsat-calibration-parameter-files (accessed on 24 September 2023).
- Dupre, J.C.; Bornert, M.; Robert, L.; Wattrisse, B. Digital Image Correlation: Displacement Accuracy Estimate. EPJ Web Conf. 2010, 6, 31006. [Google Scholar] [CrossRef][Green Version]
- Dvornychenko, V.N. Bounds on (Deterministic) Correlation Functions with Application to Registration. IEEE Trans. Pattern Anal. Mach. Intell. 1983, 5, 206–213. [Google Scholar] [CrossRef] [PubMed]
- Su, Y.; Zhang, Q.; Gao, Z.; Xu, X. Noise-induced bias for convolution-based interpolation in digital image correlation. Opt. Express 2016, 24, 1175–1195. [Google Scholar] [CrossRef]
- Dematteis, N.; Giordan, D. Comparison of Digital Image Correlation Methods and the Impact of Noise in Geoscience Applications. Remote Sens. 2021, 13, 327. [Google Scholar] [CrossRef]
- Greenwalt, C.R.; Schultz, M.E. Principles and Error Theory and Cartographic Applications; ACIC Technical Report No. 96; USAF Aeronautical Chart and Information Center: St. Louis, MO, USA, 1962. [Google Scholar]
- Dolloff, J.; Carr, J. Computation of scalar accuracy metrics LE, CE, and SE as both predictive and sample-based statistics. In Proceedings of the ASPRS 2016 Annual Conference and Co-Located JACIE Workshop-Imaging Geospatial Technol. Forum Co-Located JACIE Work, Fort Worth, TX, USA, 11–15 April 2016; pp. 1–15. [Google Scholar]
- Rengarajan, R.; Choate, M.; Storey, J.; Franks, S.; Micijevic, E. Landsat Collection-2 Geometric Calibration Updates. In Proceedings of the SPIE Optical Engineering and Applications, Online, 17 September 2020; Volume 11501. [Google Scholar] [CrossRef]
- USGS. Landsat Calibration and Validation. Available online: https://www.usgs.gov/calval/landsat-calibration-and-validation (accessed on 8 January 2023).
- Landsat Mission Headlines. Available online: https://www.usgs.gov/landsat-missions/landsat-mission-headlines (accessed on 8 February 2023).
Disclaimer/Publisher’s Note: The statements, opinions and data contained in all publications are solely those of the individual author(s) and contributor(s) and not of MDPI and/or the editor(s). MDPI and/or the editor(s) disclaim responsibility for any injury to people or property resulting from any ideas, methods, instructions or products referred to in the content. |
This article is an open access article distributed under the terms and conditions of the Creative Commons Public Domain Dedication (CC0) license (https://creativecommons.org/publicdomain/zero/1.0/).