


The Variability of Snow Cover and Its Contribution to Water Resources in the Chinese Altai Mountains from 2000 to 2022


Abstract
:
1. Introduction
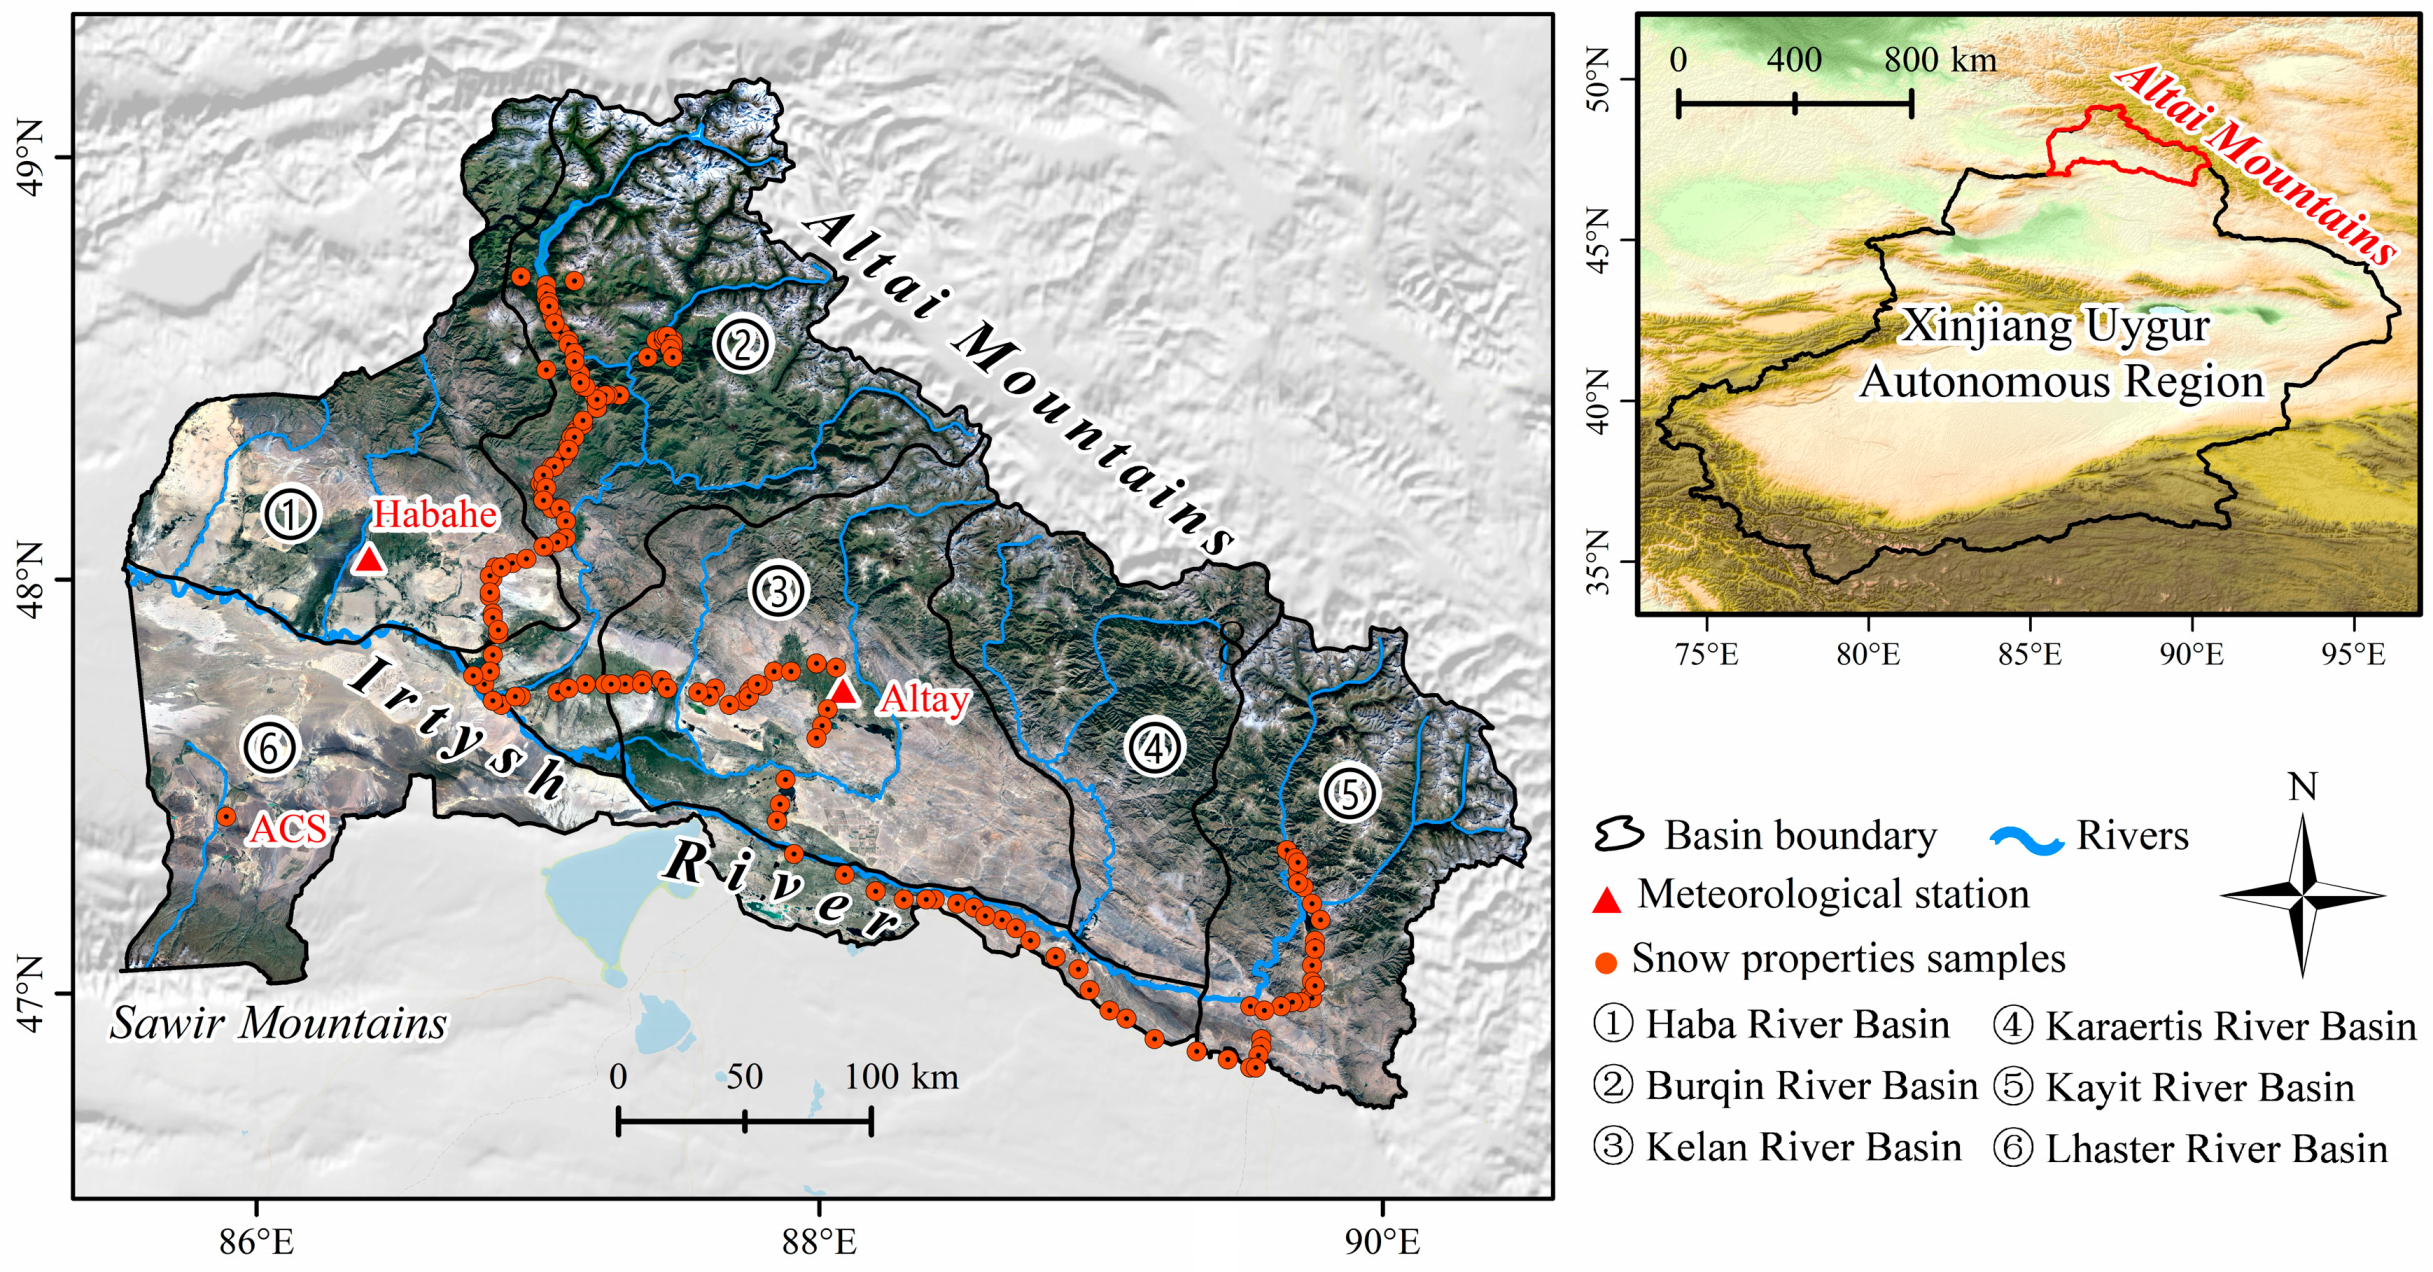
2. Study Area
3. Data and Methods
3.1. Data
3.1.1. MODIS Snow Cover Products
3.1.2. Meteorological Reanalysis Data
3.1.3. Snow Depth and Snow Density
- (1)
- Snow depth. A long-term series of daily snow depth derived from passive microwave remote sensing data, covering the entire Chinese Altai Mountains, was downloaded for free from the National Tibetan Plateau Data Center (TPDC https://data.tpdc.ac.cn/home, accessed on 20 May 2023), including daily snow depth estimates from 2000 to 2019, with a spatial resolution of 0.25°. The snow depth was generated by Che et al. (2021) [41] using a novel data fusion framework based on random forest regression combined with multisource snow depth product data, such as AMSR-E, AMSR2, NHSD, GlobSnow, ERA-Interim and MERRA2, geolocation (latitude and longitude), and topographic data (elevation). About 43,340 ground observation sites were used as the dependent variable to train and validate the snow depth, with a determination coefficient R2 of 0.81, root mean squared error of 7.69 cm, and mean absolute error of 2.74 cm. This dataset has been widely applied to regional climate and hydrological research [42,43,44]. Detailed information on the dataset sources and product processes can be found in Hu et al. (2021) [45] or Hu et al. (2023) [19]. Additionally, we used in-situ observations of snow depth from 2017 to 2019 from the Altay and Habahe meteorological stations provided by the China Meteorological Administration (http://data.cma.cn/, accessed on 20 May 2023).
- (2)
- Snow density. Zhong et al. (2021) [33] obtained 212 snow density data from the Chinese Altai Mountains in each January from 2015 to 2017 using a snow sampling tube (snow tubes). The study area consists of a mountainous higher-elevation region and the lower-elevation Irtysh River valley in the north, plus a small part occupied by the Sawir Mountains in the southwest corner (Figure 1). However, the snow density data sourced from Zhong et al. (2021) [33] and meteorological stations do not cover the Sawir Mountains. Thus, we obtained the snow density of Jimnai County from 2019 to 2021, located in the Sawir Mountains, with the support of the Altai Observation and Research Station of Cryospheric Science and Sustainable Development Northwest Institute of Eco-Environment and Resources (ACS) (Figure 1). Combined with more snow samples, it more reasonably reflects the snow density change of the Chinese Altai Mountains. Finally, combined with snow depth and snow density, the snow water equivalent was estimated based on the equation SWE = SD × Snow density × Snow cover area.
3.2. Methods
3.2.1. Snow Cover Frequency Calculation
3.2.2. Analysis Methods
3.2.3. Accuracy Assessment
4. Results
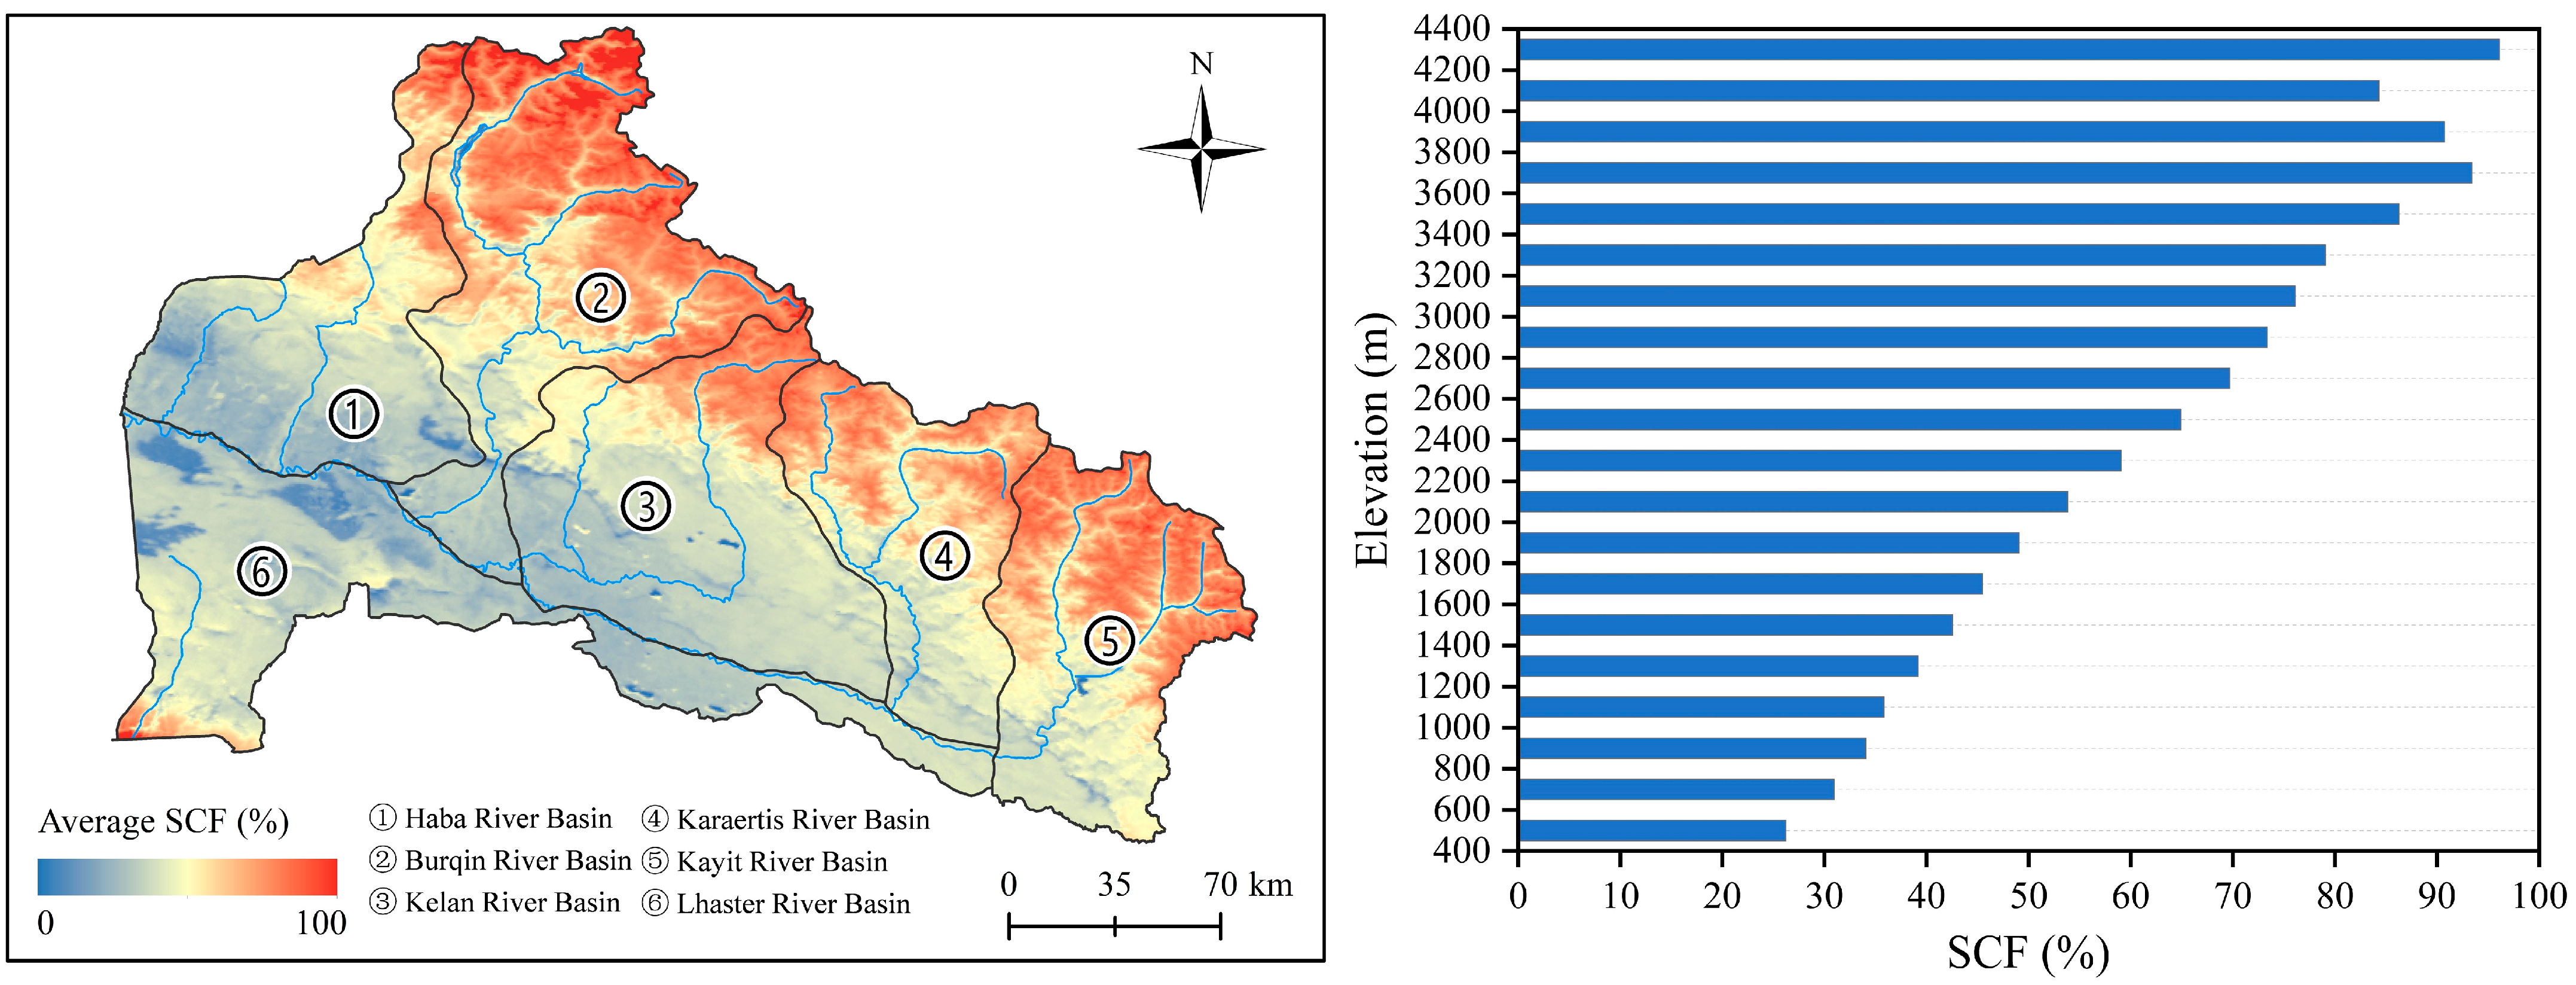
4.1. Spatial Pattern in SCF
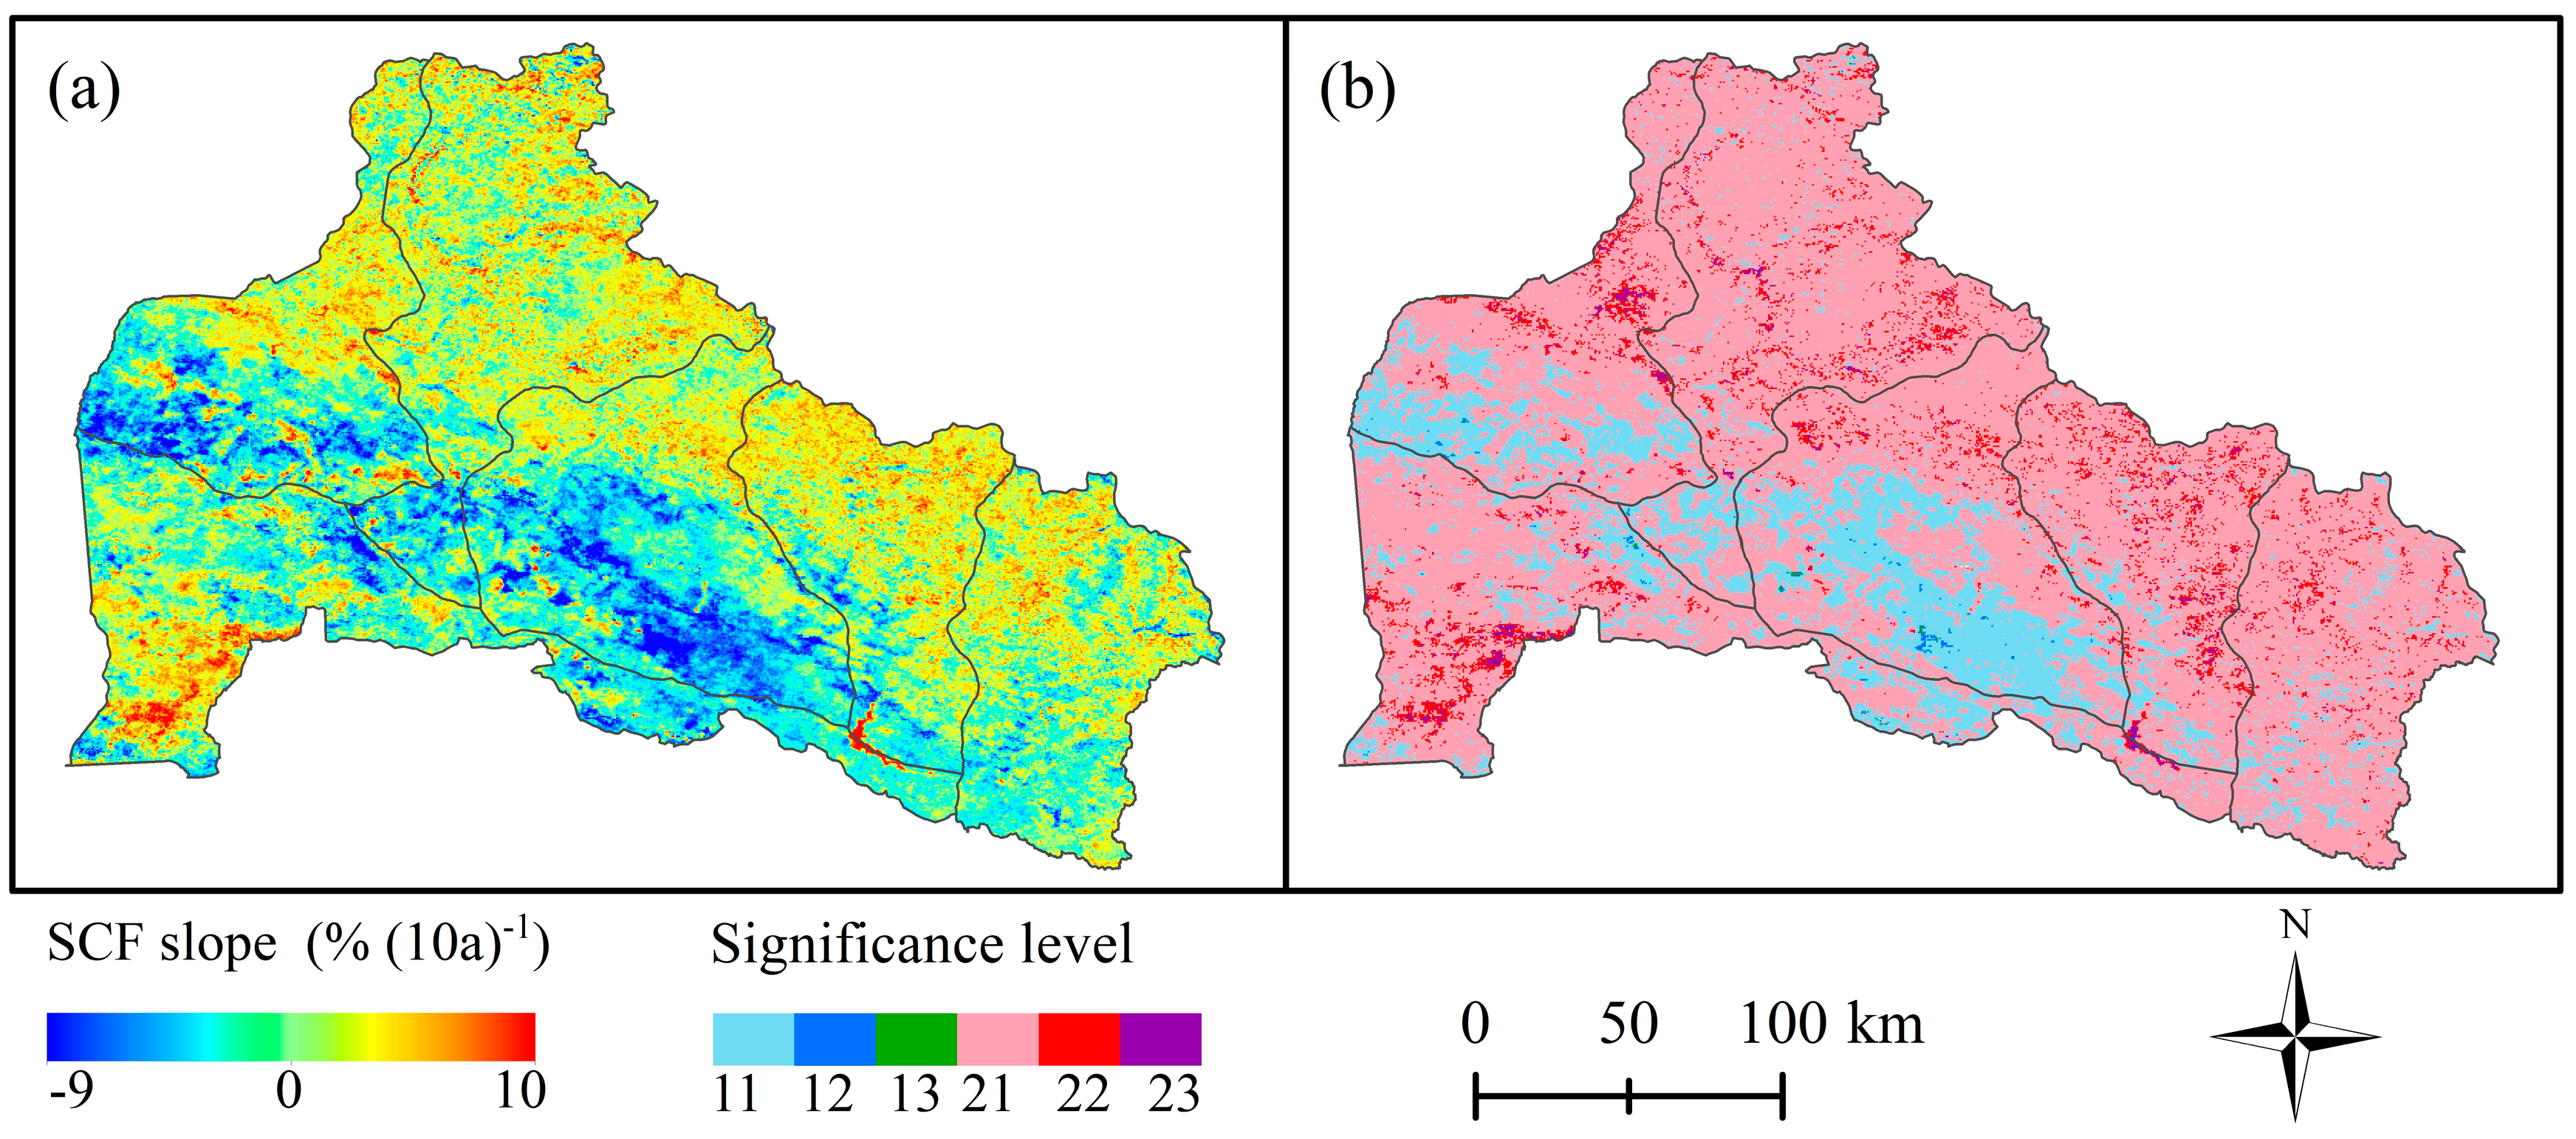
4.2. Interannual Variation in SCF
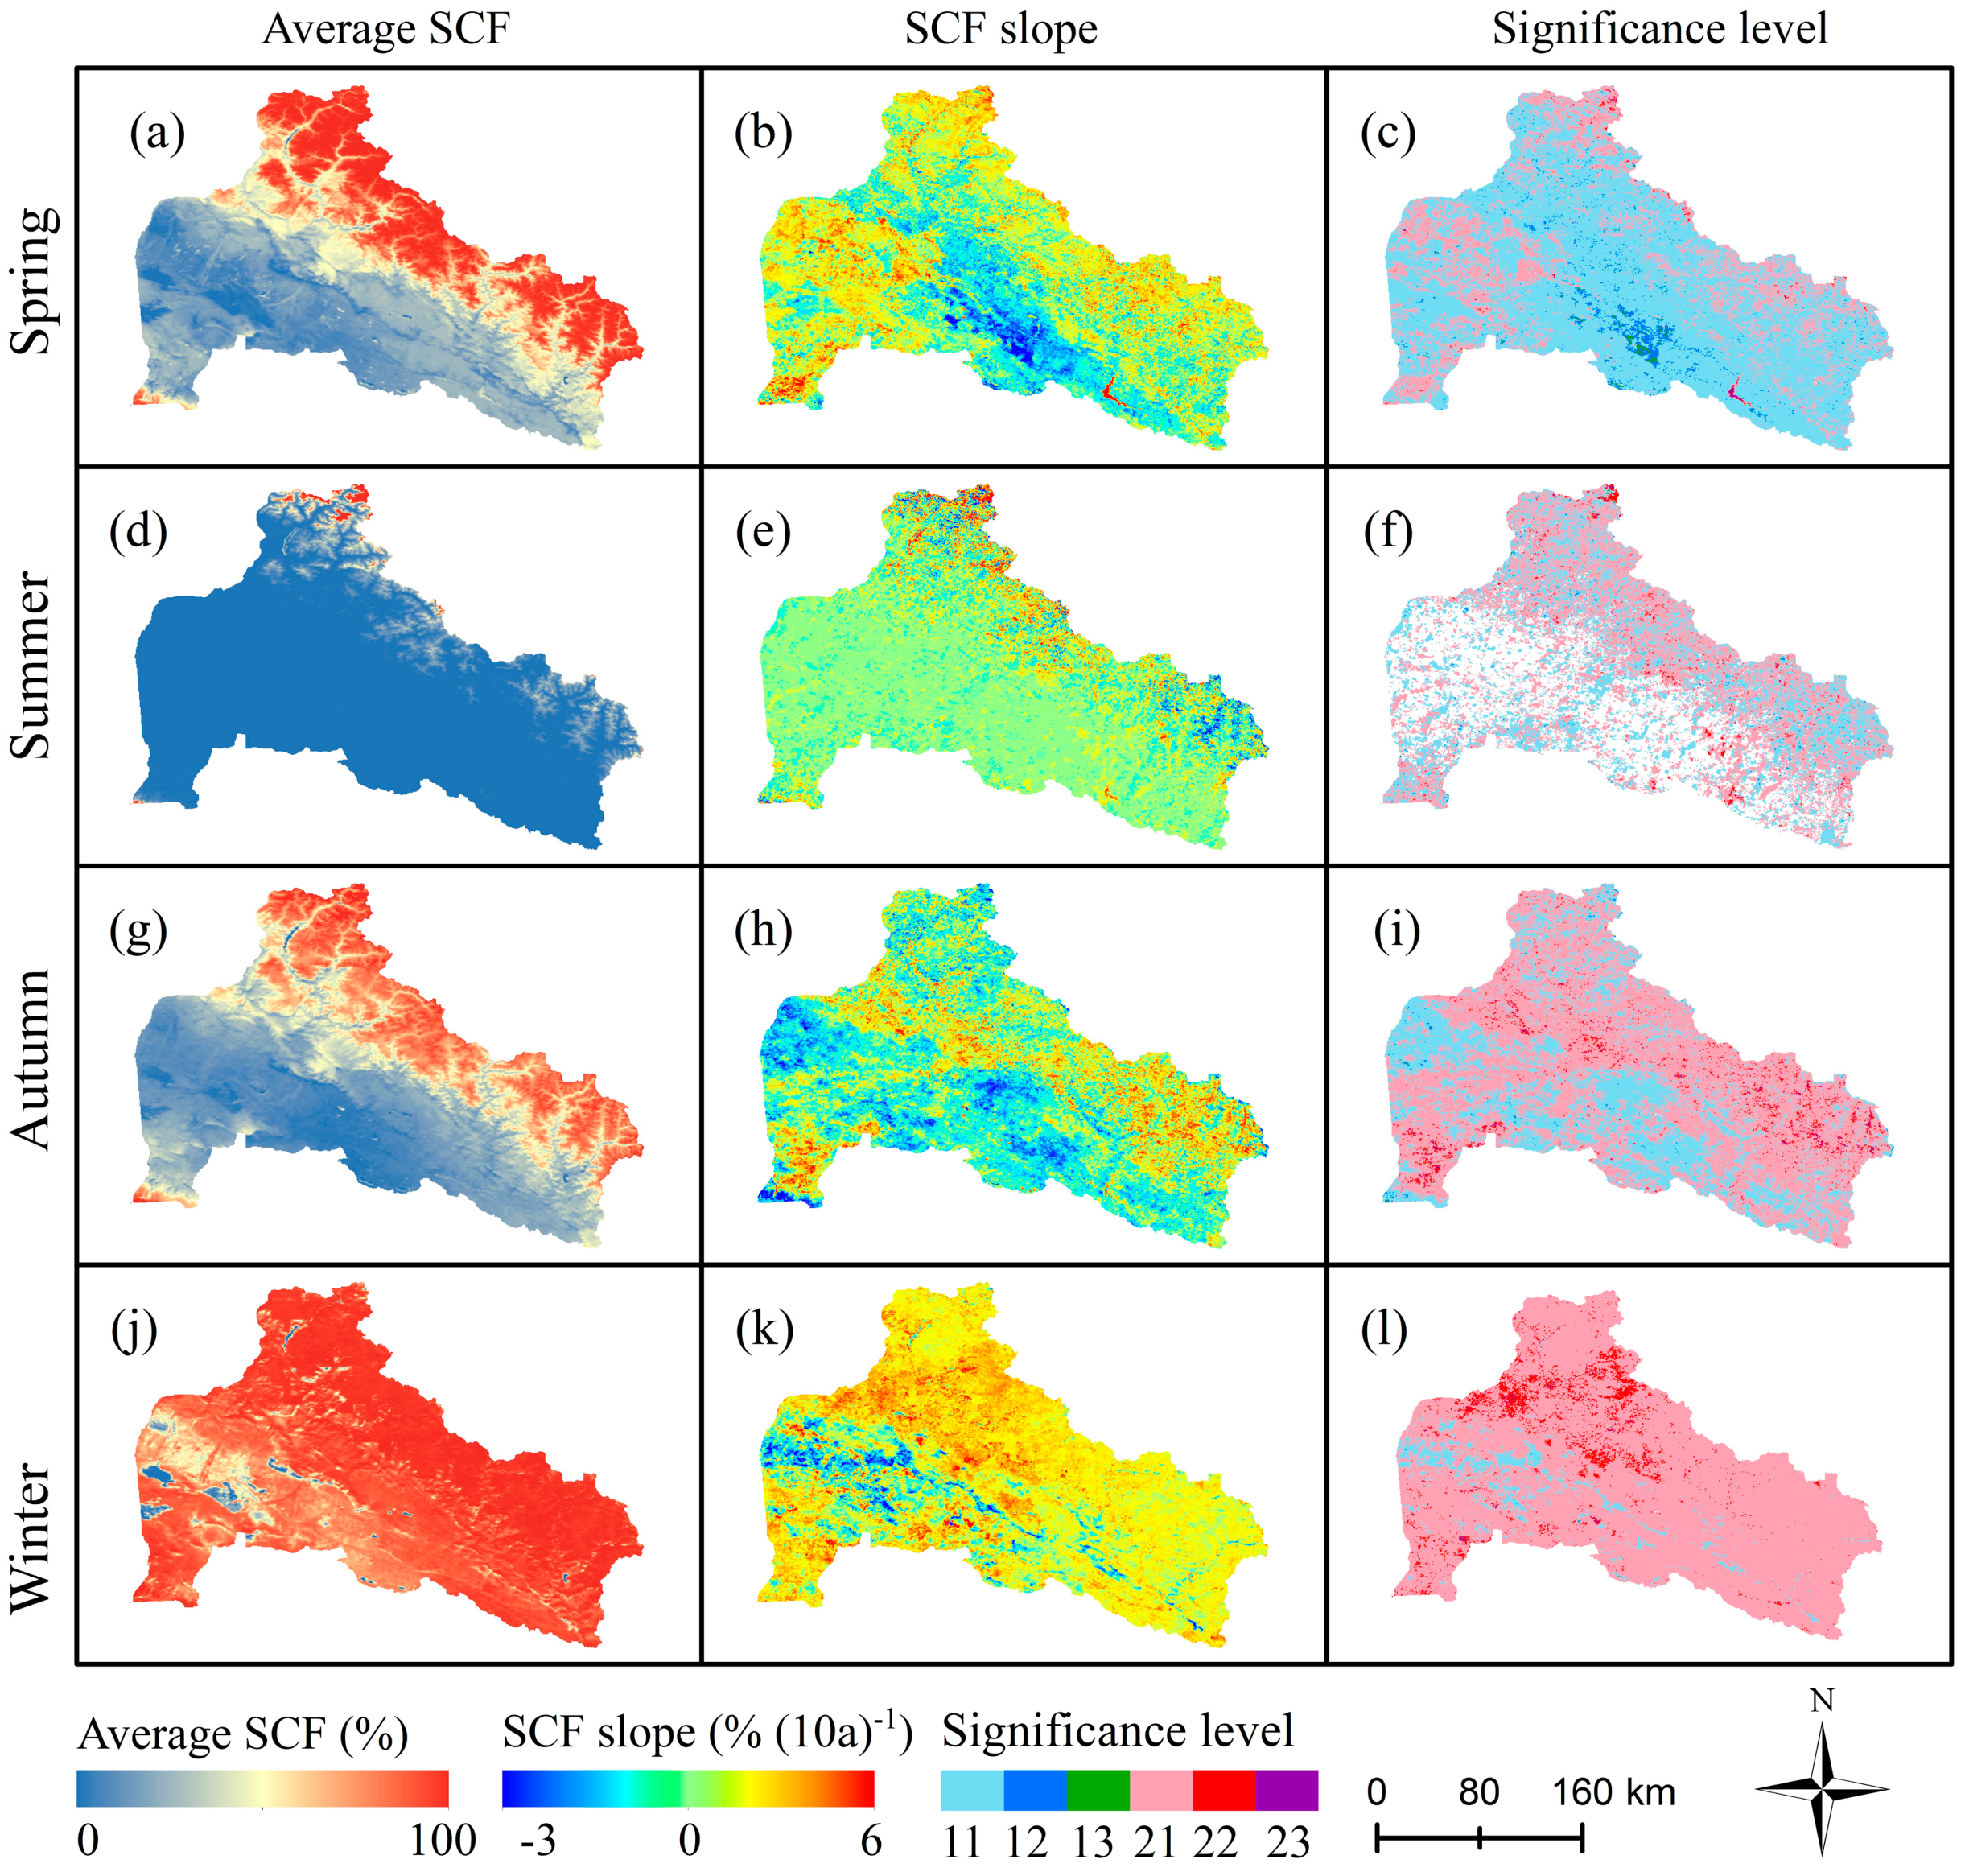
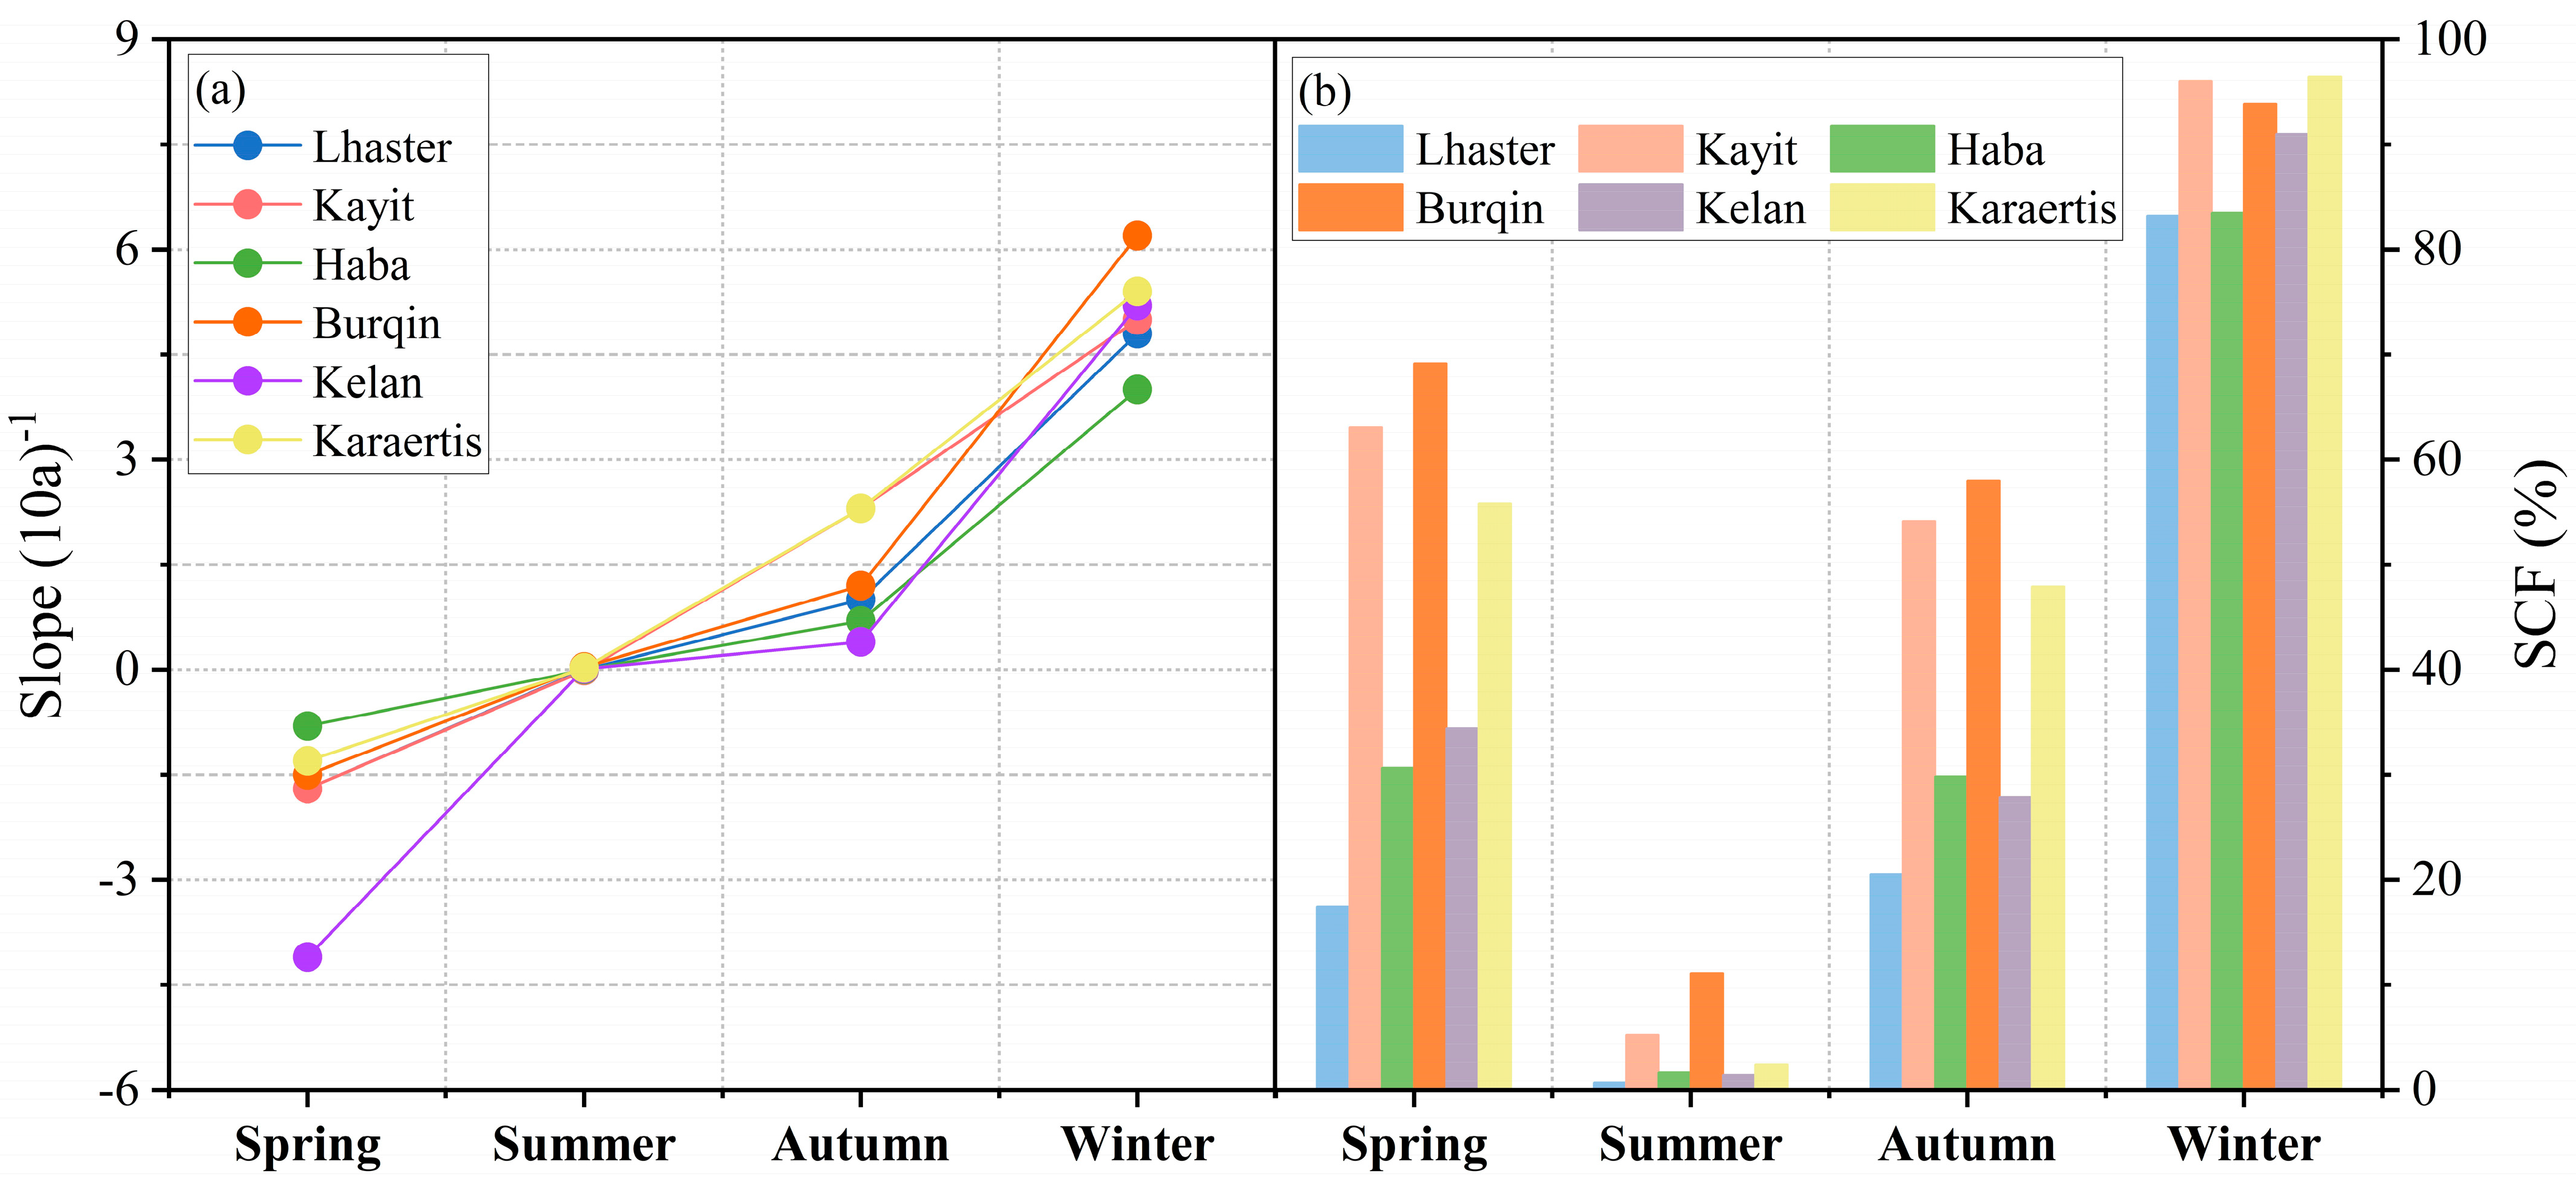
4.3. Seasonal Variation in SCF
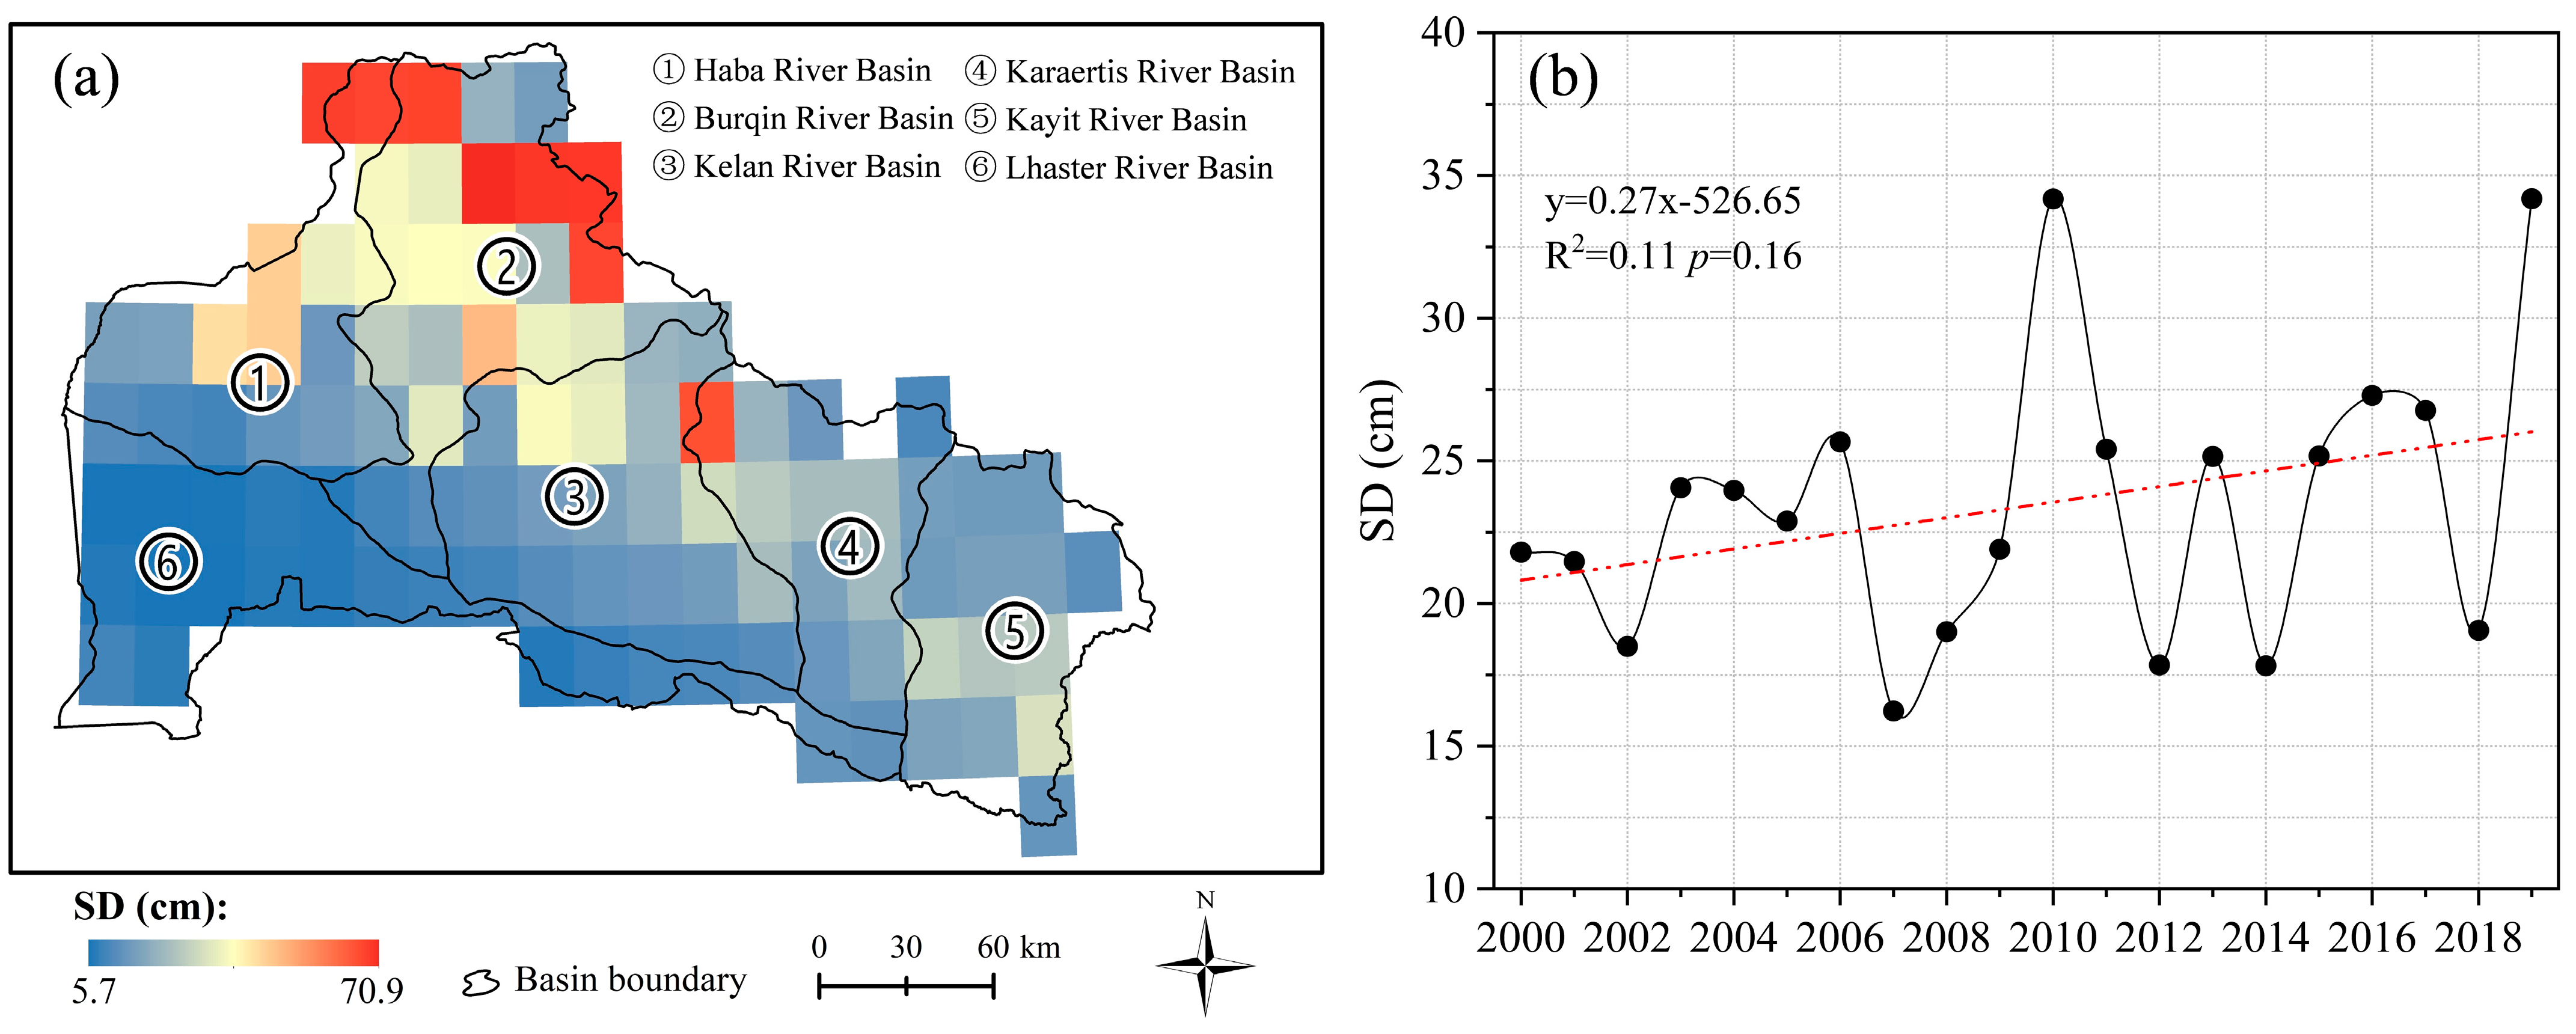
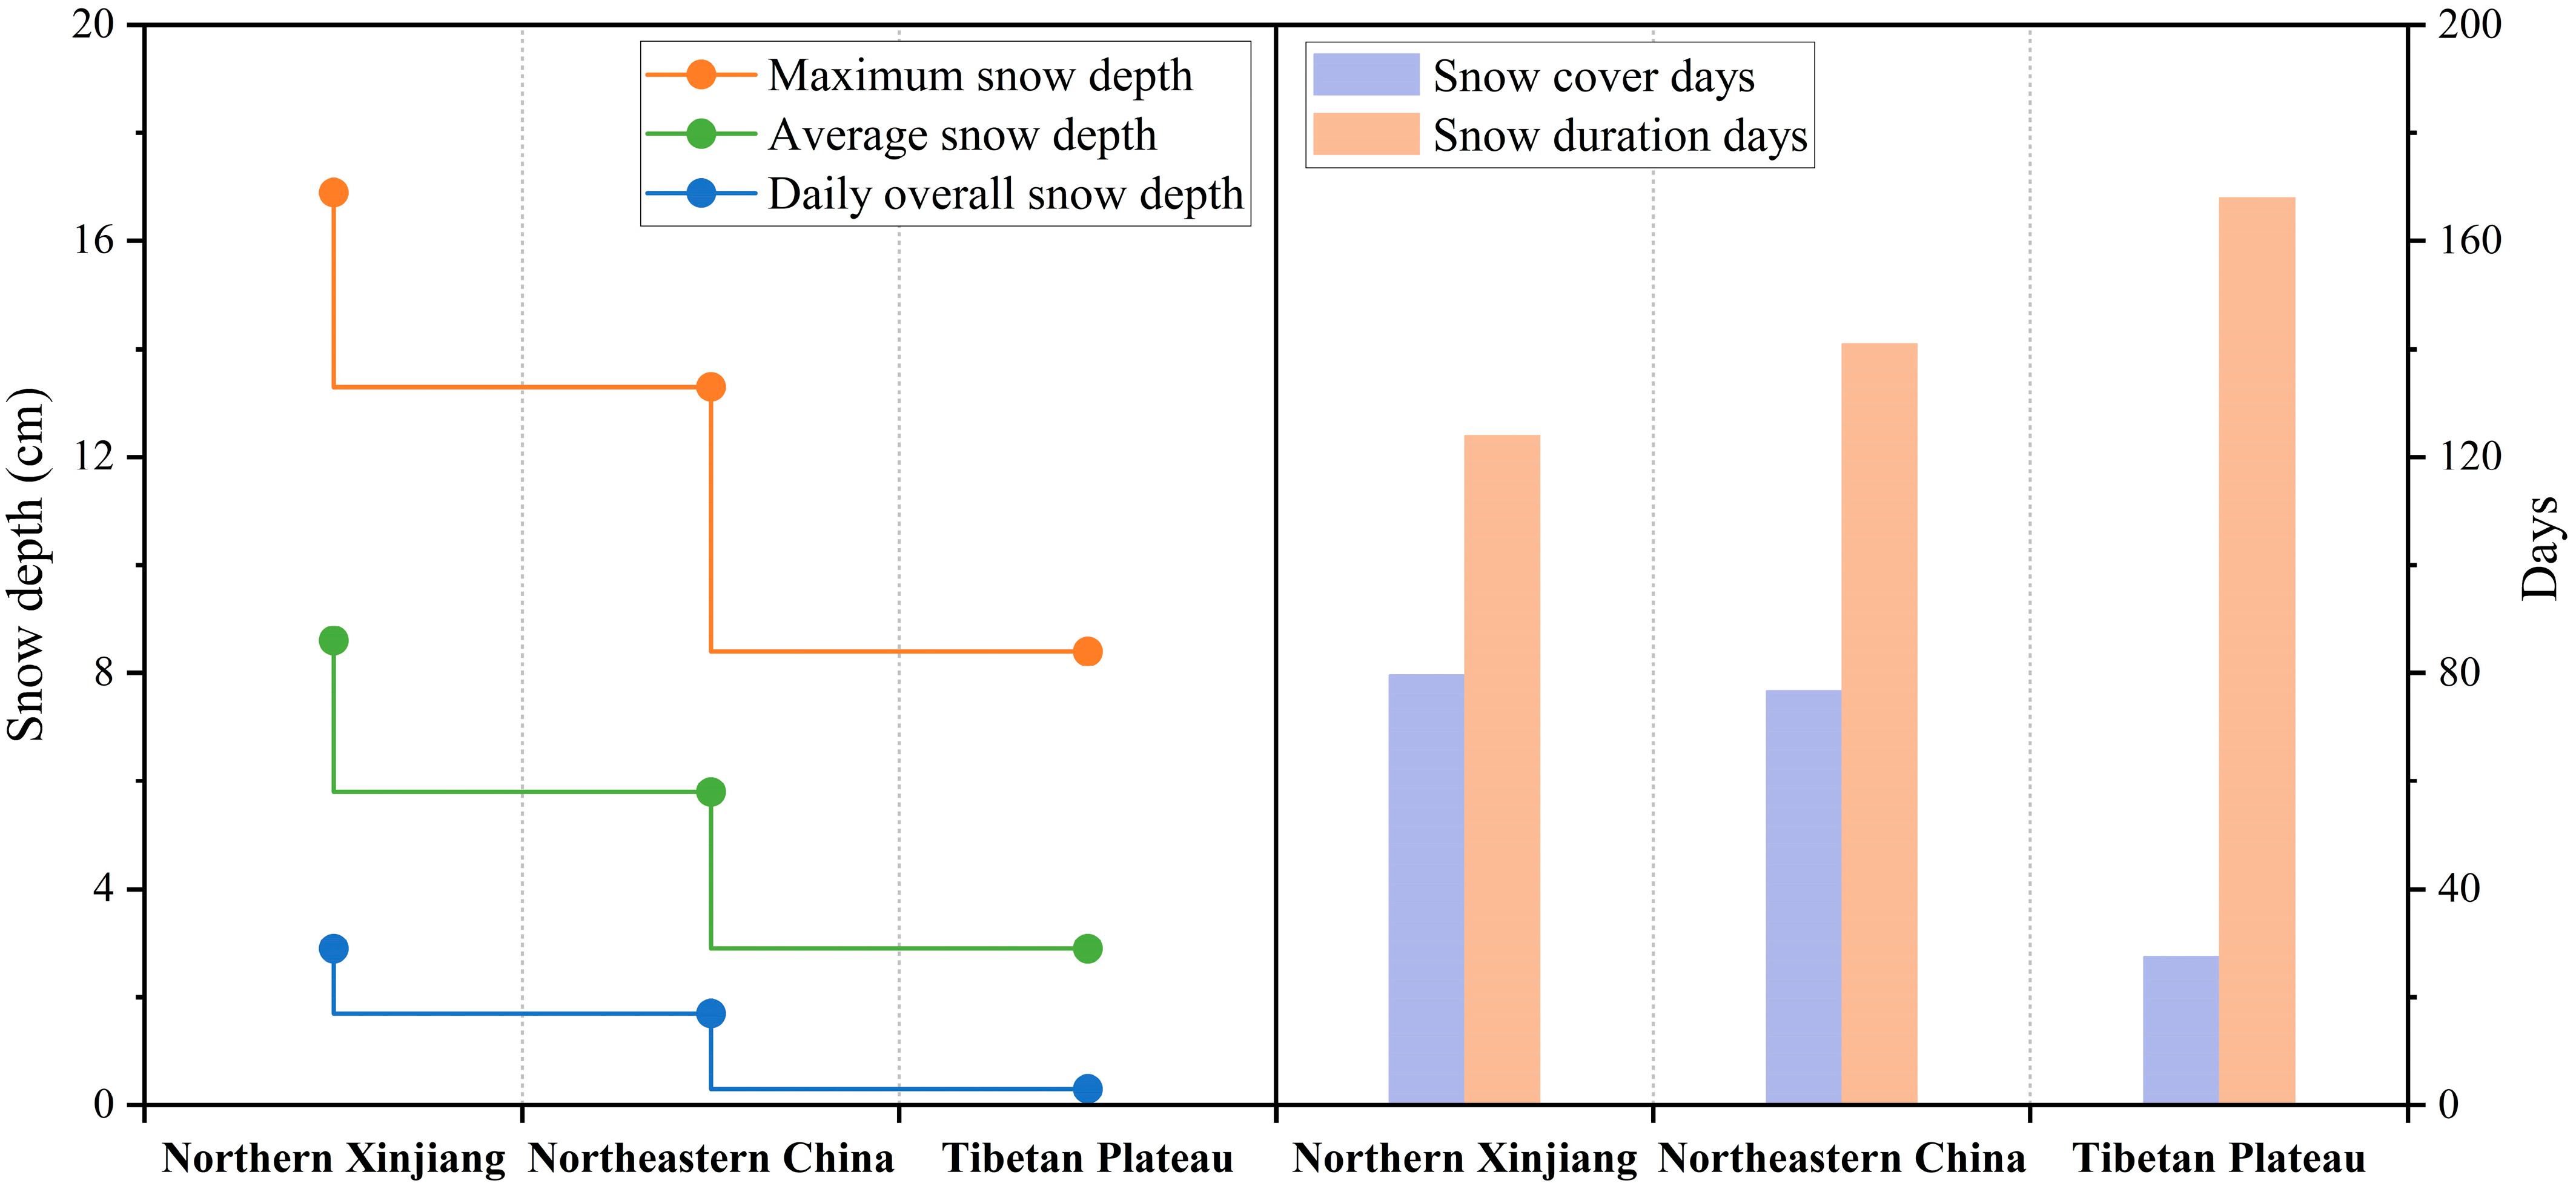
4.4. Snow Depth, Snow Density, and Snow Water Equivalent
5. Discussion
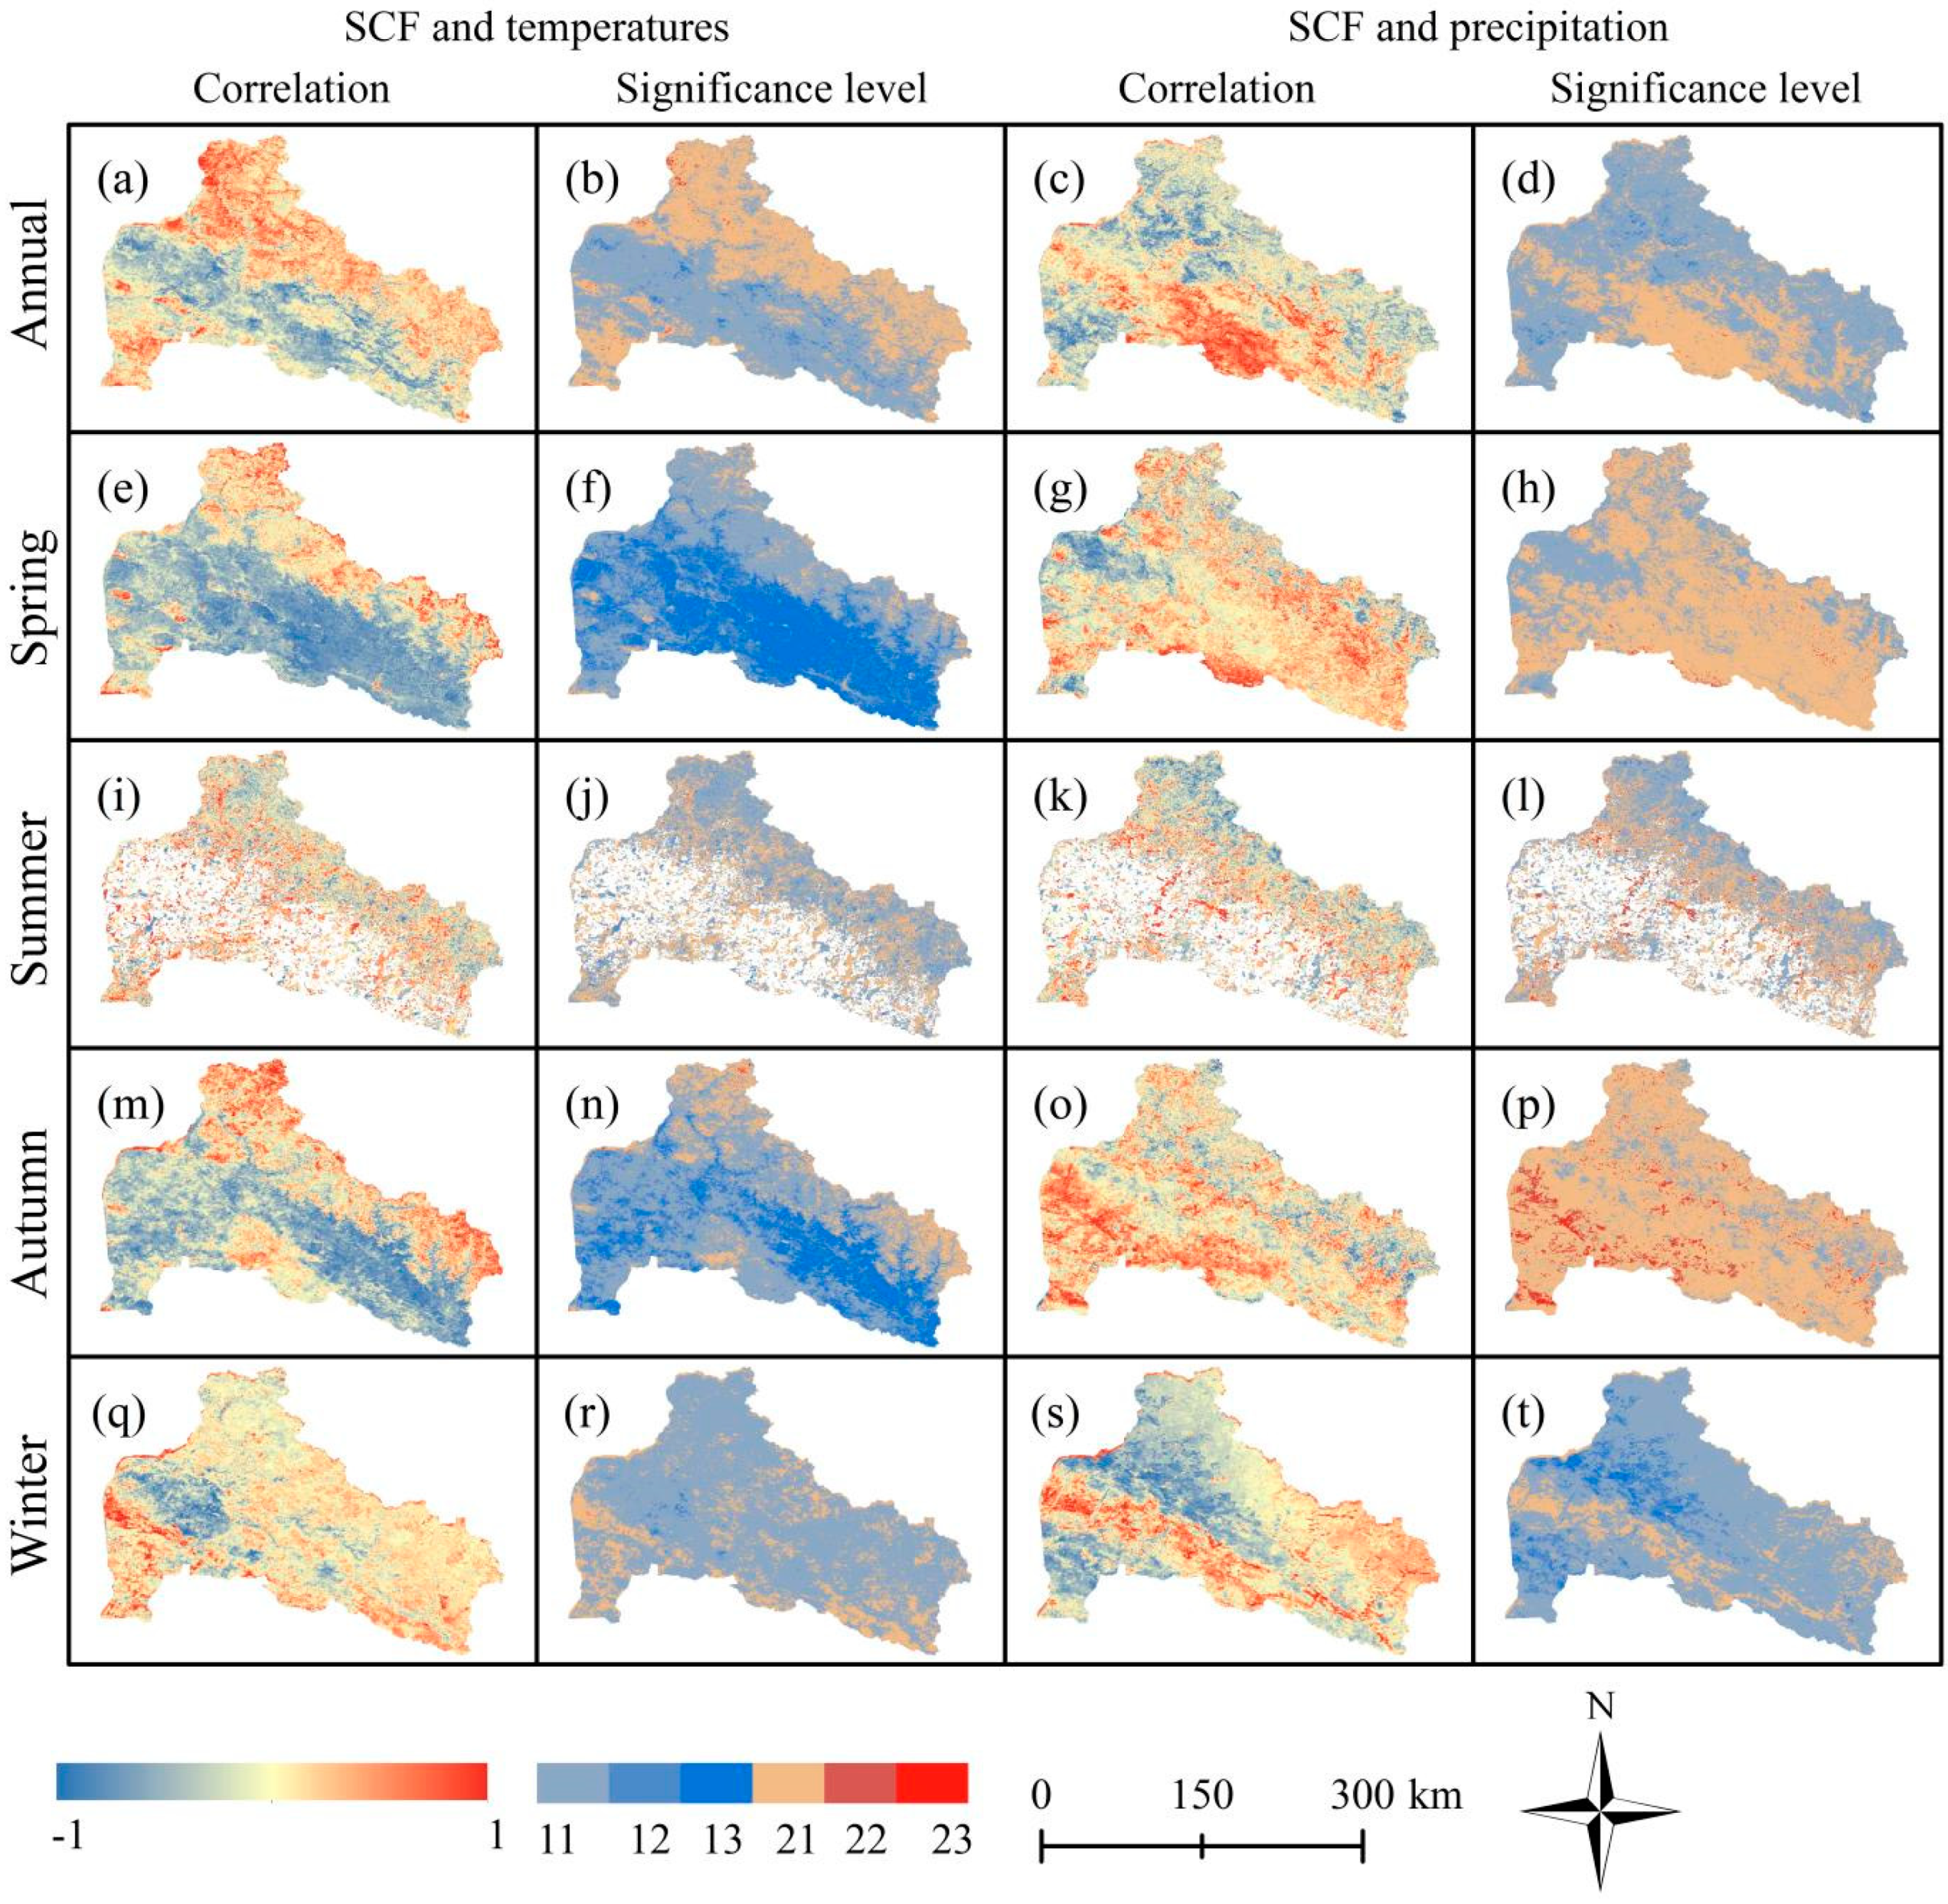
5.1. The Influence of Climatic Change on the SCF
5.2. Comparison with Previous Studies on Snow Cover Parameters
5.3. Impact of Snow Meltwater on Regional Water Resources
6. Conclusions
Author Contributions
Funding
Data Availability Statement
Conflicts of Interest
References
- You, Q.; Wu, T.; Shen, L.; Pepin, N.; Zhang, L.; Jiang, Z.; Wu, Z.; Kang, S.; AghaKouchak, A. Review of snow cover variation over the Tibetan Plateau and its influence on the broad climate system. Earth Sci. Rev. 2020, 201, 103043. [Google Scholar] [CrossRef]
- Preece, J.R.; Mote, T.L.; Cohen, J.; Wachowicz, L.J.; Knox, J.A.; Tedesco, M.; Kooperman, G.J. Summer atmospheric circulation over Greenland in response to Arctic amplification and diminished spring snow cover. Nat. Commun. 2023, 14, 3759. [Google Scholar] [CrossRef] [PubMed]
- Groisman, P.Y.; Karl, T.R.; Knight, R.W. Observed impact of snow cover on the heat balance and the rise of continental spring temperatures. Science 1994, 263, 198–200. [Google Scholar] [CrossRef] [PubMed]
- Qin, D.; Yao, T.; Ding, Y. The Cryospheric science for sustainable development. J. Glaciol. Geocryol. 2020, 42, 1–10. [Google Scholar]
- Du, W.; Kang, S.; Qian, L.; Jiang, Y.; Sun, W.; Chen, J.; Xu, Z.; Sun, W.; Qin, X.; Chai, X. Spatiotemporal variation of snow cover frequency in the Qilian Mountains (northwestern China) during 2000–2020 and associated circulation mechanisms. Remote Sens. 2022, 14, 2823. [Google Scholar] [CrossRef]
- Intergovernmental Panel on Climate Change (IPCC). Special Report on the Ocean and Cryosphere in a Changing Climate (SROCC). 2019. Available online: https://www.ipcc.ch/srocc/chapter/chapter-2/ (accessed on 20 May 2023).
- Hu, R. Snow and its Disaster Control in China; China Environmental Science Press: Beijing, China, 2013; pp. 1–11. (In Chinese) [Google Scholar]
- Shen, Y.; Wang, G.; Su, H.; Han, P.; Gao, Q.; Wang, S. Hydrological processes responding to climate warming in the upper reaches of Kelan river basin with snow-dominated of the Altay Mountains Region, Xinjiang, China. J. Glaciol. Geocryol. 2007, 29, 845–854. [Google Scholar]
- Wu, X.; Wang, X.; Liu, S.; Yang, Y.; Xu, G.; Xu, Y.; Jiang, T.; Xiao, C. Snow cover loss compounding the future economic vulnerability of western China. Sci. Total Environ. 2021, 755, 143025. [Google Scholar] [CrossRef]
- Li, Y.; Chen, Y.; Li, Z. Climate and topographic controls on snow phenology dynamics in the Tienshan Mountains, Central Asia. Atmos. Res. 2020, 236, 104813. [Google Scholar] [CrossRef]
- Parajka, J.; Blöschl, G. Validation of MODIS snow cover images over Austria. Hydrol. Earth Syst. Sci. 2006, 10, 679–689. [Google Scholar] [CrossRef]
- Urraca, R.; Gobron, N. Temporal stability of long-term satellite and reanalysis products to monitor snow cover trends. Cryosphere 2023, 17, 1023–1052. [Google Scholar] [CrossRef]
- Romanov, P.; Tarpley, D. Enhanced algorithm for estimating snow depth from geostationary satellites. Remote Sens. Environ. 2007, 108, 97–110. [Google Scholar] [CrossRef]
- Gascoin, S.; Hagolle, O.; Huc, M.; Jarlan, L.; Dejoux, J.F.; Szczypta, C.; Marti, R.; Sánchez, R. A snow cover climatology for the Pyrenees from MODIS snow products. Hydrol. Earth Syst. Sci. 2015, 19, 2337–2351. [Google Scholar] [CrossRef]
- Parajka, J.; Blöschl, G. Spatio-temporal combination of MODIS images-potential for snow cover mapping. Water Resour. Res. 2008, 44, W03406. [Google Scholar] [CrossRef]
- Saavedra, F.A.; Kampf, S.K.; Fassnacht, S.R.; Sibold, J.S. Changes in Andes snow cover from MODIS data, 2000–2016. Cryosphere 2018, 12, 1027–1046. [Google Scholar] [CrossRef]
- Matiu, M.; Hanzer, F. Bias adjustment and downscaling of snow cover fraction projections from regional climate models using remote sensing for the European Alps. Hydrol. Earth Syst. Sci. 2022, 26, 3037–3054. [Google Scholar] [CrossRef]
- Che, T.; Li, X.; Jin, R.; Armstrong, R.; Zhang, T. Snow depth derived from passive microwave remote-sensing data in China. Ann. Glaciol. 2008, 49, 145–154. [Google Scholar] [CrossRef]
- Hu, Y.; Che, T.; Dai, L.; Zhu, Y.; Xiao, L.; Deng, J.; Li, X. A long-term daily gridded snow depth dataset for the Northern Hemisphere from 1980 to 2019 based on machine learning. Big Earth Data 2023. [Google Scholar] [CrossRef]
- Notarnicola, C.; Duguay, M.; Moelg, N.; Schellenberger, T.; Tetzlaff, A.; Monsorno, R.; Costa, A.; Steurer, C.; Zebisch, M. Snow cover maps from MODIS images at 250 m resolution, Part 1: Algorithm description. Remote Sens. 2013, 5, 110–126. [Google Scholar] [CrossRef]
- Hall, D.K.; Riggs, G.A.; DiGirolamo, N.E.; Román, M.O. MODIS cloud-gap filled snow-cover products: Advantages and uncertainties. Hydrol. Earth Syst. Sci. Discuss 2019, 123, 1–23. [Google Scholar]
- Liu, A.; Che, T.; Huang, X.; Dai, L.; Wang, J.; Deng, J. Effect of Cloud Mask on the Consistency of Snow Cover Products from MODIS and VIIRS. Remote Sens. 2022, 14, 6134. [Google Scholar] [CrossRef]
- Zhou, X.; Xie, H.; Hendrickx, J.M.H. Statistical evaluation of remotely sensed snow-cover products with constraints from streamflow and SNOTEL measurements. Remote Sens. Environ. 2005, 94, 214–231. [Google Scholar] [CrossRef]
- Huang, X.; Zhang, X.; Li, X.; Liang, T.G. Accuracy Analysis for MODIS Snow Products of MOD10A1 and MOD10A2in Northern Xinjiang Area. J. Glaciol. Geocryol. 2007, 29, 722–729. [Google Scholar]
- Salminen, M.; Pulliainen, J.; Metsämäki, S.; Böttcher, K.; Heinilä, K. MODIS-derived snow-free ground reflectance statistics of selected Eurasian non-forested land cover types for the application of estimating fractional snow cover. Remote Sens. Environ. 2013, 138, 51–64. [Google Scholar] [CrossRef]
- Jiang, Y.; Du, W.; Chen, J.; Sun, W. Spatiotemporal Variations in Snow Cover and Hydrological Effects in the Upstream Region of the Shule river Catchment, Northwestern China. Remote Sens. 2021, 13, 3212. [Google Scholar] [CrossRef]
- Li, P. Variation of snow water resources in northwestern China, 1951—1997. Sci. China Ser. D Earth Sci. 1999, 42, 72–79. [Google Scholar] [CrossRef]
- Li, B.; Chen, Y.; Chen, Z.; Li, W.; Zhang, B. Variations of temperature and precipitation of snowmelt period and its effect on runoff in the mountainous areas of Northwest China. J. Geogr. Sci. 2013, 23, 17–30. [Google Scholar] [CrossRef]
- Ke, C.; Li, X.; Xie, H.; Ma, D.H.; Liu, X.; Kou, C. Variability in snow cover phenology in China from 1952 to 2010. Hydrol. Earth Syst. Sci. 2016, 20, 755–770. [Google Scholar] [CrossRef]
- Yang, Y.; Chen, R.; Liu, G.; Liu, Z.; Wang, X. Trends and variability in snowmelt in China under climate change. Hydrol. Earth Syst. Sci. 2022, 26, 305–329. [Google Scholar] [CrossRef]
- Zhuang, X.; Guo, C.; Zhao, Z.; Zhang, L. Snow cover variation analysis in Alay area of Xinjiang. J. Arid. Meteol. 2010, 28, 190–197. [Google Scholar]
- Dai, L.; Che, T. Spatiotemporal variability in snow cover from 1987 to 2011 in northern China. J. Appl. Remote Sens. 2014, 8, 084693. [Google Scholar] [CrossRef]
- Zhong, X.Y.; Zhang, T.; Su, H.; Xiao, X.X.; Wang, S.F.; Hu, Y.T.; Wang, H.J.; Zheng, L.; Zhang, W.; Xu, M.; et al. Impacts of landscape and climatic factors on snow cover in the Altai Mountains, China. Adv. Clim. Change Res. 2021, 12, 95–107. [Google Scholar] [CrossRef]
- Zhang, W.; Kang, S.; Shen, Y.; He, J.Q.; Chen, A.A. Response of snow hydrological processes to a changing climate during 1961 to 2016 in the headwater of Irtysh river basin, Chinese Altai Mountains. J. Mt. Sci. 2017, 14, 2295–2310. [Google Scholar] [CrossRef]
- Wu, X.; Zhang, W.; Li, H.; Long, Y.; Pan, X.; Shen, Y. Analysis of seasonal snowmelt contribution using a distributed energy balance model for a river basin in the Altai Mountains of northwestern China. Hydrol. Process. 2021, 35, e14046. [Google Scholar] [CrossRef]
- Aizen, V.B.; Aizen, E.M.; Joswiak, D.R.; Fujita, K.; Takeuchi, N.; Nikitin, S.A. Climatic and atmospheric circulation pattern variability from ice-core isotope/geochemistry records (Altai, Tien Shan and Tibet). Ann. Glaciol. 2006, 43, 49–60. [Google Scholar] [CrossRef]
- Narozhniy, Y.; Zemtsov, V. Current state of the Altai glaciers (Russia) and trends over the period of instrumental observations 1952–2008. Ambio 2011, 40, 575–588. [Google Scholar] [CrossRef] [PubMed]
- Panagiotopoulos, F.; Shahgedanova, M.; Hannachi, A.; Stephenson, D.B. Observed trends and teleconnections of the Siberian high: A recently declining center of action. J. Clim. 2005, 18, 1411–1422. [Google Scholar] [CrossRef]
- Ding, Y.; Zhang, S.; Wu, J.; Zhao, Q.; Li, X.; Qin, J. Recent progress on studies on cryospheric hydrological processes changes in China. Adv. Water Sci. 2020, 31, 690–702. [Google Scholar]
- Li, J.; Chen, Y.; Liu, Z. Variations in temperature and precipitation and their influences on surface water resource in different climate zones of Xinjiang. J. Univ. Chin. Acad. Sci. 2018, 35, 370–381. [Google Scholar]
- Che, T.; Hu, Y.; Dai, L.; Xiao, L. Long-Term Series of Daily Snow Depth Dataset over the Northern Hemisphere Based on Machine Learning (1980–2019). National Tibetan Plateau/Third Pole Environment Data Center. 2021. Available online: https://cstr.cn/18406.11.Snow.tpdc.271701 (accessed on 20 May 2023).
- Liu, J.; Fang, P.; Que, Y.; Zhu, L.; Duan, Z.; Tang, G.; Liu, P.; Ji, M.; Liu, Y. A dataset of lake-catchment characteristics for the Tibetan Plateau. Earth Syst. Sci. Data 2022, 14, 3791–3805. [Google Scholar] [CrossRef]
- Wei, Y.; Li, X.; Gu, L.; Zheng, X.; Jiang, T. A novel fine-resolution snow depth retrieval model to reveal detailed spatiotemporal patterns of snow cover in Northeast China. Int. J. Digit. Earth 2023, 16, 1164–1185. [Google Scholar] [CrossRef]
- Kadel, A. Verification of a Global Streamflow Forecast for the Purpose of Run-of-River Hydropower Operation in Nepal; University of British Columbia: Vancouver, BC, Canada, 2022. [Google Scholar]
- Hu, Y.; Che, T.; Dai, L.; Xiao, L. Snow depth fusion based on machine learning methods for the Northern Hemisphere. Remote Sens. 2021, 13, 1250. [Google Scholar] [CrossRef]
- Yan, W.; Wang, Y.; Ma, X.; Liu, M.; Yan, J.; Tan, Y.; Liu, S. Snow Cover and Climate Change and Their Coupling Effects on Runoff in the Keriya river basin during 2001–2020. Remote Sens. 2023, 15, 3435. [Google Scholar] [CrossRef]
- Huang, X.; Deng, J.; Wang, W.; Feng, Q.; Liang, T. Impact of climate and elevation on snow cover using integrated remote sensing snow products in Tibetan Plateau. Remote Sens. Environ. 2017, 190, 274–288. [Google Scholar] [CrossRef]
- Qin, S.; Xiao, P.; Zhang, X. How do snow cover fraction change and respond to climate in Altai Mountains of China? Int. J. Climatol. 2022, 42, 7213–7227. [Google Scholar] [CrossRef]
- Zhao, Q.; He, X.; Dong, C.; Wang, J.; Li, H.; Wang, X. The Relationship between the Temporal and Spatial Changes of Snow Cover and Climate and Vegetationin Northern Xinjiang from 1980 to 2019. Remote Sens. Technol. Appl. 2021, 36, 1247–1258. [Google Scholar]
- Wang, H.; Wang, M.; Wang, S.; Yu, X.; Han, X. Spatial-temporal variation of snow cover in Xinjiang based on surface observation from 1961 to 2017. J. Glaciol. Geocryol. 2020, 42, 72–80. [Google Scholar]
- Li, P.; Mi, D. Distribution of snow cover in China. J. Glaciol. Geocryol. 1983, 5, 9–18. [Google Scholar]
- Zhong, Z.; Li, X.; Xu, X.; Liu, X.; He, Z. Spatial-temporal variations analysis of snow cover in China from 1992−2010. Chin. Sci. Bull. 2018, 63, 2641–2654. [Google Scholar]
- Liu, C. Spatiotemporal Heterogeneity of Snow Cover and Causes in China. Ph.D. Thesis, Lanzhou University, Lanzhou, China, 2021. [Google Scholar]
- Chu, D.; Da, w.; Laba, Z.M.; Xu, W.; Zhang, J. An analysis of spatial-temporal distribution features of snow cover over the Tibetan Plateau based on MODIS data. Remote Sens. Land Resour. 2017, 29, 117–124. [Google Scholar]
- Li, L.; Ke, C. Analysis of spatiotemporal snow cover variations in Northeast China based on moderate-resolution-imaging spectroradiometer data. J. Appl. Remote Sens. 2014, 8, 084695. [Google Scholar] [CrossRef]
- Huang, X.; Ma, Y.; Li, Y.; Yang, X.L.; Wang, Y.L.; Liang, T.G. Spatiotemporal variation of snow cover over the Tibetan Plateau from 1980 to 2020. J. Glaciol. Geocryol. 2023, 45, 423–434. [Google Scholar]
- Li, H.; Li, X.; Yang, D.; Wang, J.; Gao, B.; Pan, X.; Zhang, Y.; Hao, X. Tracing snowmelt paths in an integrated hydrological model for understanding seasonal snowmelt contribution at basin scale. J. Geophys. Res. Atmos. 2019, 124, 8874–8895. [Google Scholar] [CrossRef]
- Yang, Z. Glacier Water Resources in China; Gansu People’s Publishing House: Lanzhou, China, 1991. [Google Scholar]
- Wu, M.; Jiang, Y.; Guan, X.; Pang, L.; Lv, H.; Zheng, X. Basin-wide erosion rate in Chinese Altai Mountains and its controlling factors. J. Glaciol. Geocryol. 2022, 44, 1357–1369. [Google Scholar]
- Gao, X. Glacier Runoff Variation and its Influence on River Runoff in Western China. Master’s Thesis, University of Chinese Academy of Sciences, Beijing, China, 2010. [Google Scholar]
- Liu, G.H. Study of Glacier Runoff Changes in China Based on a New Parametric Scheme of Degree-Day Model. Ph.D. Thesis, University of Chinese Academy of Sciences, Beijing, China, 2021. [Google Scholar]


| Parameters | Period | Haba | Burqin | Kelan | Karaertis | Kayit | Lhaster | Chinese Altai Mountains |
|---|---|---|---|---|---|---|---|---|
| Basin area (×104 km2) | - | 0.77 | 1.05 | 0.97 | 0.64 | 0.73 | 0.94 | 5.1 |
| Mean snow cover area (×104 km2) | 2000–2022 | 0.28 | 0.61 | 0.37 | 0.32 | 0.4 | 0.29 | 2.27 |
| SD_mean (cm) | 2000–2019 | 27.23 | 35.6 | 21.16 | 20.03 | 19.93 | 7.66 | 23.41 |
| SWE_min (km3) | 2000–2022 | 0.08 | 0.24 | 0.09 | 0.07 | 0.09 | 0.02 | 0.58 |
| SWE_max (km3) | 2000–2022 | 0.21 | 0.61 | 0.22 | 0.18 | 0.22 | 0.06 | 1.49 |
| SWE_mean (km3) | 2000–2022 | 0.16 | 0.46 | 0.16 | 0.13 | 0.17 | 0.05 | 1.12 |
| Period | SCF and Temperature | SCF and Precipitation | ||||||||||
|---|---|---|---|---|---|---|---|---|---|---|---|---|
| Positive Correlation | Negative Correlation | Positive Correlation | Negative Correlation | |||||||||
| p < 0.01 | p < 0.05 | p > 0.05 | p < 0.01 | p < 0.05 | p > 0.05 | p < 0.01 | p < 0.05 | p > 0.05 | p < 0.01 | p < 0.05 | p > 0.05 | |
| Annual | 0.06 | 0.65 | 43.26 | 0.3 | 2.46 | 53.27 | 0 | 0.19 | 32.82 | 0.21 | 1.84 | 64.94 |
| Spring | 0.01 | 0.05 | 5.27 | 32.87 | 21.62 | 40.19 | 0.07 | 0.98 | 66.71 | 0.02 | 0.18 | 32.03 |
| Summer | 0.02 | 0.24 | 27.31 | 0.34 | 2.25 | 36.04 | 0.33 | 3.16 | 29.19 | 0.1 | 0.6 | 32.81 |
| Autumn | 0.06 | 0.22 | 15.31 | 15.5 | 17.37 | 51.54 | 1.36 | 6.44 | 78.51 | 0.01 | 0.07 | 13.61 |
| Winter | 0 | 0.04 | 21.04 | 0.08 | 0.63 | 78.21 | 0 | 0.03 | 14.39 | 2.75 | 9.39 | 73.44 |
Disclaimer/Publisher’s Note: The statements, opinions and data contained in all publications are solely those of the individual author(s) and contributor(s) and not of MDPI and/or the editor(s). MDPI and/or the editor(s) disclaim responsibility for any injury to people or property resulting from any ideas, methods, instructions or products referred to in the content. |
© 2023 by the authors. Licensee MDPI, Basel, Switzerland. This article is an open access article distributed under the terms and conditions of the Creative Commons Attribution (CC BY) license (https://creativecommons.org/licenses/by/4.0/).
Share and Cite
Yu, F.; Wang, P.; Liu, L.; Li, H.; Zhang, Z. The Variability of Snow Cover and Its Contribution to Water Resources in the Chinese Altai Mountains from 2000 to 2022. Remote Sens. 2023, 15, 5765. https://doi.org/10.3390/rs15245765
Yu F, Wang P, Liu L, Li H, Zhang Z. The Variability of Snow Cover and Its Contribution to Water Resources in the Chinese Altai Mountains from 2000 to 2022. Remote Sensing. 2023; 15(24):5765. https://doi.org/10.3390/rs15245765
Chicago/Turabian StyleYu, Fengchen, Puyu Wang, Lin Liu, Hongliang Li, and Zhengyong Zhang. 2023. "The Variability of Snow Cover and Its Contribution to Water Resources in the Chinese Altai Mountains from 2000 to 2022" Remote Sensing 15, no. 24: 5765. https://doi.org/10.3390/rs15245765
APA StyleYu, F., Wang, P., Liu, L., Li, H., & Zhang, Z. (2023). The Variability of Snow Cover and Its Contribution to Water Resources in the Chinese Altai Mountains from 2000 to 2022. Remote Sensing, 15(24), 5765. https://doi.org/10.3390/rs15245765