Technical Note

Semantic Segmentation of High-Resolution Remote Sensing Images Based on Sparse Self-Attention and Feature Alignment

College of Electronic Science and Technology, National University of Defense Technology, Changsha 410073, China
*
Author to whom correspondence should be addressed.
Remote Sens. 2023, 15(6), 1598; https://doi.org/10.3390/rs15061598
Submission received: 19 January 2023 / Revised: 8 March 2023 / Accepted: 13 March 2023 / Published: 15 March 2023
(This article belongs to the Special Issue Remote Sensing Image Classification and Semantic Segmentation)

Abstract

:
Semantic segmentation of high-resolution remote sensing images (HRSI) is significant, yet challenging. Recently, several research works have utilized the self-attention operation to capture global dependencies. HRSI have complex scenes and rich details, and the implementation of self-attention on a whole image will introduce redundant information and interfere with semantic segmentation. The detail recovery of HRSI is another challenging aspect of semantic segmentation. Several networks use up-sampling, skip-connections, parallel structure, and enhanced edge features to obtain more precise results. However, the above methods ignore the misalignment of features with different resolutions, which affects the accuracy of the segmentation results. To resolve these problems, this paper proposes a semantic segmentation network based on sparse self-attention and feature alignment (SAANet). Specifically, the sparse position self-attention module (SPAM) divides, rearranges, and resorts the feature maps in the position dimension and performs position attention operations (PAM) in rearranged and restored sub-regions, respectively. Meanwhile, the proposed sparse channel self-attention module (SCAM) groups, rearranges, and resorts the feature maps in the channel dimension and performs channel attention operations (CAM) in the rearranged and restored sub-channels, respectively. SPAM and SCAM effectively model long-range context information and interdependencies between channels, while reducing the introduction of redundant information. Finally, the feature alignment module (FAM) utilizes convolutions to obtain a learnable offset map and aligns feature maps with different resolutions, helping to recover details and refine feature representations. Extensive experiments conducted on the ISPRS Vaihingen, Potsdam, and LoveDA datasets demonstrate that the proposed method precedes general semantic segmentation- and self-attention-based networks.

Graphical Abstract

1. Introduction

Semantic segmentation predicts the semantic labels for each pixel in an image. Semantic segmentation of high-resolution remote sensing images (HRSI) is the cornerstone of remote sensing interpretation. It is of great importance in many fields, such as mapping, navigation, land resource management, etc. [1,2,3]. Specifically, land cover maps depict local and overall landscape conditions, from which environmental change trends can be obtained. Semantic segmentation can be used to assess urban development and estimate the impact of natural disasters. Since remote sensing technology has advanced, HRSI with more complex pixel representation have become more readily available. Semantic segmentation is more crucial and challenging for HRSI. Traditional semantic segmentation methods [4,5,6] rely on expert experience and complex human-designs. Moreover, the segmentation performance relies on the accuracy and suitability of manually designed features. With robust feature modeling capabilities, deep learning technology has become an effective method used for semantic segmentation of HRSI, and researchers have applied deep learning technology to this operation. Specifically, a convolutional neural network (CNN) [7] has been widely used in semantic segmentation and achieved satisfactory results. To further enhance the accuracy of semantic segmentation, researchers focus on both contextual information fusion and the refinement of segmentation results.
To achieve contextual information fusion, several network variants are proposed to enhance contextual aggregation. PSPNet [8] developed spatial pyramid pooling to acquire a rich, multi-scale context. The Deeplab series [9,10,11] utilized the atrous spatial pyramid pooling (ASPP) to gather contextual clues, which consisted of parallel atrous convolutions with different dilated rates. GCN [12] removed the pooling in the network and developed a large decoupling convolution kernel to extract features. The large convolution kernel can obtain a large receptive field and is beneficial to the capture of long-range contextual information. However, the above methods fail to model the global contextual dependencies across an entire image. Recently, self-attention mechanisms commonly used in natural language processing (NLP) have been widely used for visual tasks with exciting results. Wang et al. [13] first proposed self-attention to capture global dependencies. Fu et al. [14] developed DANet to model non-local dependencies in position and channel dimensions. Instead of calculating self-attention at each point, EAMNet [15] utilized the expectation-maximization iteration manner to learn a more compact basis set, and then carried out self-attention. To model spatial long-range dependencies, CCNet [16] proposed recurrent a criss-cross attention module. Yuan et al. [17] developed OCNet with interlaced sparse self-attention. The above methods show that the self-attention operation is an effective way to capture global dependencies. Thus, several studies have used the self-attention mechanism for semantic segmentation of HRSI. Shi et al. [18] combined self-attention and atrous convolution with different atrous rates to capture spatially adaptive global context information. Li et al. [19] proposed kernel attention with linear complexity and combined it with the standard dot product attention. However, the above methods ignore a key problem: due to the complex background and rich details of HRSI, standard self-attention will introduce redundant information and interfere with semantic segmentation. To solve this problem, this paper proposes the sparse position self-attention module (SPAM) and sparse channel self-attention module (SCAM), which not only captures the global information, but also reduces the interference of redundant information.
For the refinement of segmentation results, the current semantic segmentation network uses several strategies. One is to obtain the high-level semantic information gradually via down-sampling and then integrate the features of various levels through the decoder to recover the details. For example, Long et al. [20] proposed fully convolutional networks (FCNs) that restored the original image size by incorporating the low-level features and high-level features. SegNet [21] retained the index of the maximum position when pooling, and the index was reused when upsampling. U-Net [22] adopted skip-connections to connect shallow layers and deep layers. RefineNet [23] utilized a Laplacian image pyramid to explicitly model the available information during downsampling and predictions from coarse to fine. Another potential strategy is to learn semantic information while maintaining high resolution feature maps. For example, HRNet [24] proposed a parallel structure backbone network, which maintained high resolution characteristics during the entire process. Additionally, several networks refine the segmentation edges to obtain more precise semantic segmentation results. Gated-SCNN [25] deconstructed the edge information from the regular features and used a shape branch to focus on semantic boundary information. SegFix [26] proposed a post-processing method to refine the boundaries of semantic segmentation results. ERN [27] developed the edge enhancement structure and the loss function used to supervise the edge to enhance the segmentation accuracy. Zheng et al. [28] developed a Dice-based edge-aware loss function to refine edge information directly from semantic segmentation prediction. Li et al. [29] highlighted the edge distribution of the feature map in a self-attention fashion. The above methods recover the details and improve the edge segmentation performance to some extent. However, the issue of feature maps with different resolutions being misaligned is ignored. To solve this problem, this paper proposes the feature alignment module (FAM), which generates a learnable offset map to align feature maps with different resolutions.
HRSI generally have complex background information and abundant details, which makes semantic segmentation more challenging. The standard self-attention and excessive fusion of long-range context information may introduce redundant information and cause interference to object segmentation. This paper proposes SPAM and SCAM to effectively model the position global context and channel-wise dependencies. Additionally, feature maps with different resolutions are not aligned. Features from shadow layers and deep layers are directly fused and, thus, fail to obtain higher-quality segmentation results. This paper proposes FAM, which combines low-level and high-level features with different resolutions. FAM is beneficial, as it refines segmentation results and improves the segmentation performance of an object edge. The contributions of this work are threefold:
(1)
The paper proposes SPAM and SCAM to efficiently model the position non-local information and channel-wise dependency, which reduces redundant information, contributing to the intraclass consistency of large objects and the segmentation accuracy of small objects.
(2)
The paper introduces FAM, which can align feature maps with different resolutions and further improve segmentation results.
(3)
Extensive experimental results demonstrate that SAANet achieves leading performance on ISPRS Vaihingen, Potsdam, and LoveDA datasets.

2. Materials and Methods
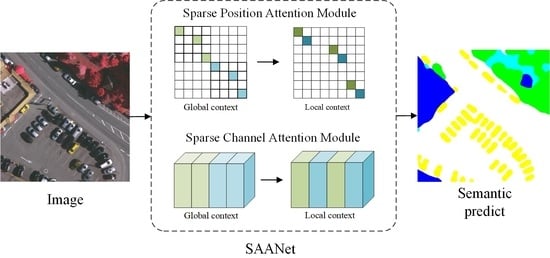
The particulars of the proposed semantic segmentation network based on sparse self-attention and feature alignment (SAANet) for semantic segmentation will be introduced. We first present the overall framework of our SAANet and then illustrate the details of the SPAM, SCAM, and FAM.

2.1. Overview

As shown in Figure 1, the proposed SAANet consists of a backbone, SPAM, SCAM, and FAM. Many studies have proved the good performance of a pretrained ResNet backbone in semantic segmentation tasks. First, the dilated ResNet-101 [30] is set as the backbone to extract features. The outputs of the dilated ResNet-101 in each stage are denoted as S 1 , S 2 , S 3 , S 4 . Due to the removal of down-sampling operations and adoption of dilated convolutions in the last two blocks, feature maps have strides of 4 , 8 , 8 , 8 pixels, with respect to the input image. Then, SPAM and SCAM take the feature map S 4 as input to model non-local dependencies in the position and channel dimensions. In addition, in order to achieve better feature representations, a feature pyramid network (FPN) [31] is used to combine low-level and high-level features and the outputs are denoted as F 1 , F 2 , F 3 , F 4 . Finally, feature maps F 2 , F 3 , and F 4 are up-sampled to the same size as feature map F 1 utilizing FAM. The four feature maps are concatenated to gain final pixel-level feature representations.

2.2. Sparse Position Self-Attention Module

Due to the complex scenes and rich details of HRSI, the implementation of a position self-attention module (PAM) on the whole image introduces redundant information and interferes with semantic segmentation. To capture long-range dependencies more efficiently and reduce redundant information, this paper proposes the SPAM, which is based on PAM.

2.2.1. Position Self-Attention Module

PAM is first introduced and shown in Figure 2. Given the feature map M, the features query (Q), key (K), and value (V) are first generated by convolutions, respectively, where Q , K , V R C × H × W . C, H, and W denote the number of channels of the feature, image height, and image width, respectively. Then, they are reshaped to Q p , K p , V p R C × N , where N = H × W is the number of pixels. Next, Q p is multiplied by the transpose of K p , and the softmax layer is applied to calculate the position attention map A p R N × N :
A p = softmax K p T Q p
where A p measures the influence between the two positions, and the more similar two pixel features are, the larger the value of A p is. Then, V p and the transpose of A p are multiplied, and the resulting product is reshaped to R C × H × W . Finally, to obtain the output N p R C × H × W , the feature map is multiplied by the scale coefficient α and sum with the feature map M.
N p = α V p A p T + M
where α is a learnable parameter, which is initialized to 0.

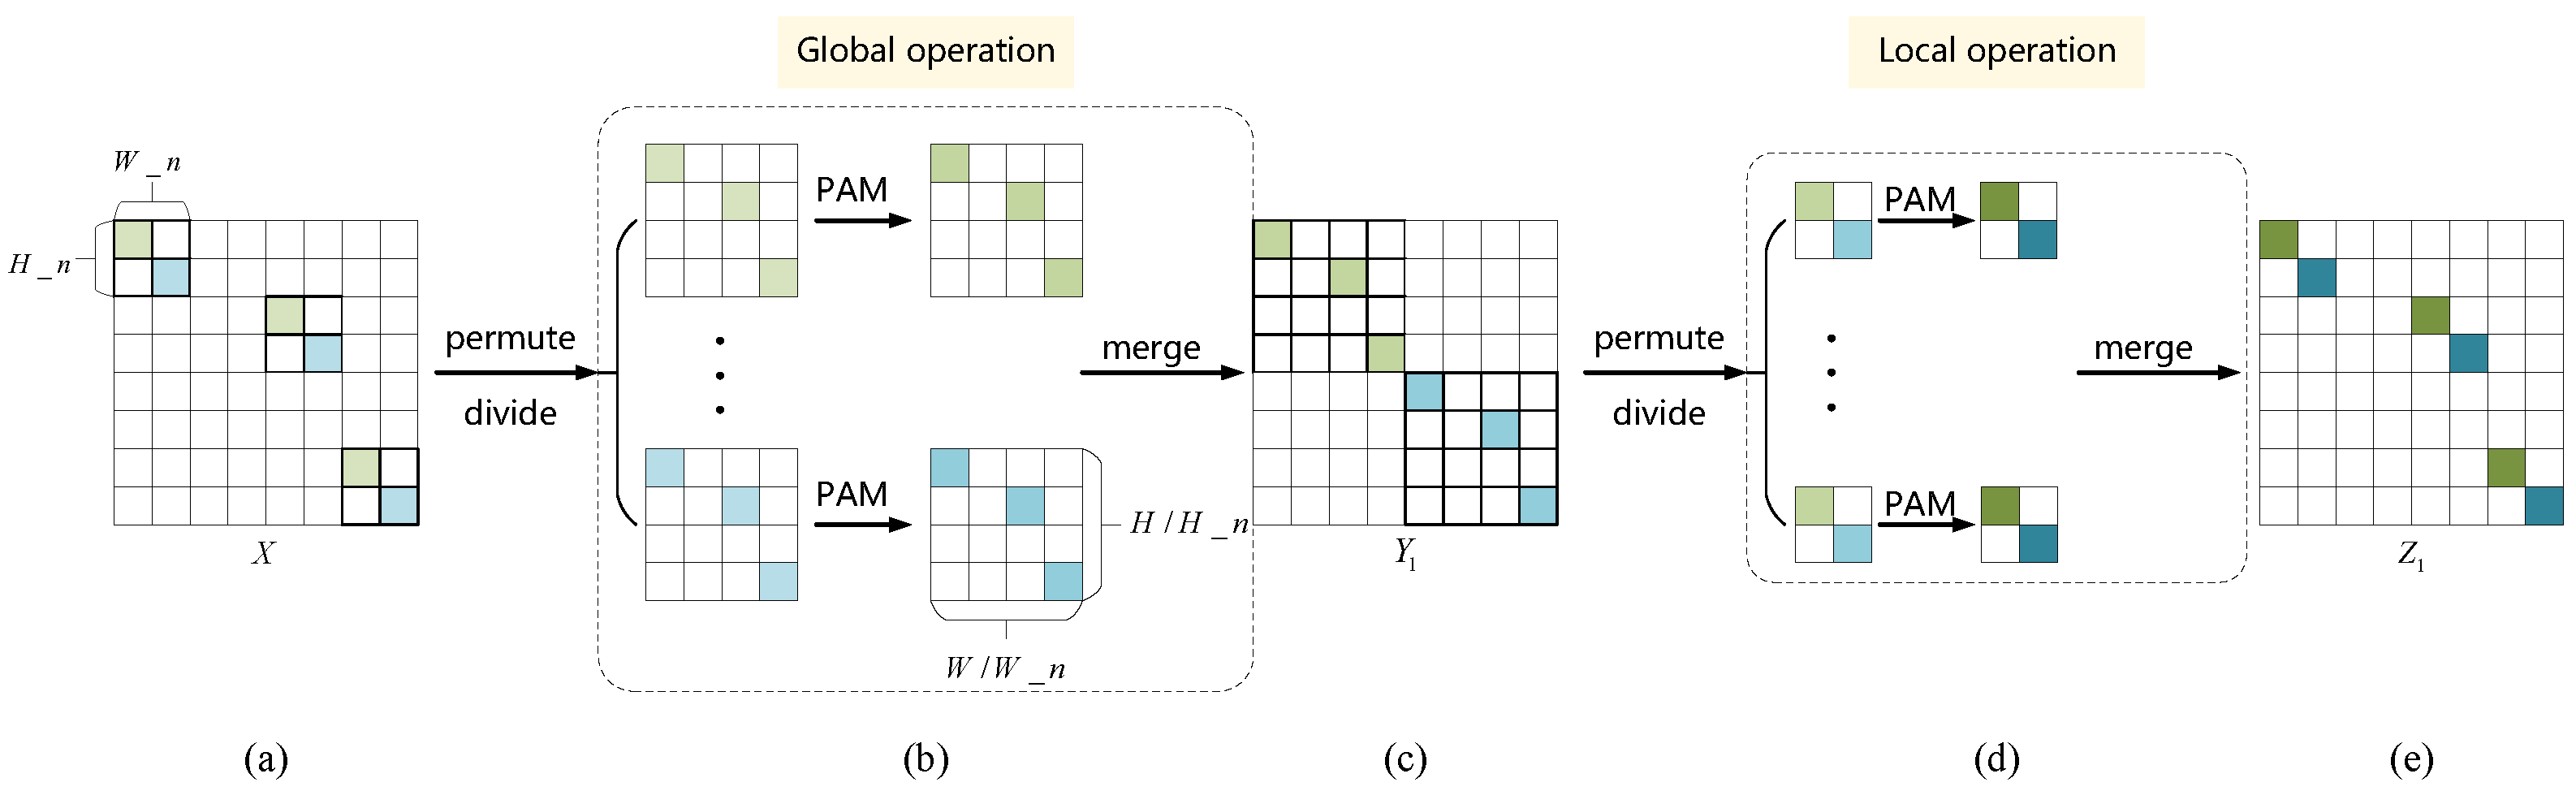
2.2.2. Sparse Position Self-Attention Module

The proposed SPAM is based on PAM. Instead of standard PAM operating on the entire image, SPAM implements the sparse mechanism by performing PAM operations on sub-regions. SPAM can not only capture global context information, but can also reduce redundant information. Specifically, we divide the inputs to small regions along the position dimension and perform PAMs in sub-regions. The details of SPAM are shown in Figure 3. Given a feature map X with the spatial size of H × W , the feature map X is grouped along the H and W dimensions and the spatial size of each group is H _ n × W _ n . The feature map X is divided into H / H _ n × W / W _ n groups, named X 1 , X 2 , X 3 . Figure 3 illustrates the details of SPAM by taking H , W = 8 and H _ n , W _ n = 2 as an example. Then, the pixels at the same relative positions in each group are reorganized into new regions. The number of new regions is H _ n × W _ n , and the pixels of each new region are H / H _ n × W / W _ n . Meanwhile, PAMs are operated in new regions, and the feature map Y 1 is obtained, which is then set as the global operation. Finally, the pixel position of the feature map Y 1 is restored to the original combination, and PAMs are carried on X 1 , X 2 , X 3 . The feature Z 1 is obtained. The input of SPAM is S 4 in our SAANet. SPAM efficiently captures the long-range context information and models the pixel-wise relationship. The information propagation process of SPAM is shown in Figure 4. Take regions R 1 , R 2 and pixels M, N, P, Q as examples to illustrate details of the information propagation. Specifically, pixel M in the region R 1 and pixel N in the region R 2 first operate PAM, while pixel P in the region R 1 and pixel Q in the region R 2 operate PAM. Then, the region R 1 and the region R 2 continue PAM, respectively. Finally, pixels M, N, P, and Q aggregate the local and global contextual information. The above operations complete the information propagation between regions R 1 and R 2 .

2.3. Sparse Channel Attention Module

Due to the complexity of HRSI, there are large intra-class differences and small inter-class differences. Therefore, operating a standard self-attention module (CAM) on all channels introduces redundant information and causes category confusion. To model interdependent information between channels more efficiently and suppress redundant information, this paper proposes SCAM, which is based on CAM.

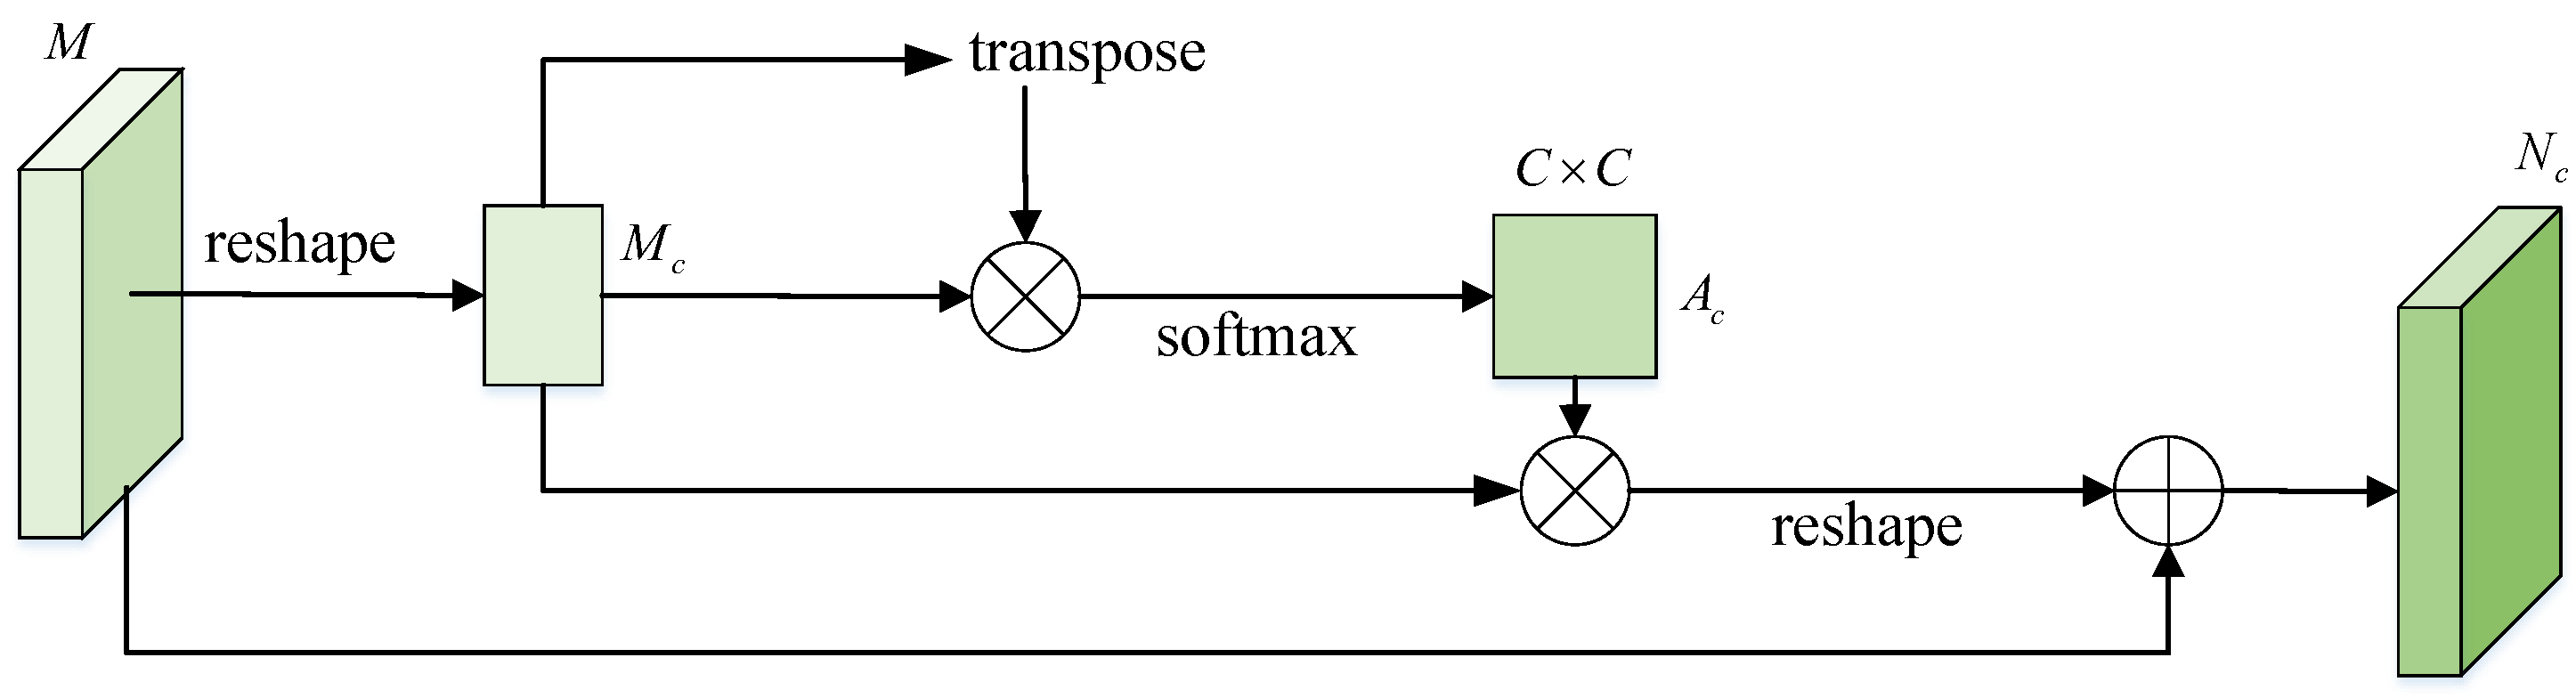
2.3.1. Channel Self-Attention Module

The architecture of CAM is shown in Figure 5. We first reshape the local feature map M R C × H × W to M c R C × H W . Then, the matrix multiplication between M c and the transpose of M c is performed for the softmax layer, and the attention feature map A c R C × C is obtained as follows:
A c = softmax M c M c T
where A c measures the influence of different channels. Then, M c is multiplied by the transpose of A c , and the multiplication is reshaped to R C × H × W . Finally, the product is multiplied by the scale coefficient β and added to the original feature M to obtain the final feature map N c R C × H × W , as follows:
N c = β A c T M c + M
where β is a learnable parameter and is initialized to 0.

2.3.2. Sparse Channel Self-Attention Module

The details of SCAM are shown in Figure 6. First, the feature map X is divided into C _ n groups C 1 , C 2 , C 3 in the channel dimension. The channel number of each group is C / C _ n . Figure 6 illustrates the details of SCAM, taking C _ n = 2 as an example. Then, the groups C 1 , C 2 , C 3 are further divided into C _ n sub-groups, named C 1 1 , C 1 2 , C 1 3 , C 2 1 , C 2 2 , C 2 3 , C 3 1 , C 3 2 , C 3 3 …. The channel number of each sub-group is C / C 2 _ n . Next, for each channel group, sub-groups in the same relative position (for instance, C 1 1 , C 2 1 , C 3 1 ) are taken out to rearrange and generate new channel groups C 1 1 , C 2 1 , C 3 1 , C 1 2 , C 2 2 , C 3 2 , C 1 3 , C 2 3 , C 3 3 …. The feature map Y 2 is obtained by operating CAMs in C / C _ n new groups. Finally, Y 2 is restored to the original channel arrangement, and Z 2 is acquired by performing CAMs in original groups C 1 , C 2 , C 3 .

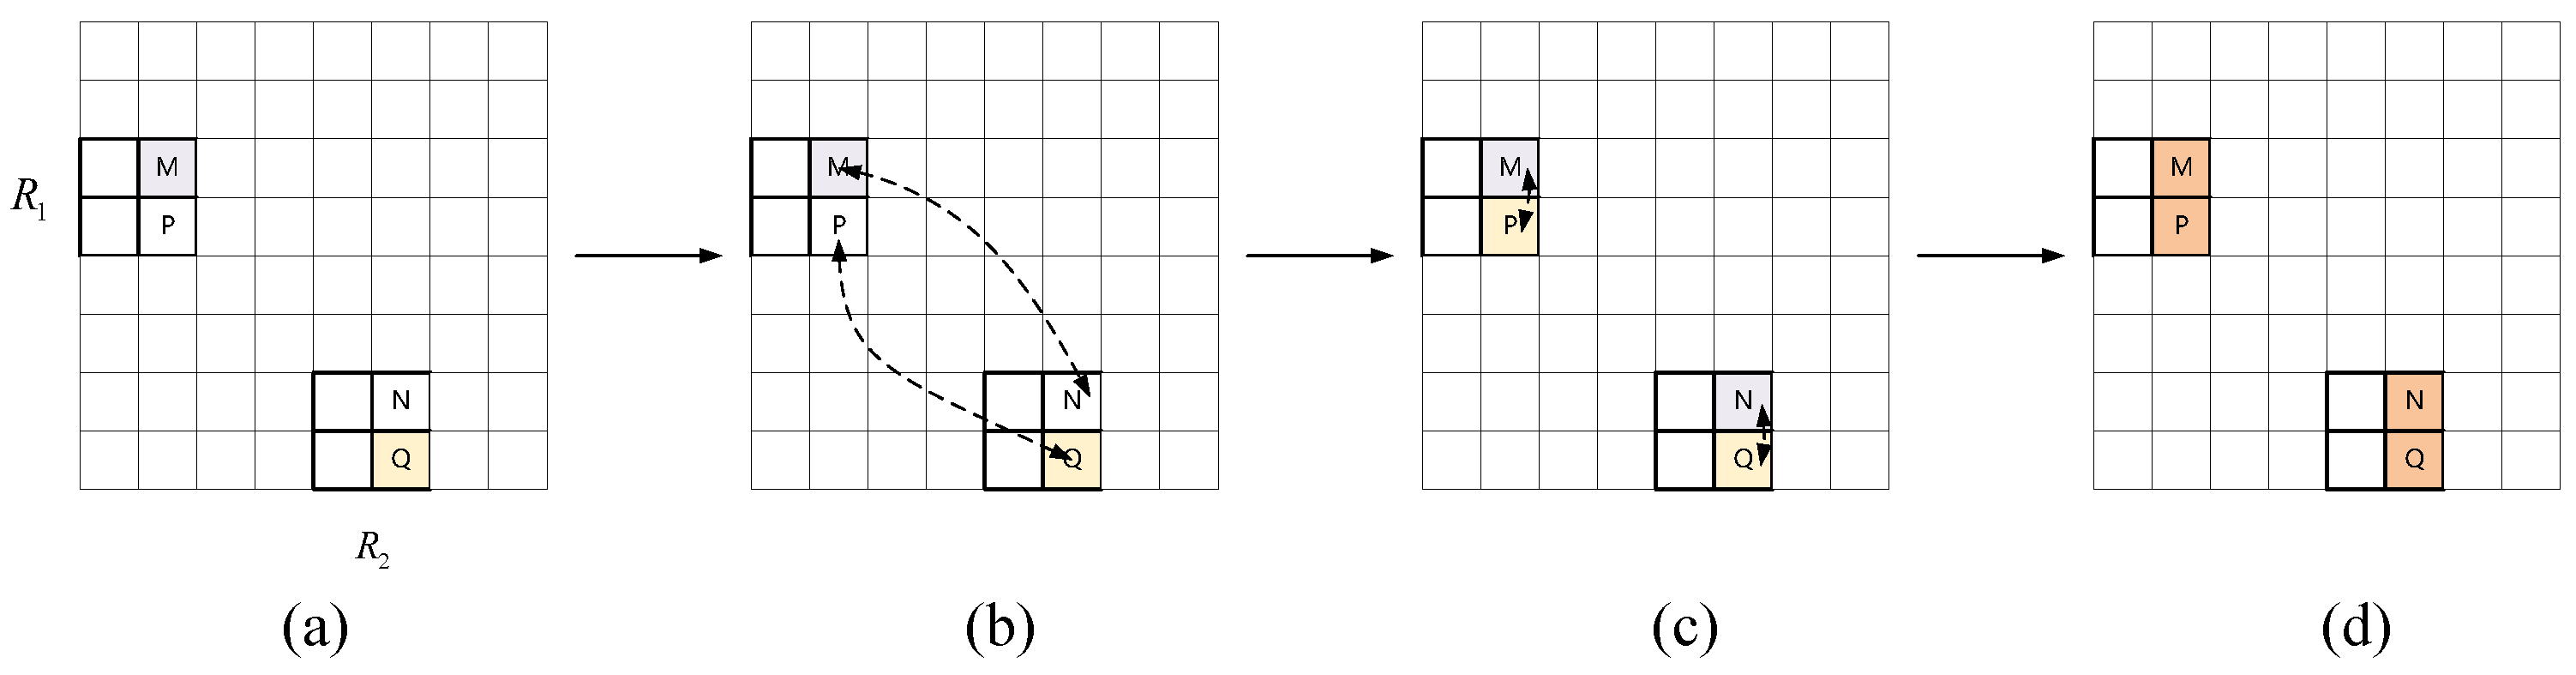
2.4. Feature Alignment Module

Several methods are proposed to refine semantic segmentation results. However, the misalignment of features is ignored. To align features with different resolutions and refine semantic segmentation representations, this paper proposes an FAM. Specifically, the feature map S 4 in Figure 1 from the last stage of ResNet fuses global context information and possesses enriched semantic information. However, the feature map S 4 with coarse resolution lacks fine details. The proposed SAANet uses an FPN to fuse different resolution features from different stages. The FPN gradually fuses lower-level features with the details and higher-level features with abundant semantic information in a top-down pathway via 2× bilinear upsampling. However, the feature maps with different resolution are misaligned, which causes confusion in edges and small object segmentation. The misalignment has a great influence on the accuracy of semantic segmentation, especially on HRSI with complex scenes. After a series of operations in SAANet, such as downsampling, residual connection, self-attention, etc., the misalignment of the feature maps is more complicated. In the upsampling process, using bilinear interpolation alone fails to achieve better semantic segmentation results. The proposed SAANet develops a feature alignment module, which utilize convolutions to obtain a learnable offset map for feature alignment.
The details of the FAM are shown in Figure 7. The FAM is structured within the FPN framework. The inputs of the FAM are two feature maps with different spatial resolutions. It is assumed that F l and F l 1 are the two input features of FAM, where F l R H l × W l × C and F l 1 R H l 1 × W l 1 × C . F l is first upsampled via the standard regular grid sampling based bilinear interpolation. Then, the upsampled F l and F l 1 are concatenated, and the feature map F is obtained. The feature F is passed through a 1 × 1 convolution, BN, and 3 × 3 convolution to predict an offset Δ f R H l 1 × W l 1 × 2 . Finally, the offset map is used to correct the upsampled F l , which obtains the output feature map aligned with F l 1 . Mathematically, the above operations can be written as:
F = c o n c a t ( F l 1 , u p s a m p l e ( F l ) )
Δ f = c o n v 3 × 3 ( B N ( c o n v 1 × 1 ( F ) ) )
where the u p s a m p l e denotes the bilinear interpolation function, and Δ f denotes offsets in horizontal and vertical directions. The FAM also involves less computation. SAANet uses three FAMs for the alignment of F 2 , F 3 , F 4 , and F 1 , respectively. FAM alleviates the feature misalignment and enhances the performance of semantic segmentation, especially for small objects and boundary regions.

3. Experiments

We first introduce the datasets, evaluation metrics, and implementation details and then conduct ablation studies to validate the effectiveness of our framework. Finally, we compare the proposed network with several state-of-the-art methods on ISPRS Vaihingen, Potsdam [32], and LoveDA Urban [33] datasets.

3.1. Datasets and Evaluation Metrics

ISPRS Vaihingen dataset: ISPRS Vaihingen is a high-resolution remote sensing dataset used for semantic segmentation, which is composed of 33 images. The ground sampling distance (GSD) is 9 cm, and the average size of the images is 2496 × 2046 pixels. All images have corresponding semantic segmentation labels. The training and testing sets contain 17 and 16 images, respectively. There are six categories: impervious surface, building, low vegetation, tree, car, and clutter/background.
ISPRS Potsdam dataset: ISPRS Potsdam contains 38 images. The GSD is 5 cm, and the size of each image is 6000 × 6000 pixels. All images have corresponding semantic segmentation labels. The number of images in the training and testing sets is 21 and 17, respectively. As with the Vaihingen dataset, there are six categories.
LoveDA Urban dataset: The LoveDA dataset is constructed by Wang et al. [33]. The historical images were obtained from the Google Earth platform. LoveDA Urban dataset was obtained from urban areas in Wuhan, Changzhou, Nanjing, and other places in China. The size of each image is 1024 × 1024 pixels, and the GSD is 0.3m. The dataset was divided into three parts: a training set, a val set, and a test set, among which the training set and val set have semantic labels. In our experiment, 1156 training images were used as our training set, and 677 val set images were used as our test set. There are seven categories: background, building, road, water, barren, forest, and agricultural.
Evaluation Metrics: To evaluate the performance of semantic segmentation, this study sets the mean intersection over union (mIoU), F1-score (F1), and overall pixel accuracy (OA) [34] as its evaluation metrics. The aforementioned metrics are as follows.
m I O U = 1 N k = 1 N T P k T P k + F P k + F N k
F 1 = 2 × P r e c i s i o n × R e c a l l P r e c i s i o n + R e c a l l , P r e c i s i o n = T P T P + F P , R e c a l l = T P T P + F N
O A = k = 1 N T P k k = 1 N T P k + F P k + T N k + F N k
where T P , F P , T N , F N , and k indicate the true positive, false positive, true negative, false negatives, and category, respectively.

3.2. Implementation Details

Due to limited computing resources, we cropped all images into 512 × 512 pixels. All experiments were implemented with PyTorch on a single NVIDIA GeForce RTX 2080Ti GPU, and the optimizer was set as standard the stochastic gradient descent (SGD). For different data sets, different learning rates were selected. The learning rates of the Vaihingen, Potsdam, and LoveDA Urban datasets were 0.001, 0.0008, and 0.0007, respectively. For all methods, cross-entropy loss is set as the loss function. For all datasets and networks, the maximum iteration period is 100 epochs.

3.3. Comparison to State-of-the-Art

To verify the superiority of our SAANet, we perform comparisons with several existing semantic segmentation methods, including self-attention-based and other general semantic segmentation networks. Aside from HRNet, whose backbone network is W48, other networks use the dilated ResNet-101 as the backbone. The experimental results on ISPRS Vaihingen, Potsdam, and LoveDA datasets are shown in Table 1, Table 2 and Table 3, respectively. The proposed SAANet achieves the best mIOU on ISPRS Vaihingen, Potsdam, and LoveDA Urban datasets.
Results on the Vaihingen dataset: Compared with the typical segmentation network FCN, our SSANet obtains 1.72%, 1.33%, and 0.76% improvement and achieves 68.50%, 80.22%, and 86.72% for mIOU, mF1, and OA, respectively. Moreover, the mIOU/F1/OA of our SAANet surpasses 0.92%/0.72%/0.37% by the network based on self-attention DANet. Thanks to SPAM, SCAM, and FAM, SSANet achieves more precise semantic segmentation results in all classes, especially on small objects. For example, SSANet outperforms the previous best one by 1.62% in the car category.
Results on the Potsdam dataset: Compared with a typical segmentation network based on self-attention CCNet, our SSANet obtains 1.20%, 1.02%, and 0.61% improvement and achieves 73.79%, 83.57%, and 88.22%, on mIOU, mF1, and OA, respectively. Moreover, the mIOU, mF1, and OA of our SAANet surpasses 1.07%/0.75%/0.76% by the typical network with multi-scale aggregation PSPNet. Meanwhile, SSANet achieves more precise semantic segmentation results in all classes, with the most significant improvement in the car category.
Results on the LoveDA Urban dataset: Compared with the ISPRS Vaihingen and Potsdam datasets, the LoveDA Urban dataset with lower GSD has more complex scenes, which makes semantic segmentation more challenging. Nevertheless, our SAANet still achieves the best mIOU, mF1, and OA. Particularly, for more challenging classes, the background class with greater intra-class variation, and the agricultural class with a small number of pixels, the proposed SAANet achieves the highest IOU. Specifically, compared with typical segmentation network FCN, our SSANet obtains 4.98%, 5.64%, and 7.07% improvement and achieves 50.01%, 66.03%, and 65.45% for mIOU, mF1, and OA, respectively. Moreover, the mIOU/F1/OA of our SAANet surpasses 2.10%/2.11%/3.83% for the network based on the self-attention CCNet.
Overall, our method achieves state-of-the-art semantic segmentation performance on the ISPRS Vaihingen, Potsdam, and LoveDA datasets. To qualitatively validate the effectiveness, several visualization results are shown in Figure 8 and Figure 9. It is observed that the overall visual effect of our method outperforms other methods. Specifically, for large objects, our method contributes to the intra-class consistency. In the first group in Figure 8, for large buildings, other methods incorrectly predict that several pixels representing buildings are low vegetation or tree class. In the first group in Figure 9, other methods incorrectly predict pixels inside impervious surfaces. On the contrary, our SAANet can maintain category consistency. Additionally, for small objects, our method achieves more refined semantic segmentation results. For example, in the second group in Figure 8 and Figure 9, several pixels representing cars are incorrectly predicted or have rough edges in the visual results of other methods. However, our SAANet obtains more accurate pixel classification and more precise edges. This suggests that our SAANet can obtain superior semantic segmentation performance and visual effects.

3.4. Evaluation in Efficiency

We not only evaluate the segmentation accuracy and visualization results of different methods, but also measure the computational complexity and model parameters, in terms of giga floating-point operations per second (GFLOPs) (G) and the number of parameters with millions (Params) (M). All models are calculated with an input image size of 512 × 512 × 3 . The results are shown in Table 4. HRNet uses HRNetv2_W48 as the backbone network and has the lowest computational complexity. The backbone network of other methods is ResNet-101 with dilated convolution strategy. Compared with the self-attention-based networks DANet and CCNet, our method only increases the computational complexity by about 1.76% and the number of parameters by 0.6% to obtain better segmentation accuracy. Although our SAANet achieves better performance, it has a more complex structure and provides a small amount of computational complexity and parameters. We will focus on balancing the relationship between accuracy and complexity in future work.

4. Discussions

Previous work has focused on the fact that contextual information is important for semantic segmentation. PSPNet [8] uses the pooling operation of a pyramid structure to model the context information of different scales. Deeplabv3+ [11] combines the pyramid structure with the dilated convolution to capture the context information. In addition, several works [13,14,15,16,17] have proved that the self-attention mechanism is an effective way to model global context information. The self-attention mechanism captures context information through a sequence of matrix operations, which improves the accuracy of semantic segmentation. However, HRSI have complex scenes and rich details. The implementation of standard self-attention will introduce excessive redundant information and interfere with semantic segmentation. In this paper, SPAM and SCAM are proposed to model local and global context information, while avoiding the introduction of redundant information. In addition, FAM is proposed to improve the segmentation accuracy of edge regions and refine the semantic segmentation results. To better discuss and validate the effectiveness of each module of our SAANet, extensive ablation studies are conducted on the ISPRS Vaihingen and Potsdam datasets.

4.1. Sparse Position and Channel Attention Module

Both local and global context information is indispensable for the semantic segmentation task. In general, a larger receptive field can fuse a wider range of information, which is conducive to obtaining better feature representation. The standard self-attention operation is equivalent to fusing the information of each pixel of the image indistinguishably, which models long-range context information. The proposed SPAM and SCAM can capture local context information, as well as model long-range context information, and does so both sparsely and efficiently. To acquire a balance between local and global context, different H _ n , W _ n in SPAM and C _ n in SCAM are set. Extensive experiments are conducted on the ISPRS Vaihingen and Potsdam datasets, and the results are shown in Table 5.
The pretrained ResNet-101 with the dilated strategy is adopted to initialize the backbone. The output of the last stage of ResNet-101 is used for semantic segmentation. Baseline based on ResNet101 obtains an mIOU of 65.19%, an mF1 of 77.32%, an OA of 85.60% on the ISPRS Vaihingen dataset. Baseline obtains an mIOU of 72.03%, an mF1 of 82.04%, an OA of 87.43% on the ISPRS Potsdam dataset. Compared with other H _ n , W _ n in SPAM and C _ n in SCAM, SPAM with H _ n , W _ n = 4 and SCAM with C _ n = 2 achieves the best mIOU of 68.19% on the Vaihingen dataset and mIOU of 73.65% on the Potsdam dataset. The larger H _ n and W _ n are, the wider the region of capturing local information in the spatial dimension is, which will introduce more redundant information. Each channel map of high-level features is related to the category. By dividing channels into more groups (i.e., the larger C _ n is), several channels with strong associations may be dispersed and rearranged, which is adverse to obtaining a better feature representation of each class. Therefore, H _ n , W _ n , and C _ n are set as 4, 4, and 2, respectively, in follow-up experiments.
Sparse Position Attention Module: In order to efficiently model spatial long-range context information, SPAM is introduced to enhance the output of the backbone. The results are shown in Table 6. Compared with the baseline, SPAM provides an mIOU of 0.54% and 1.15% improvement and achieves an mIOU of 65.73% and 73.18%, an mF1 of 78.06% and 83.12%, and an OA of 85.61% and 87.88%, respectively, on the Vaigingen and Potsdam datasets. It is obvious that SPAM can effectively capture global context information and achieves a better segmentation performance.
Sparse Channel Attention Module: In order to efficiently capture the interdependencies between channels, SCAM is introduced to enhance the output of the backbone. The results are shown in Table 6. Compared with the baseline, SCAM provides mIOU of 0.19% and 0.77% improvement and achieves an mIOU of 65.38% and 72.80%, an mF1 of 77.41% and 82.80%, and an OA of 85.85% and 87.73%, respectively, on the Vaigingen and Potsdam datasets. SCAM is of great significance when it comes to modeling the dependencies between channels.
We integrate SPAM and SCAM into the baseline to generate a network. Compared with the baseline, the SPAM models long-range context information, and SCAM efficiently captures the interdependencies between channels. SPAM and SCAM provide an mIOU of 3%, an mF1 of 2.67%, and an OA of 1.04% improvement and obtain an mIOU of 68.19%, an F1 of 79.99%, and an OA of 86.64% on the Vaihingen dataset. Additionally, SPAM and SCAM provide an mIOU of 1.62%, an mF1 of 1.45%, and an OA of 0.66% improvement and obtain an mIOU of 73.65%, an F1 of 83.49%, and an OA of 88.09% on the Potsdam dataset. Extensive experiments demonstrate that SPAM and SCAM enhance the semantic segmentation performance of HRSI.

4.2. Feature Alignment Module

We compare the segmentation results of the method with SPAM and SCAM with labels. Several results are shown in Figure 10, demonstrating that most of the regions with inaccurate segmentation are boundary regions. In this paper, the FPN structure is used to integrate the high-level features with semantic information and the low-level features with detail information to obtain a finer semantic segmentation result. However, feature maps with different resolutions are misaligned. Utilizing the FPN structure to fuse features from shadow layers and deep layers fails to obtain better results. Therefore, it is vital that the FAM aligns and fuses features with different resolutions. The results are shown in Table 6. The network with the FPN obtains an mIoU of 66.82%, an mF1 of 78.88%, and an OA of 86.11% on the Vaigingen dataset. The network with FAM achieves the best mIoU of 68.5%, mF1 of 80.22%, and OA of 86.72%. Meanwhile, the network with FAM achieves the best mIoU of 73.79%, an mF1 of 83.57%, and an OA of 88.22% on the Potsdam dataset. The results prove that feature alignment is essential and the proposed FAM is effective. Additionally, FAM is beneficial, as it refines the boundaries. To prove the effectiveness of FAM for boundary regions, the mIOU, mF1, and OA are calculated on the edge region. Since there is no standard edge region, a neighborhood in which different classes are connected is selected as the edge region in this paper. Specifically, we first extract the boundary of different objects in the label and then perform the dilation operation in morphology operations to obtain the edge region. Note that the pixels closer to the object boundary are more likely to be confused, and the pixels closer to the object interior are more likely to be classified. As the dilation kernel increases, the edge region expands and the pixels grow closer to the interior of the object. The mIOU, mF1, and OA in a larger area cannot fully highlight the improvement in the edge region. Therefore, in this paper, a kernel of 3 × 3 is selected for the dilation operation to obtain the edge region. The results are shown in Table 7. The network without FAM obtains an mIoU of 35.68%, an mF1 of 51.88%, and an OA of 55.19% on the Vaigingen dataset. FAM provides an mIOU of 1.04%, an mF1 of 0.84%, and an OA of 0.23% improvement. Meanwhile, the method without FAM obtains an mIoU of 38.32%, an mF1 of 54.34%, and an OA of 56.48% on the Potsdam dataset. The method with FAM obtains an mIoU of 38.81%, an mF1 of 54.82%, and an OA of 56.90%. The results demonstrate that FAM refines the edge regions of semantic segmentation results and further explains the necessity and effectiveness of feature alignment.
In general, the experiments and visual results illustrate that SPAM, SCAM, and FAM achieve better semantic segmentation results. As shown in Table 1, Table 2 and Table 3, the proposed method achieves optimal OA, mF1, and mIOU on the ISPRS Vaihingen, Potsdam, and LoveDA Urban datasets. Specifically, the accuracy of small object cars is significantly improved. Additionally, as shown in Figure 8 and Figure 9, other networks incorrectly the predicted pixels inside large objects, such as impervious surfaces and buildings. For small objects, such as cars, incorrect pixel classifications occur, as well as inaccurate edges. In contrast, our SAANet can maintain intra-class consistency for large objects and accuracy for small objects. Meanwhile, the experimental results show that global context information enhancement on HRSI with complex backgrounds introduces redundant information. The researchers further explore more adaptive global context information fusion methods to suppress redundant information as much as possible.

5. Conclusions

In this paper, we present a network based on sparse self-attention and feature alignment for semantic segmentation of HRSI. Specifically, SPAM is developed to capture long-range context information. SCAM is adopted to model interdependencies between channels more efficiently, while FAM is introduced to align features with different resolutions and refine semantic segmentation results. Moreover, extensive ablation experiments demonstrate the effectiveness of our method on the ISPRS Vaihingen and Potsdam datasets. Comparative experiments on the ISPRS Vaihingen, Potsdam, and LoveDA Urban datasets demonstrate that our SAANet obtains finer semantic segmentation results and achieves outstanding performance. Although our SAANet enhances the context information and details, there are still problems in the field of semantic segmentation of HRSI, such as large intra-class differences and small inter-class differences. For example, trees and low vegetation in the Vaihingen and Potsdam datasets are easily confused. In subsequent research, we will use comparative learning in the semantic segmentation of HRSI to obtain better feature embedding space and more easily distinguished feature representation.

Author Contributions

H.Z. determined the research direction and revised the expression of the article; L.S. came up with innovative ideas, developed the SAANet, conducted experiments, and completed the manuscript. J.W. helped to modify the conception and provided suggestions for expression. X.C., S.H., M.L. and S.L. checked out the article’s writing. All authors have read and agreed to the published version of the manuscript.

Funding

This work was supported by the Natural Science Foundation of China under grant 62071474.

Data Availability Statement

Not applicable.

Conflicts of Interest

The authors declare no conflict of interest.

References

  1. Tokarczyk, P.; Wegner, J.D.; Walk, S.; Schindler, K. Features, Color Spaces, and Boosting: New Insights on Semantic Classification of Remote Sensing Images. IEEE Trans. Geosci. Remote Sens. 2014, 53, 280–295. [Google Scholar] [CrossRef]
  2. Tang, Y.; Zhang, L. Urban change analysis with multi-sensor multispectral imagery. Remote Sens. 2017, 9, 252. [Google Scholar] [CrossRef] [Green Version]
  3. Wu, L.; Lu, M.; Fang, L. Deep Covariance Alignment for Domain Adaptive Remote Sensing Image Segmentation. IEEE Trans. Geosci. Remote Sens. 2022, 60, 1–11. [Google Scholar] [CrossRef]
  4. Liu, M.Y.; Tuzel, O.; Ramalingam, S.; Chellappa, R. Entropy rate superpixel segmentation. In Proceedings of the The 24th IEEE Conference on Computer Vision and Pattern Recognition, CVPR 2011, Colorado Springs, CO, USA, 20–25 June 2011. [Google Scholar]
  5. Radman, A.; Zainal, N.; Suandi, S.A. Automated segmentation of iris images acquired in an unconstrained environment using HOG-SVM and GrowCut. Digit. Signal Process. 2017, 64, 60–70. [Google Scholar] [CrossRef]
  6. Thanh Noi, P.; Kappas, M. Comparison of random forest, k-nearest neighbor, and support vector machine classifiers for land cover classification using Sentinel-2 imagery. Sensors 2017, 18, 18. [Google Scholar] [CrossRef] [PubMed] [Green Version]
  7. Krizhevsky, A.; Sutskever, I.; Hinton, G.E. Imagenet classification with deep convolutional neural networks. Commun. ACM 2017, 60, 84–90. [Google Scholar] [CrossRef] [Green Version]
  8. Zhao, H.; Shi, J.; Qi, X.; Wang, X.; Jia, J. Pyramid Scene Parsing Network. In Proceedings of the IEEE Computer Society, Las Vegas, NV, USA, 26 June–1 July 2016. [Google Scholar]
  9. Chen, L.-C.; Papandreou, G.; Kokkinos, I.; Murphy, K.; Yuille, A.L. Deeplab: Semantic image segmentation with deep convolutional nets, atrous convolution, and fully connected crfs. IEEE Trans. Pattern Anal. Mach. Intell. 2017, 40, 834–848. [Google Scholar] [CrossRef] [PubMed] [Green Version]
  10. Chen, L.C.; Papandreou, G.; Schroff, F.; Adam, H. Rethinking atrous convolution for semantic image segmentation. arXiv 2017, arXiv:1706.05587. [Google Scholar]
  11. Chen, L.C.; Zhu, Y.; Papandreou, G.; Schroff, F.; Adam, H. Encoder-decoder with atrous separable convolution for semantic image segmentation. In Proceedings of the European Conference on Computer Vision (ECCV), Munich, Germany, 8–14 September 2018; pp. 801–818. [Google Scholar]
  12. Peng, C.; Zhang, X.; Yu, G.; Luo, G.; Sun, J. Large kernel matters–improve semantic segmentation by global convolutional network. In Proceedings of the IEEE Conference on Computer Vision and Pattern Recognition, Honolulu, HI, USA, 21–26 July 2017; pp. 4353–4361. [Google Scholar]
  13. Wang, X.; Girshick, R.; Gupta, A.; He, K. Non-local neural networks. In Proceedings of the IEEE conference on computer vision and pattern recognition, Salt Lake City, UT, USA, 21–26 June 2018; pp. 7794–7803. [Google Scholar]
  14. Fu, J.; Liu, J.; Tian, H.; Li, Y.; Bao, Y.; Fang, Z.; Lu, H. Dual Attention Network for Scene Segmentation. In Proceedings of the 2019 IEEE/CVF Conference on Computer Vision and Pattern Recognition (CVPR), Long Beach, CA, USA, 15–20 June 2019. [Google Scholar]
  15. Li, X.; Zhong, Z.; Wu, J.; Yang, Y.; Lin, Z.; Liu, H. Expectation-maximization attention networks for semantic segmentation. In Proceedings of the IEEE/CVF International Conference on Computer Vision, Seoul, Republic of Korea, 27–28 October 2019; pp. 9167–9176. [Google Scholar]
  16. Huang, Z.; Wang, X.; Huang, L.; Huang, C.; Wei, Y.; Liu, W. Ccnet: Criss-cross attention for semantic segmentation. In Proceedings of the IEEE/CVF international conference on computer vision, Seoul, Republic of Korea, 27 October–2 November 2019; pp. 603–612. [Google Scholar]
  17. Yuan, Y.; Huang, L.; Guo, J.; Zhang, C.; Chen, X.; Wang, J. OCNet: Object context for semantic segmentation. Int. J. Comput. Vis. 2021, 129, 2375–2398. [Google Scholar] [CrossRef]
  18. Shi, H.; Fan, J.; Wang, Y.; Chen, L. Dual attention feature fusion and adaptive context for accurate segmentation of very high-resolution remote sensing images. Remote Sens. 2021, 13, 3715. [Google Scholar] [CrossRef]
  19. Li, R.; Zheng, S.; Zhang, C.; Duan, C.; Su, J.; Wang, L.; Atkinson, P.M. Multiattention network for semantic segmentation of fine-resolution remote sensing images. IEEE Trans. Geosci. Remote Sens. 2021, 60, 1–13. [Google Scholar] [CrossRef]
  20. Long, J.; Shelhamer, E.; Darrell, T. Fully convolutional networks for semantic segmentation. In Proceedings of the IEEE Conference on Computer Vision and Pattern Recognition, Boston, MA, USA, 7–12 June 2015; pp. 3431–3440. [Google Scholar]
  21. Badrinarayanan, V.; Kendall, A.; Cipolla, R. Segnet: A deep convolutional encoder-decoder architecture for image segmentation. IEEE Trans. Pattern Anal. Mach. Intell. 2017, 39, 2481–2495. [Google Scholar] [CrossRef] [PubMed]
  22. Ronneberger, O.; Fischer, P.; Brox, T. U-Net: Convolutional Networks for Biomedical Image Segmentation; Springer: Munich, Germany, 2015. [Google Scholar]
  23. Lin, G.; Milan, A.; Shen, C.; Reid, I. Refinenet: Multi-path refinement networks for high-resolution semantic segmentation. In Proceedings of the IEEE Conference on Computer Vision and Pattern Recognition, Honolulu, HI, USA, 21–26 July 2017; pp. 1925–1934. [Google Scholar]
  24. Sun, K.; Zhao, Y.; Jiang, B.; Cheng, T.; Wang, J. High-Resolution Representations for Labeling Pixels and Regions. arXiv 2019, arXiv:1904.04514. [Google Scholar]
  25. Takikawa, T.; Acuna, D.; Jampani, V.; Fidler, S. Gated-scnn: Gated shape cnns for semantic segmentation. In Proceedings of the IEEE/CVF International Conference on Computer Vision, Seoul, Republic of Korea, 27–28 October 2019; pp. 5229–5238. [Google Scholar]
  26. Yuan, Y.; Xie, J.; Chen, X.; Wang, J. Segfix: Model-agnostic boundary refinement for segmentation. In Proceedings of the European Conference on Computer Vision, Glasgow, UK, 23–28 August 2020; pp. 489–506. [Google Scholar]
  27. Liu, S.; Ding, W.; Liu, C.; Liu, Y.; Wang, Y.; Li, H. ERN: Edge loss reinforced semantic segmentation network for remote sensing images. Remote Sens. 2018, 10, 1339. [Google Scholar] [CrossRef] [Green Version]
  28. Zheng, X.; Huan, L.; Xia, G.S.; Gong, J. Parsing very high resolution urban scene images by learning deep ConvNets with edge-aware loss. ISPRS J. Photogramm. Remote Sens. 2020, 170, 15–28. [Google Scholar] [CrossRef]
  29. Li, X.; Li, T.; Chen, Z.; Zhang, K.; Xia, R. Attentively learning edge distributions for semantic segmentation of remote sensing imagery. Remote Sens. 2021, 14, 102. [Google Scholar] [CrossRef]
  30. He, K.; Zhang, X.; Ren, S.; Sun, J. Deep residual learning for image recognition. In Proceedings of the IEEE Conference on Computer Vision and Pattern Recognition, Las Vegas, NV, USA, 26 June–1 July 2016; pp. 770–778. [Google Scholar]
  31. Lin, T.Y.; Dollár, P.; Girshick, R.; He, K.; Hariharan, B.; Belongie, S. Feature pyramid networks for object detection. In Proceedings of the IEEE Conference on Computer Vision and Pattern Recognition, Honolulu, HI, USA, 21–26 July 2017; pp. 2117–2125. [Google Scholar]
  32. Available online: https://www2.isprs.org/commissions/comm2/wg4/benchmark/2d-sem-label-vaihingen/ (accessed on 1 March 2021).
  33. Wang, J.; Zheng, Z.; Ma, A.; Lu, X.; Zhong, Y. LoveDA: A remote sensing land-cover dataset for domain adaptive semantic segmentation. arXiv 2021, arXiv:2110.08733. [Google Scholar]
  34. Zhao, Q.; Liu, J.; Li, Y.; Zhang, H. Semantic Segmentation with Attention Mechanism for Remote Sensing Images. IEEE Trans. Geosci. Remote Sens. 2021, 60, 1–13. [Google Scholar] [CrossRef]
Figure 1. An overview of our proposed semantic segmentation network based on sparse self-attention and feature alignment (SAANet). H and W represent the height and width of the input image, respectively.
Remotesensing 15 01598 g001
Figure 2. The framework of the position self-attention module (PAM).
Remotesensing 15 01598 g002
Figure 3. The structure of the proposed sparse position self-attention module (SPAM). (a) The input image is divided along position dimension. (b) PAMs are performed in rearranged small regions. (c) The pixel position of the feature map is restored to the original combination. (d) PAMs are performed in restored sub-regions. (e) The output of SPAM is obtained.
Remotesensing 15 01598 g003
Figure 4. The information propagation process of the proposed SPAM. (a) M and P are the two pixels in region R 1 ; and N and Q are the two pixels in region R 2 . (b) During the first PAM operation, the information is transmitted between M and N and between P and Q, respectively. (c) During the second PAM operation, the information is transmitted between M and P and between N and Q, respectively. (d) M, N, P, and Q contain global and local information.
Remotesensing 15 01598 g004
Figure 5. The architecture of the channel self-attention module (CAM).
Remotesensing 15 01598 g005
Figure 6. The structure of the proposed sparse channel self-attention module (SCAM). (a) The input image is divide along the channel dimension. (b) CAMs are performed in rearranged sub-channels. (c) The channels of the feature map are resorted to the original combination. (d) CAMs are performed in resorted sub-channels. (e) The output of SCAM is obtained.
Remotesensing 15 01598 g006
Figure 7. The framework of the proposed feature alignment module (FAM).
Remotesensing 15 01598 g007
Figure 8. Visual results achieved by different networks on ISPRS Vaihingen dataset. For the first group, other methods incorrectly predict that several pixels representing buildings are low vegetation or tree class. For the second group, several pixels representing cars have rough edges. However, our SAANet can maintain category consistency and obtain more precise edges.
Remotesensing 15 01598 g008
Figure 9. Visual results achieved by different networks on ISPRS Potsdam dataset. For the first group, other methods incorrectly predict pixels inside impervious surfaces. For the second group, several pixels representing cars are incorrectly predicted. However, our SAANet can maintain category consistency and obtain more accurate pixel classification.
Remotesensing 15 01598 g009
Figure 10. Visualization results of the difference between predictions and labels. (ac) from the test set of the Vaihingen dataset. Note that most of the regions with inaccurate segmentation are boundary regions.
Remotesensing 15 01598 g010
Table 1. Comparisons of different networks on ISPRS Vaihingen dataset. Note that we chose the IOU as the metric of each category. The best results are shown in boldface.
MethodImp. Surf.BuildingLow Veg.TreeCarBackgroundmIOUmF1OA
DeepLabv3+77.1585.4061.2274.5457.4626.4463.7075.9085.30
HRNet79.1285.7862.4675.6960.4625.8764.9076.7086.10
EMANet77.8385.7362.6175.3760.9532.1865.7877.8785.88
PSPNet77.9485.7762.9075.6560.4034.5966.2178.3485.97
CCNet77.7385.6462.3575.4261.6136.2266.5078.6685.83
FCN77.9985.8262.8475.3961.8636.7666.7878.8985.96
DANet78.4886.6763.1975.7463.7337.6767.5879.5086.35
SAANet79.0087.5263.7976.1665.3539.2168.5080.2286.72
Table 2. Comparisons of different networks on ISPRS Potsdam dataset. Note that we choose the IOU as the metric of each category. The best results are shown in boldface.
MethodImp. Surf.BuildingLow Veg.TreeCarBackgroundmIOUmF1OA
DeepLabv3+81.8790.3271.7573.5883.1234.1972.4782.5087.45
CCNet82.4390.6471.7273.3183.4733.9772.5982.5587.61
PSPNet81.6489.9671.4374.4582.6136.2172.7282.8287.46
HRNet82.6589.9972.1774.1683.5835.0672.9482.8787.76
DANet82.8090.9472.2374.4283.7033.8772.9982.8087.96
FCN82.3090.6671.6274.3783.5536.0373.0983.0387.73
EMANet82.5490.4971.9273.7383.3137.1673.1983.1887.77
SAANet83.4090.7872.4674.5384.1237.4673.7983.5788.22
Table 3. Comparisons of different networks on LoveDA Urban dataset. Note that we choose the IOU as the metric of each category. The best results are shown in boldface.
MethodBackgroundBuildingRoadWaterBarrenForestAgriculturalmIOUmF1OA
DeepLabv3+35.3159.7356.2354.9519.4542.0531.1742.7058.4657.99
FCN34.1359.6054.9968.4226.9147.9023.2745.0360.3958.38
HRNet37.9660.0359.8368.3325.0744.6330.5946.6362.1160.87
PSPNet38.7258.8053.0060.3023.1844.3648.1346.6462.6463.41
DANet38.6762.0458.9366.5223.2643.9234.3746.8262.3361.54
CCNet38.8360.3156.0463.8939.7446.9629.6147.9163.9261.62
EMANet40.4660.0258.1864.5530.3647.7446.2249.6565.5865.19
SAANet42.0961.2557.2663.6433.1444.3248.3850.0166.0365.45
Table 4. Comparison with other networks on GFLOPs and Params. The best results are shown in boldface.
MethodGFLOPs (G)Params (M)
DeepLabv3+254.5660.21
HRNet93.7365.85
EMANet246.6358.71
PSPNet256.6365.60
CCNet278.5766.45
FCN275.8866.12
DANet277.2666.45
SAANet283.4666.85
Table 5. Comparisons of different H _ n , W _ n , and C _ n on ISPRS Vaihingen and Potsdam datasets. The best results are shown in boldface.
DatasetH_nW_nC_nmIOUmF1OA
Vaihingen///65.1977.3285.60
44268.1979.9986.64
44467.8279.6786.47
88267.7379.7186.24
88467.8279.7586.40
1616267.6779.5286.42
1616468.0479.7586.40
Potsdam///72.0382.0487.43
44273.6583.4988.09
44473.3883.2887.96
88273.4483.2288.15
88473.1183.0487.89
1616273.5483.4587.98
1616472.5782.3987.89
Table 6. Comparisons of different versions of our network on ISPRS Vaihingen and Potsdam datasets. The best results are shown in boldface.
DatasetSPAMSCAMFPNFAMmIOUmF1OA
Vaihingen 65.1977.3285.6
65.7378.0685.61
65.3877.4185.85
68.1979.9986.64
66.8278.8886.11
68.50 80.2286.72
Potsdam 72.0382.0487.43
73.1883.1287.88
72.8082.8087.73
73.6583.4988.09
73.6383.4588.07
73.7983.5788.22
Table 7. Quantitative results achieved by different variants of our network on boundaries. The best results are shown in boldface.
DatasetMethodmIOUF1OA
Vaihingenbaseline + SPAM + SCAM35.6851.8855.19
baseline + SPAM + SCAM + FAM36.5252.9255.42
Potsdambaseline + SPAM + SCAM38.3254.3456.48
baseline + SPAM + SCAM + FAM38.8154.8256.90
Disclaimer/Publisher’s Note: The statements, opinions and data contained in all publications are solely those of the individual author(s) and contributor(s) and not of MDPI and/or the editor(s). MDPI and/or the editor(s) disclaim responsibility for any injury to people or property resulting from any ideas, methods, instructions or products referred to in the content.

