Abstract
The coal industry is the largest global emitter of carbon dioxide (CO2). However, recent data suggests that coal mine methane (CH4) emissions worldwide are higher than those of the oil and gas industry. Furthermore, the coal industry is less active in reducing methane emissions than the oil and gas sectors due to lower profitability. Although uncertainties remain in quantifying methane emissions from mines, the use of satellite observations is revolutionizing the process of monitoring and improving the accuracy of emission accounting. The methodology presented here allows us to determine background CH4 concentrations and improve our ability to detect emission events using Sentinel-5P data. Knowing the background concentrations for the area of interest provides us the opportunity to track seasonal and annual variations and trends, as well as quickly detect periodic or accidental emissions from unregulated sources, etc. The methodology and systematic research applied in this paper for the period of May 2018 to the end of 2022 enables us to detect hundreds of large-scale emissions of CH4, NO2, and CO from the coal mines in the Kuznetsk Basin (the Kemerovo region), the largest coal mining area in Russia. We estimated that the amount of these emissions is significantly higher than the emissions reported by various authors for other coal mining regions such as Poland and Australia. We found that in cases of high methane quantity there is a positive correlation between NO2 and CO emissions in time and location. The source of emissions in the study area is homogeneous, which allows it to be used as a benchmark for building models to estimate and track emissions in heterogeneous areas.
1. Introduction
Methane (CH4), nitrogen dioxide (NO2), and carbon monoxide (CO) are amongst the main air pollutants worldwide [1,2]. They are being emitted by various sources, with the coal industry being one of the largest global emitters. A growing number of scientific reports state that coal is the most polluting source of energy and a major cause of the unprecedented increase in the concentration of greenhouse gases in the atmosphere [3,4,5]. Emissions of CH4, CO, and NO2 are released into the atmosphere along the entire chain from the mining of coal to its processing, transport, and combustion.
Methane emissions from coal mining depend on a number of factors such as the geology of the deposit, the method of coal extraction, the rank of the coal, and more. Typically, higher rank coal has higher methane content [6]. It is believed that operating underground mines are responsible for the majority of methane emissions at a global level. Methane emissions from surface mines are generally much lower [7]. In terms of emission flux, underground mines are considered as point sources whose emissions are relatively easier to record, track, and quantify. Surface mines, on the other hand, are considered as an area source and the recording and quantification of their emissions are considerably more difficult, since the amount of emissions from open-pit mines is very close to the value of background methane levels for the specific study area. Uncontrolled emissions from abandoned mines can also be difficult to detect and problematic to measure.
CO is another gas emitted by coal mining industries. CO has a short lifetime in the atmosphere (days to a few weeks) and plays an important role in the formation of ground-level ozone (O3). In the atmosphere, CO interacts with OH and reduces their levels. Meanwhile, OH radicals help reduce the lifetime of potent greenhouse gases such as methane. As a consequence, the reduction of (OH) indirectly increases the global warming potential of these gases.
Due to its relatively short atmospheric lifetime, CO can be used as a tracer gas in the assessment of emissions from point sources of air pollution [8,9]. This is particularly useful when investigating emissions of air pollutants such as CH4, CO, and NO2 in coal mining areas, where we very often have a combination of many different sources in a relatively small area, such as oil and gas fields in addition to coal mines. NO2 is highly reactive gas and, in the presence of OH radicals under solar radiation, contributes to the formation of tropospheric ozone [10,11]. The main anthropogenic sources of NO2 are thermal power plants, oil refineries, etc., where the combustion of fossil fuels such as coal, oil, and natural gas releases large amounts of this gas into the atmosphere.
Spontaneous coal combustion is very common in coal mining areas and releases large quantities of toxic gases. Significant differences in pollution levels and seasonal behavior of air pollutants have been found in different regions of the world. The temporal and spatial behavior of air pollution depends on relevant regional characteristics such as the topography of the area, local meteorological conditions, and the specific distribution and nature of local pollution sources [12]. To efficiently combat global warming, we have to find fast and reliable methods to reduce the presence of the main and most impactful gases causing the greenhouse effect.
Methane (CH4) is the second most abundant greenhouse gas after carbon dioxide (CO2). Its concentration in the atmosphere has increased at an accelerating rate in recent years and it is one of the reasons for the observed acceleration of climate warming. To slow down climate change in the short term, it is vital that emissions of this greenhouse gas is reduced rapidly in the current decade [13]. The atmosphere’s methane budget is the sum of all the individual sources and sinks that determine the amount of methane in the atmosphere on a particular day. However, accurate quantification of this budget is a major challenge [14]. This is one of the most important aspects for meeting international climate commitments, but many of the existing methane inventory systems at the national level are not sufficiently reliable [7]. Accurately determining atmospheric methane levels from all sources, both locally and globally, requires the development and application of advanced tracking technologies and scientific methods. An essential part of the process of quantifying the global methane budget is to investigate the dynamics of changes in methane concentrations and fluxes from a given emission source, as well as the mechanisms of uptake and transport. An important step in this direction is the development of detailed inventories of anthropogenic sources of methane and other important air pollutants such as carbon monoxide (CO) and nitrogen dioxide (NO2), and their nature and location [15]. For that reason, the quality of emission monitoring and reporting systems needs to be greatly improved. Methane, CO, and NO2 emissions vary widely between sectors and countries. There are several options for tracking emissions with varying degrees of accuracy [16]. It is important that monitoring and reporting programs take into account the spatial and temporal variability of emission fluxes. The choice of monitoring sites and the frequency of measurements are critical to the reliability of the results obtained [7].
A comprehensive review of available inventories of anthropogenic methane emissions has been compiled by the Global Carbon Project [17], with the two largest sources being agriculture and fossil fuels [18]. The fossil fuel industry is one of the largest sources of anthropogenic methane emissions to the atmosphere, primarily due to the gas and oil sectors (throughout the extraction-to-combustion chain). However, coal mining is relatively less studied and is likely to contribute significantly more to the levels of this greenhouse gas [19]. This finding becomes even more pronounced when considering the impact of abandoned coal mines, which continue to emit methane long after closure.
The recording and estimation methods used, the type, frequency, and density of data, consideration of orographic and meteorological factors, and other factors play a significant role in interpreting the data obtained for monitoring air pollution. Each approach has its strengths and limitations and it is therefore important that the objectives of the emissions study are adequately formulated and tailored to the information available.
Satellite technology is the most promising method for monitoring air pollutant emissions and reporting systems over the last few years. This is due to the rapid quantitative and qualitative development of this technology, including quantity and speed of information processing, broad range of applications, etc. [20,21]. Satellite remote sensing is providing increasingly better results in establishing emission profiles; it is very useful for mid- and long-term monitoring, and is crucial in tracking whether emission targets are being achieved [22]. With the fast development of satellite technology for remote sensing of atmospheric pollution, studies are increasingly focusing on the energy sector, especially coal mining. However, the success of research and its applicability for practical purposes depend on the resolution of the satellite data used. Satellite data is distinguished by both advantages and disadvantages in terms of its spatial and temporal resolution.
The primary purpose of low and medium spatial resolution satellites is not to identify and quantify emissions from point sources, but rather to study emissions of gaseous pollutants such as methane, CO, and NO2 from facilities and sites over large areas, and to track and analyze their medium and long-range transport. It is mainly a detection technique, because each measurement from a satellite is a snapshot of the gas concentration in the atmospheric column over the area of the image [22,23,24]. There are a number of important factors that have an impact on the range of applications and data quality of atmospheric remote sensing satellites. These include the presence of cloud cover over the study area, low albedo, wind, missing pixels, high aerosol content in the atmosphere, surface topography, high mountain areas, etc. All of these factors have varying degrees of influence. An additional negative influence is the presence of high levels of particulate matter in coal mining areas. The absence of pixels in satellite imagery is an important and consistent feature of satellite imagery, particularly for the measurement of methane emissions. It is therefore crucial to determine the percentage of available data for each study area in time and space.
Due to the spatial characteristics of atmospheric processes, air pollution can be studied at different scales. For global phenomena, such as dust storms, satellite data with low spatial resolution and a wide spatial window are most appropriate [25]. Temporal changes in air pollutant concentrations can occur quickly if they are directly influenced by air currents. To fully investigate such processes, data with temporal resolution on the order of hours are required. Satellite data with such high temporal resolution are rarely available. Medium spatial resolution satellites can quickly scan large areas and therefore quickly identify all the overshoots in an area. However, using satellites to quantify atmospheric emissions depends on the resolution of meteorological networks [26,27]. Therefore, caution should be exercised when using medium-resolution satellite data for emission quantification as they have a relatively high degree of uncertainty [22]. A higher number of measurements over a given area will reduce the range of errors and improve the precision of the results obtained. Nevertheless, extracting meaningful and useful information from the full annual stream of satellite data requires focused and efficiently structured hardware and software processing and analysis. Such an integrated system has the capability to determine background levels of gaseous pollutants and detect the presence of periodic and episodic high emission levels.
The main objective of this study is to investigate the spatial and temporal behavior of CH4, CO, and NO2 in coal mining areas and the percentage of TROPOMI (TROPOspheric Monitoring Instrument is the satellite instrument on board the Copernicus Sentinel-5 Precursor satellite) product data available for the respective study area. So far, several scientific reports have focused on emissions from coal mining areas in Australia, Poland, China, and the United States [5,28,29]. However, many countries with a large share of global coal mining and processing remain unexplored [3], especially with respect to methane emissions. Moreover, a significant part of officially reported emissions in these countries may be questionable [3]. Russia’s Kuznetsk Basin (the Kemerovo region) is a notable example for an under-explored coal mining area. In addition, the Kuznetsk Basin can be regarded as a nearly homogenous source of emissions from coal mining industry. For both these reasons, we select this region as a study area of the present research. Potential applications where the obtained results can be used include data assimilation [30,31,32,33], inputs to regional and continental atmospheric transport models, meteorological grid models for the simulation of atmospheric processes, etc.
2. Materials and Methods
2.1. Study Area: Kemerovo Region, Russia
Despite being the largest coalfield area in Russia and one of the largest in the world, the Kemerovo region remains one of the most under-explored regions, presenting an opportunity for further scientific investigation and discovery. It contains about 1/3 of the world’s known coal reserves [3,34] and is located in the south-western part of Siberia. It is also home to Russia’s largest and deepest coal mine, the Raspadskaya mine. The administrative area of Kemerovo region (Figure 1) covers an area of approximately 95,000 km2, with the coal mining area (the Kuznets Basin) between the cities of Kemerovo in the north and Novokuznetsk in the south covering an area of approximately 26,000 km2. Due to the lack of official information on the exact location of coal mines in Kuzbass, this study relied on data from Global Energy Monitor (GEM) [3,35] to generate a geolocalised map of 86 mines for analysis purposes.
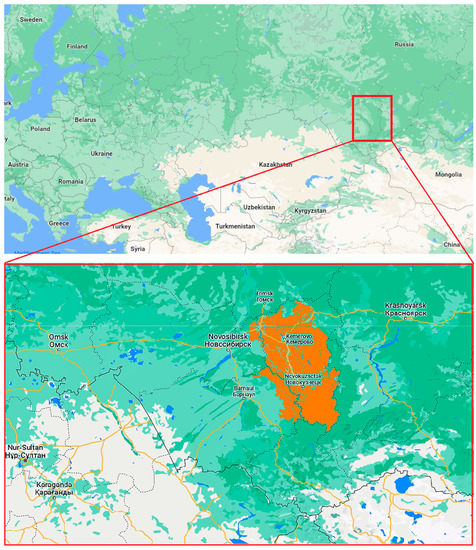
Figure 1.
Kemerovo region, Russia. Map provided by Google Maps.
2.2. TROPOMI Data and Observations
This study utilized information from the TROPOMI sensor on the Sentinel-5P satellite, which is a product of the European Space Agency and operates in a sun-synchronous orbit. With a bandwidth of 2600 km, a local flyby time of about 13 h, and a spatial resolution of 7 × 5.5 km2 (as of August 2019; 7 × 7 km2 since the start of the mission), its data are open access and available 2 to 4 days after their acquisition, daily [36,37,38]. The value for methane XCH4 is the column mean dry molecular fraction and is a product of L2 level (user data). It is expressed in parts per billion (ppb). Only cloud-free data were used for the study, and pixels with optical thickness > 0.07 and albedo in SWIR < 0.02 were removed. These filtering thresholds are consistent with SRON recommendations for data use [39]. The Sentinel-5P data are published in netCDF format and have irregular geometry, requiring geo-referencing [40]. This process is carried out in two stages using Sentinel’s image processing product, SNAP [41]. The study area was cropped according to the input data from the topography of the area after geo-referencing. Sentinel-5P data acquired between May 2018 and December 2022 were used in the research. Thus far, the combined emissions of methane, CO, and NO2 in this coal mining region have not been studied using TROPOMI satellite data simultaneously.
2.3. Methodology
The relatively high percentage of missing pixels is one of the main problems in studying air pollutant emissions from medium-resolution satellite data. This is particularly the case for methane, but it is also true for NO2 and CO, depending on the latitude. It is therefore important to determine what data are available for the study area in terms of time (for each day) and space (% completeness of the available pixels in the image). Several studies quantifying the effect of missing pixels on the resulting methane endpoints have been published in the scientific literature. One very useful result [22] shows that the uncertainty largely depends on the variation of methane levels in the study area. In cases where the background methane is relatively stable, the removal of significant amounts of data still results in low uncertainty levels. Conversely, in areas with high background variability (possibly due to the presence of a large intermittent emission source), we tend to see much higher uncertainty even with less missing data. An analysis of the amount of available data from the TROPOMI sensor on the Sentinel 5P satellite was performed for the Kemerovo region of Russia for the full period of this study, from May 2018 to December 2022.
Background levels are one of the most critical indicators to monitor when studying air pollutants such as methane, NO2, and CO. The knowledge of background levels for the study area makes it possible to explore seasonal and annual trends in their variation, to quickly detect periodic or occasional small- to average- volume emissions from unregulated sources, as well as track transport from other areas or a series of processes such as scavenging capacity, etc. During the process of determining background concentrations, a fundamental task in image processing and analysis techniques [22], it is important to take into account local topographic features (areas of uniform topography and low elevation) and key local atmospheric characteristics (humidity, wind rose, etc.).
For the Kemerovo region, Russia, these requirements form a study area of about 36,000 km2 with a maximum altitude of 557 m, concentrated entirely around the coal mines (Figure 2). This area is subjected to an integrated analysis on a weekly basis in order to determine the background level of methane using the equation:
where is the background methane value, μ is the median, and is the mean of the dataset. The factor k in Equation (1) is predetermined. For the purpose of this work, after a preliminary analysis to estimate the error, we use k = 3 as a more precise value. This is a very popular technique for automatic image analysis in background determination and astronomical object retrieval [22,42]. This approach is iterative (it consists of one or more iterations), since the sigma-cropping is carried out in one or more steps. The first step is to compute the standard deviation σ (Equation (2)).
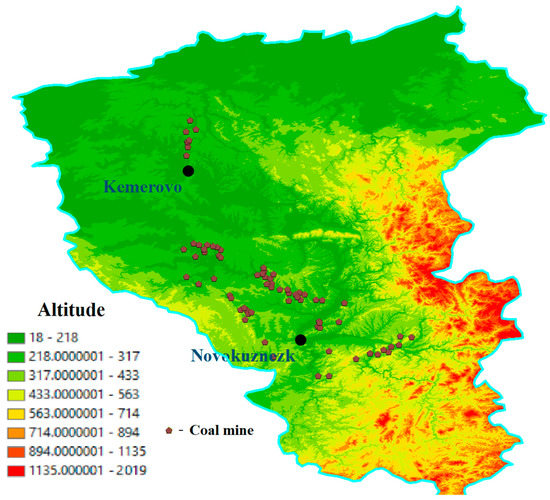
Figure 2.
Kemerovo region, Russia with coal mines indicated.
The standard deviation is determined using the equation:
where is the mean of the dataset, —the ith element of the dataset, n—the size of the dataset.
The next step is to remove all pixels that do not fall within the interval of ±3σ around the median value μ. For a result of more than 95% of the pixels in this interval, the Equation (1) is applied, which gives the background value of methane for the study area. The same method can be applied by replacing in Equation (1) with and , respectively, to determine the background concentrations of CO and NO2. Background levels were calculated for each day of the four-year study period. A 3σ filter was then applied to detect emission events. The aim is to find clusters exceeding at least three times the standard deviation value σ for that calculation cycle. These areas need to have at least eight pixels (for each individual polygon subjected to filtering) that exceed the background by at least 3σ values to be considered as having an emission event. Any pixels that do not meet this condition are eliminated from further inspection.
The advantage of this approach lies in the relatively fast processing time performed in the R statistical and mathematical data processing environment. This is especially true when extracting information from large datasets, such as the image files acquired daily by the TROPOMI sensor.
3. Results
3.1. Data Availability
Summary statistics of data availability for the study area (the Kuznetsk Basin, Kemerovo region) over the entire research period (May 2018–December 2022) are shown in Figure 3.
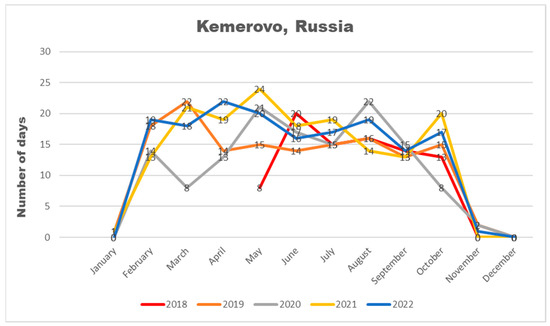
Figure 3.
Number of days with methane data available from TROPOMI, Kemerovo region, Russia.
The graphs clearly show that for all four and a half years in the area there were no methane readings from the TROPOMI sensor in the months of November, December, and January. The percentage of availability ranges from 27% to 77% for the remaining months. The dense cloud cover over the study area is the main reason for the complete lack of data for the winter months of November to January. It is important to note that the temporal and spatial density of data for CO and NO2 is significantly higher for the Kemerovo region study area. Therefore, it is not necessary to perform such a statistical analysis. Another peculiarity with regard to the TROPOMI methane data is the fact that a significant number of the images for the research area have a low or medium density of pixels. To qualify as valid data, we required that at least 10 pixels be clustered in the area analyzed. In most cases, the period from February to October provided sufficient data for the calculation, as the background calculation was performed on a weekly basis.
3.2. Background Tendency of CH4
The filtering procedure was applied to the data quality for the period May 2018–December 2022 to eliminate files with low or no percentage of pixels present in the imagery, and the weekly background methane concentrations for methane were obtained as shown in Figure 4.
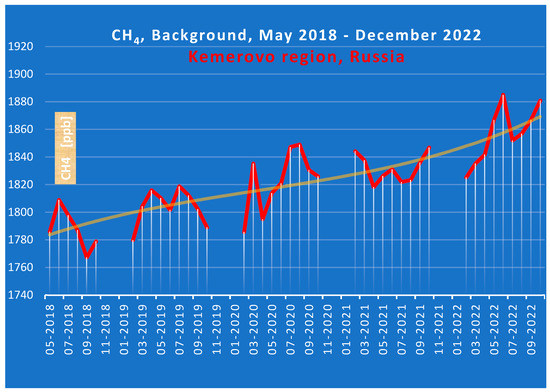
Figure 4.
Background concentrations of methane in the atmosphere over the Kemerovo region for the period May 2018–December 2022. Data used–Sentinel-5P.
As can be seen from the graph in Figure 4, there is a clear tendency towards a sustained increase in the methane background on an annual basis. In addition, the large amplitudes of the monthly variations in methane background concentrations are very noticeable. This is due to the large number of methane super-emitters over a relatively small area.
3.3. Detection of High Methane Emissions Events
The availability of detailed information on the background methane concentrations in the study area allows to apply a 3σ filter to detect emission events.
The application of this method led to the registration of 339 (Figure 5) methane emissions events on the territory of the Kemerovo region, for the period May 2018–December 2022. Such a high number of detected events is the cause of the high amplitude of monthly variations of background methane concentrations in the region, shown in Figure 4. The location of spots with detected high methane emissions overlaps with coal mine locations in this area. There is no seasonal dependence established in the frequency of these emission events. Due to the high number of mines located in a relatively small region (Figure 2), each with varying volumes of coal mined and operating standards, it is very difficult to identify the specific mines responsible for these high emissions using medium-resolution satellite data such as the TROPOMI. Further research with higher spatial and temporal resolution is needed to more accurately estimate the amount of methane released into the atmosphere and to identify the super-emitters. The TROPOMI data are extremely useful for recording emission events, as we show in the research reported here. This is particularly useful for locations with limited access to specific sites, or where information on emissions from these sites may not be highly reliable.
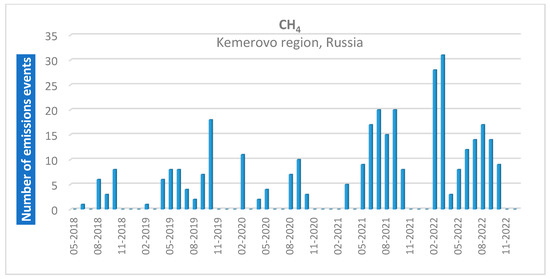
Figure 5.
Number of registered events of high methane emissions for the period May 2018–December 2022 on a monthly basis in the Kemerovo region, Russia. Data used—Sentinel-5P.
Figure 6 shows the individual days with high methane emissions in the study area. A cluster of pixels exceeding 3σ is required to record an emission event. For many of the days in the study time interval from May 2018 to December 2022, several clusters with high methane emission values were detected simultaneously on the same day. This is an indication of the presence of multiple super-emitters in the Kemerovo region.
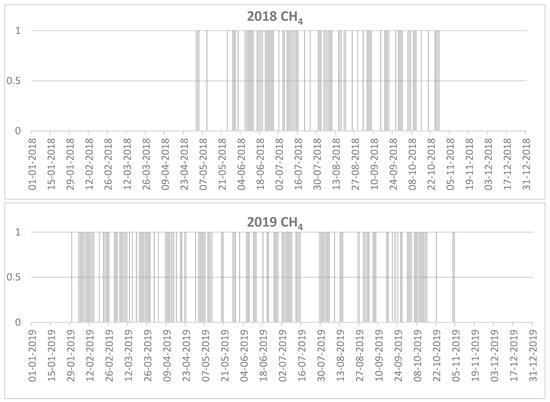
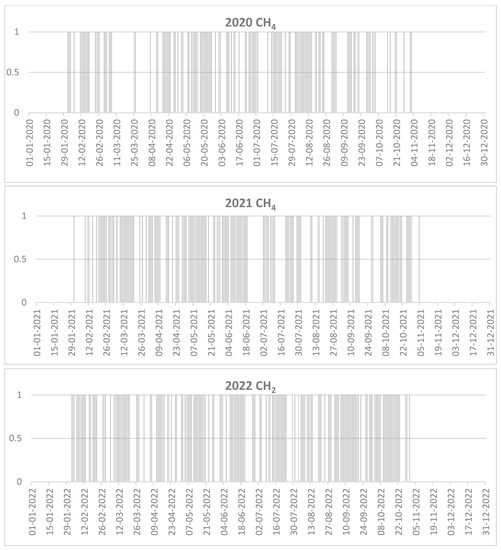
Figure 6.
Days with methane emissions of more than 3σ above the background concentration, Kemerovo region, for each year from 2018 to 2022 separately.
Using the same methodology with 3σ filter to detect high NO2 and CO emission events in the Kemerovo region study area, 861 and 874 emission events were recorded for May 2018–December 2022, respectively. Figure 7 and Figure 8 show the distribution of these events on a daily basis for each of the individual years for NO2 and CO, respectively. Another important result of our calculations shows that nearly all high methane emission events are associated with high CO and NO2 emissions in the same area.
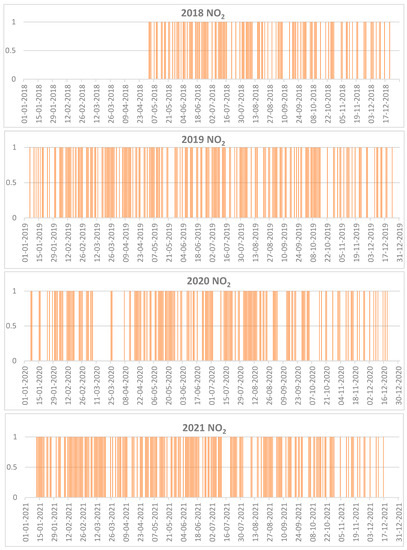
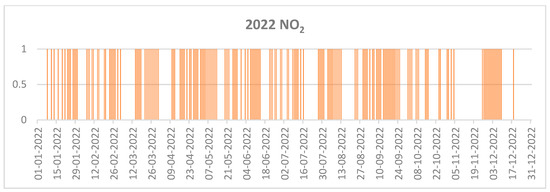
Figure 7.
Days with NO2 emissions of more than 3σ above the background concentration, Kemerovo region, for each year from 2018 to 2022 separately.
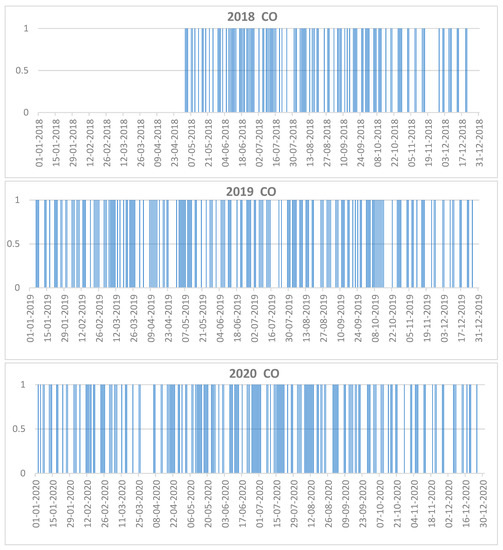
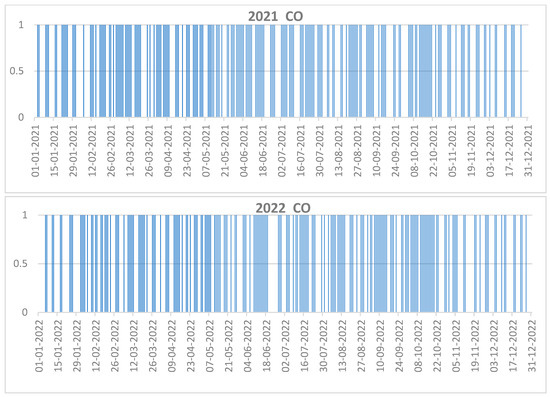
Figure 8.
Days with CO emissions of more than 3σ above the background concentration, Kemerovo region, for each year from 2018 to 2022 separately.
The results show that the large monthly variations in the background concentration of CH4 can be attributed to the presence of a number of super emitters in the study area of Kemerovo region and to the large number of registered emission events for the studied period of 4 years and 8 months. Several clusters with high CH4, NO2 and CO emissions events within the same day are clearly visible in Figure 9, Figure 10, Figure 11 and Figure 12.
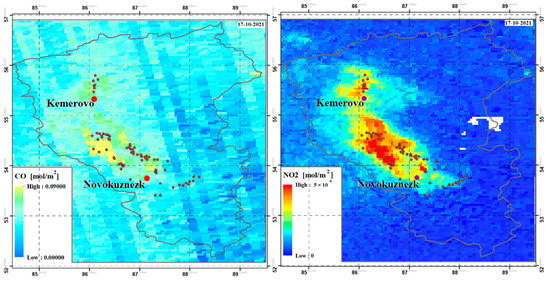
Figure 9.
High CO (left panel) and NO2 (righ panel) emissions, registered on 17 October 2021. Data used—Sentinel-5P.
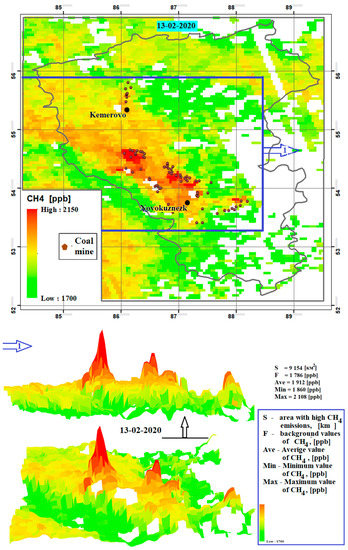
Figure 10.
High methane emissions, registered on 13 February 2020. The blue rectangle (top, 2D view) outlines the area shown in the 3D views (bottom). Data used—Sentinel-5P.
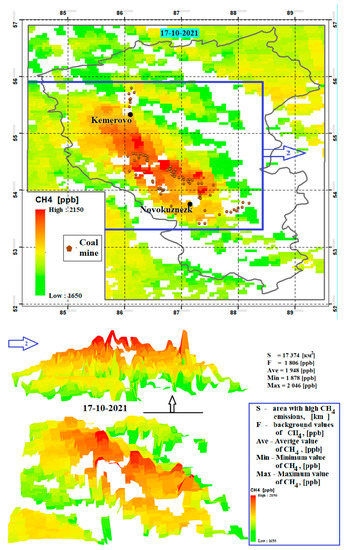
Figure 11.
High methane emissions, registered on 17 October 2021. The blue rectangle (top, 2D view) outlines the area shown in the 3D views (bottom). Data used—Sentinel-5P.
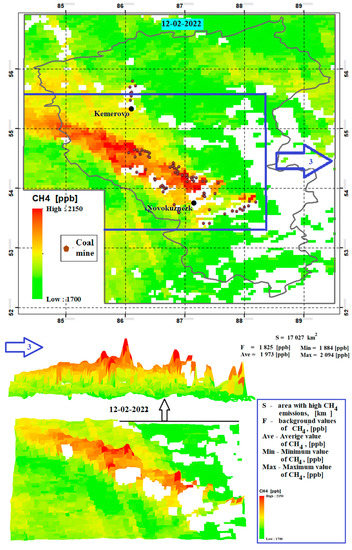
Figure 12.
High methane emissions, registered on 12 February 2022. The blue rectangle (top, 2D view) outlines the area shown in the 3D views (bottom). Data used—Sentinel-5P.
4. Discussion
The results of a study on the emissions of methane, CO, and NO2 in the largest coal mining area in Russia, the Kuznetsk Basin, have been presented using satellite data from the Sentinel-5P satellite of the European Space Agency, with a medium spatial resolution. This region has been relatively under-studied with regard to atmospheric pollutant emissions such as methane, NO2, and CO, and has limited potential for obtaining reliable ground-based measurements from official sources [3]. Therefore, it is extremely important to conduct diverse studies and analyses using satellite data with moderate to high spatial resolution.
Cases of high emissions of methane and NO2 have been reported in other coal mining regions [12,43], but the number and amount of registered emission events is significantly lower compared to those reported in the current study for the Kuznetsk Basin. The results of the present research on the detection of emission events for CH4, NO2, and CO can serve as input data for analyses of air quality or the contribution of these atmospheric pollutants to regional and global climate change.
In this article, we present a method for determining the background levels of atmospheric pollutants such as methane, NO2, and CO. Knowing this key indicator allows monitoring of seasonal and annual trends, rapid identification of periodic or unintentional emissions from unregulated sources, and more. One of the advantages of the presented method is the relatively fast computational procedures in processing data from daily observations of Sentinel-5P. Our study showed that it is possible to track annual trends in methane concentrations despite the relatively low percentage of available data, which is in good agreement with findings from [2,22,33,44]. The results obtained here regarding the density of available data provided by TROPOMI can be used as a basis for further studies and more accurate quantitative assessments of emissions using satellite data with high spatial resolution. As a result of applied computational and analytical procedures, hundreds of cases (Figure 6, Figure 7 and Figure 8) of high methane, NO2, and CO emissions were detected in the coal mining area of Kuznetsk Basin for the entire study period from May 2018 to the end of 2022. In agreement with our results, [3] also found a significant increase in tropospheric NO2 concentration over Kuzbass due to coal mining and processing activities. Canadian global emissions monitoring company GHGSat reports [45,46,47] the largest ever recorded methane leaks from a coal mine in the period from January 2022 to May 2022. The source, the Raspadskaya mine, is located in the southeastern part of the Kuznetsk Basin studied by us. Their data, with high spatial resolution, enables more precise calculation of the amount of emitted methane into the atmosphere. This highlights the importance of the combined use of satellite data with medium and high spatial resolution for more accurate identification of point sources, registration of all emission events in the study area, as well as more precise quantitative determination of emissions. The emission events reported by GHGSat for the period January 2022–May 2022 are included among those registered by us for the same period, with the exception of those in January 2022, due to a lack of data from TROPOMI.
As a result of our research, we have observed periodic events of simultaneous high-emission clusters of methane (Figure 10, Figure 11 and Figure 12), as well as NO2 and CO (Figure 9), indicating the presence of several point sources of emissions. To precisely locate and quantify emissions from these sources, it is recommended to use satellite data with high spatial resolution. Our findings demonstrate that the large number of emissions events we have recorded is responsible for the observed upward trend in methane concentrations in the atmosphere over the studied area, as well as for the large monthly amplitude variations. This conclusion is consistent with the sustained global increase in methane background reported by other authors [16,17,18]. In addition, we have found that the weekly and monthly variability of CH4 and NO2 are well revealed by the data provided by TROPOMI, which is corroborated by [29,48].
5. Conclusions
The main objective of this study was to examine the spatiotemporal patterns of CH4, CO, and NO2 in coal mining regions using TROPOMI data. The methodology used, allowed for the determination of baseline gas concentrations, tracking of seasonal/annual changes, and prompt detection of unregulated emissions. An additional advantage of this methodology was its ability to track annual trends in methane concentrations despite the low percentage of available Sentinel-5 data. Over a period of four and a half years, hundreds of large-scale emissions of CH4, NO2, and CO from the coal mines in the Kuznetsk Basin (the Kemerovo region) were detected. The research revealed periodic events of simultaneous high-emission clusters of methane, NO2, and CO, indicating the presence of several emission sources. One limitation is that satellite data with high spatial resolution is highly recommended to precisely locate and quantify emissions from these sources. However, the obtained results showed that the proposed methodology can effectively analyze air quality or the contribution of these atmospheric pollutants to regional and global climate change.
Author Contributions
Conceptualization, methodology, software, validation, formal analysis, investigation, resources, data curation, writing and editing, visualization by P.T., M.D. and D.A. All authors have read and agreed to the published version of the manuscript.
Funding
This research received no external funding.
Data Availability Statement
The TROPOMI data are available at https://scihub.copernicus.eu/ (accessed on 12 March 2023).
Acknowledgments
The authors appreciate and thank to ESA for providing the TROPOMI data.
Conflicts of Interest
The authors declare no conflict of interest.
References
- Manisalidis, I.; Stavropoulou, E.; Stavropoulos, A.; Bezirtzoglou, E. Environmental and Health Impacts of Air Pollution: A Review. Front. Public Health 2020, 8, 14. [Google Scholar] [CrossRef]
- Trenchev, P. Use of Satellite Data with Medium Spatial Resolution to Detect Atmospheric Methane Pollution. Ph.D. Thesis, Space Research Institute at the Bulgarian Academy of Sciences, Sofia, Bulgaria, November 2022. [Google Scholar]
- Labzovskii, L.D.; Belikov, D.A.; Damiani, A. Space borne NO2 observations are sensitive to coal mining and processing in the largest coal basin of Russia. Sci Rep. 2022, 12, 12597. [Google Scholar] [CrossRef]
- Pandey, B.; Gautam, M.; Agrawal, M. Greenhouse gas emissions from coal mining activities and their possible mitigation strategies. In Environmental Carbon Footprints; Butterworth-Heinemann: Oxford, UK, 2018; pp. 259–294. [Google Scholar]
- Guanter, L.; Irakulis-Loitxate, I.; Gorroño, J.; Sánchez-García, E.; Cusworth, D.H.; Varon, D.J.; Cogliati, S.; Colombo, R. Mapping methane point emissions with the PRISMA space borne imaging spectrometer. Remote Sens. Environ. 2021, 265, 112671. [Google Scholar] [CrossRef]
- Aydin, G.; Karakurt, I.; Aydiner, K. Analysis and Mitigation Opportunities of Methane Emissions from the Energy Sector. Energy Sources Part A Recovery Util. Environ. Eff. 2012, 34, 967–982. [Google Scholar] [CrossRef]
- UNECE. Best Practice Guidance for Effective Management of Coal Mine Methane at National Level: Monitoring, Reporting, Verification and Mitigation; United Nations: Geneva, Switzerland, 2022; pp. 1–43.
- Jeong, U.; Hong, H. Comparison of Total Column and Surface Mixing Ratio of Carbon Monoxide Derived from the TROPOMI/Sentinel-5 Precursor with In-Situ Measurements from Extensive Ground-Based Network over South Korea. Remote Sens. 2021, 13, 3987. [Google Scholar] [CrossRef]
- Reichle, H.G., Jr.; Connors, V.S. The mass of CO in the atmosphere during October 1984, April 1994, and October 1994. J. Atmos. Sci. 1999, 56, 307. [Google Scholar] [CrossRef]
- Bezirtzoglou, E.; Alexopoulos, A. Ozone history and ecosystems: A goliath from impacts to advance industrial benefits and interests, to environmental and therapeutical strategies. Ozone Deplet. Chem. Impacts 2009, 135–145. [Google Scholar]
- Fuglestvedt, J.S.; Berntsen, T.; Isaksen, I.S.A.; Mao, H.; Liang, X.Z.; Wang, W.C. Climatic forcing of nitrogen oxides through changes in tropospheric ozone and methane. Atmos. Environ. 1999, 33, 961–977. [Google Scholar] [CrossRef]
- Li, A.; Chen, C.; Chena, J.; Leia, P. Environmental investigation of pollutants in coal mine operation and waste dump area monitored in Ordos Region, China. RSC Adv. 2021, 11, 10340–10352. [Google Scholar] [CrossRef]
- Gatenby, J. Urgent Steps Must Be Taken to Reduce Methane Emissions, New Report Says. 2021. Available online: https://phys.org/news/2021-05-urgent-methane-emissions.html (accessed on 12 March 2023).
- Ganesan, A.L.; Schwietzke, S.; Poulter, B.; Arnold, T.; Lan, X.; Rigby, M.; Vogel, F.; van der Werf, G.; Janssens-Maenhout, G.; Boesch, H.; et al. Advancing Scientific Understanding of the Global Methane Budget in Support of the Paris Agreement. Glob. Biogeochem. Cycles 2019, 33, 1475–1512. [Google Scholar] [CrossRef]
- IIASA—International Institute for Applied Systems Analysis. Containing Methane and Its Contribution to Global Warming. 2020. Available online: https://phys.org/news/2020-02-methane-contribution-global.html (accessed on 12 March 2023).
- van Dingener, R.; Crippa, M.; Janssens-Maenhout, G.; Guizzardi, D.; Dentener, F. Global Trends of Methane Emissions and Their Impacts on Ozone Concentrations, JNC Science for Policy Report. 2018. Available online: https://op.europa.eu/en/publication-detail/-/publication/c40e6fc4-dbf9-11e8-afb3-01aa75ed71a1/language-en (accessed on 12 March 2023).
- Saunois, M.; Stavert, A.R.; Poulter, B.; Bousquet, P.; Canadell, J.G.; Jackson, R.B.; Raymond, P.A.; Dlugokencky, E.J.; Houweling, S.; Patra, P.K.; et al. The Global Methane Budget 2000–2017. Earth Syst. Sci. Data 2020, 12, 1561–1623. [Google Scholar] [CrossRef]
- Ravishankara, A.; Kuylenstierna, J.; Michalopoulou, E.; Höglund-Isaksson, L.; Zhang, Y.; Seltzer, K.; Ru, M.; Castelino, R.; Faluvegi, G.; Naik, N.; et al. GMA—Global Methane Assessment. Benefits and Costs of Mitigating Methane Emissions; United Nations Environment Programme and Climate and Clean Air Coalition: Paris, France, 2021; pp. 17–119. [Google Scholar]
- Kholod, N.; Evans, M.; Pilcher, R.; Roshchanka, V.; Ruiz, F.; Coté, M.; Collings, R. Global methane emissions from coal mining to continue growing even with declining coal production. J. Clean. Prod. 2020, 256, 120489. [Google Scholar] [CrossRef]
- European Commission. EU Methane Strategy. 2020. Available online: https://ec.europa.eu/commission/presscorner/detail/en/ip_20_1833 (accessed on 12 March 2023).
- Zhang, Y.; Gautam, R.; Pandey, S.; Omara, M.; Maasakkers, J.D.; Sadavarte, P.; Lyon, D.; Nesser, H.; Sulprizio, M.P.; Varon, D.J.; et al. Quantifying methane emissions from the largest oil-producing basin in the United States from space. Sci. Adv. 2020, 6, eaaz5120. [Google Scholar] [CrossRef]
- Cooper, J.; Dubey, L.; Hawkes, A. Methane detection and quantification in the upstream oil and gas sector: The role of satellites in emissions detection, reconciling and reporting. Environ. Sci. Atmos. 2022, 2, 9. [Google Scholar] [CrossRef]
- Dimitrova, M.; Nedkov, R.; Syrakov, D.; Georgieva, E.; Gochev, D.; Trenchev, P.; Veleva, B.; Atanassov, D.; Spassova, T.; Bachvarova, E. Identification of Optimal Satellite Data for Use in the Air Quality Modeling System BgCWFS. In Proceedings of the Fifteenth International Scientific Conference “Space, Ecology and Safety”, Sofia, Bulgaria, 6–8 November 2019; pp. 253–260. [Google Scholar]
- Dimitrova, M.; Trenchev, P.; Gochev, G. Spatial and Seasonal Distribution of NO2 Pollution over Bulgaria, Based on Tropomi Measurements. In Proceedings of the Sixteenth International Scientific Conference “Space, Ecology and Safety”, Sofia, Bulgaria, 4–6 November 2020; pp. 279–282. [Google Scholar]
- Dimitrova, M. Seasonal changes of Sahara desert dust transport over Balkans. Aerosp. Res. Bulg. 2021, 33, 79–86. [Google Scholar] [CrossRef]
- Ershadi, A.; Mccabe, M.F.; Evans, J.P.; Mariethoz, G.; Kavetski, D.A. Bayesian analysis of sensible heat flux estimation: Quantifying uncertainty in meteorological forcing to improve model prediction. Water Resour. Res. 2013, 49, 2343–2358. [Google Scholar] [CrossRef]
- Pendergrass, W.; McQueen, J.; Dimego, G.; Ek, M. Evaluation of NOAA/NCEP’s North America Mesoscale (NAM) 12-km and 4-km High-Resolution Nest (NAM4) Forecast for a typical Southern Temperate Deciduous Forest. In Proceedings of the AMS 7th Conference on Transition of Research to Operations, Seattle, WA, USA, 22–26 January 2017. [Google Scholar]
- Fiehn, A.; Kostinek, J.; Eckl, M.; Klausner, T.; Gałkowski, M.; Chen, J.; Gerbig, C.; Röckmann, T.; Maazallahi, H.; Schmidt, M.; et al. Estimating CH4, CO2 and CO emissions from coal mining and industrial activities in the Upper Silesian Coal Basin using an aircraft-based mass balance approach. Atmos. Chem. Phys. 2020, 20, 12675–12695. [Google Scholar] [CrossRef]
- Sadavarte, P.; Pandey, S.; Maasakkers, J.; Lorente, A.; Borsdorff, T.; Denier van der Gon, H.; Houweling, S.; Aben, I. Methane emissions from super-emitting coal mines in Australia quantified using TROPOMI satellite observations. Environ. Sci. Technol. 2021, 55, 16573–16580. [Google Scholar] [CrossRef]
- Georgieva, E.; Atanassov, D.; Spassova, T.; Batchvarova, E.; Syrakov, D.; Dimitrova, M.; Nedkov, R.; Veleva, B. Satellite Information Downscaled to Urban Air Quality in Bulgaria-Project Description. Bulg. J. Meteo. Hydr. 2019, 23, 47–60. Available online: http://meteorology.meteo.bg/global-change/content-en-23-2.html (accessed on 12 March 2023).
- Lahoz, W.A.; Schneider, P. Data assimilation: Making sense of Earth Observation. Front. Environ. Sci. 2014, 2, 16. [Google Scholar] [CrossRef]
- Fletcher, S.J. Data Assimilation for the Geosciences: From Theory to Application, 1st ed.; Elsevier: Amsterdam, The Netherlands, 2017. [Google Scholar]
- Schneider, P.; Hamer, P.D.; Kylling, A.; Shetty, S.; Stebel, K. Spatiotemporal Patterns in Data Availability of the Sentinel-5P NO2 Product over Urban Areas in Norway. Remote Sens. 2021, 13, 2095. [Google Scholar] [CrossRef]
- Britannica, The Editors of Encyclopaedia. “Kuznetsk Coal Basin”. Encyclopedia Britannica. 30 November 2015. Available online: https://www.britannica.com/place/Kuznetsk-Coal-Basin (accessed on 12 February 2023).
- GEM: Global Energy Monitor. Available online: https://globalenergymonitor.org/ (accessed on 12 March 2023).
- Varon, D.J.; McKeever, J.; Jervis, D.; Maasakkers, J.D.; Pandey, S.; Houweling, S.; Aben, I.; Scarpelli, T.; Jacob, D.J. Satellite discovery of anomalously large methane point sources from oil/gas production. Geophys. Res. Lett. 2019, 46, 13507–13516. [Google Scholar] [CrossRef]
- Pandey, S.; Gautam, R.; Houweling, S.; van der Gon, H.D.; Sadavarte, P.; Borsdorff, T.; Hasekamp, O.; Landgraf, J.; Tol, P.; van Kempen, T.; et al. Satellite observations reveal extreme methane leakage from a natural gas well blowout. Proc. Natl. Acad. Sci. USA 2019, 116, 26376–26381. [Google Scholar] [CrossRef]
- Cusworth, D.H.; Jacob, D.J.; Sheng, J.-X.; Benmergui, J.; Turner, A.J.; Brandman, J.; White, L.; Randles, C.A. Detecting high-emitting methane sources in oil/gas fields using satellite observations. Atmos. Chem. Phys. 2018, 18, 16885–16896. [Google Scholar] [CrossRef]
- Plant, G.; Kort, E.A.; Murray, L.T.; Maasakkers, J.D.; Aben, I. Evaluating urban methane emissions from space using TROPOMI methane and carbon monoxide observations. Remote Sens. Environ. 2022, 268, 112756. [Google Scholar] [CrossRef]
- Open Access Hub. Available online: https://scihub.copernicus.eu (accessed on 10 March 2023).
- Earth Online Tools. SNAP. Available online: https://earth.esa.int/eogateway/tools/snap (accessed on 10 March 2023).
- Bertin, E.; Arnouts, S. SExtractor: Software for source extraction. Astron. Astrophys. Suppl. Ser. 1996, 117, 393–404. [Google Scholar] [CrossRef]
- Zheng, Z.; Yang, Z.; Wu, Z.; Marinello, F. Spatial Variation of NO2 and Its Impact Factors in China: An Application of Sentinel-5P Products. Remote Sens. 2019, 11, 1939. [Google Scholar] [CrossRef]
- Crosman, E. Meteorological Drivers of Permian Basin Methane Anomalies Derived from TROPOMI. Remote Sens. 2021, 13, 896. [Google Scholar] [CrossRef]
- GHGSat. Available online: https://www.ghgsat.com/en/newsroom/russian-mine-produces-biggest-methane-leak-ever-seen-by-ghgsat/ (accessed on 10 January 2023).
- EcoWatch. Available online: https://www.ecowatch.com/methane-leak-russia-coal-mine.html (accessed on 10 January 2023).
- GeoSpatialWorld. Available online: https://www.geospatialworld.net/prime/technology-and-innovation/worlds-biggest-methane-leak-detected-in-russian-coal-mine/ (accessed on 10 January 2023).
- Wang, C.; Wang, T.; Wang, P.; Wang, W. Assessment of the Performance of TROPOMI NO2 and SO2 Data Products in the North China Plain: Comparison, Correction and Application. Remote Sens. 2022, 14, 214. [Google Scholar] [CrossRef]
Disclaimer/Publisher’s Note: The statements, opinions and data contained in all publications are solely those of the individual author(s) and contributor(s) and not of MDPI and/or the editor(s). MDPI and/or the editor(s) disclaim responsibility for any injury to people or property resulting from any ideas, methods, instructions or products referred to in the content. |
© 2023 by the authors. Licensee MDPI, Basel, Switzerland. This article is an open access article distributed under the terms and conditions of the Creative Commons Attribution (CC BY) license (https://creativecommons.org/licenses/by/4.0/).