Article

Sentinel-2 MSI Observations of Water Clarity in Inland Waters across Hainan Island and Implications for SDG 6.3.2 Evaluation

1
School of Earth Science and Resources, China University of Geoscience, Beijing 100083, China
2
Key Laboratory of Digital Earth Science, Aerospace Information Research Institute, Chinese Academy of Sciences, Beijing 100094, China
3
International Research Center of Big Data for Sustainable Development Goals, Beijing 100094, China
4
Center of Ecology Environment Monitoring of Hainan Province, Haikou 571126, China
5
University of Chinese Academy of Sciences, Beijing 100049, China
*
Author to whom correspondence should be addressed.
Remote Sens. 2023, 15(6), 1600; https://doi.org/10.3390/rs15061600
Submission received: 12 February 2023 / Revised: 12 March 2023 / Accepted: 13 March 2023 / Published: 15 March 2023
(This article belongs to the Special Issue Remote Sensing of Wetlands and Biodiversity)

Abstract

:
Freshwater on islands represents a precious resource and highly vulnerable ecosystem. For monitoring freshwater, satellite remote sensing is efficient and has large-scale application. This study proposed a modified model of the quasi-analytical algorithm (ZSD-QAAv6m) to retrieve the water clarity of inland waters (>1 km2) across Hainan Island, China using Sentinel-2 multispectral instrument data. By adjusting the threshold of Rrs(665), the proposed model could accurately estimate water clarity with diverse optical properties on the island and avoid underestimation in moderately clear waters. Based upon this, the first spatiotemporal analysis of recent water clarity in Hainan Island was conducted. The results show that lake water clarity in the central region was generally higher (with average value of 1.4 m) than that of coastal regions (with average value of 1.2 m). Seasonally, the water clarity during the wet season was usually lower than that in the dry season, with average values of 1.1 m and 1.3 m across the island respectively. From 2017 to 2021, the proportion of water bodies with water clarity > 0.5 m increased from 60% to 100%. The overall spatial pattern of water clarity was correlated to the regional vegetation cover in Hainan Island, with higher clarity associated with higher vegetation cover in the central regions. The seasonal variation of water clarity may be attributed to heavy rainfall and runoff during the wet season; while the distinct annual variation may be benefited from the strengthened surface water protections in Hainan Province in recent years. This study provides a practical approach for evaluating the SDG 6.3.2 indicator in Hainan Island using remote sensed water clarity as a comprehensive water quality indicator and the findings could facilitate the island’s water resource management and conservation.

1. Introduction

Hainan Island is the main island of Hainan Province which is the southernmost province of China. Often promoted as “China’s Hawaii”, the climate of Hainan Island is tropical—characterized by hot and humid summers, with mild, pleasant winters. Rainfall in Hainan Island is abundant; the average annual precipitation is 1800 mm but with an uneven spatiotemporal distribution [1,2,3]. Considering islands in general, their relatively small size compared to that of mainland regions renders them particularly vulnerable to economic and environmental stresses imposed by rapidly growing populations, increasing economic development, and global climate change [2,4,5]. Freshwater represents one of the most precious resources and vulnerable ecosystems on islands. For Hainan Island, although the overall inland water is relatively rich, most of the water bodies consist of smaller artificial reservoirs with an area of less than 10 km2 [2,5]. With the acceleration of urbanization on Hainan Island, its lakes and reservoirs are facing increasingly serious water quality issues, such as industrial pollution, domestic sewage, and other water pollution. Recently, Hainan Province was identified as a target for multiple conservation measures including water quality consolidation and improvement and ecological protection of its critical lakes, reservoirs, and watersheds. Moreover, the 2018 construction of the “Hainan Free Trade Port” and the 2021 designation of Hainan Province as a distinctive provincial demonstration area in China for the implementation of Sustainable Development Goals (SDGs) has further promoted protection of the island’s hydro-ecological environment. The hydro-ecological environment of Hainan Island is vital to the overall development of Hainan Province and its water has been specifically recognized as a target of the United Nations (UN) SDGs, of which, SDG 6 is set to “provide and sustainably manage water and sanitation for all”. In the specific target indicators, SDG 6.3.2 is defined as the proportion of water bodies in the country with good ambient water quality [6]. Therefore, the monitoring of inland water quality on Hainan Island is important for evaluating SDG 6.3.2 and understanding the water quality status of its inland water bodies.
With the development of satellite remote sensing technology, satellite remote sensing data have become an important and low-cost data source for monitoring surface water quality on a large scale. Water clarity is an important water quality indicator for assessing water cleanliness and the degree of eutrophication [7]. Water clarity is generally measured using a traditional Secchi-disk, where the disk is lowered into the water and the depth at which the Secchi-disk disappears from the observer’s sight is recorded as the water clarity; this measurement is therefore also called the Secchi-disk depth (ZSD) [8,9,10]. As a synoptic water quality indicator, water clarity is closely related to the five core water quality parameters proposed by the UN-Water, in the evaluation of SDG 6.3.2, and is considered an important reporting parameter [11].
In the recent decades, a series of remote sensing algorithms for water clarity have been developed, and they can generally be classified into two types: empirical and semi-analytical. While empirical algorithms mainly use single-band or band-combination methods to establish a simple or multiple regression relationship between remotely sensed reflectance and measured water clarity [12,13,14,15], semi-analytical algorithms are supported by clear mechanistic models, which can overcome certain regional and temporal limitations of the modeling data [16]. In the updated semi-analytical ZSD model proposed by Lee et al. [16], ZSD was expressed as a function of the remote sensing reflectance (Rrs) and the diffuse attenuation coefficient Kd. This algorithm has been widely applied in marine, coastal, and inland waters. However, inland waters are known to possess complex bio-optical characteristics, the model’s application in inland waters often necessitates further calibration [10,17,18,19,20,21,22]. In particular, the retrieval of water clarity in turbid water bodies using the semi-analytical ZSD model, can be problematic because the choice of reference wavelengths or their thresholds may not be applicable to diverse water types, leading to underestimation of water clarity. [19,23,24,25]. Although various studies have attempted to improve the semi-analytical ZSD model, most of them have only involved simple calibration of the model without in-depth study on the mechanism of the model. The applicability of the semi-analytical ZSD model in regional water bodies remains to be explored.
In this paper, the semi-analytical ZSD model was improved by adjusting the threshold of Rrs(665) in classifying the clear and turbid water types to avoid the underestimation issues in moderately clear waters. With this modification, the performance of the ZSD model was enhanced in regional inland waters across Hainan Island, and it also provides a valuable reference for improving the applicability of the semi-analytical model to derive water clarity in diverse types of inland waters. Based on the modified semi-analytical ZSD model, the water clarity of lakes and reservoirs larger than 1 km2 across Hainan Island was estimated using Sentinel-2 multispectral instrument (MSI) data, and analysis the spatiotemporal variations of Inland water in Hainan Island from 2017 to 2021. In addition, the implications for SDG 6.3.2 evaluation and the influencing factors of their spatiotemporal variations are preliminarily discussed.

2. Datasets and Methods

2.1. Study Area

Hainan Island is the largest tropical island in China (18°10′–20°10′N, 108°37′–111°03′E, ~33,200 km2), located in the southernmost part of China. The island falls under a marine tropical monsoon climate, characterized by warm temperatures throughout the year. The average daily sunshine is 5.5 h and the average daily temperature is >10 °C. The terrain of Hainan Island presents a unique pattern of high elevation in the middle and low elevation in the coastal areas. The island also boasts a bountiful precipitation regime, predominantly concentrated between May and October, yielding an average annual rainfall of over 1600 mm. However, the spatial and temporal distribution of rainfall is uneven, exhibiting distinct wet and dry seasons, and the central and eastern parts of the island are relatively more humid. At the same time, the island hosts abundant surface water resources, with most of its lakes and reservoirs being artificial and relatively small, and with river runoff being abundant. Due to the influence of dry and wet monsoons and the island’s topography, the surface water of Hainan Island has uneven temporal and spatial distribution characteristics [26]. Moreover, due to the acceleration of urbanization on the island and the advancement of its social economy, the lakes and reservoirs are facing increasingly serious water pollution problems. Thus, the surface water quality of Hainan Island in particular has received increasing attention by the whole Hainan Province.

2.2. In Situ Datasets

In this paper, lakes and reservoirs with a water area larger than 1 km2 on Hainan Island were selected as the study area (Figure 1). Two in situ measured datasets were obtained for this study: the optical experimental dataset collected from five inland water areas around Sanya City (Dataset I), and a water quality monitoring dataset from 20 inland water areas across Hainan Island, collected by the Center of Ecology Environment Monitoring of Hainan Province (Dataset II). Dataset I was obtained by field surveys around Sanya City from 6–12 January 2022, for which 53 sampling points were obtained from five inland water bodies with the ZSD ranging from 0.7–3.5 m. In addition to ZSD, water sample and remote sensing reflectance were also collected at each sampling point. For these measurements, a typical black and white Secchi-disk was used in the field campaigns to determine ZSD. The disk was lowered into the water, and the ZSD was determined as the depth at which the disk was no longer visible by an observer from the water surface. A portable field spectrometer (ASD FieldSpec®3) was used to measure the Rrs in the wavelength range of 350–2500 nm according to the “above-water” method [27,28]. Using collected water samples in Dataset I, the concentrations of Chla-a and TSM and the absorption coefficient of CDOM at 440 nm were determined in the laboratory according to the method described in the relevant protocols [27]. In Dataset II, the water clarity data were collected from 20 inland waters across Hainan Island during 2019 and 2021 with the aforementioned method.
The in situ measured data were spatiotemporally matched with the Sentinel-2 MSI data for model development and validation using the following criteria: (1) The time window was set to ≤5 days between the satellite and field-measurement data; (2) the median of the 3 × 3 window centered at the sampling point was taken for the matches [29]. The criteria yielded 52 pairs of matched data from Dataset I and 43 pairs of matched data from Dataset II (Figure 1, Table 1).

2.3. Sentinel-2 MSI Data

Sentinel-2 is a wide-swath, high-resolution, multispectral Earth Observation satellite mission launched by the European Space Agency through the “Copernicus project”, which is composed of the Sentinel-2A and Sentinel-2B satellites. The double satellites enable the MSI data to cover the same area of the equator every 5 days. The Sentinel-2 MSI covers 12 spectral bands, including 4 visible bands (centered at 443, 490, 560, and 665 nm), 6 near-infrared bands (centered at 705, 740, 783, 842, 865, and 945 nm), and 2 shortwave infrared bands (centered at 1610 nm and 2190 nm), with spatial resolutions of 10, 20, and 60 m, respectively.
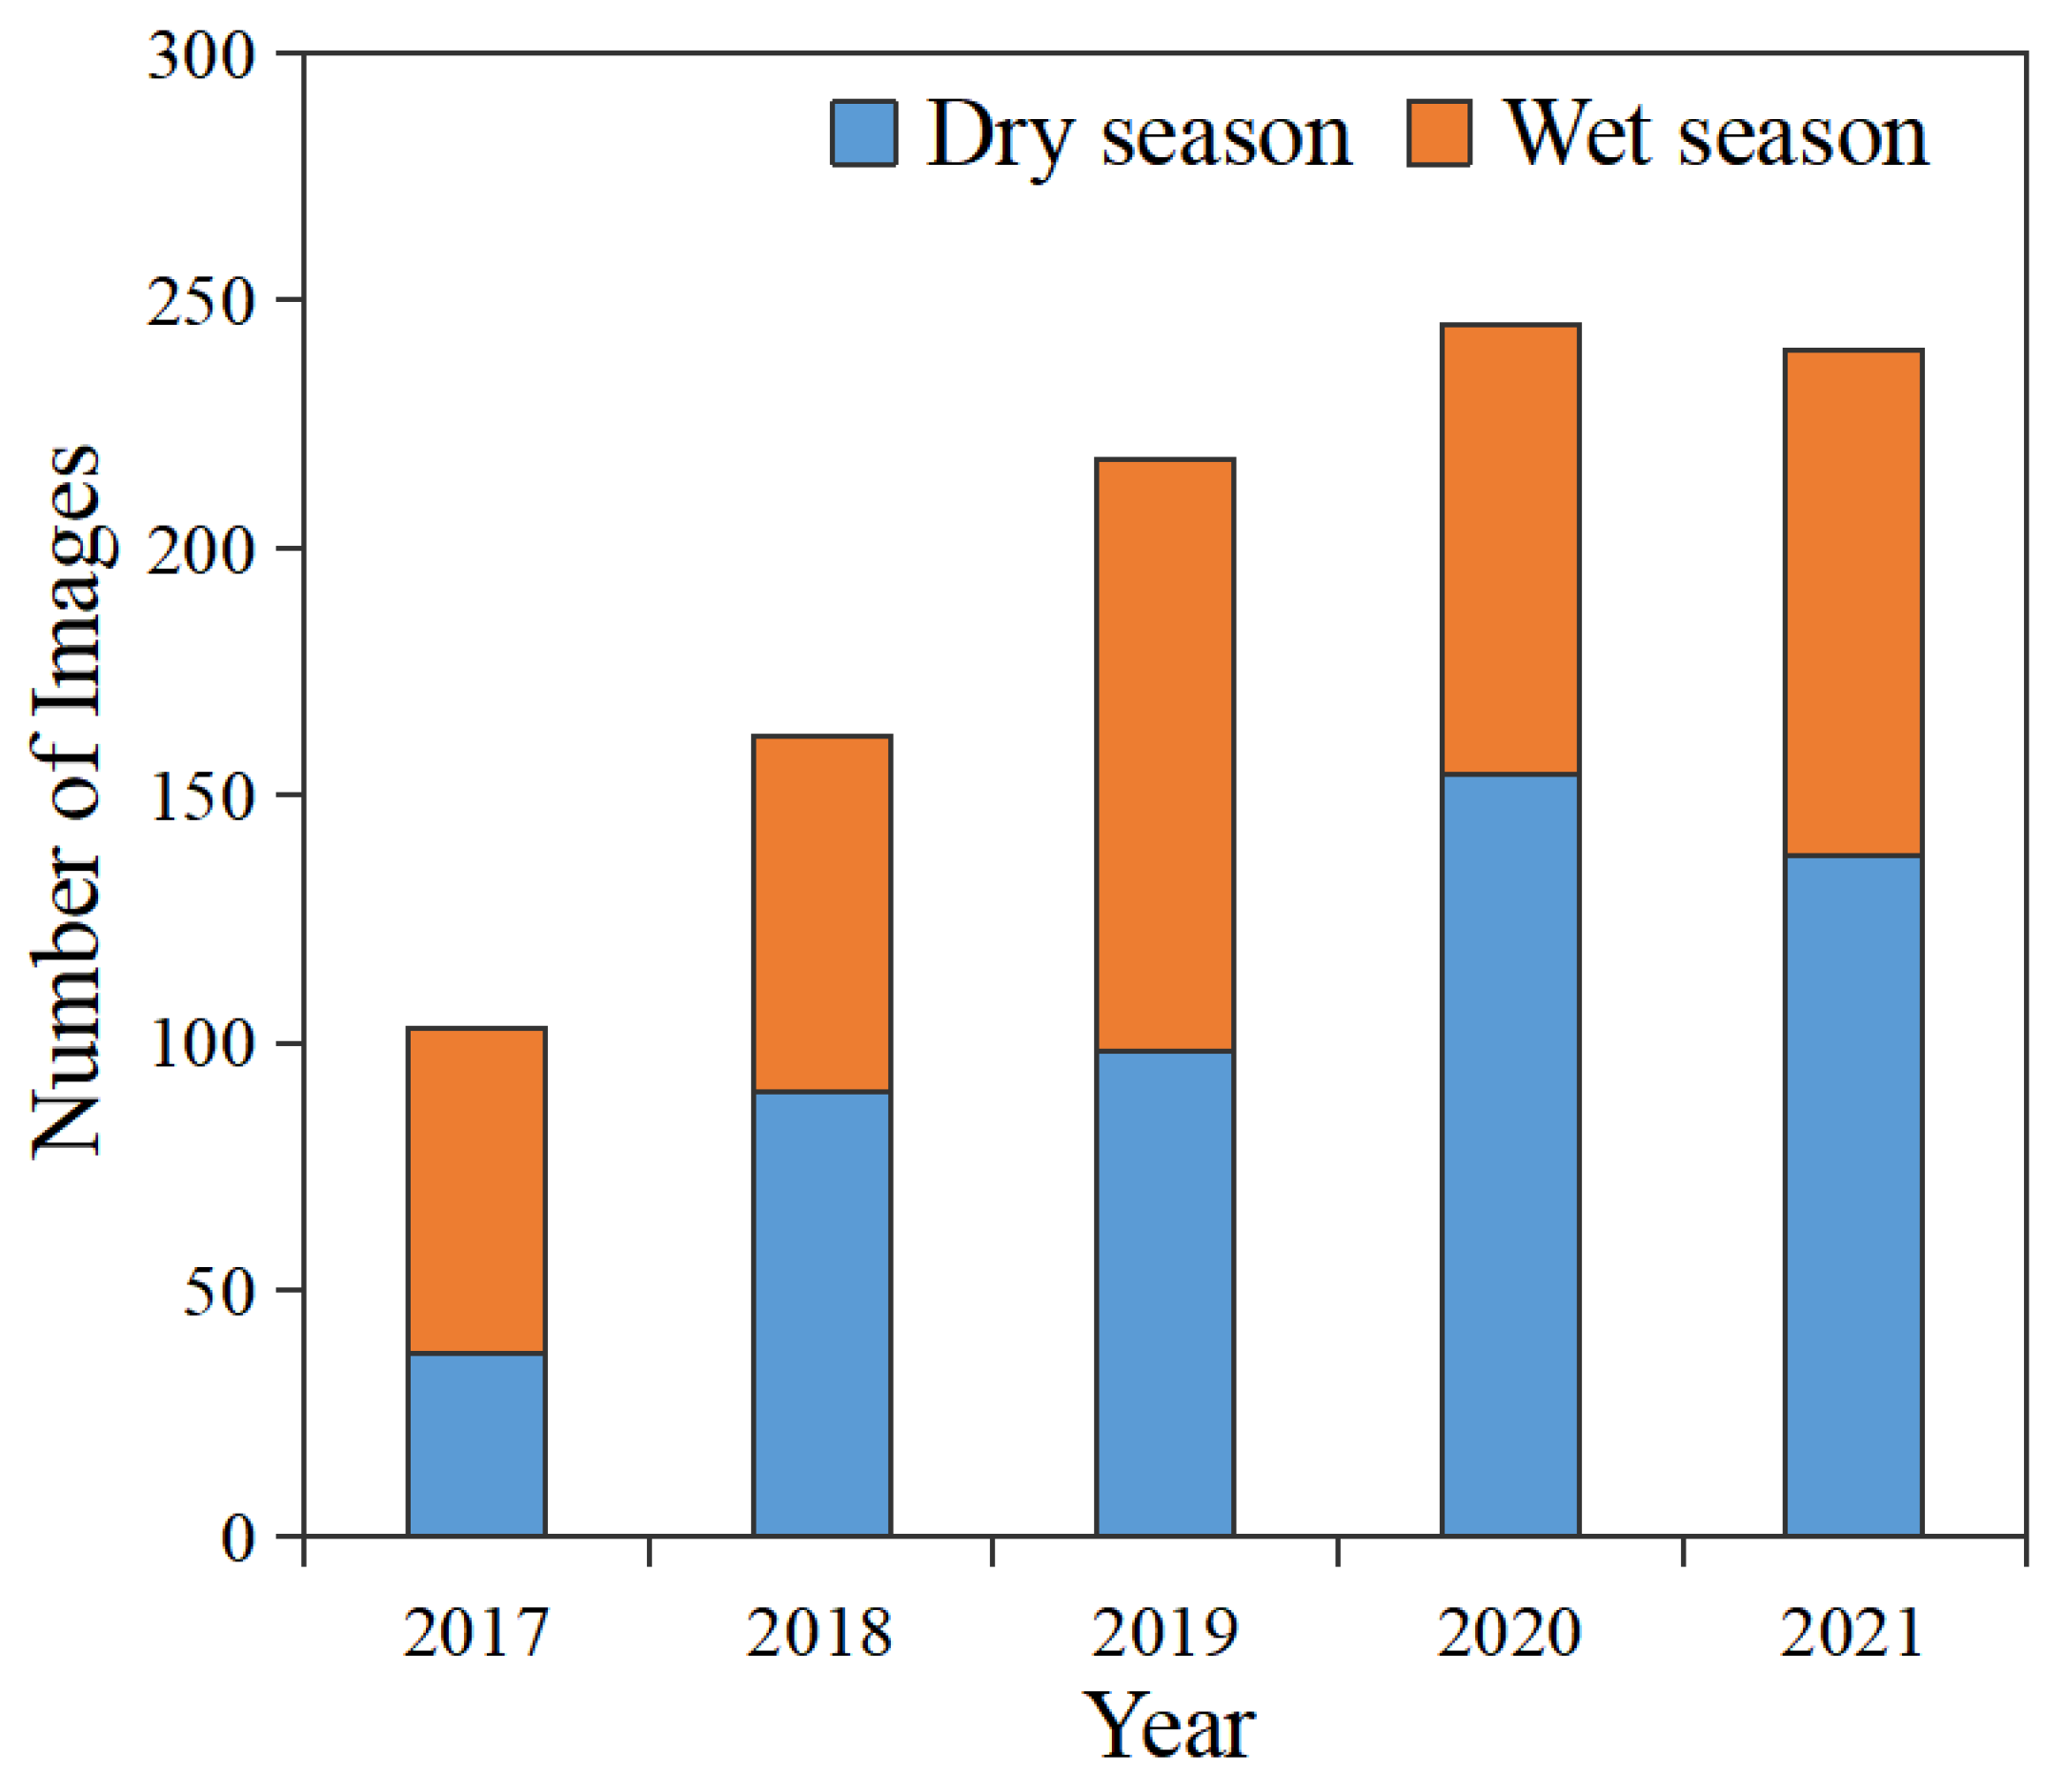
The Sentinel-2 MSI Level-2A (L2A) data used in this study were surface reflectance data atmospherically corrected by the Sen2Cor processor based on Sentinel-2 Level-1C (L1C) data. Sentinel-2 MSI L1C data covering Hainan Island from 2017–2018 were acquired from the official website of the European Space Agency (ESA) (https://scihub.copernicus.eu/dhus/#/home, accessed on 1 April 2022) and then atmospherically corrected for surface reflectance data using the Sen2Cor processor plugged into the Sentinel Application Platform software. The Sentinel-2 MSI L2A data from 2019–2021 were obtained from the Google Earth Engine (GEE) cloud platform. The surface reflectance data were cloud masked using the QA60 band included in the Sentinel-2 products. Based on the cloud mask, images with >30% cloud cover were excluded. Finally, 968 images were obtained. The specific number of images in the wet and dry seasons each year is shown in Figure 2.

2.4. Remote Sensing Reflectance Correction

A pixel-based correction method was used to correct Sentinel-2 MSI L2A data for removing the effects of sun glints and skylight reflections from the surface reflectance data, where it subtracts the minimum value of the near-infrared and shortwave infrared bands from the reflectance of each band [30,31]. Previous studies have shown that this method can be applied to derive remote sensing reflectance from surface reflectance data over large-scale inland waters with acceptable and stable accuracy. The correction formula is as follows:
R r s ( λ ) = R ( λ ) min ( R N I R : R S W I R ) π ,
where min(RNIR:RSWIR) represents the minimum reflectance value of the Sentinel-2 MSI L2A data in the near-infrared and shortwave infrared bands.

2.5. Water Area Extraction

In order to determine the best thresholding value for every water body, the algorithm combining the normalized difference water index (NDWI) and Otsu’s automatic threshold segmentation was adopted for automatic threshold segmentation of water bodies [32]. Moreover, to ensure the representativeness of small water bodies in the segmentation, the thresholding value for each connected water body was determined within an expanded zone with an area 2.5 times that of the water area, including the water body and a buffer zone surrounding it. In addition, in order to avoid the effect of mixed pixel and land adjacency, a 20-m (2-pixel) buffer inside the water boundary was removed from each water body.

2.6. ZSD Estimation Using a Modified Semi-Analytical Model ZSD-QAAv6m

In this study, the semi-analytical ZSD model based on Quasi-Analytical Algorithm (QAA v6) proposed by Lee et al. [16] was modified to adapt the water clarity retrieval of inland water bodies on Hainan Island.
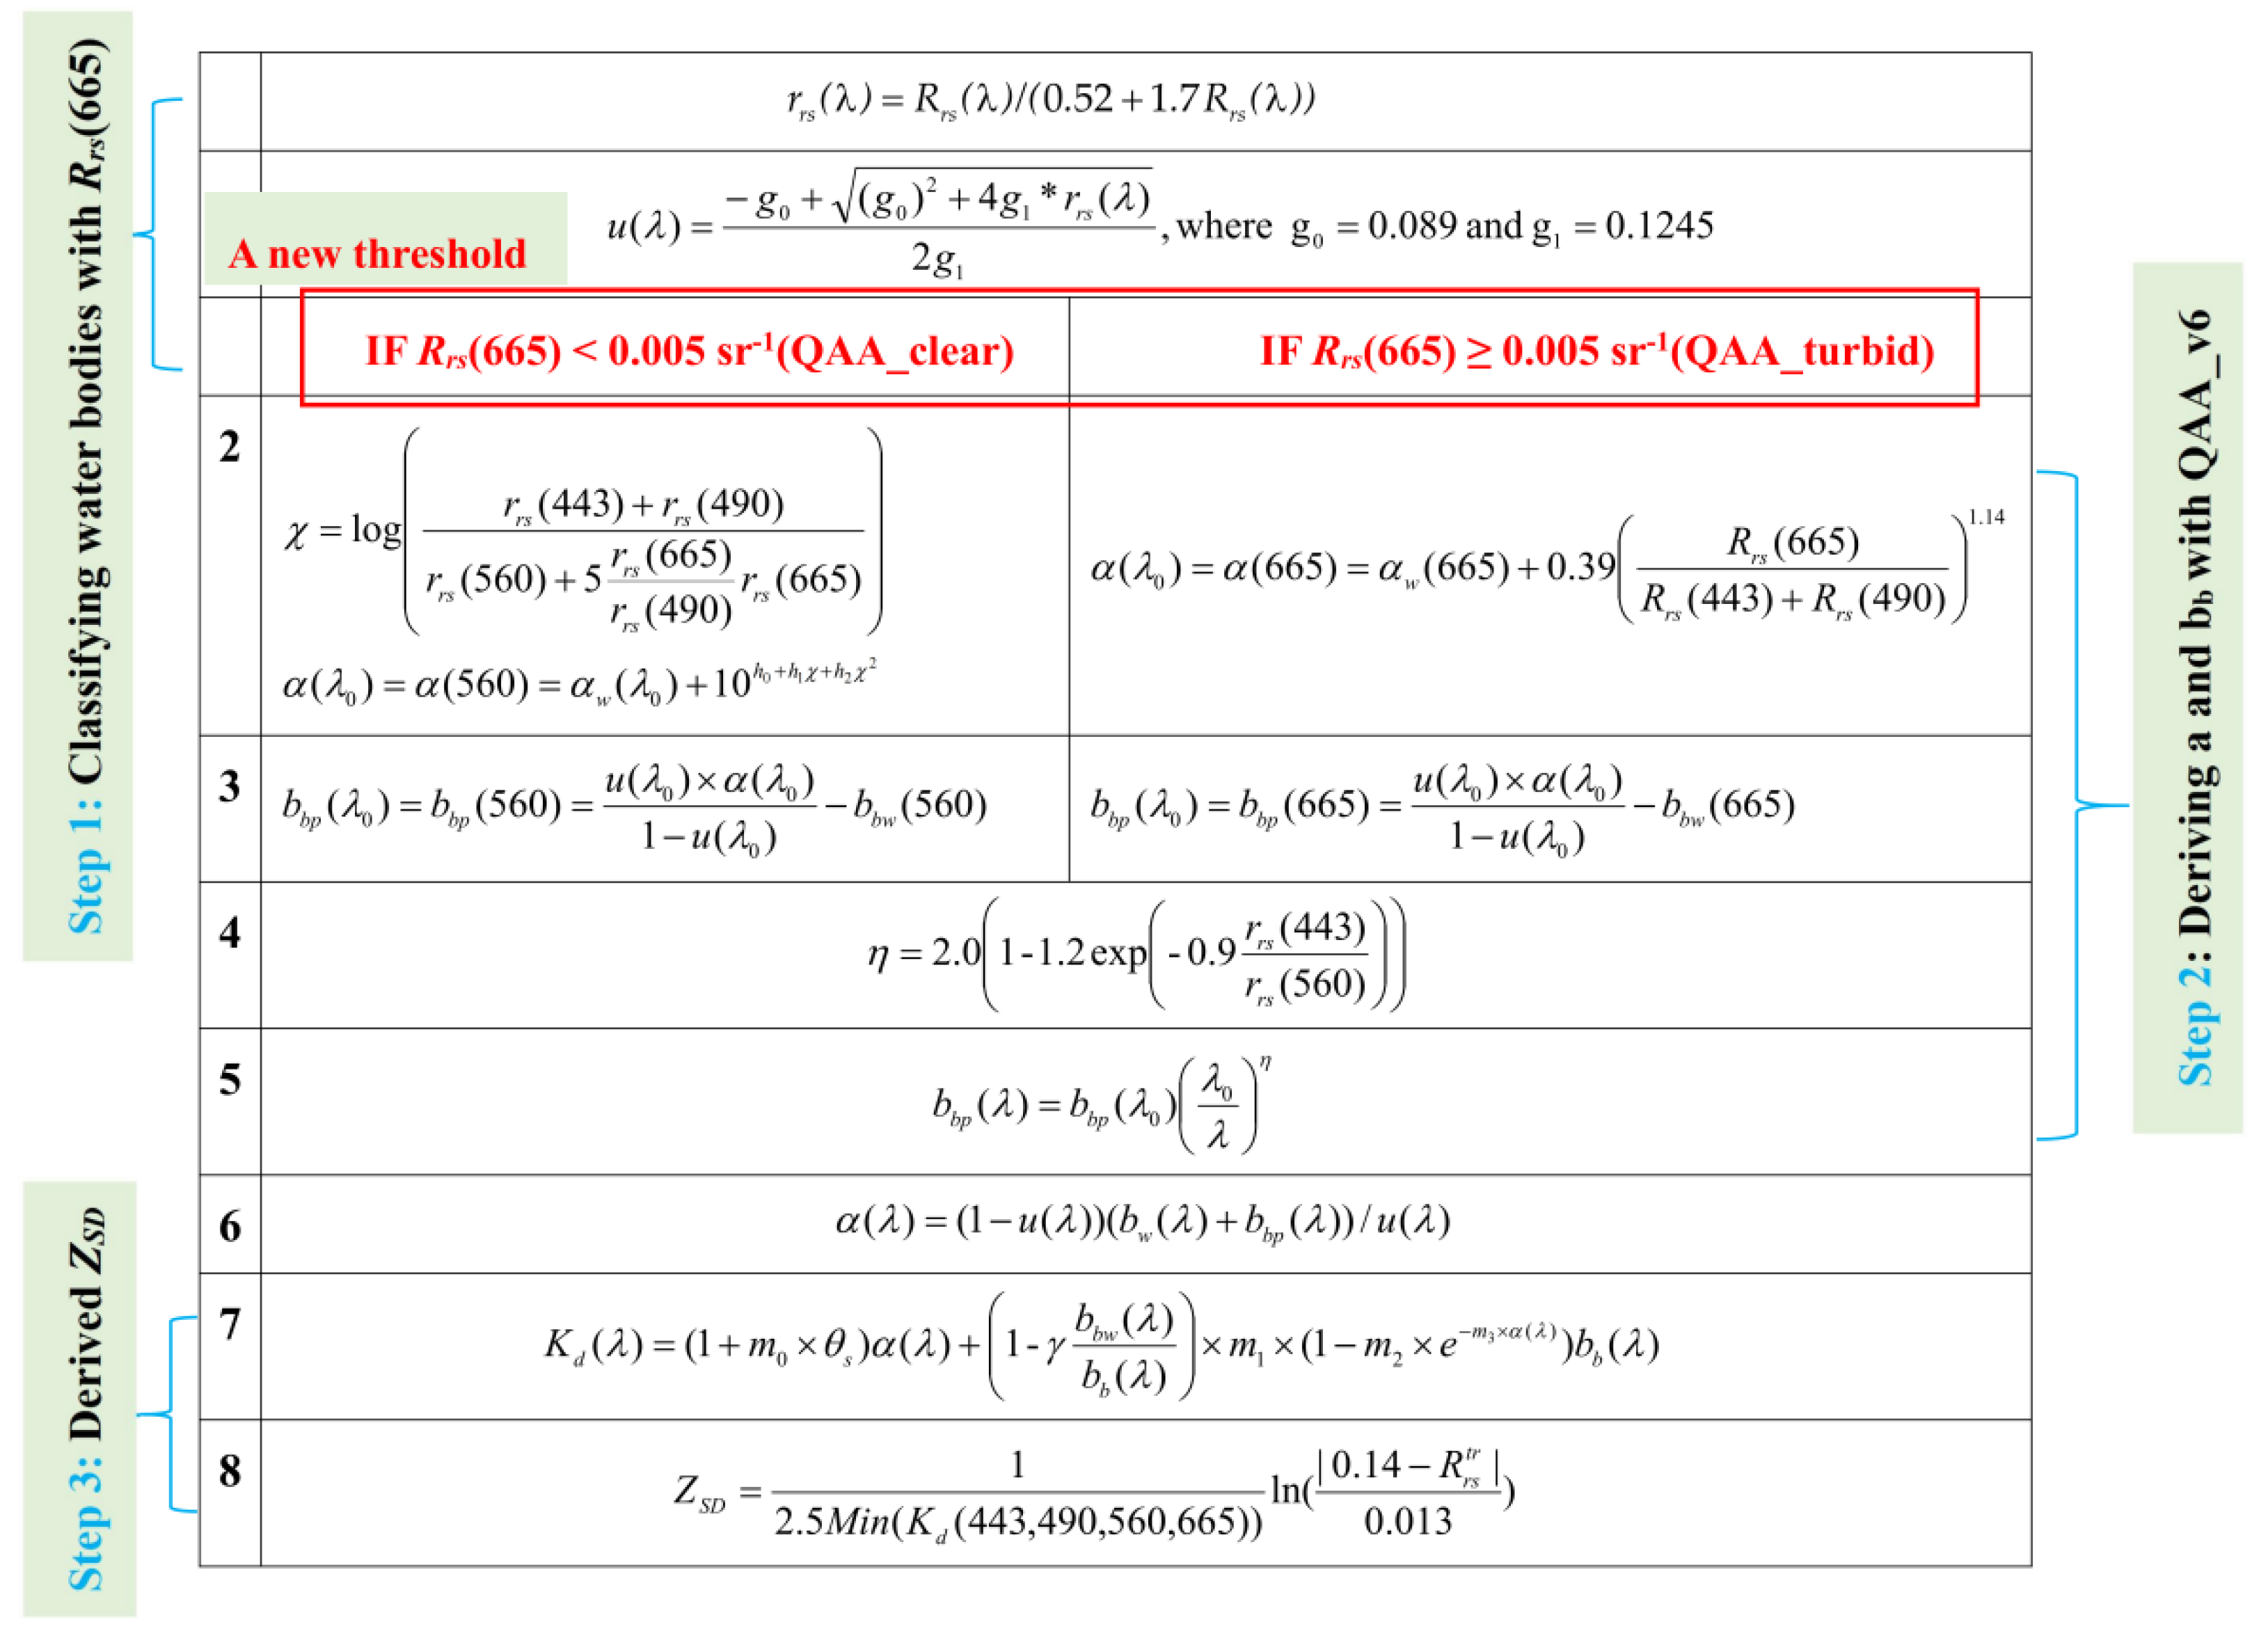
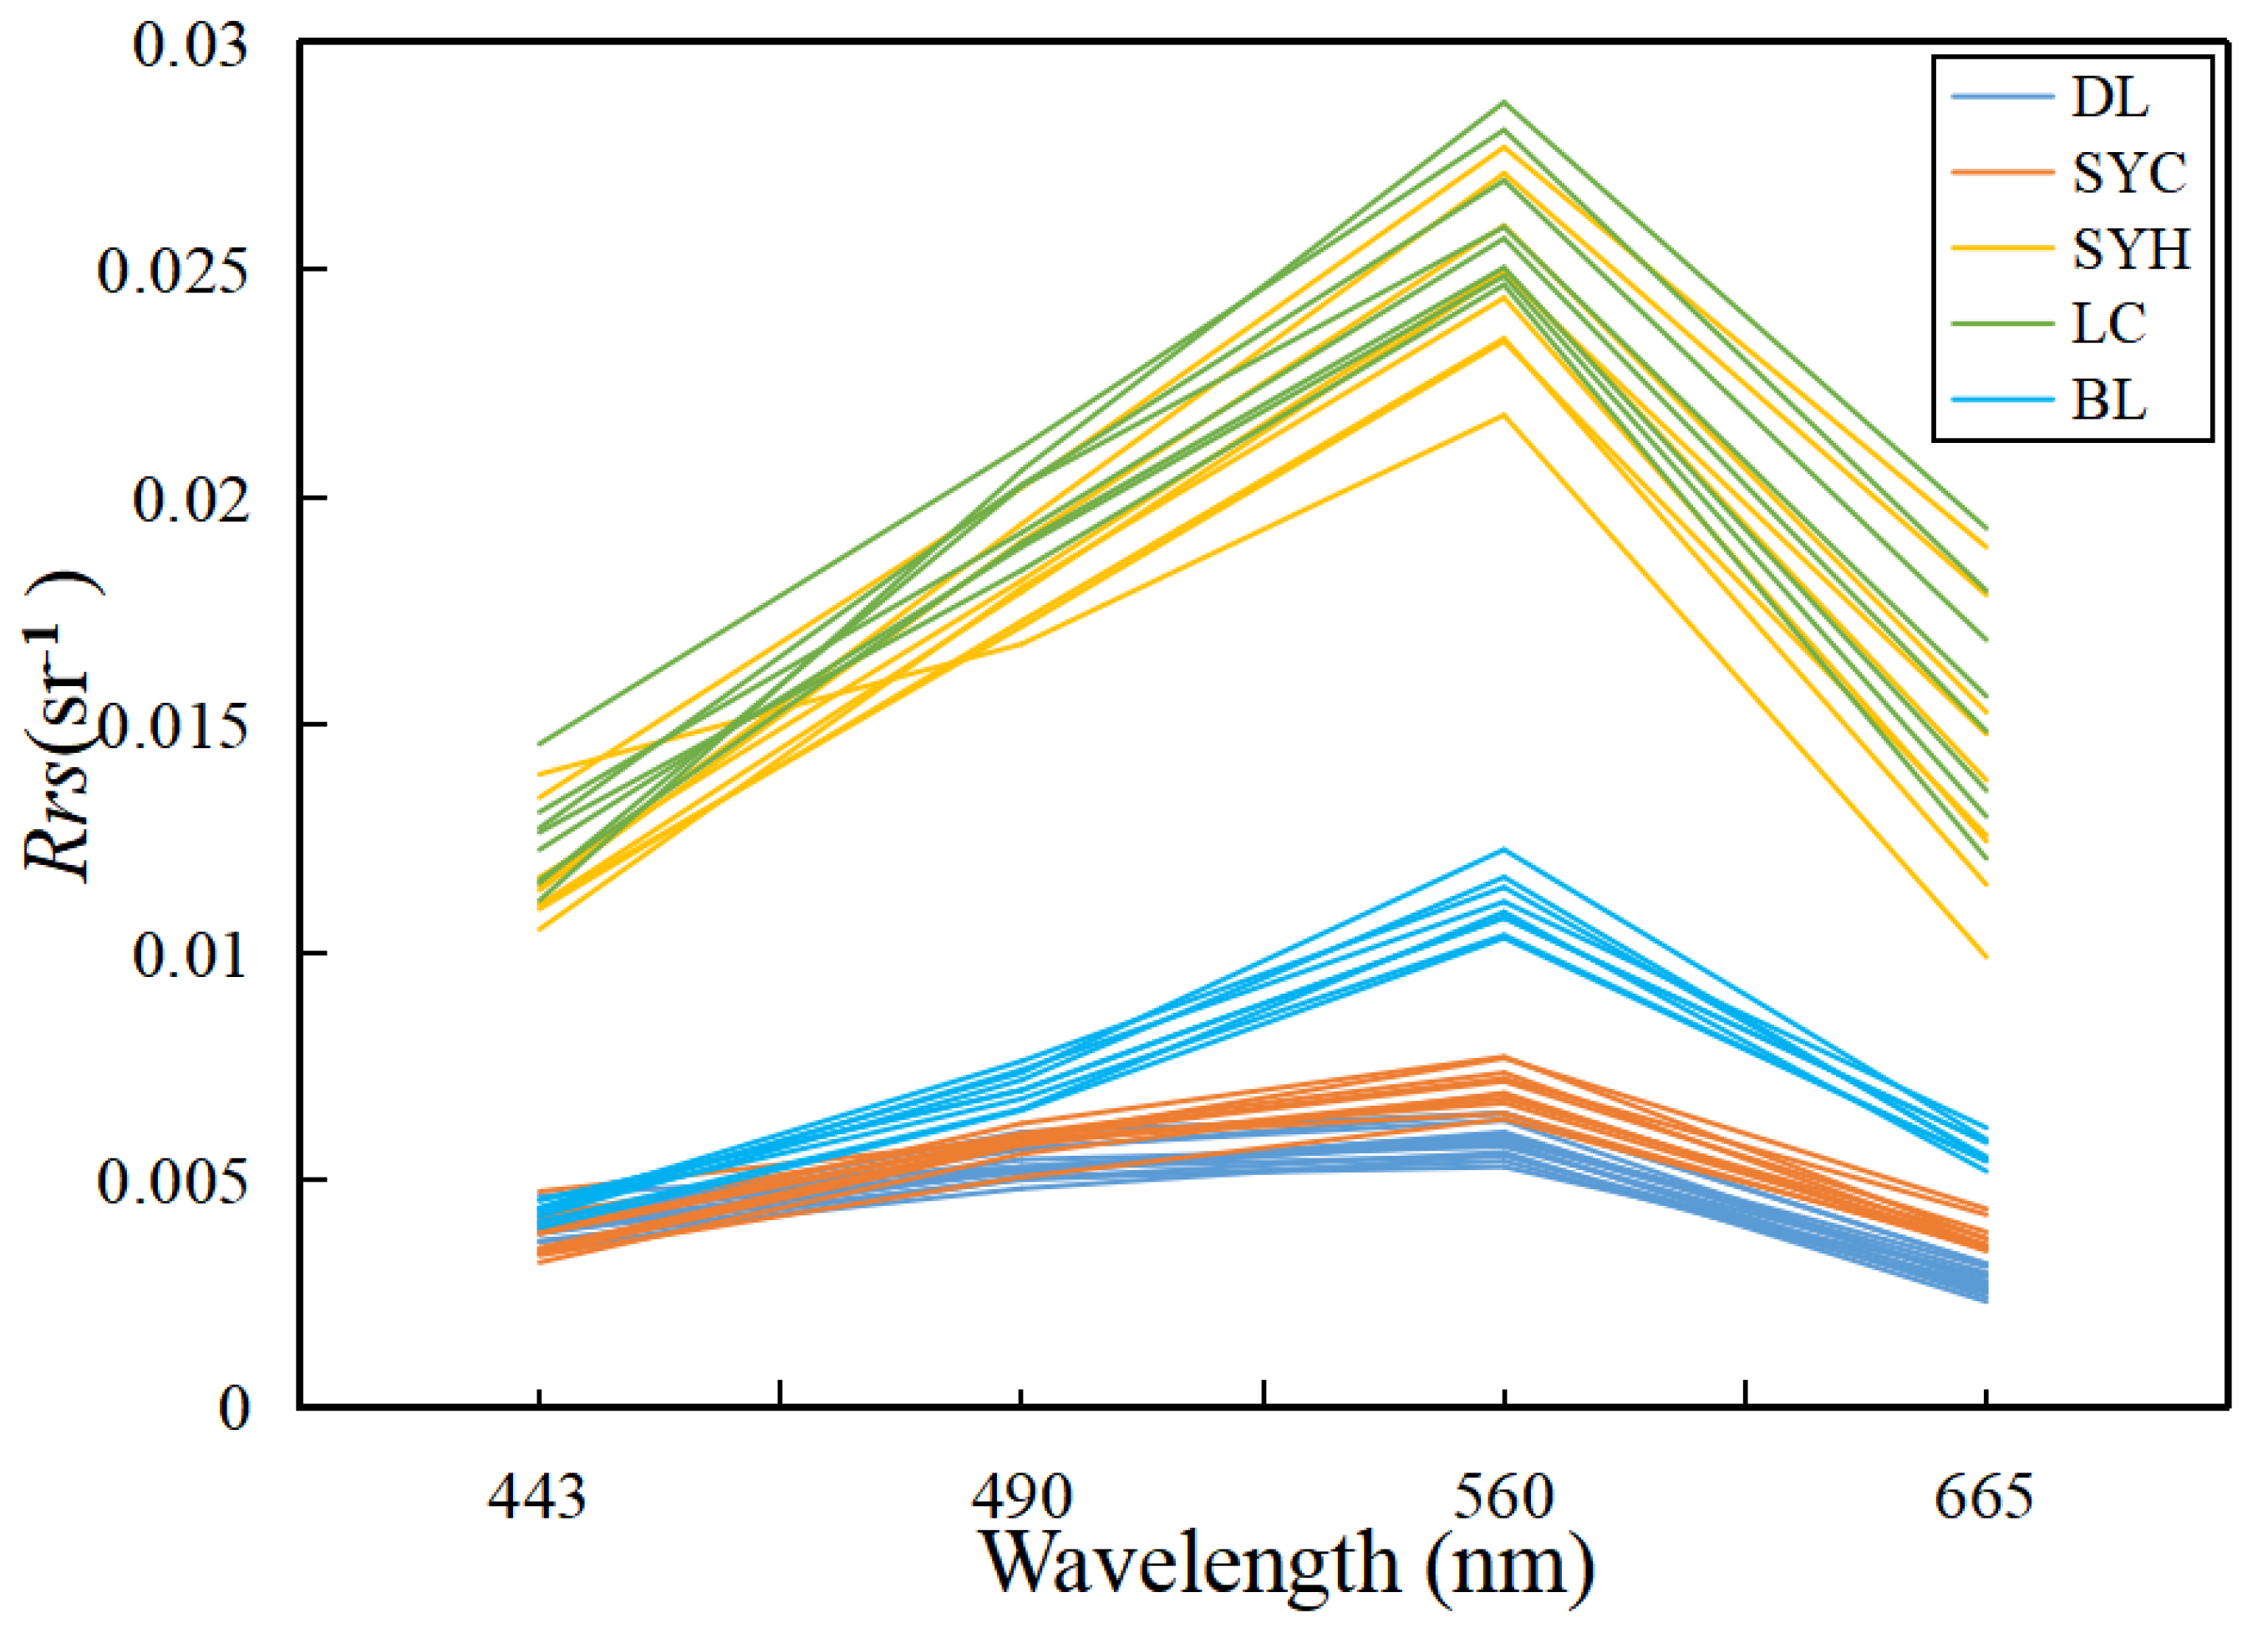
The modified semi-analytical algorithm for the ZSD estimation was established with three main steps: first, the water was classified into clear and turbid water types with a threshold of Rrs(665); second, the total absorption coefficient a (m−1) and the backscattering coefficient bb (m−1) for the two types of water were estimated based on QAAv6; and third, the diffuse attenuation coefficient Kd (m−1) was estimated and then fed to the semi-analytical model of ZSD (Figure 3). In the first step, a new threshold value of Rrs(665), i.e., 0.005, was proposed for distinguishing the clear and turbid waters through analysis of the in situ measured and matched Sentinel-2 MSI data from Hainan Island (Figure 4). By changing this threshold value from 0.0015 to 0.005, the water samples in Dalong Reservoir and Shuiyuanchi Reservoir could be classified into the clear water type, enabling the retrieved ZSD to be no longer underestimated for moderately clear waters. The moderately clear water type indicates the inland waters with ZSD above 2 m but Rrs(665) between 0.0015 and 0.005 sr−1. In the second step, QAAv6, which is the latest version of QAA, was applied to derive the a and bb from the Sentinel-2 Rrs(λ) data with the updated thresholding value to classify the clear and turbid water types. In the third step, Kd at the transparent window of the water (Kdtr) was calculated with the derived a and bb based on the radiative transfer model [33]; then, ZSD was estimated with Kdtr and Rrstr based on the semi-analytical model of ZSD [10,16], where Rrstr is the remote sensing reflectance at the transparent window of water. The transparent window of water indicates the wavelength at which the water is mostly penetrative by visible light, and it can be determined by the location of the minimum Kd in the visible domain [16].
With the derived diffuse attenuation coefficient Kd, the semi-analytical model of ZSD can be expressed as [16]:
Z S D = 1 2.5 M i n ( K d ( 443 , 490 , 560 , 665 ) ) ln ( | 0.14 R r s t r | 0.013 ) .
where Rrstr is the remote sensing reflectance of the band corresponding to the minimum diffuse attenuation coefficient Kd.
For brevity, the overall ZSD estimation scheme based on the modified semi-analytical model was called ZSD-QAAv6m, and the ZSD estimation scheme based on the original QAAv6 was called ZSD-QAAv6.

2.7. Accuracy Evaluation

In order to evaluate the performance of the corrected remote sensing reflectance and the ZSD model, this study uses three indicators: the determination coefficient (R2), the mean relative error (MRE), and the root mean square error (RMSE). The calculation formulas are as follows:
R 2 = i = 1 n ( y i y ) 2 i = 1 n ( y i y ) 2 M R E = 1 n 1 n | X X | X R M S E = 1 n ( X X ) 2 n 1 .
where X and X′ are the in situ measured value and model-estimated value, respectively, and n is the number of matched pairs.

3. Results

3.1. Validation of Sentinel-2–Derived Remote Sensing Reflectance

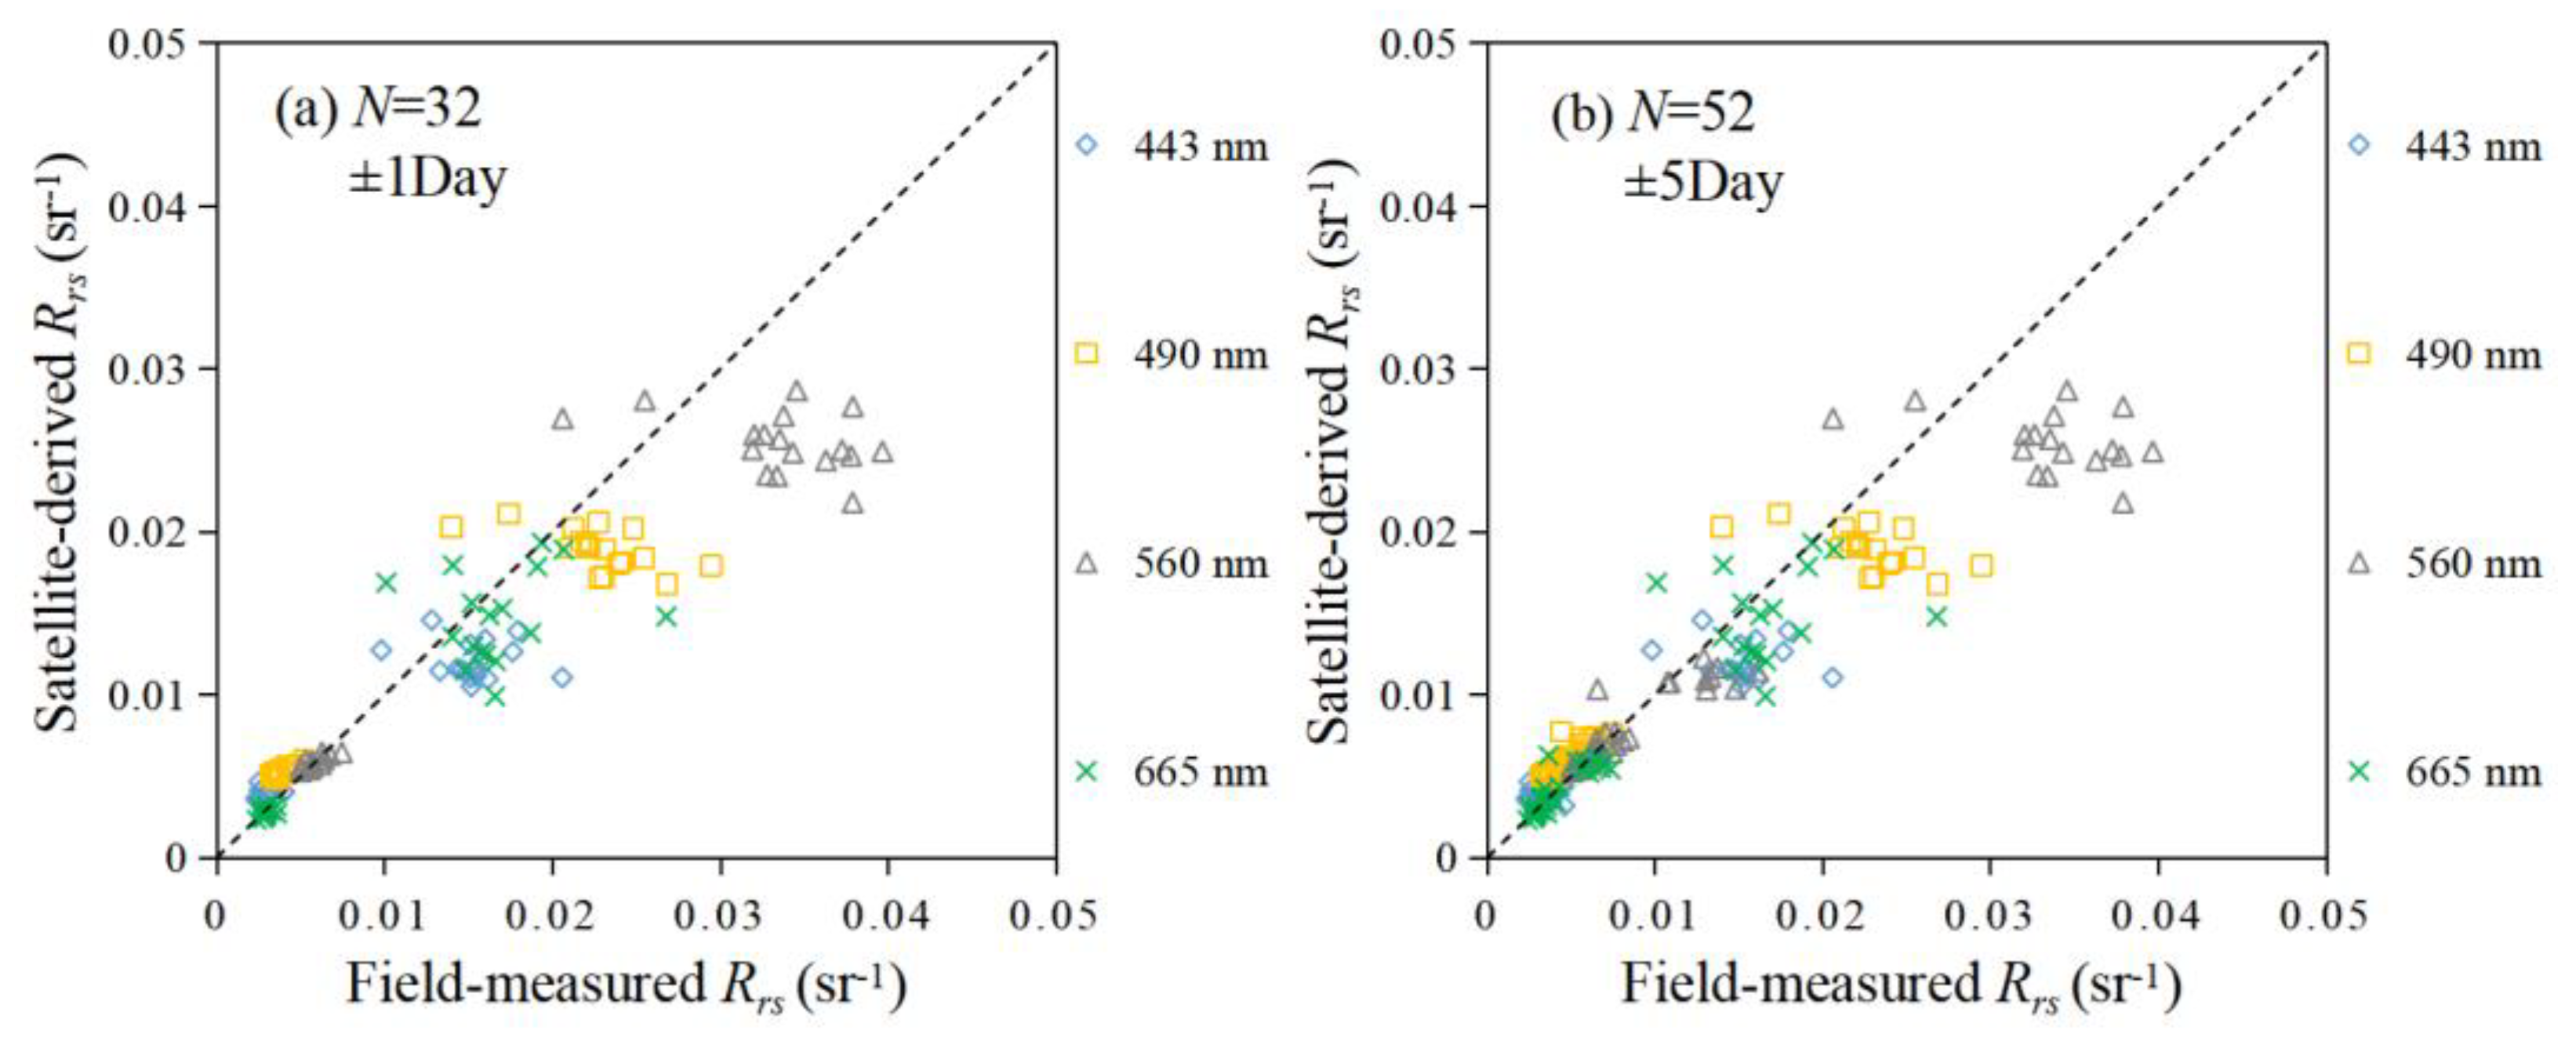
The Rrs(λ) data corrected from the Sentinel-2 MSI L2A data were validated using the quasi-synchronous in situ measured Rrs(λ) data. The in situ measured Rrs(λ) was first converted into the equivalent remote sensing reflectance of the Sentinel-2 MSI band, and then the reflectance-corrected Sentinel-2 MSI L2A data were assessed with the matched in situ data. To demonstrate the feasibility of the matched time window of ±5 days, the assessment results with a matched time window of ≤1 day were also obtained and compared to the results from the matched time window of ≤5 days. As shown in Figure 5, with time windows of ≤1 day, the Rrs(λ) derived from the Sentinel-2 data generally had good agreement with the matched in situ Rrs(λ) data in the four visible bands, where the R2 was between 0.83 and 0.91, MRE was between 15% and 32%, and RMSE was lower than 0.00005 sr−1. With a time window of ≤5 days, the results were generally consistent, with an R2 between 0.85 and 0.92, MRE between 14% and 27%, and RMSE lower than 0.00004 sr−1 (Table 2).

3.2. Validation of ZSD-QAAv6m Model

This study first used the in situ measured Rrs(λ) and ZSD data obtained for Hainan Island to evaluate the performance of the ZSD-QAAv6 and ZSD-QAAv6m models. Figure 6 shows the comparison between the ZSD obtained by Dataset I in situ measurements and the matched estimated ZSD via the Sentinel-2 satellite based on the ZSD-QAAv6 model and the ZSD-QAAv6m model. It was found that the ZSD-QAAv6m model performed better (R2 = 0.93, MRE = 12.8%, RMSE = 0.13 m), which could solve the underestimation in ZSD-QAAv6 model when ZSD is above 2 m. The performance evaluation can be explained in that, with the original threshold of Rrs(665), QAAv6 identified all samples in Dataset I as turbid water bodies, which consequently led to underestimations in the high-value ranges.
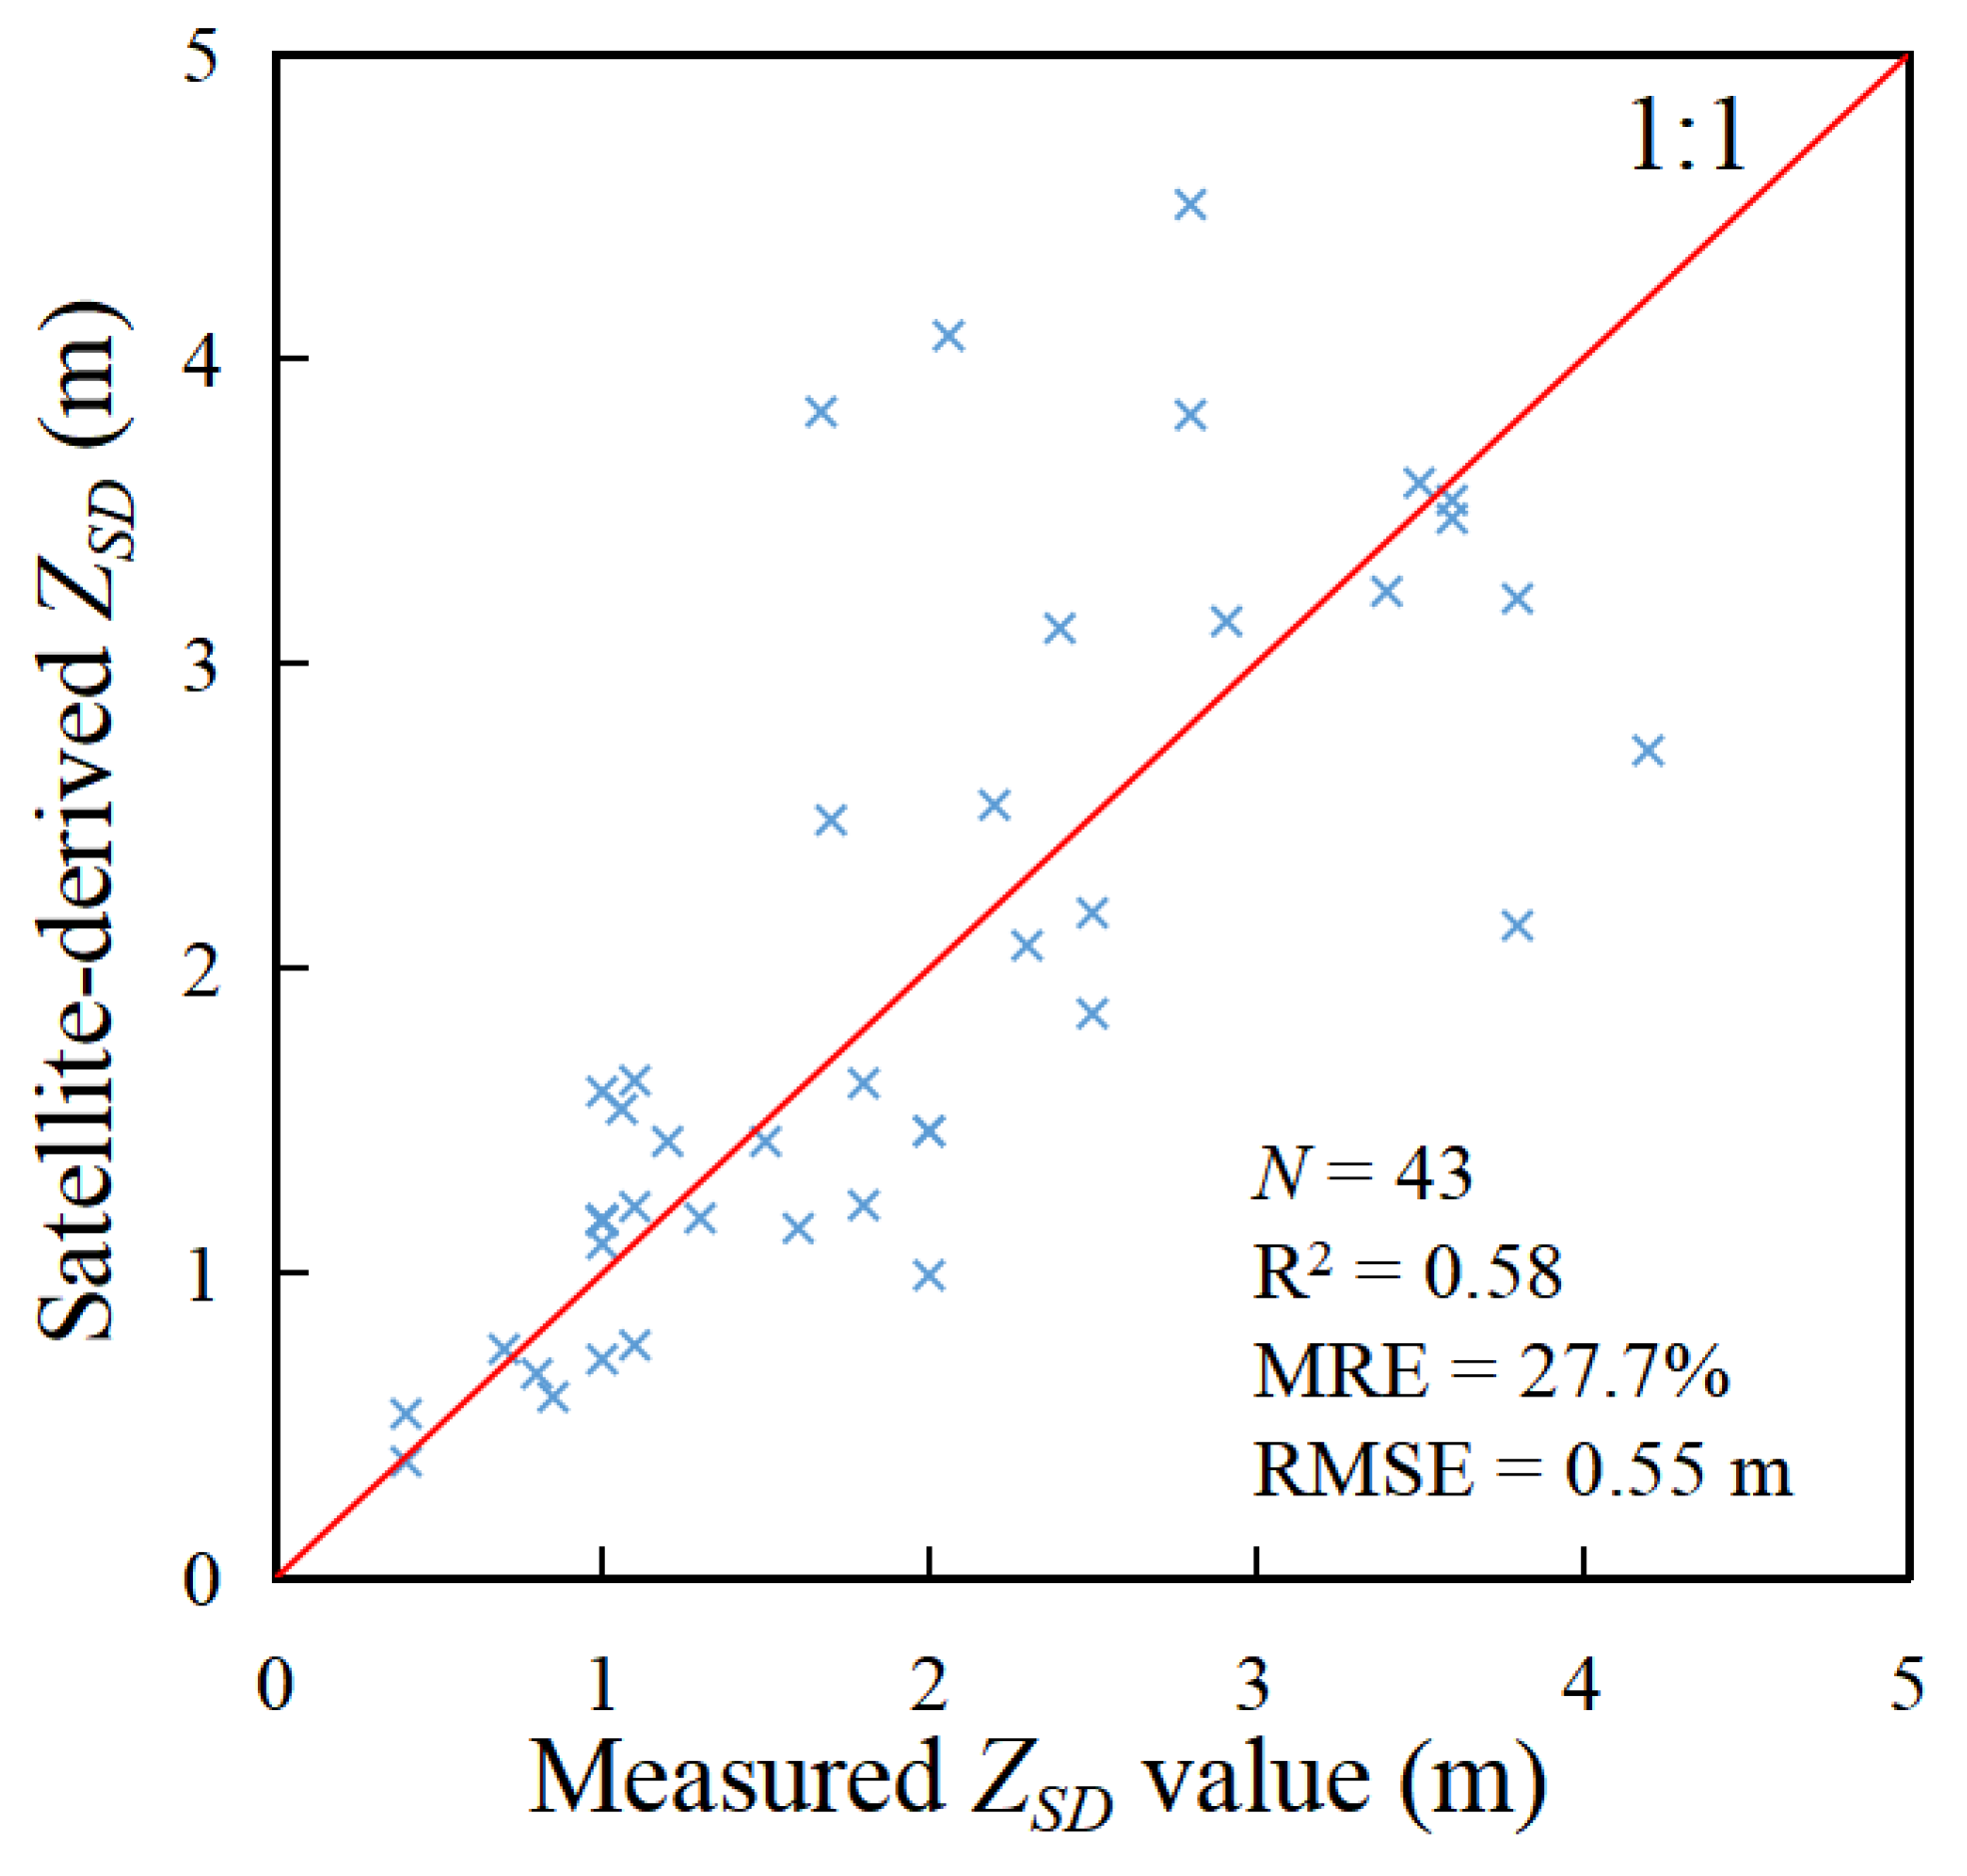
With the recalibrated thresholding value of Rrs(665) for distinguishing clear and turbid waters, the underestimation could be avoided, while MRE and RMSE were lowered from 24.8% and 0.57 m to 13.9% and 0.26 m for moderately clear waters, that is, if ZSD was above 2 m but Rrs(665) was larger than the original threshold of 0.0015 sr−1. To further test the performance of the ZSD-QAAv6m model, the satellite earth synchronization data of Dataset Ⅱ were used to test the model. Figure 7 shows the comparison between the measured ZSD data of Dataset Ⅱ and the ZSD estimated by the matched Sentinel-2 satellite. The results illustrate that the overall performance of the ZSD-QAAv6m model is good for inland waters across Hainan Island (R2 = 0.58, MRE = 27.7%, RMSE = 0.55 m).

3.3. Model Comparison

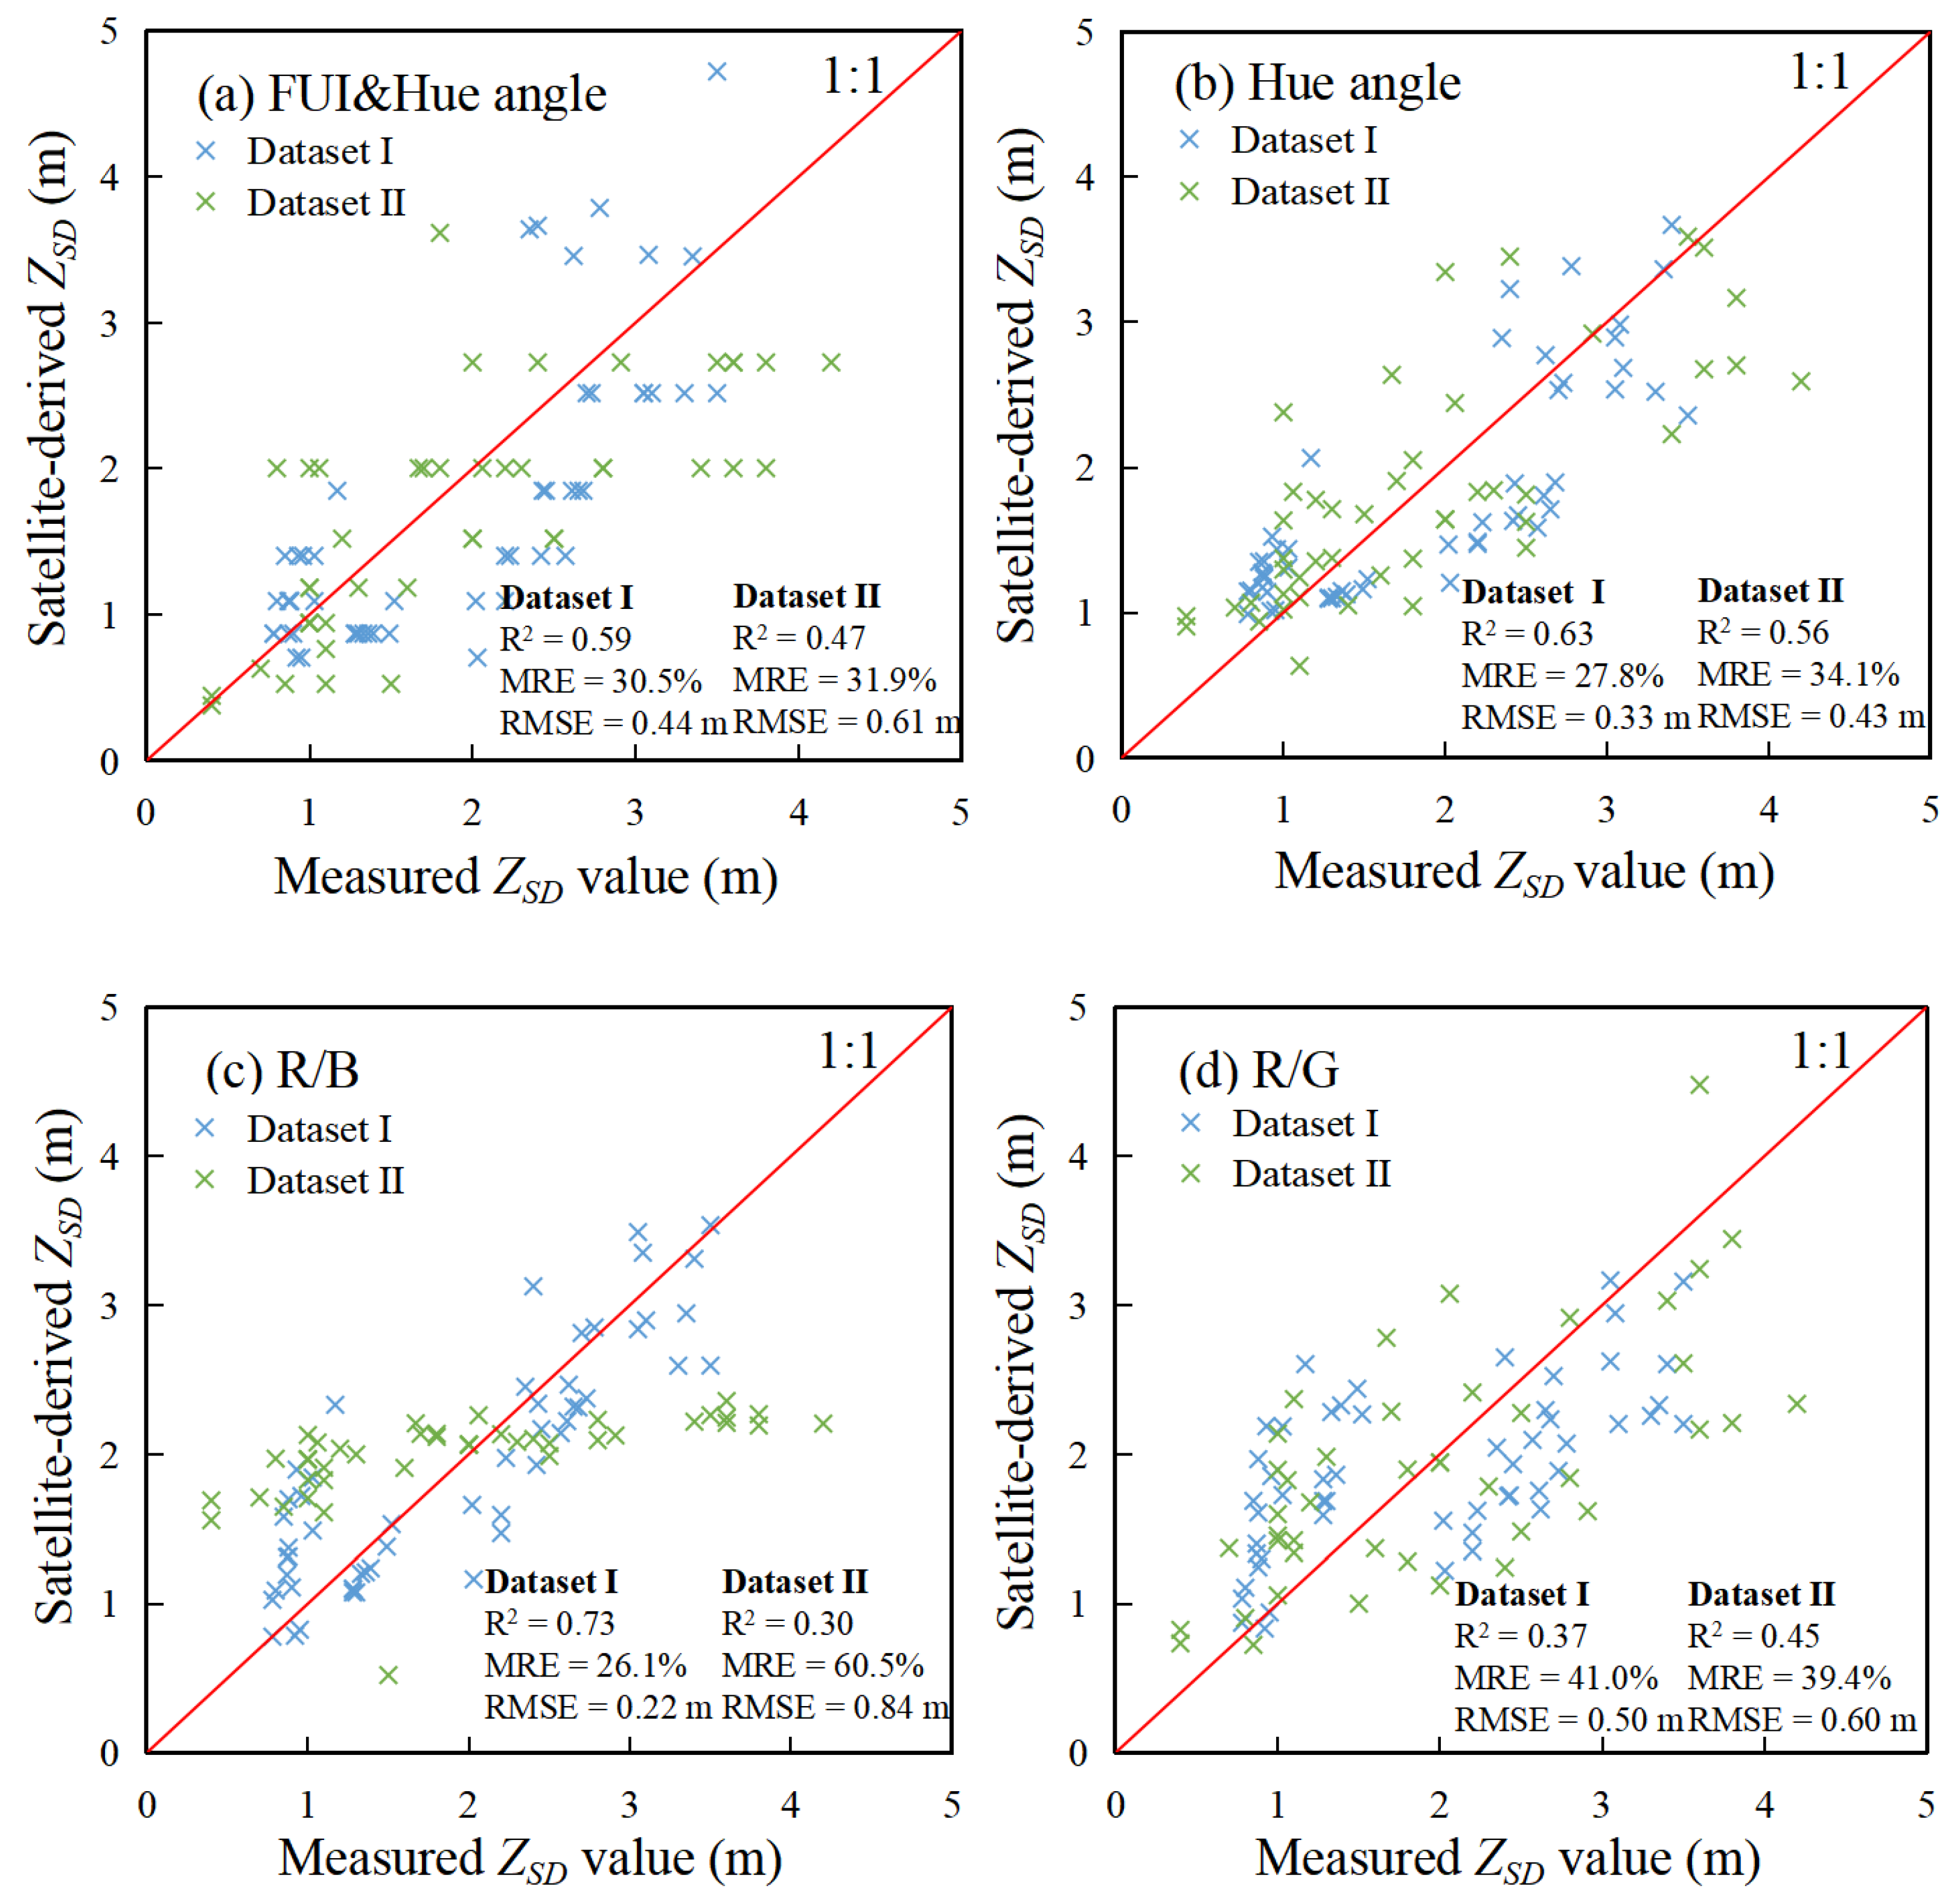
To demonstrate the applicability of the modified ZSD-QAAv6m model, this semi-analytical model was compared with four published ZSD empirical models based on in situ datasets and matched Sentinel-2 data for Hainan Island. These empirical models included band-ratio algorithms: the Red–Blue ratio model, Red–Green ratio model, and two CIE color-based algorithms, that is, the FUI & Hue-angle model and Hue-angle model [12,14,34,35,36,37]. The models were tuned and optimized using Dataset I in situ measurements and then tested using in situ measurements of ZSD in Dataset I and Dataset II and the matched Sentinel-2 data. As shown in Figure 8, the CIE color-based models generally achieved better performance than the band-ratio models, but MRE for the CIE color-based models was generally larger than 30%, and MRE for the modified ZSD-QAAv6m model was less than 30%. These results indicate that the modified ZSD-QAAv6m semi-analytical model outperformed the empirical models in ZSD retrieval for inland waters on Hainan Island using Sentinel-2 data. Thus, the ZSD-QAAv6m model was applied to map the spatiotemporal patterns of water clarity across Hainan Island.

3.4. Spatiotemporal Dynamics of Lake Clarity on Hainan Island during 2017–2021

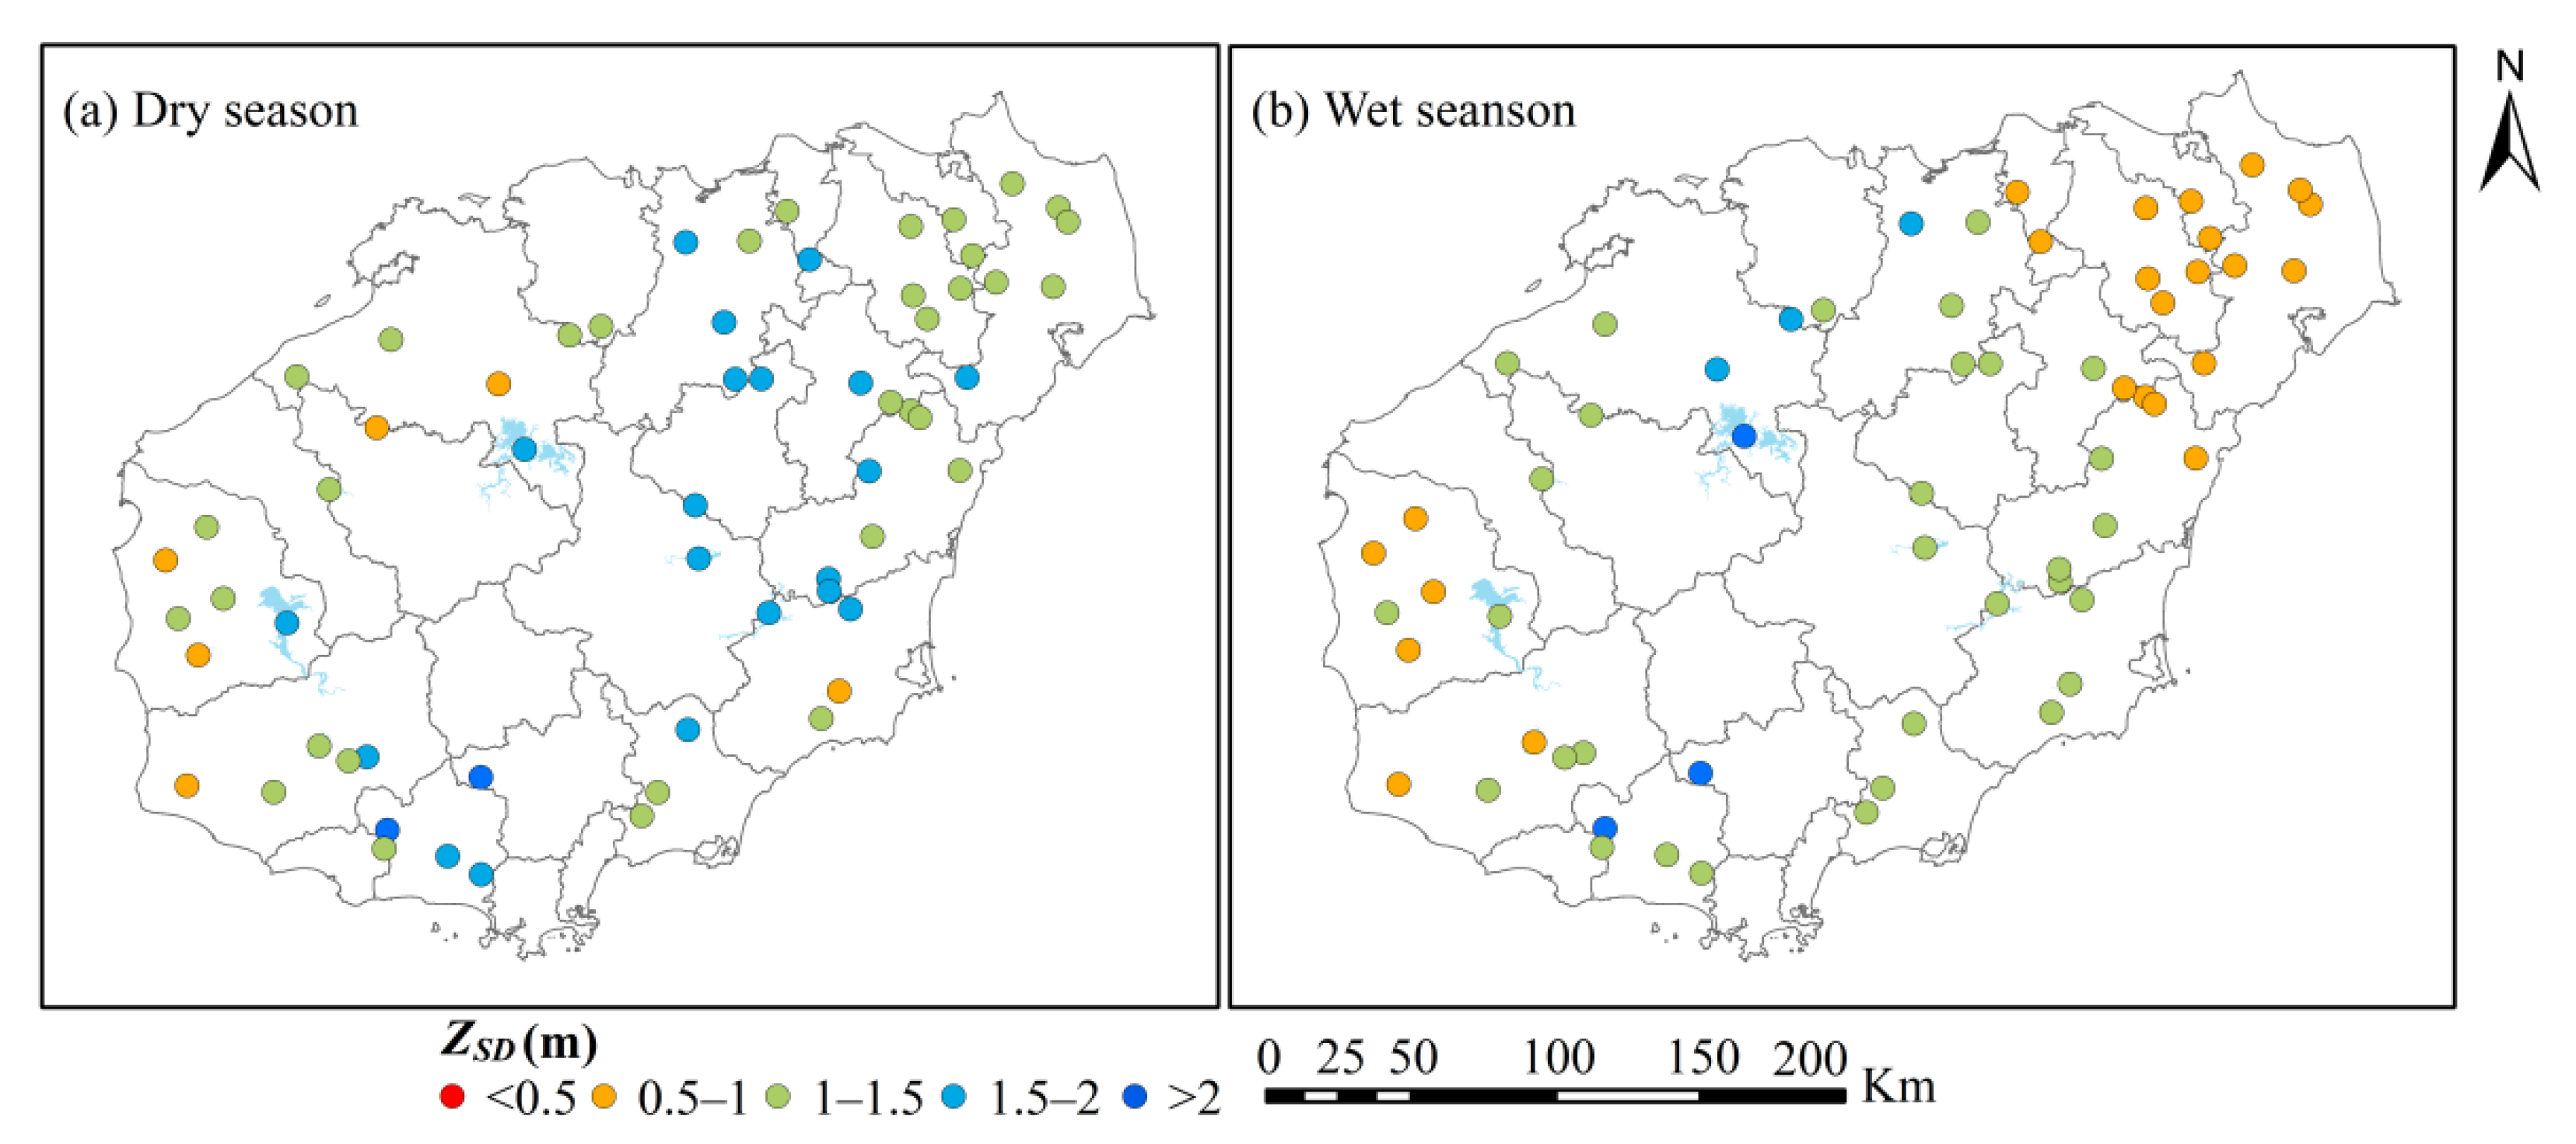
With the available Sentinel-2 MSI data from 2017–2021 on Hainan Island, the water clarity of 61 inland water bodies across the island were mapped using the proposed ZSD-QAAv6m model. To evaluate the seasonal variations, the year was divided into two seasons: wet (May–October) and dry (November to April), according to the tropical climate type of Hainan Island, where frequent rainfall occurs in the wet season and less rainfall occurs in the dry season. The climatological mean ZSD in the wet and dry seasons between 2017 and 2021 for inland waters across Hainan Island are shown in Figure 9. The results showed that 87.1% of inland water bodies on Hainan Island had higher water clarity in the dry season than in the wet season. In particular, in the northeast coastal areas (Haikou city and Wenchang city), the water clarity in the dry season is significantly higher than that in the wet season. Moreover, the proportions of water clarity across Hainan Island in dry and wet seasons from 2017–2021 were plotted and the results are shown in Figure 10; the water clarity of inland water bodies is generally higher in the dry season than in the wet season. Meanwhile, the average water clarity of water in the wet season was 1.1 m, and that in the dry season was 1.3 m. In addition, it is also shown in Figure 10 that the proportion of water bodies with higher ZSD (≥1.5 m) significantly increased, and the proportion of water bodies with lower ZSD (<0.5 m) significantly decreased from 2017 to 2021. This indicates that the water clarity in inland waters across Hainan Island improved in recent years, although the water clarity in Hainan is lower in the wet season compared with that in the dry season every year.
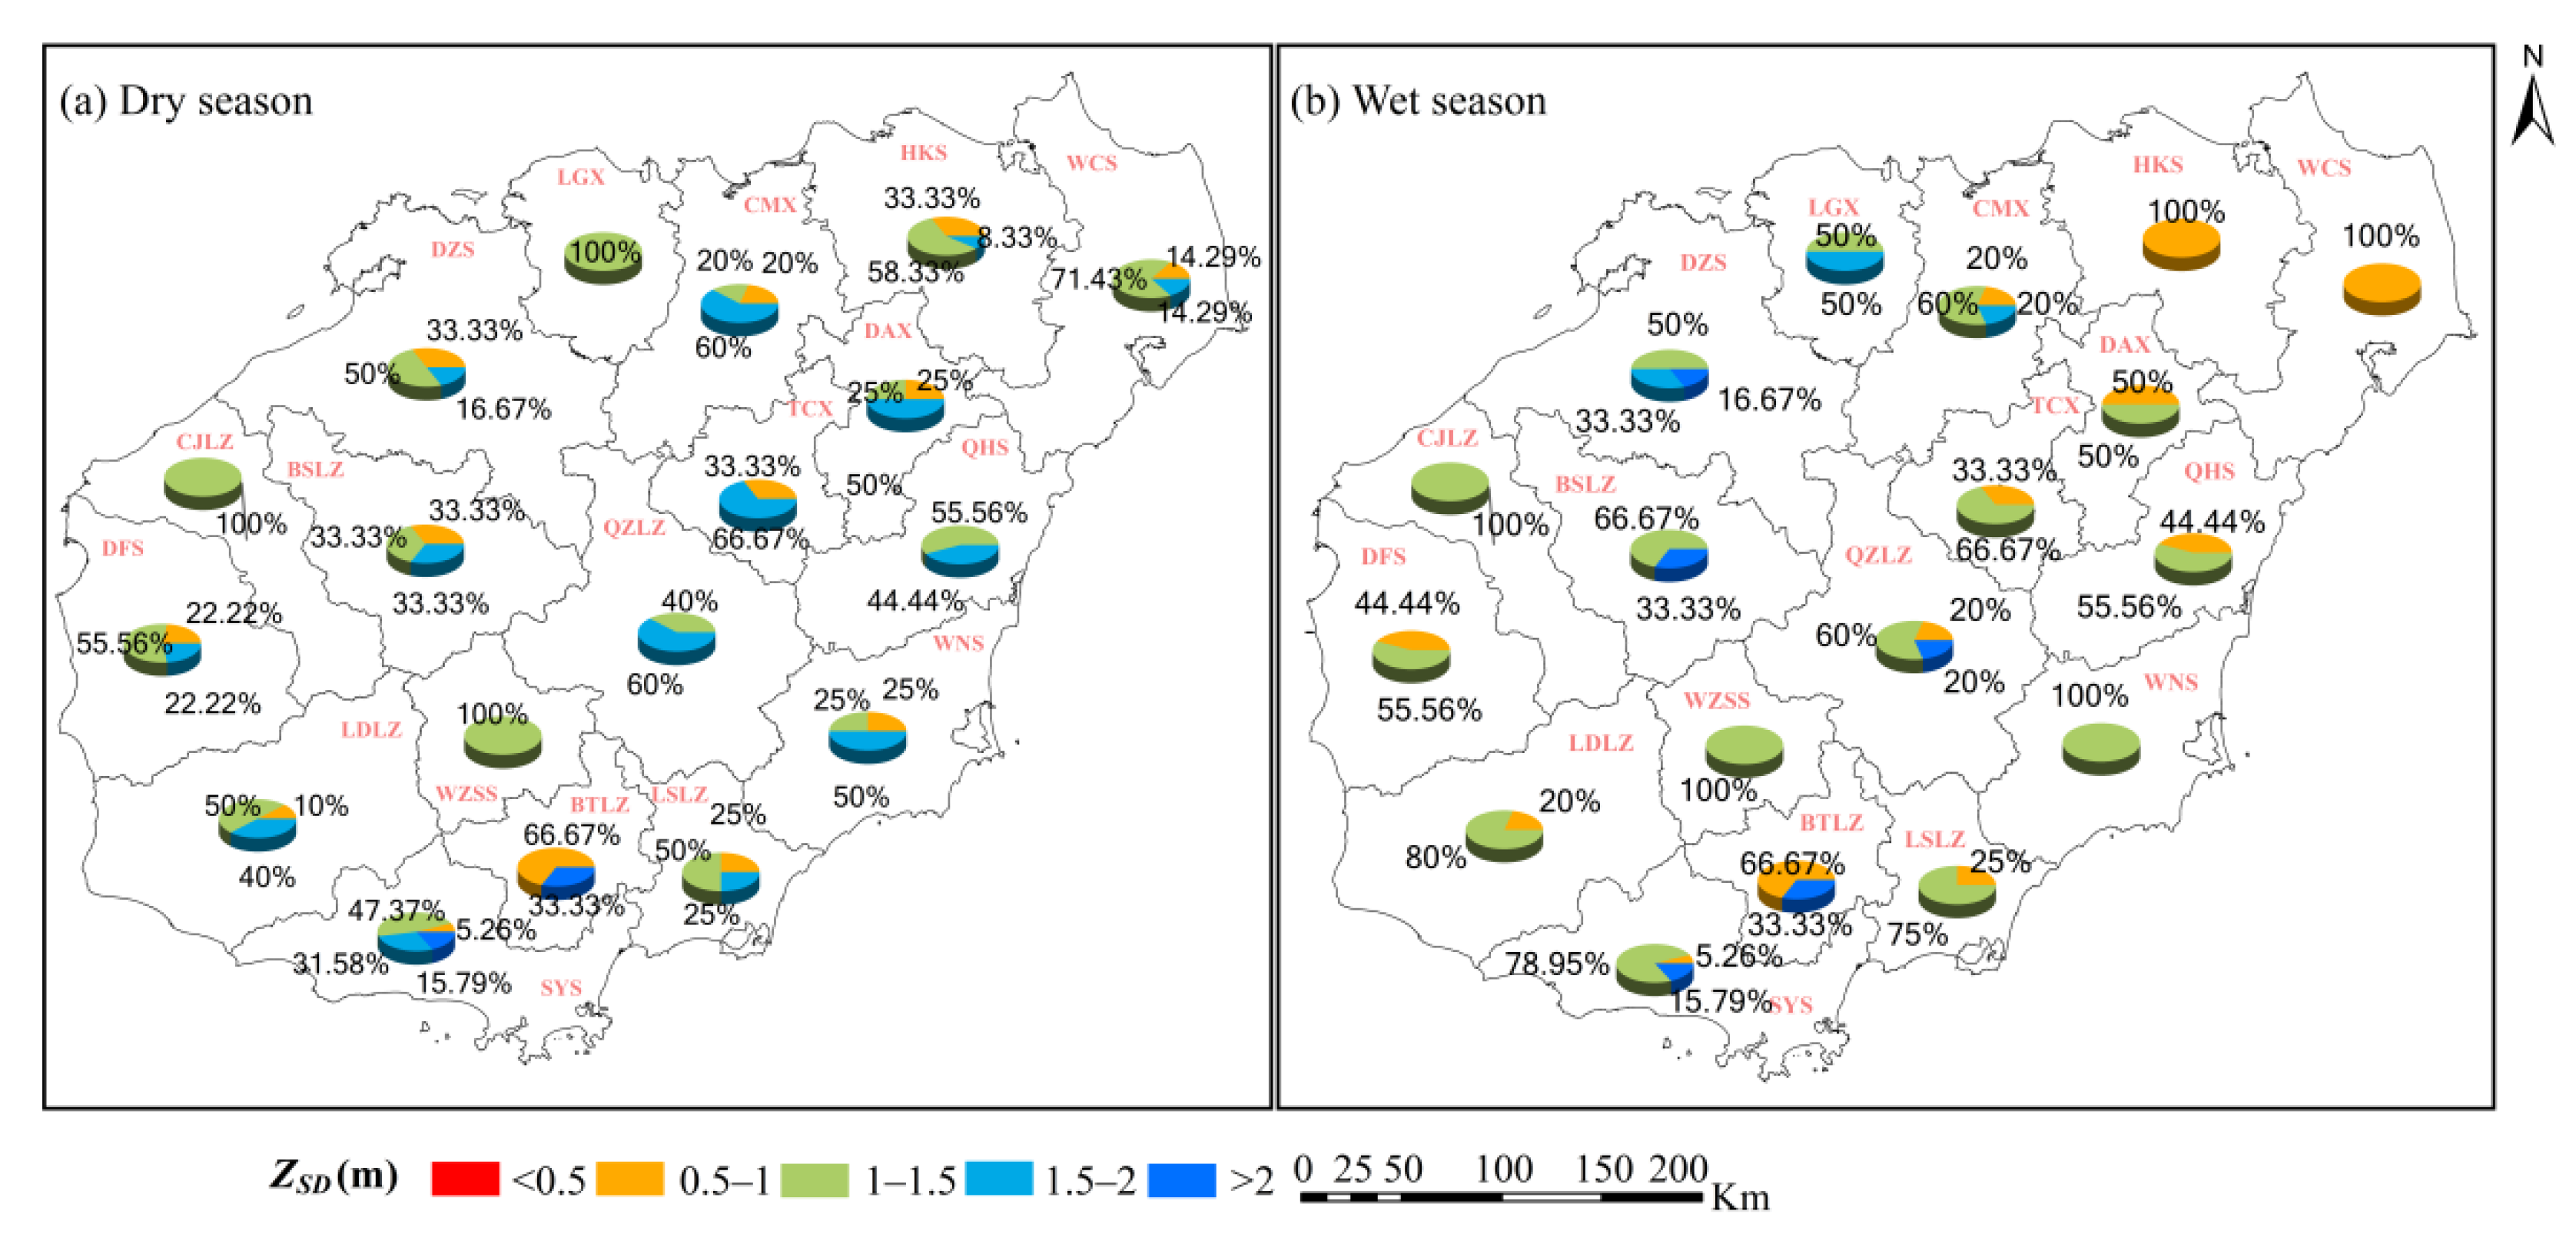
The spatial variation of water clarity was analyzed according to the administrative divisions of Hainan Island as follows: Baisha Li Autonomous County (BSLZ), Baoting Li and Miao Autonomous County (BTLZ), Changjiang Li Autonomous County (CJLZ), Chengmai County (CMX), Danzhou City (DZS), Ding’an County (DAX), Dongfang City (DFS), Haikou City (HKS), LinGao County (LGX), Ledong Li Autonomous County (LDLZ), Lingshui Li Autonomous County (LSLZ), Qionghai City (QHS), Qiongzhong Li and Miao Autonomous County (QZLZ), Sanya City (SYS), Tunchang County (TCX), Wanning City (WNS), Wenchang City (WCS), and Wuzhishan City (WZSS). Among them, BSLZ, QZLZ, WZSS, BTLZ, DAX, and TCX are located in the central region, while the remaining are in coastal regions. As shown in Figure 11, the higher water clarity was observed in the central region of Hainan Island and lower water clarity was found in the coastal regions. The average clarity of the central regions and coastal cities is respectively 1.4 m and 1.2 m. And the proportion of water bodies with clarity greater than 1 m in the northeast coastal area of the Hainan Island in the dry season is higher than that in the wet season; in the wet season, the average clarity of the water bodies in the coastal areas is basically below 1.5 m. In particular, the water clarity of Wenchang City and Haikou City is below 1 m. This may be related to the increase in rainfall in the wet season and the short-term strong rainfall brought by typhoons and land cover type.

4. Discussion

4.1. ZSD Estimation Uncertainty

Previous studies have shown that the ZSD inversion algorithm has good performance in open oceans and coastal areas (the ZSD range is 0.1–30 m) [10,16]. However, due to the complex components and bio-optical properties of inland water bodies, the application of semi-analytical algorithms to large-scale inland water bodies is still a challenge, and regional differences must also be considered [12,38]. Meanwhile, the QAAv6 algorithm, which uses the red-band threshold method to distinguish turbid and clean water bodies, has rarely been applied to large-scale inland water bodies and needs further verification and calibration [21,25]. In this study, by modifying the ZSD-QAAv6 model parameters, the ZSD-QAAv6m model showed good adaptability in diverse types of inland water bodies, thereby improving the original model’s retrieval capabilities of water clarity in moderately clean water bodies, and ultimately enhancing the performance of water clarity inversion over regional inland water bodies. However, it is noted that the in situ data acquired in this study is limited and the ZSD in this dataset is generally covarying with the total suspended matter in water. For a broader application of the semi-analytical model to inland waters, additional field data collection may help to calibrate and improve the proposed model of this study.
Another limitation is that the atmospheric correction of Sentinel-2 data may introduce some uncertainty to the retrieval of ZSD. First, this is because a more stable atmospheric correction algorithm is needed for an extensive range of complex inland water bodies. Research shows that Sen2Cor has been widely used for complex inland waters [39,40,41,42] and has shown good performance in retrieving the water reflectance of inland waters, specifically of Hainan Island (Figure 5), so the Sen2Cor algorithm was another reasonable choice for this study. However, Sen2Cor is not designed specifically for inland waters. In contrast, the ZSD retrieved by QAAv6 depends on the attenuation coefficient Kd(λ) as well as Rrs(λ), while the value of the Kd(λ) depends on a and bb calculated by QAA. The QAA algorithm for water bodies with different turbidity levels needs to change the reference wavelength to obtain more accurate a and bb. For clean water bodies with low absorption coefficients, QAAv6 is suitably applicable; however, for the more turbid inland waters, due to the high absorption coefficient, QAAv6 will lead to the estimated value of a(λ) for turbid water being too small, resulting in an error in water clarity [43]. The atmospheric correction affects the longer wavelength band, thus causing uncertainty in the retrieval of water clarity by the QAAv6 algorithm. Therefore, a more detailed atmospheric correction of Sentinel-2 data for inland waters remains to be identified in the future [40,44].
Finally, due to the frequent occurrence of cloudy weather over Hainan Island, the availability of cloud-free Sentinel-2 data is limited, which makes it difficult to accurately calculate the interannual variation ZSD from satellite data. In future studies, the uncertainties of water clarity inversion will be introduced into the spatiotemporal analysis. Consequently, by utilizing multi-source satellite data, the reliability of water clarity inversion can be improved, thereby enhancing the time-series analysis.

4.2. Environmental Factors Related to the Water Clarity Variations in the Hainan Island

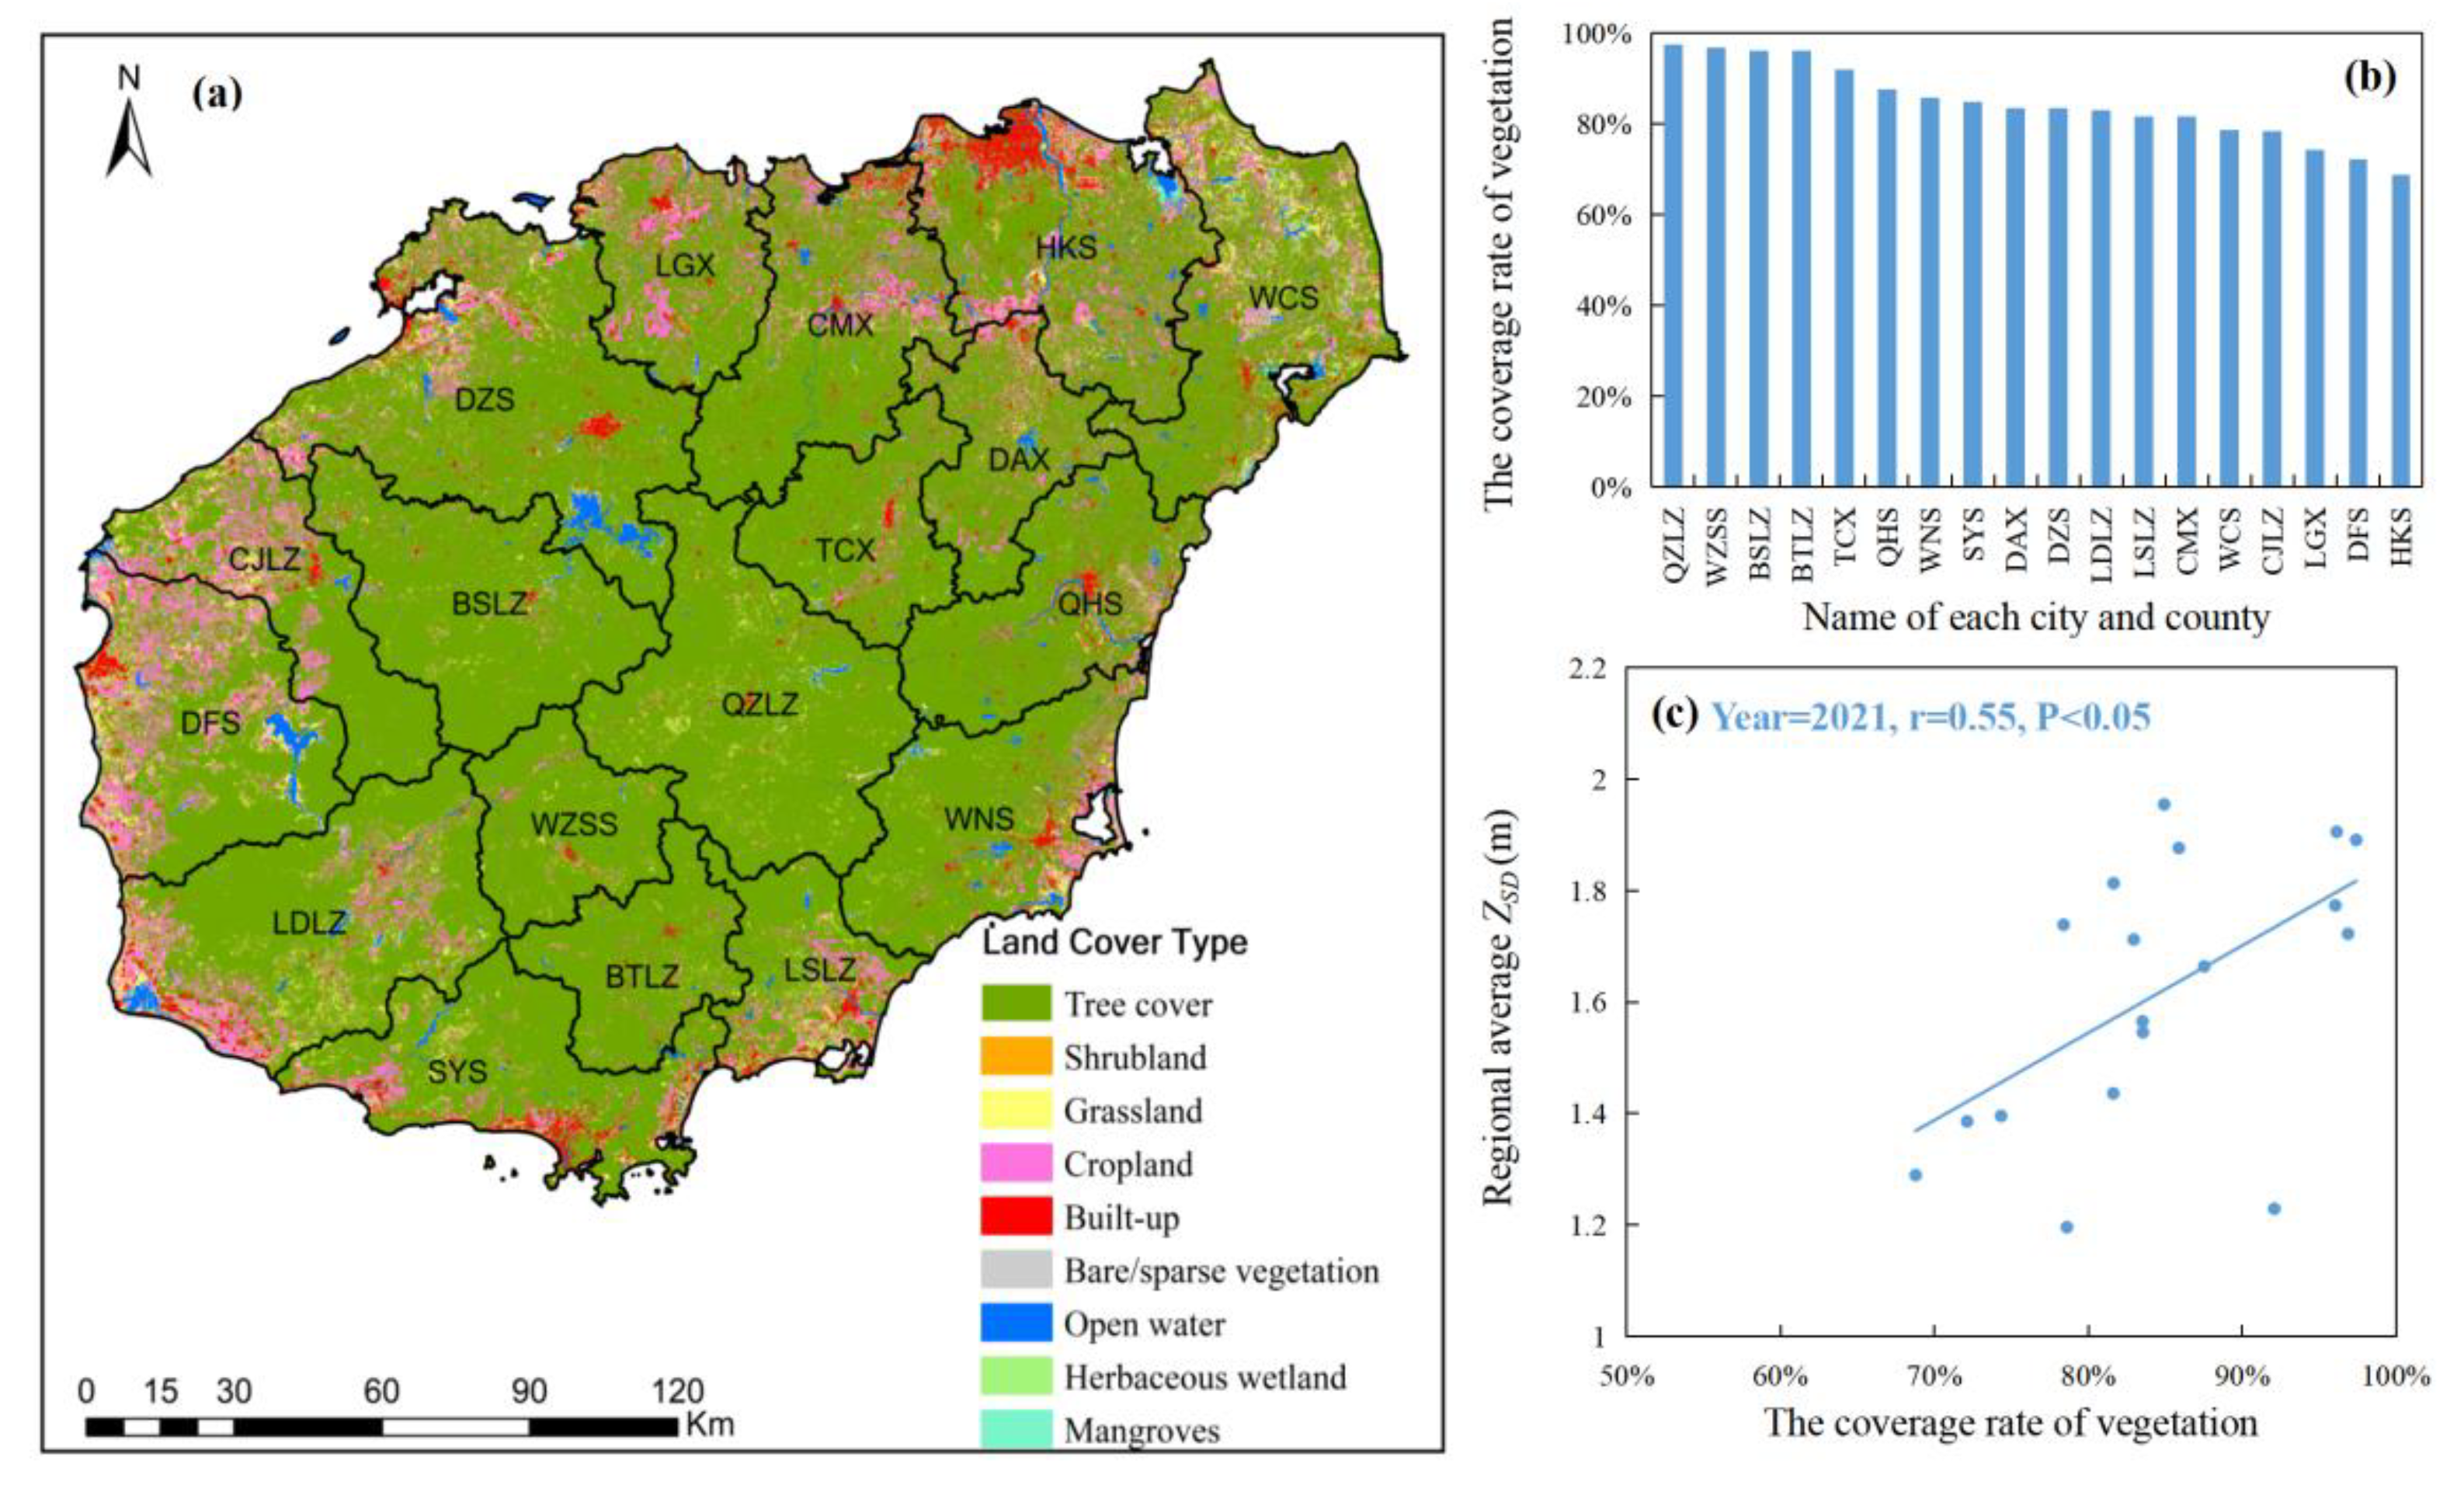
The results illustrated that the water clarity tends to be high in the middle regions of Hainan Island and low in the coastal zone. In previous studies, land cover has been recognized as a significant influencing factor to the regional water quality [45,46,47] and high vegetation cover can reduce the sediments taken by runoff to the water bodies [48,49]. Studies have shown that the land-cover type of Hainan Island is dominated by tree cover, of which tree cover area accounts for more than 93%, and the vegetation cover in central mountainous cities and counties is higher than that in coastal cities and counties [3,50]. Therefore, the correlation between vegetation cover and regional average water clarity was analyzed using the ESA land-cover product in 2021 derived from GEE [51,52]. As shown in Figure 12, the vegetation cover in the central mountainous area was over 95% and the water clarity was significantly and positively correlated with the regional vegetation cover (p < 0.05). This confirms the contribution of high vegetation cover, especially the high tree cover, to the regional water clarity on Hainan Island.
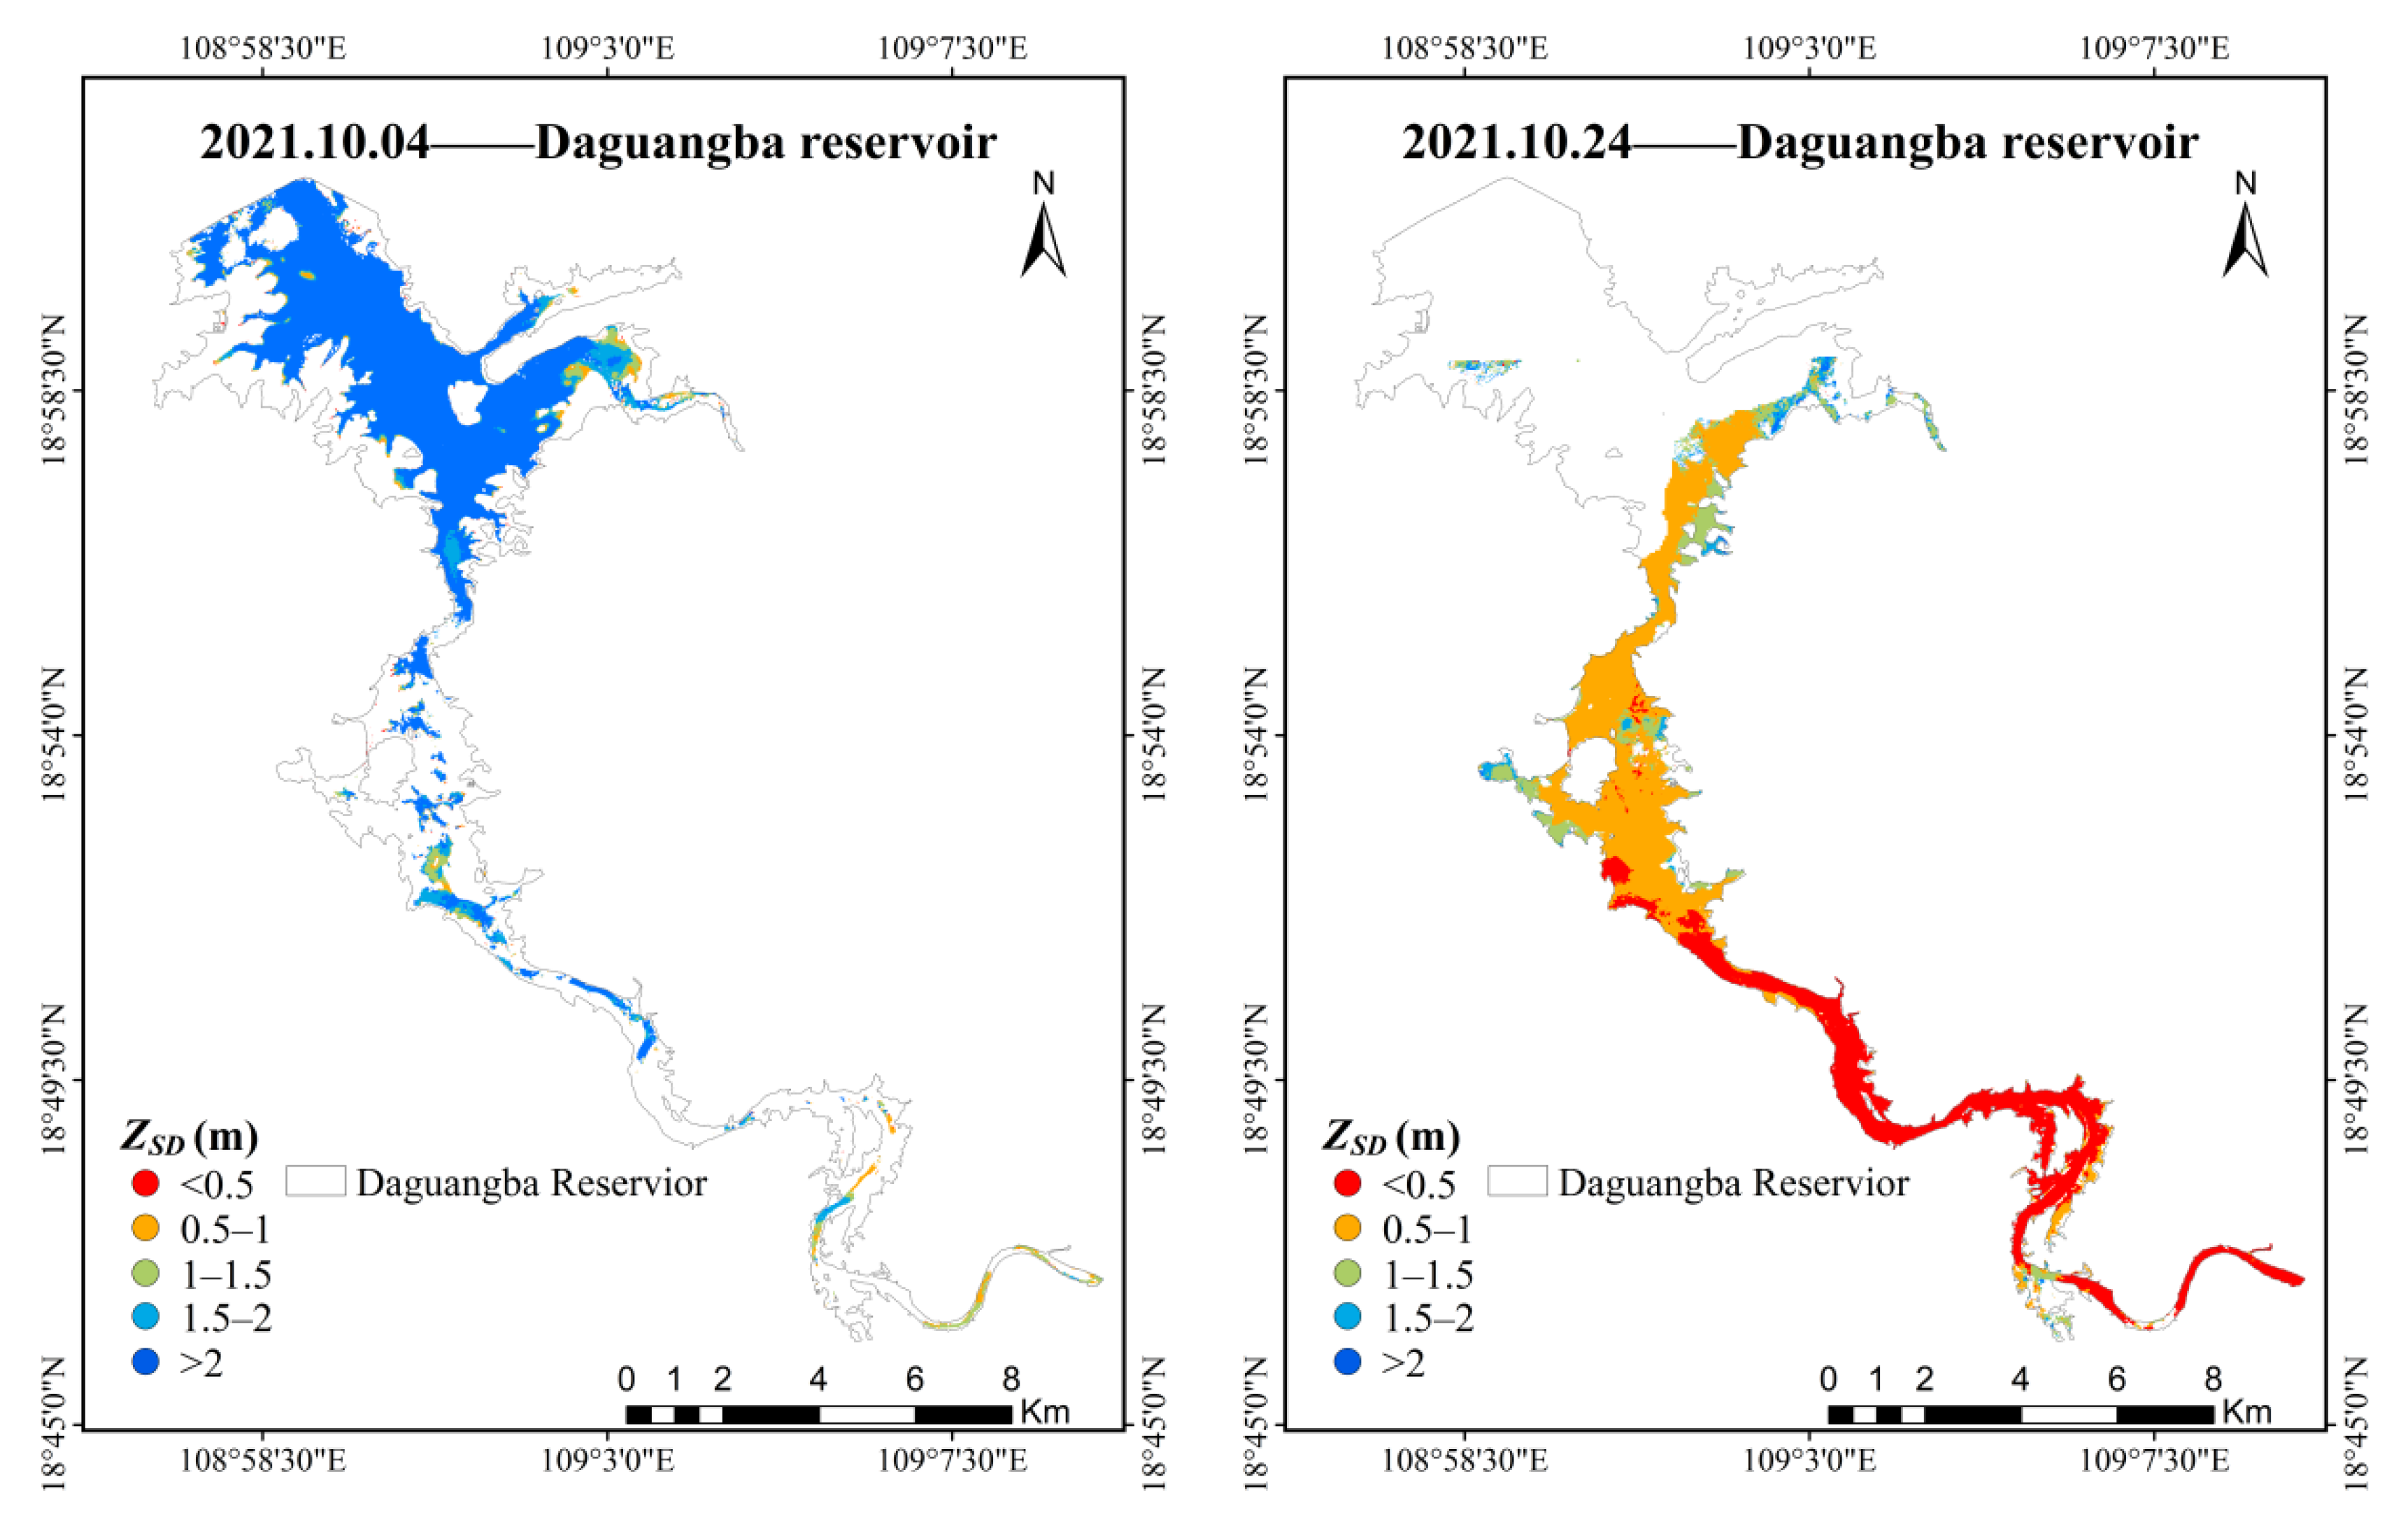
Climate factors are widely recognized as the primary driver of clarity in lakes and reservoirs. As a typical island water system, the inland water bodies of Hainan Island can be largely impacted by rainfall in the region. With heavy rainfall in the wet season, suspended matter and nutrient substances would be brought into water bodies with surface runoff [53,54,55]; therefore, the water clarity can be relatively low in this season. In contrast, the water clarity can be higher in the dry season when there is little rainfall and runoff. Moreover, due to the typical tropical island climate, the heavy rainfalls are usually accompanied by strong winds and even typhoons in the coastal regions [56]. Therefore, the inland water bodies in the surrounding coastal regions seem to be more vulnerable to rainfall, typhoons, and other climatic factors. In order to further explain the impact of typhoons on water clarity, this study analyzed the changes in water clarity before and after a typhoon. On 13 October 2021, typhoon “Kompasu”, the strongest typhoon to make landfall in Hainan Province in the last 5 years, made landfall in Qionghai City on Hainan Island. Given the typhoon path released by the Hainan Meteorological Information Service Website, the Daguangba Reservoir was used as an example to show the spatial variation of the water clarity in this reservoir before and after the typhoon. As shown in Figure 13, the water clarity of the Daguangba Reservoir decreased significantly after the typhoon. By mixing the water body and bringing in sediments through heavy rainfall, the typhoon caused an obvious decrease in water clarity of the water body.
In terms of the yearly pattern, this study found that the water clarity of inland water bodies on Hainan Island gradually increased between 2017 and 2021. This result is consistent with the results from the Hainan Ecological and Environment Bulletin (http://hnsthb.hainan.gov.cn/hjzl/hjzlxx/hjzkgb_51008/, accessed on 15 September 2022). But there was no obvious change in meteorological factors (precipitation, temperature, wind speed) during that period. However, it is noted that Hainan Province has intensified the efforts to protect the water environment in recent years, particularly after 2018 [57,58]. In this case, human activities may have played an important role in impacting the water clarity change of inland water bodies on Hainan Island during the past 5 years. The monthly water quality report of urban rivers and lakes in Hainan Province also confirmed the positive effect of the relevant policies issued by Hainan Province since 2018 in strengthening the environmental protections and surface water treatments, such as the "Three Year Action Plan for the Treatment of Polluted Water Bodies".

4.3. Implications for the SDG 6.3.2 Evaluation

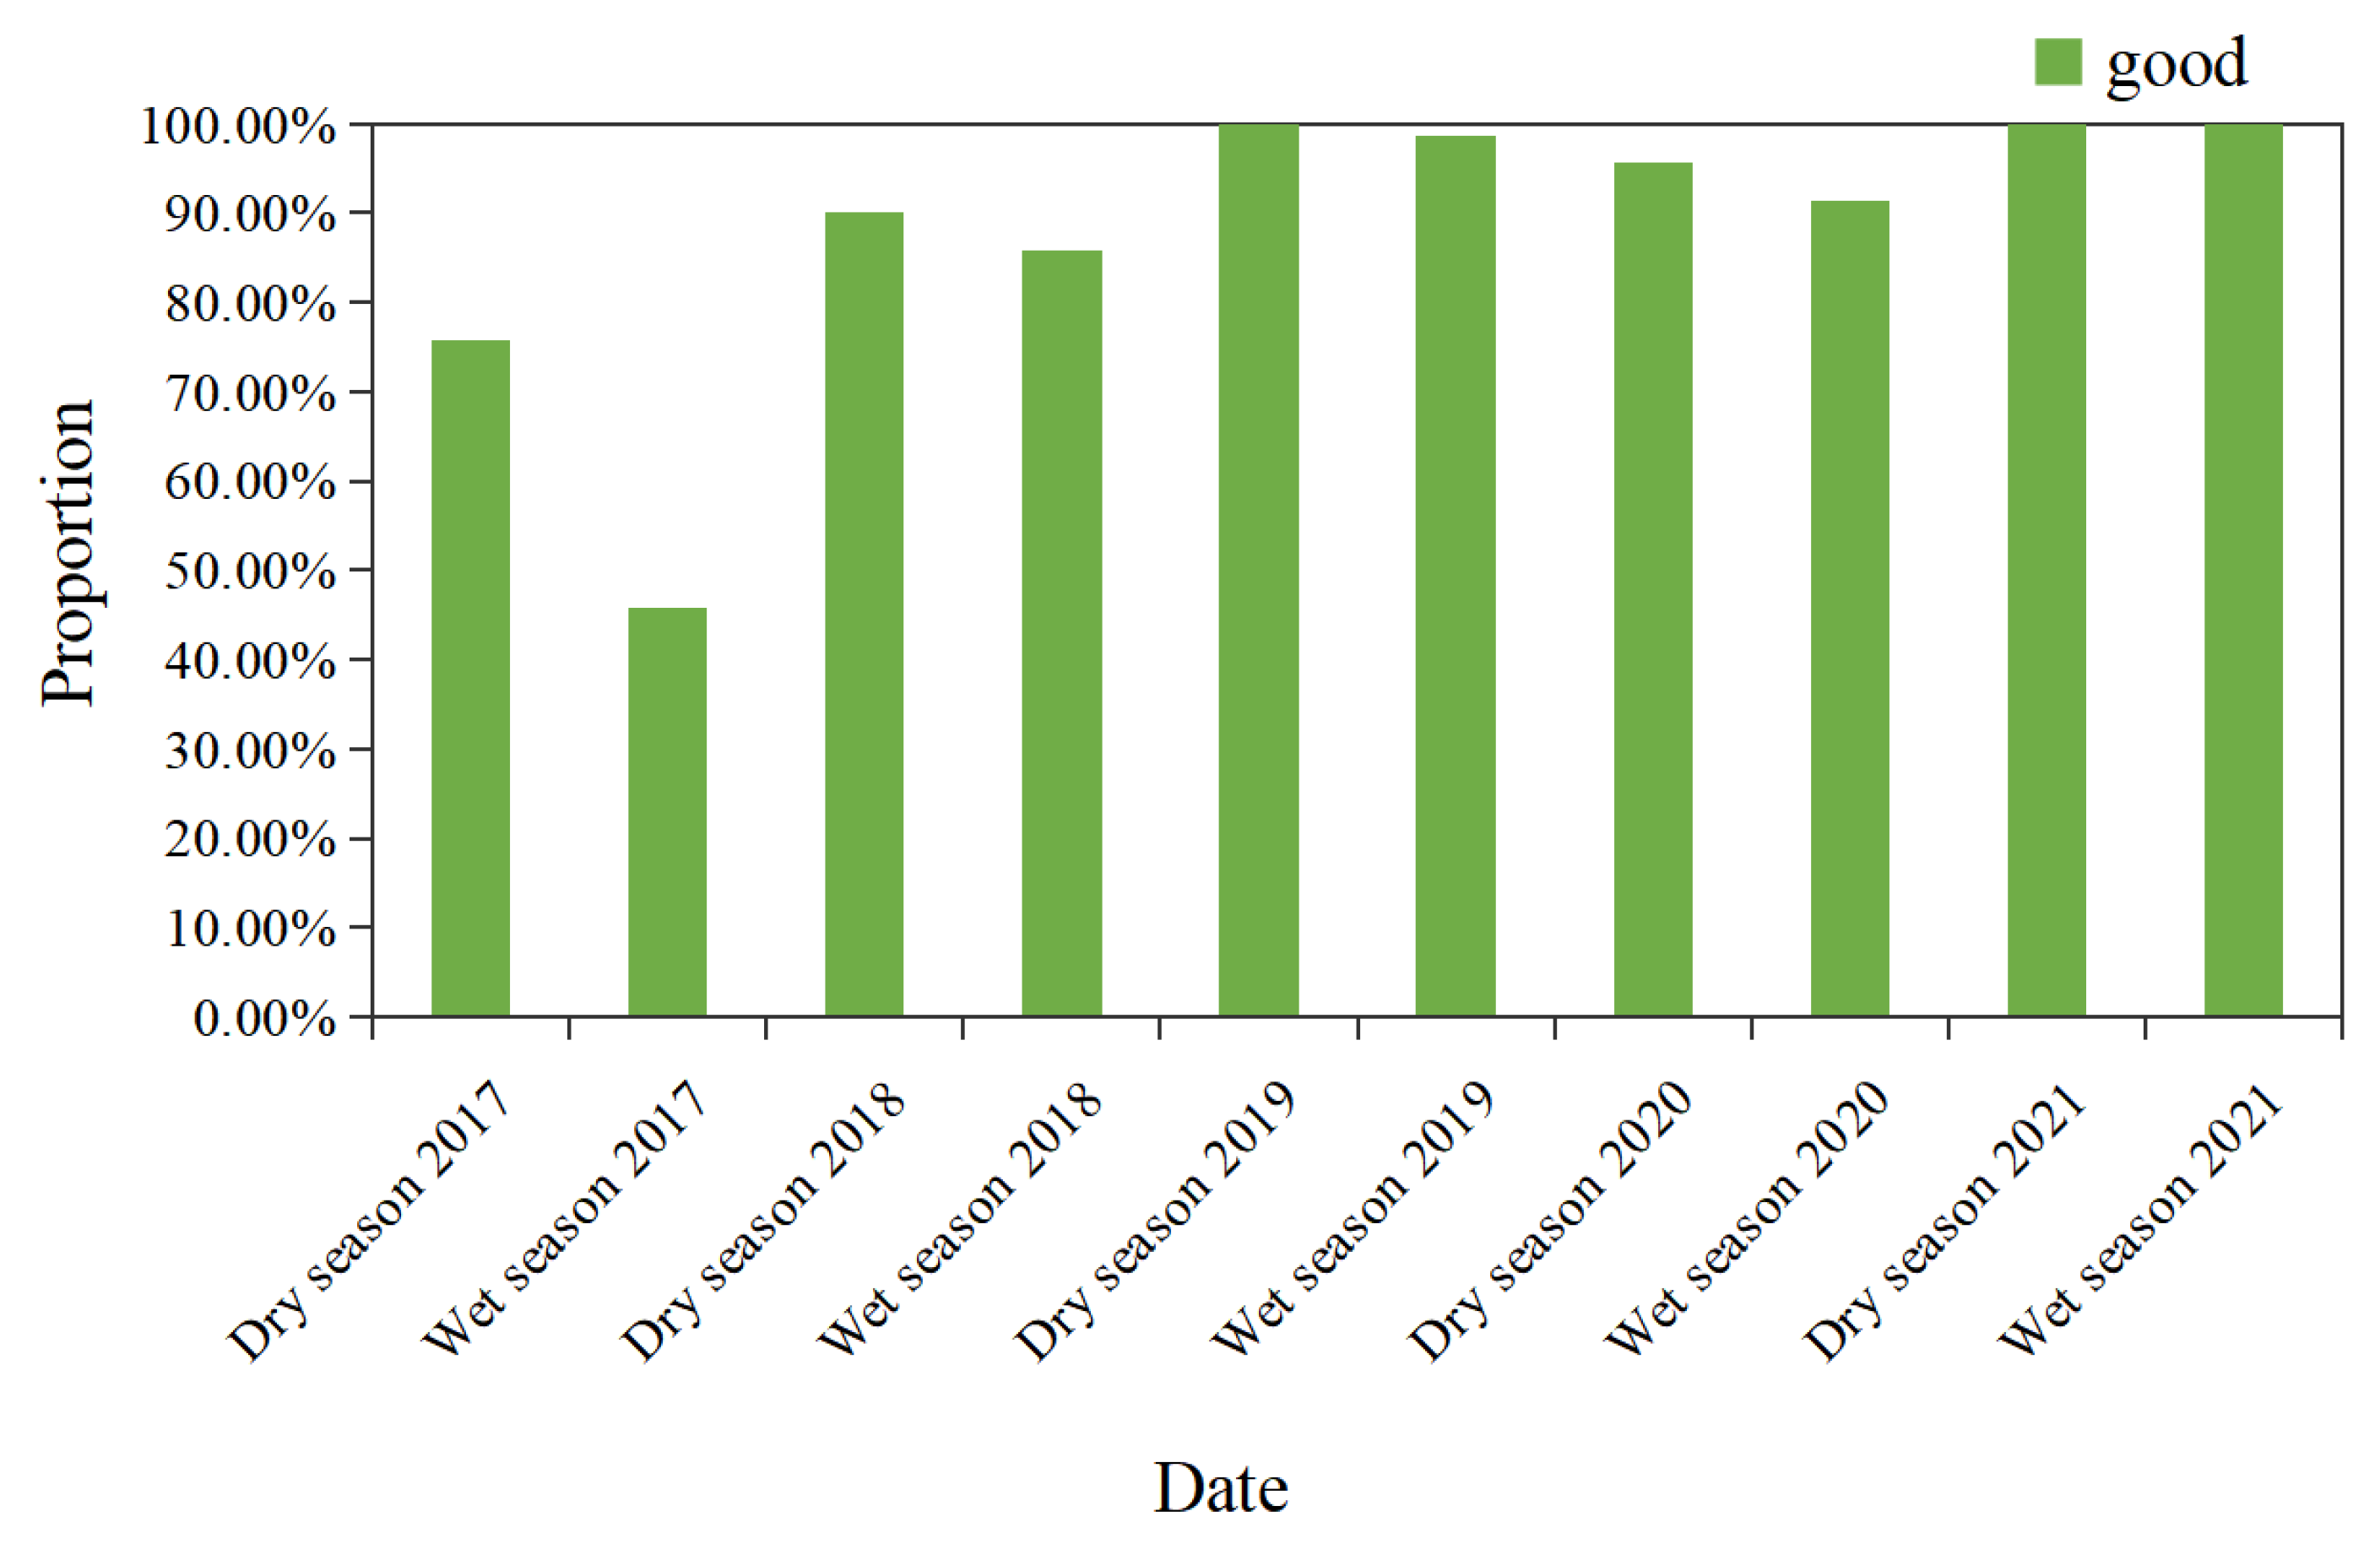
ZSD is an important and comprehensive optical water quality parameter, which reflects the cleanness of water bodies and the overall water quality to a certain extent [59,60]. In the UN SDG 6, the indicator of SDG 6.3.2 is “the proportion of water bodies with good ambient water quality” [6]. Therefore, the water clarity retrieved by Sentinel-2 data can be used to evaluate water quality, as it can be satisfactorily estimated with satellite data [11,37]. Here, water bodies with average water clarity larger than 0.5 m were identified as having good ambient water quality, because that value is usually regarded as a simple criterion for assessing eutrophic state in inland waters [61]. Therefore, the proportion of water bodies with good water quality in the Hainan Island was evaluated from 2017–2021 using the satellite-derived water clarity data. As shown in Figure 14, the results indicate that the proportion of water bodies with good water quality on Hainan Island was relatively low in 2017 (~75% in the dry season and ~45% in the wet season). After 2018, there was a significant increase in the proportion of water bodies with good water quality on Hainan Island. By 2021, the proportion of water bodies with good water quality in the dry and wet seasons had reached 100%. This indicates that the overall water quality of inland water bodies on Hainan Island improved from 2017–2021.

5. Conclusions

In this study, the water clarity of lakes and reservoirs larger than 1 km2 on Hainan Island was derived using Sentinel-2 MSI data. First, the Sentinel-2 MSI Level-2A data were corrected and evaluated to derive the Rrs over inland waters in the Hainan Island. Then, the semi-analytical ZSD model based on QAAv6 was tested and calibrated to cope with the underestimations in moderately clear waters. A modified semi-analytical ZSD retrieval scheme, named ZSD-QAAv6m, was proposed, where the threshold value of Rrs(665) in the QAAv6 model for classifying turbid and clear waters was changed to 0.005 from 0.0015 sr−1. With the new scheme, ZSD was better retrieved with Sentinel-2 MSI data with MRE values less than 30%. Furthermore, compared with other empirical ZSD models, the ZSD-QAAv6m model produced superior performance and demonstrated the capacity of the semi-analytical model to retrieve water quality parameters for regional inland water bodies. Finally, the water clarity of more than 60 inland water bodies on Hainan Island from 2017–2021 was derived and analyzed. The water clarity generally improved from 2017–2021, with the quality lower in the wet season and higher in the dry season. Spatially, it was found the water clarity of Inland waters in central regions was generally higher than that in the coastal regions. The spatiotemporal variations in water clarity are likely related to the distinct climate type and water system distribution of the island and can also be attributed to strengthened water protection measures recently applied in the Hainan Province. In addition, the satellite-derived water clarity results were further applied in the evaluation of SDG 6.3.2 for the past 5 years on Hainan Island.
This paper is the first to use satellite remote sensing data from Sentinel-2 MSI and a semi-analytical algorithm to approach water quality studies and SDG indicator evaluation in island regions. In spite of the advantages, there are still some limitations with respect to using clarity to assess the water quality of inland water bodies. As the single indicator of water clarity used to assess water cleanliness, ZSD may not comprehensively reflect the condition of water quality, thus a more integrated water quality assessment using satellite remote sensing technology remains to be explored. In addition, the modified ZSD-QAAv6m model was fitted by using inland water data from Hainan Island, hence there is still a need to optimize the water body classification scheme in the QAAv6 model with a large amount of in situ measured datasets for a wider application.

Author Contributions

Conceptualization, R.Q., S.W. and J.L.; methodology, R.Q. and S.W.; validation, R.Q., W.Z. and F.Z.; investigation, W.Z. and W.S.; data curation, R.Q.; writing—original draft preparation, R.Q.; writing—review and editing, R.Q. and S.W.; visualization, F.Z. and J.S.; supervision, S.W. and J.L.; project administration, S.W. and J.L. All authors have read and agreed to the published version of the manuscript.

Funding

This research has been jointly sponsored by the Director Fund of the International Research Center of Big Data for Sustainable Development Goals (Grant No. CBAS2022DF004), the National Natural Science Foundation of China (Grant No. 41901272), the Hainan Provincial Department of Science and Technology (Grant No. ZDKJ2019006), and the Dragon 5 Cooperation (No. 59193).

Data Availability Statement

Not applicable.

Acknowledgments

The authors would like to thank the European Space Agency for providing the Sentinel-2 MSI data.

Conflicts of Interest

The authors declare no conflict of interest.

References

  1. Zhou, Z.G. Present Situation and Development and Utilization of Water Resources in Hainan Province. J. Econ. Water Resour. 2004, 22, 35–38. [Google Scholar]
  2. Xiang, X.M. A preliminary study on the basic characteristics of water resources in Hainan Island and the main factors affecting sustainable development. J. Hainan Norm. Univ. Nat. Sci. 2007, 20, 80–83. [Google Scholar]
  3. Li, W.G.; Zhang, J.H.; Liu, S.J.; Che, X.; Chen, X.; Zou, H. Meteorological characteristics and monitoring index of drought in Hainan Island. J. Trop. Biol. 2022, 13, 324–330. [Google Scholar]
  4. Pelling, M.; Uitto, J.I. Small island developing states: Natural disaster vulnerability and global change. Glob. Environ. Change Part B Environ. Hazards 2001, 3, 49–62. [Google Scholar] [CrossRef]
  5. Falkland, A. Tropical island hydrology and water resources current knowledge and future needs. Hydrol. Water Manag. Humid Trop. 2002, 237. [Google Scholar]
  6. UN. Transforming our World: The 2030 Agenda for Sustainable Development; United Nations: New York, NY, USA, 2015. [Google Scholar]
  7. Carlson, R.E. A trophic state index for lakes. Limnol. Oceanogr. 1977, 22, 361–369. [Google Scholar] [CrossRef] [Green Version]
  8. Zhang, X.Q. Seawater transparence. Trans. Oceanol. Limnol. 1982, 14–18. [Google Scholar]
  9. Wernand, M.R. On the history of the Secchi disc. J. Eur. Opt. Soc. Rapid Publ. Eur. 2010, 5. [Google Scholar] [CrossRef] [Green Version]
  10. Lee, Z.P.; Shang, S.L.; Qi, L.; Jiang, Y.; Gong, L. A semi-analytical scheme to estimate Secchi-disk depth from Landsat-8 measurements. Remote Sens. Environ. 2016, 177, 101–106. [Google Scholar] [CrossRef]
  11. Shen, M.; Duan, H.T.; Cao, Z.G.; Xue, K.; Qi, T.C.; Ma, J.G.; Liu., D.; Song, K.S.; Huang, C.L.; Song, X.Y. Sentinel-3 OLCI observations of water clarity in large lakes in eastern China: Implications for SDG 6.3. 2 evaluation. Remote Sens. Environ. 2020, 247, 111950. [Google Scholar] [CrossRef]
  12. Ren, J.L.; Zheng, Z.B.; Li, Y.M.; Lu, G.N.; Wang, Q.; Lyu, H.; Huang, C.C.; Liu, G.; Du, C.G.; Mu, M.; et al. Remote observation of water clarity patterns in Three Gorges Reservoir and Dongting Lake of China and their probable linkage to the Three Gorges Dam based on Landsat 8 imagery. Sci. Total Environ. 2018, 625, 1554–1566. [Google Scholar] [CrossRef]
  13. Shi, K.; Zhang, Y.L.; Zhu, G.W.; Qin, B.Q.; Pan, D.L. Deteriorating water clarity in shallow waters: Evidence from long term MODIS and in-situ observations. Int. J. Appl. Earth Obs. Geoinf. 2018, 68, 287–297. [Google Scholar] [CrossRef]
  14. Song, K.S.; Liu, G.; Wang, Q.; Wen, Z.D.; Lyu, L.L.; Du, Y.X.; Sha, L.W.; Fang, C. Quantification of lake clarity in China using Landsat OLI imagery data. Remote Sens. Environ. 2020, 243, 111800. [Google Scholar] [CrossRef]
  15. Liu, D.; Duan, H.T.; Loiselle, S.; Hu, C.M.; Zhang, G.Q.; Li, J.L.; Yang, H. Observations of water transparency in China’s lakes from space. Int. J. Appl. Earth Obs. Geoinf. 2020, 92, 102187. [Google Scholar] [CrossRef]
  16. Lee, Z.P.; Shang, S.L.; Hu, C.M.; Du, K.P.; Weidemann, A.; Huo, W.L.; Lin, J.F.; Lin, G. Secchi disk depth: A new theory and mechanistic model for underwater visibility. Remote Sens. Environ. 2015, 169, 139–149. [Google Scholar] [CrossRef] [Green Version]
  17. Shang, S.L.; Lee, Z.P.; Shi, L.H.; Lin, G.; Wei, G.M.; Li, X.D. Changes in water clarity of the Bohai Sea: Observations from MODIS. Remote Sens. Environ. 2016, 186, 22–31. [Google Scholar] [CrossRef] [Green Version]
  18. Feng, L.; Hou, X.J.; Zheng, Y. Monitoring and understanding the water transparency changes of fifty large lakes on the Yangtze plain based on long-term MODIS observations. Remote Sens. Environ. 2019, 221, 675–686. [Google Scholar] [CrossRef]
  19. Liu, X.; Lee, Z.P.; Zhang, Y.; Lin, J.; Shi, K.; Zhou, Y.; Qin, B.; Sun, Z. Remote sensing of secchi depth in highly turbid lake waters and its application with MERIS data. Remote Sens. 2019, 11, 2226. [Google Scholar] [CrossRef] [Green Version]
  20. Vundo, A.; Matsushita, B.; Jiang, D.; Gondwe, M.; Hamzah, R.; Setiawan, F.; Fukushima, T. An Overall Evaluation of Water Transparency in Lake Malawi from MERIS Data. Remote Sens. 2019, 11, 279. [Google Scholar] [CrossRef] [Green Version]
  21. Yin, Z.Y.; Li, J.S.; Liu, Y.; Xie, Y.; Zhang, F.F.; Wang, S.L.; Sun, X.; Zhang, B. Water clarity changes in Lake Taihu over 36 years based on Landsat TM and OLI observations. Int. J. Appl. Earth Obs. Geoinf. 2021, 102, 102457. [Google Scholar] [CrossRef]
  22. Somasundaram, D.; Zhang, F.F.; Ediriweera, S.; Wang, S.L.; Yin, Z.Y.; Li, J.S.; Zhang, B. Patterns, Trends and Drivers of Water Transparency in Sri Lanka Using Landsat 8 Observations and Google Earth Engine. Remote Sens. 2021, 13, 2193. [Google Scholar] [CrossRef]
  23. Yang, W.; Matsushita, B.; Chen, J.; Yoshimura, K.; Fukushima, T. Retrieval of inherent optical properties for turbid inland waters from remote-sensing reflectance. IEEE Trans. Geosci. Remote Sens. 2012, 51, 3761–3773. [Google Scholar] [CrossRef]
  24. Huang, J.; Chen, L.Q.; Chen, X.L.; Tian, L.Q.; Feng, L.; Yesou, H.; Li, F.F. Modification and validation of a quasi-analytical algorithm for inherent optical properties in the turbid waters of Poyang Lake, China. J. Appl. Remote Sens. 2014, 8, 083643. [Google Scholar] [CrossRef]
  25. Chen, M.M.; Xiao, F.; Wang, Z.; Feng, Q.; Ban, X.; Zhou, Y.D.; Hu, Z.Z. An Improved QAA-Based Method for Monitoring Water Clarity of Honghu Lake Using Landsat TM, ETM+ and OLI Data. Remote Sens. 2022, 14, 3798. [Google Scholar] [CrossRef]
  26. Tan, J. Research of the Ecological Security in Hai Nan Province. Doctoral Dissertation, Central South University, Changsha, China, 2012. [Google Scholar]
  27. Mueller, J.L.; Morel, A.; Frouin, R.; Davis, C.; Arnone, R.; Carder, K.; Lee, Z.P. Ocean Optics Protocols for Satellite Ocean Color Sensor Validation, Revision 4. In Volume III: Radiometric Measurements and Data Analysis Protocols; Goddard Space Flight Space Centre: Greenbelt, MD, USA, 2003. [Google Scholar] [CrossRef]
  28. Tang, J.W.; Tian, G.L.; Wang, X.Y.; Wang, X.M.; Song, Q.J. The methods of water spectra measurement and analysis. I: Above-water method. Remote Sens. (Chin.) 2004, 8, 37–44. [Google Scholar] [CrossRef]
  29. Yu, D.F.; Zhou, Y.; Xing, Q.G.; Gai, Y.Y.; Zhou, B.; Fan, Y.G. Retrieval of Secchi disk depth using MODIS satellite remote sensing and in situ observations in the Yellow Sea and the East China Sea. Mar. Environ. Sci. 2016, 35, 774–779. [Google Scholar]
  30. Wang, S.L.; Li, J.S.; Zhang, B.; Shen, Q.; Zhang, F.F.; Lu, Z.Y. A simple correction method for the MODIS surface reflectance product over typical inland waters in China Int. Int. J. Remote Sens. 2016, 37, 6076–6096. [Google Scholar]
  31. Wang, S.L.; Li, J.S.; Zhang, B.; Spyrakos, E.; Tyler, A.N.; Shen, Q.; Zhang, F.F.; Kuster, T.; Lehmann, M.K.; Wu, Y.H.; et al. Trophic state assessment of global inland waters using a MODIS-derived Forel-Ule index. Remote Sens. Environ. 2018, 217, 444–460. [Google Scholar] [CrossRef] [Green Version]
  32. Yuan, Z.X.; Jiang, H.; Chen, Y.Z.; Wang, X.Q. Extraction of Water Body Information Using Adaptive Threshold Value and OTSU Algorithm. Remote Sens. Inf. 2016, 31, 7. [Google Scholar]
  33. Lee, Z.P.; Hu, C.M.; Sheng, S.L.; Du, K.P.; Lewis, M.; Arnone, R.; Brewin, R. Penetration of UV-visible solar light in the global oceans: Insights from ocean color remote sensing. J. Geophys. Res. 2013, 118, 4241–4255. [Google Scholar] [CrossRef] [Green Version]
  34. Olmanson, L.G.; Bauer, M.E.; Brezonik, P.L. A 20-year Landsat water clarity census of Minnesota’s 10,000 lakes. Remote Sens. Environ. 2008, 112, 4086–4097. [Google Scholar] [CrossRef]
  35. Duan, H.T.; Ma, R.H.; Zhang, Y.Z.; Zhang, B. Remote-sensing assessment of regional inland lake water clarity in northeast China. Limnology 2009, 10, 135–141. [Google Scholar] [CrossRef]
  36. Wang, S.L.; Li, J.S.; Zhang, B.; Lee, Z.P.; Spyrakos, E.; Feng, L.; Liu, C. Changes of water clarity in large lakes and reservoirs across China observed from long-term MODIS. Remote Sens. Environ. 2020, 247, 111949. [Google Scholar] [CrossRef]
  37. Yin, Z.Y.; Li, J.S.; Huang, J.; Wang, S.L.; Zhang, F.F.; Zhang, B. Steady increase in water clarity in Jiaozhou Bay in the Yellow Sea from 2000 to 2018: Observations from MODIS. Ocean. Limnol. 2021, 39, 800–813. [Google Scholar] [CrossRef]
  38. Mouw, C.B.; Gred, S.; Aurin, D.; Di Giacomo, P.M.; Lee, Z.P.; Twardowski, M.; Binding, C. Aquatic color radiometry remote sensing of coastal and inland waters: Challenges and recommendations for future satellite missions. Remote Sens. Environ. 2015, 160, 15–30. [Google Scholar] [CrossRef]
  39. Pereira-Sandoval, M.; Ruescas, A.; Urrego, P.; Ruiz-Verdú, A.; Delegido, J.; Tenjo, C.; Soria-Perpinyà, X.; Vicente, E.; Soria, J.; Moreno, J. Evaluation of Atmospheric Correction Algorithms over Spanish Inland Waters for Sentinel-2 Multi Spectral Imagery Data. Remote Sens. 2019, 11, 1469. [Google Scholar] [CrossRef] [Green Version]
  40. Martins, V.S.; Barbosa, C.C.F.; De Carvalho, L.A.S.; Jorge, D.S.F.; Lobo, F.D.L.; Novo, E.M.L.d.M. Assessment of Atmospheric Correction Methods for Sentinel-2 MSI Images Applied to Amazon Floodplain Lakes. Remote Sens. 2017, 9, 322. [Google Scholar] [CrossRef] [Green Version]
  41. Liu, H.Z.; Li, Q.Q.; Shi, T.Z.; Hu, S.B.; Wu, G.F.; Zhou, Q.M. Application of sentinel 2 MSI images to retrieve suspended particulate matter concentrations in Poyang Lake. Remote Sens. 2017, 9, 761. [Google Scholar] [CrossRef] [Green Version]
  42. Qing, S.; Cui, T.W.; Lai, Q.; Bao, Y.H.; Diao, R.X.; Yue, Y.L.; Hao, Y.L. Improving remote sensing retrieval of water clarity in complex coastal and inland waters with modified absorption estimation and optical water classification using Sentinel-2 MSI. Int. J. Appl. Earth Obs. Geoinf. 2021, 102, 102377. [Google Scholar] [CrossRef]
  43. Gao, L.; Hu, P.; Zhu, J.S. Comparison and analysis of two semi-analytical inversion models for water transparency. Mar. Sci. 2021, 45, 14–23. [Google Scholar]
  44. Renosh, P.R.; Doxaran, D.; Keukelaere, L.D.; Gossn, J.I. Evaluation of Atmospheric Correction Algorithms for Sentinel-2-MSI and Sentinel-3-OLCI in Highly Turbid Estuarine Waters. Remote Sens. 2020, 12, 1285. [Google Scholar] [CrossRef] [Green Version]
  45. Calijuri, M.L.; de Siqueira Castro, J.; Costa, L.S.; Assemany, P.P.; Alves, J.E. Impact of land use/land cover changes on water quality and hydrological behavior of an agricultural subwatershed. Environ. Earth Sci. 2015, 74, 5373–5382. [Google Scholar] [CrossRef]
  46. Gorgoglione, A.; Gregorio, J.; Ríos, A.; Alonso, J.; Chreties, C.; Fossati, M. Influence of Land Use/Land Cover on Surface-Water Quality of Santa Lucía River, Uruguay. Sustainability 2020, 12, 4692. [Google Scholar] [CrossRef]
  47. Li, D.D.; Lerman, A.; Mackenzie, F.T. Human perturbations on the global biogeochemical cycles of coupled Si–C and responses of terrestrial processes and the coastal ocean. Appl. Geochem. 2021, 26, S289–S291. [Google Scholar] [CrossRef]
  48. Mouri, G.; Takizawa, S.; Oki, T. Spatial and temporal variation in nutrient parameters in stream water in a rural-urban catchment, Shikoku, Japan: Effects of land cover and human impact. J. Environ. Manag. 2021, 92, 1837–1848. [Google Scholar] [CrossRef] [PubMed]
  49. Wan, R.; Cai, S.; Li, H.; Yang, G.; Li, Z.; Nie, X. Inferring land use and land cover impact on stream water quality using a Bayesian hierarchical modeling approach in the Xitiaoxi River Watershed, China. J. Environ. Manag. 2014, 133, 1–11. [Google Scholar] [CrossRef] [PubMed]
  50. Ma, Y.T.; Mu, X.D.; Hou, P.; Sun, L.; Zhang, L.J. Remote Sensing Identification and Spatial Variation of Drought Characteristics in Hainan Island. Remote Sens. Technol. Appl. 2022, 37, 1159–1169. [Google Scholar] [CrossRef]
  51. Zanaga, D.; Van De Kerchove, R.; De Keersmaecker, W.; Souverijns, N.; Brockmann, C.; Quast, R.; Wevers, J.; Grosu, A.; Paccini, A.; Vergnaud, S.; et al. ESA WorldCover 10 m 2020 v100; ESA: Zenodo, Arab, 2021. [Google Scholar] [CrossRef]
  52. Zanaga, D.; Van De Kerchove, R.; Daems, D.; De Keersmaecker, W.; Brockmann, C.; Kirches, G.; Wevers, J.; Cartus, O.; Santoro, M.; Fritz, S.; et al. ESA WorldCover 10 m 2021 v200; ESA: Zenodo, Arab, 2022. [Google Scholar]
  53. Robarts, R.D.; Waiser, M.J. Relaxation of phosphorus limitation due to typhoon—Induced mixing in two morphologically distinct basins of Lake Biwa, Japan. Limnol. Oceanogr. 1998, 43, 1023–1036. [Google Scholar] [CrossRef]
  54. Fan, C.X.; Zhang, L.B.; Qin, Q.; Wang, S.M.; Hu, W.P.; Zhang, C. Estimation on dynamic release of phosphorus from wind-induced suspended particulate matter in Lake Taihu. Sci. China Ser. D-Earth Sci. 2004, 47, 710–719. [Google Scholar]
  55. Sun, X.J.; Zhu, G.W.; Lou, L.C.; Qin, B.Q. Experimental study on phosphorus release from sediments of shallow lake in wave flume. Sci. China Ser. D Earth Sci. 2006, 49, 92–101. [Google Scholar] [CrossRef]
  56. Shi, J.; Yin, X.C. Some climatic characteristics of typhoon in Hainan Island. Chin. J. Trop. Crops 1992, 13, 113–120. [Google Scholar]
  57. Hainan Province “14th Five-Year Plan” Ecological Environmental Protection Plan. Available online: https://www.hainan.gov.cn/hainan/flfgxzgfxwj/202107/8e21b40ae1e145eab3282ae4eef4fbff/files/4052ee26e0dd41cf93b4a27315e1ab89.pdf (accessed on 8 July 2021).
  58. In-Depth Fight Pollution Prevention and Control Action Plan for the Battle of Pollution in Hainan Province. Available online: https://www.hainan.gov.cn/hainan/swygwj/202208/3b36b87c41d441d894fc4de743883ad9.shtml (accessed on 23 August 2022).
  59. EU. Directive 2000/60/EC of the European Parliament and of the Council of 23 October 2000 Establishing a Framework for Community Action in the Field of Water Policy; Office for Official Publications of the European Communities: Brussels, Belgium, 2000. [Google Scholar]
  60. USEPA. Guidance for 2006 Assessment, Listing and Reporting Requirements Pursuant to Sections 303(d), 305(b) and 314 of the Clean Water Act; USEPA: Washington, DC, USA, 2005.
  61. Stephens, D.L.B.; Carlson, R.E.; Horsburgh, C.A.; Hoyer, M.V.; Bachmann, R.W.; Canfield, D.E., Jr. Regional distribution of Secchi disk transparency in waters of the United States. Lake Reserv. Manag. 2015, 31, 55–63. [Google Scholar] [CrossRef]
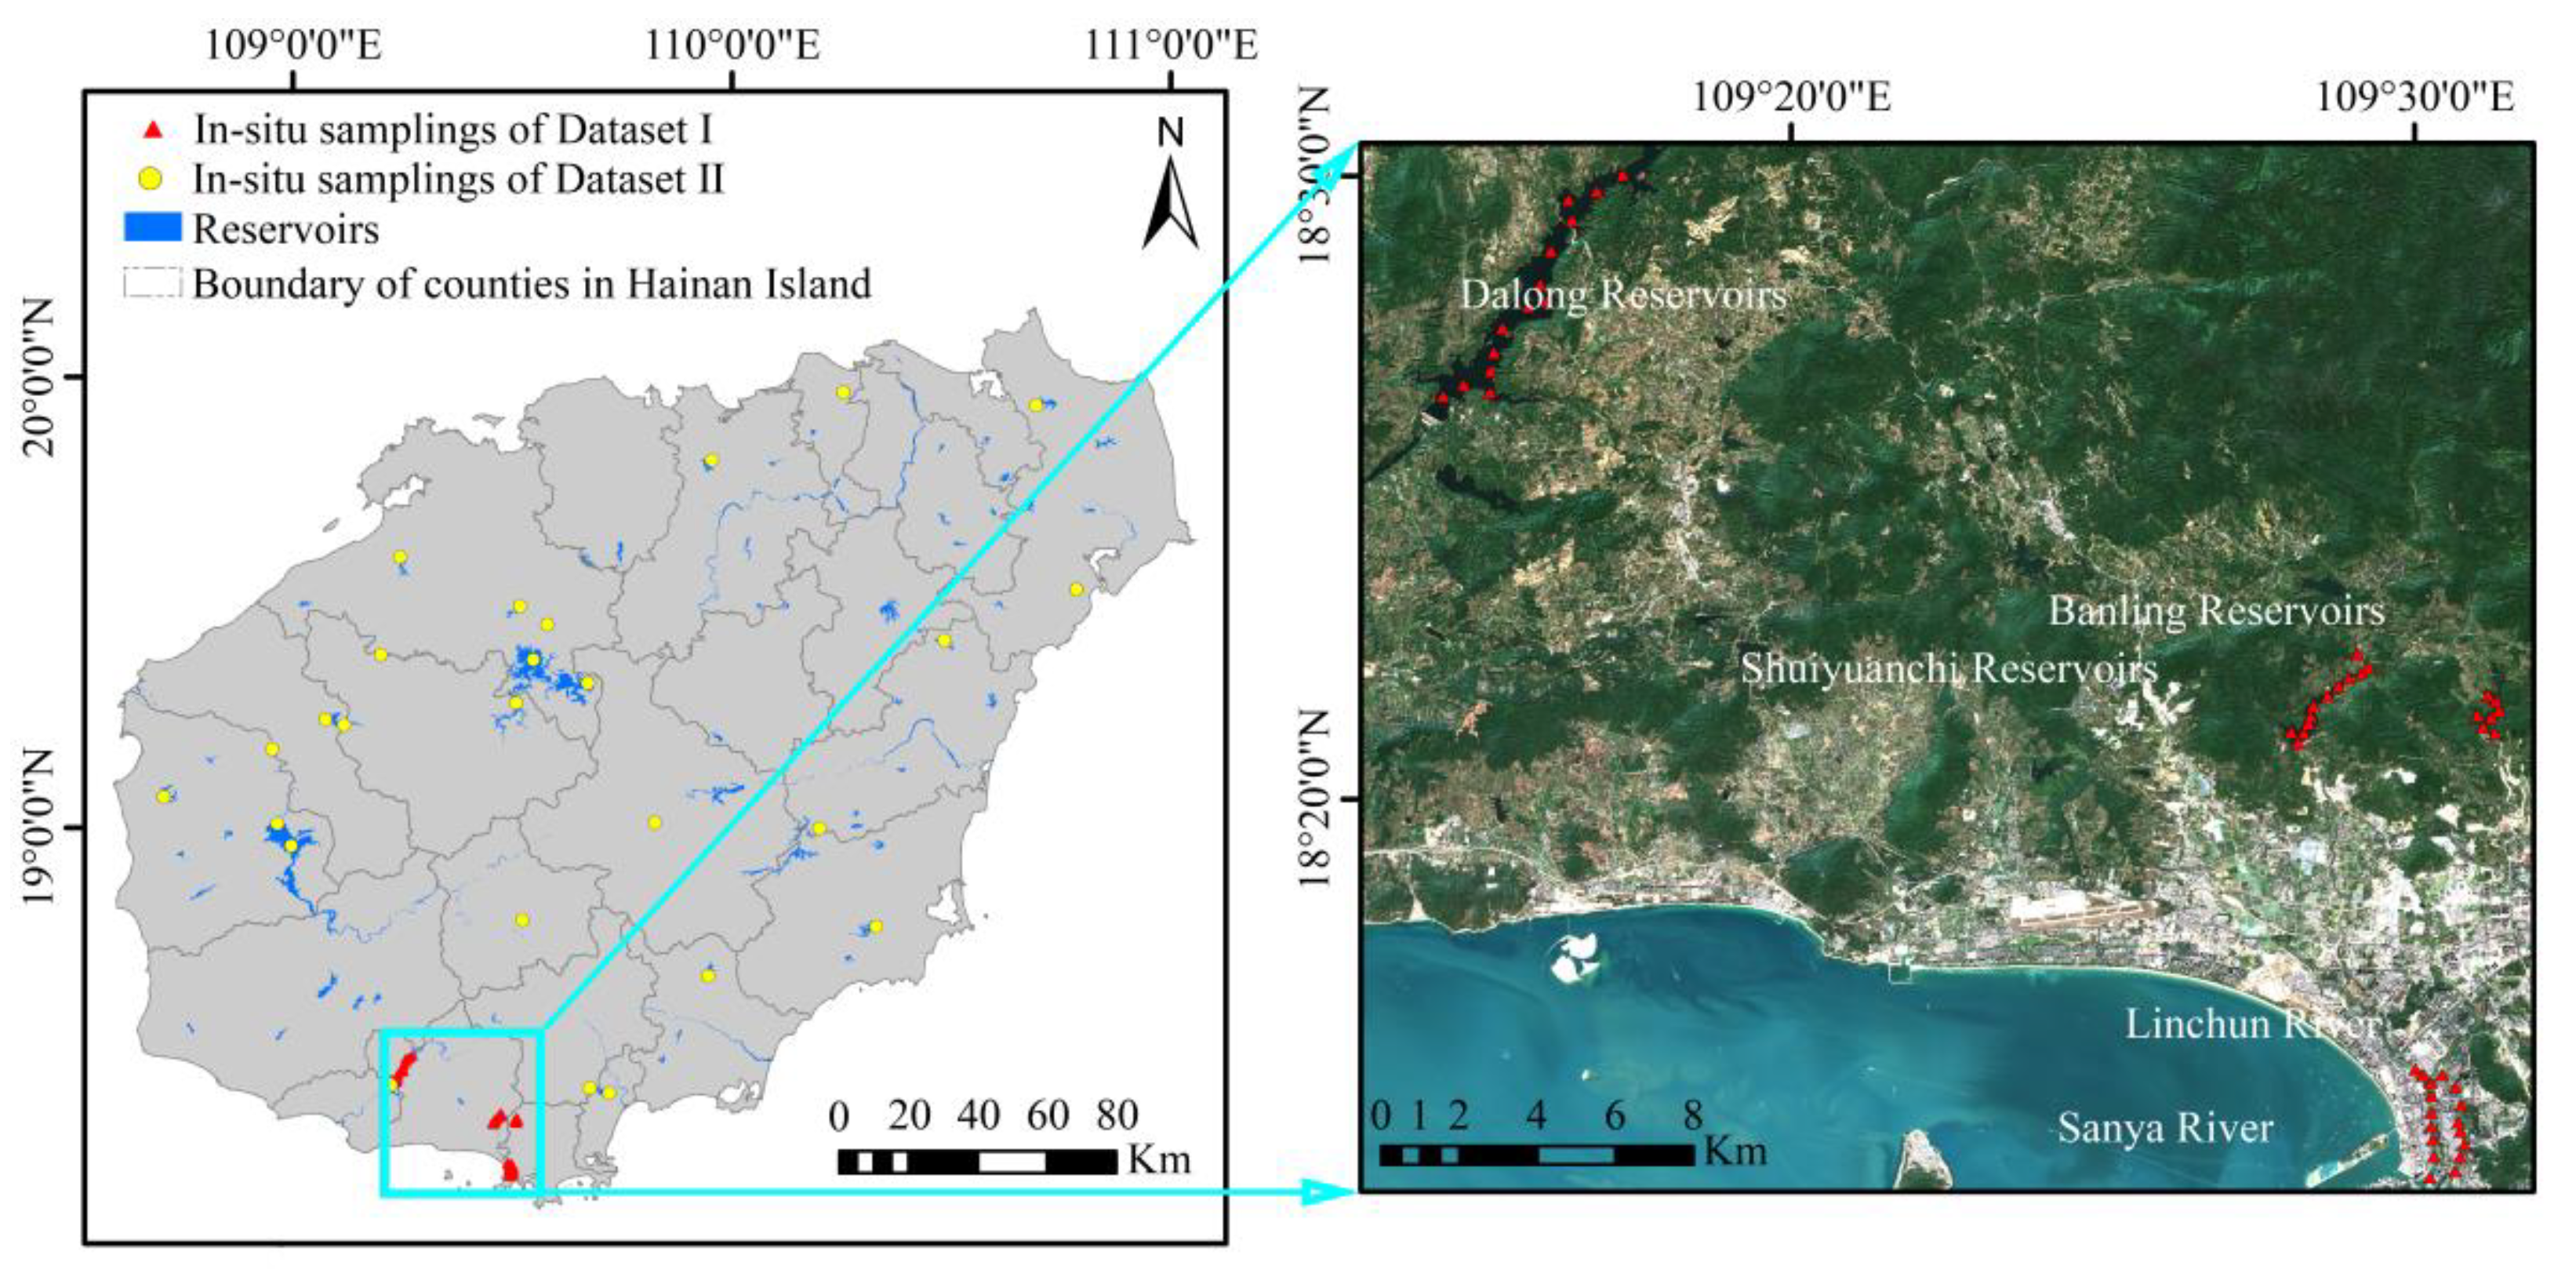
Figure 1. Distribution of the study area and sampling points.
Remotesensing 15 01600 g001
Figure 2. Sentinel-2 data distribution covering Hainan Island for 2017–2021.
Remotesensing 15 01600 g002
Figure 3. Overall flowchart of the approach to semi−analytically deriving ZSD.
Remotesensing 15 01600 g003
Figure 4. Spectral curve Dataset I at 443, 490, 560, and 665 nm. (DL: Dalong Reservoir; SYC: Shuiyuanchi Reservoir; SYH: Sanya River; LC: Linchun River; BL: Banling Reservoir).
Remotesensing 15 01600 g004
Figure 5. Comparison between the quasi−synchronous in situ measured Rrs(λ) and Sentinel−2 MSI remote sensing reflectance. (a) ±1 Day. (b) ±5 Day.
Remotesensing 15 01600 g005
Figure 6. Validation of the model using Dataset I and matched Sentinel-2 data. (a) The ZSD-QAAv6 model, (b) the ZSD-QAAv6m model.
Remotesensing 15 01600 g006
Figure 7. Validation of the ZSD-QAAv6m model using Dataset II for Hainan Island.
Remotesensing 15 01600 g007
Figure 8. Model comparisons of the (a) FUI and Hue-angle model, (b) Hue-angle model, (c) Red–Blue ratio model, and (d) Red–Green ratio model in Datasets I and II.
Remotesensing 15 01600 g008
Figure 9. Climatological mean ZSD of inland water bodies on Hainan Island in the (a) dry and (b) wet seasons during 2017–2021.
Remotesensing 15 01600 g009
Figure 10. ZSD distribution in the dry and wet seasons from 2017 to 2021.
Remotesensing 15 01600 g010
Figure 11. Average proportion of annual ZSD water bodies in the (a) dry and (b) wet seasons for inland water bodies on Hainan Island from 2017–2021.
Remotesensing 15 01600 g011
Figure 12. Land-cover types on Hainan Island and their correlation with regional water clarity. (a) The land-cover type of Hainan Island in 2021, (b) the coverage rate of vegetation (including tree cover, shrubland, grassland, and cropland) in regions of Hainan Island, (c) correlations between the Sentinel-2-derived water clarity and vegetation cover in regions of Hainan Island.
Remotesensing 15 01600 g012
Figure 13. Change in water clarity in the Daguanba Reservoir before and after the heavy rainfall of typhoon “Kompasu” (the blank space within the boundary of the water body indicates the area not covered by the water body or an area in which there are no effective observations).
Remotesensing 15 01600 g013
Figure 14. Proportion of inland waters with good quality indicated by water clarity (ZSD > 0.5 m) on Hainan Island in the dry and wet seasons, 2017–2021.
Remotesensing 15 01600 g014
Table 1. Experimental data for Hainan Island.
No.Water BodyLat (°)Lon (°)Sampling Date (2022)No. of SamplesZSD Range (m)
1Dalong Reservoir18.4445109.24566 January152.35–3.50
2Sanya River18.2349109.49658 January90.87–1.17
3Linchun River18.2349109.51168 January80.78–0.96
4Shuiyuanchi Reservoir18.3633109.476211 January112.02–2.68
5Banling Reservoir18.3556109.524712 January91.28–1.52
Table 2. Results of the measured and Sentinel-2 MSI remotely sensed reflectance in four bands.
BandR2MRERMSE (sr−1)
443 nm0.9023.4%0.0000063
490 nm0.9126.3%0.000012
560 nm0.9215.4%0.000033
665 nm0.8514.5%0.0000069
Disclaimer/Publisher’s Note: The statements, opinions and data contained in all publications are solely those of the individual author(s) and contributor(s) and not of MDPI and/or the editor(s). MDPI and/or the editor(s) disclaim responsibility for any injury to people or property resulting from any ideas, methods, instructions or products referred to in the content.