Abstract
Recent upgrades to China’s radar network now allow for polarimetric measurements of convective systems in central China, providing an effective data set with which to evaluate the microphysics schemes employed in local squall line simulations. We compared polarimetric radar variables derived by Weather Research and Forecasting (WRF) and radar forward models and the corresponding hydrometeor species with radar observations and retrievals for a severe squall line observed over central China on 16 March 2022. Two microphysics schemes were tested and were able to accurately depict the contrast between convective and stratiform regions in terms of the drop size distribution (DSD) and reproduce the classical polarimetric signatures of the observed differential reflectivity (ZDR) and specific differential phase (KDP) columns. However, for the convective region, the simulated DSDs in both schemes exhibited lower proportions of large drops and lower liquid water content; by contrast, for the stratiform region, the proportion of large drops was found to be too high in the Morrison (MORR) scheme. The underprediction of ice-phase processes in the convective region, particularly the riming processes associated with graupel and hail, was likely responsible for the bias toward large raindrops at low levels. In the stratiform region, raindrop evaporation in the WRF Double-Moment 6-Class (WDM6) scheme, which partially offsets the overestimation of ice-phase processes, produced ground DSDs that more closely matched the observational data, and did not exhibit the overly strong warm-rain collisional growth processes of MORR.
1. Introduction
The modeling of microphysical processes remains a major obstacle to achieving reliable numerical weather predictions and climate simulations, in part due to gaps in our knowledge of cloud processes [1]. A vast amount of microphysical information can be extracted using observational data from polarimetric weather radars. The dual-polarization upgrades of the S-band Weather Surveillance Radar 1988 Doppler (WSR-88D) network in the USA and the C-band network in Germany and other European countries have been successively completed [2]. China has been enhancing its operational radar network to polarimetry in recent years [3], thus providing new opportunities for the extensive evaluation of, and potential improvements to, existing microphysical parameterization schemes.
Polarimetric radar is capable of determining disparities in horizontal and vertical backscatter, along with the phase shift of propagation, correlation, and depolarization [4]. The logarithm of the ratio of the power returned from horizontally and vertically polarized backscatter, known as differential reflectivity (ZDR), depends mainly on the median shape and size of hydrometeors. The specific differential phase (KDP), defined as the range derivative of the differential phase shift (ΦDP) between the horizontal and vertical pulse phases, is dependent on the number concentration. The copolar correlation coefficient (ρhv) is a normalized measure of the correlation of horizontal and vertical backscattered power within a radar sample volume and can help distinguish meteorological from non-meteorological targets and ice particles from rain. The polarimetric variables are susceptible to alterations in hydrometeors’ shape, spatial orientation, and phase composition, which can occur during a variety of microphysical processes. Hence, these multivariate polarimetric “fingerprints” can provide insight into microphysical processes that include size sorting, breakup, aggregation, riming, melting, and hail production [5,6,7]. For instance, a commonly observed microphysical feature of mesoscale convective systems (MCSs) is that in convective regions ice growth is dominated by riming whereas in stratiform regions deposition and aggregation are the primary mechanisms [8,9,10]. Warm-rain processes such as raindrop growth from collision-coalescence and the gathering of cloud droplets are highly efficient in MCS precipitation processes in a relatively moist stable environment [11,12]. Microphysical characteristics also vary with terrain elevation and the life cycle stage of the convective system involved [13,14,15]. Dual-polarization radar observations have also been used to evaluate the microphysics schemes used in various numerical models using forward operators, e.g., [16,17,18]. The polarimetric radar forward operators, using the T-matrix algorithm, generate synthetic polarimetric observations from the model output variables and compare them with the actual observations. Studies have leveraged these radar forward operators to validate raindrop size properties simulated by microphysics schemes and to reproduce meaningful polarimetric signatures in convective storms, including a ZDR column in the convective updraft region and a depressed ρhv ring in the storm-inflow region [19,20,21]. It has also been found that the simulated polarimetric radar variables are highly affected using different microphysics schemes with varying moments. The single-moment microphysics used in the modeling studies of Jung et al. [21] was barely able to reproduce certain signatures, such as mid-level ZDR and ρhv rings; however, these features were reproduced realistically in the same model using the corresponding three-moment scheme [22] by Snyder et al. [23] and Fan et al. [5]. Likewise, different polarimetric signatures have been exploited for quantifiable examinations and in-depth analyses of liquid- and ice-phase processes [10,24,25,26,27]. For example, polarimetric fingerprints in warm clouds associated with size sorting and collision–coalescence processes are reproduced to varying extents among simulations with different microphysics schemes [26,27]. By contrast, it has been noted that the simulated polarimetric variables above the melting layer lack explicit variability and are explained in part by the limited diversity of particles in the model, as well as the inability of the T-matrix approach to replicate the polarimetric fingerprints of ice processes involving snow and graupel [20,27]. However, using retrievals of ice-water content profiles and hydrometeor types, Chen et al. [24] quantitatively evaluated the ice processes of three widely used microphysics schemes. They found that the total ice-water content values for convective regions were overpredicted, where the overestimation of graupel and snow by riming was possibly responsible for extremely large raindrops below freezing levels. These quantitative retrievals of ice properties strongly depend on assumptions regarding the habit and properties of particles that govern polarimetric scattering, and thus some uncertainties exist. Morrison et al. [1] highlighted incorporating uncertainty concerning ice density, habit, and size distribution into these retrievals. In the present study, we use the same assumptions regarding ice density and size distribution from the microphysics schemes for the polarimetric radar forward operators and uniformly adopt the assumptions established by Ryzhkov et al. [17] regarding the shape and orientation angle of ice particles to constrain uncertainty in the evaluation.
Squall lines are linearly organized MCSs that serve as useful test cases for microphysics schemes since their convective strength and precipitation organization are sensitive to cloud microphysical parameterization [5,28,29]. Previous studies have found that the simulations vary depending on the varieties of ice species and certain ice process parameterizations used [30,31,32,33]. Compared with the use of a graupel category in the simulation, the use of faster-falling hail commonly narrows the convection region [33] but limits the development of bow echoes due to the weaker surface cold pools and rear inflow jets [32]. An approach that uses one category of ice with adjustable properties to cover all types of ice species can somewhat reduce the impact of the uncertainty associated with distinguishing graupel/hail particles in MCS simulations [34,35,36]. The flexible characterization of ice properties, according to Zhao et al. [29], has a substantial influence on whether a transition zone arises in a simulated squall line. The impact of microphysical–dynamical feedbacks on squall line simulations has also been considered in several studies [5,37,38]. For instance, latent heating/cooling can influence vertical upward motion by directly dominating cloud-scale buoyancy distributions, which can have large impacts on MCS structures and lifetimes [37]. In addition, it remains important to constrain particle size distributions in microphysics schemes such as the popular two-moment bulk schemes, which were found to have issues with correctly representing the size distribution of rain particles through the comparison of polarimetric radar variables [20,38,39].
Previous studies have focused mainly on MCSs in mid-latitude North America and Europe and East and South China, but microphysical characteristics within MCSs vary according to the climate regime and synoptic environment. The successively upgraded dual-polarization function of the operational radar network in China can provide observational data that are maximally effective for evaluating and constraining microphysics schemes in various background environments over the East Asian monsoon region and can help to address the gaps in our understanding of the microphysics involved. In this study, we are using the new data to gain insight into the microphysics of a spring squall line over central China and to validate the microphysical process parameterization used for squall line numerical simulations. To our knowledge, few studies have identified the main microphysical processes that cause variations in polarimetric signatures in squall line precipitation over central China. Our study aims to do this, using numerical models and a forward operator. This method may inspire more analysis of cases in central China using dual-polarization radar measurements.
On 16 March 2022, a heavy rainfall event of a squall line occurred in central China. This study focuses on convective and stratiform precipitation processes during the mature stage, specifically from 1200 UTC to 1500 UTC. Section 2 introduces the observational data set and model simulation setup used in this study. It also describes the polarimetric radar operator and the methodologies used for the classification of types of rainfall and the identification of hydrometers. Section 3 describes the synoptic background and mesoscale evolution of the squall line. Microphysical characteristics of squall lines from polarimetric radar observations and numerical simulations are presented and discussed in Section 4. A summary of the findings and future effort directions are given in Section 5.
2. Observational Data and Methods
2.1. Observational Data Sets
To examine the microphysical features, observational information from an S-band polarimetric radar (S-POL) at the Huaihua site (the location of which is indicated by an unfilled triangle in Figure 1) was used. S-band polarimetric radar is part of China’s operational weather radar (hereafter referred to as CINRAD-SAD) network and operates in the volume coverage pattern 21 volume-scan strategy. The volume scan consists of nine elevation angles between 0.5° and 19.5° every 6 min, with an unambiguous range (velocity) of 150 km (26.5 m/s). The S-POL data used in this study were subject to both a quality control and calibration procedure to remove non-meteorological artifacts and any systematic bias. Non-meteorological echoes for which ρhv < 0.85 were excluded [40]. Although some beneficial data may have been discarded due to this ρhv threshold, the overall statistical findings should remain unaffected. While stringent internal calibration procedures similar to WSR-88D are applied for CINRAD-SAD radars, small fluctuations in the differential reflectivity are still known to occur. An external calibration procedure was performed for the S-POL radar used in the study to remove any unresolved systematic bias in ZDR. Since the CINRAD-SAD radars, which have a fixed observation strategy, cannot point vertically, the bias was estimated using light rain echoes at lower elevation angles, beginning at 20 km from the radar to avoid ground clutter, based on the method described by Cunningham et al. [41]. After thresholding based on ρhv and calibration, a despeckling procedure was performed following Bell et al. [42], whereby valid data from at least four contiguous range gates along the radar beam were required to remove isolated radar echoes. The KDP was estimated by calculating the range derivative of ΦDP following Lang et al. [43]. The ΦDP was filtered using a finite-impulse response filter (in the Colorado State University (CSU) RadarTools; [44]) before computing KDP.
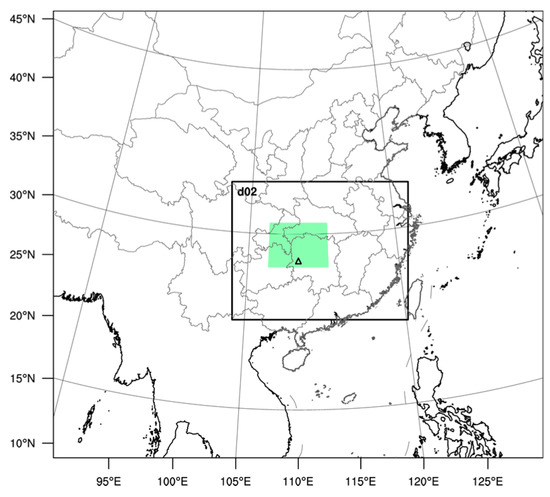
Figure 1.
The model domains used. The outer region is the parent domain (9 km), and d02 is the inner domain (3 km). The innermost box, shaded green, denotes the area of the squall line system (approximately 27°–31°N, 107°–113°E), and the triangle at the bottom of the green area indicates the location of the Huaihua station.
Polarimetric variables were then interpolated from polar to Cartesian coordinates at 1 km horizontal and 500 m vertical resolution using a Barnes scheme in an open-source radar toolkit Py-ART [45]. The radius of influence of the interpolation grows with the distance from the S-POL radar, based on a minimum radius of influence of 1 km and a virtual beam width of 0.957° (equal to the S-POL beam width). The gridded data make it simple to compare the polarimetric signatures to their modeled counterparts.
Radiosonde data at the S-POL site can provide temperature profiles for hydrometeor classification and characterize environmental conditions for convective initiation. Additional observations used for evaluation were three-dimensional radar mosaic reflectivity, surface precipitation, and temperature. The former combined all available radars in the study region, with a grid spacing of 0.01° (∼1 km) horizontally and varying vertical resolutions (0.5–19 km) updated every 6 min. Surface precipitation and temperature data were gathered from thousands of weather stations.
2.2. Model Setup
Simulations of the selected squall line event were conducted employing the Weather Research and Forecasting (WRF) Model version 4.2 [46] with a 9–3 km two-way nested domain configuration (see Figure 1 for domain coverage and Table 1 for a summary of configuration options). The ERA5 reanalysis data [47] with 3 h intervals and 0.25° grid resolution were used to generate initial and lateral boundary conditions. Numerical experiments were integrated from 0000 UTC to 1800 UTC on 16 March 2022 for 18 h, with the model outputs saved at 15 min intervals. Spectral nudging [48] was applied to the long-wave spectral regimes (wavelength > 1000 km) of temperature, geopotential height, and wind fields at every integral time step above the planetary boundary layer (PBL) over the WRF outer domain to keep the simulated state close to the ERA5 data at large scales [20].

Table 1.
Summary of WRF configuration options.
In the present study, two widely used bulk microphysics schemes in WRF, double-moment six-class scheme WDM6 [49] and Morrison scheme MORR [28], are tested, and both simulations are compared with radar observational data. The WDM6 scheme is not truly double moment and only prognoses both the mass and number mixing ratios for cloud droplets and rain, and the mass mixing ratio of ice, snow, and graupel. As opposed to WDM6, the MORR scheme predicts mass and number mixing ratios for rain, cloud ice, snow, and graupel and the mass mixing ratio of cloud droplets. In WDM6, the size distributions in rain and cloud droplets are represented by a generalized four-parameter gamma function; ice microphysics are identical to those in the corresponding single-moment scheme following Hong et al. [50]. In MORR, the size distribution of cloud droplets is assumed to be in the form of a gamma function with a variable shape parameter [51], while the other hydrometeors conform to the inverse-exponential size distribution. Despite the variations in rain size distributions for the WDM6 and MORR schemes, the rain evaporation scheme is kept consistent between different schemes. The relationship between fall speed and size for graupel/hail varies between the two schemes, but the melting scheme for graupel/hail remains the same.
Other physics parameterizations are identical between two experiments when using either the WDM6 or MORR scheme (Table 1).
It should be noted that, as an ongoing effort to improve operational forecast models in central China, this study used the same horizontal grid spacings (3 km) for simulations. We acknowledge the limitation in the comparison with 1 km-mesh radar observations and thereby concentrate more on examining stratiform and convective scale features.
2.3. Dual-Polarization Forward Operator for WRF
The forward model of the Polarimetric Radar Retrieval and Instrument Simulator (POLARRIS-f)—a radar forward operator that was developed by scientists at Colorado State University and NASA (https://earth.gsfc.nasa.gov/meso/models/polarris (accessed on 27 March 2021))—was used to simulate the S-POL variables [16].
The Polarimetric Radar Retrieval and Instrument Simulator incorporates the WRF microphysics assumptions, such as particle sizes, densities, and liquid/ice phase from different microphysics schemes. Additional uncertainties in the polarimetric estimates arise due to characteristics of hydrometeors that are not usually included in the model, such as aspect ratio, orientation angle distributions, and dielectric constant. For this study, particle aspect ratio and canting angles uniformly followed the assumptions described by Ryzhkov et al. [17], and effective dielectric properties were estimated using the Garnett [58] mixing formula for air–ice and air–ice–liquid mixtures. However, given the intricate nature of ice shapes and spatial orientations, differences between modeled and observed data for the above-freezing-level ZDR and KDP are not examined.
2.4. Rainfall Type Categorization and Hydrometeor Identification
For objective model–observation comparisons, the convective/stratiform partitioning algorithm proposed by Powell et al. [59] was applied consistently to the 3 km-height gridded reflectivity data. It is an update to the method described by Steiner et al. [60], based on the horizontal radar reflectivity gradient (often referred to as a reflectivity texture scheme). The new algorithm allows for echo objects in the immediate vicinity of convective cores to be appropriately allocated to a new “mixed” category, while in the old algorithm these echoes are considered convective. Furthermore, the new algorithm more often correctly recognizes periods in which stratiform rain is absent. Hence, it is more appropriate for the study of squall lines.
In addition, a fuzzy logic hydrometeor identification (HID) algorithm in CSU RadarTools [43,61] was adopted to categorize hydrometeors present in the squall line. Apart from polarimetric variables, the temperature is also applied to the algorithm to separate liquid and ice regions. For model data, prognostic air temperatures were extracted from the WRF model field. For radar observations, the radiosonde data from the Huaihua site were interpolated to the S-POL analysis grids. Ten hydrometeor species were included in the study: drizzle, rain, ice crystals, aggregates, wet snow, vertically aligned ice, low-density graupel, high-density graupel, hail, and big drops.
3. Environmental Conditions and Case Description
Figure 2 shows the synoptic conditions before the squall line of interest formed. A deep trough at 500 hPa (Figure 2a) was above southwest China, along with a downstream weak ridge, which resulted in a strong southwesterly flow. In the low-level troposphere, the paralleled 850-hPa jet (20 m/s), was advecting the warm, moist air toward central China (Figure 2b). In the region in which the squall line occurred, total column water was as high as 40 kg/m2, and the equivalent potential temperature was also high.
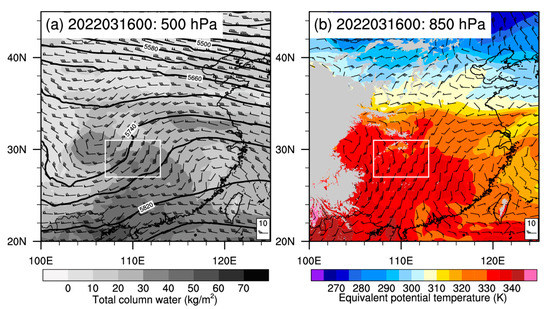
Figure 2.
The ERA5 data for (a) 500 hPa geopotential height (solid black, contoured every 30 m) and wind barbs (m/s) superimposed on total column water (kg/m2; grayscale shading) and (b) 850 hPa equivalent potential temperature (K; color shading) and wind barbs (m/s) at 0000 UTC on 16 March 2022. The gray shading in (b) denotes terrain height > 1.5 km. The white rectangles in (a,b) represent the area of the squall line system.
Upper-air soundings (Figure 3; the location of which is represented by an unfilled triangle in Figure 1) were also used to examine the environmental conditions associated with the storm. The total precipitable water (TWP) of 45.1 mm could be considered moderate considering the intense rainfall associated with squall line events. Compared with the corresponding values from plum rain or typhoon events, this value is fairly low and, in relative terms, is indicative of a drier environment ([11,62]. A convective available potential energy (CAPE) value as high as 1097 J/kg was recorded in Huaihua, with a lifting condensation level (Plcl) of 931.5 hPa ahead of the squall line, indicating suitable environmental conditions for convective initiation, with only a minor degree of lifting required.
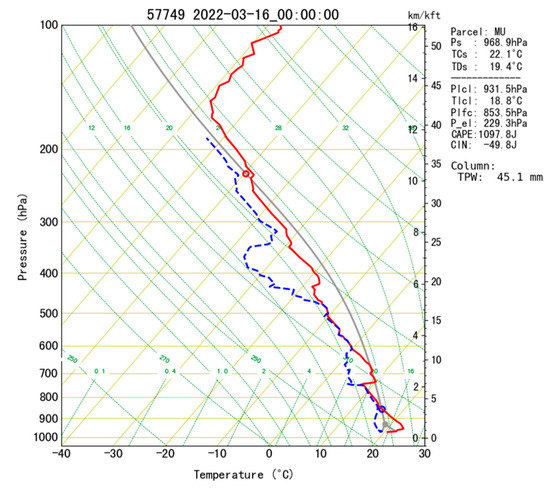
Figure 3.
Skew T-logP diagram for Huaihua (triangle in Figure 1) at 0000 UTC on 16 March 2022. The red and blue lines show temperature and dewpoint temperature profiles, respectively. The gray curve represents the ascending path of the most unstable parcel. The yellow background line, sloped at a 45° angle, denotes temperature lines.
Horizontal distributions of composite reflectivity, from observations that were recorded every 6 min, distinctly illustrate the evolution of the MCSs (Figure 4). The convection line was initiated northwest of Huaihua (not shown), some distance from site, in the afternoon at ~0630 UTC (LST = UTC + 8); it developed quickly into a leading convective line accompanied by stratiform structures 2 h later (Figure 4a) and moved gradually east-southeast (Figure 4b–d). During the intensifying stage (0900–1200 UTC), the convective and stratiform areas expanded rapidly (compare Figure 4a,b). During the mature stage (1200–1500 UTC), the leading edge was marked by deep and intense convective cells, accompanied by heavy rainfall (Figure 5). The other typical features are a cold pool defined by a temperature drop of larger than 2 °C, and a transition zone with lower radar reflectivity, parallelly located right behind the leading convective line (Figure 6a–c). The linear MCS began to weaken at around 1530 UTC, and a gradual decrease in mesoscale organization was observed in the radar reflectivity data (Figure 4d). In this study, we focused on the mature stage of the squall line.
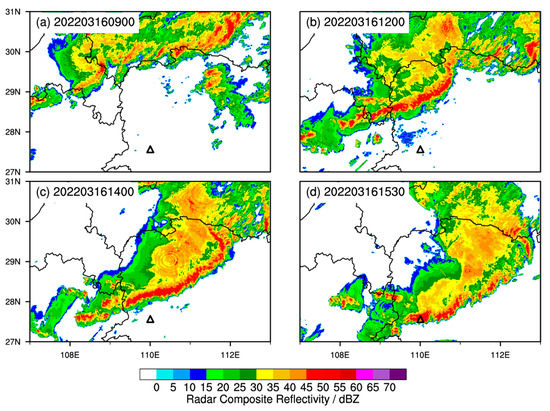
Figure 4.
Radar mosaic showing radar reflectivity (dBZ) at (a) 0900 UTC, (b) 1200 UTC, (c) 1400 UTC, and (d) 1530 UTC on 16 March 2022. The triangle denotes the location of the S-POL radar.
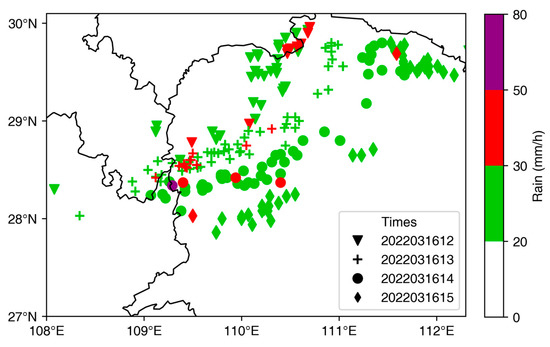
Figure 5.
Spatial distribution of hourly rainfall above 20 mm/h during the mature stage of the squall line. The time values are given in the legend.
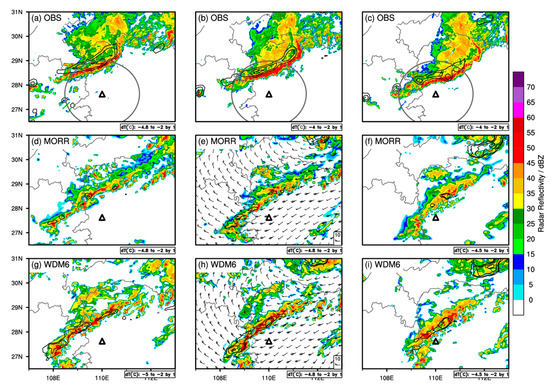
Figure 6.
Temporal evolution of observed and simulated radar reflectivities (dBZ) for the 16 March 2022 squall line case at 1200 UTC (left column), 1300 UTC (middle column), and 1400 UTC (right column) at an elevation of 3 km. Black contours show the hourly temperature change, indicating the location of the surface cold pool. The triangle in each panel indicates where S-POL is situated. The dark gray circles in the first three panels indicate the 150 km range from the radar.
4. Results and Discussion
4.1. General Evaluation of the Simulated Squall Line
First, we examined the essential features of the model-simulated convective system using the 3 km composite reflectivity data and the hourly temperature variation data from 1200 to 1400 UTC. Overall, the orientation and movement of the squall line produced by both the MORR and WDM6 schemes resembled the radar observations, but modeled radar reflectivity values were generally underestimated compared with observations on the leading convective lines, especially for the MORR scheme (Figure 6d–i). Figure 6 also shows that the simulated systems advanced southeast earlier than the observed system. In terms of organizational morphology, both simulations produced a broken, less continuous, and narrower stratiform area compared with the observed uniform, continuous, and wide structure, and lacked a distinct low-reflectivity transition zone. The WDM6 scheme exhibited an hourly temperature drop of about 3 °C (Figure 6g−i), which was consistent with the cold pool intensity. However, the leading edge of the surface cold pool (the −2 °C isotherm) was not trapped behind the maximum radar reflectivity line, as seen in the observational data, but ahead of the leading convective line. The MORR scheme failed to generate a substantial cold pool; temperatures decreased by less than 2 °C (Figure 6d−f). This weak cold pool should be associated with inverse-exponential size distribution in the MORR scheme (as mentioned in Section 2.2), which dominates the rain evaporation rates.
4.2. Evaluation of Polarimetric Signatures
4.2.1. Horizontal Distributions
For comparison of synthetic polarimetric variables (horizontal reflectivity Z, ZDR, and KDP) with radar observations, we selected simulated samples from the Huaihua radar coverage area (dark gray circles in Figure 6a–c, 150 km radius). Figure 7 shows a snapshot of the observed and simulated Z, ZDR, and KDP at 1300 UTC at an elevation of 3.0 km. The area classified as a convective region is emphasized by black dots in Figure 7a,d,g. Overall, the modeled squall line showed a similar spatial distribution for all three polarimetric variables compared with the observed system, but with a narrower stratiform area and wider leading convective line. The transition zone, which is characterized by a thin gap of low Z and ZDR, was not well reproduced in MORR or WDM6. The peak Z value, which exceeded 60 dBZ in the observations of the leading convective line, was underestimated in both MORR and WDM6 (~50dBZ), consistent with the characteristics illustrated in Figure 6. High ZDR values (>3 dB) occurred in the leading convective line; this is a common polarimetric feature linked to size sorting [13,63], indicating the involvement of large raindrops. Low ZDR (<1.5 dB) values were observed in the stratiform region (Figure 7b), in the absence of the intense updraft. The simulated ZDR values for the WDM6 scheme were in general agreement with the observations, with ZDR values being high near the leading convective line, and lower in areas away from it, but the high values were distributed more loosely (Figure 7b,h). In MORR, ZDR showed no discernible pattern of the convective line (Figure 7e). There was considerable variation in the magnitude of the ZDR values within the convective region: the simulated peak ZDR value was as high as 6.0 dB for a few grid points along the leading edge, while the lowest value was only 0.2 dB for the surrounding points. Nonetheless, the difference in ZDR that distinguishes the DSDs of the convective and stratiform regions was still evident in MORR.
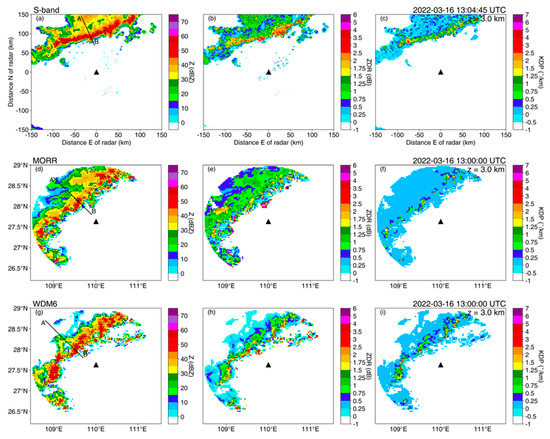
Figure 7.
(a,d,g) Radar reflectivity (Z; dBZ), (b,e,h) differential reflectivity (ZDR; dB), and (c,f,i) specific differential phase (KDP; °/km) from (a−c) the S-POL radar observations and the POLARRIS-f simulations converted from the WRF output using (d–f) MORR and (g–i) WDM6 microphysics schemes, at 1300 UTC on 16 March 2022 at an elevation of 3 km. The convective region was divided based on the criteria revised by Powell et al. [59] and is indicated by black dots. The triangle in each panel indicates where S-POL is situated. Lines A-B in (a), (d), and (g) indicate cross-section lines of Figure 9.
The difference between observed and simulated values was less pronounced for KDP than ZDR (Figure 7c,f,i). The high KDP values produced by MORR and WDM6 were roughly the same, and the convective line was reproduced, yet the simulated values were generally lower than the observed values (mostly < 1.5°/km; Figure 7c,f,i). A few more intense convective areas (Z > 55 dBZ) in the simulations had KDP values higher than 2.5°/km (Figure 7f,i), which agreed more closely with the observations (Figure 7c). Throughout the stratiform region, both simulations exhibited low (but consistent) KDP compared with the observations.
To statistically analyze and further evaluate the microphysics of the warm cloud layers, joint probability density functions (PDFs) in Z-ZDR and Z-KDP space were constructed and normalized by peaks in frequency. Each PDF encompassed 3 h of radar observations or POLARRIS-f simulations, covering the Huaihua radar coverage (150 km radius), and spanning from the surface to 3 km altitude to ensure only liquid drops. Peak frequencies of the observed Z and ZDR are at 30 dBZ and 0.85 dB for stratiform samples (black contours in Figure 8a) and 50 dBZ and 2.5 dB for convective samples (colored shading in Figure 8a). For the radar observations of the convective samples, the modal distribution of Z and ZDR values with frequencies higher than 30% extended from 43 dBZ to 55 dBZ, and from 1.5 to 3.2 dB, respectively, further supporting the conclusion drawn from Figure 7a,b that the clouds of the convective region are composed of larger raindrops. For convective samples in MORR, the simulated Z and ZDR values with frequencies higher than 30% were confined to ~48 dBZ and ~2.2 dB (Figure 8b), indicating that the modal distributions occupy a smaller phase space compared to the observations. Despite effectively reproducing the peaks in frequency of moderate raindrops, MORR fails to capture the frequencies of over 30% of large raindrops in the top right side of the observational phase space. For observed stratiform precipitation, the distribution of Z and ZDR values with frequencies over 30% extended from 15 to 38 dBZ, and from 0.2 to 1.2 dB, respectively. The MORR scheme exhibits high frequencies for large Z and ZDR values that are not observed in reality; values with frequencies higher than 30% exceeded 40 dBZ and 2.0 dB, implying that the rain rate and drop sizes in the stratiform region are both exaggerated [64]. By contrast, the modal distributions of the WDM6 scheme match the radar observations more closely and exhibit a similarly broad range of Z values for both convective and stratiform regions, despite an apparent narrower distribution of ZDR for a given reflectivity than the observations. The WDM6 simulations have a truncated ZDR, which is in agreement with the findings of earlier studies [19], due to the use of a different shape parameter.
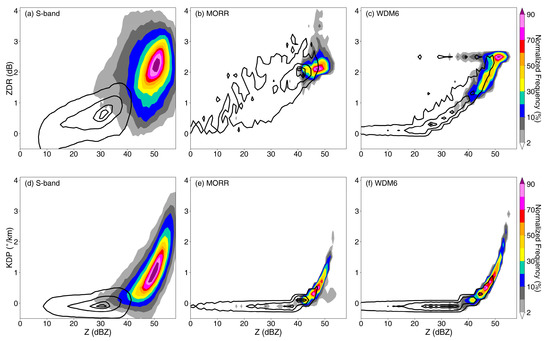
Figure 8.
Joint radar reflectivity–differential reflectivity (Z-ZDR; top) and reflectivity– specific differential phase (Z-KDP; bottom) frequency distributions, normalized by maximum frequency, for 1200–1500 UTC (percent, color shadings from 2% to 100% for the convective region; black contours at 5, 30, 70, and 90% for the stratiform region). (a,d) The S-POL radar observations (below 3 km elevation) and POLARRIS-f simulations converted from the WRF output using the (b,e) MORR and (c,f) WDM6 microphysics schemes. The statistics from the simulations were limited to below approximately 2.75 km. Z was binned from 0 to 60 dBZ every 1 dBZ and both ZDR and KDP were binned from −0.5 to 4.5 dB (or °/km) every 0.05 dB (or °/km).
The specific differential phase is highly responsive to the amount of liquid water. Consistent with the KDP below 0.5°/km in Figure 7c,f,i, the PDFs obtained from both observations and simulations for stratiform samples exhibit high frequencies of close to zero KDP across a broad range of Z values (10 to 40 dBZ) (contours in Figure 8d−f). The low KDP and similarly low ZDR in both WDM6 and the observational data are indicative of a low concentration of small- to moderate-sized drops in the stratiform region. The MORR scheme showed similar KDP but higher ZDR values compared with the observations of the stratiform region, indicating DSDs with a small number of much larger raindrops collocated with low water content overall (Figure 8b,e). For convective samples, the modal distribution of KDP values with a frequency greater than 30% ranged from 0.2 to 2.2°/km in the observations; in both simulations, these values were lower than 1.5°/km, consistent with the findings shown in Figure 7 and similar to those reported by Putnam et al. [26]. Compared with the observations, the MORR scheme exhibited narrower KDP and ZDR distributions for a given reflectivity and performed well for moderate convection, further demonstrating the absence of an adequate quantity of large raindrops in the convective region. Similarly, the low KDP values in WDM6 indicate that there is an overall bias toward lower numbers of large raindrops and lower water contents in the two double-moment model microphysics schemes.
4.2.2. Vertical Cross Sections
Vertical cross sections oriented perpendicular to the squall line can be used to examine the structure of the system in more detail (Figure 9). The dashed black line in Figure 9 indicates the freezing level, which was obtained from a 1200 UTC sounding at the same site as S-POL and is located at ~4 km. In the cross sections of Z and ZDR from S-POL (Figure 9a,b), the trailing stratiform region is split from the leading convective line by a weak echo transition zone with lower Z and ZDR values. The melting layer in the stratiform part is marked by a well-pronounced abrupt drop in ZDR with altitude (Figure 9b). Another notable polarimetric signature is the ZDR column associated with the convective updraft, which is located at the front of the squall line and extends up to a height of 5 km (i.e., ~1 km higher than the freezing level). The maximum ZDR (~3.5–4 dB) was concentrated between the surface and a height of 2 km (Figure 9b), corresponding to slightly lower KDP (~1.5–2°/km) beneath an overhang structure in the KDP profile (Figure 9c), which indicates a moderate concentration of large raindrops near the ground. This is supposed to be the result of size sorting, since large raindrops enlarge by acquiring cloud droplets when falling, whereas smaller drops are carried upwards by the rising air [65]. KDP values in excess of 1°/km were observed at the upper part of the ZDR column; this phenomenon, known as the KDP Column, is attributed to the occurrence of supercooled raindrops or water-coated hail adjacent to the updraft [66,67]. The overhang of KDP below the freezing level is associated with high Z values (>60 dBZ), which is likely due to the melting of graupel and hail into raindrops, thus resulting in increased KDP.
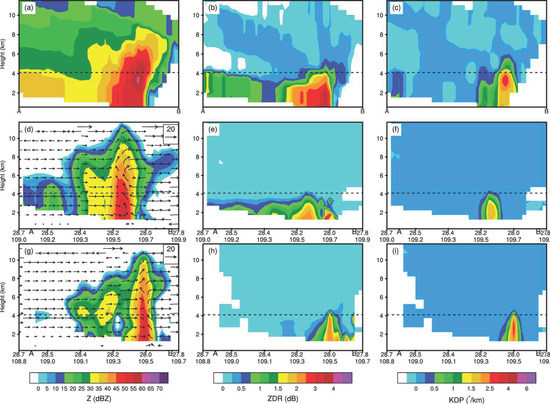
Figure 9.
Cross section of (a,d,g) radar reflectivity (Z; dBZ), (b,e,h) differential reflectivity (ZDR; dB), and (c,f,i) KDP (°/km) from the (a–c) S-POL radar and (d–f) MORR and (g–i) WDM6 microphysics schemes. The dashed black line indicates the freezing level and the black arrows represent wind (m/s). The black lines in Figure 7 a,d,g indicate the locations of the cross-section plots.
The simulated Z distributions and the coupling of updrafts to high Z values (Figure 9d,g) are consistent with radar observations. Both schemes also reproduce a ZDR column-like feature stretching up to the freezing level in the convective core (Figure 9e,h), though the simulated ZDR columns are narrower and weaker (1.5–2.5 dB) than observed. The MORR scheme additionally exhibits a ZDR peak (>3 dB; near 28.0°N, 109.7°E) near the surface ahead of the ZDR column, along with a low Z value, suggesting the existence of large raindrops within a region of weak convection, where this would be unexpected. Previous studies [26,38] found similar ZDR spikes in MORR and attributed them to the fact that the parameterization of the rain breakup rate in MORR depends on the value of the mixing ratio [28], so that the low efficiency of rain breakup in low-precipitation regions with a small mixing ratio could result in locally large drops. In the stratiform region, the melting layer that manifests as a decrease in ZDR with height is better captured by MORR than WDM6, though its height is slightly lower than observed. The KDP columns, which are co-located with the ZDR columns, are located adjacent to the updraft region in MORR and WDM6 (Figure 9f,i), in agreement with expectations. The KDP values for the KDP column in both schemes were close to the radar observation values (0–3°/km) as with, e.g., [68,69], but neither scheme captured the distinct KDP overhang structure. As with the ZDR columns, the KDP column in the simulations is clearly narrower than in the observations, especially in WDM6.
4.2.3. Composite Vertical Structure
The accurate temporal and spatial modeling of an observed squall line system is challenging; to further assess the effectiveness of the schemes under study, we produced a statistical comparison of the simulated polarimetric variables and the radar measurements for similar storm evolution phases (1200–1500 UTC) using contoured-frequency-with-altitude diagrams (CFADs) and composite profiles.
The CFADs of Z generated from S-POL radar observations and the MORR and WDM6 schemes for the convective and stratiform regions are shown in Figure 10. Close to the surface (i.e., below 3 km) in the convective region (Figure 10a–c), the maximum frequency contours of the MORR and WDM6 schemes (Figure 10b,c) tilt slightly to the right, with Z values increasing from ~42 dBZ at 3 km to 45–50 dBZ at the surface. Such a negative slope is not visible in the radar data (Figure 10a). Nevertheless, these simulated Z values (45–50 dBZ) near the surface are still slightly lower than the observed (50 dBZ). For the middle-upper levels (above 4 km) of the convective region, the observed and simulated Z values at the frequency maximum both decrease sharply with height. This fingerprint is associated with ice growth processes, suggesting precipitable particles increase in size by deposition, aggregation, or riming [24,70]. In the stratiform region (Figure 10d–f), the simulated Z exhibits a broader distribution throughout the altitude layer compared with observations, extending to around 45 dBZ (and >45 dBZ in WDM6) at a height of 6 km, with values between 30 and 45 dBZ occurring frequently below the freezing level, which is an overestimate of about 5 dBZ. Another distinct discrepancy between the model and radar stratiform Z CFADs occurs below 2 km, with a significantly negative slope in the frequency contours at reflectivity thresholds > 40 dBZ near the surface in simulations (Figure 10e,f).
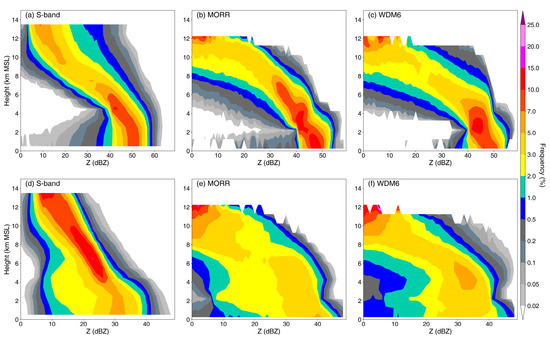
Figure 10.
Contoured frequency by altitude diagrams (CFADs) for reflectivity over (top panels) convective and (bottom panels) stratiform regions, from (a,d) S-POL radar and the (b,e) MORR and (c,f) WDM6 microphysics schemes. The time period of the analysis is 1200–1500 UTC.
Figure 11a,b show the vertical profiles of median Z values and the interquartile range for each altitude layer. The median Z values for the convective region (Figure 11a) at 12 km (~10 dBZ) are nearly 10 dBZ lower than the radar value (~20 dBZ) for both MORR and WDM6, indicating the underprediction of convection by both schemes. For the stratiform region (Figure 11b), the underestimation of median Z values above the −20 °C levels is also evident, suggesting weaker deposition in MORR and WDM6 compared with observations, interpreted as a consequence of the weaker residual buoyancy [8] due to the underprediction of previous convection. However, the median Z values between the −20 °C level and the freezing level, and the increases in those values, were greater in both schemes than in the radar observations (Figure 11b). These extreme Z values within 3 km above the freezing level are consistent with the HID classification of snow aggregates and graupel in the simulations (see Section 4.3 for a detailed discussion) and indicate exaggerated aggregation and riming [8,20,68]. Also, below 2 km the median profile increased more rapidly in MORR and WDM6 than in the S-POL radar data—except for the final 1 km inversion in WDM6 (Figure 11b)—which is consistent with Figure 10e,f and could be associated with the overestimated collision–coalescence of raindrops [71].
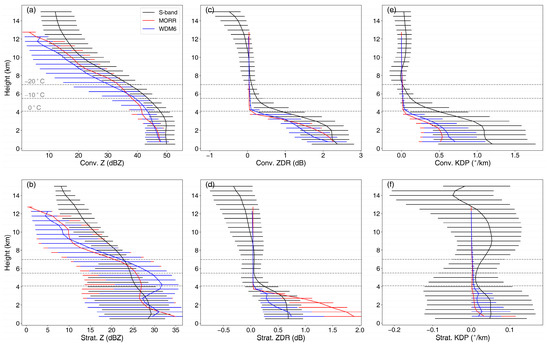
Figure 11.
Comparison of (a,b) Z, (c,d) differential reflectivity (ZDR), and (e,f) specific differential phase (KDP) median profiles over (top) convective and (bottom) stratiform regions for S-POL radar and the MORR and WDM6 microphysics schemes in the sampling period 1200–1500 UTC. Error bars denote the interquartile range for each altitude layer. The gray dashed lines indicate the 0 °C, −10 °C, and −20 °C levels as recorded by soundings, with the lowest value at the bottom and the highest at the top.
The vertical profiles of ZDR and KDP median values and interquartile ranges for radar observations and the two schemes are compared in Figure 11c–f. The observed convective ZDR median increases sharply from around 0.4 dB at 1 km above the freezing level to 2.2 dB at the 2 km level and then remains almost constant toward the surface (Figure 11c). The positive ZDR values above the freezing level are primarily attributable to supercooled raindrops that are transported by the strong updrafts [10,27]. This is also reflected in the observed convective KDP (the black line with bars in Figure 11e), which is partially related to the liquid water content, with an upper quartile value of approximately 0.4°/km at 1 km above the freezing level. Focusing on the warm cloud layers, MORR and WDM6 reproduce the observed ZDR and KDP profile shapes in the convective region reasonably well. It is clear that Z, ZDR, and KDP all markedly increase within the initial 1–2 km beneath the freezing level as a result of melting and subsequent collision–coalescence processes. Below 2 km, the increases diminish in the observations but are persistent for ZDR in the two schemes and KDP in WDM6. These findings suggest that the raindrop evaporation and/or breakup and coalescence processes are largely canceled out in the observational data, whereas the coalescence process is dominant in both schemes, where the conversion of cloud drops to raindrops is much more active in the WDM6 scheme, leading to an increase in KDP [71,72]. However, the ZDR and KDP median values are consistently lower throughout the warm cloud layers in the convective region for the two schemes than in the radar observations, suggesting a significant underestimation of raindrop size and liquid water content in this region.
The most distinct features of ZDR in the stratiform regions (Figure 11d) are that the ZDR values and the rates of increase in median ZDR (0.1–1.9 dB) within the warm cloud layers are highest in the MORR scheme, such that the ZDR maximum is actually close to the typical value for convection regions (Figure 11c). As mentioned earlier (Figure 8b), this suggests that MORR exaggerates the size of raindrops in the stratiform region. Meanwhile, such a dramatic increase in ZDR and a slight increase in KDP below 2 km further support the conclusion evidenced by the plots shown in Figure 10d–f and Figure 11b that the collision–coalescence of raindrops in this region is overestimated in the MORR scheme. The rate of ZDR increase in WDM6 is also higher than that of the radar observations, indicating more efficient collision–coalescence processes; however, ZDR values are underestimated by about 0.3 dB for the initial 2 km beneath the freezing level in the former. The interquartile ranges of KDP over stratiform regions in WDM6 exhibit a narrow distribution, peaking at around 0.1°/km with a slight negative offset in the lowest 1 km, suggesting limited liquid water content and slightly dominant evaporation processes.
4.3. Statistical Comparison of Hydrometeors
To gain further insight into the differences in microphysical characteristics, we created stacked frequency by altitude diagrams (SFADs) of HID integrated over mature storm stages for the radar and model data (Figure 12). The probability-based analysis aids in mitigating the ambiguities of the HID algorithm and ascertains the predominant hydrometeor type in specific vertical layers [10,16].
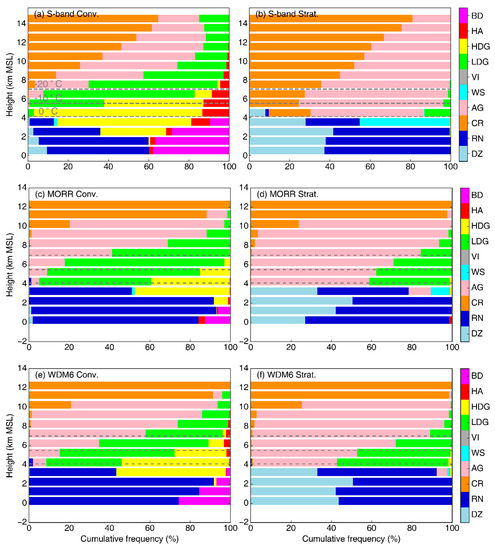
Figure 12.
Hydrometeor identification frequency by height for convective (left) and stratiform (right) regions from (a,b) S-POL radar and the (c,d) MORR and (e,f) WDM6 microphysics schemes during 1200–1500 UTC. DZ = drizzle, RN = rain, CR = ice crystals, AG = aggregates, WS = wet snow, VI = vertical ice, LDG = low-density graupel, HDG = high-density graupel, HA = hail, BD = big drops/melting hail. The 0, −10, and −20 °C levels are indicated by gray dashed lines, as in Figure 11.
The HID SFAD for the observed convective rain (Figure 12a) is marked by a large percentage of heavily rimed particles (hail, low- and high-density graupel) above the freezing level, with the highest proportion reaching almost 100% between the –20 °C level and the freezing level and still accounting for ~15–65% above the –20 °C level. Although both the MORR and WDM6 schemes tend to produce similar distributions of rimed particles, MORR predicts negligible amounts of hail. Both MORR and WDM6 significantly underestimated the fractions of high-density graupel at the mid-levels (28% and 39% vs. 63% on average) and low-density graupel at the upper levels (17% and 16% vs. 29% on average; Figure 12a,c,e). These discrepancies suggest much more active ice-phase processes in the observed convection, especially the riming processes of ice particles collecting liquid/supercooled drops between the freezing and −10 °C levels. The more efficient riming process and subsequent melting in the S-POL observations commonly result in larger quantities of graupel and stronger raindrop growth within the melting layer, which advances high proportions of big drops (40%) below the melting layer (Figure 12a). By contrast, less than 20% of hydrometeors in the convective samples were determined to be large drops in the two schemes (Figure 12c,e). According to Leinonen and von Lerber [73], the number and size of the melted raindrops vary with the degree of riming. Rime can trap a considerable quantity of meltwater due to its porous structure, whereas if the particles are unrimed or lightly rimed the meltwater is instantly visible when the melting begins, resulting in a lower melting rate.
For the stratiform samples, ice crystals and aggregates each account for almost 50% of the hydrometeors above the freezing level in the S-POL radar observations (Figure 12b), whereas aggregates dominate in the MORR and WDM6 schemes (Figure 12d,f) except at the upper levels (above 11 km) where high fractions of ice crystals are observed. Additionally, simulations from both MORR and WDM6 tend to overestimate the graupel fractions at the mid-levels compared with the observed HID SFADs (Figure 12b,d,f; 36% and 43% vs. 7% on average) as also reflected in the biases in Z at these altitudes (Figure 11b). In stratiform regions, these rimed aggregates may be left over from collapsing convection [8]. In principle, there are three ways to induce a high bias in reflectivity if the particles are overly dense, numerous, or oversize. Due to their large size, a large fraction of snow aggregates would be expected to dominate the radar signal in this layer, but their fractions are similar among the three stratiform regions. It should be noted that the snow density assumed by the MORR and WDM6 schemes (and correspondingly in the forward simulator) is 100 kg/m3, which is much smaller than the assumed density of more rimed graupel (400 and 500 kg/m3). It appears likely that the overestimation of Z values in simulations is due to either the larger assumed graupel density or a larger graupel fraction. As expected, a rain layer of drizzle and moderate-sized drops (indicated by RN in Figure 12) is also observed in the stratiform region, as well as a melting layer largely composed of wet snow rather than graupel (Figure 12b). However, wet snow, an indicator of a melting layer [8], only accounts for around 10% in MORR and less than 5% in WDM6. Below the melting layer in the MORR simulation, an appreciable increase in moderate-sized drop fraction occurs at the lowest 2 km level, indicating enhancing warm rain growth processes in this layer, which may explain the distinct increases in the polarimetric radar variables at this altitude (Figure 11b,d,f).
Note that the depth and microphysical processes of warm cloud layers of the squall line vary by region [5,38] and season [11] and can strongly influence the potential for intense rainfall. The balanced warm-rain processes for the squall line from central China, as outlined earlier, are consistent with the findings in East China [11]. However, the coalescence process is weaker because the depth of the warm cloud layer in spring is shallower than in summer (~4 km vs. 5 km). Many problems still exist in the simulation, such as the weaker intensity of the cold pool in MORR compared to WDM6. This result is different from the findings of Qian et al. [31] for a squall line in southeast China under a weak-forcing environment but is consistent with those of Zhou et al. [38] for a merger-formation bow echo under the same conditions. The source of these scheme biases requires further investigation. There are some uncertainties that could have an impact on the findings of the present study. For instance, the radar forward operator, which converts model output data into simulated polarimetric variables, contains uncertainties. Assumptions must be made regarding the aspect ratio, orientation, and shape of the particles in order to calculate scattering properties. This information is not usually included in the model and often limits the simulation of polarization variables above the melting layer.
5. Conclusions
In this study, we compared polarimetric radar variables derived by the WRF and POLARRIS-f models and the corresponding hydrometeor species with radar observations and retrievals for a severe squall line observed over central China on 16 March 2022. Two double-moment microphysics schemes, MORR and WDM6, were tested, and both simulations were able to capture the major structure of the squall line, including the leading convective line and the trailing stratiform structure and a cool pool, despite the absence of the transition zone with low Z and low ZDR. However, the dominant polarimetric features and microphysical variability simulated in both schemes differed considerably from the polarimetric radar observations.
The model-simulated drop size distributions (DSDs) present realistic differences in patterns between convective and stratiform regions, but for convective regions they produce lower frequencies of large drops and lower liquid water content than observed. Conversely, the high Z and ZDR values in stratiform regions indicate that drop size was overestimated in the DSDs for stratiform rain within the MORR scheme.
Both simulations reproduce the classical polarimetric signatures of the observed ZDR and KDP columns, which are colocated with convective updrafts, though the corresponding widths are narrower than those in the radar observations due to underpredicted convection. Weaker convective updrafts are incapable of lofting enough supercooled raindrops up to the levels of subfreezing temperatures to produce the wider ZDR and KDP columns as observed.
Ice-phase processes were underestimated in the convective region, particularly riming processes. The highest median Z values were observed in the radar data at all vertical levels, positive values of ZDR and KDP were evident above the freezing level, and the highest fractions of graupel and hail were observed between the –20 °C level and the freezing level, indicating active riming processes of ice particles collecting liquid/supercooled drops. By contrast, Z values were lowest in MORR between the −20 °C and 0 °C levels, followed by WDM6; this underestimation of Z is consistent with the results obtained from the comparison of the degree of riming, where MORR predicts negligible amounts of hail and underestimates the occurrence of high-density graupel at the mid-levels similar to WDM6. The limited degree of riming can lead to reduced fall speeds and melting rates and, consequently, sequentially lower frequencies of large drops and lower liquid water content in WDM6 and MORR than the radar observations, even though warm-rain collision–coalescence processes are overestimated in both schemes.
As for stratiform rain, both schemes underpredict deposition above the −20 °C levels, producing a lower ice crystal fraction and lower Z values, and are unable to reproduce a melting layer consisting mainly of wet snow as observed. We believe that the overprediction of Z values associated with graupel between the –20 °C level and the freezing level is a consequence of higher assumed graupel densities in MORR and WDM6 or larger graupel fractions. This is also an important determinant in the overprediction of raindrop size by MORR below the melting layer. In addition, collisional growth in warm-rain processes is slightly dominant in MORR, while the raindrop evaporation behavior in WDM6 partially offsets the overestimation of ice-phase processes and produces ground DSDs that more closely resemble the radar observations.
Author Contributions
Conceptualization, Y.S.; methodology, Y.S.; Software, Y.S.; validation, Y.S. and Z.Z.; formal analysis, Y.S.; investigation, Y.S. and M.W.; resources, H.L.; writing—original draft preparation, Y.S.; writing—review and editing, Q.G. and Z.Z.; visualization, Y.S.; supervision, Z.Z. and Q.G. All authors have read and agreed to the published version of the manuscript.
Funding
This research was funded by the National Natural Science Foundation of China (grant number 42230612), the Joint Open Project of KLME and CIC-FEMD, NUIST (grant number KLME202211) and the Special Program for Innovation and Development of China Meteorological Administration (CXFZ2022J010).
Data Availability Statement
The polarimetric radar data from the operational S-band radar in Huaihua are available for research from the China Meteorological Administration (CMA) upon request. The radar mosaic reflectivity, radiosonde, and surface data presented in this paper are available from the authors upon request. The data used for the model runs are available from ERA5 web interface (https://cds.climate.copernicus.eu/cdsapp#!/search?text=ERA5 (accessed on 1 January 2021)).
Acknowledgments
The authors thank the support of the open-source radar library Py-ART, CSU RadarTools (https://github.com/CSU-Radarmet/CSU_RadarTools.git (accessed on 27 March 2021)) and POLARRIS-f (https://earth.gsfc.nasa.gov/meso/models/polarris (accessed on 27 March 2021)) regarding the processing of radar data and the simulation of radar variables, respectively. We acknowledge Anwei Lai and Muyun Du (Institute of Heavy Rain, CMA) for their valuable suggestions.
Conflicts of Interest
The authors declare no conflict of interest.
References
- Morrison, H.; Lier-Walqui, M.; Fridlind, A.M.; Grabowski, W.W.; Harrington, J.Y.; Hoose, C.; Korolev, A.; Kumjian, M.R.; Milbrandt, J.A.; Pawlowska, H.; et al. Confronting the Challenge of Modeling Cloud and Precipitation Microphysics. J. Adv. Model. Earth Syst. 2020, 12, e2019MS001689. [Google Scholar] [CrossRef] [PubMed]
- Trömel, S.; Simmer, C.; Blahak, U.; Blanke, A.; Doktorowski, S.; Ewald, F.; Frech, M.; Gergely, M.; Hagen, M.; Janjic, T.; et al. Overview: Fusion of radar polarimetry and numerical atmospheric modelling towards an improved understanding of cloud and precipitation processes. Atmos. Chem. Phys. 2021, 21, 17291–17314. [Google Scholar] [CrossRef]
- Zhao, K.; Huang, H.; Wang, M.; Lee, W.C.; Chen, G.; Wen, L.; Wen, J.; Zhang, G.; Xue, M.; Yang, Z.; et al. Recent Progress in Dual-Polarization Radar Research and Applications in China. Adv. Atmos. Sci. 2019, 36, 961–974. [Google Scholar] [CrossRef]
- Ryzhkov, A.V.; Zrnic, D.S. Radar Polarimetry for Weather Observations; Springer: Cham, Switzerland, 2019; p. 486. [Google Scholar]
- Fan, J.; Han, B.; Varble, A.; Morrison, H.; North, K.; Kollias, P.; Chen, B.; Dong, X.; Giangrande, S.E.; Khain, A.; et al. Cloud-resolving model intercomparison of an MC3E squall line case: Part I—Convective updrafts. J. Geophys. Res. Atmos. 2017, 122, 9351–9378. [Google Scholar] [CrossRef]
- Li, H.; Moisseev, D.; von Lerber, A. How Does Riming Affect Dual-Polarization Radar Observations and Snowflake Shape? J. Geophys. Res. Atmos. 2018, 123, 6070–6081. [Google Scholar] [CrossRef]
- Li, H.; Tiira, J.; Von Lerber, A.; Moisseev, D. Towards the connection between snow microphysics and melting layer: Insights from multifrequency and dual-polarization radar observations during BAECC. Atmos. Chem. Phys. 2020, 20, 9547–9562. [Google Scholar] [CrossRef]
- Barnes, H.C.; Houze, R.A. Precipitation hydrometeor type relative to the mesoscale airflow in mature oceanic deep convection of the Madden-Julian Oscillation. J. Geophys. Res. Atmos. 2014, 119, 13990–914014. [Google Scholar] [CrossRef]
- Huang, H.; Zhao, K.; Chan, J.C.L.; Hu, D. Microphysical Characteristics of Extreme-Rainfall Convection over the Pearl River Delta Region, South China from Polarimetric Radar Data during the Pre-summer Rainy Season. Adv. Atmos. Sci. 2022. [Google Scholar] [CrossRef]
- Chen, G.; Zhao, K.; Lu, Y.; Zheng, Y.; Xue, M.; Zhang, S.; Fan, X. Variability of microphysical characteristics in the “ 21 · 7 ” Henan extremely heavy rainfall event. Sci. China Earth Sci. 2022, 65, 1861–1871. [Google Scholar] [CrossRef]
- Chen, G.; Zhao, K.; Wen, L.; Wang, M.; Huang, H.; Wang, M.; Yang, Z.; Zhang, G.; Zhang, P.; Lee, W.C. Microphysical characteristics of three convective events with intense rainfall observed by polarimetric radar and disdrometer in Eastern China. Remote Sens. 2019, 11, 2004. [Google Scholar] [CrossRef]
- Chang, W.Y.; Lee, W.C.; Liou, Y.C. The kinematic and microphysical characteristics and associated precipitation efficiency of subtropical convection during SoWMEX/TiMREX. Mon. Weather Rev. 2015, 143, 317–340. [Google Scholar] [CrossRef]
- Wen, J.; Zhao, K.; Huang, H.; Zhou, B.; Yang, Z.; Chen, G.; Wang, M.; Wen, L.; Dai, H.; Xu, L.; et al. Evolution of microphysical structure of a subtropical squall line observed by a polarimetric radar and a disdrometer during OPACC in Eastern China. J. Geophys. Res. 2017, 122, 8033–8050. [Google Scholar] [CrossRef]
- Friedrich, K.; Kalina, E.A.; Aikins, J.; Gochis, D.; Rasmussen, R. Precipitation and cloud structures of intense rain during the 2013 great Colorado flood. J. Hydrometeorol. 2016, 17, 27–52. [Google Scholar] [CrossRef]
- Houze, R.A. Orographic effects on precipitating clouds. Rev. Geophys. 2012, 50, 1–47. [Google Scholar] [CrossRef]
- Matsui, T.; Dolan, B.; Rutledge, S.A.; Tao, W.K.; Iguchi, T.; Barnum, J.; Lang, S.E. POLARRIS: A POLArimetric Radar Retrieval and Instrument Simulator. J. Geophys. Res. Atmos. 2019, 124, 4634–4657. [Google Scholar] [CrossRef]
- Ryzhkov, A.; Pinsky, M.; Pokrovsky, A.; Khain, A. Polarimetric radar observation operator for a cloud model with spectral microphysics. J. Appl. Meteorol. Climatol. 2011, 50, 873–894. [Google Scholar] [CrossRef]
- Xie, X.; Shrestha, P.; Mendrok, J.; Carlin, J.; Trömel, S.; Blahak, U.; Bonn Polarimetric Radar forward Operator (B-PRO). CRC/TR32 Database (TR32DB). 2021. Available online: https://www.tr32db.uni-koeln.de/search/view.php?doiID=115 (accessed on 7 July 2021).
- Brown, B.R.; Bell, M.M.; Frambach, A.J. Validation of simulated hurricane drop size distributions using polarimetric radar. Geophys. Res. Lett. 2016, 43, 910–917. [Google Scholar] [CrossRef]
- Köcher, G.; Zinner, T.; Knote, C.; Tetoni, E.; Ewald, F.; Hagen, M. Evaluation of convective cloud microphysics in numerical weather prediction models with dual-wavelength polarimetric radar observations: Methods and examples. Atmos. Meas. Technol. 2022, 15, 1033–1054. [Google Scholar] [CrossRef]
- Jung, Y.; Xue, M.; Zhang, G. Simulations of polarimetric radar signatures of a supercell storm using a two-moment bulk microphysics scheme. J. Appl. Meteorol. Climatol. 2010, 49, 146–163. [Google Scholar] [CrossRef]
- Milbrandt, J.A.; Yau, M.K. A multimoment bulk microphysics parameterization. Part II: A proposed three-moment closure and scheme description. J. Atmos. Sci. 2005, 62, 3065–3081. [Google Scholar] [CrossRef]
- Snyder, J.C.; Bluestein, H.B.; Dawson, D.T.; Jung, Y. Simulations of polarimetric, X-band radar signatures in supercells. Part II: ZDR columns and rings and KDP columns. J. Appl. Meteorol. Climatol. 2017, 56, 2001–2026. [Google Scholar] [CrossRef]
- Chen, G.; Zhao, K.; Huang, H.; Yang, Z.; Lu, Y.; Yang, J. Evaluating Simulated Raindrop Size Distributions and Ice Microphysical Processes with Polarimetric Radar Observations in a Meiyu Front Event Over Eastern China. J. Geophys. Res. Atmos. 2021, 126, e2020JD034511. [Google Scholar] [CrossRef]
- You, C.R.; Chung, K.S.; Tsai, C.C. Evaluating the performance of a convection-permitting model by using dual-polarimetric radar parameters: Case study of SoWMEX IOP8. Remote Sens. 2020, 12, 3004. [Google Scholar] [CrossRef]
- Putnam, B.J.; Xue, M.; Jung, Y.; Zhang, G.; Kong, F. Simulation of polarimetric radar variables from 2013 CAPS spring experiment storm-scale ensemble forecasts and evaluation of microphysics schemes. Mon. Weather Rev. 2017, 145, 49–73. [Google Scholar] [CrossRef]
- Shrestha, P.; Trömel, S.; Evaristo, R.; Simmer, C. Evaluation of modelled summertime convective storms using polarimetric radar observations. Atmos. Chem. Phys. 2022, 22, 7593–7618. [Google Scholar] [CrossRef]
- Morrison, H.; Thompson, G.; Tatarskii, V. Impact of cloud microphysics on the development of trailing stratiform precipitation in a simulated squall line: Comparison of one- and two-moment schemes. Mon. Weather Rev. 2009, 137, 991–1007. [Google Scholar] [CrossRef]
- Zhao, X.; Lin, Y.; Luo, Y.; Qian, Q.; Liu, X.; Liu, X.; Colle, B.A. A Double-Moment SBU-YLIN Cloud Microphysics Scheme and Its Impact on a Squall Line Simulation. J. Adv. Model. Earth Syst. 2021, 13, e2021MS002545. [Google Scholar] [CrossRef]
- Wu, D.; Dong, X.; Xi, B.; Feng, Z.; Kennedy, A.; Mullendore, G.; Gilmore, M.; Tao, W.K. Impacts of microphysical scheme on convective and stratiform characteristics in two high precipitation squall line events. J. Geophys. Res. Atmos. 2013, 118, 11119–111135. [Google Scholar] [CrossRef]
- Qian, Q.; Lin, Y.; Luo, Y.; Zhao, X.; Zhao, Z.; Luo, Y.; Liu, X. Sensitivity of a Simulated Squall Line During Southern China Monsoon Rainfall Experiment to Parameterization of Microphysics. J. Geophys. Res. Atmos. 2018, 123, 4197–4220. [Google Scholar] [CrossRef]
- Adams-Selin, R.D.; Van Den Heever, S.C.; Johnson, R.H. Impact of graupel parameterization schemes on idealized bow echo simulations. Mon. Weather Rev. 2013, 141, 1241–1262. [Google Scholar] [CrossRef]
- Bryan, G.H.; Morrison, H. Sensitivity of a simulated squall line to horizontal resolution and parameterization of microphysics. Mon. Weather Rev. 2012, 140, 202–225. [Google Scholar] [CrossRef]
- Han, B.; Fan, J.; Varble, A.; Morrison, H.; Williams, C.R.; Chen, B.; Dong, X.; Giangrande, S.E.; Khain, A.; Mansell, E.; et al. Cloud-Resolving Model Intercomparison of an MC3E Squall Line Case: Part II. Stratiform Precipitation Properties. J. Geophys. Res. Atmos. 2019, 124, 1090–1117. [Google Scholar] [CrossRef]
- Morrison, H.; Milbrandt, J.A. Parameterization of cloud microphysics based on the prediction of bulk ice particle properties. Part I: Scheme description and idealized tests. J. Atmos. Sci. 2015, 72, 287–311. [Google Scholar] [CrossRef]
- Naeger, A.R.; Colle, B.A.; Zhou, N.; Molthan, A. Evaluating warm and cold rain processes in cloud microphysical schemes using Olympex field measurements. Mon. Weather Rev. 2020, 148, 2163–2190. [Google Scholar] [CrossRef]
- Feng, Z.; Leung, L.R.; Houze Jr, R.A.; Hagos, S.; Hardin, J.; Yang, Q.; Han, B.; Fan, J. Structure and Evolution of Mesoscale Convective Systems: Sensitivity to Cloud Microphysics in Convection-Permitting Simulations Over the United States. J. Adv. Model. Earth Syst. 2018, 10, 1470–1494. [Google Scholar] [CrossRef]
- Zhou, A.; Zhao, K.; Lee, W.C.; Ding, Z.; Lu, Y.; Huang, H. Evaluation and Modification of Microphysics Schemes on the Cold Pool Evolution for a Simulated Bow Echo in Southeast China. J. Geophys. Res. Atmos. 2022, 127, e2021JD035262. [Google Scholar] [CrossRef]
- Khain, A.P.; Beheng, K.D.; Heymsfield, A.; Korolev, A.; Krichak, S.O.; Levin, Z.; Pinsky, M.; Phillips, V.; Prabhakaran, T.; Teller, A.; et al. Representation of Microphysical Processes in Cloud-Resolving Models: Spectral (bin) Microphysics Versus Bulk Parameterization. Rev. Geophys. 2015, 53, 247–322. [Google Scholar] [CrossRef]
- Chen, H.; Chandrasekar, V.; Bechini, R. An Improved Dual-Polarization Radar Rainfall Algorithm (DROPS2.0): Application in NASA IFloodS Field Campaign. J. Hydrometeorol. 2017, 18, 917–937. [Google Scholar] [CrossRef]
- Cunningham, J.G.; Zittel, W.D.; Lee, R.R.; Ice, L.; Hoban, N.P. Methods for Identifying Systematic Differential Reflectivity (Zdr) Biases on the Operational WSR-88D Network. In Proceedings of the 36th Conference on Radar Meteorology; American Meteorological Society: Brekenridge, CO, USA, 2013; Volume 9, pp. 1–24. [Google Scholar]
- Bell, M.M.; Lee, W.C.; Wolff, C.A.; Cai, H. A solo-based automated quality control algorithm for airborne tail Doppler radar data. J. Appl. Meteorol. Climatol. 2013, 52, 2509–2528. [Google Scholar] [CrossRef]
- Lang, T.J.; Ahijevych, D.A.; Nesbitt, S.W.; Carbone, R.E.; Rutledge, S.A.; Cifelli, R. Radar-Observed Characteristics of Precipitating Systems during NAME 2004. J. Clim. 2007, 20, 1713–1733. [Google Scholar] [CrossRef]
- Lang, T.; Dolan, B.; Guy, N.; Gerlach, C.A.M.; Hardin, J. CSU-Radarmet/CSU_RadarTools: CSU_RadarTools, v1.3; Zenodo: Genève, Switzerland, 2019. [Google Scholar] [CrossRef]
- Heistermann, M.; Collis, S.; Dixon, M.J.; Giangrande, S.; Helmus, J.J.; Kelley, B.; Koistinen, J.; Michelson, D.B.; Peura, M.; Pfaff, T.; et al. The Emergence of Open-Source Software for the Weather Radar Community. Bull. Am. Meteorol. Soc. 2015, 96, 117–128. [Google Scholar] [CrossRef]
- Skamarock, C.; Klemp, B.; Dudhia, J.; Gill, O.; Liu, Z.; Berner, J.; Wang, W.; Powers, G.; Duda, G.; Barker, D.M.; et al. A Description of the Advanced Research WRF Model Version 4; National Center for Atmospheric Research: Boulder, CO, USA, 2019. [Google Scholar] [CrossRef]
- Hersbach, H.; Bell, B.; Berrisford, P.; Hirahara, S.; Horányi, A.; Muñoz-Sabater, J.; Nicolas, J.; Peubey, C.; Radu, R.; Schepers, D.; et al. The ERA5 global reanalysis. Q. J. R. Meteorol. Soc. 2020, 146, 1999–2049. [Google Scholar] [CrossRef]
- Cha, D.-H.; Jin, C.-S.; Lee, D.-K.; Kuo, Y.-H. Impact of intermittent spectral nudging on regional climate simulation using Weather Research and Forecasting model. J. Geophys. Res. 2011, 116, 1–11. [Google Scholar] [CrossRef]
- Lim, K.-S.S.; Hong, S.-Y. Development of an Effective Double-Moment Cloud Microphysics Scheme with Prognostic Cloud Condensation Nuclei (CCN) for Weather and Climate Models. Mon. Weather Rev. 2010, 138, 1587–1612. [Google Scholar] [CrossRef]
- Hong, S.Y.; Dudhia, J.; Chen, S.H. A revised approach to ice microphysical processes for the bulk parameterization of clouds and precipitation. Mon. Weather Rev. 2004, 132, 103–120. [Google Scholar] [CrossRef]
- Martin, G.M.; Johnson, D.W.; Spice, A. The Measurement and Parameterization of Effective Radius of Droplets in Warm Stratocumulus Clouds. J. Atmos. Sci. 1994, 51, 1823–1842. [Google Scholar] [CrossRef]
- Kain, J.S. The Kain–Fritsch Convective Parameterization: An Update. J. Appl. Meteorol. 2004, 43, 170–181. [Google Scholar] [CrossRef]
- Janjić, Z.I. The Step-Mountain Eta Coordinate Model: Further Developments of the Convection, Viscous Sublayer, and Turbulence Closure Schemes. Mon. Weather Rev. 1994, 122, 927–945. [Google Scholar] [CrossRef]
- Iacono, M.J.; Delamere, J.S.; Mlawer, E.J.; Shephard, M.W.; Clough, S.A.; Collins, W.D. Radiative forcing by long-lived greenhouse gases: Calculations with the AER radiative transfer models. J. Geophys. Res. Atmos. 2008, 113, D13103. [Google Scholar] [CrossRef]
- Dudhia, J. Numerical Study of Convection Observed during the Winter Monsoon Experiment Using a Mesoscale Two-Dimensional Model. J. Atmos. Sci. 1989, 46, 3077–3107. [Google Scholar] [CrossRef]
- Janjić, Z.I. The Step-Mountain Coordinate: Physical Package. Mon. Weather Rev. 1990, 118, 1429–1443. [Google Scholar] [CrossRef]
- Dudhia, J. A Multi-layer Soil Temperature Model for MM5. Proceedings of Paper Presented at 6th Annual MM5 Users Workshop, Boulder, CO, USA, 27–30 June 1996. [Google Scholar]
- Garnett, J.C.M. Colours in Metal Glasses and in Metallic Films. Philos. Trans. R. Soc. London. Ser. A Contain. Pap. A Math. Or Phys. Character 1904, 203, 385–420. [Google Scholar] [CrossRef]
- Powell, S.W.; Houze, R.A.; Brodzik, S.R. Rainfall-type categorization of radar echoes using polar coordinate reflectivity data. J. Atmos. Ocean. Technol. 2016, 33, 523–538. [Google Scholar] [CrossRef]
- Steiner, M.; Houze, R.A.; Yuter, S.E. Climatological characterization of three-dimensional storm structure from operational radar and rain gauge data. J. Appl. Meteorol. 1995, 34, 1978–2007. [Google Scholar] [CrossRef]
- Dolan, B.; Rutledge, S.A.; Lim, S.; Chandrasekar, V.; Thurai, M. A robust C-band hydrometeor identification algorithm and application to a long-term polarimetric radar dataset. J. Appl. Meteorol. Climatol. 2013, 52, 2162–2186. [Google Scholar] [CrossRef]
- He, Z.; Zhang, Q.; Zhao, K.; Hu, H. Initiation and Evolution of Elevated Convection in a Nocturnal Squall Line Along the Meiyu Front. J. Geophys. Res. Atmos. 2018, 123, 7292–7310. [Google Scholar] [CrossRef]
- Park, H.S.; Ryzhkov, A.V.; Zrnić, D.S.; Kim, K.-E. The Hydrometeor Classification Algorithm for the Polarimetric WSR-88D: Description and Application to an MCS. Weather Forecast. 2009, 24, 730–748. [Google Scholar] [CrossRef]
- Chen, G.; Zhao, K.; Zhang, G.; Huang, H.; Liu, S.; Wen, L.; Yang, Z.; Yang, Z.; Xu, L.; Zhu, W. Improving Polarimetric C-Band Radar Rainfall Estimation with Two-Dimensional Video Disdrometer Observations in Eastern China. J. Hydrometeorol. 2017, 1375–1391. [Google Scholar] [CrossRef]
- Bringi, V.N.; Burrows, D.A.; Menon, S.M. Multiparameter Radar and Aircraft Study of Raindrop Spectral Evolution in Warm-based Clouds. J. Appl. Meteorol. Climatol. 1991, 30, 853–880. [Google Scholar] [CrossRef]
- Hubbert, J.; Bringi, V.N.; Carey, L.D.; Bolen, S. CSU-CHILL Polarimetric Radar Measurements from a Severe Hail Storm in Eastern Colorado. J. Appl. Meteorol. 1998, 37, 749–775. [Google Scholar] [CrossRef]
- Loney, M.L.; Zrnić, D.S.; Straka, J.M.; Ryzhkov, A.V. Enhanced Polarimetric Radar Signatures above the Melting Level in a Supercell Storm. J. Appl. Meteorol. (1988–2005) 2002, 41, 1179–1194. [Google Scholar] [CrossRef]
- Straka, J.M.; Zrnić, D.S.; Ryzhkov, A.V. Bulk Hydrometeor Classification and Quantification Using Polarimetric Radar Data: Synthesis of Relations. J. Appl. Meteorol. 2000, 39, 1341–1372. [Google Scholar] [CrossRef]
- Ryzhkov, A.V.; Schuur, T.J.; Burgess, D.W.; Zrnic, D.S. Polarimetric Tornado Detection. J. Appl. Meteorol. 2005, 44, 557–570. [Google Scholar] [CrossRef]
- Sun, Y.; Dong, X.; Cui, W.; Zhou, Z.; Fu, Z.; Zhou, L.; Deng, Y.; Cui, C. Vertical Structures of Typical Meiyu Precipitation Events Retrieved from GPM-DPR. J. Geophys. Res. Atmos. 2020, 125, e2019JD031466. [Google Scholar] [CrossRef]
- Houze, R.A., Jr. Cloud Dynamics, 2nd ed.; Elsevier/Academic Press: Oxford, UK, 2014; pp. 141–165. [Google Scholar]
- Kumjian, M.R.; Prat, O.P. The impact of raindrop collisional processes on the polarimetric radar variables. J. Atmos. Sci. 2014, 71, 3052–3067. [Google Scholar] [CrossRef]
- Leinonen, J.; von Lerber, A. Snowflake Melting Simulation Using Smoothed Particle Hydrodynamics. J. Geophys. Res. Atmos. 2018, 123, 1811–1825. [Google Scholar] [CrossRef]
Disclaimer/Publisher’s Note: The statements, opinions and data contained in all publications are solely those of the individual author(s) and contributor(s) and not of MDPI and/or the editor(s). MDPI and/or the editor(s) disclaim responsibility for any injury to people or property resulting from any ideas, methods, instructions or products referred to in the content. |
© 2023 by the authors. Licensee MDPI, Basel, Switzerland. This article is an open access article distributed under the terms and conditions of the Creative Commons Attribution (CC BY) license (https://creativecommons.org/licenses/by/4.0/).