Abstract
We report an open-path incoherent broadband cavity-enhanced absorption spectroscopy (OP-IBBCEAS) technique for in situ simultaneous optical monitoring of NO2, NO3, and H2O in a reaction chamber. The measurement precision values (1σ) are 2.9 ppbv and 2.9 pptv for NO2 and NO3 in 2 s, respectively, and the measurement uncertainties are 6% for NO2 and 14% for NO3. Intercomparison of measured concentrations of NO2 and NO3 by open-path and extractive IBBCEAS was carried out in the SAES-ARC reaction chamber during the reaction of NO2 with O3. The measurement accuracy of OP-IBBCEAS is verified by an NO2 intercomparison and the NO3 transmission efficiency of the extractive IBBCEAS is determined by comparison against the in situ NO3 measurement. The relationship between H2O absorption cross section and its mixing ratio at 295 K and 1 atm was analysed. Due to the spectral resolution of IBBCEAS system, the strong and narrow absorption lines of H2O are unresolved and exhibit non-Beer–Lambert Law behaviour. Therefore, a correction method is used to obtain the effective absorption cross section for fitting the H2O structure. An inappropriate H2O absorption cross section can cause an overestimation of NO3 concentration of about 28% in a humid atmosphere (H2O = 1.8%). This spectroscopic correction provides an approach to obtain accurate NO3 concentrations for open-path optical configurations, for example in chamber experiments or field campaigns. The measurement precision values are improved by a factor of 3 to 4 after applying Kalam filtering, achieving sub-ppbv (0.8 ppbv) and sub-pptv (0.9 pptv) performance in 2 s for NO2 and NO3, respectively.
1. Introduction
The nitrate radical (NO3) governs the radical chemistry in the nocturnal troposphere [1,2]. The source of NO3 is attributed to the formed through the reaction of nitrogen dioxide with ozone (Reaction (R1)):
NO3 and N2O5 are generally in thermal equilibrium (Reactions (R2)) governed by the NO2 concentration and the ambient temperature [3]:
NO3 is lost via oxidation reaction with alkenes, aldehydes, and biogenic volatile organic compounds (VOCs; Reaction (R3)), which can lead to the formation of secondary aerosol (SOA) [4,5]:
The lifetime of NO3 is short and its concentration is extremely low in the troposphere (in pptv range) due to its high reactivity. As a result, measurement of NO3 is demanding, requiring high sensitivity and accuracy, together with high spatial and temporal resolution [1].
NO3 absorbs red light efficiently via the strong electronic transition [6]. This strong visible absorption band has been the basis for many spectroscopic approaches to NO3 detection. In the 1970s, NO3 radicals were first detected in the troposphere using long-path differential optical absorption spectroscopy (LP-DOAS), which was a pioneering method for measuring NO3 in field experiments [7,8,9,10,11] and in chamber studies [12,13,14]. However, LP-DOAS measures the average mixing ratio over an optical path of several kilometres. The local mixing ratio of NO3 at a specific site cannot be accurately quantified.
Among in-situ measurements, cavity ring-down spectroscopy (CRDS) was developed and wildly deployed for laboratory studies [15,16] and field measurements of NO3 [3,17,18]. Fiedler et al. [19] firstly proposed Incoherent broad-band cavity-enhanced absorption spectroscopy (IBBCEAS). The IBBCEAS (also termed BBCEAS, BBCES, or CE-DOAS) technique has been successfully applied for monitoring trace gas and aerosol extinction in recent years [20,21,22,23,24,25,26,27,28]. Extractive IBBCEAS systems have been successfully developed for the ground, vertical and airborne measurement of NO3 and N2O5 [25,29,30,31,32,33,34] thanks to their high sensitivity and accuracy with high temporal resolution as CRDS. Since cavity-based instruments need to sample air into the optical cavity, losses of NO3 on instrument surfaces must be quantified. The particle chemical compound, moisture content, air temperature and relative humidity [25,35] are the main factors impacting the transmission efficiency of NO3 and contribute to the overall measurement uncertainty.
To avoid NO3 sampling losses, open-path IBBCEAS (OP-IBBCEAS) was developed to measure NO3 mixing ratios in a reaction chamber [20]. Shortly afterward, the OP-IBBCEAS was extended to other atmospheric trace gases like HONO, NO2, SO2, H2O, IO, I2, BrO, Br2, O3, Formaldehyde (CH2O), and nitrophenols et al. in the reaction chamber [21,23,36,37,38,39,40,41,42,43] and in field measurements [44,45,46]. Although an open-path approach avoids sampling losses, other challenges arising from the influence of aerosol extinction and water vapour on the spectral analysis should also be taken into account.
In this work, we set up a Laser-Driven Light Source (LDLS) based OP-IBBCEAS system coupled to a reaction chamber, and the design and performance are described. We use this open-path system to measure the mixing ratios of NO2 and NO3 and compare these measurements against those from an extractive IBBCEAS instrument. The transmission efficiency of the extractive NO3-IBBCEAS system was directly obtained by comparing the measured NO3 concentrations. A correction method to obtain the effective absorption cross section of H2O based on its mixing ratio is proposed and the influence of the water vapour mixing ratio on retrieving NO3 is discussed. In the context of chamber experiments, the application of Kalman filtering to the OP-IBBCEAS system is explored, and the measurement precision is further improved.
2. Materials and Methods
2.1. Open-Path IBBCEAS
2.1.1. Instrument Setup
Figure 1 shows the OP-IBBCEAS instrument installed in the reaction chamber. The instrument was separated into transmitter and receiver platform. The light source is a Laser-Driven Light Source (LDLS, EQ-99X, Energetiq Technology, USA). Light from the LDLS was focused by a plano-convex lens (f = 60 cm) and collimated into the entrance cavity mirror by two beam steering mirrors. A green diode laser mounted on the transmitter platform was used to adjust the position of the platforms and align the optical cavity. The procedure for initial alignment of the cavity has been described previously [21]. The second cavity mirror was mounted on the receiver platform.
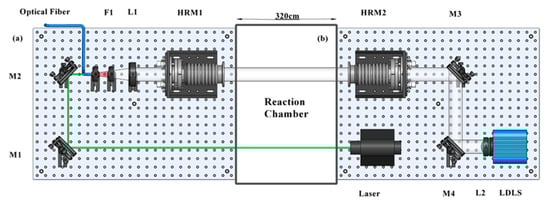
Figure 1.
Schematic layout of the OP-IBBCEAS system and atmospheric simulation chamber (center). (a) The receiver platform. (b) The transmitter platform. These two platforms are installed on both sides of the chamber. M1 to M4 are beam steering mirrors. The high reflectivity mirrors HRM1 and HRM2 were mounted on the frames. F1 is an optical filter. L1 and L2 are the focus lenses.
The high-reflectivity (HR) optical cavity mirrors (Layertec Gmbh) were 50 mm in diameter and had a 7 m radius of curvature. The reflectivity of the HR mirrors is greater than 0.999 from 620 to 670 nm reported by the manufacturer. The transmitted cavity light was focused by a plano-convex lens (f = 60 cm), filtered by a band-pass filter (FF02-675/67-25, Semrock, NY, USA), and coupled into a 100 μm-diameter optical fibre. The fibre was connected to a monochromator (Andor Kymera-328i-A, Andor Tech., Oxford Instruments, Oxford, UK) coupled with a CCD detector (Andor DU420A-BU, Andor Tech., Oxford instruments, Oxford, UK). The monochromator uses 600 l mm−1 diffraction grating (500 nm blaze) and covered a wavelength range between 600 and 724 nm. The spectrometer resolution was determined by fitting the emission line of the mercury argon calibration light source (Hg-1, Ocean Optics) at 692.95 nm, corresponding to 0.54 nm. In order to minimize the dark current, the CCD detector was regulated and stabilized at −60.0 °C. For measurements at SAES, the transmitter unit and the receiver unit were installed on both sides of the cylindrical SAES-ARC chamber, giving a mirror separation d of 3.65 ± 0.04 m.
Both the transmitter and receiver platform were equipped with an adapter board to couple to the reaction chamber. One side of the adapter plate was connected to adjustable mirror mounts through 100 mm flexible bellows (50 mm inner diameter), and the other side was equipped with a 250 mm stainless steel pipe (50 mm inner diameter). The pipes served three purposes: first, The HR mirror could be contaminated by the sample air, resulting in a decrease in mirror reflectivity; purging the mirror is an efficient method to solve this problem. The inert gas could be kept in the pipe to form an air film to isolate the mirror from the sample gas. A flow of high-purity nitrogen (500 mL min−1) was used to purge each cavity mirror. The path length through the reaction chamber was reduced to d = (2.80 ± 0.03) m because of the purging air. Second, the pipe on the receiver platform reduced stray light coupling into the detection system. Third, the pipes made a seal with the Teflon wall of the reaction chamber.
2.1.2. Measurement Principle
Fiedler et al. [19] first described the principle of IBBCEAS method. The extinction coefficient ɛ(λ) of the sample can be determined from the reference spectrum, sample spectrum, effective cavity length and mirror reflectivity:
In Equation (1), I0(λ) is the zero spectrum through “clean” air, I(λ) is the spectrum with sample, λ is the wavelength, d is the effective length through the sample, R(λ) is the mirror reflectivity, σi(λ) and ni are the absorption cross section and number density of ith species, and is the extinction due to the Rayleigh and Mie scattering, respectively. Mie scattering from aerosols should be considered carefully when using an open path configuration in field or chamber settings.
The absorption cross section used to retrieve the mixing ratio of NO2 was convolved from the high-resolution cross section at 293 K and 1000 mbar published by Voigt et al. [47]. The Voigt reference cross section was measured using Fourier-transform spectroscopy and had a resolution of 0.5 cm−1 above 435 nm (about 0.008 nm at 435 nm). The estimated uncertainty of this absorption cross section is about 4%. The absorption cross section used to retrieve the concentration of NO3 was convolved from the cross section at 293 K reported by Yokelson et al. [6]. The resolution of the absorption cross section was around 0.1 nm between 440–694 nm. The uncertainty of this absorption cross section is about 13%. Figure 2a shows the applied absorption cross section of NO2 and NO3 [6,47] convolved to the instrument resolution of OP-IBBCEAS.
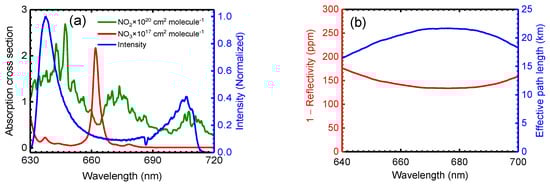
Figure 2.
(a) The green and red spectrum are the absorption cross section of NO2 and NO3 convolved from Voigt et al. [47] and Yokelson et al. [6], respectively. The transmitted light intensity is shown as the blue line. (b) Mirror loss expressed as (1 − R) and the corresponding effective path length.
2.1.3. The Mirror Reflectivity (R(λ))
The number density of absorbing species can be quantified after determining the mirror reflectivity R(λ) (Equation (1)). Various approaches have been taken to determine R(λ) [18,20,21,37,48,49,50]. In this work, R(λ) was determined by using a known concentration of NO2 sample:
Here, and were the transmitted light intensities through the cavity when the chamber was filled with zero air and after NO2 was added, respectively. is the convolved NO2 absorption cross section [47] according to the spectrograph instrument function and is the known number density of NO2. To determine R(λ), NO2 was injected into the chamber up to mixing ratios of 150 ppbv and the NO2 concentrations were measured using a chemiluminescent NOX analyser. Figure 2b shows the mirror reflectivity calibration using this procedure. The reflectivity R(λ) at 675 nm was 0.99987 ± 0.00002 (1 − R = 130 ppm), corresponding to an effective optical path length of 21.7 km ( in the clean chamber.
2.2. Extractive IBBCEAS
- NO2-IBBCEAS
A small extractive NO2-IBBCEAS instrument was also used to quantify NO2. A detailed description of this instrument can be found in [51,52]. In brief, light from a temperature-stabilized blue LED centred at 460 nm and with a full width at half maximum (FWHM) of 25 nm was coupled into a multi-mode fibre and focused into a high-finesse optical cavity. The optical cavity comprised two 25 mm-diameter high-reflectivity (HR) mirrors (R > 0.9999 between 365 and 415 nm) separated by 85 cm. The output light of the cavity was focussed into a multi-mode fibre and coupled into a CCD spectrometer (Maya2000, Ocean Optics, FL, USA) with a spectral resolution of 0.4 nm. Air was sampled from the reaction chamber at 1.5 L min−1 through a 2.0 m-long PFA tube (i.d. = 4.35 mm). The measurement precision (1σ) was 97 pptv for NO2 over 6 s integration time and the associated uncertainty was estimated to be 6%.
- NO3-IBBCEAS
A portable extractive NO3-IBBCEAS instrument was also used to quantify NO3. The instrument was based on the same principle reported above and is described in Wang et al. [25]. The light source was a temperature-stabilized red LED centred at 660 nm and with a FWHM of 25 nm. The optical cavity comprised two 25 mm diameter high-reflectivity (HR) mirrors (>0.9999 at 660 nm) separated by 50 cm. The output light of the cavity was focussed by a plano-convex lens into an optical fibre and coupled into a CCD spectrometer (QE65000, Ocean Optics, FL, USA) with a spectral resolution of 0.85 nm. Air was sampled from the chamber at 2 L min−1 through a PFA tube (length 1.65 m, i.d. 4.35 mm). Particulate matter was removed by an inline Teflon filter with 2 μm pore size, which was replaced before each experiment. This instrument’s measurement cycle is 5 min, including 30 s to measure a reference spectrum and 4 min 30 s to record sample spectra. The reference spectrum was obtained by titrating the sample with a 99.7 ppmv NO (diluted by N2) at 10 mL min−1 flow rate. In this work, the measurement precision (1σ) was 1.7 pptv for NO3 in 6 s integration time and the associated uncertainty was estimated to be 19%.
2.3. The Reaction Chamber (SAES-ARC)
SAES-ARC is an indoor atmospheric simulation chamber located in the Shanghai Academy of Environmental Sciences. A schematic of the reaction chamber and instrumentation is shown in Figure 3a. The reaction chamber is constituted by a Teflon FEP bag of cylindrical shape with a diameter and length of 3.2 m and 2 m, respectively. The reactor volume is about 10.0 m3 and the surface-to-volume ratio is about 2.6 m−1. The reaction chamber is operated at room temperature and atmospheric pressure. The humidity can be modified by a humidification system. A total of 60 black lamps (F40BLB, Philips, Eindhoven, Netherlands) on two of the long sides of the chamber were the light source. The movable blackout curtain is installed on the outside of the chamber to keep the chamber in darkness (as required) and to protect people from the intense UV output of the black lamps. A Teflon-coated fan, mounted on one side of the chamber and 1 m above the chamber floor, ensured a homogeneous distribution of gases and particles inside the chamber. The fan was turned on for several minutes when the trace gas was injected into the chamber. A temperature and humidity sensor (HMP 110, Vaisala, Vantaa, Finland) was used to record the inside temperature and relative humidity (RH). The absolute water vapour mixing ratios were calculated from the temperature, pressure, and RH. The measurement precision of RH was ±1.5% and that of temperature was ±0.2 °C. Ozone was produced by photolyzing pure oxygen with a mercury lamp. The chamber was also equipped with a chemiluminescence NOX analyser (Model 42i, Thermo Scientific, Massachusetts, USA) and a photometric O3 analyser (EC9810, Ecotech, Melbourne, Australia).
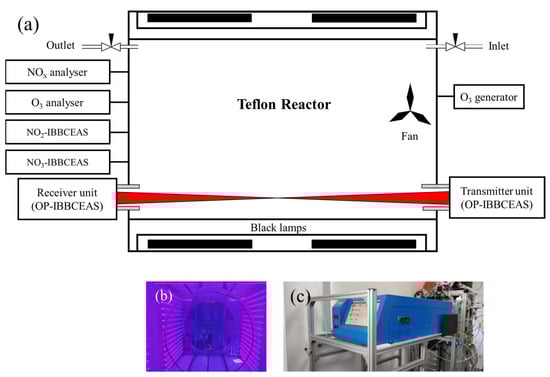
Figure 3.
(a) Schematic of SAES-ARC facility. (b) SAES-ARC with black lamps on. (c) Extractive NO3-IBBCEAS.
2.4. The Effective Cross Section Correction Method
The effective cross section correction method was used to handle the strong absorption of water vapour which overlaps the absorption of NO3 in 662 nm region, and the absorption cross section of water varies with temperature and pressure. Moreover, the water absorption lines are not resolved by typical monochromators, leading to non-Beer-Lambert behaviour that affects the spectral analysis. When retrieving the concentration of NO3, it is crucial to accurately account for the influence of H2O on the spectrum [29,53].
In previous work, the effective cross section was calculated from the absorber’s concentration and cavity residence time [29,30]. Here, the effective cross section was calculated according to the water vapour mixing ratio, mirror reflectivity and the high-resolution cross section of the HITRAN database [31]. In the reaction chamber study, the water vapor tends to be kept at some specific concentration, and it is sufficient to establish a series of effective absorption cross sections according to the instrument function of the spectrometer.
The flow diagram of the calculation of the effective cross section of water vapour of this work is shown in Figure 4.
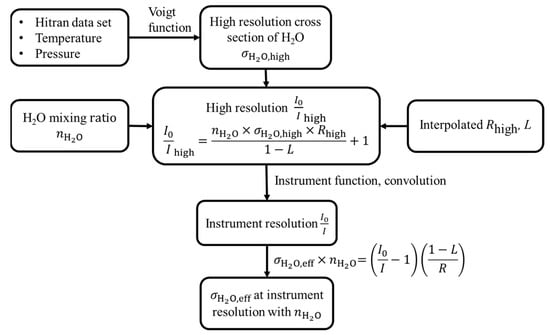
Figure 4.
The flow diagram of the calculation of effective cross section of water vapor at instrumental spectrum resolution.
- The high-resolution cross section of water vapour has been acquired from the HITRAN database [54], and the cross section at the set temperature and pressure can be calculated using the Voigt function [55].
- The high resolution can be calculated by using the H2O mixing ratio , the high-resolution cross section , the interpolated mirror reflectivity , together with the effective cavity length L:
- The instrument resolution was convolved from the high resolution with the instrument function.
- The instrument resolution cross section can be calculated at the set temperature, pressure, and mixing ratio:
3. Results and Discussion
3.1. The Performance of OP-IBBCEAS
The uncertainty of retrieved mixing ratios is mainly attributed to the uncertainties in the cavity length, mirror reflectivity R(λ), and absorption cross section. The uncertainties of the NO2 and NO3 cross sections are approximately 4% and 13% [6,47]; the uncertainty in the NO2 cross section also leads to a 5% uncertainty in the calibration of R(λ). The uncertainty in cavity length is around 1%. The associated measurement uncertainty is around ±6% and ±14% for NO2 and NO3 respectively calculated by the Gaussian error propagation.
The fluctuation of I0 is usually affect the measurement precision of IBBCEAS system, which mainly attributed by the fluctuation of light source and the resonator cavity. The LDLS light source cannot easily temperature stabilized by thermoelectric cooler (TEC) control module like LED. The heat dissipation of LDLS relies on heat exchange with the environmental air. As for indoor chamber experiments, the air temperature was stabilized by air conditioners. The LDLS was turned on for more than 3–4 h to achieve the thermal equilibrium with the air before the I0 was recorded by spectrometer. The stability of LDLS temperature also ensure the stability of I0 throughout out the experiments.
A flexible bellow was used to connect the HR mirror frame and the chamber wall, and it can minimize the effect of chamber vibration on the finely alignment of the cavity. This can also ensure the stability of I0 throughout out the experiments as far as possible.
The standard deviation was used to determine the measurement precision of the CEAS instrument [29,44,56,57]. The deviation analysis result is shown in Figure 5. Serious of 4000 reference spectra with 2 s integration time were continuously collected with the reaction chamber filled with zero-air. The I0 was calculated by averaging the first 100 spectra, and the rest spectra were analysed using this I0. The retrieved concentrations of NO2 and NO3 were used for Gaussian fitting and are shown in Figure 5a,b. The 1σ standard deviation is 2.9 ppbv and 2.9 pptv for NO2 and NO3 in 2 s, respectively.
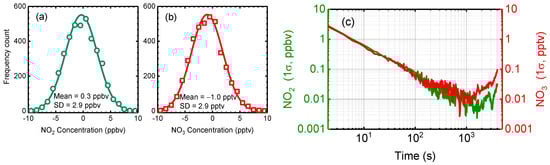
Figure 5.
The standard and Allan deviation analysis result. (a) and (b) are the standard deviation of measured NO2 and NO3 in 2 s integration time, respectively, when the chamber was filled with zero air. (c) Allan deviation analysis result of the measurements of NO2 and NO3.
Allan deviation analysis is a common method for characterizing the stability and sensitivity of an IBBCEAS system [25,28,29,44,56]. The Allan deviation in Figure 5c shows that the precision of OP-IBBCEAS measurements improves up to an averaging time of about 1000 s, at which time the precision is about 0.005 ppbv for NO2 and about 0.01 pptv for NO3. At longer times, the precision decreases due to long-term drift in the system stability [24]. The drift noise of the system might come from the fluctuations in temperature and current of the light source. Deformation of the HR mirror frame caused by the change in environmental temperature may affect the alignment of the cavity, which is also a potential source of drift noise. The 1σ deviations are 2.8 ppbv and 2.6 pptv for NO2 and NO3 in a 2 s integration time, respectively, in agreement with the standard deviation analysis result. Table 1 summarizes the characteristics and performance of existing OP-IBBCEAS for NO3 and NO2 measurements. The OP-IBBCEAS instrument presented in this work has the second longest effective optical path length and achieved the best detection capability.

Table 1.
Comparison of OP-IBBCEAS performances for NO3 and NO2 measurement under ideal conditions.
3.2. Intercomparison of NO2 and NO3
The mirror reflectivity values of the extractive NO2-IBBCEAS and NO3-IBBCEAS instruments were determined according to the difference of Rayleigh scattering cross section between N2 and He. The SAES-ARC chamber was flushed for 8 h with zero air at a flow rate of 60 L min−1 before each experiment. The purified air was supplied by a zero-air generator (ZAS100, Convenient Inc., Beijing, China). In the intercomparison experiments, time-series measurements of NO2 and NO3 were simultaneously performed using the extractive NO2-IBBCEAS, extractive NO3-IBBCEAS and OP-IBBCEAS instruments.
NO2 measurements by the extractive NO2-IBBCEAS and OP-IBBCEAS were compared. The time series result of NO2 mixing ratio during a chamber experiment is shown in Figure 6a. The experiment was carried out in dry (RH = 0.40 ± 0.05%), aerosol-free air at room temperature (22.8 ± 1.0 °C). NO2 was added into the chamber twice at 10:48 and 11:02. After NO2 was fully mixed, O3 was gradually added into the chamber from 11:40, reaching 129 ppbv at 13:30. To ensure that the chamber air was homogeneously mixed, the chamber fan was turned on from 10:48 to 13:30. The chamber was flushed with zero air from 15:00. Figure 6a shows close agreement in the NO2 concentration measured by both the OP-IBBCEAS and the extractive NO2-IBBCEAS.
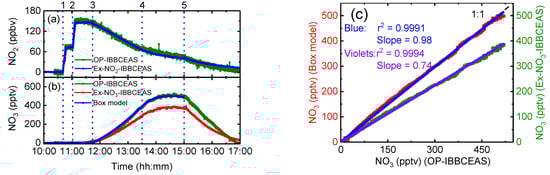
Figure 6.
Time-series measurement of NO2, NO3 concentrations and the NO3 box model simulation results. (a) Time series of NO2 concentrations retrived by OP-IBBCEAS (green data) and extractive NO2-IBBCEAS (blue data). (b) Time series of NO3 concentrations retrived by OP-IBBCEAS (green data), extractive NO3-IBBCEAS (red data), and a box model simulation curve (blue data). The SAES-ARC experiment event sequence was: (1) 10:48, 75 ppbv of NO2 added, fan on; (2) 11:02, 75 ppbv of NO2 added; (3)–(4) 11:40–13:30, 130 ppbv O3 added; (4) 13:30: fan off; (5) 15:00, flush on. (c) Correlation of the measured NO3 concentrations between OP-IBBCEAS and box model simulation (Blue line), and extractive NO3-IBBCEAS (Violet line).
Figure 6b shows the NO3 concentrations retrieved by the extractive NO3-IBBCEAS and OP-IBBCEAS instruments, together with the NO3 simulated by box model. The simulation was based on the initial NO2 concentrations and constrained by the measured O3 concentrations. Figure 6c shows the liner fitting between the measured NO3 concentrations from the OP-IBBCEAS and extractive NO3-IBBCEAS (violets line), together with the concentration from OP-IBBCEAS and box model simulation (blue line). The NO3 concentration measured by OP-IBBCEAS agrees well with box model simulation, and the linear correction coefficient is r2 = 0.9991, the slope and intercept are 0.98 and 0.97 pptv, respectively. The correlation between the OP-IBBCEAS and extractive NO3-IBBCEAS is excellent (r2 = 0.9994) and the intercept is small (1.4 pptv). However, the correlation slope is 0.74, indicating significant losses of NO3 in the extractive system that do not occur in the open-path system across the chamber. The correlation slope was used to correct the extractive NO3-IBBCEAS data. The transmission efficiency obtained here was similar to the value reported by Dorn et al. [14]. Finally, the box model simulation of the NO2-O3 chemical system reproduced the experimentally measured concentration–time profiles very well. Small differences in the measured NO3 concentrations are seen during flushing; these differences likely arise from spatial heterogeneity of NO3 concentrations in the chamber as a result of diluting chamber contents with clean air from a specific location in the chamber.
3.3. Effect of Humidity on the Spectral Analysis
3.3.1. The Cross Section of H2O
To evaluate the interference of H2O cross section accuracy on spectral fitting, the H2O absorption cross sections of different mixing ratios were calculated, for which the method is described in Section 2.4. Figure 7a shows the modified absorption cross sections of H2O at ten different H2O mixing ratios (0.2%, 0.4%, 0.6%, 0.8%, 1.0%, 1.2%, 1.4%, 1.6%, 1.8% and 2.0%), corresponding to relative humidities of 7.7%, 15.3%, 23.0%, 30.7%, 38.3%, 46.0%, 53.7%, 61.3%, 69.0%, and 76.7% at 22 °C. From 658 to 666 nm, the absorption cross section varies differently at different wavelengths, which decreases as the wavelength increases. The change of the convolved H2O absorption cross section with the mixing ratio of H2O from 658.0 nm to 666.0 nm at 1 nm intervals is shown in Figure 7b. Note that the y-axis of Figure 7b is logarithmic and that the changes in the absorption cross sections at different wavelengths are not linear.
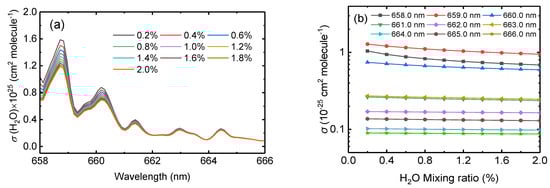
Figure 7.
(a) The convolved H2O absorption cross section at ten different mixing ratios. (b) The change of the convolved H2O absorption cross section with the mixing ratios from 658 nm to 666 nm at 1 nm intervals. The y-axis uses a logarithmic scale here.
In the reaction chamber experiment, the H2O concentration changes as the experiment progresses and can reach a maximum relative humidity of about 2%. The variation of H2O absorption cross section with different concentrations cannot be ignored because even small changes in water vapor concentration affect the spectral fit and hence the quantification of trace amounts of NO3.
3.3.2. The Influence of H2O Cross Section
To explore the interference of water vapor cross sections on the spectral fitting, four similar chamber experiments were carried out at different water vapor concentrations, in which H2O was added to the reaction chamber after NO2 and O3 were added. The effective cross section correction method was applied to acquire the number densities of NO3, NO2 and H2O accurately, as described in Section 2.4.
The Levenberg–Marquardt least-squares fitting method was applied for retrieving the molecule number densities of NO3, NO2 and H2O. The wavelength range from 645 to 685 nm was chosen as the optimized spectral fitting window. A third-order polynomial was applied to account for the unstructured extinction arising from scattering and O3 absorption. Figure 8 shows an example of OP-IBBCEAS retrievals of NO3, NO2 and H2O mixing ratios of 55.6 ± 2.5 pptv, 11.5 ± 2.8 ppbv, and 0.8 ± 0.02%, respectively. The H2O cross section used here was based on = 0.78%. Figure 8f shows that the absorption of H2O is well fitted by using an effective cross section correction method.
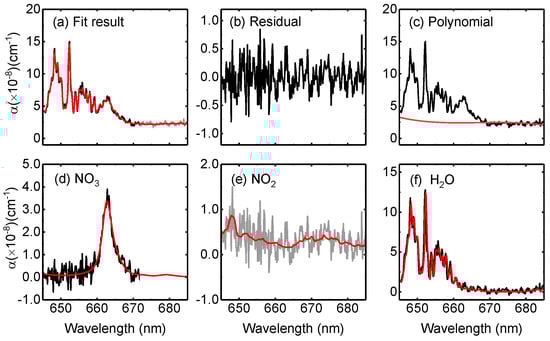
Figure 8.
One spectrum fitting example of chamber experiment with a 2 s integration time. The black and red line are the measured and fitted data, respectively. (a) fit result, (b) Residual, (c) Polynomial, (d) NO3, (e) NO2, and (f) H2O, respectively. The retrieved mixing ratios of NO3, NO2 and H2O are respectively 55.6 ± 2.5 pptv, 11.5 ± 2.8 ppbv, and 0.80 ± 0.02%.
One consideration in the use of optical cavities is that the effective optical path length is non-linearly reduced in the presence of strong absorbers or scatterers [22,58,59]. Figure 9 shows the decrease of the effective optical path length. Owing to the strong absorption of 0.8% H2O at 652 nm, the effective optical path length decreases 11%, from 19.3 km to 17.1 km. Considering NO3 at 662 nm, the effective optical path length decreases 7%, from 20.8 km to 19.3 km.
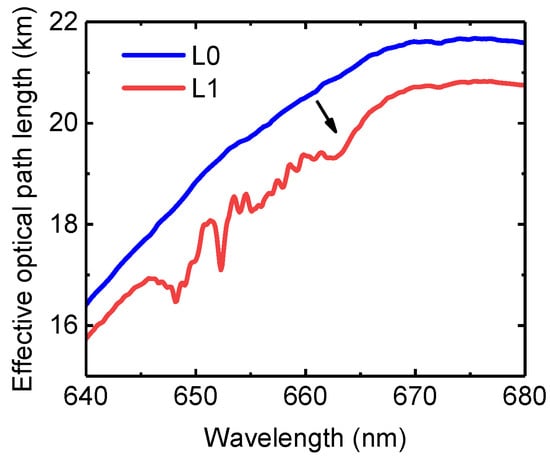
Figure 9.
Example of the influence of sample composition of effective absorption optical path length: no extinction (L0) and extinction from 55.6 pptv NO3, 11.5 ppbv NO2, and 0.8% H2O (L1).
The NO3 retrieved by OP-IBBCEAS under different H2O mixing ratios is shown in Figure 10a. The green and red points represent the retrieved NO3 data with and without H2O cross-section correction. The averaged H2O mixing ratios measured by the humidity sensor were 0.01%, 0.78%, 1.3%, and 1.8% (RH = 0.4%, 30%, 50%, and 70% at 22 °C), respectively. The red and green points agreed well when the chamber was dry. When H2O was added, the difference between using the effective H2O cross section and the uncorrected cross section becomes obvious and the discrepancy increases with H2O mixing ratio. An inappropriate H2O absorption cross section can cause an overestimation of NO3 concentration of about 28% in a humid atmosphere (H2O = 1.8%).
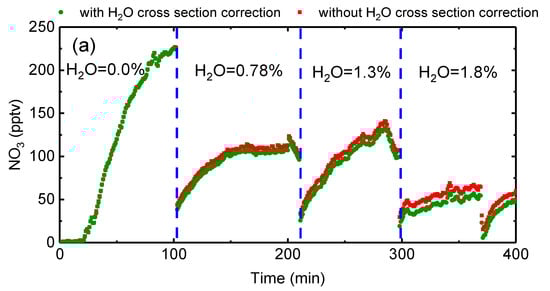
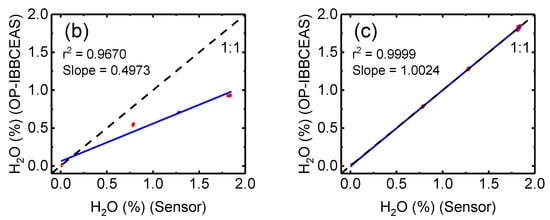
Figure 10.
(a) NO3 concentrations retrieved using OP-IBBCEAS with (green) and without (red) the H2O cross section correction. Figures (b) and (c) show the correlation of the H2O mixing ratio measured by a humidity sensor with that retrieved by the OP-IBBCEAS measurements. In (b) the uncorrected H2O cross section is used, whereas the corrected H2O cross section is used in (c).
The H2O measurement precision (1σ) of OP-IBBCEAS is 0.02%, which is better than humidity sensor corresponding to 0.04% (RH = 1.7% at 22 °C). The correlation and regression analysis of the H2O mixing ratio measured by the humidity sensor and OP-IBBCEAS without the correction H2O cross section is shown in Figure 10b. The slope is 0.497 and r2 = 0.97. In contrast, the regression analysis of the measured H2O mixing ratio with the effective H2O cross section is shown in Figure 10c. Here the agreement in the two measurements is great, the slope is 1.002 and the r2 = 0.9999. The mixing ratio of H2O is retrieved accurately after applying the effective H2O absorption cross section, thus demonstrating the reliability and accuracy of the effective cross section correction method.
3.4. The Application of Kalman Filtering
Kalman filtering is an adaptive technique with the advantage of self-adjustment by its transfer function, and is very useful in a real measurement environment [24,60,61,62]. Here, Kalman filtering was applied to further improve the measurement precision. Kalman filtering has several advantages over a simple moving average. Kalman filtering is conditioned on previous data and is less affected by spikes generated by the sensor [60].
In Kalman filtering, the predicted concentration (or true value) at time k () is calculated by combining the predicted concentration (or true value) at time k−1 () with the measured value at time k () by using a recursive procedure [60]. This can be expressed as follows:
Here, the value is the Kalman gain, which is obtained from the measurement noise () and the true concentration variability (). The factor ρ is defined as the ratio of , which is the parameter used to adjust the filter. In this work, ρ was set to 50, and the variance of the first 20 values was used as the input of . Figure 11 shows the retrieved concentration of NO2 and NO3 when the reaction chamber was full of zero-air as the value obtained after applying Kalman filtering. The 1σ deviation with 2 s integration time (described in Section 3.1) were improved from 2.9 ppbv to 0.8 ppbv for NO2 and 2.9 pptv to 0.9 pptv for NO3, respectively. The measurement precision values were improved by a factor 3.6 for NO2 and by a factor of 3.2 for NO3.
Figure 11.
The raw data (grey line) measured by OP-IBBCEAS with the chamber filled with zero air, and the measured data after applying Kalman filtering (red line). (a) The measured NO2 data with and without Kalman filtering. (b) The measured NO3 data with and without Kalman filtering.
Figure 12 shows the reaction chamber experimental result of NO2 and NO3 with and without applying Kalman filtering. The spikes generated by the sensor were removed after processing Kalman filtering. The effect of Kalman filtering is more pronounced on the NO2 data because the signal-to-noise ratio (SNR) of NO2 is less than NO3. The NO2 data also show that Kalman filtering copes well with rapid step changes in actual chamber concentration. The filtering result demonstrated that Kalman filtering is an efficient tool for reducing the measurement noise and improving the precision without affecting the time resolution.
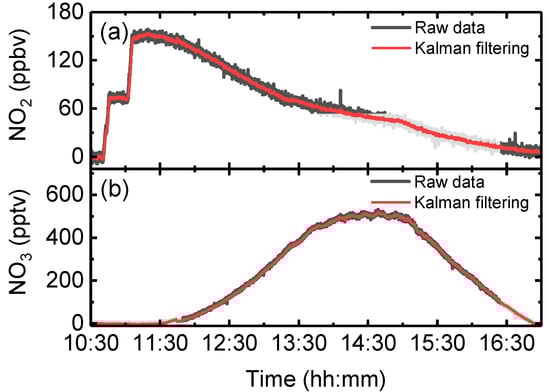
Figure 12.
The raw data (grey line) measured by OP-IBBCEAS in reaction chamber experimental conditions, and the measured data after applying with Kalman filtering (red line). (a) The measured NO2 data with and without Kalman filtering. (b) The measured NO3 data with and without Kalman filtering.
4. Conclusions
We developed an OP-IBBCEAS for simultaneous measurements of NO2, NO3, and H2O in the SAES-ARC simulation chamber based on absorption between 645 and 685 nm. The precision of the OP-IBBCEAS is 2.9 ppbv for NO2 and 2.9 pptv for NO3 in a 2 s (1σ), and its corresponding uncertainty is estimated to be ±6% for NO2 and ±14% for NO3. Intercomparison measurements of NO2 and NO3 between open-path and extractive IBBCEAS were performed during the reaction of NO2 with O3 in the SAES-ARC. The intercomparison of NO2 measured by OP-IBBCEAS and extractive NO2-IBBCEAS shows good agreement. The intercomparison of measured NO3 obtained by the OP-IBBCEAS instrument and a box model also shows excellent agreement. A 74% transmission efficiency of extractive NO3-IBBCEAS was estimated based on regression analysis of the measured NO3 using OP-IBBCEAS and the extractive NO3-IBBCEAS system. A crucial advantage of the OP-IBBCEAS instrument is that it does not actively sample the air mass of interest, and there are no transmission losses in the instrument. The in-line filter membrane needs to be regularly replaced (as it does in extractive CEAS or CRDS systems) owing to accumulation of particulate matter and changes in the transmission efficiency of the filter over time. However, this OP-IBBCEAS does not allow N2O5 to be estimated, and it is an advantage of extractive instrument with heated inlets. As has been shown by others, the OP-IBBCEAS is a good approach for application to reaction chambers and field campaigns owing to its simple and robust design, and high precision in monitoring reactive radicals. In field campaigns, the concentrations of NO2 and NO3 can be well quantified by this OP-IBBCEAS, but this is not sufficient to discuss scientific questions. Some other typical pollutants like NO, CO, O3 and NH3 et al. should be measured as well if the researchers try to identify the source of pollutants accurately [63,64,65].
The effective cross section correction method was used to reduce the influence of H2O. Comparison of the NO3 data analyzed with and without the H2O cross-section correction showed that the NO3 concentration is overestimated without the H2O absorption cross section correction. The measured H2O mixing ratios of humidity sensor and OP-IBBCEAS were also compared. The slope and r2 improved from 0.4973 and 0.9670 to 1.0024 and 0.9999 by correcting the effective absorption cross section of H2O. The measurement precisions were improved by a factor of 3.6 and 3.2 for NO2 and NO3, respectively, after applying the Kalman filtering.
The system has good application prospects in laboratory experiments and field campaigns for in situ and NO3 measurement. This approach also gives an accurate, in situ measurement of NO2 rather than an indirect measurement like chemiluminescence. In addition, the H2O measurement precision of OP-IBBCEAS is better than this hygrometer, and the accurate retrieval of H2O vapour could be valuable in some circumstances.
Author Contributions
Conceptualization, S.L. and J.C.; methodology, M.W., S.L. and J.C.; validation, D.S.V.; formal analysis, D.S.V. and R.V.; investigation, M.W. and J.C.; resources, W.H. and X.W.; data curation, M.W. and H.W.; writing—original draft preparation, M.W.; writing—review and editing, M.W., S.L., R.V., D.S.V. and J.C.; visualization, M.W.; supervision, S.L. and J.C.; project administration, F.F. and J.C.; funding acquisition, X.W., S.L., F.F. and J.C. All authors have read and agreed to the published version of the manuscript.
Funding
This research was funded by National Key Research and Development Program of China (Grant No. 2022YFC3701103,2022YFC3700300), the High-end Foreign Expert Introduction Program (Grant No. G2022013002), and the National Natural Science Foundation of China (Grant No. 42175111).
Institutional Review Board Statement
Not applicable.
Informed Consent Statement
Not applicable.
Data Availability Statement
Not applicable.
Conflicts of Interest
The authors declare no conflict of interest.
References
- Wayne, R.P.; Barnes, I.; Biggs, P.; Burrows, J.P.; Canosa-Mas, C.E.; Hjorth, J.; Le Bras, G.; Moortgat, G.K.; Perner, D.; Poulet, G.; et al. The nitrate radical: Physics, chemistry, and the atmosphere. Atmos. Environ. Part A Gen. Top. 1991, 25, 1–203. [Google Scholar] [CrossRef]
- Brown, S.S.; Stutz, J. Nighttime radical observations and chemistry. Chem. Soc. Rev. 2012, 41, 6405–6447. [Google Scholar] [CrossRef] [PubMed]
- Brown, S.S.; Stark, H.; Ravishankara, A. Applicability of the steady state approximation to the interpretation of atmospheric observations of NO3 and N2O5. J. Geophys. Res. Atmos. 2003, 108, 4539. [Google Scholar] [CrossRef]
- Hoyle, C.R.; Boy, M.; Donahue, N.M.; Fry, J.L.; Glasius, M.; Guenther, A.; Hallar, A.G.; Hartz, K.H.; Petters, M.D.; Petaja, T.; et al. A review of the anthropogenic influence on biogenic secondary organic aerosol. Atmos. Chem. Phys. 2011, 11, 321–343. [Google Scholar] [CrossRef]
- Ziemann, P.J.; Atkinson, R. Kinetics, products, and mechanisms of secondary organic aerosol formation. Chem. Soc. Rev. 2012, 41, 6582–6605. [Google Scholar] [CrossRef]
- Yokelson, R.J.; Burkholder, J.B.; Fox, R.W.; Talukdar, R.K.; Ravishankara, A.R. Temperature Dependence of the NO3 Absorption Spectrum. J. Phys. Chem. 1994, 98, 13144–13150. [Google Scholar] [CrossRef]
- Platt, U.; Perner, D.; Schröder, J.; Kessler, C.; Toennissen, A. The diurnal variation of NO3. J. Geophys. Res. Ocean. 1981, 86, 11965–11970. [Google Scholar] [CrossRef]
- Allan, B.J.; McFiggans, G.; Plane, J.M.; Coe, H.; McFadyen, G.G. The nitrate radical in the remote marine boundary layer. J. Geophys. Res. Atmos. 2000, 105, 24191–24204. [Google Scholar] [CrossRef]
- Geyer, A.; Ackermann, R.; Dubois, R.; Lohrmann, B.; Müller, T.; Platt, U. Long-term observation of nitrate radicals in the continental boundary layer near Berlin. Atmos. Environ. 2001, 35, 3619–3631. [Google Scholar] [CrossRef]
- Geyer, A.; Alicke, B.; Ackermann, R.; Martinez, M.; Harder, H.; Brune, W.; Di Carlo, P.; Williams, E.; Jobson, T.; Hall, S. Direct observations of daytime NO3: Implications for urban boundary layer chemistry. J. Geophys. Res. Atmos. 2003, 108, 4368. [Google Scholar] [CrossRef]
- Stutz, J.; Alicke, B.; Ackermann, R.; Geyer, A.; White, A.; Williams, E. Vertical profiles of NO3, N2O5, O3, and NOx in the nocturnal boundary layer: 1. Observations during the Texas Air Quality Study 2000. J. Geophys. Res. Atmos. 2004, 109, D12307. [Google Scholar] [CrossRef]
- Wängberg, I.; Barnes, I.; Becker, K. Product and mechanistic study of the reaction of NO3 radicals with α-pinene. Environ. Sci. Technol. 1997, 31, 2130–2135. [Google Scholar] [CrossRef]
- Bossmeyer, J.; Brauers, T.; Richter, C.; Rohrer, F.; Wegener, R.; Wahner, A. Simulation chamber studies on the NO3 chemistry of atmospheric aldehydes. Geophys. Res. Lett. 2006, 33, L18810. [Google Scholar] [CrossRef]
- Dorn, H.P.; Apodaca, R.L.; Ball, S.M.; Brauers, T.; Brown, S.S.; Crowley, J.N.; Dubé, W.P.; Fuchs, H.; Häseler, R.; Heitmann, U.; et al. Intercomparison of NO3 radical detection instruments in the atmosphere simulation chamber SAPHIR. Atmos. Meas. Tech. 2013, 6, 1111–1140. [Google Scholar] [CrossRef]
- King, M.D.; Dick, E.M.; Simpson, W.R. A new method for the atmospheric detection of the nitrate radical (NO3). Atmos. Environ. 2000, 34, 685–688. [Google Scholar] [CrossRef]
- Brown, S.S.; Stark, H.; Ciciora, S.J.; Ravishankara, A. In-situ measurement of atmospheric NO3 and N2O5 via cavity ring-down spectroscopy. Geophys. Res. Lett. 2001, 28, 3227–3230. [Google Scholar] [CrossRef]
- Dubé, W.P.; Brown, S.S.; Osthoff, H.D.; Nunley, M.R.; Ciciora, S.J.; Paris, M.W.; McLaughlin, R.J.; Ravishankara, A. Aircraft instrument for simultaneous, in situ measurement of NO3 and N2O5 via pulsed cavity ring-down spectroscopy. Rev. Sci. Instrum. 2006, 77, 034101. [Google Scholar] [CrossRef]
- Schuster, G.; Labazan, I.; Crowley, J.N. A cavity ring down/cavity enhanced absorption device for measurement of ambient NO3 and N2O5. Atmos. Meas. Tech. 2009, 2, 1–13. [Google Scholar] [CrossRef]
- Fiedler, S.E.; Hese, A.; Ruth, A.A. Incoherent broad-band cavity-enhanced absorption spectroscopy. Chem. Phys. Lett. 2003, 371, 284–294. [Google Scholar] [CrossRef]
- Venables, D.S.; Titus, G.; Johannes, O.; Wenger, J.C.; Ruth, A.A. High sensitivity in situ monitoring of NO3 in an atmospheric simulation chamber using incoherent broadband cavity-enhanced absorption spectroscopy. Environ. Sci. Technol. 2006, 40, 6758. [Google Scholar] [CrossRef]
- Varma, R.M.; Venables, D.S.; Ruth, A.A.; Heitmann, U.; Schlosser, E.; Dixneuf, S. Long optical cavities for open-path monitoring of atmospheric trace gases and aerosol extinction. Appl. Opt. 2009, 48, B159–B171. [Google Scholar] [CrossRef] [PubMed]
- Platt, U.; Meinen, J.; Pohler, D.; Leisner, T. Broadband Cavity Enhanced Differential Optical Absorption Spectroscopy (CE-DOAS)—Applicability and corrections. Atmos. Meas. Tech. 2009, 2, 713–723. [Google Scholar] [CrossRef]
- Chen, J.; Venables, D.S. A broadband optical cavity spectrometer for measuring weak near-ultraviolet absorption spectra of gases. Atmos. Meas. Tech. 2011, 4, 425–436. [Google Scholar] [CrossRef]
- Fang, B.; Zhao, W.; Xu, X.; Zhou, J.; Ma, X.; Wang, S.; Zhang, W.; Venables, D.S.; Chen, W. Portable broadband cavity-enhanced spectrometer utilizing Kalman filtering: Application to real-time, in situ monitoring of glyoxal and nitrogen dioxide. Opt. Express 2017, 25, 26910–26922. [Google Scholar] [CrossRef] [PubMed]
- Wang, H.; Chen, J.; Lu, K. Development of a portable cavity-enhanced absorption spectrometer for the measurement of ambient NO3 and N2O5: Experimental setup, lab characterizations, and field applications in a polluted urban environment. Atmos. Meas. Tech. 2017, 10, 1465–1479. [Google Scholar] [CrossRef]
- Duan, J.; Qin, M.; Ouyang, B.; Fang, W.; Li, X.; Lu, K.; Tang, K.; Liang, S.; Meng, F.; Hu, Z. Development of an incoherent broadband cavity-enhanced absorption spectrometer for in situ measurements of HONO and NO2. Atmos. Meas. Tech. 2018, 11, 4531–4543. [Google Scholar] [CrossRef]
- Liu, J.; Li, X.; Yang, Y.; Wang, H.; Kuang, C.; Zhu, Y.; Chen, M.; Hu, J.; Zeng, L.; Zhang, Y. Sensitive Detection of Ambient Formaldehyde by Incoherent Broadband Cavity Enhanced Absorption Spectroscopy. Anal. Chem. 2020, 92, 2697–2705. [Google Scholar] [CrossRef]
- Wang, M.; Varma, R.; Venables, D.S.; Zhou, W.; Chen, J. A Demonstration of Broadband Cavity-Enhanced Absorption Spectroscopy at Deep-Ultraviolet Wavelengths: Application to Sensitive Real-Time Detection of the Aromatic Pollutants Benzene, Toluene, and Xylene. Anal. Chem. 2022, 94, 4286–4293. [Google Scholar] [CrossRef]
- Langridge, J.M.; Ball, S.M.; Shillings, A.J.L.; Jones, R.L. A broadband absorption spectrometer using light emitting diodes for ultrasensitive, in situ trace gas detection. Rev. Sci. Instrum. 2008, 79, 123110. [Google Scholar] [CrossRef]
- Benton, A.; Langridge, J.; Ball, S.; Bloss, W.; Dall’Osto, M.; Nemitz, E.; Harrison, R.M.; Jones, R. Night-time chemistry above London: Measurements of NO3 and N2O5 from the BT Tower. Atmos. Chem. Phys. 2010, 10, 9781–9795. [Google Scholar] [CrossRef]
- Kennedy, O.; Ouyang, B.; Langridge, J.; Daniels, M.; Bauguitte, S.; Freshwater, R.; McLeod, M.; Ironmonger, C.; Sendall, J.; Norris, O. An aircraft based three channel broadband cavity enhanced absorption spectrometer for simultaneous measurements of NO3, N2O5 and NO2. Atmos. Meas. Tech. 2011, 4, 1759–1776. [Google Scholar] [CrossRef]
- Wang, H.; Lu, K.; Chen, X.; Zhu, Q.; Qi, C.; Song, G.; Jiang, M.; Xin, L.; Shang, D.; Tan, Z. High N2O5 Concentrations Observed in Urban Beijing: Implications of a Large Nitrate Formation Pathway. Environ. Sci. Technol. Lett. 2017, 4, 416–420. [Google Scholar] [CrossRef]
- Chen, X.; Wang, H.; Lu, K.; Li, C.; Zhai, T.; Tan, Z.; Ma, X.; Yang, X.; Liu, Y.; Chen, S. Field determination of nitrate formation pathway in winter Beijing. Environ. Sci. Technol. 2020, 54, 9243–9253. [Google Scholar] [CrossRef]
- Nam, W.; Cho, C.; Perdigones, B.; Rhee, T.S.; Min, K.E. Development of a broadband cavity-enhanced absorption spectrometer for simultaneous measurements of ambient NO3, NO2, and H2O. Atmos. Meas. Tech. 2022, 15, 4473–4487. [Google Scholar] [CrossRef]
- Fuchs, H.; Dubé, W.P.; Ciciora, S.J.; Brown, S.S. Determination of Inlet Transmission and Conversion Efficiencies for in Situ Measurements of the Nocturnal Nitrogen Oxides, NO3, N2O5 and NO2, via Pulsed Cavity Ring-Down Spectroscopy. Anal. Chem. 2008, 80, 6010–6017. [Google Scholar] [CrossRef]
- Gherman, T.; Venables, D.S.; Vaughan, S.; Orphal, J.; Ruth, A.A. Incoherent Broadband Cavity-Enhanced Absorption Spectroscopy in the near-Ultraviolet: Application to HONO and NO2. Environ. Sci. Technol. 2008, 42, 890–895. [Google Scholar] [CrossRef]
- Chen, J.; Wenger, J.C.; Venables, D.S. Near-ultraviolet absorption cross sections of nitrophenols and their potential influence on tropospheric oxidation capacity. J. Phys. Chem. A 2011, 115, 12235–12242. [Google Scholar] [CrossRef]
- Ashu-Ayem, E.R.; Nitschke, U.; Monahan, C.; Chen, J.; Darby, S.B.; Smith, P.D.; O’Dowd, C.D.; Stengel, D.B.; Venables, D.S. Coastal Iodine Emissions. 1. Release of I-2 by Laminaria digitata in Chamber Experiments. Environ. Sci. Technol. 2012, 46, 10413–10421. [Google Scholar] [CrossRef]
- Hoch, D.J.; Buxmann, J.; Sihler, H.; Poehler, D.; Zetzsch, C.; Platt, U. An instrument for measurements of BrO with LED-based Cavity-Enhanced Differential Optical Absorption Spectroscopy. Atmos. Meas. Tech. 2014, 7, 199–214. [Google Scholar] [CrossRef]
- Wu, T.; Coeur-Tourneur, C.; Dhont, G.; Cassez, A.; Fertein, E.; He, X.; Chen, W. Simultaneous monitoring of temporal profiles of NO3, NO2 and O3 by incoherent broadband cavity enhanced absorption spectroscopy for atmospheric applications. J. Quant. Spectrosc. Radiat. Transf. 2014, 133, 199–205. [Google Scholar] [CrossRef]
- Yi, H.; Wu, T.; Wang, G.; Zhao, W.; Fertein, E.; Coeur, C.; Gao, X.; Zhang, W.; Chen, W. Sensing atmospheric reactive species using light emitting diode by incoherent broadband cavity enhanced absorption spectroscopy. Opt. Express 2016, 24, A781–A790. [Google Scholar] [CrossRef] [PubMed]
- Yi, H.; Cazaunau, M.; Gratien, A.; Michoud, V.; Pangui, E.; Doussin, J.-F.; Chen, W. Intercomparison of IBBCEAS, NitroMAC and FTIR analyses for HONO, NO2 and CH2O measurements during the reaction of NO2 with H2O vapour in the simulation chamber CESAM. Atmos. Meas. Tech. 2021, 14, 5701–5715. [Google Scholar] [CrossRef]
- Yi, H.; Meng, L.; Wu, T.; Lauraguais, A.; Coeur, C.; Tomas, A.; Fu, H.; Gao, X.; Chen, W. Absolute determination of the chemical kinetic rate constant by optically tracking the reaction on the second time-scale using cavity enhanced absorption spectroscopy. Phys. Chem. Chem. Phys. 2022, 24, 7396–7404. [Google Scholar] [CrossRef] [PubMed]
- Wu, T.; Chen, W.; Fertein, E.; Cazier, F.; Dewaele, D.; Gao, X. Development of an open-path incoherent broadband cavity-enhanced spectroscopy based instrument for simultaneous measurement of HONO and NO2 in ambient air. Appl. Phys. B Lasers Opt. 2012, 106, 501–509. [Google Scholar] [CrossRef]
- Suhail, K.; George, M.; Chandran, S.; Varma, R.; Venables, D.S.; Wang, M.; Chen, J. Open path incoherent broadband cavity-enhanced measurements of NO3 radical and aerosol extinction in the North China Plain. Spectrochim. Acta Part A Mol. Biomol. Spectrosc. 2019, 208, 24–31. [Google Scholar] [CrossRef]
- Wang, H.; Lu, K. Monitoring Ambient Nitrate Radical by Open-Path Cavity-Enhanced Absorption Spectroscopy. Anal. Chem. 2019, 91, 10687–10693. [Google Scholar] [CrossRef]
- Voigt, S.; Orphal, J.; Burrows, J.P. The temperature and pressure dependence of the absorption cross-sections of NO2 in the 250–800 nm region measured by Fourier-transform spectroscopy. J. Photochem. Photobiol. A Chem. 2002, 149, 1–7. [Google Scholar] [CrossRef]
- Schmidl, G.; Paa, W.; Triebel, W.; Schippel, S.; Heyer, H. Spectrally resolved cavity ring down measurement of high reflectivity mirrors using a supercontinuum laser source. Appl. Opt. 2009, 48, 6754–6759. [Google Scholar] [CrossRef]
- Fullam, D.P.; Shoji, K.; Venables, D.S. Using integrated absorption to calibrate optical cavity spectrometers. Anal. Methods 2015, 7, 3298–3301. [Google Scholar] [CrossRef]
- Washenfelder, R.A.; Attwood, A.R.; Flores, J.M.; Zarzana, K.J.; Rudich, Y.; Brown, S.S. Broadband cavity-enhanced absorption spectroscopy in the ultraviolet spectral region for measurements of nitrogen dioxide and formaldehyde. Atmos. Meas. Tech. 2016, 9, 41–52. [Google Scholar] [CrossRef]
- Wu, T.; Zhao, W.; Chen, W.; Zhang, W.; Gao, X. Incoherent broadband cavity enhanced absorption spectroscopy for in situ measurements of NO2 with a blue light emitting diode. Appl. Phys. B Lasers Opt. 2009, 94, 85–94. [Google Scholar] [CrossRef]
- Chen, Y.; Yang, C.; Zhao, W.; Fang, B.; Xu, X.; Gai, Y.; Lin, X.; Chen, W.; Zhang, W. Ultra-sensitive measurement of peroxy radicals by chemical amplification broadband cavity-enhanced spectroscopy. Analyst 2016, 141, 5870–5878. [Google Scholar] [CrossRef]
- Ball, S.M.; Jones, R.L. Broad-band cavity ring-down spectroscopy. Chem. Rev. 2003, 103, 5239–5262. [Google Scholar] [CrossRef]
- Rothman, L.S.; Gordon, I.E.; Barbe, A.; Benner, D.C.; Bernath, P.F.; Birk, M.; Boudon, V.; Brown, L.R.; Campargue, A.; Champion, J.P.; et al. The HITRAN 2008 molecular spectroscopic database. J. Quant. Spectrosc. Radiat. Transf. 2009, 110, 533–572. [Google Scholar] [CrossRef]
- McLean, A.B.; Mitchell, C.E.J.; Swanston, D.M. Implementation of an efficient analytical approximation to the Voigt function for photoemission lineshape analysis. J. Electron. Spectrosc. Relat. Phenom. 1994, 69, 125–132. [Google Scholar] [CrossRef]
- Allan, D.W. Statistics of atomic frequency standards. Proc. IEEE 1966, 54, 221–230. [Google Scholar] [CrossRef]
- Li, C.M.; Wang, H.C.; Chen, X.R.; Zhai, T.Y.; Chen, S.Y.; Li, X.; Zeng, L.M.; Lu, K.D. Thermal dissociation cavity-enhanced absorption spectrometer for measuring NO2, RO2NO2, and RONO2 in the atmosphere. Atmos. Meas. Tech. 2021, 14, 4033–4051. [Google Scholar] [CrossRef]
- Horbanski, M.; Pöhler, D.; Lampel, J.; Platt, U. The ICAD (iterative cavity-enhanced DOAS) method. Atmos. Meas. Tech. 2019, 12, 3365–3381. [Google Scholar] [CrossRef]
- Tang, J.Y.; Li, Y.J.; Li, X.L.; Jing, S.A.; Huang, C.; Zhu, J.P.; Hu, Q.Y.; Wang, H.L.; Lu, J.; Lou, S.R.; et al. Intermediate volatile organic compounds emissions from vehicles under real world conditions. Sci. Total Environ. 2021, 788, 147795. [Google Scholar] [CrossRef]
- Leleux, D.; Claps, R.; Chen, W.; Tittel, F.; Harman, T. Applications of Kalman filtering to real-time trace gas concentration measurements. Appl. Phys. B 2002, 74, 85–93. [Google Scholar] [CrossRef]
- Chen, W.; Yi, H.; Wu, T.; Zhao, W.; Lengignon, C.; Wang, G.; Fertein, E.; Coeur, C.; Wysocki, G.; Wang, T. Photonic sensing of reactive atmospheric species. Encycl. Anal. Chem. 2017, 1–60. [Google Scholar] [CrossRef]
- Tang, K.; Qin, M.; Fang, W.; Duan, J.; Meng, F.; Ye, K.; Zhang, H.; Xie, P.; He, Y.; Xu, W. Simultaneous detection of atmospheric HONO and NO2 utilising an IBBCEAS system based on an iterative algorithm. Atmos. Meas. Tech. 2020, 13, 6487–6499. [Google Scholar] [CrossRef]
- Bian, X.; Zhou, S.; Sun, X.; Yu, B.; Li, J. Continuous measurement of NO2 in flue gas employing cavity-enhanced spectroscopy sensing system. Measurement 2022, 201, 111729. [Google Scholar] [CrossRef]
- Li, J.; Reiffs, A.; Parchatka, U.; Fischer, H. In situ measurements of atmospheric CO and its correlation with NOx and O3 at a rural mountain site. Metrol. Meas. Syst. 2015, 22, 25–38. [Google Scholar] [CrossRef]
- Thompson, A.M.; Cicerone, R.J. Possible perturbations to atmospheric CO, CH4, and OH. J. Geophys. Res. Atmos. 1986, 91, 10853–10864. [Google Scholar] [CrossRef]
Disclaimer/Publisher’s Note: The statements, opinions and data contained in all publications are solely those of the individual author(s) and contributor(s) and not of MDPI and/or the editor(s). MDPI and/or the editor(s) disclaim responsibility for any injury to people or property resulting from any ideas, methods, instructions or products referred to in the content. |
© 2023 by the authors. Licensee MDPI, Basel, Switzerland. This article is an open access article distributed under the terms and conditions of the Creative Commons Attribution (CC BY) license (https://creativecommons.org/licenses/by/4.0/).