1. Introduction
Atmospheric environmental pollution not only affects climate change but also threatens human health. The sources of polluting gases can be divided into natural sources, such as volcanoes, and man-made emissions, such as industrial and power plants. Among the pollution gases, SO
2 does great harm to the environment. SO
2 is a toxic gas emitted by anthropogenic and naturally occurring sources (e.g., chemical plants, ships, and volcanoes). This polluting gas forms acid rain after being discharged into the atmosphere, acidifying the surface water and damaging the soil, thereby contributing to the severe deterioration of ecological conditions. Therefore, the monitoring and analysis of SO
2 emissions are of great significance in evaluating air quality and improving weather conditions [
1].
The ultraviolet (UV) camera is an exciting new technology for measuring the two-dimensional distribution of SO
2 in industrial smokestacks or volcanic plumes. The initial concept of the SO
2 camera was nearly simultaneously proposed by two pioneering researchers, Burton and Bluth [
2,
3]. This new method has been developed rapidly due to its advantages of easy operation and high resolution. SO
2 cameras first came into popular usage for the remote quantification of volcanic SO
2 emissions, which has great significance in studying volcanic degassing processes [
4,
5], volcanic dynamics [
6], and the volcanic shallow plumbing system [
7]. With the improvement in filter technology and the development of UV cameras, the focus of this novel technology has been on the measurement of SO
2 pollution from human activities with low concentrations, such as from factory chimneys [
8], the atmospheric tracer experiment [
9], and the sulfur content of fuel oil for ships [
10].
Despite the great advantages of the SO
2 camera over traditional remote sensing technologies (such as DIAL, FTIR, and DOAS) [
11,
12,
13] in spatial and temporal resolution, its high sensitivity makes it susceptible to both individual and environmental factors, which usually lead to non-negligible detection errors. The charge-coupled device (CCD) of the camera is often disturbed by noise during imaging, like photon noise and dark current. Kern et al. presented the detection limits of seven typical UV cameras at different integration times and explained how photon noise and dark current affect the UV camera detection sensitivity [
14]. The detection accuracy of UV cameras is also affected by environmental conditions. The variation in solar incident angle will lead to vignetting, which weakens the light intensity near the maximum field of view (FOV) [
15]. Furthermore, the change in the incidence angle will have a large impact on the transmission of the band-pass filters, which also contributes to the vignetting effect. Accordingly, a method for flattening correction and vignetting correction that may effectively help correct the error caused by image irregularity in post-processing and analysis is suggested [
16].
Light dilution is also an important factor that leads to large errors in UV optical remote sensing techniques. UV cameras are usually positioned several kilometers away from the plume to obtain the best view. Therefore, the influence of UV scattering cannot be ignored. Light dilution arises when the solar light scattered through the atmosphere is absorbed or scattered by gaseous molecules and aerosols. As the distance between instruments and the detection target increase, the detection error caused by the light dilution effect gradually increases. Light dilution correction is a key approach to mitigating the light dilution problems of UV camera technologies. Several calibration methods can reduce the adverse effect of the light dilution of UV cameras, such as the DOAS calibration method [
17], the image-based calibration method [
18], and the combined image and spectrometer correction method, which can further reduce the effect of light dilution on the calibration accuracy of UV cameras [
19].
However, although quite significant, the study of the effect of light dilution on the detection limit of UV cameras has rarely been reported. The detection limit is influenced by many factors, such as the quantum efficiency and dark noise of camera CCD, the camera lens aperture and transmittance, the filter bandwidth, the central wavelength, the weather conditions, the detection distance, and the detection target characteristics. Investigating the detection limits of UV cameras under the influence of light dilution is of great importance in designing UV camera systems and evaluating their detection capability, which is a complex but inevitable problem.
This paper focuses on the limits of camera detection under the effect of UV scattering, with full consideration of the quantum efficiency of CCD and the selection of filters. On the basis of discussions on camera sensitivity in actual atmospheric conditions, a method of calculating the detection limit is proposed. The measurement principle of the UV camera and the theory of signal-to-noise ratio (SNR) are first introduced. Then, the effect of the center wavelength and the bandwidth on the camera sensitivity is simulated to find the best combination of center wavelengths and bandwidth. The detection limits of the camera under different aerosol depths, the detection distances, and the atmospheric visibility are also analyzed to derive the camera sensitivity curves. With the retrieved concentration images at different monitoring distances, the effect of UV scattering on the theoretically obtained detection limit of SO2 cameras is verified through a field experiment. Finally, we summarize how to improve the detection limit, illustrating changes in camera sensitivity due to filter choice, the aerosols in plumes, and the radiative transfer between the sun and instruments.
2. Materials and Methods
The SO
2 camera generally consists of a pair of UV-sensitive cameras and two band-pass filters with adjacent central wavelengths, and performs imaging on the gas plume in two wavebands, with the scattered solar radiation as the light source [
20]. The optical density of SO
2 is obtained according to the differential optical absorption theory.
2.1. Double Spectral Channels
Aside from SO2, plumes, either from industrial chimneys or ship exhausts, have many aerosols. The extinction effect of aerosols affects the inversion reliability and accuracy of the SO2 concentration. To eliminate this problem, double spectral channels are selected in practical measurements.
SO
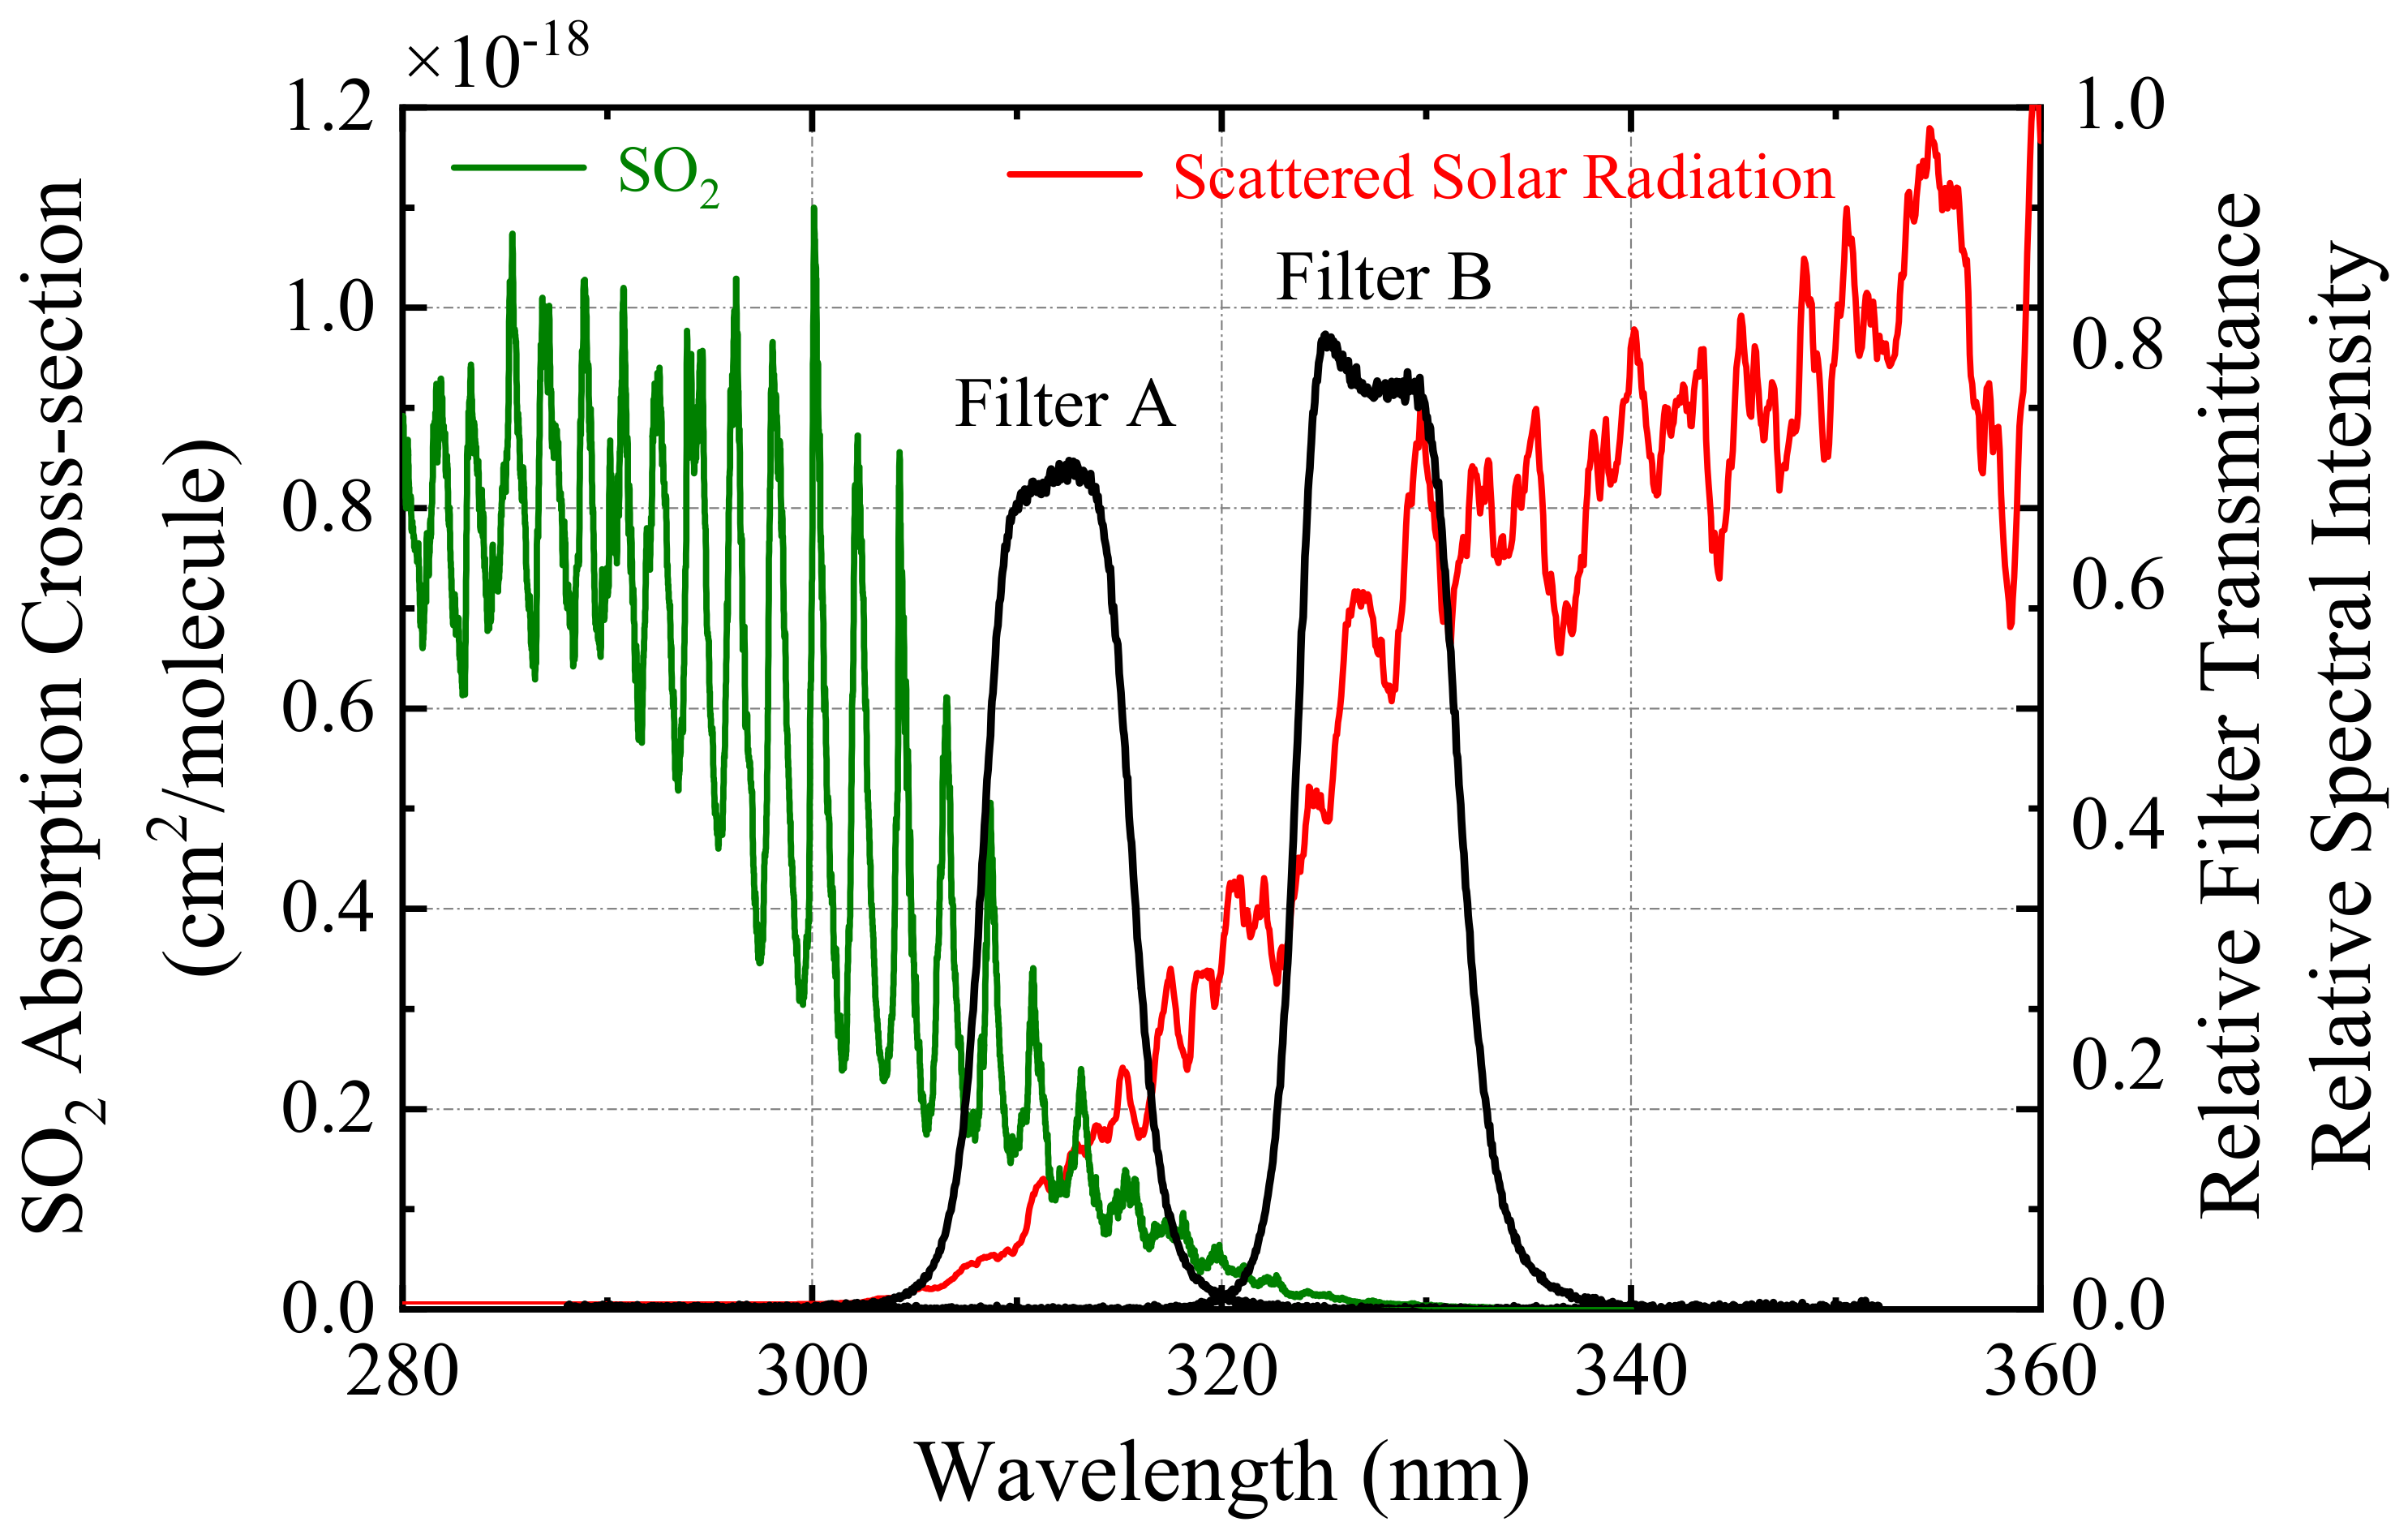
2 gas has obvious spectral characteristics at 240–320 nm (see
Figure 1). The wavelength shorter than 300 nm cannot be used for the remote sensing of SO
2 due to the absorption of O
3. For the UV camera, the spectral band with the central wavelength at 310 nm, which is the overlapping area between the SO
2 absorption and solar scattering spectra, is suitable as the signal channel (Filter A). However, in addition to SO
2 absorption, the measured intensity of the signal channel is also influenced by the absorption and scattering of aerosols in the plume. For the correction of radiative transfer and aerosol scattering effects, an off-band filter at 330 nm is used in the reference channel (Filter B).
For both the signal and reference channels, the incident light intensity
arriving at the camera CCD can be expressed as follows [
2]:
where
is the solar scattered light intensity,
is the filter transmittance, and
is the quantum efficiency of the camera.
For CCD pixels with polluting gas present in the FOV, the light intensity
received by the signal channel satisfies the Beer–Lambert–Bouguer law, without considering the light dilution [
21].
where
is the light intensity of the signal channel before passing through the plume,
is the absorption cross-section of SO
2,
is the aerosol optical depths, and
is the SO
2 column density.
The reference channel is only affected by the extinction of aerosols.
where
and
are the light intensity before and after passing through the plume, respectively.
SO
2 optical depth
can be obtained by the comprehensive treatment of two channels’ optical depth.
2.2. Influence of Filters
For optical imaging systems, not all the scattered light vertically enters the filter. The effective center wavelength and transmittance of the filter vary with the incident angle. The filter transmittance
is approximated by Gaussian distribution
when the sun scattered light is vertically incident [
22].
where
is a normalization factor,
is the filter center wavelength, and
is the transmittance bandwidth.
If the scattered light non-vertical incidence filters, the effective bandpass center
should be corrected.
where
is the refractive index of the filter material, and
is the refractive index of air. The effective bandpass center
depends on the filter’s central wavelength
, and its refractive index
shifts towards shorter wavelengths when incident angle
increases.
For filters mounted between the object lens and the camera CCD,
can be parameterized in terms of radius and the azimuth [
17].
where
is the distance to the center of the lens,
is the azimuth of the position at which the incident light intersects the lens,
is the lens’ focal length,
is the angular magnification of the objective lens, and
is the viewing angle.
Moreover, the effective maximum transmittance of filters will also decrease for non-vertical incidence light. When filters are placed between the objective lens and the camera, the effective transmittance is retrieved by using the aperture radius of lens
and all relative orientations
.
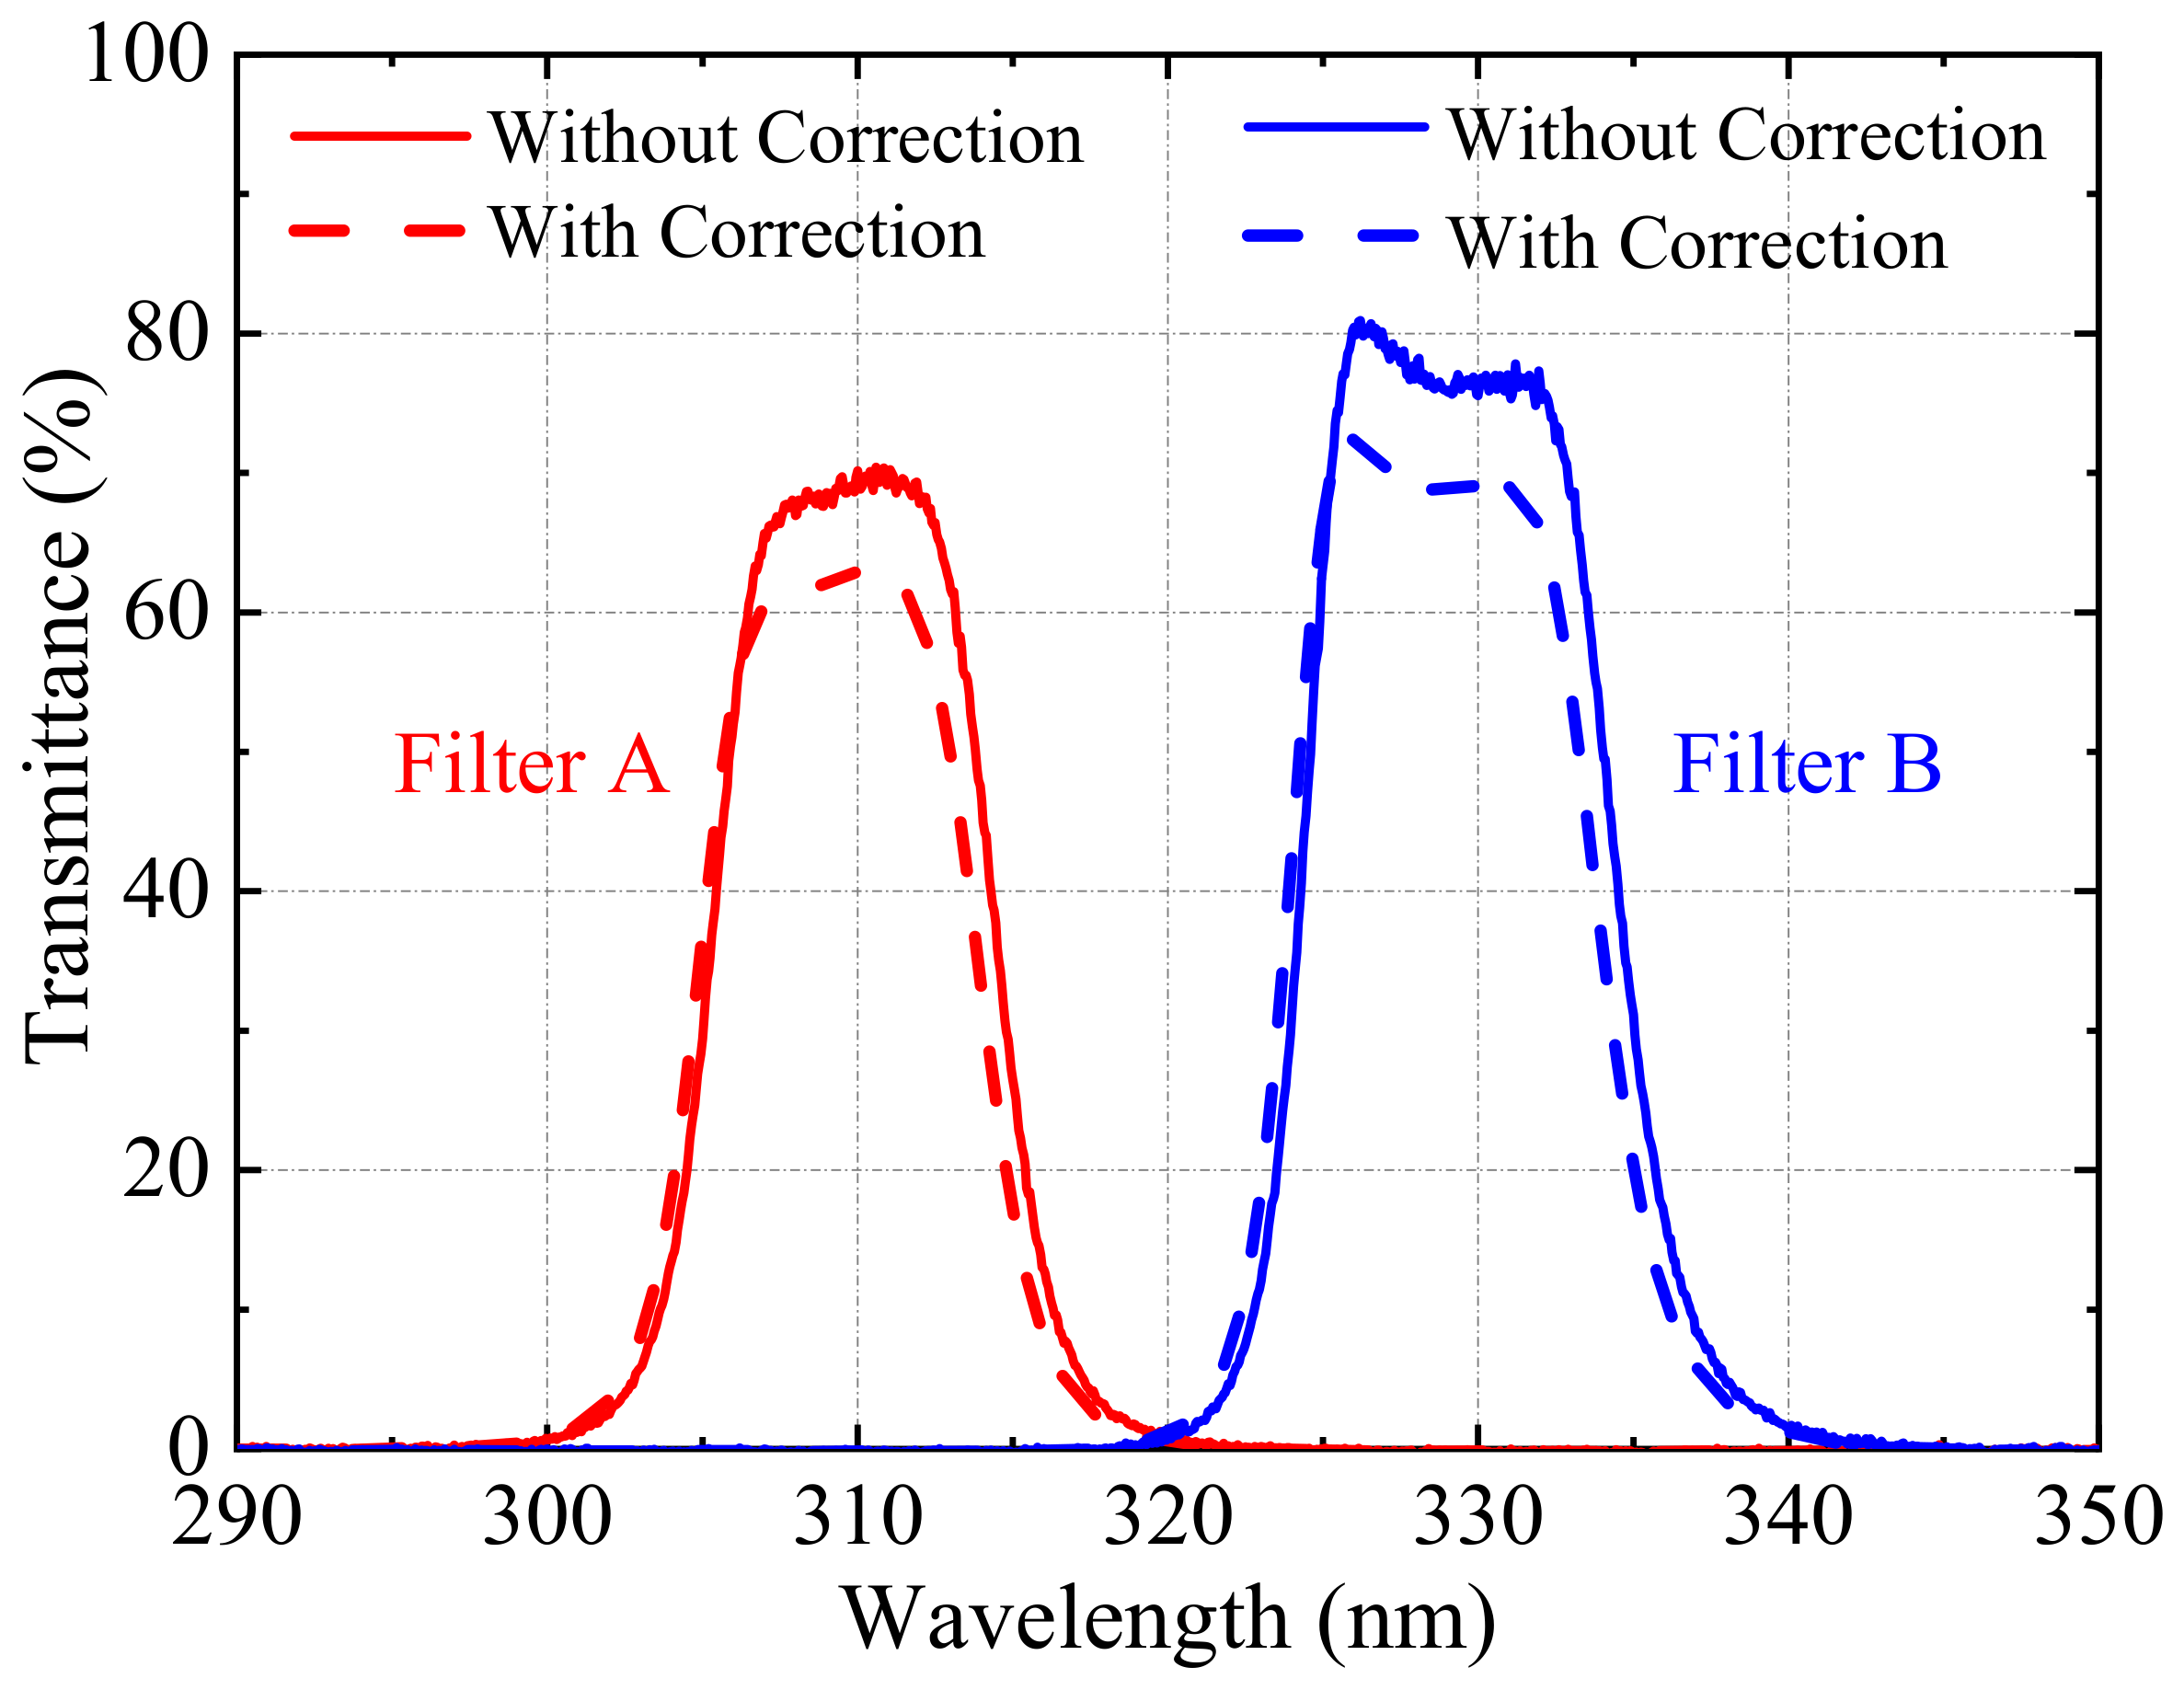
Figure 2 shows the transmittance curves of Filters A and B measured by the UV spectrometer, as well as the effective transmittance curves with non-vertical incidence correction. The solid lines are the transmittance curves measured under ideal conditions, while the dotted lines are the calculated filter transmittance curves based on the correction theory (see
Figure 2). Given the non-vertical incidence of the solar scattered light, the effective central wavelength of the filters will shift toward shorter wavelengths, and the effective transmittance will decrease. The SNR at the edge of cameras with decreasing
and blue-shifted
will affect the sensitivity of the SO
2 camera systems. Moreover, the full width at half maximum (FWHM) of filters will increase with the shift of
to a short wave, which also affects the camera sensitivity. To optimize the detection limit of the SO
2 camera and improve its sensitivity, the optimal matching between
and the FWHM should be considered.
2.3. SO2 Camera SNR and Detection Limits
Noises will be inevitably introduced to images of SO
2 cameras due to the influence of imaging mechanisms and external factors, resulting in non-ideal final measured signals. In order to quantitatively study the influence of noise on the measurement results, researchers introduced the concept of SNR. SNR is an important performance index that reflects the detection limit of imaging instruments, which is used to characterize the radiation performance and image quality of the instrument. The signal strength can be described by camera quantum efficiency
, exposure time
, and filter transmittance
, while noise refers to the sum of the noise generated by all parts of the imaging process [
14].
For SO
2 camera systems, two aspects affect the system performance: one is the strength of the signal received and converted by the camera (affects the numerator), and the other is the intensity of the noise it introduced (affects the denominator). In the imaging process, camera noise has three main parts: dark noise, readout noise, and photon noise [
3]. Given that the noise in systems and the environment cannot be controlled during telemetry, the signal strength received by cameras must be increased to improve the SNR of the system.
In general, quantum efficiency
is determined by the camera CCD, while incident light intensity
depends on the actual atmosphere situation. Therefore, the system sensitivity can be improved by increasing the exposure time or selecting appropriate filters.
Section 2.2 shows that different filter bandwidths and center wavelengths have great influences on the maximum effective transmittance. Thus, finding the appropriate bandwidth at the optimal center wavelength can reduce the detection limit.
The detection limit of the camera is reflected in its sensitivity to SO2. Detection limit is an important performance index that evaluates the imaging capability of remote sensing systems. Thus, the analysis and estimation of the detection limit are of great reference significance in the design of optical system parameters and the selection of imaging devices. Using the detection limit as the standard, this paper quantitatively investigates the criticality of various hardware choices versus telemetry conditions on the effects of measurements and proposes ways to improve the detection limit of SO2 cameras.
2.4. Optimal Filter Selection
When selecting band-pass filters for the SO
2 camera system, the center wavelength and the bandwidth must be considered because they all affect the total amount of scattered light that enters the imaging system. According to
Section 2.1, SO
2 gas has remarkable absorption characteristics in 240–320 nm, while the solar radiation reaching the ground mainly starts from 300 nm because of the UV absorption of O
3. Considering the SO
2 absorption cross-section and the solar scattered light intensity, selecting a narrow wavelength window around 310 nm (by employing Filter A) is advantageous for measuring SO
2 because the sensitivity of the camera system and the accuracy of the inversion results can be guaranteed [
15]. The joint use of Filter B, with a central wavelength around 330 nm where the SO
2 absorption is weak, several dozen times will greatly compensate for the effect of aerosol scattering. For Filter A (the signal channel), the shift of the central wavelength toward a short wave could effectively increase the camera sensitivity but also reduce the light intensity arriving at the camera CCD, and therefore result in poor SNR, and vice versa. For Filter B (the reference channel), shifting to a short wavelength will make the filter transmission curve overlap the SO
2 absorption spectrum and therefore lead to low measurement results. Meanwhile, shifting to a long wavelength will affect the compensation accuracy of the aerosol scattering effect. In addition, the filter bandwidth determines the scattered light received by the camera [
23]. A narrow bandwidth improves the sensitivity and reduces the SNR, whereas excessive bandwidth makes the two channels overlap, thereby increasing the inversion error.
In the following, a model was applied to study the best filter bandwidth and central wavelength combination. The transmittance curve of band-pass filters can be approximated with Gaussian distribution [
24]. The SNR is calculated as a function of the central wavelength and the bandwidth of the filter. For the convenience of comparison, the calculated SNR is normalized at 310 nm with a width of 10 nm. The reference channel is simulated using a transmittance curve centered near 330 nm, with the same bandwidth as that of Filter A. Here, an identical maximum transmittance is assumed for all filters. This assumption can only be considered an approximation; filters with narrow bandwidths have a lower maximum transmittance than wide ones. Thus, the actual transmittance must be calibrated. Nevertheless, a reference for selecting optimal filter parameters is provided.
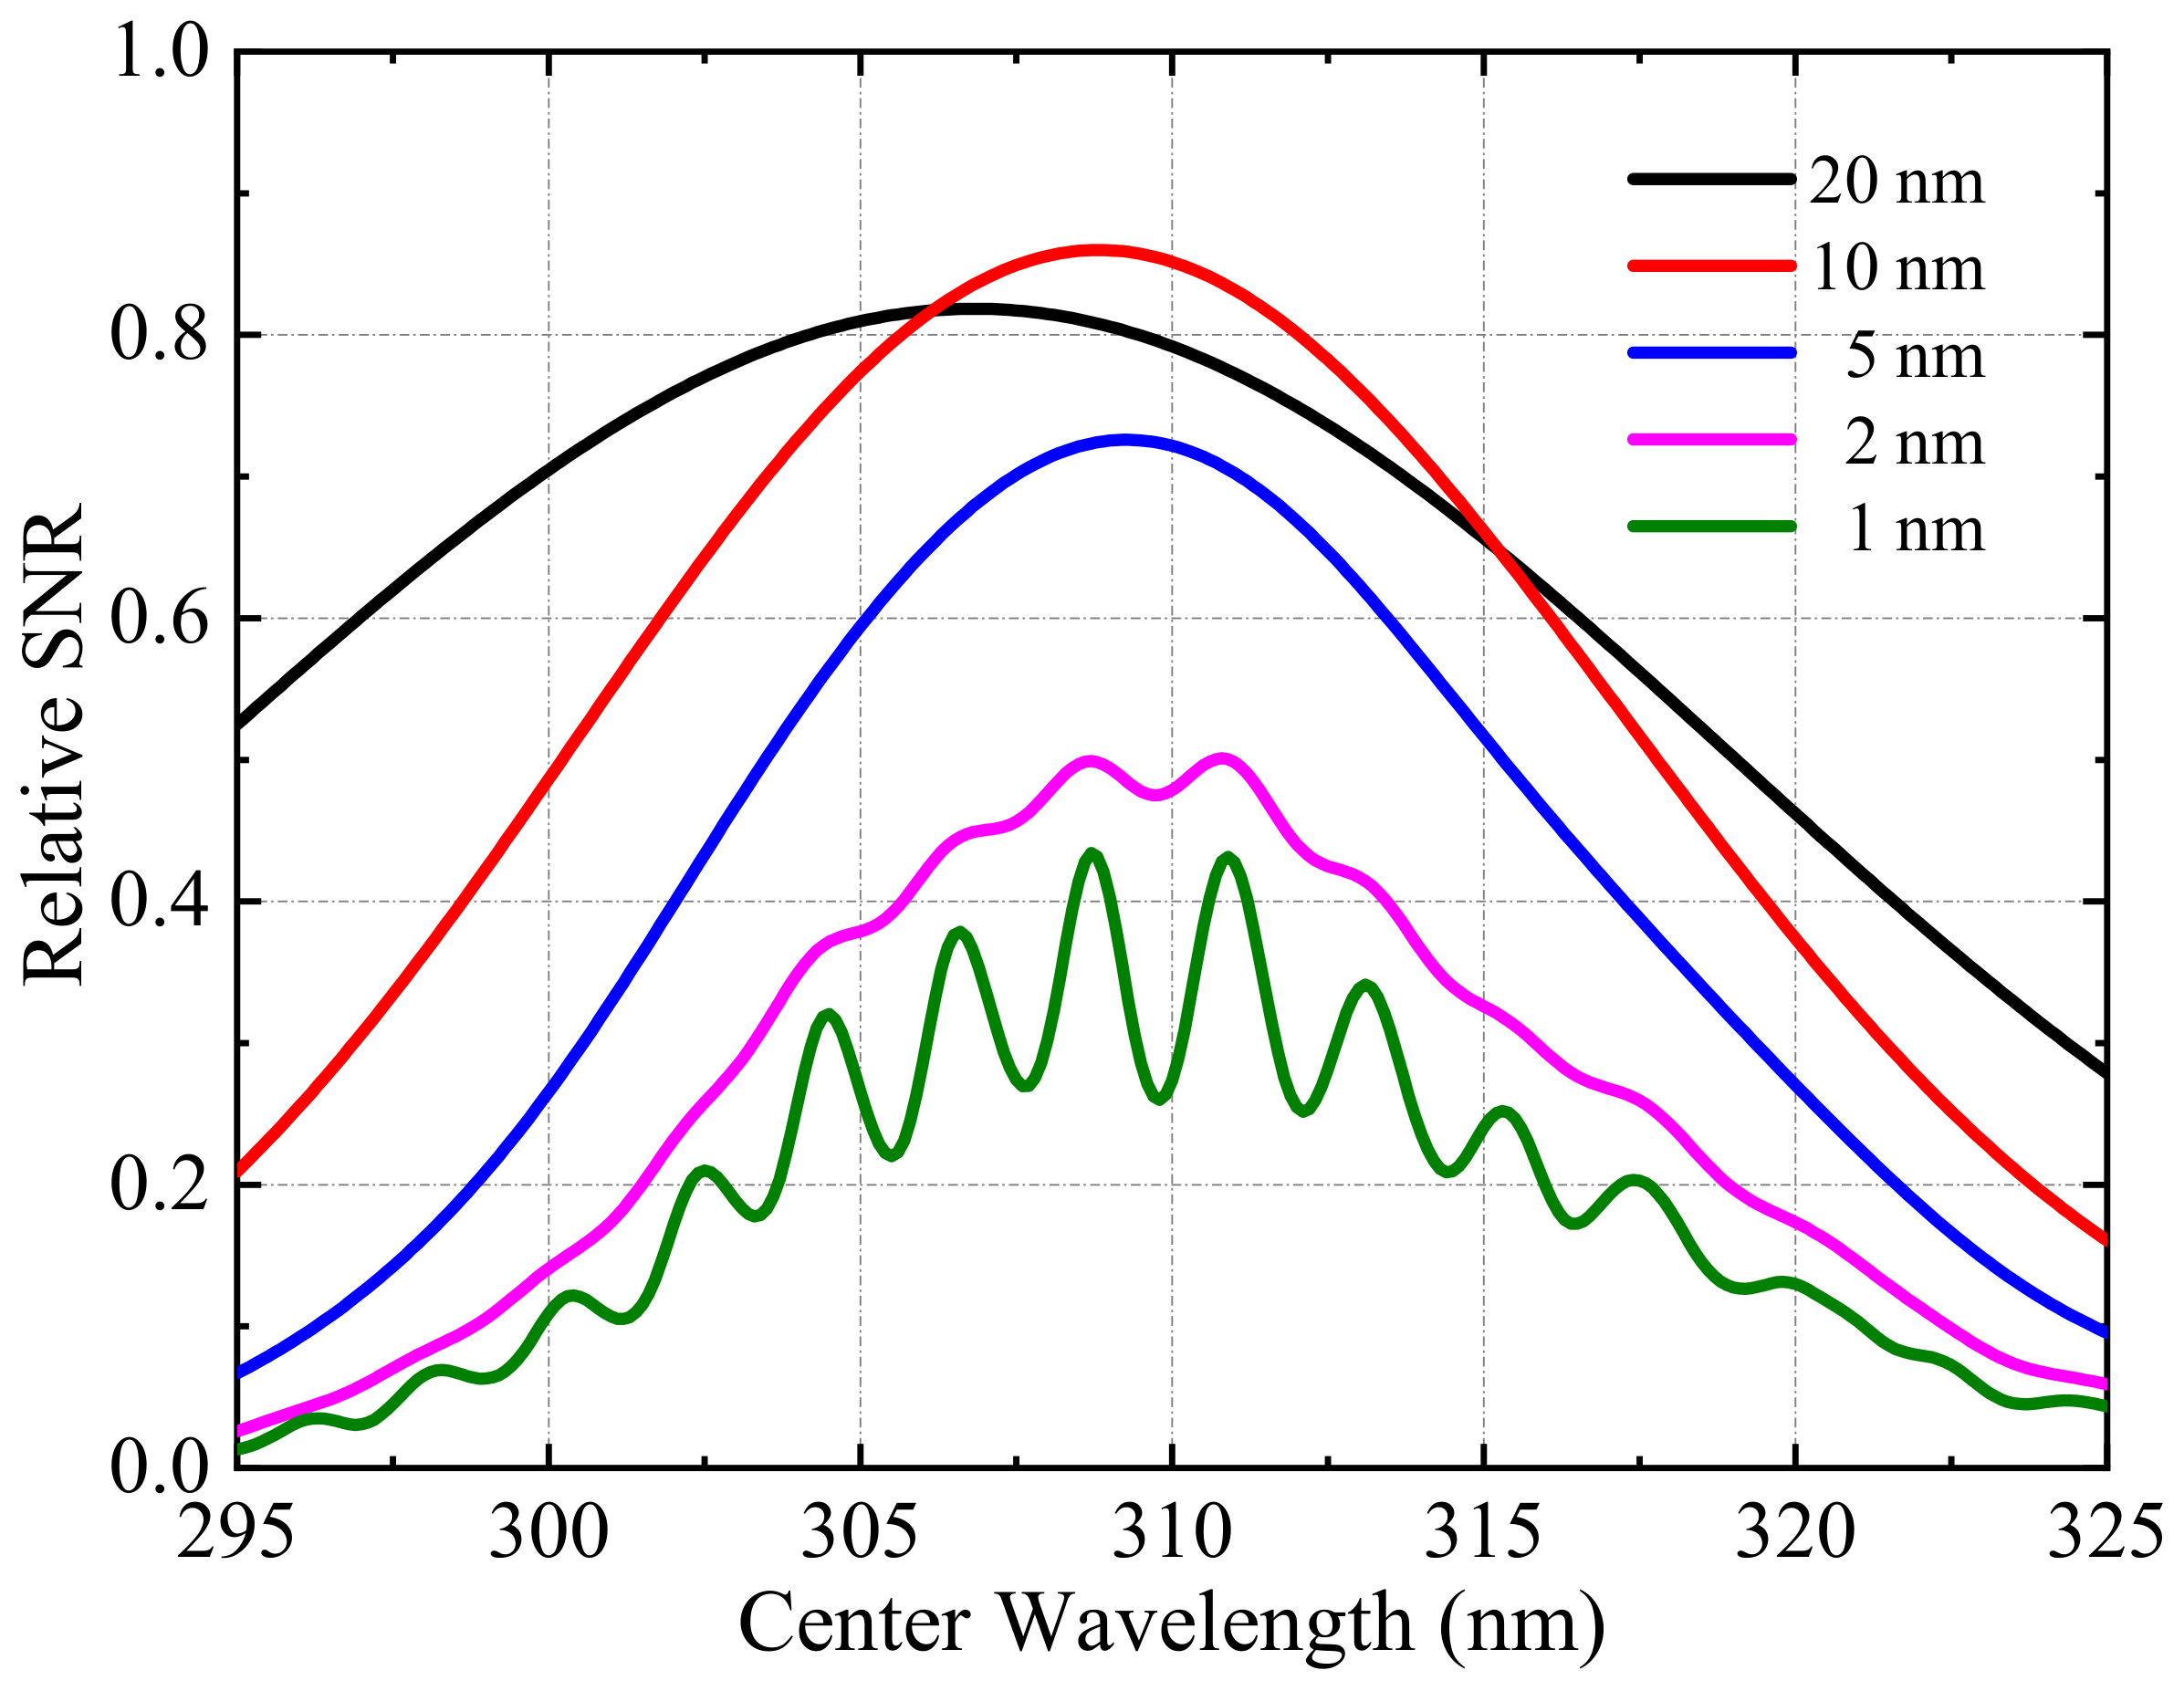
The relationship between the filter parameters and the relative SNR is simulated and shown in
Figure 3. The central wavelength varies between 295 and 325 nm, and the bandwidth increases from 1 nm to 20 nm. When the central wavelength shifts toward short wavelengths, incident solar light intensity
decreases significantly, and the relative SNR drops, obviously due to the ozone absorption. For longer wavelengths,
increases and the SO
2 absorption cross-section diminishes, which also affects the SNR. Narrow filters (less than 2 nm) are sensitive to individual SO
2 absorption bands, while wide filters (more than 20 nm) are affected by background light.
For the given central wavelength, increasing the filter bandwidth effectively improves the SNR. However, when the bandwidth exceeds a certain value, increasing the bandwidth further will lead to a decline in the SNR and the sensitivity.
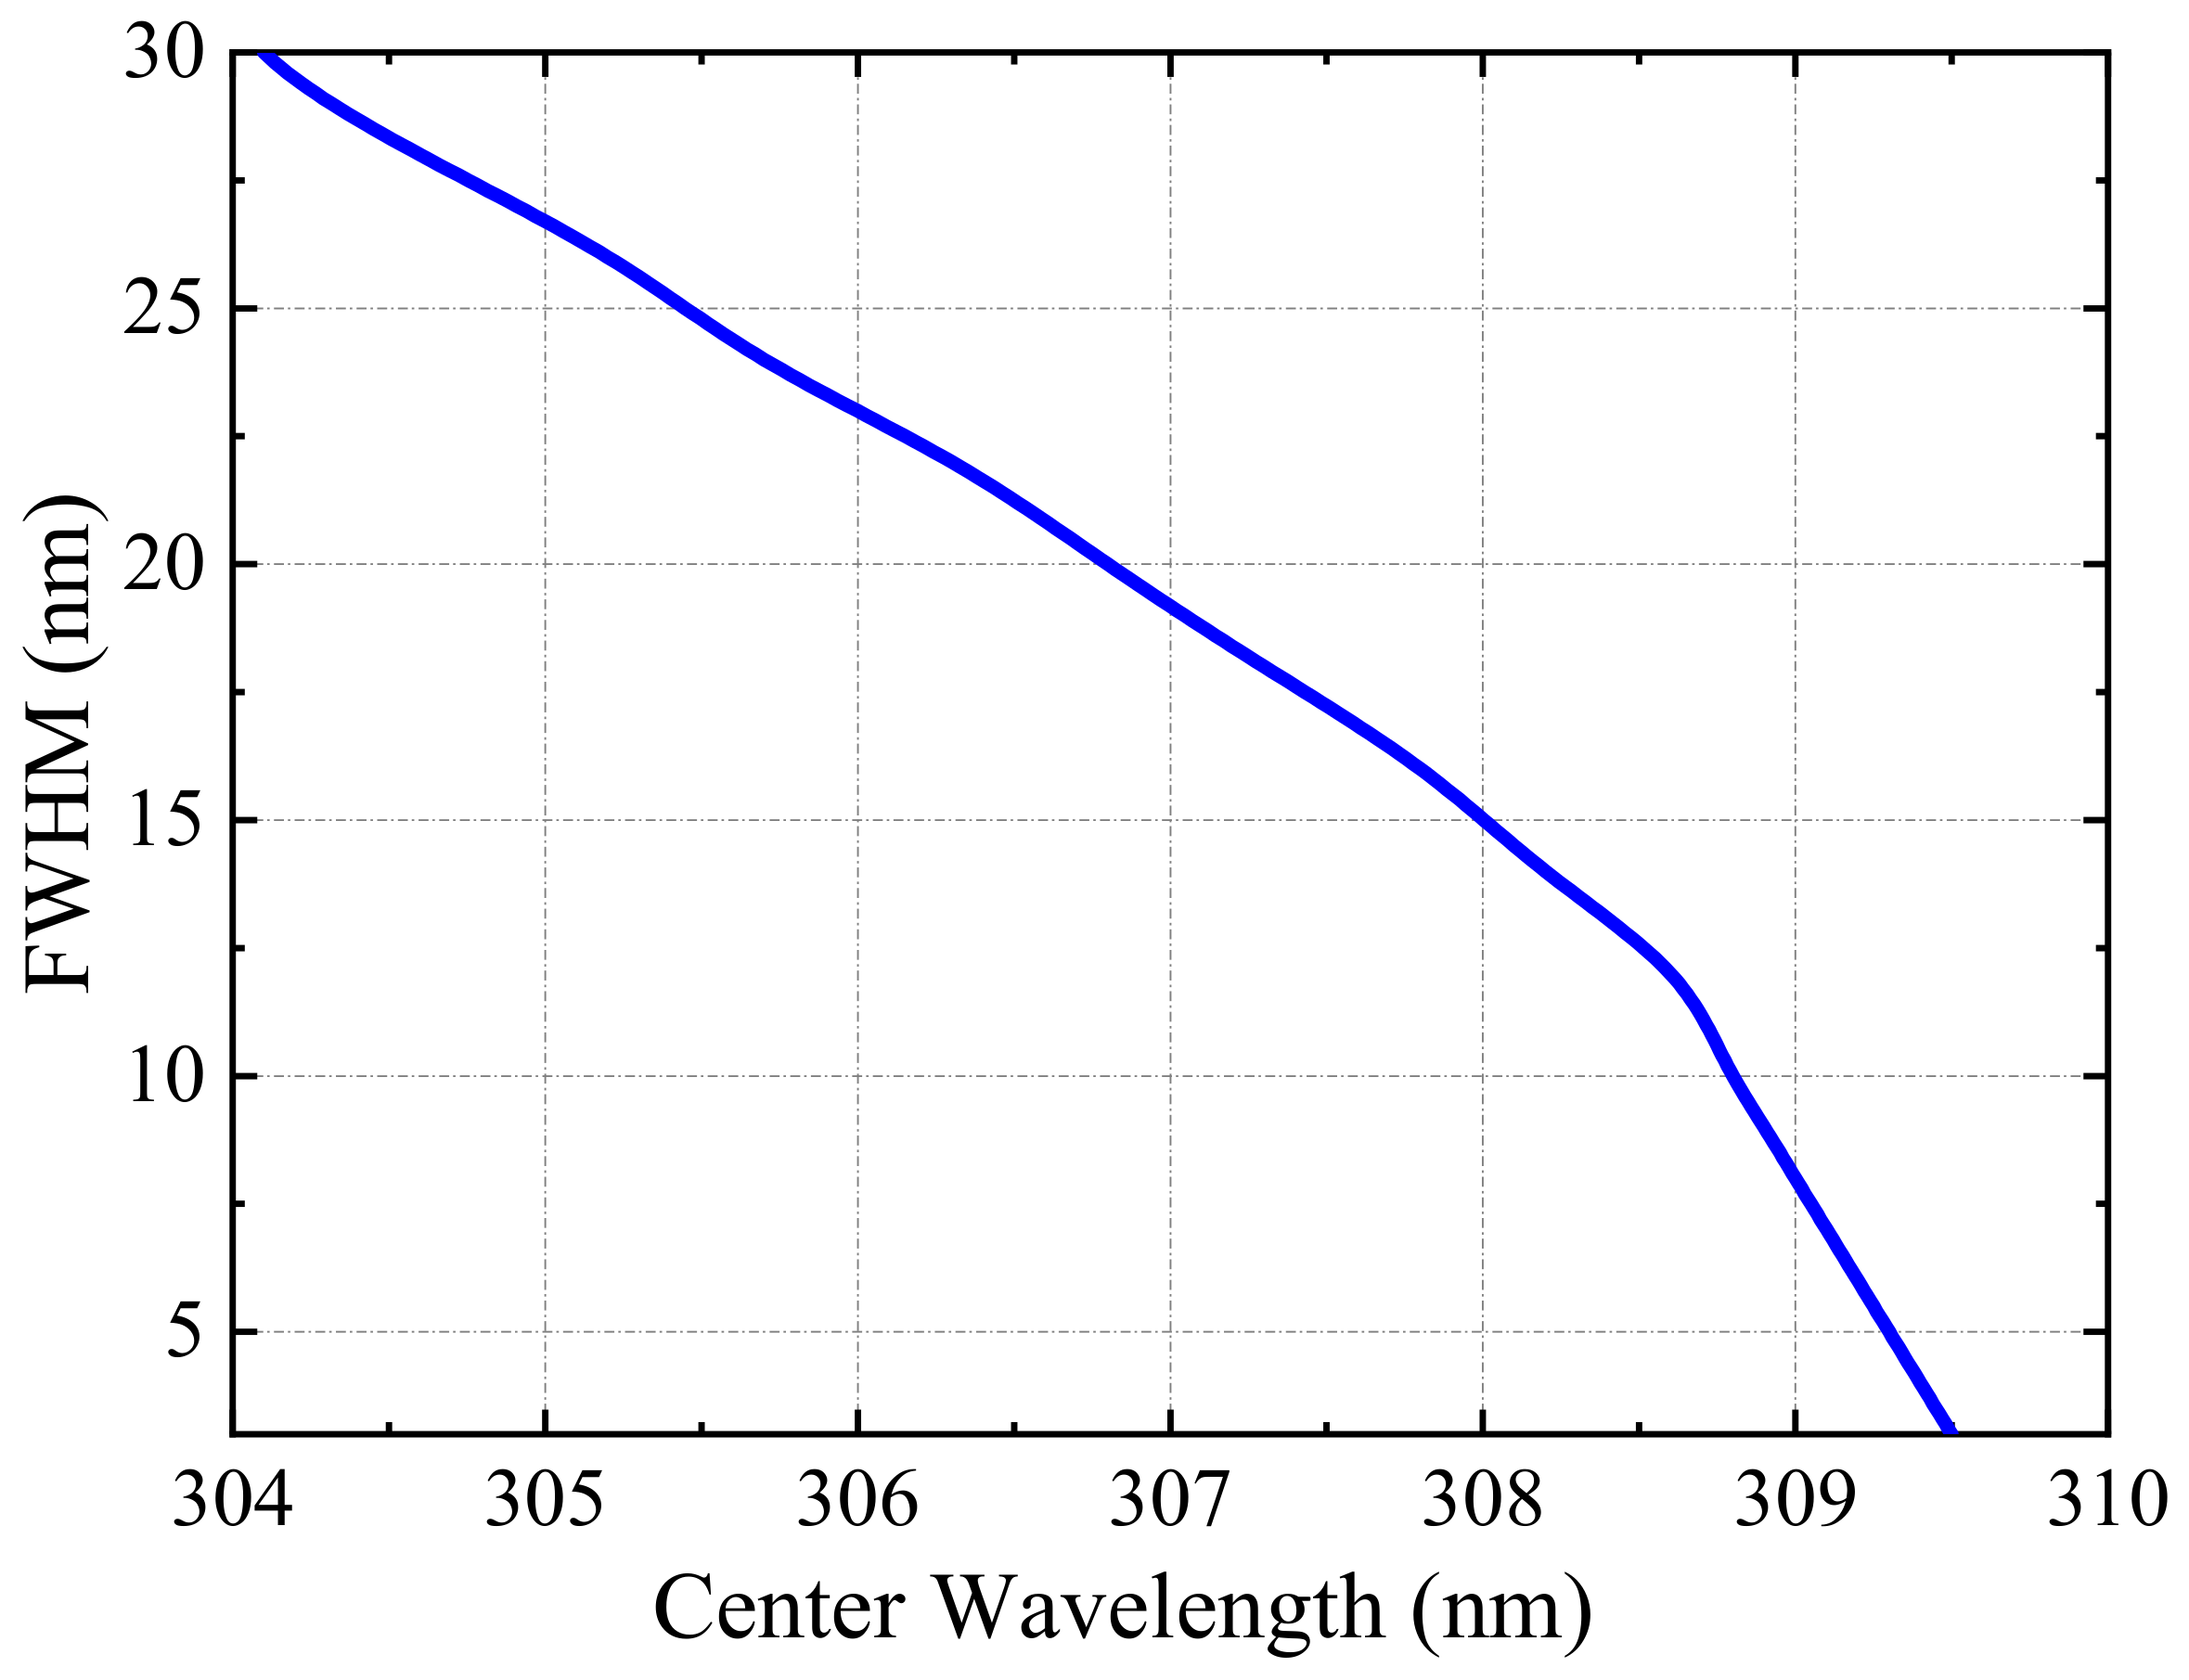
Figure 4 shows the optimal matching between the central wavelength and bandwidth of the filter. The optimal bandwidth decreases obviously with the increase of the central wavelength.
In an effort to understand the optimal matching further, the variation in the detection limit of the SO
2 camera system with the central wavelength and the bandwidth is also simulated (see
Figure 5). Here, the color bar is inverted, indicating that the darker the color, the lower the detection limit and the better the system performance. The choice of bandwidth greatly impacts the system sensitivity. The model indicates that the minimum detection limit of the SO
2 camera system is centered at 309 nm, with an FWHM of 10 nm for the signal channel. The solar scattered light non-vertical incidence will cause the filter transmission curve to shift toward short wavelengths. In such cases, a large
can be selected to calibrate the error.
3. Radiative Transfer Model
In the design of remote sensing imaging systems, the study of atmospheric radiative transfer characteristics is of great significance in increasing the system detection capability and improving the inversion accuracy. The dilution effect caused by light scattering in the atmosphere is an unavoidable problem. As solar radiation passes through the medium, its intensity is attenuated according to the absorption and scattering of aerosols [
25]. The atmospheric scattering increases the light path from the sun to the instrument. This scattering can affect the sensitivity of the imaging system and lead to a significant decrease in the measured absorbance. In the following section, the factors affecting the effective light path are discussed, an actual radiative transfer model of the SO
2 camera system is described, and the influence of UV scattering on the inversion results is quantitatively analyzed.
3.1. Idealized Light Path
In the remote sensing measurements of pollution source plumes using solar scattered light, the light path is usually assumed to be ideal, that is, the light is only scattered by the plume and then reaches the camera CCD through the clouds and aerosols in the path. The impact of solar scattering on the SO2 camera is mainly reflected in the calibration and inversion problem, which is a key indicator of the SO2 camera performance. Unlike the spectrometer, the SO2 camera cannot be used to directly obtain the SO2 column density. A calibration method, which takes multiple cells filled with different SO2 concentrations and measures the corresponding optical depth with a UV camera, can be used to obtain the calibration curve. Ideally, there is a linear relationship between the optical depth and the SO2 concentration, which ensures that the calibration cell method is scientific. The calibration coefficient is roughly proportional but will change with different atmospheric conditions.
3.2. Light Dilution
The SO
2 camera may be positioned several kilometers away from the plume to obtain the best view. Two different scatterings affect the measurement results. One is Rayleigh scattering, which occurs when light interacts with gas molecules. On a clear day with few clouds, the air between the plume and the camera is largely free of aerosols. Under these ideal conditions, Rayleigh scattering is mainly considered. Mie scattering occurs when light interacts with aerosol particles. Low atmospheric visibility results from the presence of aerosols in the air, and the aerosol size exceeds the scattered light in the UV band by a wide margin [
26]. Given that the scattering cross-section of Mie scattering is much larger than that of Rayleigh scattering, Mie scattering is dominant in low visibility.
Another significant source of uncertainty in UV remote sensing measurements is the impact of “light dilution”. In the process of atmospheric transmission, the sun scattered light will interact with the gas molecules and aerosols in the atmosphere, including absorption and scattering. After passing through the plume, light outside FOV may scatter between the instrument and the plume, and some of them will enter the FOV of the cameras. The light passing through the plume is increasingly replaced by obtrusive light with the increasing distance between the instrument and the remote sensing target. Meanwhile, the increased light path leads to the increased solar light being scattered by atmospheric molecules (Rayleigh scattering) and aerosol particles (Mie scattering), which results in the “dilution” of the plume signal. Particularly, within a measurement range of a few kilometers, this effect can easily lead to the underestimation of SO
2 emission rates. This is because these lights have not passed through the plume and do not contain spectral absorption structures from the plume constituents. Scattered light not only dilutes the measured column density but also affects the detection limit of the instrument. Mori et al. noted that the presence of light dilution can be confirmed by retrieving the SO
2 optical depth from two different wavelength channels [
27]. The measurements of a plume at an increasing distance (so increasing light dilution) exhibit a non-linear relationship because the scattering is wavelength-dependent, so short-wavelength channels (signal channels) will be greatly affected by light dilution. Although the method can determine the effect of light dilution, it cannot be applied for correction. Consequently, the following section proposes a correction model for the light dilution effect and performs scientifically accurate analytical calculations.
3.3. Realistic Radiative Transfer
Under the idealized light path, the solar scattered light intensity
passing through the plume is attenuated by absorption at a specific wavelength
according to the Beer–Lambert–Bouguer law, which depends on the absorption cross-section
and its gas concentration
along the optical path
.
The exponent is the optical depth
, which is proportional to the column density
of the absorbing gas along optical path
.
Obtrusive light, which seriously affects the accuracy of the measurement results, must be eliminated [
19]. Considering the distance
between the instrument and the plume and atmospheric scattering coefficient
, to reconstruct the radiative transfer equation, the light intensity
reaching the camera can be expressed as follows:
where
depends on atmospheric conditions, such as air pressure and temperature, and is directly related to atmospheric visibility. The scattering coefficient
is proportional to
when Rayleigh scattering of small molecules dominates and to
when Mie scattering of aerosols dominates.
The intensity of the image measured by the SO
2 camera is the convolution of the solar scattered light intensity
, filter transmittance
, and quantum efficiency
of the camera.
where the subscripts of
and
refer to the two wavelength channels.
In reality, air aerosol and detection distance affect the camera calibration curve, and Mie scattering has a strong wavelength dependence [
28]. Therefore, the SO
2 optical depth is re-expressed as follows:
where
is the ratio between the scattering cross-sections of the two channels.
Considering the effect of light dilution and combining Equations (11)–(13), the expression of the SO
2 optical depth can be optimized as follows:
Thus, the atmospheric scattering has a significant impact on the measurement of the SO2 concentration. It can be approximated as an ideal transmission model with a cloudless and high visibility condition, while the effect of scattering on instrument sensitivity must be considered at long distances or under low visibility conditions.
4. Theoretical Description of Detection Limit
When detecting the SO2 concentration with the two-spectral channels of the UV camera, the detection limit can be defined by the SO2 concentration value, which corresponds to the change in camera signal intensity being greater than or equal to the instrument noise level. For UV imaging telemetry systems, the detection limit is usually determined by the combination of weather conditions and instrument performance. The solar scattering spectrum provides the initial signal source for the SO2 camera, and the detection limit improves with cloud-free weather conditions. In terms of instrument performance, the quantum efficiency of the CCD, the aperture and transmittance of the camera lens, the central wavelength, the transmission bandwidth and maximum transmittance of the UV filters, and the exposure time of the camera directly affect the detection limit of the SO2 UV camera system.
Typically, the detection limit of the SO
2 camera is greatly dependent on the monitoring distance due to the light dilution effect. The SO
2 concentration error
can be expressed according to the error transfer relation.
where
and
are the errors of the calibration curve slope and the optical depth, respectively.
is obtained by differentiating Equation (14).
Then,
can be written as follows:
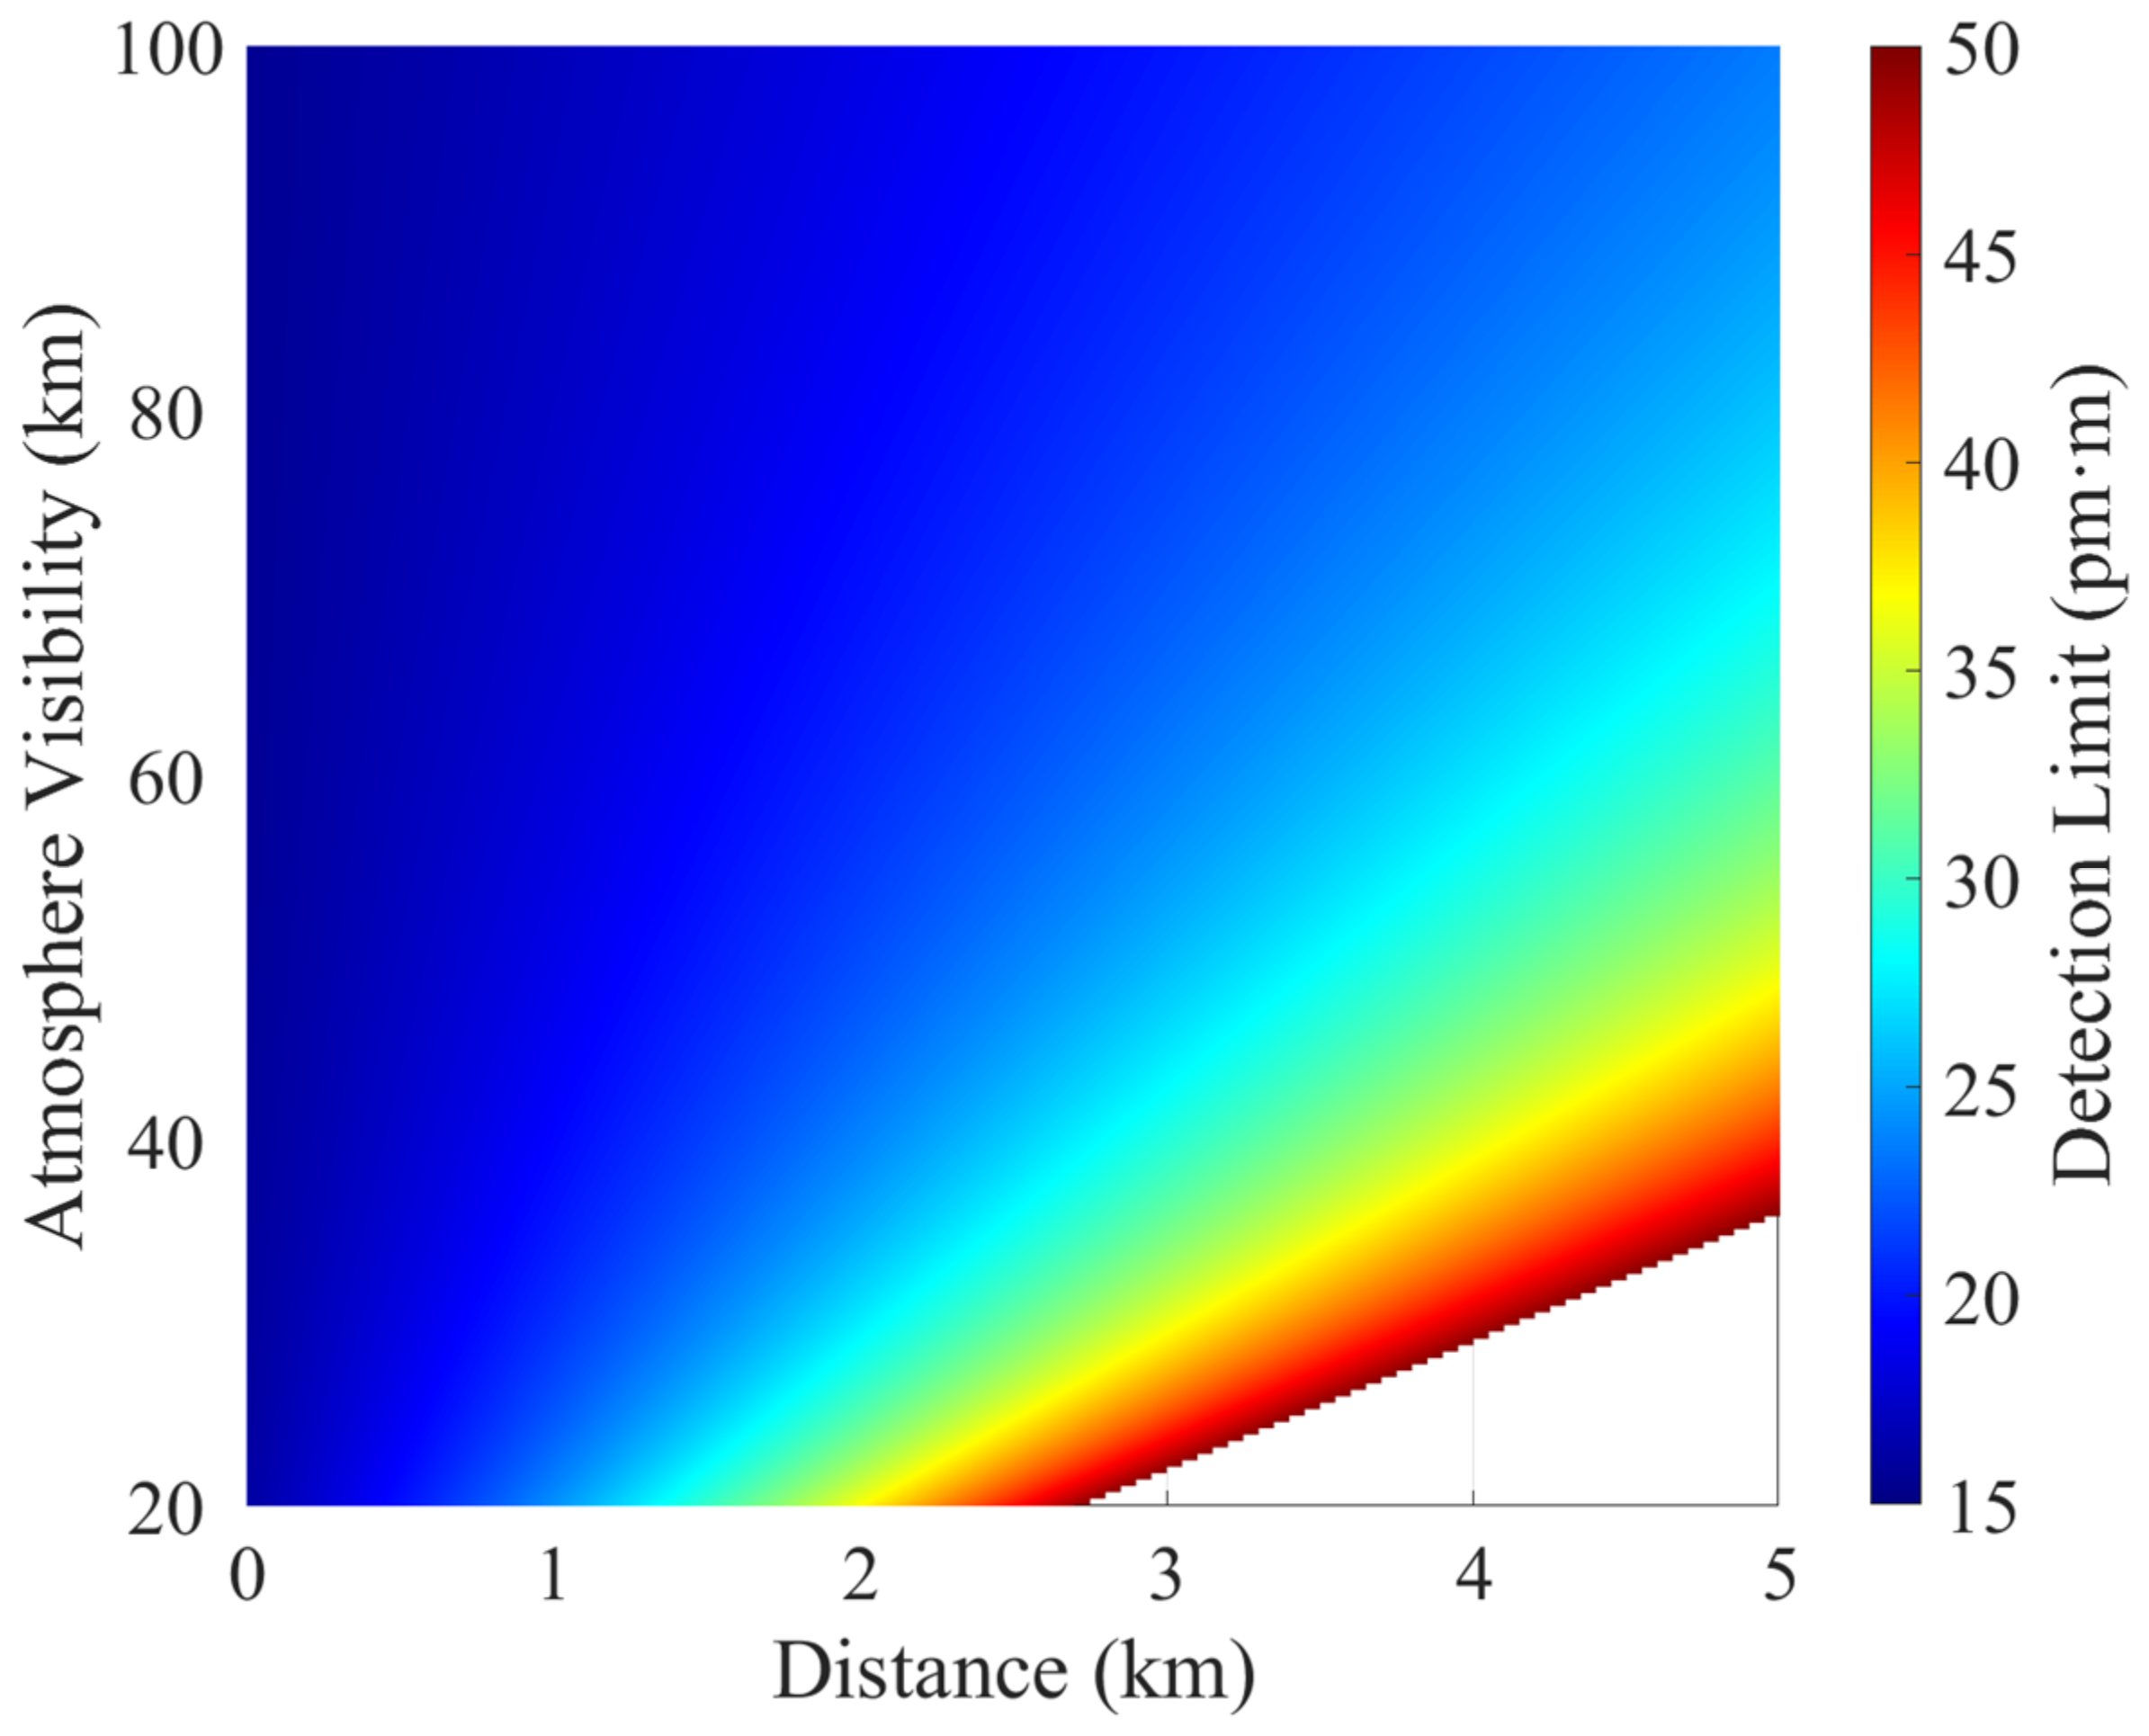
The light dilution effect influences the detection limit because sunlight is scattered by air molecules and aerosols in the light path, causing additional photon noise after entering the camera’s FOV. To evaluate the effect of the light dilution on the detection limit, the detection limit of the camera was calculated for the different monitoring distances and the atmospheric visibility by simulation using the actual atmospheric radiation transmission model (
Figure 6). All the results are based on normal atmospheric conditions (temperature and humidity are at normal levels).
Two features can be seen in
Figure 6. First, the detection limit of the instrument worsens with the increasing distance from the plume at the same atmospheric visibility. Consequently, more solar scattered light in the path is scattered by air molecules and aerosol particles, and the resulting obtrusive light brings increased signal uncertainty to the measurement results. Second, the Mie and Rayleigh scattering effects increase with the decreasing atmospheric visibility at a certain distance, leading to a decrease in camera sensitivity and worsening of the detection limit. The effects of air aerosol scattering on the camera performance depend not only on the detection distance but also on the atmospheric visibility, which causes the significant difference in the optical depth measured from the actual value.
In addition to the light dilution effect, the quantity of aerosol in the plume is an important consideration affecting the detection limit of the SO
2 camera. When the plume is filled with solid particles, absorption and scattering effects will take place, thus resulting in the continuous extinction of wavelengths (see
Section 3). The amount of change in signal intensity by SO
2 gas absorption decreases with the increasing optical depth of the aerosol, which eventually leads to the poor detection limits of the system (see
Figure 7).
For specific telemetry plumes, regions with low SO2 gas concentrations also generally have a low aerosol content. Therefore, the effect of aerosol extinction on the SO2 concentration detection limit can often be ignored in actual measurement experiments.
5. Results
5.1. Measurement Setup and Location
The above theoretical analysis shows that the sensitivity of the UV camera to detect SO2 concentration is heavily dependent on the detection distance, weather conditions, and the optical depth of the carbon black particles in the exhaust plume. The inversion of the SO2 concentration images can also be challenged by the presence of light dilution, and the calibration curve should be obtained by considering the actual radiative transfer process. This causes the detection limit of the same SO2 camera for imaging the exhaust plume of a ship to deteriorate sharply with the increase of the detection distance.
To verify the effect of UV scattering on the detection limit of the instrument, we conducted an outfield experiment on the exhaust emissions of round-trip ships in the Shanghai Port on 11 April 2019. The sky was free of clouds, and the visibility was approximately 60 km. The SO2 concentration of the ship exhaust was lower than that of volcanic and industrial chimneys and greatly influenced by the atmospheric conditions and the distance during monitoring. Thus, instruments with a high detection limit were required. The SO2 camera used in this experiment consists of a pair of 2048 × 2048 pixels UV back-illuminated CMOS sensor (Prime 95B), C-mount quartz lenses (VTUV10540T) with an F number of 4.0, and two UV bandpass filters with the central wavelength at 310 nm (XBPA310) and 330 nm (XBPA330) for each channel. This camera has a fast sampling frequency (better than 40 Hz) and a good SNR (the quantum efficiency of the camera at 310 nm and 330 nm is approximately 50%). To obtain a calibration curve that fully considers the actual radiative transfer process, this SO2 UV camera system is equipped with a DOAS and placed between the two cameras. The DOAS system consists of a BIM-6704 spectrometer with a resolution of 0.25 nm, a 1000-um quartz optical fiber, and a UV lens of the same type as the camera lens. The FOV angles of the SO2 cameras and the DOAS are 9.8° and 0.54°, respectively, where the DOAS’s FOV corresponds to the central field of view of the SO2 camera. All the instruments are installed together on an operation platform through a fixed link, and the tracking ship is controlled by a software to ensure that the FOV strictly matches during the tracking of the ship.
The exposure time for both cameras was fixed, with the 310 nm camera (signal channel) set to 100 ms and the 330 nm camera (reference channel) set to 50 ms, capturing images at a framerate of 10 Hz. Firstly, close the mechanical shutter of the cameras to take the dark noise images of each camera, which are used to correct for the CCD having a nonzero response to zero light input. Then, each of the two cameras simultaneously captures an image of the plume. Also required are clear images, which show the intensity of light that arrives at the camera CCD from each direction before passing through the plume. The clear images are obtained by panning the cameras to an area of plume-free sky as near to the plume as practicable. We captured clear images in small breaks in camera measurements, and at least half-hourly.
5.2. Detection Limits of the SO2 Cameras System
The image of the SO
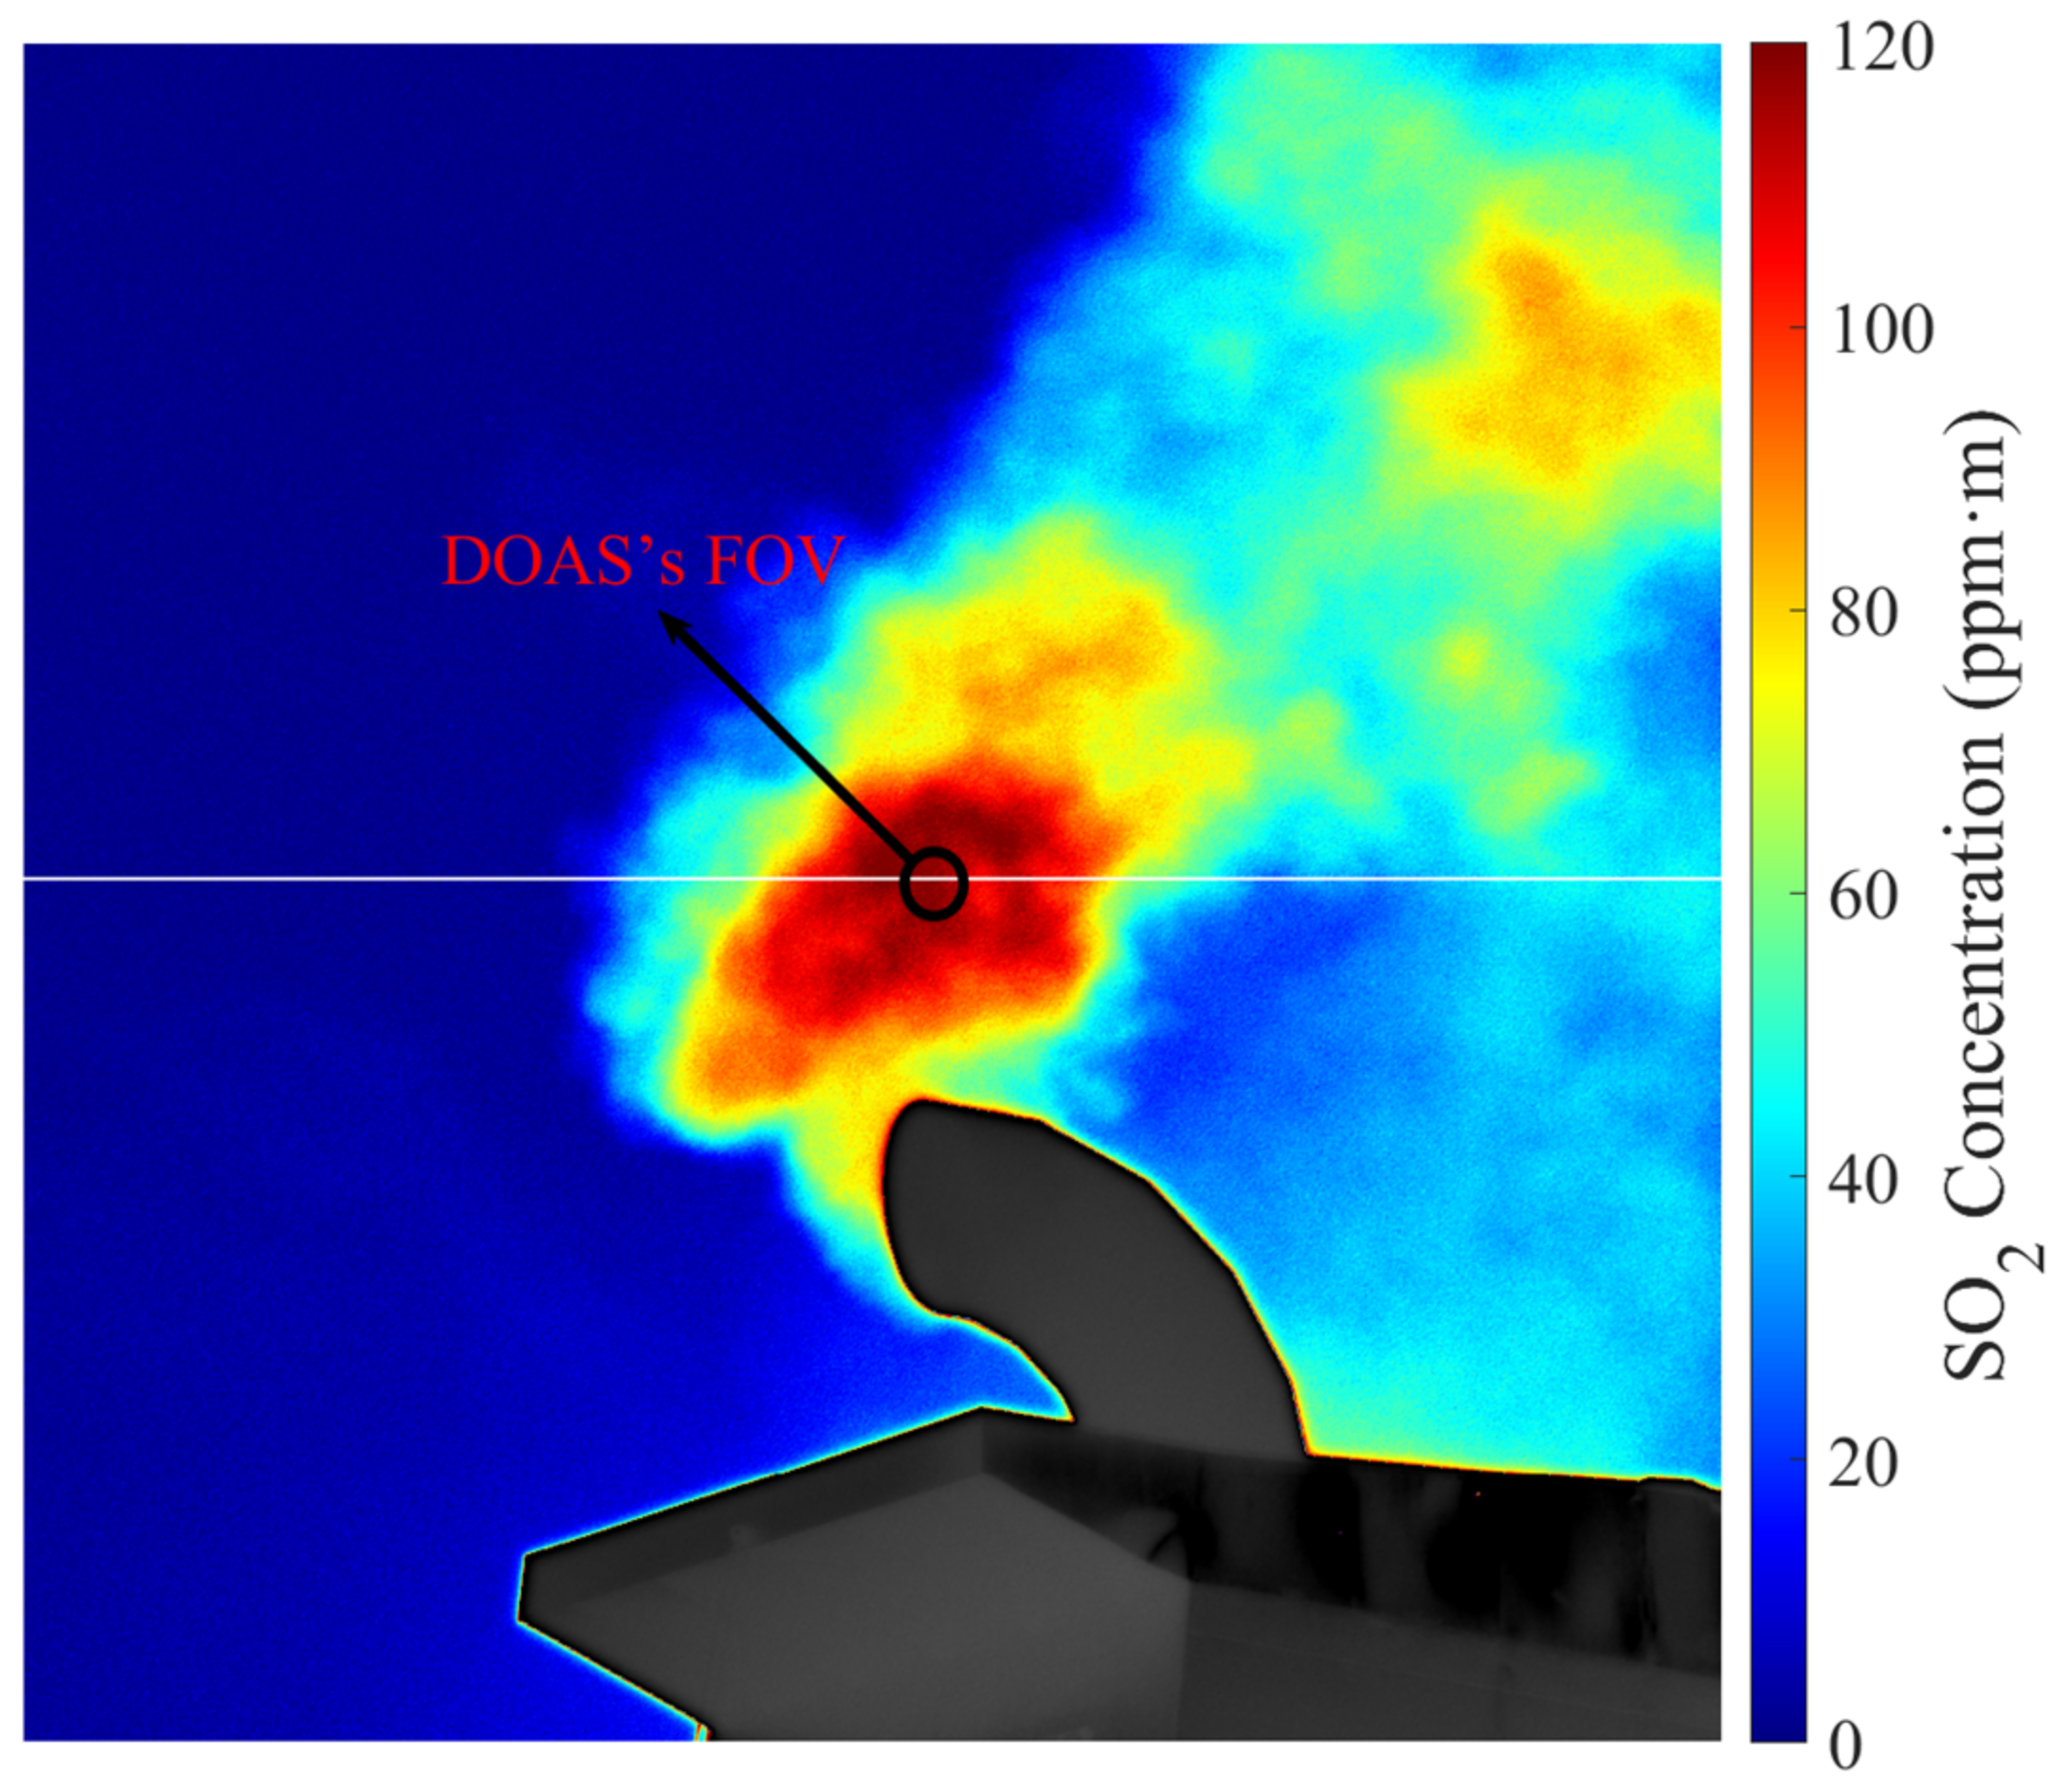
2 concentration obtained by monitoring the inversion at approximately 200 m from the ship is shown in
Figure 8. The left region of the concentration image is nearly free of the exhaust plume due to the combined effect of the ship’s navigation direction and the wind speed direction over the sea surface. For an intuitive analysis of the detection limit using the SO
2 camera at close range, a row of pixels in the camera FOV past the center of the plume is taken out, and the SO
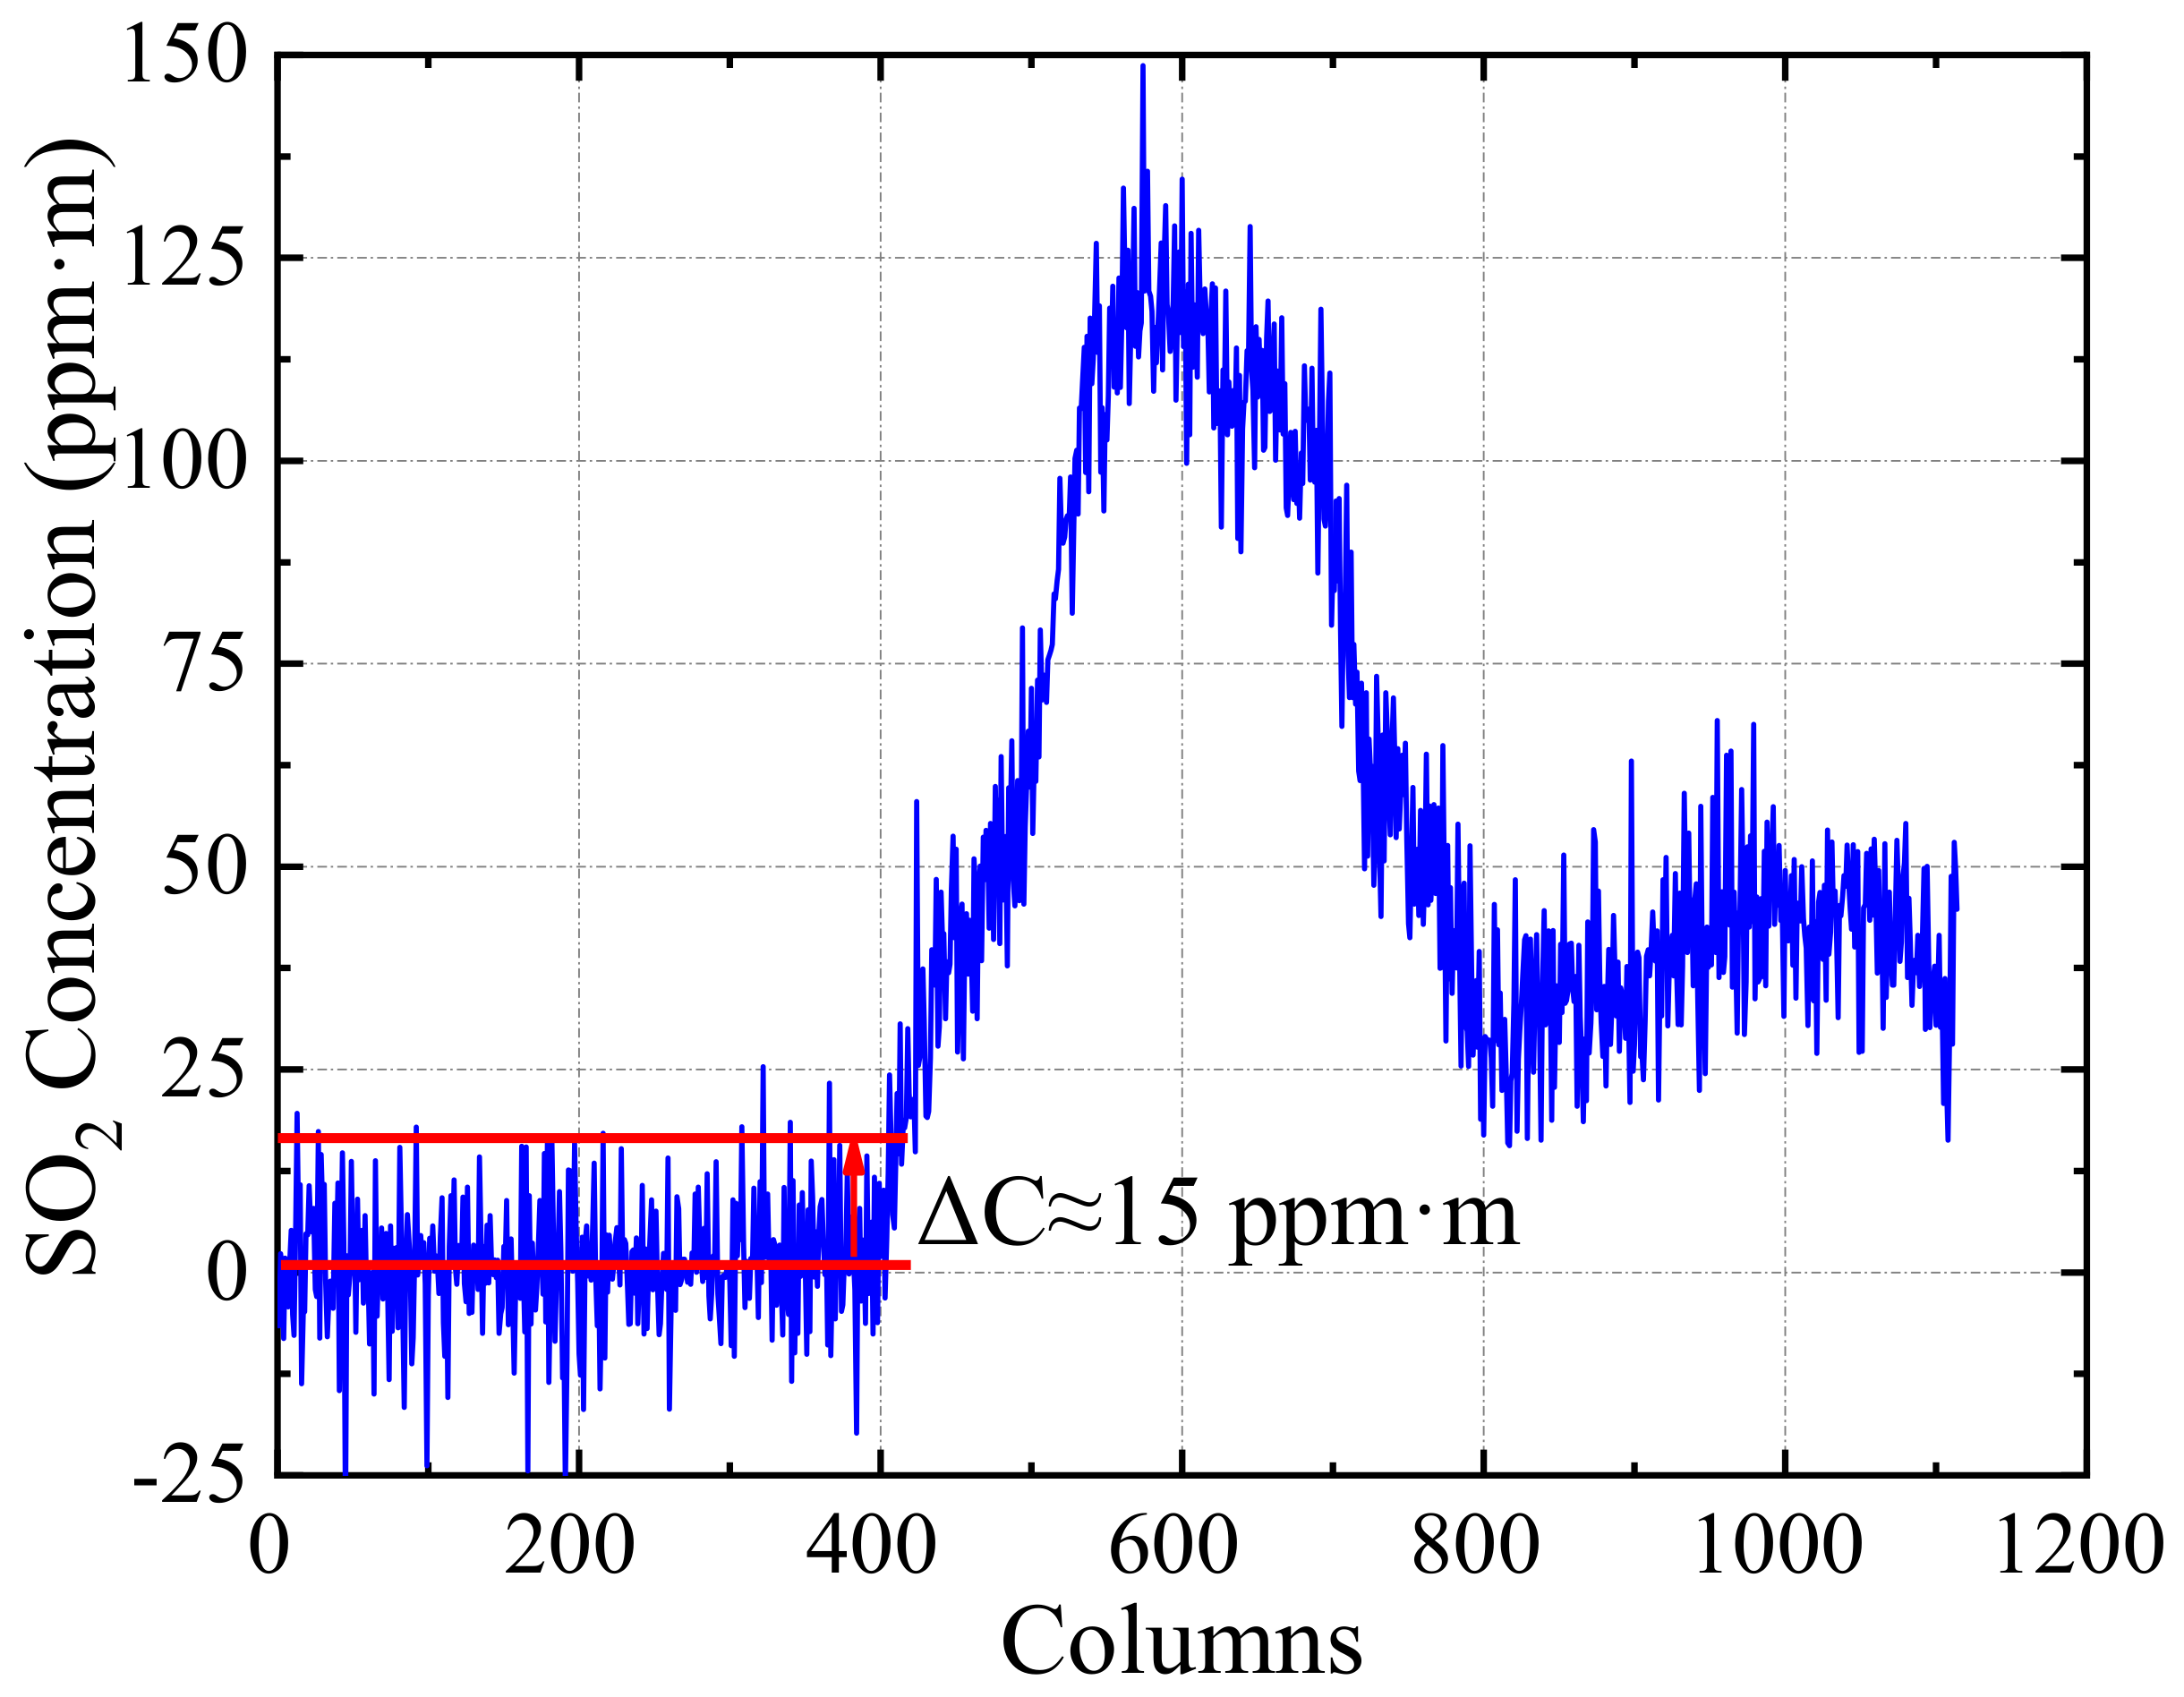
2 concentration value in that row is obtained (see
Figure 9).
Section 2.3 shows that if the signal strength is lower than or equal to the noise strength, then the SO
2 concentration signal in the exhaust plume is drowned out by the noise and cannot be measured by the instrument. The left half of the concentration curve in
Figure 9 shows that the SO
2 concentration fluctuates up and down at
, and the noise level is
. Therefore, the detection limit of the SO
2 camera at close range is
, which is consistent with the theoretical analysis results in
Figure 6.
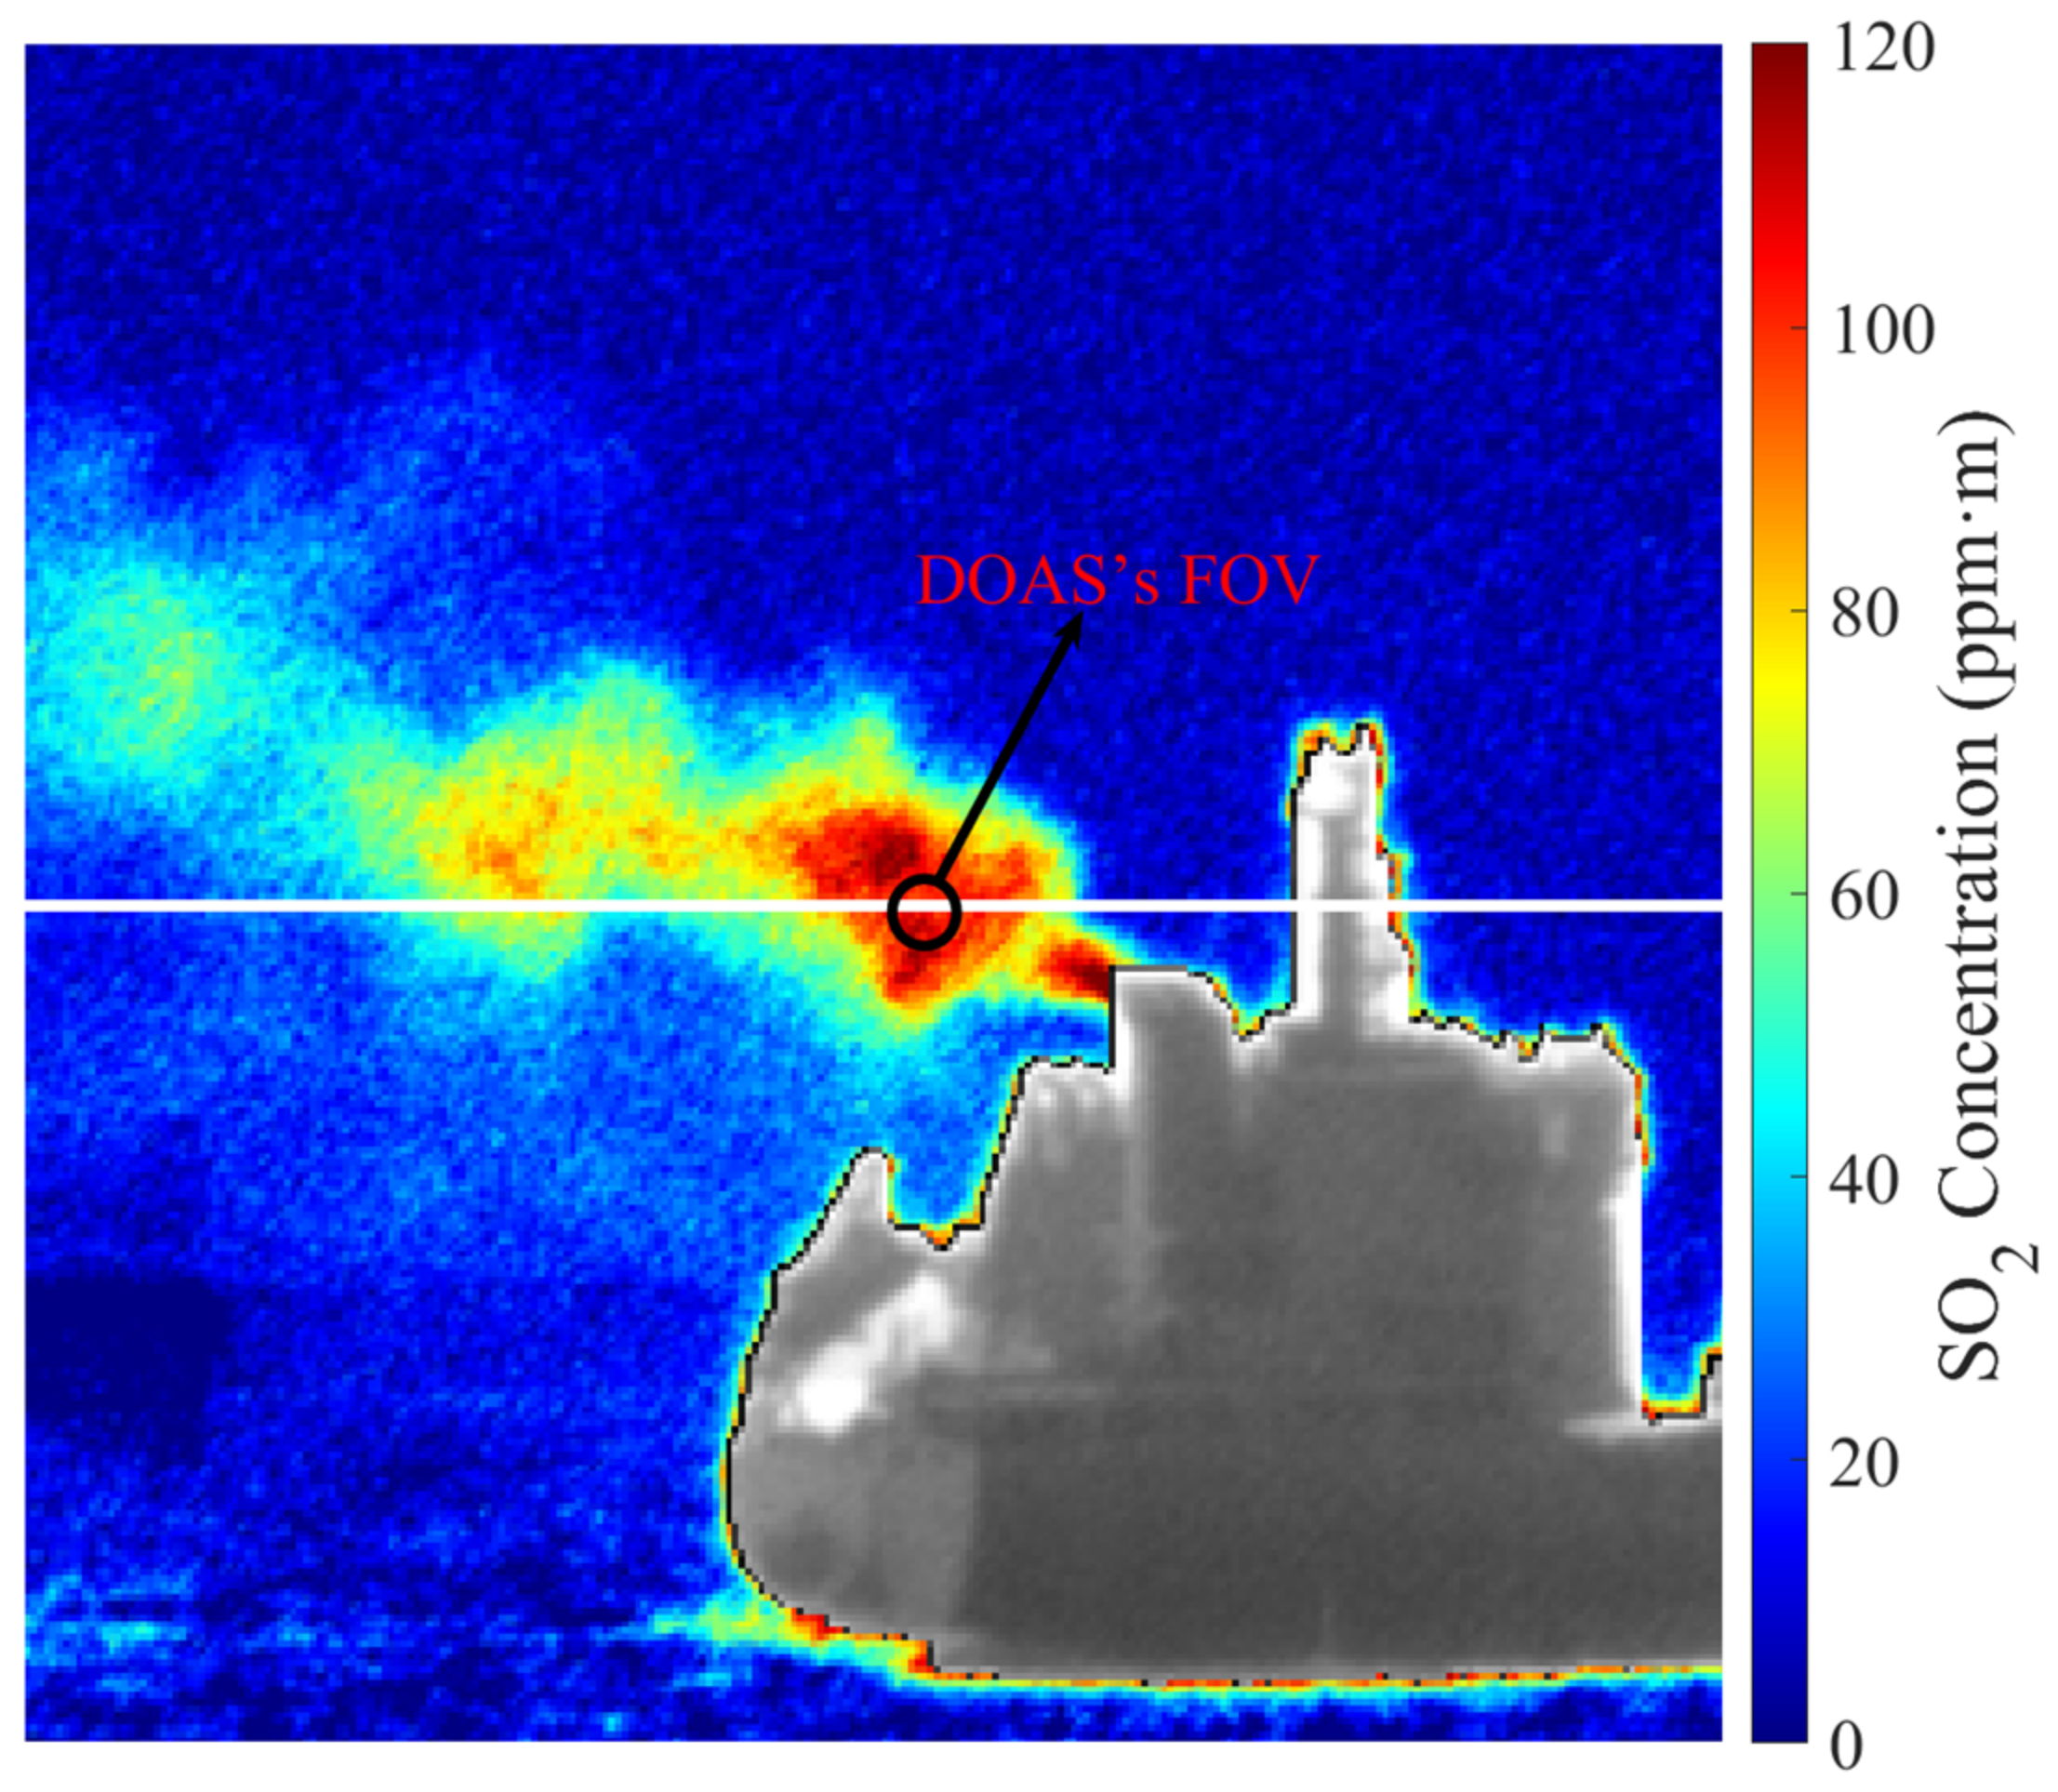
When the ship sailed 3.5 km away from the SO
2 camera, the SO
2 concentration image of the ship exhaust obtained by the SO
2 camera is shown in
Figure 10. Owing to the change in the sea wind direction, no ship exhaust signal can be observed on the right side of the image.
Figure 11 shows the SO
2 concentration curve with similar methods as in
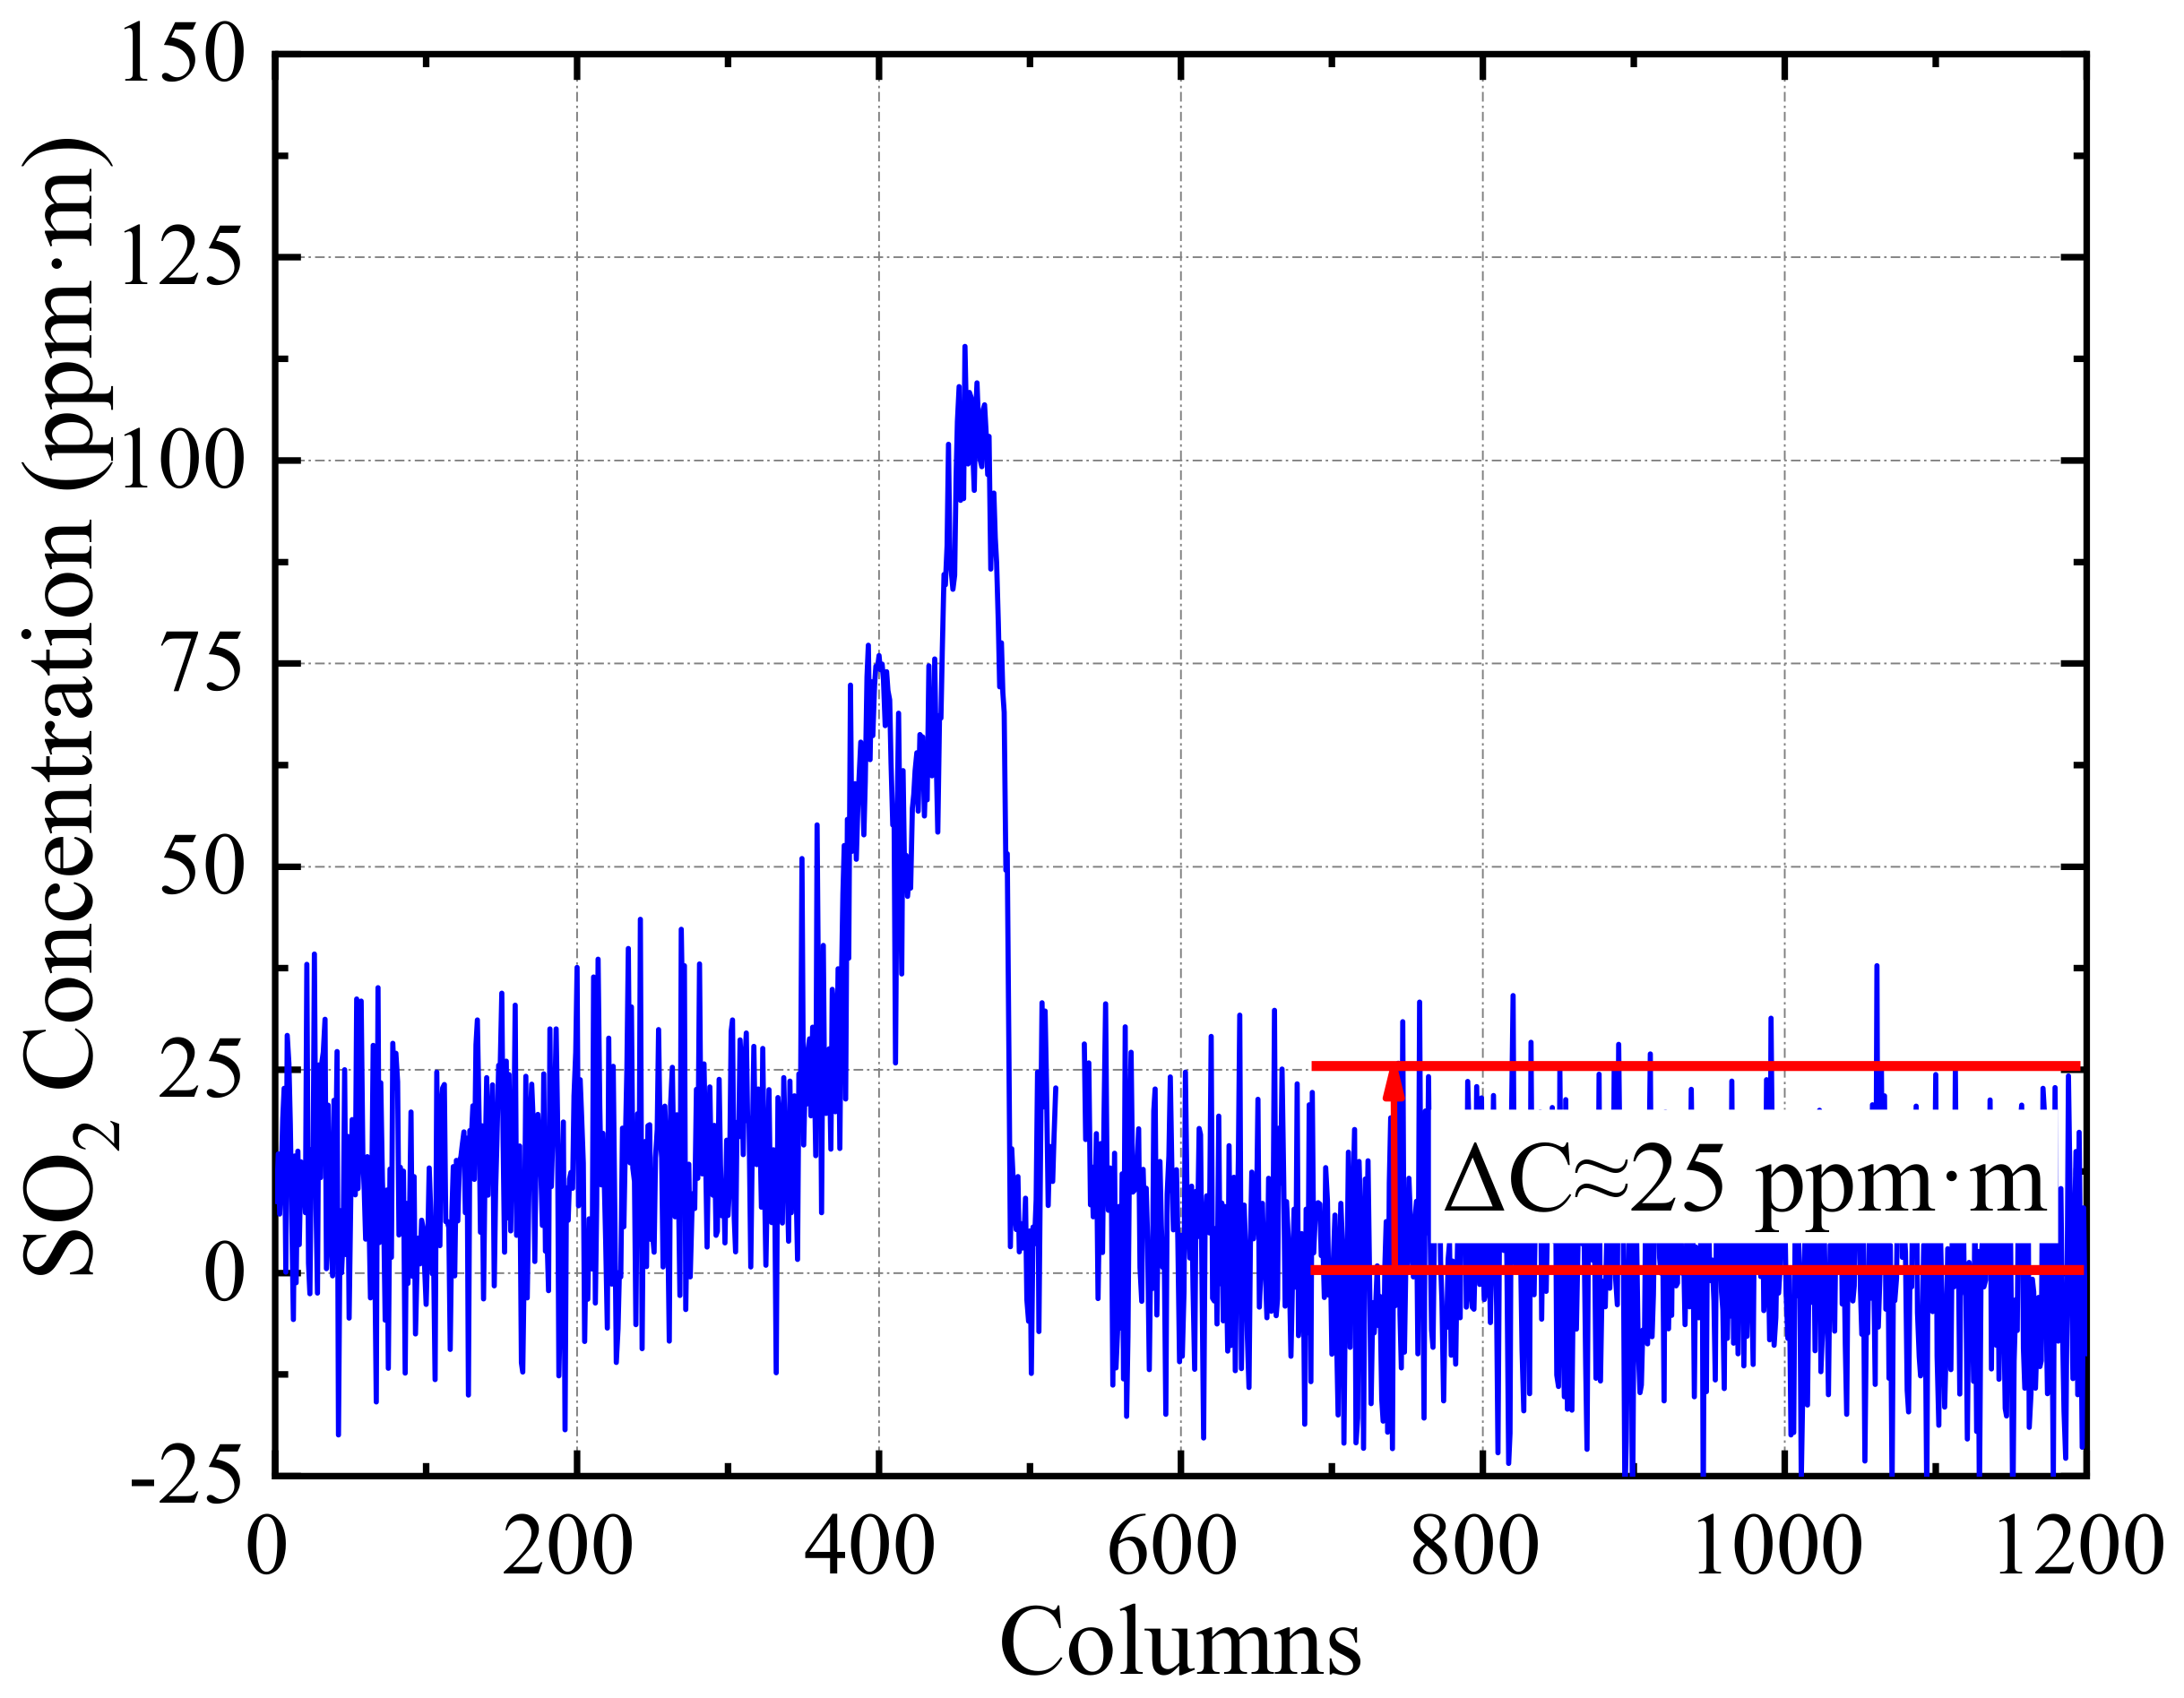
Figure 9. It can be seen that the noise level of the SO
2 concentration fluctuates significantly around
as the detection distance increases. The results clearly show that the SO
2 concentration detection limit of the camera system increases to
with the detection distance change from 200 m to 3.5 km, which is also consistent with the theoretical analysis in
Figure 6.
The comparison of
Figure 9 and
Figure 11 shows that the atmospheric UV scattering worsens the camera detection limit as the monitoring distance increases. Meanwhile, the visibility is generally reduced with the generation of sea fog, strengthening the influence of the light dilution effect. If the detection limit of the instrument is extremely poor, the signal obtained under low SO
2 concentration in the plume should be difficult to monitor, making the final measured SO
2 emission rate low. Especially for low SO
2 concentration pollution sources (such as ship exhausts), large errors will take place under long distances and low visibility conditions. Therefore, the key for optimizing the detection limit of SO
2 cameras with full consideration of the actual radiation transmission process is to reduce the effect of light dilution by selecting UV cameras with high quantum efficiency and a low thermal noise electron number and selecting narrow bandpass filters with high-transmittance and large-aperture telescopes. These methods effectively reduce the influence of the light dilution effect on the detection error and have an important significance in improving the detection distance of the instrument.
6. Discussion
We have analyzed the factors affecting the camera detection limit, such as the selection of the filter center wavelength, detection distance, and aerosol scattering. Due to the limitation of the experimental conditions, the above theory and experimental results only rely on one type of camera. It is not difficult to see from the analysis (see
Section 2) that the detection limit may be affected by camera hardware indicators, almost a decisive one sometimes. In the following, four individual SO
2 camera systems are compared to find the influence of camera performance on the detection limit.
Table 1 gives an overview of the specifications of each system. Meanwhile, the control tests at different monitoring distances and atmospheric visibility are added to verify the universality of our proposed detection limit theory (see
Section 4).
One of the most meaningful parameters to compare among the various camera systems is the SO
2 detection limit.
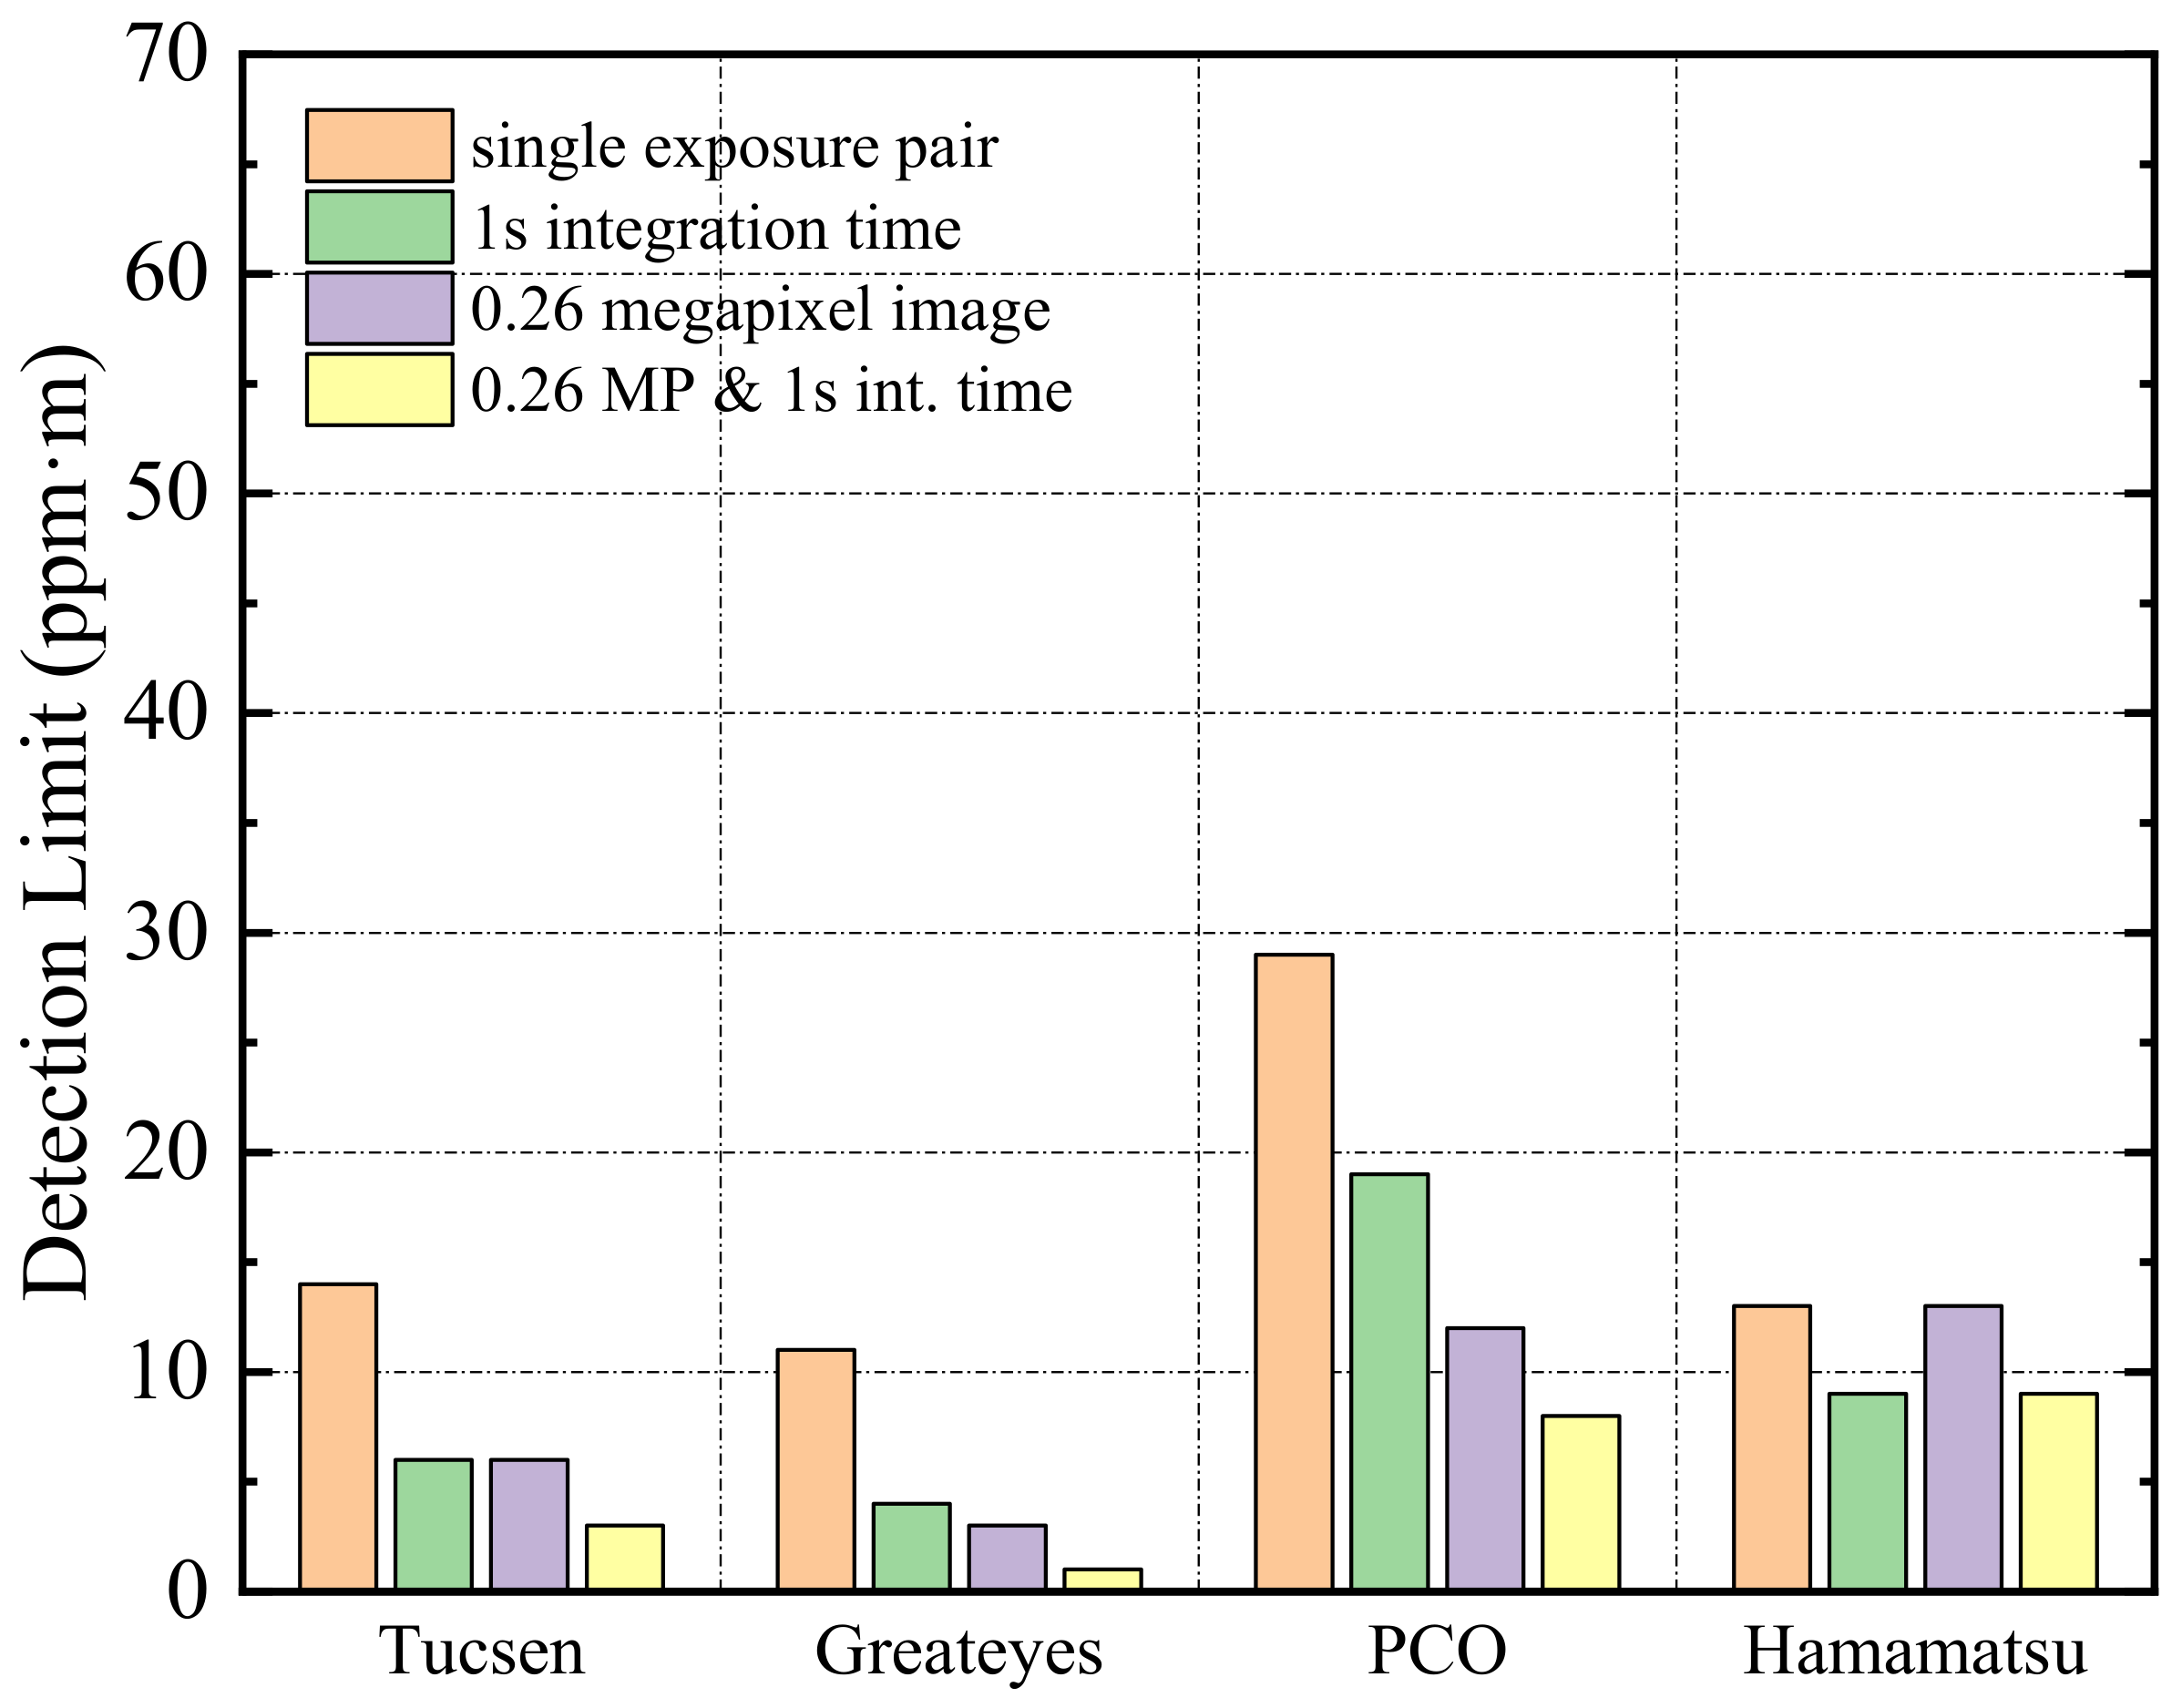
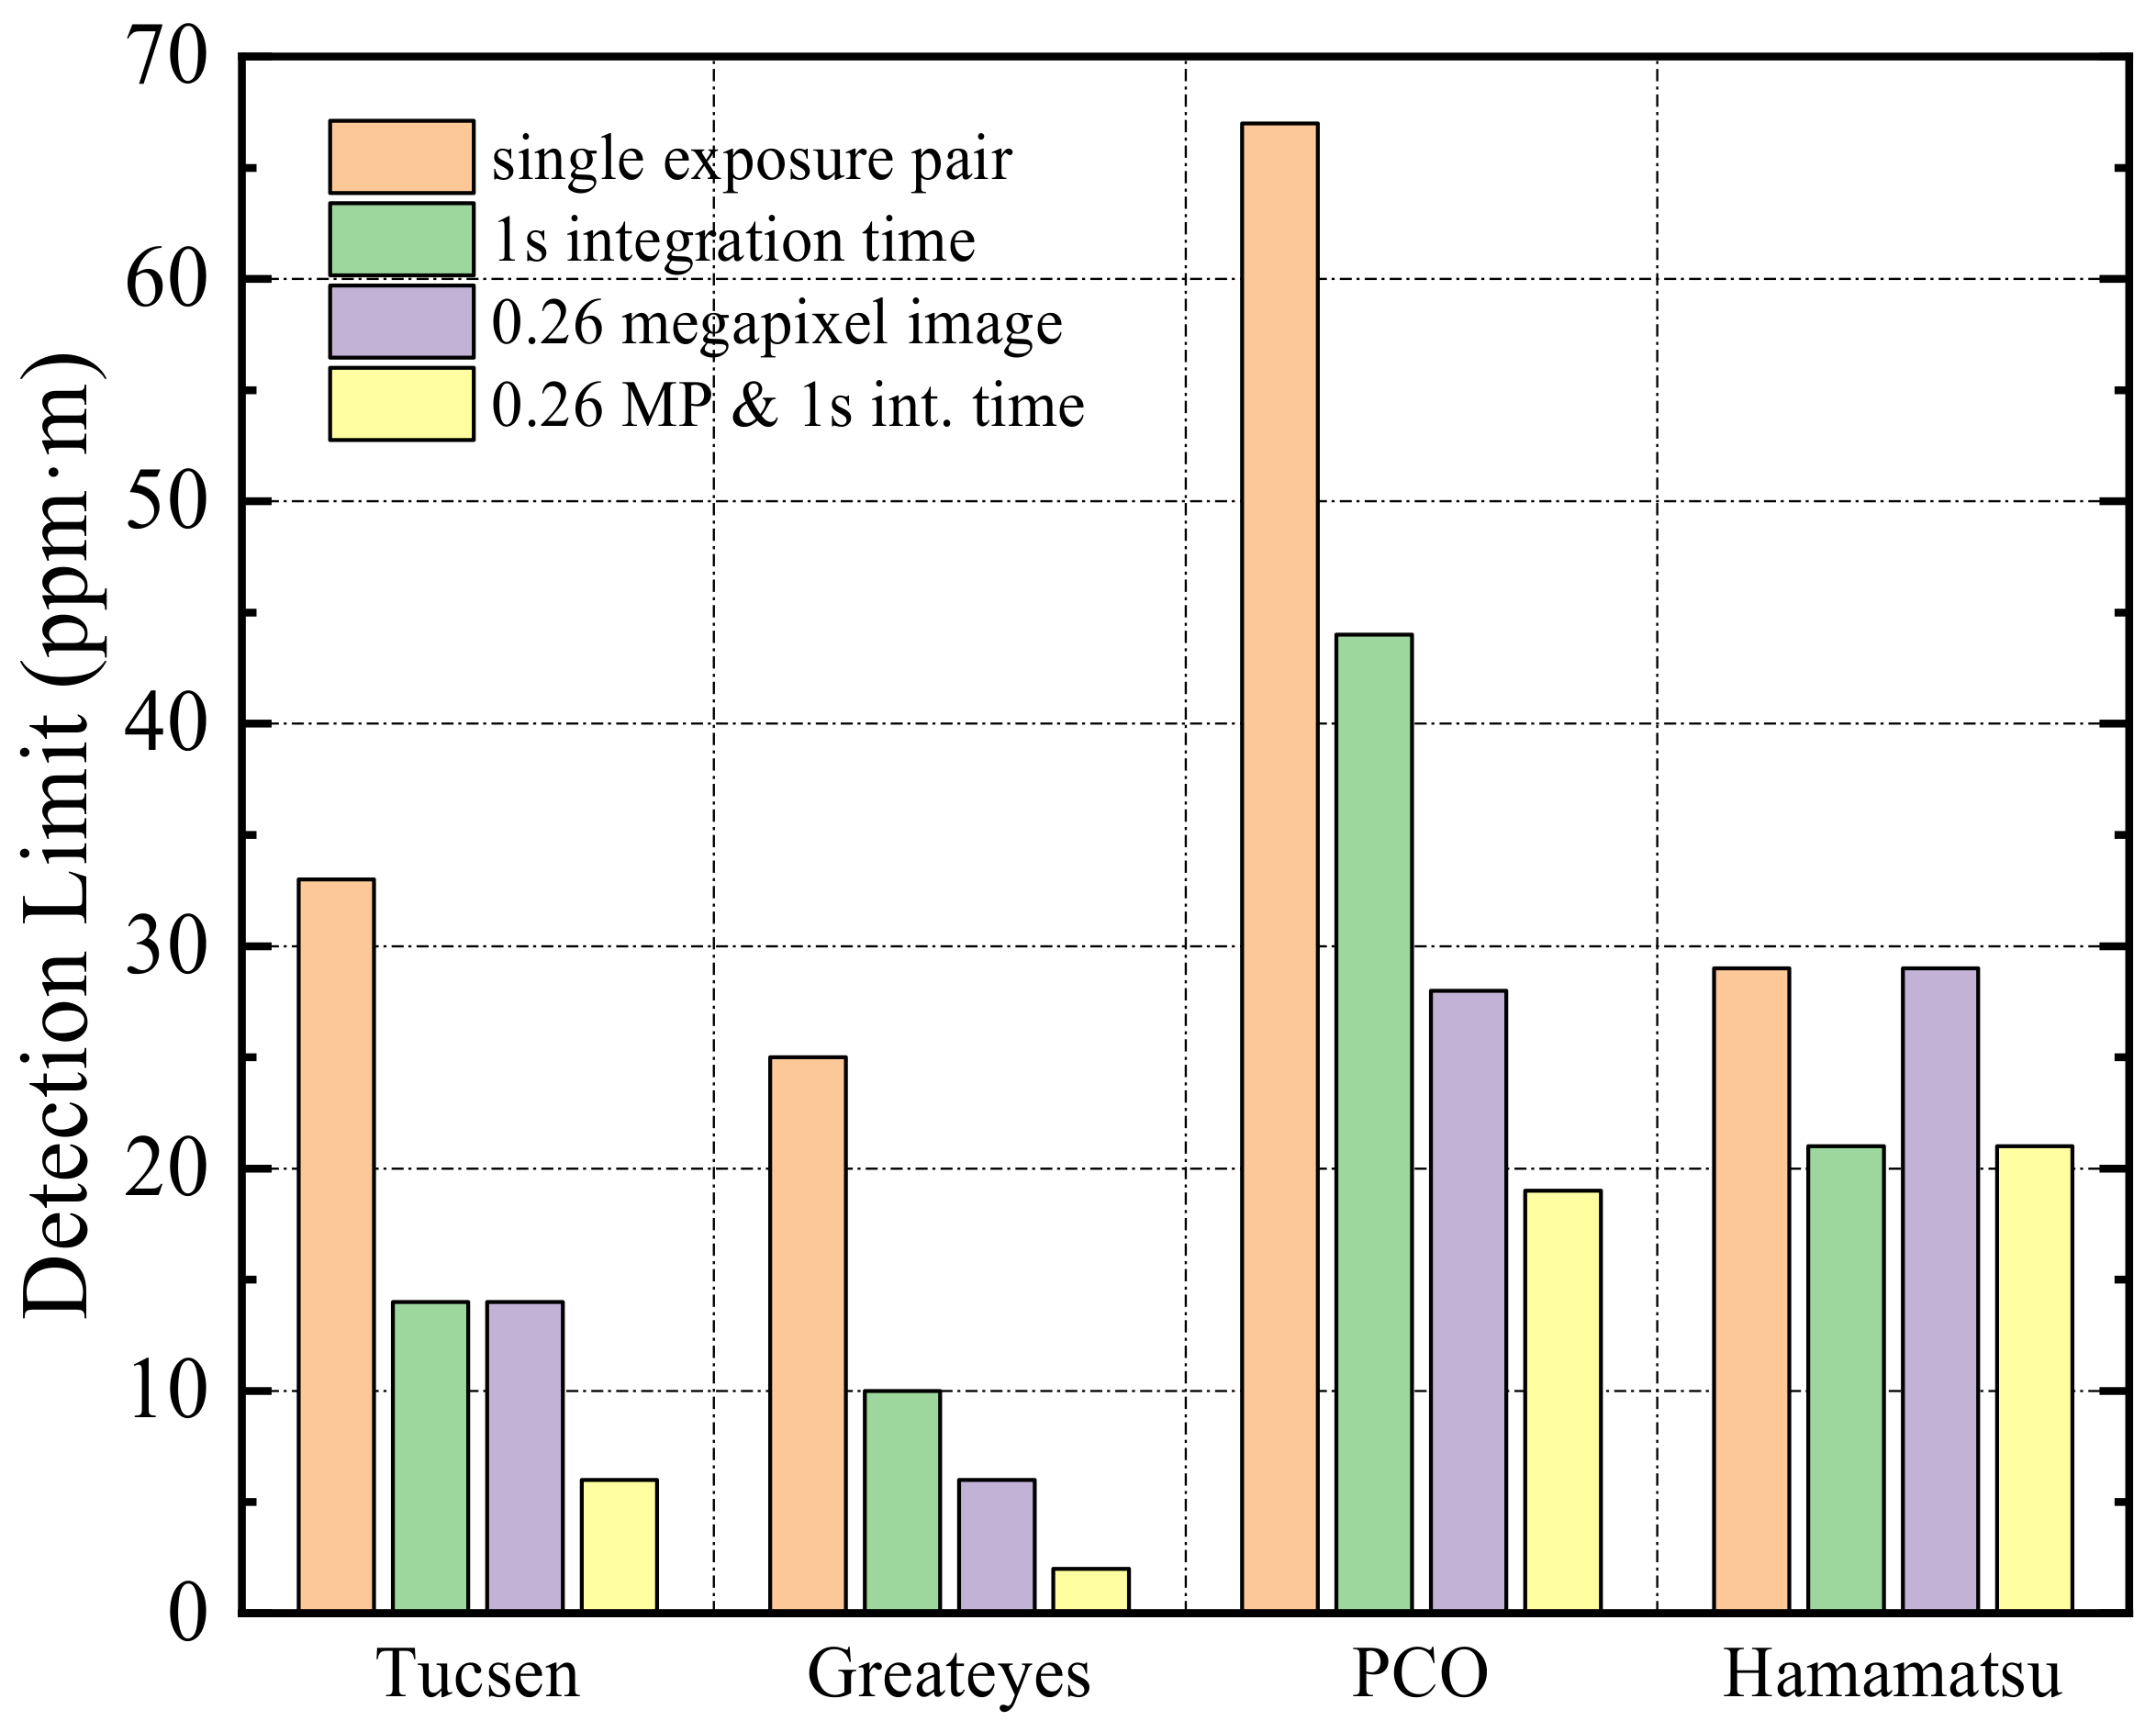
Figure 12 shows the detection limits derived for each system under the ideal condition. The first bar gives the SO
2 detection limit obtained by one suite of images in which the saturation of both images is approximately 80% of the maximum. The second bar given for each camera system represents the detection limit that is obtained by co-adding multiple images within the total integration time of 1 s. Sensors with relatively low full-well capacity and shorter exposure times benefit most from this operation. Since the full-well capacity of the different sensors varies, so too does the acquisition time for each camera system. In general, sensors with larger pixel sizes, higher quantum efficiency, and lower full-well capacity require a shorter exposure time. Here, the detection limits of Tucsen and Greateyes have the most significant improvement during the time-integrated operation, which are improved by 57% and 64%, respectively. It should be noted that this calculation does not consider the time required for transmitting images to the acquisition computer, only the actual exposure time of the sensor.
Another way to improve the detection limit is by co-adding adjacent image pixels. In practice, a smoothing filter is usually applied to achieve this. This operation abates the interference of noise on the image quality at the expense of reducing the spatial resolution of the image. However, the four cameras we selected have different spatial resolutions. To effectively compare the effectiveness of this method, the detection limits of each camera are obtained after co-adding spatial resolutions until 512 × 512 pixels (see the third value in
Figure 12). It can be seen that, except for Hamamatsu, the detection limits of the other three cameras have been significantly improved. The detection limit of the Greateyes camera with the highest spatial resolution (2048 × 2048 pixels) is increased by 73%, greatly improving the detection capability at low concentration.
The detection limit given by the final bar for each system is the value of the co-added image with an integration time of 1 s and pixels merging to 512 × 512. Obviously, all systems have a detection limit of better than 10 ppm·m. Largely due to its high definition and excellent quantum efficiency (), the Greateyes camera system exhibited the lowest detection limit (around 1 ppm·m). This last operation is generally the most useful method for improving camera performance unless a specific application requires a very high temporal or spatial resolution where co-adding or smoothing is therefore not possible.
In practical applications, the monitoring conditions are usually not ideal. The UV camera will be placed several kilometers away from the monitoring target to obtain the optimal FOV. With an increase in distance, the signal light reaching the camera’s light-sensitive surface can be easily affected due to the light dilution effects.
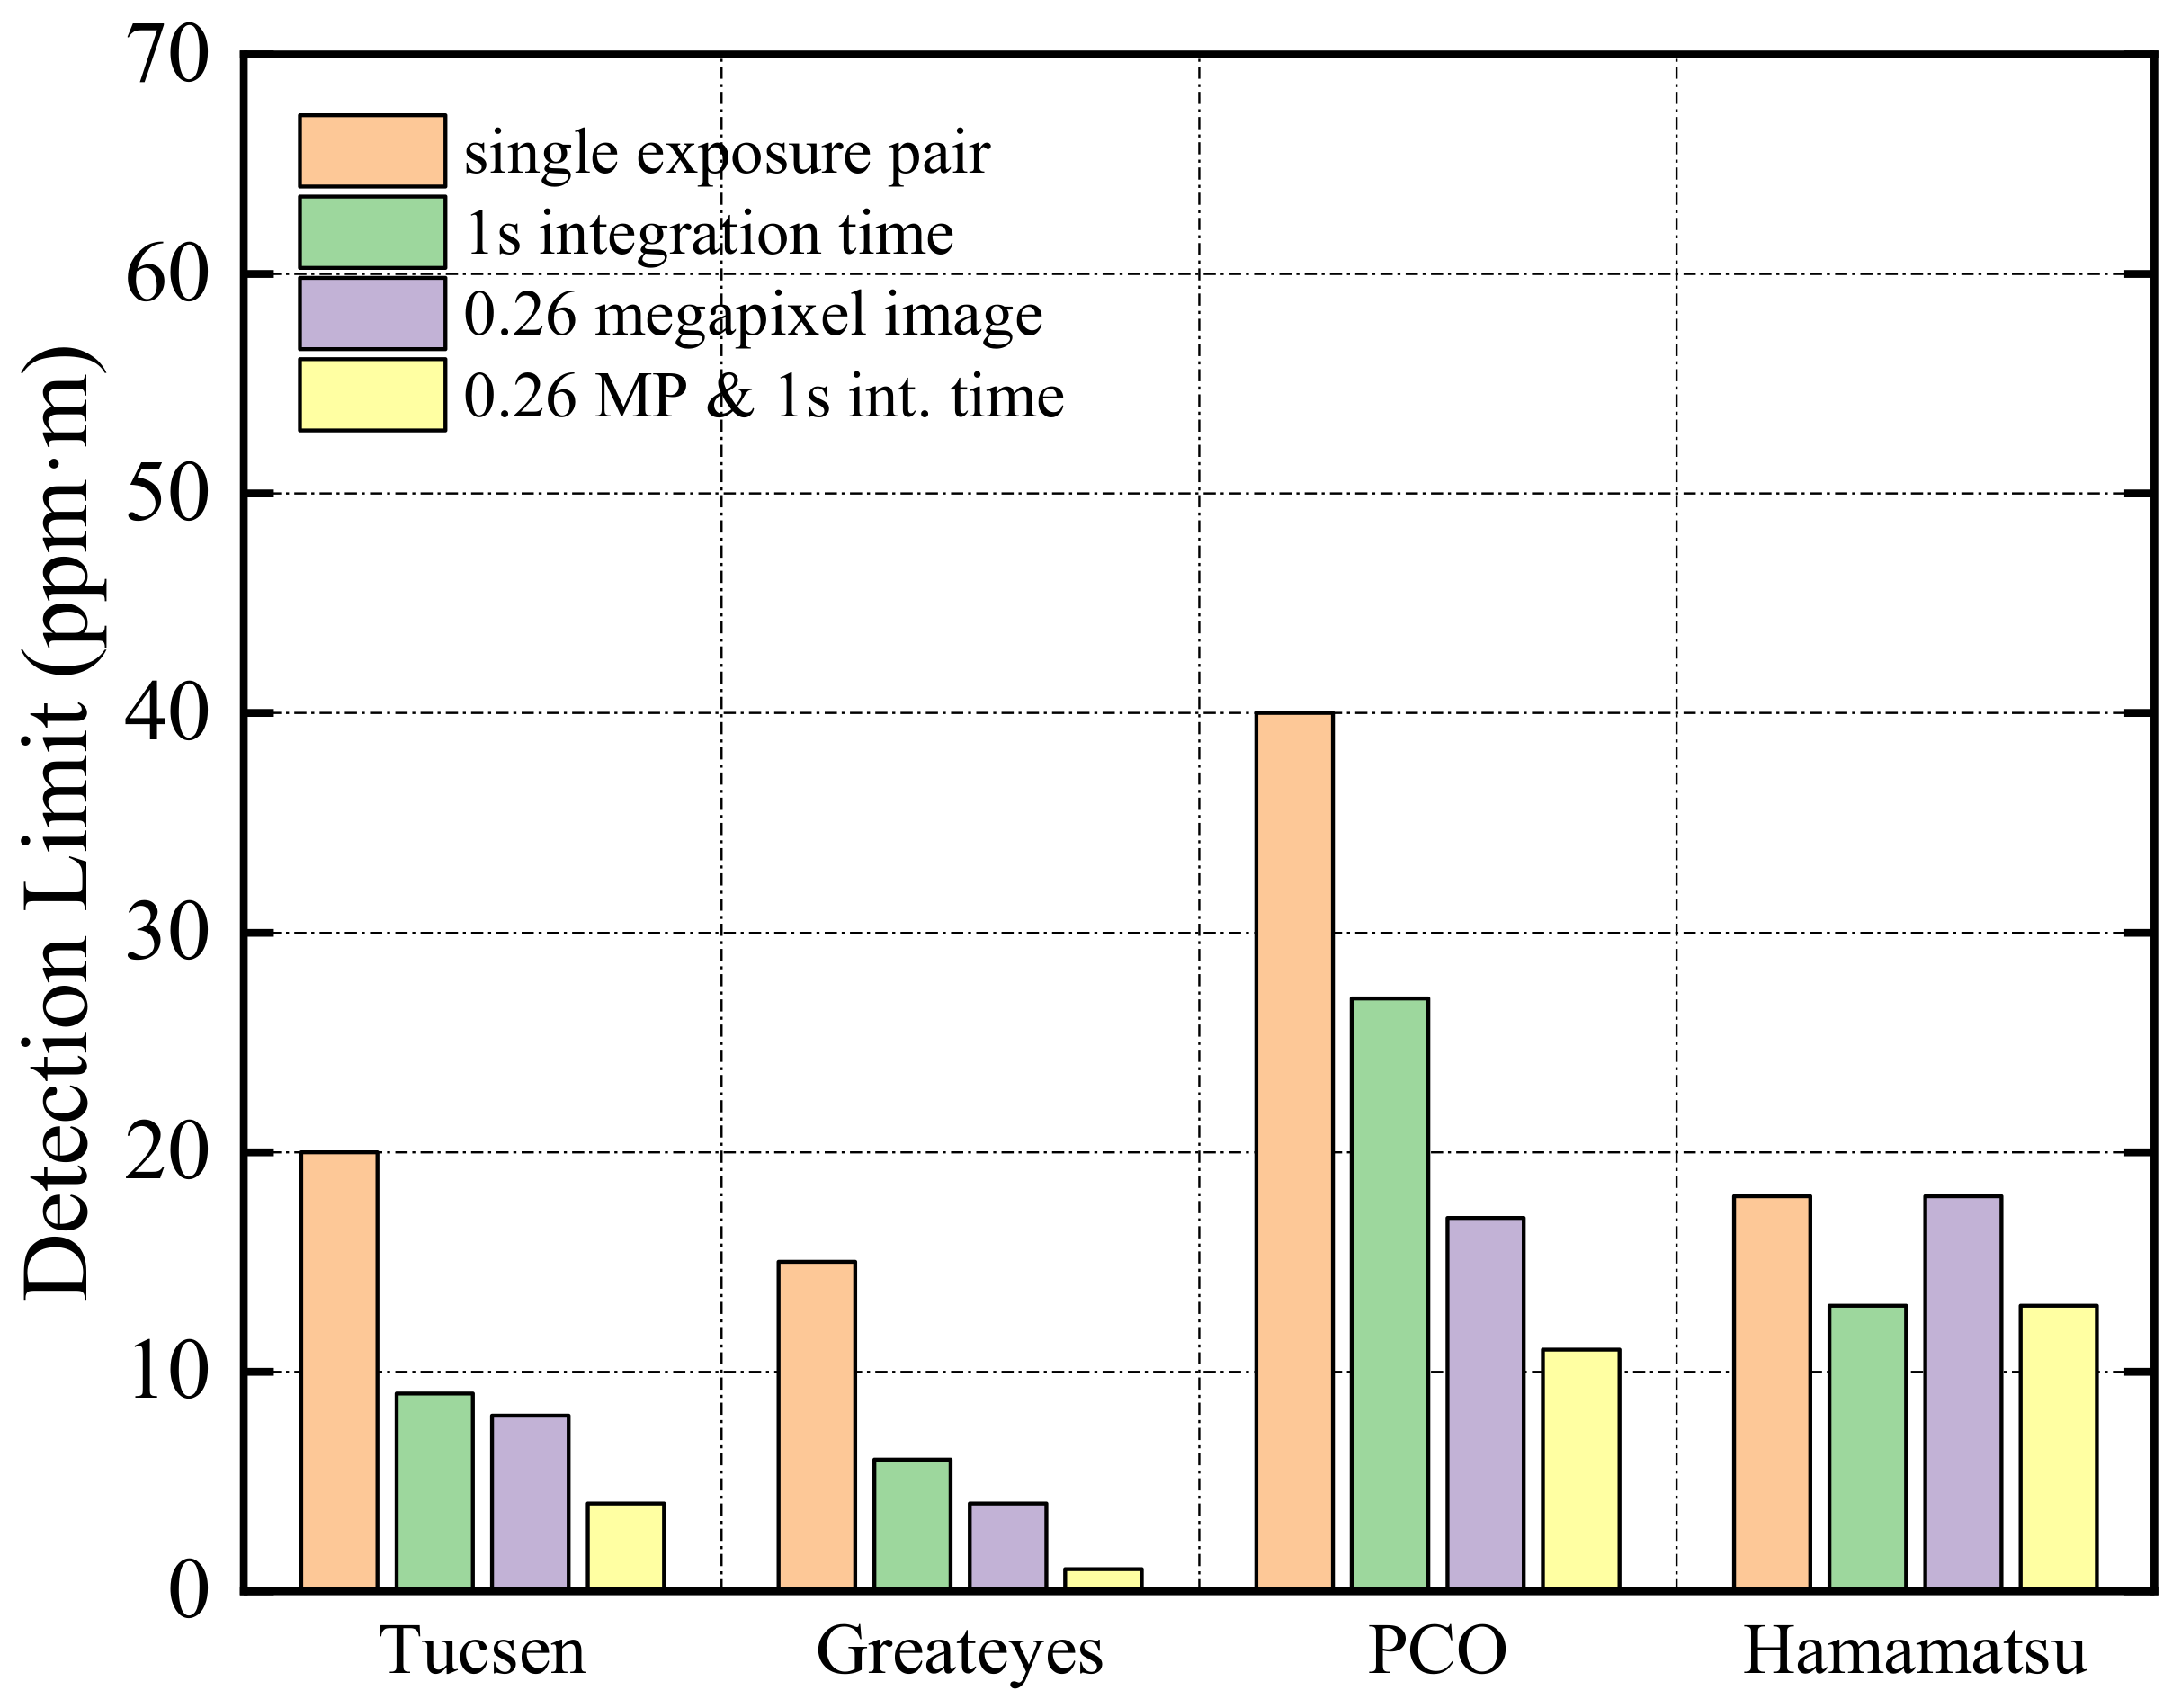
Figure 13 shows the detection limits derived for each system with a detection distance of 2 km and atmospheric visibility of 50 km (the first bar). As can be seen, the detection limits of all cameras have increased to varying degrees. The poor performance of the PCO systems is the most seriously affected, with the camera performance declining by approximately 38%. The light dilution effect will weaken the effective signal light intensity reaching the camera-sensitive surface, while the increase in stray light can inevitably introduce more noise.
Next, we varied the monitoring distance or atmospheric visibility over the conditions in
Figure 13 to explore the effect on camera detection limits at long distances or low atmospheric visibility.
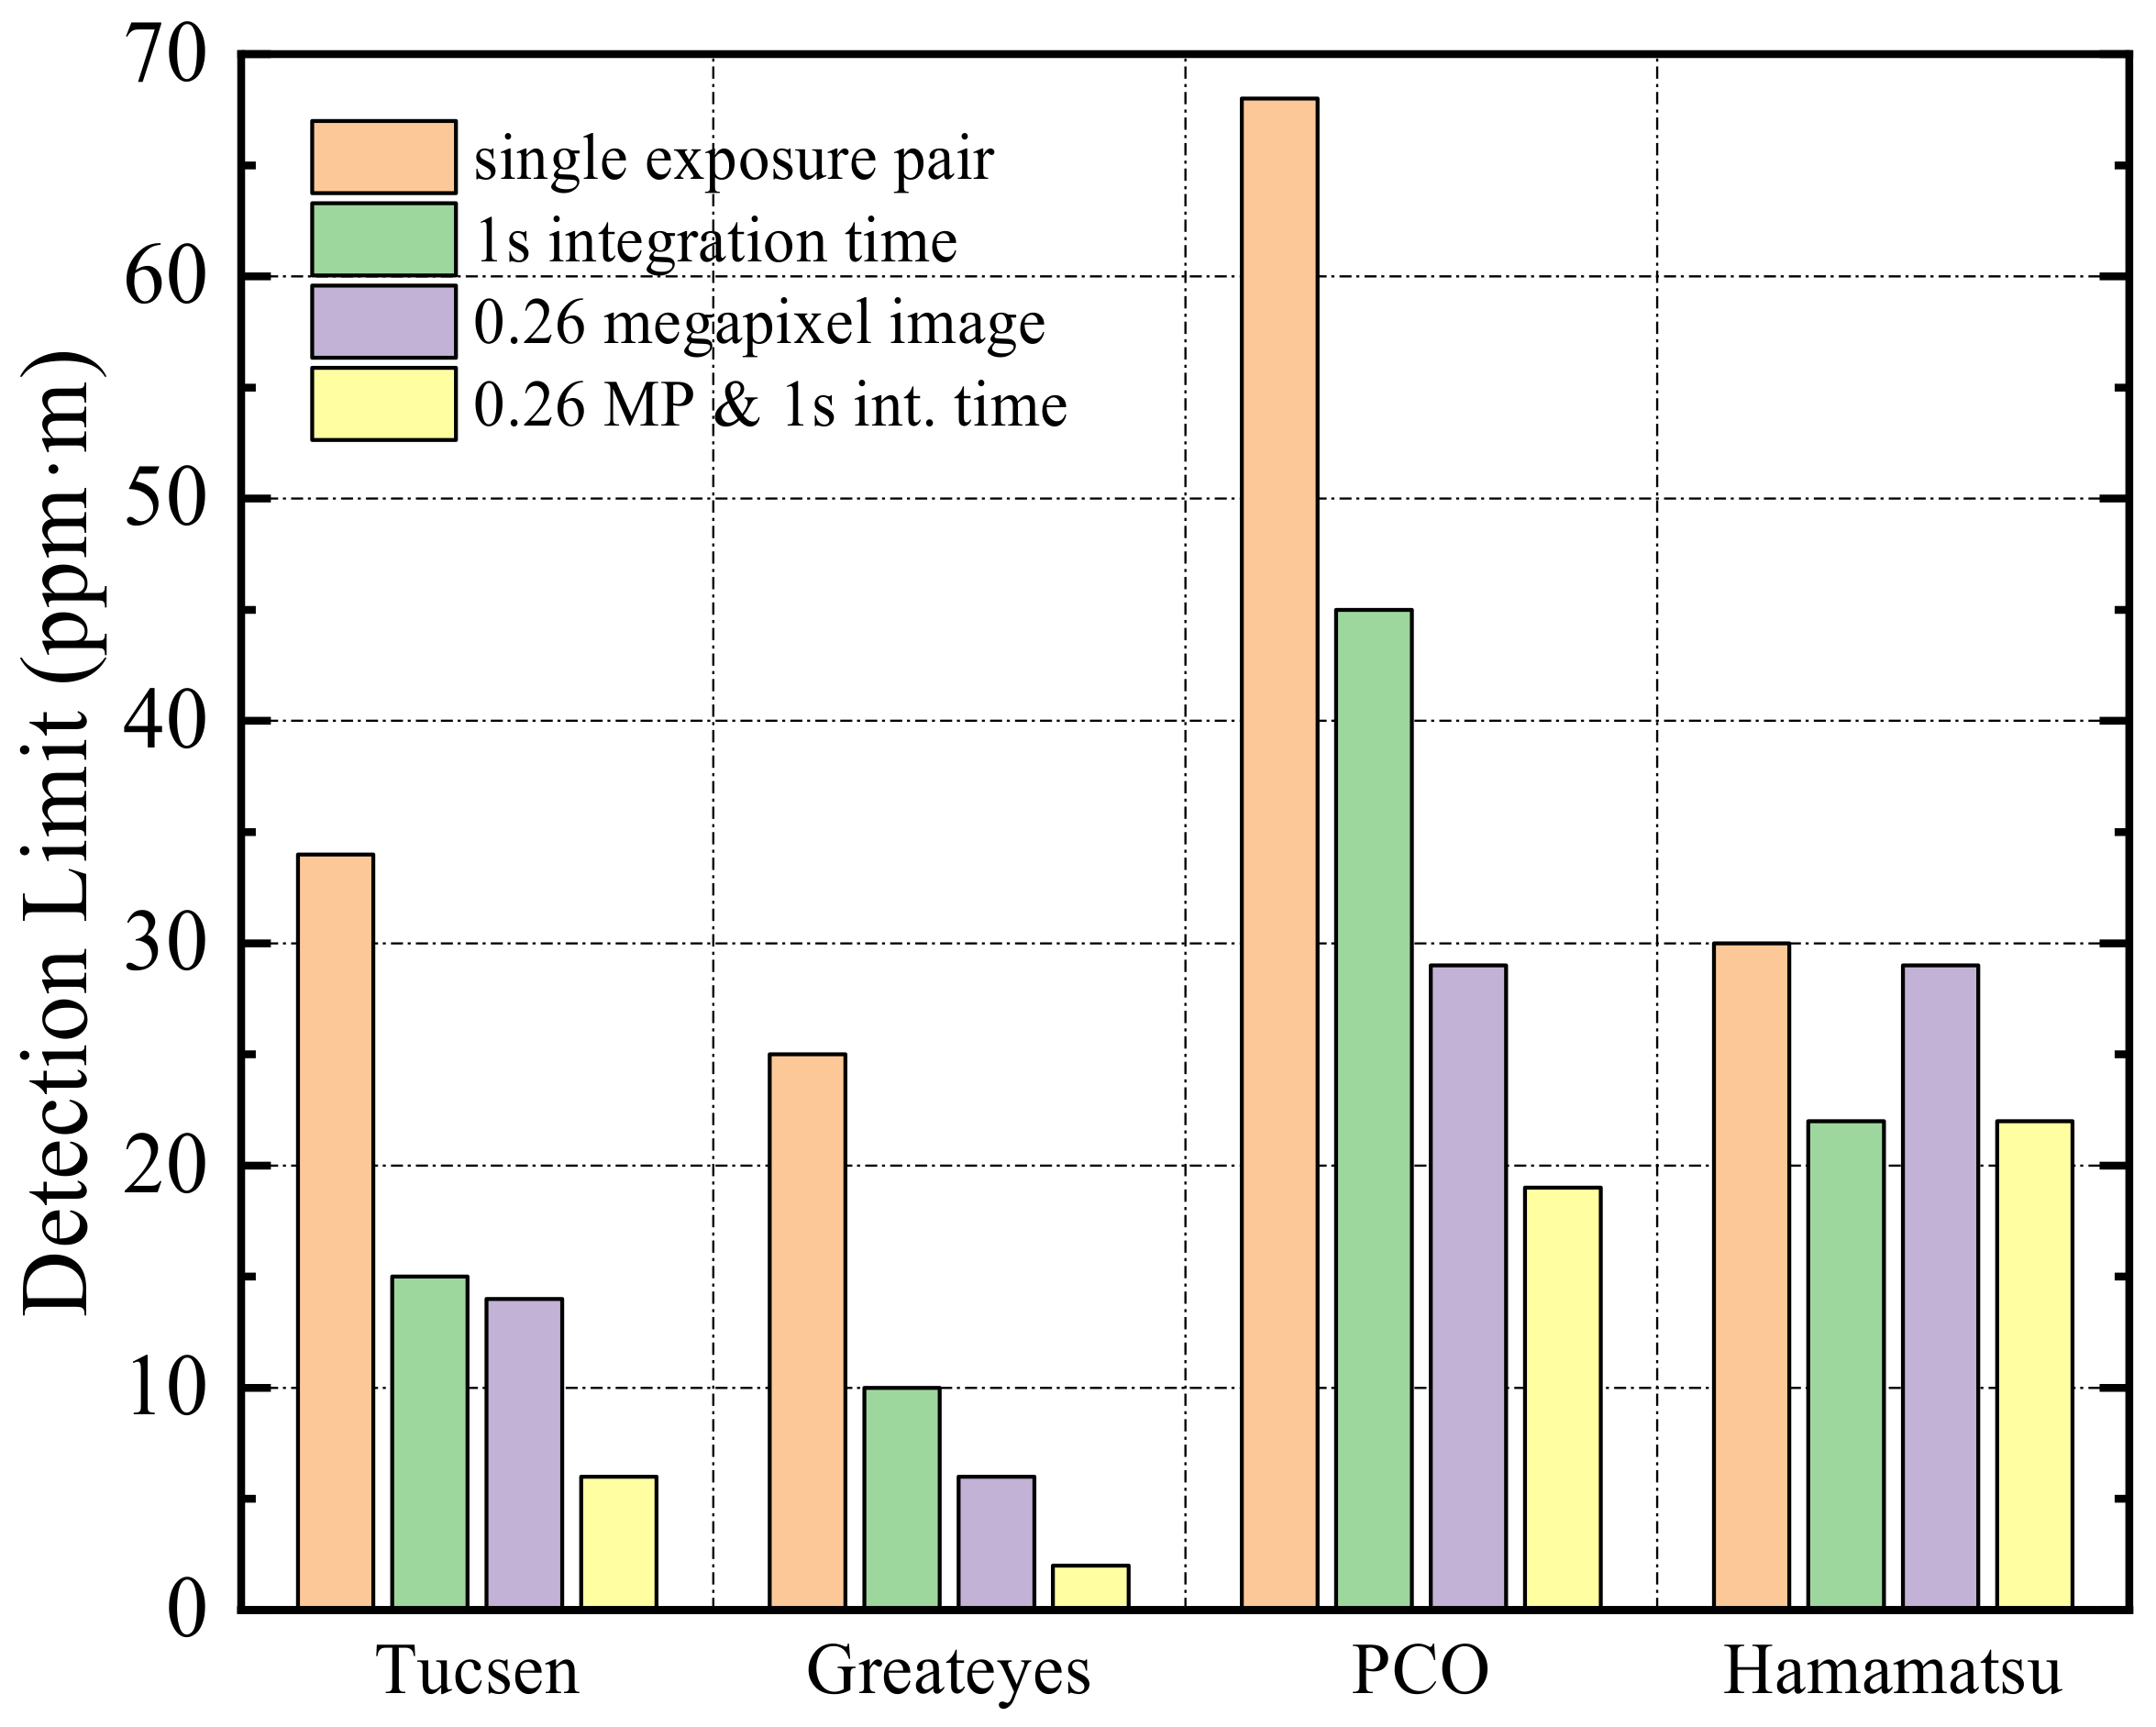
Figure 14 and
Figure 15 show the detection limits of the UV camera under two conditions: detection distance of 2 km, atmospheric visibility of 20 km, and detection distance of 5 km, atmospheric visibility of 50 km, respectively. Based on the intercomparison data, the performance of the four cameras decreased by about 70% compared with ideal conditions. As illustrated, the four cameras’ detection limits in the two conditions are relatively consistent, which indicates that detection distance and atmospheric visibility can accomplish exactly the opposite but roughly equal. The results of that experiment are consistent with the description in
Figure 6. Perhaps most exciting is that the simultaneous integration/smoothing of images can still maintain the instrument performance and improve the detection limit (see the fourth value of
Figure 14 and
Figure 15).
Comparing the detection limits calculated for four sensors under different monitoring conditions, we come to the following conclusions:
- (1)
Sensors with better resolution exhibit high sensitivity to incident light. There are more electrons in the pixel area, which can produce stronger signals. In addition, the sensitivity per pixel of the sensor grows with the increasing pixel size and takes less time to reach the full-well capacity. By increasing the pixel size accordingly, all instruments were able to take less time to reach the full-well capacity;
- (2)
The increase in pixels and sensor area essentially improves the quality of each image. With a certain sensor size, increasing the pixels means reducing the image element size. Therefore, increasing the camera resolution without magnifying the sensor size will only worsen the image quality. Camera systems with large sensor areas usually have higher SNR and benefit most in post-image smoothing operations. The process and cost of processing larger-sized sensors are difficult to balance, which is an insurmountable contradiction at present;
- (3)
The light dilution effect is also one of the main factors affecting detection accuracy. Without effective correction, the final retrieved SO2 concentration will seriously deviate from the true value, which certainly reduces the credibility of UV cameras applied to low-concentration pollution source monitoring;
- (4)
The detection distance and atmospheric visibility have opposite but roughly equal effects on the detection limit. Thus, the camera detection range will be seriously reduced at a lower visibility;
- (5)
Simultaneous application of co-adding/smoothing to the image maintains instrument performance and improves detection limits.
The International Maritime Organization promulgated and implemented the International Convention for the Prevention of Pollution from Ships (MARPOL), in which it is required that the sulfur content of global marine fuels should contain no more than 0.5% m/m by 2020 [
10]. The experiment showed that the combustion of marine fuel with 0.05% m/m sulfur content produces about 50 SO
2 [
29]. By using the co-adding/smoothing method, the four camera systems can meet the actual engineering requirements in suitable weather conditions even if the detection distance is increased to 5 km. Clearly, Tucsen and Greateyes will achieve better detection results, but Greateyes uses the EM-CCD chip, which is at a huge disadvantage in terms of lowering manufacturing costs. Considering both performance and cost factors, Tucsen is obviously more cost-effective.
7. Conclusions
The measurement accuracy and detection limit of the SO2 UV camera under the influence of light dilution are analyzed in this paper. It was proved that the measurement accuracy and detection sensitivity of the camera are affected by many factors. In addition to hardware parameters such as the CCD quantum efficiency and dark noise, the camera lens’ aperture and transmittance, the filter bandwidth, and central wavelength, it can also be affected by weather conditions, detection distance, and detection target characteristics.
This paper first introduced the working principle of the SO2 UV camera and the spectral characteristics of the solar radiation scattered in the atmosphere, based on which, the optimal match between the filter center wavelength and bandwidth theoretically is theoretically obtained by studying the influence of filter center wavelength and the transmission bandwidth on camera sensitivity. The analysis shows that the optimal camera sensitivity and detection accuracy will be obtained with the center wavelength of 309 nm and the transmission bandwidth of 10 nm.
On the basis of the optimal matching relationship between the center wavelength of the filter and the transmission bandwidth, the effect of light dilution on the measurement accuracy and detection sensitivity of the SO2 UV camera is emphatically studied, including weather conditions, detection distance, and the aerosol content in the plume. The theoretical analysis results show that a low atmospheric visibility and a long detection distance cause the sensitivity of the camera to deviate from the Beer–Lambert approximation and further reduce the measurement accuracy and the detection limit. As the monitoring distance increases, the obtrusive light scattered by atmospheric molecules and aerosol particles in the path increases the uncertainty of the measurement results. Thus, the detection limit of the instrument worsens with the increasing distance at the same atmospheric visibility. Moreover, the aerosol content inside the plume also affects the detection limit of the SO2 UV camera system. The amount of change in signal intensity due to SO2 gas absorption decreases with the increasing aerosol optical depth, which eventually leads to the poor detection limit of the system.
To verify the scientific nature and accuracy of the proposed theory, the SO2 emission concentration of the ship at Shanghai port was measured to calibrate the detection limit of the instrument. By analyzing the images of exhaust SO2 concentration at approximately 200 m and 3.5 km from the ship, the noise level resolutions of the SO2 concentration image are 15 ppm·m and 25 ppm·m at two different distances, which are consistent with our theoretical calculations.
The sensitivity of the camera to SO2 is also proven to be strongly influenced by CCD performances. Cameras with a high resolution, high quantum efficiency, large pixel, and low noise levels can achieve good detection limits under poor monitoring conditions, which shows better anti-interference ability. Errors caused by light dilution can be fatal for monitoring sources with low SO2 concentrations. Fortunately, effective image processing (e.g., co-adding/smoothing) can improve detection limits to meet the actual engineering requirements, and CCD with high full-well capacity and large spatial resolution receives the most benefits from this operation.
After many years of development, the SO2 UV camera technology has been well-developed not only in software and hardware but also in detection performance. The application fields are gradually expanding from volcanic plume monitoring to industrial chimneys and ship exhausts remote sensing with low SO2 concentrations. The radiation transfer model in this paper solves the light dilution effect on the detection limit of the SO2 UV camera. The SO2 UV camera is expected to have great application in low concentration pollution sources under complex conditions.
Author Contributions
Conceptualization, K.W. and W.H.; methodology, W.H., K.W. and F.L.; software, K.W., J.G. and J.L.; investigation, Z.Z. and J.L.; visualization, K.W. and Z.Z.; writing—original draft preparation, K.W. and W.H.; writing—review and editing, F.L., Z.Z. and W.H.; supervision, F.L. and X.H.; funding acquisition, K.W., W.H. and F.L. All authors have read and agreed to the published version of the manuscript.
Funding
This research was funded by the National Natural Science Foundation of China, grant numbers 41975039 and 61705253. This study was also supported by the Natural Science Foundation of Shandong Province and the Youth Innovation Technology Project of Higher School in Shandong Province, grant numbers ZR2021QD088 and 2021KJ008.
Data Availability Statement
Not applicable.
Acknowledgments
Dingyi Wang of the Department of Physics at the University of New Brunswick is acknowledged for his suggestion and encouragement.
Conflicts of Interest
The authors declare no conflict of interest.
References
- Wang, J.; Chen, W.; Wang, P.; Zhang, Z.; Wan, F.; Zhou, F.; Song, R.; Wang, Y.; Gao, S. Fiber-enhanced Raman spectroscopy for highly sensitive H2 and SO2 sensing with a hollow-core anti-resonant fiber. Opt. Express 2021, 29, 32296. [Google Scholar] [CrossRef] [PubMed]
- Mori, T.; Burton, M. The SO2 camera: A simple, fast and cheap method for ground-based imaging of SO2 in volcanic plumes. Geophys. Res. Lett. 2006, 33, L17315. [Google Scholar] [CrossRef]
- Bluth, G.; Shannon, J.; Watson, I.; Prata, F.; Realmuto, V. Development of an ultra-violet digital camera for volcanic SO2 imaging. J. Volcanol. Geotherm. Res. 2007, 161, 47–56. [Google Scholar] [CrossRef]
- Nadeau, P.A.; Palma, J.L.; Waite, G.P. Linking volcanic tremor, degassing, and eruption dynamics via SO2 imaging. Geophys. Res. Lett. 2011, 38, L01304. [Google Scholar] [CrossRef]
- Pering, T.D.; Liu, E.J.; Wood, K.; Wilkes, T.C.; Aiuppa, A.; Tamburello, G.; Bitetto, M.; Richardson, T.; McGonigle, A.J.S. Combined ground and aerial measurements resolve vent-specific gas fluxes from a multi-vent volcano. Nat. Commun. 2020, 11, 3039. [Google Scholar] [CrossRef]
- Pering, T.D.; McGonigle, A.J.S.; James, M.R.; Tamburello, G.; Aiuppa, A.; Donne, D.D.; Ripepe, M. Conduit dynamics and post explosion degassing on Stromboli: A combined UV camera and numerical modeling treatment. Geophys. Res. Lett. 2016, 43, 5009–5016. [Google Scholar] [CrossRef]
- D’Aleo, R.; Bitetto, M.; Donne, D.D.; Tamburello, G.; Battaglia, A.; Coltelli, M.; Patanè, D.; Prestifilippo, M.; Sciotto, M.; Aiuppa, A. Spatially resolved SO2 flux emissions from Mt Etna. Geophys. Res. Lett. 2016, 43, 7511–7519. [Google Scholar] [CrossRef]
- Osorio, M.; Casaballe, N.; Belsterli, G.; Barreto, M.; Gómez, á.; Ferrari, J.A.; Frins, E. Plume Segmentation from UV Camera Images for SO2 Emission Rate Quantification on Cloud Days. Remote Sens. 2017, 9, 517. [Google Scholar] [CrossRef]
- Dinger, A.S.; Stebel, K.; Cassiani, M.; Ardeshiri, H.; Bernardo, C.; Kylling, A.; Park, S.-Y.; Pisso, I.; Schmidbauer, N.; Wasseng, J.; et al. Observation of turbulent dispersion of artificially released SO2 puffs with UV cameras. Atmos. Meas. Tech. 2018, 11, 6169–6188. [Google Scholar] [CrossRef]
- Cao, K.; Zhang, Z.; Li, Y.; Zheng, W.; Xie, M. Ship fuel sulfur content prediction based on convolutional neural network and ultraviolet camera images. Environ. Pollut. 2021, 273, 116501. [Google Scholar] [CrossRef]
- Liu, P.; Zhang, T.; Sun, X.; Fan, G.; Xiang, Y.; Fu, Y.; Dong, Y. Compact and movable ozone differential absorption lidar system based on an all-solid-state, tuning-free laser source. Opt. Express 2020, 28, 13786–13800. [Google Scholar] [CrossRef]
- Wiacek, A.; Li, L.; Tobin, K.; Mitchell, M. Characterization of trace gas emissions at an intermediate port. Atmos. Meas. Tech. 2018, 18, 13787–13812. [Google Scholar] [CrossRef]
- Ilanko, T.; Pering, T.D.; Wilkes, T.C.; Choquehuayta, F.E.A.; Kern, C.; Moreno, A.D.; De Angelis, S.; Layana, S.; Rojas, F.; Aguilera, F.; et al. Degassing at Sabancaya volcano measured by UV cameras and the NOVAC network. Volcanica 2019, 2, 239–252. [Google Scholar] [CrossRef]
- Kern, C.; Lübcke, P.; Bobrowski, N.; Campion, R.; Mori, T.; Smekens, J.-F.; Stebel, K.; Tamburello, G.; Burton, M.; Platt, U.; et al. Intercomparison of SO 2 camera systems for imaging volcanic gas plumes. J. Volcanol. Geotherm. Res. 2015, 300, 22–36. [Google Scholar] [CrossRef]
- Dalton, M.P.; Watson, I.M.; Nadeau, P.A.; Werner, C.; Morrow, W.; Shannon, J.M. Assessment of the UV camera sulfur dioxide retrieval for point source plumes. J. Volcanol. Geotherm. Res. 2009, 188, 358–366. [Google Scholar] [CrossRef]
- Schiavo, B.; Stremme, W.; Grutter, M.; Campion, R.; Guarin, C.A.; Rivera, C.; Inguaggiato, S. Characterization of a UV camera system for SO2 measurements from Popocatépetl Volcano. J. Volcanol. Geotherm. Res. 2018, 370, 82–94. [Google Scholar] [CrossRef]
- Kern, C.; Werner, C.; Elias, T.; Sutton, A.J.; Lübcke, P. Applying UV cameras for SO2 detection to distant or optically thick volcanic plumes. J. Volcanol. Geotherm. Res. 2013, 262, 80–89. [Google Scholar] [CrossRef]
- Campion, R.; Delgado-Granados, H.; Mori, T. Image-based correction of the light dilution effect for SO2 camera measurements. J. Volcanol. Geotherm. Res. 2015, 300, 48–57. [Google Scholar] [CrossRef]
- Varnam, M.; Burton, M.; Esse, B.; Salerno, G.; Kazahaya, R.; Ibarra, M. Two Independent Light Dilution Corrections for the SO2 Camera Retrieve Comparable Emission Rates at Masaya Volcano, Nicaragua. Remote Sens. 2021, 13, 935. [Google Scholar] [CrossRef]
- Prata, A.J. Measuring SO2 ship emissions with an ultraviolet imaging camera. Atmos. Meas. Tech. 2014, 7, 1213–1229. [Google Scholar] [CrossRef]
- Lübcke, P.; Bobrowski, N.; Illing, S.; Kern, C.; Nieves, J.M.A.; Vogel, L.; Zielcke, J.; Granados, H.D.; Platt, U. On the absolute calibration of SO2 cameras. Atmos. Meas. Tech. 2013, 6, 677–696. [Google Scholar] [CrossRef]
- Wu, K.; Xiong, Y.; Feng, Y.; Yu, Y.; Li, F. Development of a self-calibration method for real-time monitoring of SO2 ship emissions with UV cameras. Opt. Express 2021, 29, 1813–1823. [Google Scholar] [CrossRef] [PubMed]
- Xiong, Y.H.; Luo, Z.J.; Chen, Z.W.; Yu, G.B.; Duan, W.M.; Liu, L.M.; Li, F.Q.; Wu, K.J. Study on Ultraviolet Imaging Remote Sensing Monitoring Technology for SO2 Gas Emission. Spectrosc. Spect. Anal. 2020, 40, 1289–1296. [Google Scholar] [CrossRef]
- Kern, C.; Kick, F.; Lübcke, P.; Vogel, L.; Wöhrbach, M.; Platt, U. Theoretical description of functionality, applications, and limitations of SO2 cameras for the remote sensing of volcanic plumes. Atmos. Meas. Tech. 2010, 3, 733–749. [Google Scholar] [CrossRef]
- Kern, C.; Deutschmann, T.; Vogel, L.; Wöhrbach, M.; Wagner, T.; Platt, U. Radiative transfer corrections for accurate spectroscopic measurements of volcanic gas emissions. Bull. Volcanol. 2009, 72, 233–247. [Google Scholar] [CrossRef]
- Ilanko, T.; Pering, T.; Wilkes, T.; Woitischek, J.; D’Aleo, R.; Aiuppa, A.; McGonigle, A.; Edmonds, M.; Garaebiti, E. Ultraviolet Camera Measurements of Passive and Explosive (Strombolian) Sulphur Dioxide Emissions at Yasur Volcano, Vanuatu. Remote Sens. 2020, 12, 2703. [Google Scholar] [CrossRef]
- Mori, T.; Mori, T.; Kazahaya, K.; Ohwada, M.; Hirabayashi, J.; Yoshikawa, S. Effect of UV scattering on SO2 emission rate measurements. Geophys. Res. Lett. 2006, 33, L17315. [Google Scholar] [CrossRef]
- Wu, K.; Feng, Y.; Xiong, Y.; Duan, W.; Yu, G.; Li, F. Real-time continuous calibration method for an ultraviolet camera. Opt. Lett. 2020, 45, 6851–6854. [Google Scholar] [CrossRef]
- Zhang, Z.; Zheng, W.; Cao, K.; Li, Y.; Xie, M. Simulation Analysis on the Optimal Imaging Detection Wavelength of SO2 Concentration in Ship Exhaust. Atmosphere 2020, 11, 1119. [Google Scholar] [CrossRef]
Figure 1.
The absorption cross-sections of SO2 and solar scattering spectrum. As a reference, the transmittance curves of filters at the wavelengths of 310 nm and 330 nm are also shown.
Figure 1.
The absorption cross-sections of SO2 and solar scattering spectrum. As a reference, the transmittance curves of filters at the wavelengths of 310 nm and 330 nm are also shown.
Figure 2.
The transmittance curves of Filters A and B (solid lines) measured by the UV spectrometer, and the effective transmittance curves with non-vertical incidence correction (dotted lines).
Figure 2.
The transmittance curves of Filters A and B (solid lines) measured by the UV spectrometer, and the effective transmittance curves with non-vertical incidence correction (dotted lines).
Figure 3.
The influence of filter center wavelength and bandwidth on the relative SNR of the camera. Different colors represent different filter bandwidths.
Figure 3.
The influence of filter center wavelength and bandwidth on the relative SNR of the camera. Different colors represent different filter bandwidths.
Figure 4.
The optimal matching between the central wavelength and bandwidth of the filter.
Figure 4.
The optimal matching between the central wavelength and bandwidth of the filter.
Figure 5.
Dependence of the detection limit of the camera system on the filter central wavelength and bandwidth. The improper central wavelength and narrow transmittance window can significantly reduce the detection limit of the camera. By calculation, the optimum detection limit of the camera is obtained when the central wavelength of the signal channel filter (Filter A) is 309 nm with FWHM of 10 nm.
Figure 6.
The simulated detection limit of SO2 cameras at different monitoring distances and atmospheric visibilities.
Figure 6.
The simulated detection limit of SO2 cameras at different monitoring distances and atmospheric visibilities.
Figure 7.
The detection limit of the SO2 camera varying with aerosol optical depth.
Figure 7.
The detection limit of the SO2 camera varying with aerosol optical depth.
Figure 8.
SO2 concentration of the ship exhaust at 200 m retrieved by the UV camera. A row of pixels passing through the center of the plume is selected to calculate the detection limit of the camera (white line) and also marks the FOV of DOAS.
Figure 8.
SO2 concentration of the ship exhaust at 200 m retrieved by the UV camera. A row of pixels passing through the center of the plume is selected to calculate the detection limit of the camera (white line) and also marks the FOV of DOAS.
Figure 9.
The SO
2 concentration found along the white line in
Figure 8. Detection limit of the camera system at 200 m is about 15 ppm·m.
Figure 9.
The SO
2 concentration found along the white line in
Figure 8. Detection limit of the camera system at 200 m is about 15 ppm·m.
Figure 10.
SO
2 image of ship exhaust obtained with a distance of about 3.5 km. The selection principle of row pixels passing through the plume center and FOV of DOAS are consistent with those in
Figure 8.
Figure 10.
SO
2 image of ship exhaust obtained with a distance of about 3.5 km. The selection principle of row pixels passing through the plume center and FOV of DOAS are consistent with those in
Figure 8.
Figure 11.
The SO
2 concentration found along the white line in
Figure 10. Detection limit of the camera system at 3.5 km is about 25 ppm·m.
Figure 11.
The SO
2 concentration found along the white line in
Figure 10. Detection limit of the camera system at 3.5 km is about 25 ppm·m.
Figure 12.
The detection limits of different camera systems under ideal conditions (Distance = 0 km). The first bar is the detection limit of a single exposure. The second and third bars represent the detection limit for a total integration time of 1 s and 0.26-megapixel image (512 × 512 pixels), respectively. The final bar is the detection limit of the 0.26-megapixel image after 1 s integration.
Figure 13.
Detection limits of different camera systems with a detection distance of 2 km and atmospheric visibility of 50 km.
Figure 13.
Detection limits of different camera systems with a detection distance of 2 km and atmospheric visibility of 50 km.
Figure 14.
Detection limits of different camera systems with a detection distance of 2 km and atmospheric visibility of 20 km.
Figure 14.
Detection limits of different camera systems with a detection distance of 2 km and atmospheric visibility of 20 km.
Figure 15.
Detection limits of different camera systems with a detection distance of 5 km and atmospheric visibility of 50 km.
Figure 15.
Detection limits of different camera systems with a detection distance of 5 km and atmospheric visibility of 50 km.
Table 1.
Camera properties used in the instrument intercomparison experiment.
Table 1.
Camera properties used in the instrument intercomparison experiment.
| Camera System Identifier | Tucsen | Greateyes | PCO | Hamamatsu |
|---|
Sensor technology
Camera model
Pixels [PH × PV]
Sensor size DH × DV [μm]
Quantum efficiency at 310 nm
Read noise
Dark noise
Saturation signal | CMOS
Dhyana 400BSI V2
1200 × 1200
11 × 11
~35%
1.6 e− | EM-CCD
ELSE 2048 BI UV3
2048 × 2048
13.5 × 13.5
~55%
3.8 e− | CCD
PCO. ultraviolet
1392 × 1040
4.65 × 4.65
~25%
2 e− | CCD
ImagEMX2-1k
512 × 512
16 × 16
~10%
8 e− |
| 0.55 e− | 0.01 e− | 1 e− | 0.0005 e− |
| 80,000 e− | 150,000 e− | 24,000 e− | 140,000 e− |
| Disclaimer/Publisher’s Note: The statements, opinions and data contained in all publications are solely those of the individual author(s) and contributor(s) and not of MDPI and/or the editor(s). MDPI and/or the editor(s) disclaim responsibility for any injury to people or property resulting from any ideas, methods, instructions or products referred to in the content. |
© 2023 by the authors. Licensee MDPI, Basel, Switzerland. This article is an open access article distributed under the terms and conditions of the Creative Commons Attribution (CC BY) license (https://creativecommons.org/licenses/by/4.0/).
