1. Introduction
Research on the stability of lava tunnels is relatively scarce compared with studies focused on karst cavities [
1,
2]. Lava tunnels can be several meters wide and usually run for long distances below the surface [
3]. Generally, the caves we see are those that are stable or that present very isolated problems, in good-quality rock masses. Caves developed on poor quality terrain tend to evolve and collapse [
4]. Most of the caves are in equilibrium, in an apparently elastic state, despite the previous fall of large blocks bounded by discontinuities [
5].
There are numerous lava tunnels in the Galápagos Islands. Charles Darwin was one of the first to record them in 1845 [
6]. These natural tunnels are formed when an upper layer of flowing lava cools and forms a crust while the molten lava below the surface continues flowing. As the flow decreases the lava will empty creating lava tunnels [
7]. Since they are generally located at shallow depths, skylights are commonly found, which are points in the lava tunnels that have not been able to close completely [
8]. In some cases, these tunnels are located very close to urban areas.
The study area corresponds to El Mirador de los Túneles, located in the south of the island of Santa Cruz.. The Mirador sector has a long history of geotechnical problems. For example, recent cave roof collapses have been reported during construction works [
9]. In addition, it is blocked by backfill 90 m into the tunnel. This lava tunnel has been chosen for several reasons: it has a very common and therefore representative typology; it is easy to access for data collection and it poses risks for roads and houses.
This research aims to characterize the interior of this volcanic cave geomechanically, considering the current conditions inside the tunnel. This work required (i) the evaluation of the rock mass quality by combining empirical methodologies based on geomechanical classifications; (ii) numerical modelling of the tunnel geomechanical behavior; and (iii) the application of the SfM (Structure from Motion) digital photogrammetry technique to define the geometry. One of the contributions of this study is the presentation of results using Virtual Reality, so that the analyses can be collated by researchers who cannot access the study area. Furthermore, these virtual tours, with different degrees of immersion, can be used by local authorities for dissemination projects [
10].
In addition, this work focuses on improving the data on cave geomechanics in the Galápagos Islands, considering that only a few publications have addressed this topic [
4,
11,
12]. Principally, the ultimate objective of the research is to validate in a particular case a simple methodology to geomechanically characterize caves through field data and effective but simple analysis.
2. Materials and Methods
2.1. Location
El Mirador de los Túneles is located 1.4 km northwest of the Puerto Ayora town in Santa Cruz Island, Galápagos (
Figure 1a) at 85 m above sea level. Its average height is 5.9 m, its width is 5.5 and the average cross-section is 27 m
2 [
10]. The tunnel reaches an estimated length of 850 m and it is located NW direction from the main urban area of Puerto Ayora (
Figure 1b).
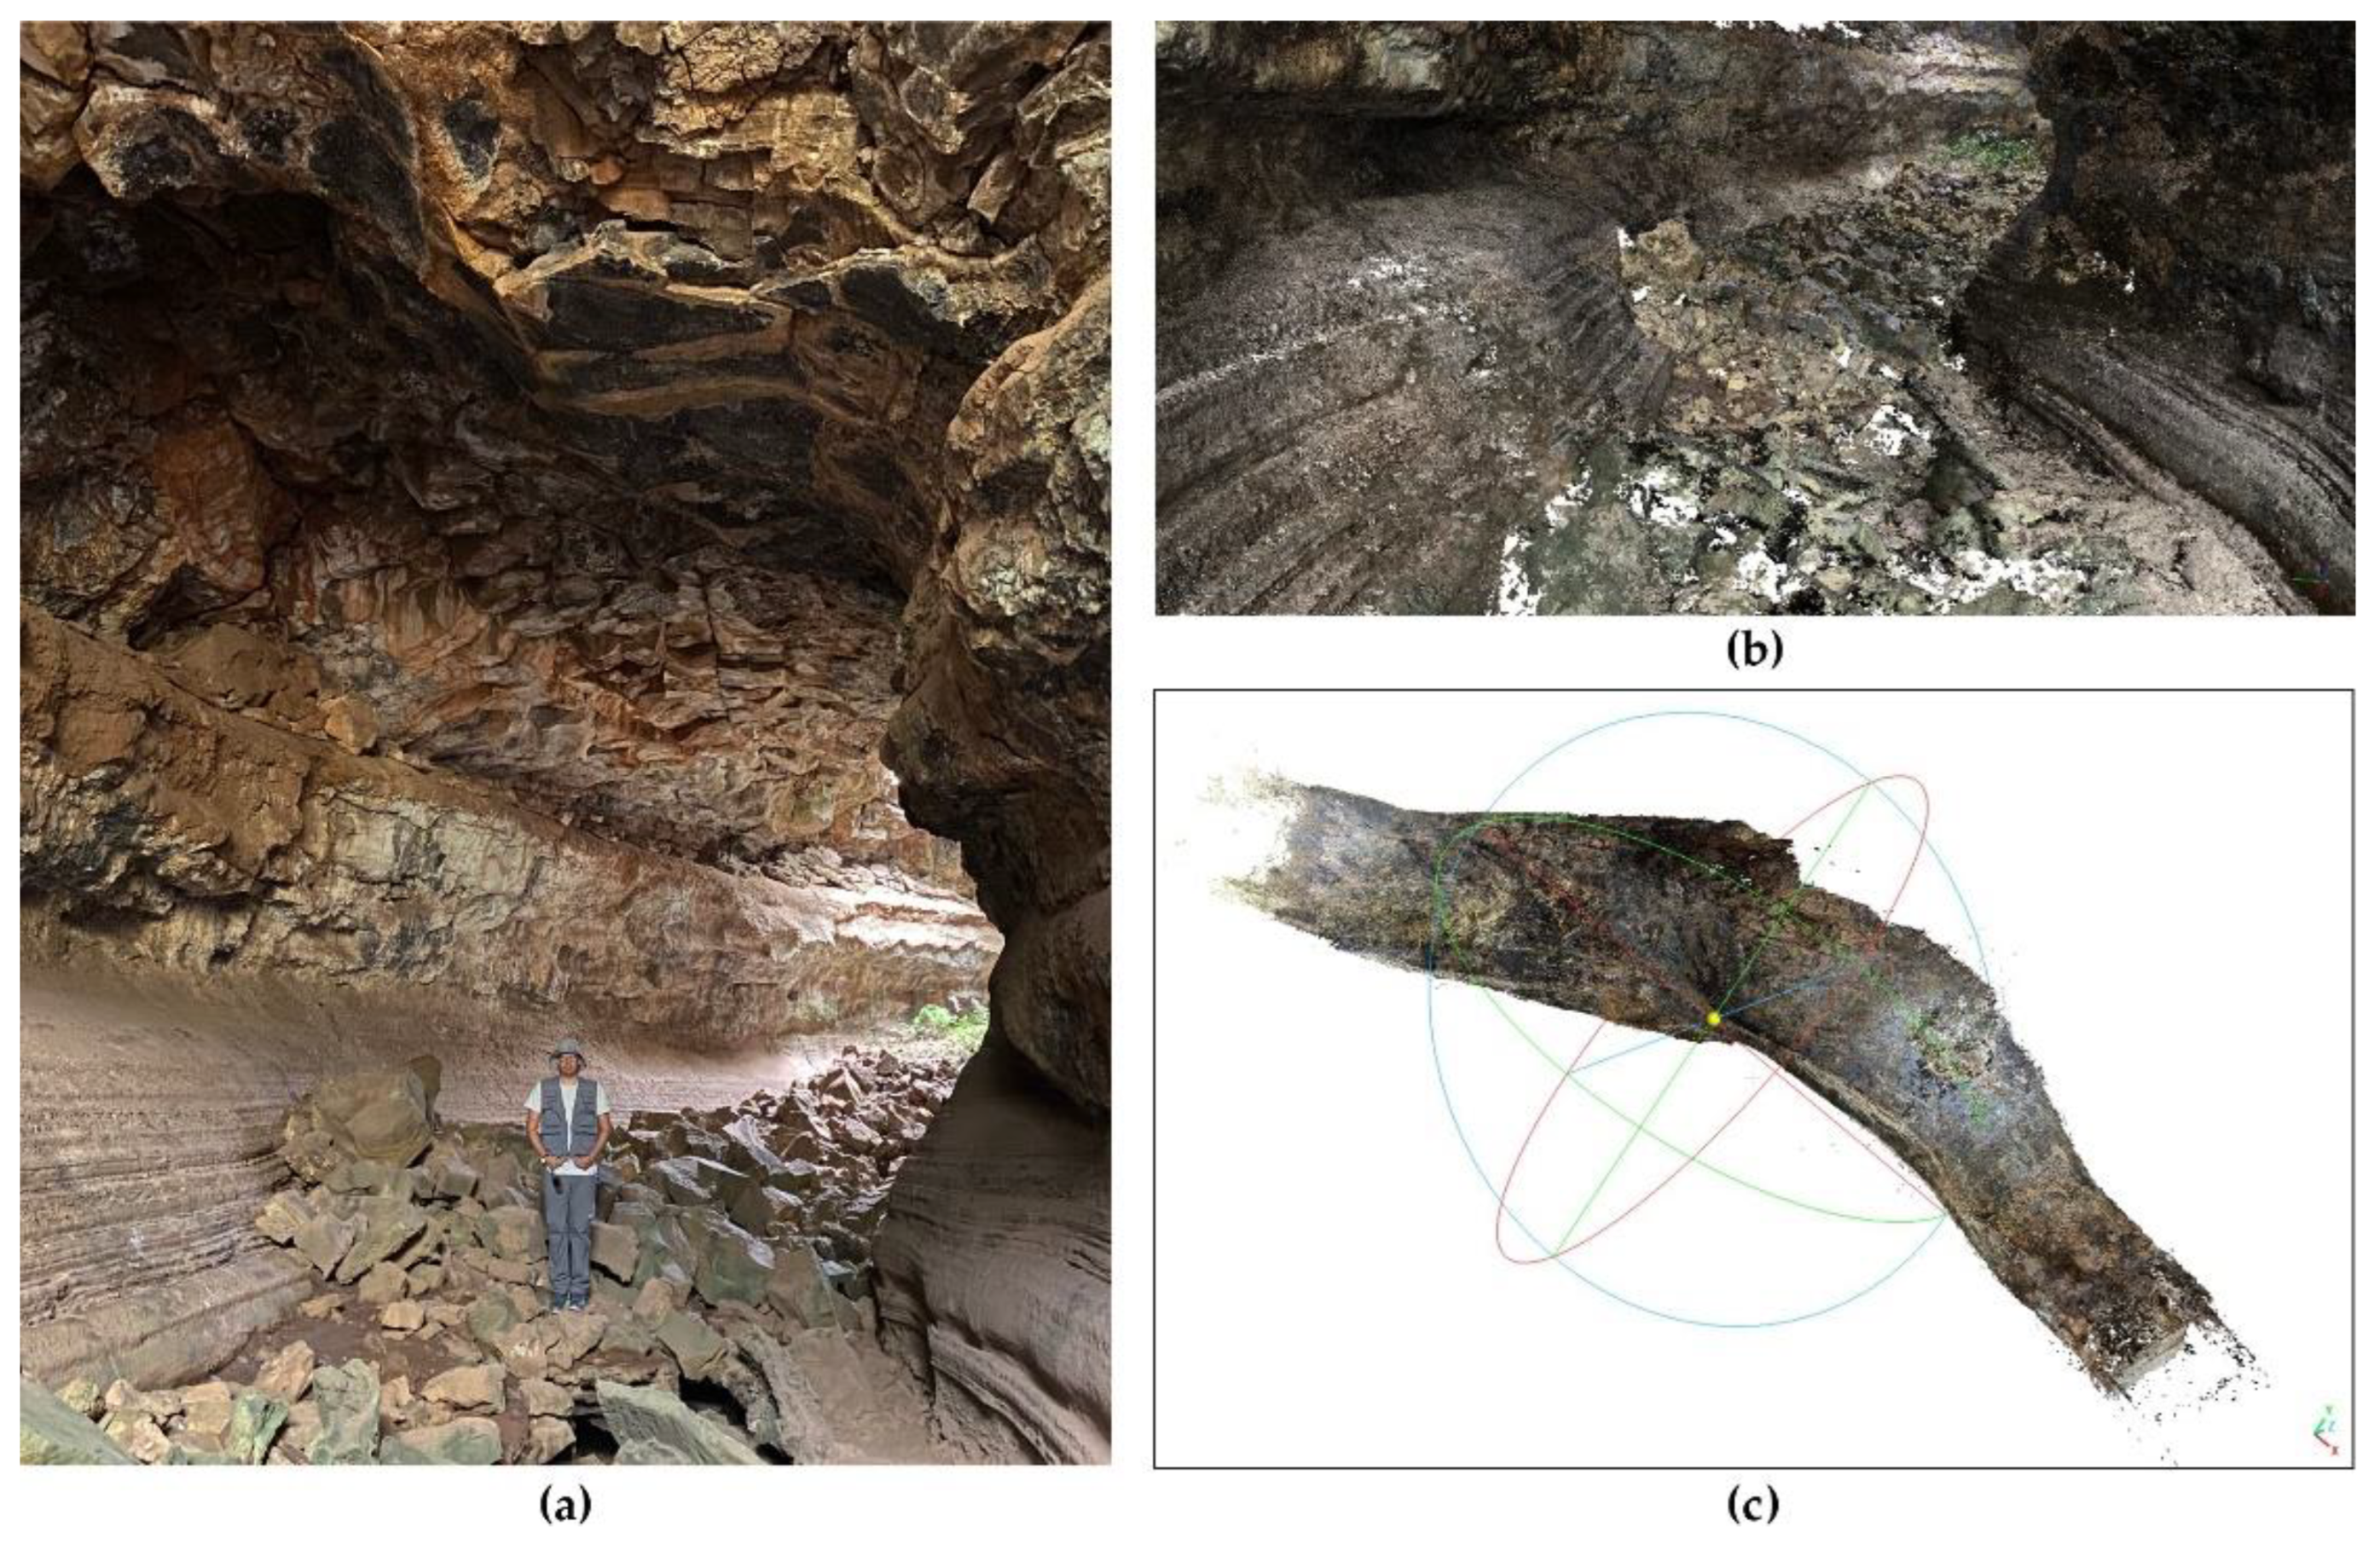
El Mirador de los Túneles has two main sections. The first section, near the main road is open to the public (
Figure 1c), and the second is located below the urban area which is not easily visited. The tourist section has a cross-section in the shape of a peanut. Striations on the walls (
Figure 1d) represent variations in flow and periods of flow stability. At mid-height there is the beginning of a roof formations, which becomes more marked in a SW direction. The lava tube has an opening in the roof that is called the skylight (
Figure 1e). From a geotechnical point of view, it is important to distinguish the skylights from the sinkholes. Skylights are voids naturally formed because the lava did not reach that part, are mostly stable and remain opened since the formation of the cave, whereas sinkholes are small to big collapses of roofs and are an indication that the cave reached the maximum stable span. Currently, only a section of the tunnel below the urban area can be visited since it is hazardous to enter.
2.2. Geological Context
The Galápagos archipelago is the product of hotspot activity ~1000 km west of South America and 100 km south of the Galápagos Spreading Centre (GSC), an oceanic ridge separating the Cocos and Nazca plates. [
13]. The Galápagos hotspot represents a magma supply process that has existed for more than 90 million years, while the lithospheric plate has moved thousands of kilometers in the same time interval, carrying away the volcanoes generated by the hotspot [
14,
15]. Among the islands of the Galápagos archipelago, San Cristobal is the oldest island at 2.35 million years and Fernandina is the youngest island at ~0.5 million years [
16,
17].
The Santa Cruz lavas can be divided into the Platforms series, which are intercalated with marine sediments, and the Shield series, which are basaltic lava flows [
18]. The lavas of the Platform series are the oldest with an age of 1.3 to 1.1 million years, while the youngest are represented by the Shield series ranging from 0.03 ± 0.025 million years to 0.024 ± 0.011 million years [
16].
Santa Cruz is an island with a maximum height of 950 m above sea level consisting of an elliptical shield volcano. Monogenetic volcanic cones are aligned along the E-W series of normal faults, as well as sinkholes larger than 100 m in diameter [
19].
Large pahoehoe and aa-type lava flows characterize the southern sector of the island. The presence of one type or the other is strictly related to the variations in slope and viscosity of the magma at the site [
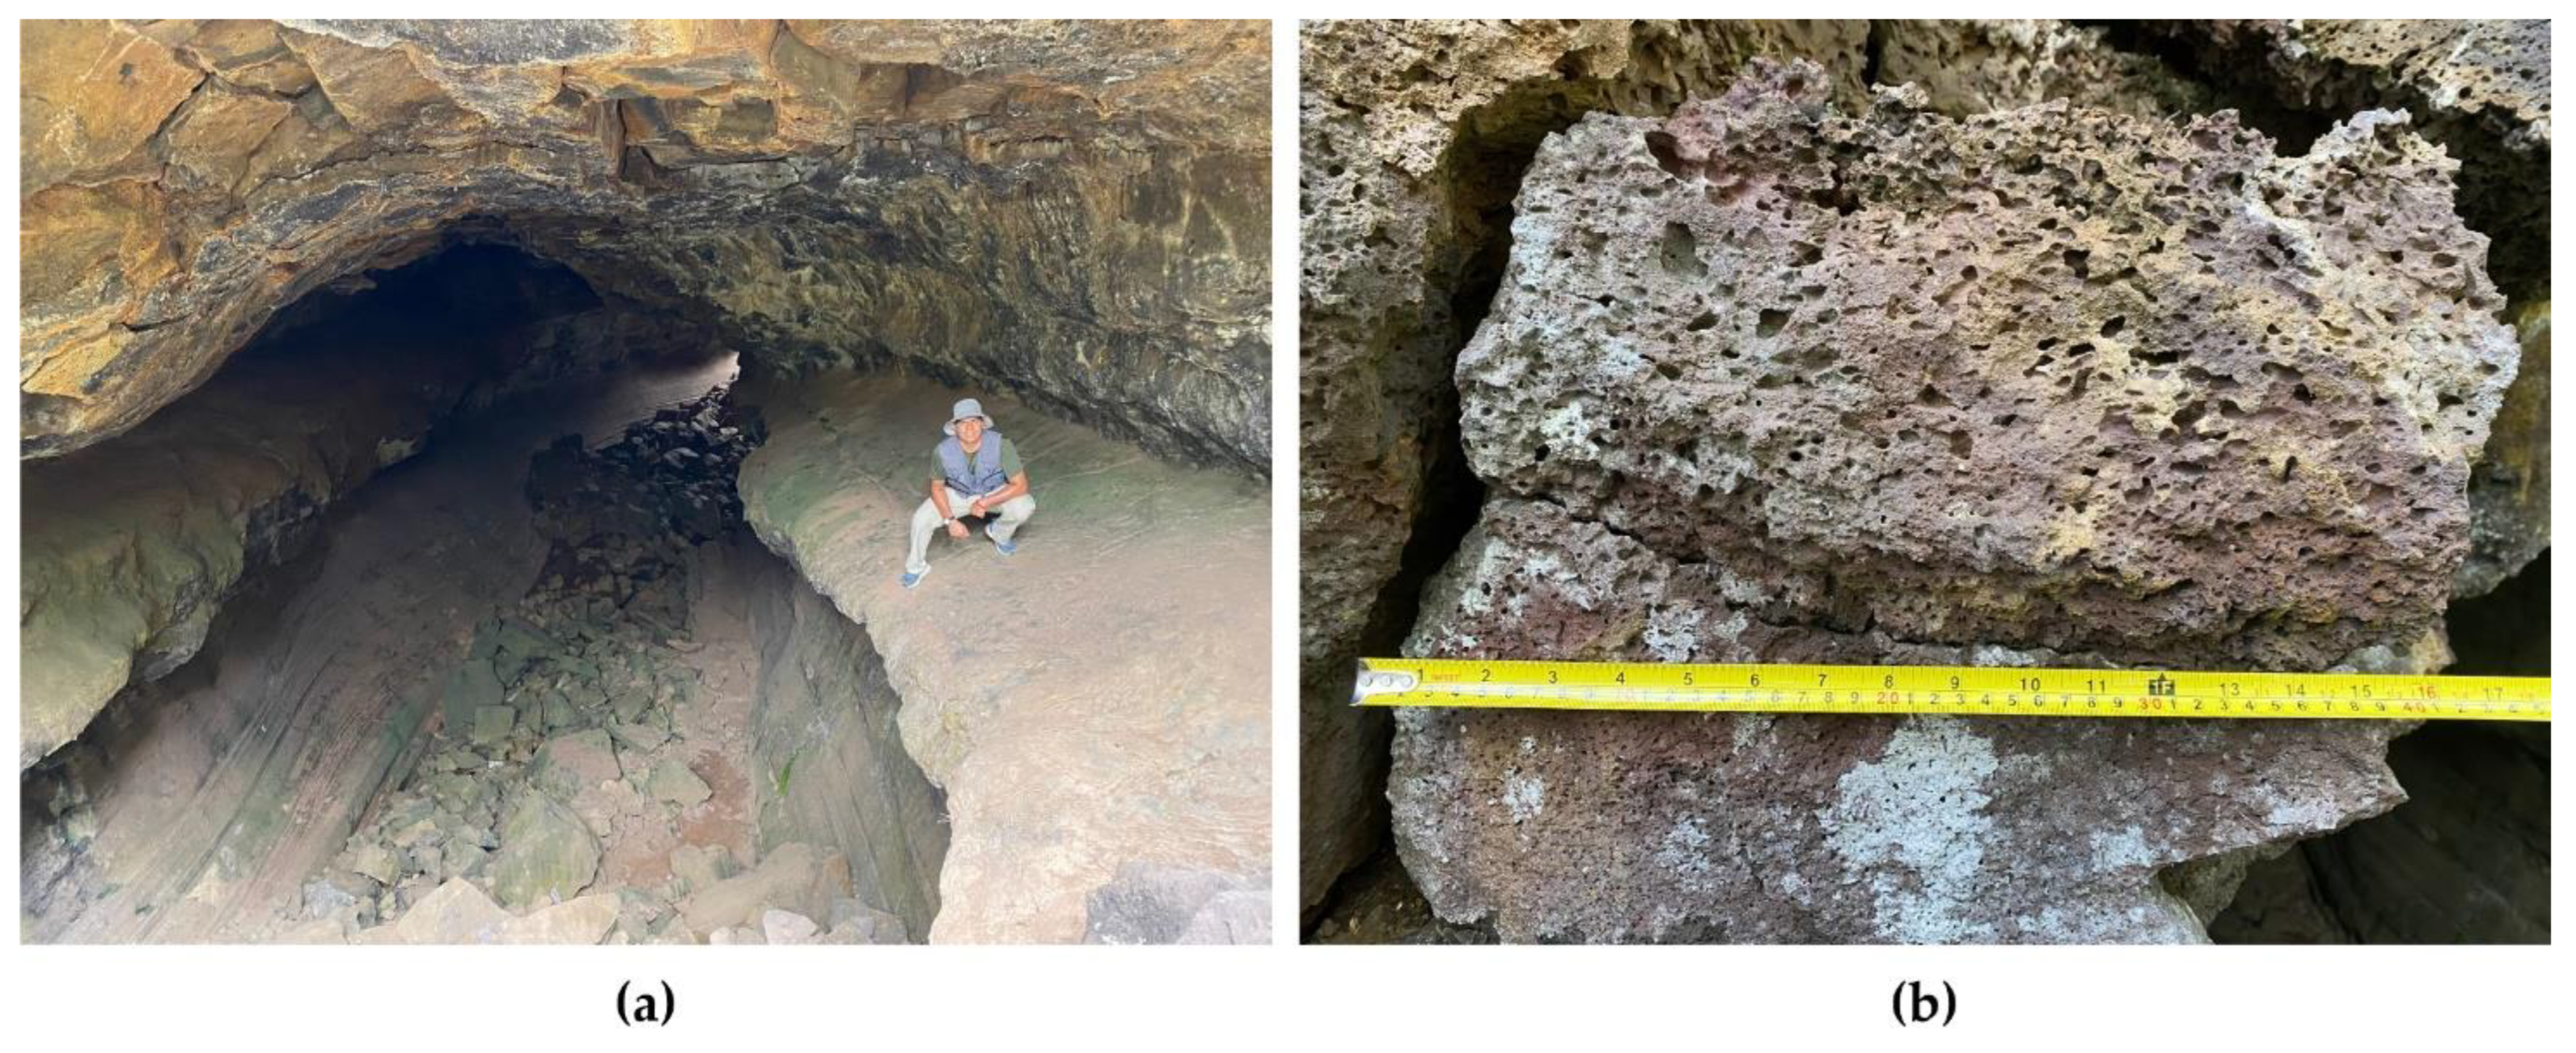
20]. The pahoehoe flows are defined by their high fluidity and by their smooth and folded “rope-like” surface, which allows to understand the main directions of flow movement. On the other hand, the “aa” type flows are characterized by highly irregular surfaces and highly vesicular rock fragments. Both types of lava flows can generate structures within them, known in the literature as lava tunnels (
Figure 2a) or tumuli (circular or elongated sinusoidal in shape, with a height of about one meter) [
21].
The lavas from the volcanic cave are basaltic in composition, characterized by high vesicularity (±40%) with isolated averaging 2–3 mm in size and sub-rounded in shape. (
Figure 2b). The samples are aphyric in texture with a low percentage of crystallinity (2–3%). The matrix appears locally weathered by palagonization processes presumably due to contact with water [
22].
2.3. Geomechanical Characterization
2.3.1. Rock Mass Classification
Geomechanical classifications and empirical analysis have been used to assess rock mass stability. This form of analysis has been effectively applied to tunnel design since the 1970s. Geomechanical classifications consist of giving ratings to several key parameters and obtaining an index (numerical value) representing the quality of a rock mass. They can be very useful engineering tools, not only because they provide a starting point for tunnel support design, but also because they force users to examine rock mass properties in a very systematic way [
23]. It is important to understand the limitations of the geomechanical classification schemes [
24] and that their use does not (and cannot) replace some of the more elaborate design procedures [
23].
Empirical stability analysis methods are closely linked to these geomechanical classifications of rock masses: they are based on the back-analysis of numerous case studies in which the stability of a span has been analyzed using one or more of the classifications [
11]. Its usefulness lies in the ease of its application and the good results achieved in many cases [
25].
This research applied the Q Index [
26] and Rock Mass Rating (RMR) [
27], the most widely used geomechanical classifications. In addition, the study was complemented with the recently developed Cave Geomechanical Index (CGI) [
28], which allows comparison and validation of the rock quality results.
The CGI was inspired by Bieniawski’s geomechanical classification methodology [
27] with the sum of weighted variables according to range of analysis and whose result indicates the geomechanical quality of the evaluated material. The CGI model has been implemented in iron caves near mining areas that must have their physical integrity preserved according to Brazilian legislation [
28]. The CGI formula is shown in the following equation:
where:
α RMR = Assigned value to the rock mass classification
β HR = Assigned value to the hydraulic radius
γ CS = Assigned value to the roof shape
δ CT = Assigned value to the roof thickness
After the weights of the four system variables have been defined, the corresponding scores are summed. The CGI value ranges from 0 to 100, which is higher than the lower value of the susceptibility to structural instability.
Table 1 shows the five CGI classes and their respective levels of susceptibility to structural instability of the spans. Colors inserted in the chart are used later; they indicate five categories, where red being the worst quality of rock and cave and blue the best
2.3.2. Geomechanical Stations
For this study, we opted for an methodology of analysis based geomechanical stations to determine various geomechanical parameters in situ, which helped us estimate the RMR, Q Index, GSI and other rock mass, matrix and joints parameters.
Geomechanical stations facilitate the geotechnical assessment of a cave when we have access to the interior. In many cases, it is unfeasible or inadvisable to carry out soundings and laboratory tests, both of which are destructive [
29]. The number of stations and their location depend on favorable ground conditions (existing outcrops and accessibility) and representativeness [
30]. At each station, data were taken that allowed us to adequately characterize the rock mass, especially the discontinuities and their geomechanical parameters.
2.3.3. Numerical Analysis
By means of numerical stress-strain analysis, we can determine overloaded zones and ground motions.
Numerical models are computer programs that can simulate stress and strength in the rock mass and excavations such as tunnels, mines and caves. The geomechanical behavior of a rock mass can be modelled when subjected to certain predefined initial in-situ stresses [
31].
In this study, the stresses were determined and the effects of alterations on the active pressure inside the cavern were evaluated using Examine 2D software considering a single material. Examine 2D is a boundary element software developed for two-dimensional elastic stress analysis of underground excavations [
32]. These boundary element models have certain limitations in cases of smaller thicknesses and application of loads.
In the numerical analysis of the cave, the most unfavorable sections were chosen and assigned rock mass strength values based on the Hoek-Brown criterion for basaltic materials (
Table 2). This criterion combines both laboratory tests and field observations. Rocdata software from Rocscience was used to calculate the parameters. In the present study, three joint sets were identified, in which case the rock mass can be analyzed using the Hoek and Brown criteria with caution. The parameter used for the basalt were those obtained from the field geomechanical stations.
2.3.4. Photogrammetry
The remote sensing techniques are helping in many fields of geotechnics and geology [
33]. The photogrammetry is a technique by which volumetric information describing sur-face structures can be obtained by exploiting parallax, that is to say, the difference in the apparent position of an object, due the varying perspective provided by overlapping images captured from different viewpoints [
34]. The approach is best suited for images with a high degree of overlap that capture the full three-dimensional structure of the scene as seen from a wide range of viewpoints [
34], of positions or, as the name suggests, images derived from a moving sensor [
35].
Compared to other traditional short-range photogrammetry methods, the Structure from Motion (SfM) technique has many advantages, such as high efficiency, flexible workflows and no need for expert supervision [
36]. In addition, the SfM technique allows obtaining a set of XYZ coordinates, or 3D point cloud, of the rock mass. Such geometrical and optical information can be used to extract parameters characterizing the rock massif or detect changes remotely [
37]. Therefore, problems of inaccessibility and bias in collecting large amounts of data are eliminated, resulting in more representative and accurate results [
38].
For the generation of the 3D model of the lava tunnel interior, a total of 2079 photographs were taken from different angles and points using an iPhone 13 (
Figure 3a). To orient and scale the 3D point cloud, obtained by SfM, it is necessary to have the precise coordinates of some control points, at least three, on the ground surface of the mapped area [
39]. With the help of Agisoft Metashape software [
40] the 3D point cloud was obtained (
Figure 3b). All point cloud files were exported to “xyz” format for processing using CloudCompare (
Figure 3c) [
41]. Finally, the different parameters collected from the geomechanical stations were compared with the data that could be obtained from the model to check their accuracy.
Some specific output formats, such as OBJ files, were generated to elaborate a Virtual Reality tour. The 3D objects (cave spans) were uploaded to Sketchfab, a free-access repository.
3. Results
3.1. Cave Geometry by Photogrammetry
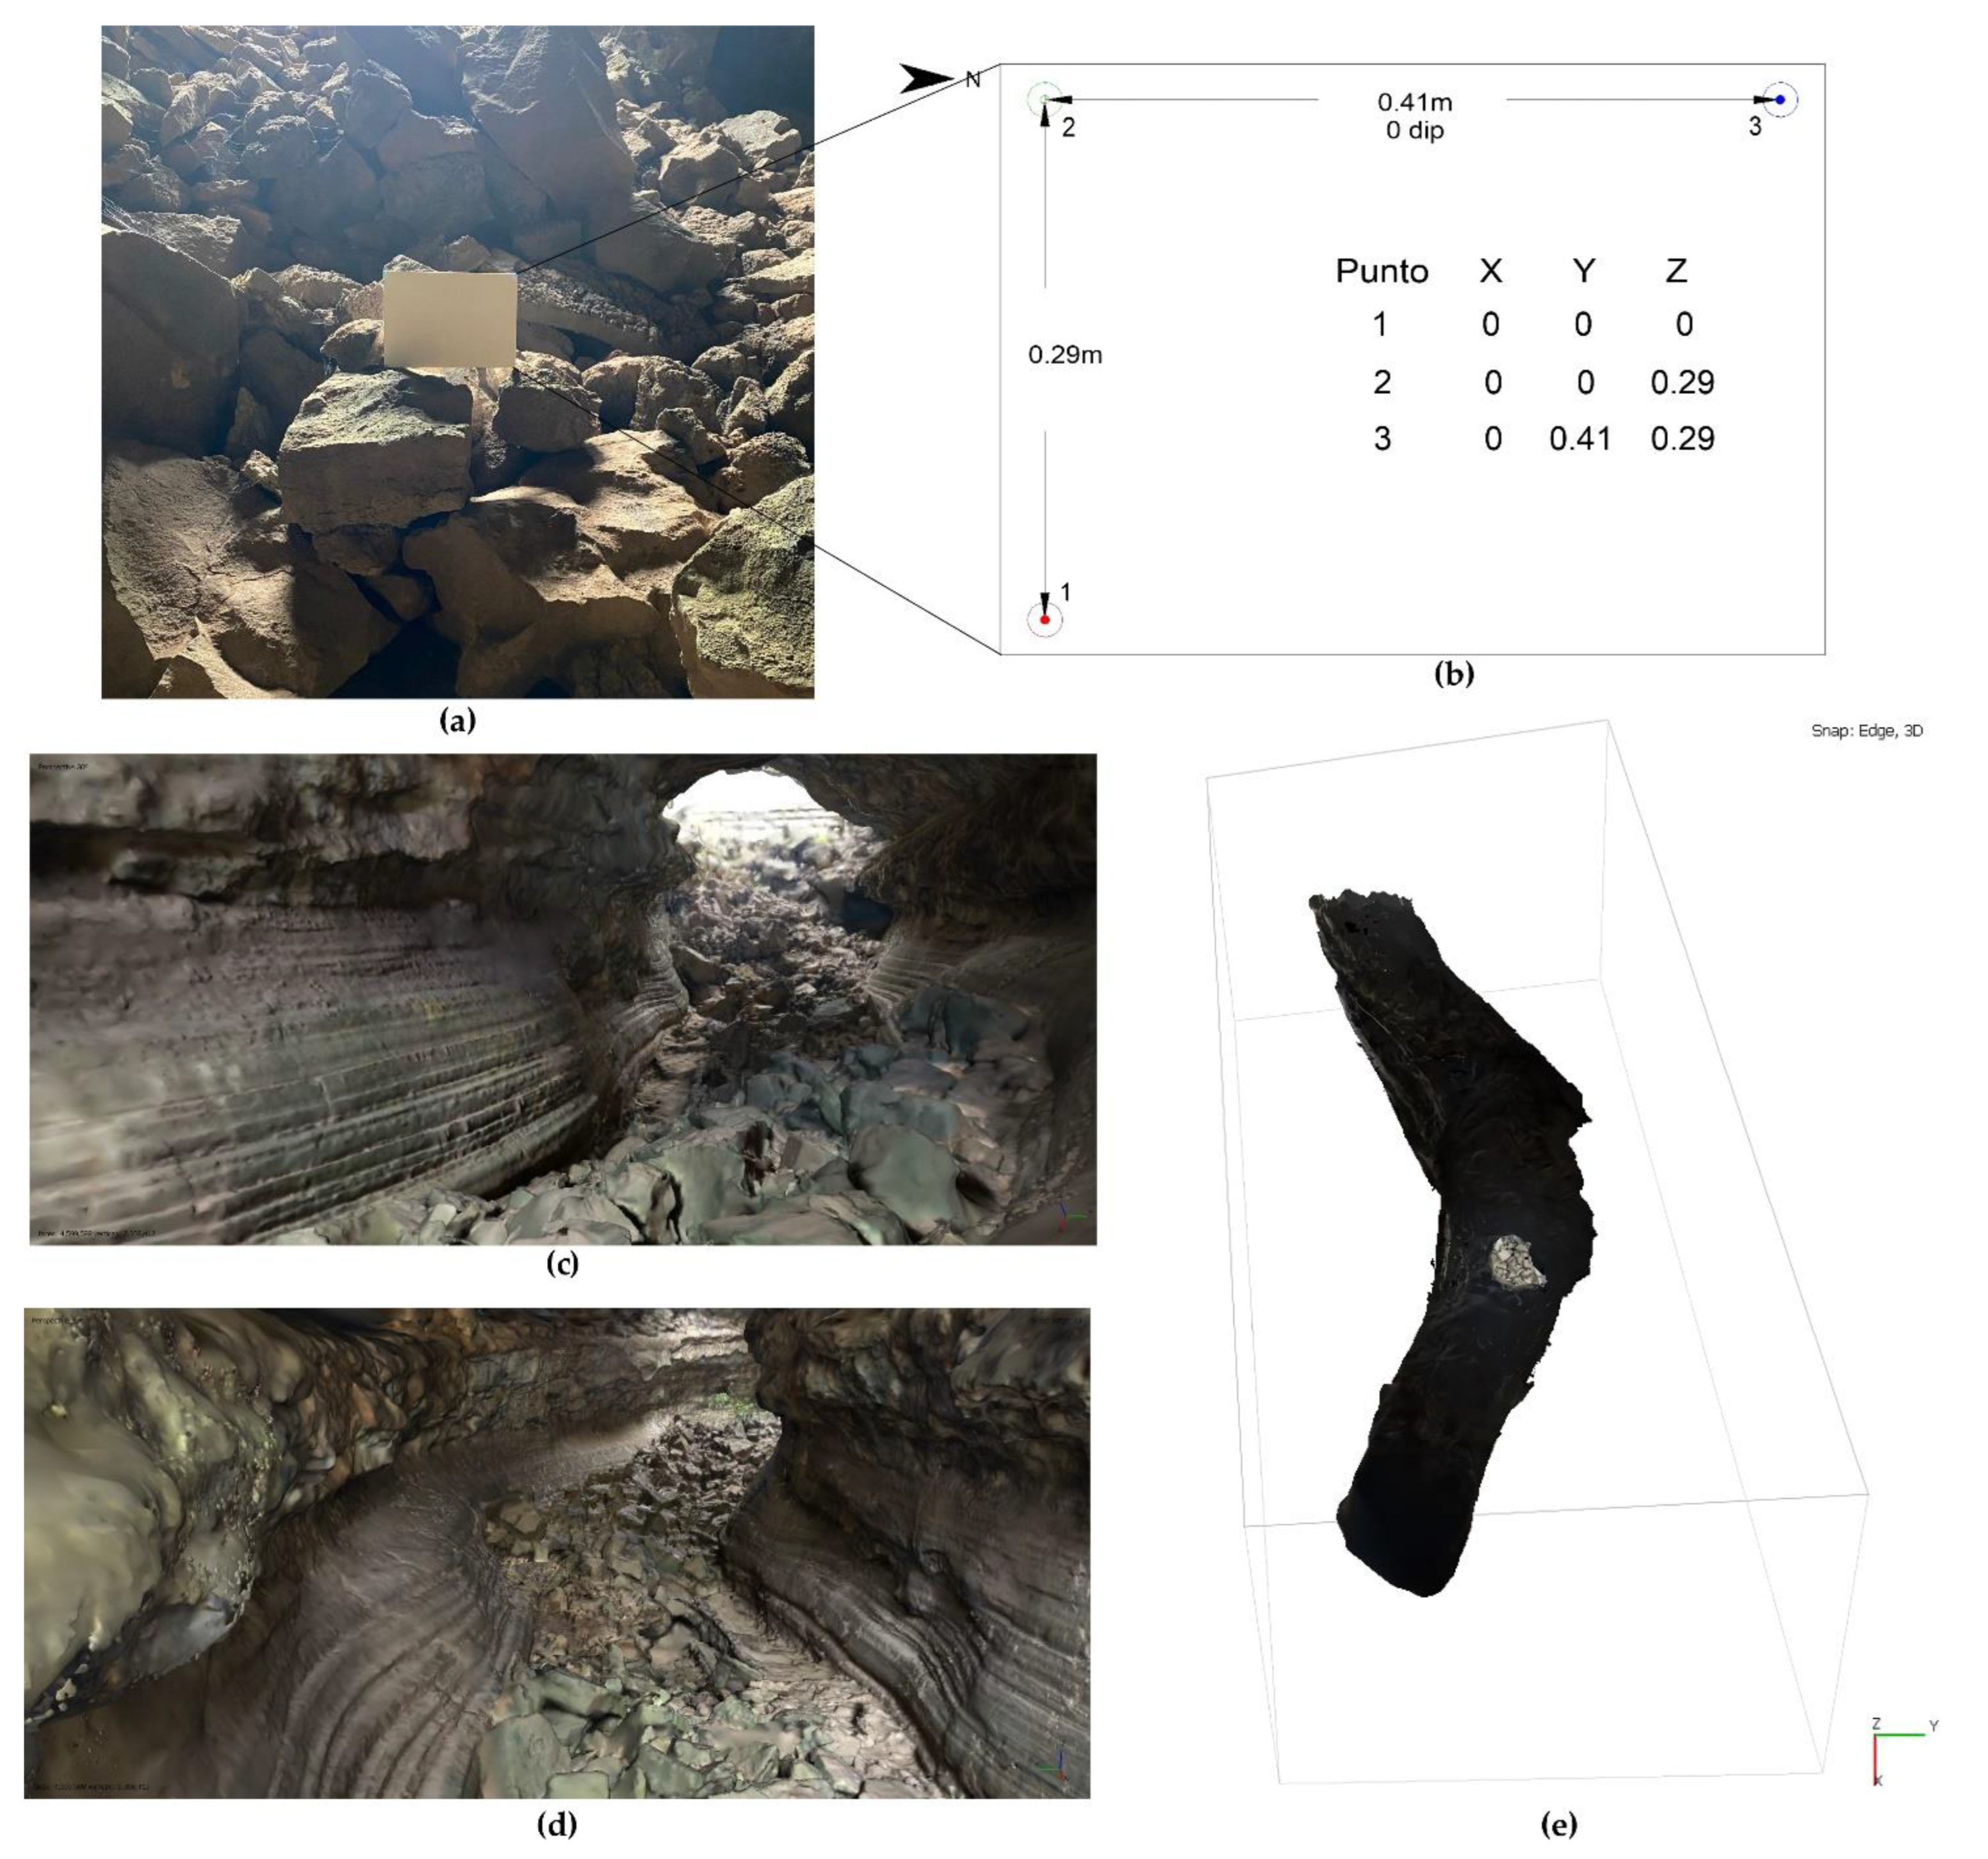
Initially, the ideal place for the point control placement was established (
Figure 4a), a board was designed where three marks were placed for the orientation and scaling of the model. This way, by measuring the distances between points, the relative coordinates could be calculated with point “1” being the starting point (0,0,0) (
Figure 4b). The three-dimensional reconstruction (
Figure 4c–e) of the lava tunnel was made from a set of photographs captured from the different geomechanical stations of the project. A geomechanical station is an environment of about 5 meters where rock resistance measurements, fracture orientation, etc., are carried out. In this environment, it is used to make a set of photographs that are superimposed to create the photogrammetry model.
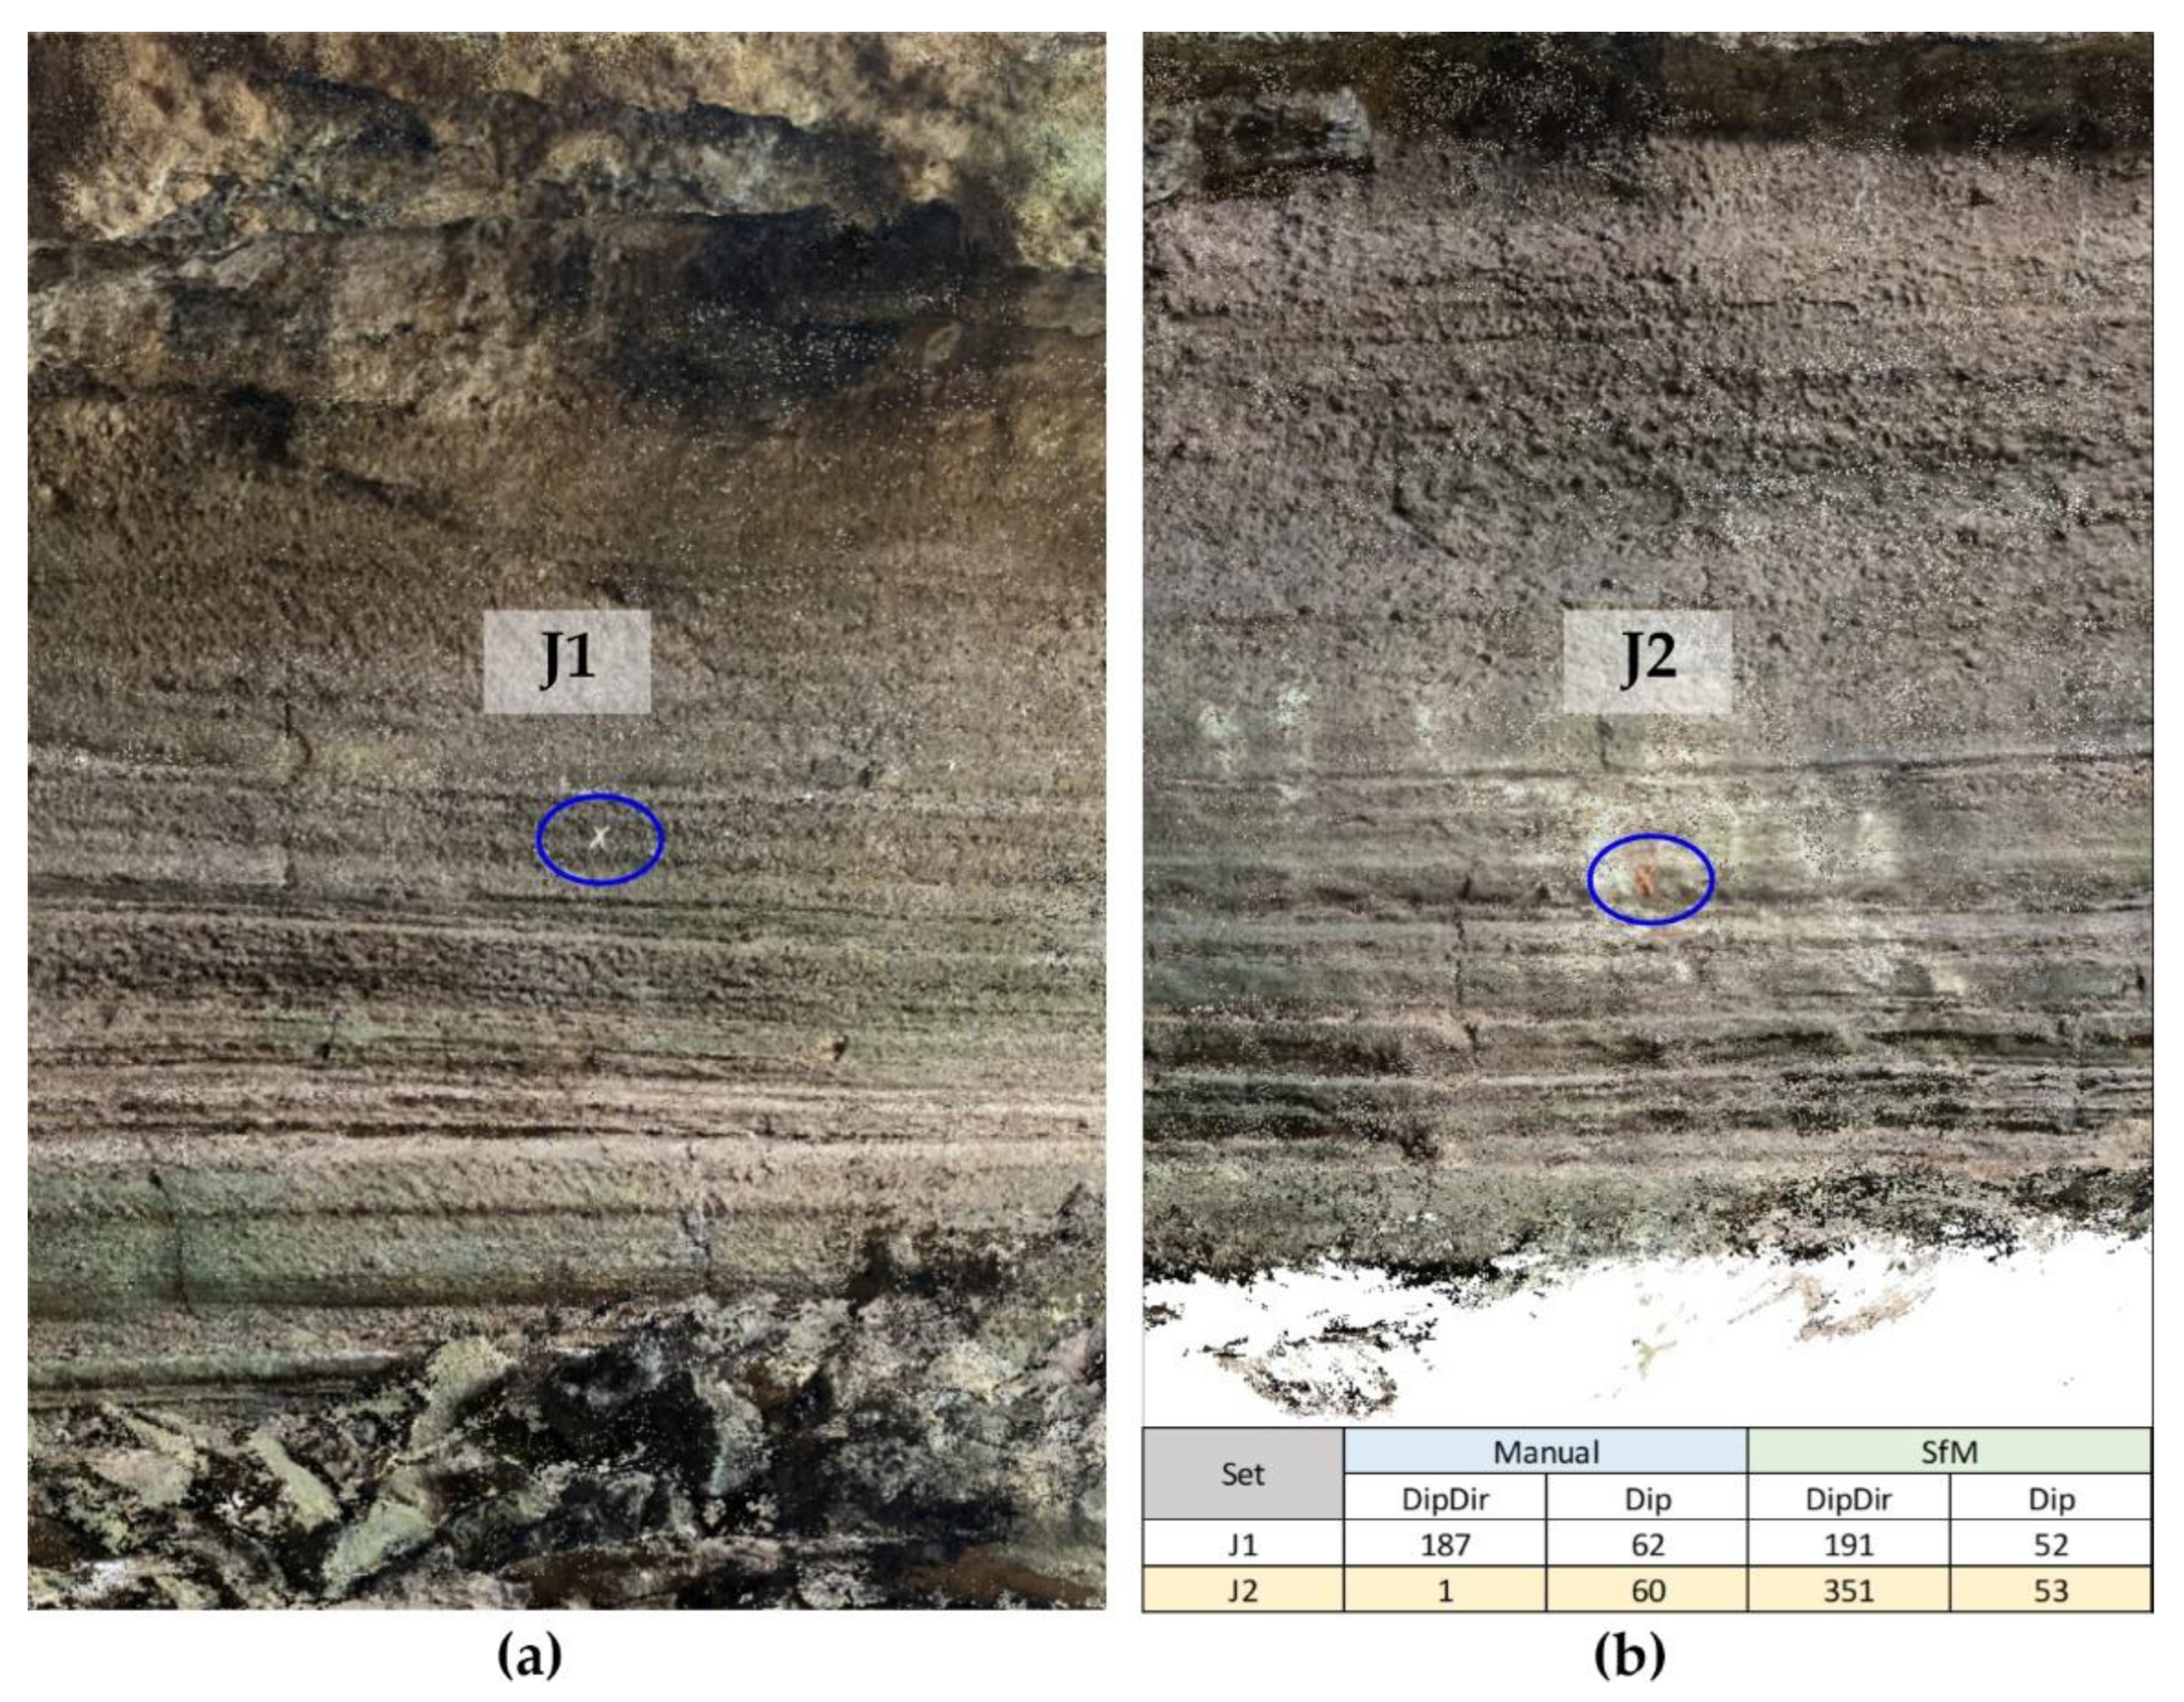
Finally, two control planes were fixed inside the tunnel marked with different colored plasticine to check the correct orientation of the discontinuities, and to determine the difference between the field survey and the SfM technique (
Figure 5a). There is a difference in values between 6° and 10° that can be managed and validate the work (
Figure 5b).
Additionally, there was no major problem with measuring the dimensions of the discontinuities because the model was accurately scaled.
Figure 5b shows two joint sets. In reality, three joint sets have been detected: one longitudinal and two transversal to the section, which give rise to parallelepiped blocks; however, one of the joints is practically invisible inside and can only be clearly seen at the entrance to the caves and on the fallen blocks. In fact, the coefficient Jn = 9 in the Q index applies to 3 families of joints.
A photogrammetric model of the cave can be seen in the following link:
Table 3 shows the parameters of the geomechanical classifications that have been determined from the SfM technique. Better results are presented when the discontinuities present in the model are adjusted to a suitable scale for data collection.
3.2. Stability Assessment by Geomechanical Classifications
Barton’s Q Index [
26], Bieniawski’s RMR system [
27] and the Geotechnical Cavity Index [
28] were used during the in-situ survey of the geomechanical stations along the underground cavity. Four geomechanical stations have been established to assess the quality of the rock mass, which are located in the walkable section to the NW before the road crossing. The rest of the tunnel has been inferred due to various access complications.
The rock quality values and mapped observations for the Bieniawski RMR Index are summarized in
Table 4 where the volcanic cave presents a medium rock quality. On the other hand, from the values obtained using Barton’s Q Index (
Table 5), poor-quality rock mass has been determined. Finally,
Table 6 shows the result of mapping the CGI variables, obtaining moderate susceptibility to structural instability.
As can be seen, the methodologies applied complemented each other. Old landslides, but no major instabilities could be observed, except for a few blocks at the entrance to the area where stations 2 and 3 are located, which will have to be monitored.
3.3. Stability Assessment Using Empirical Analysis
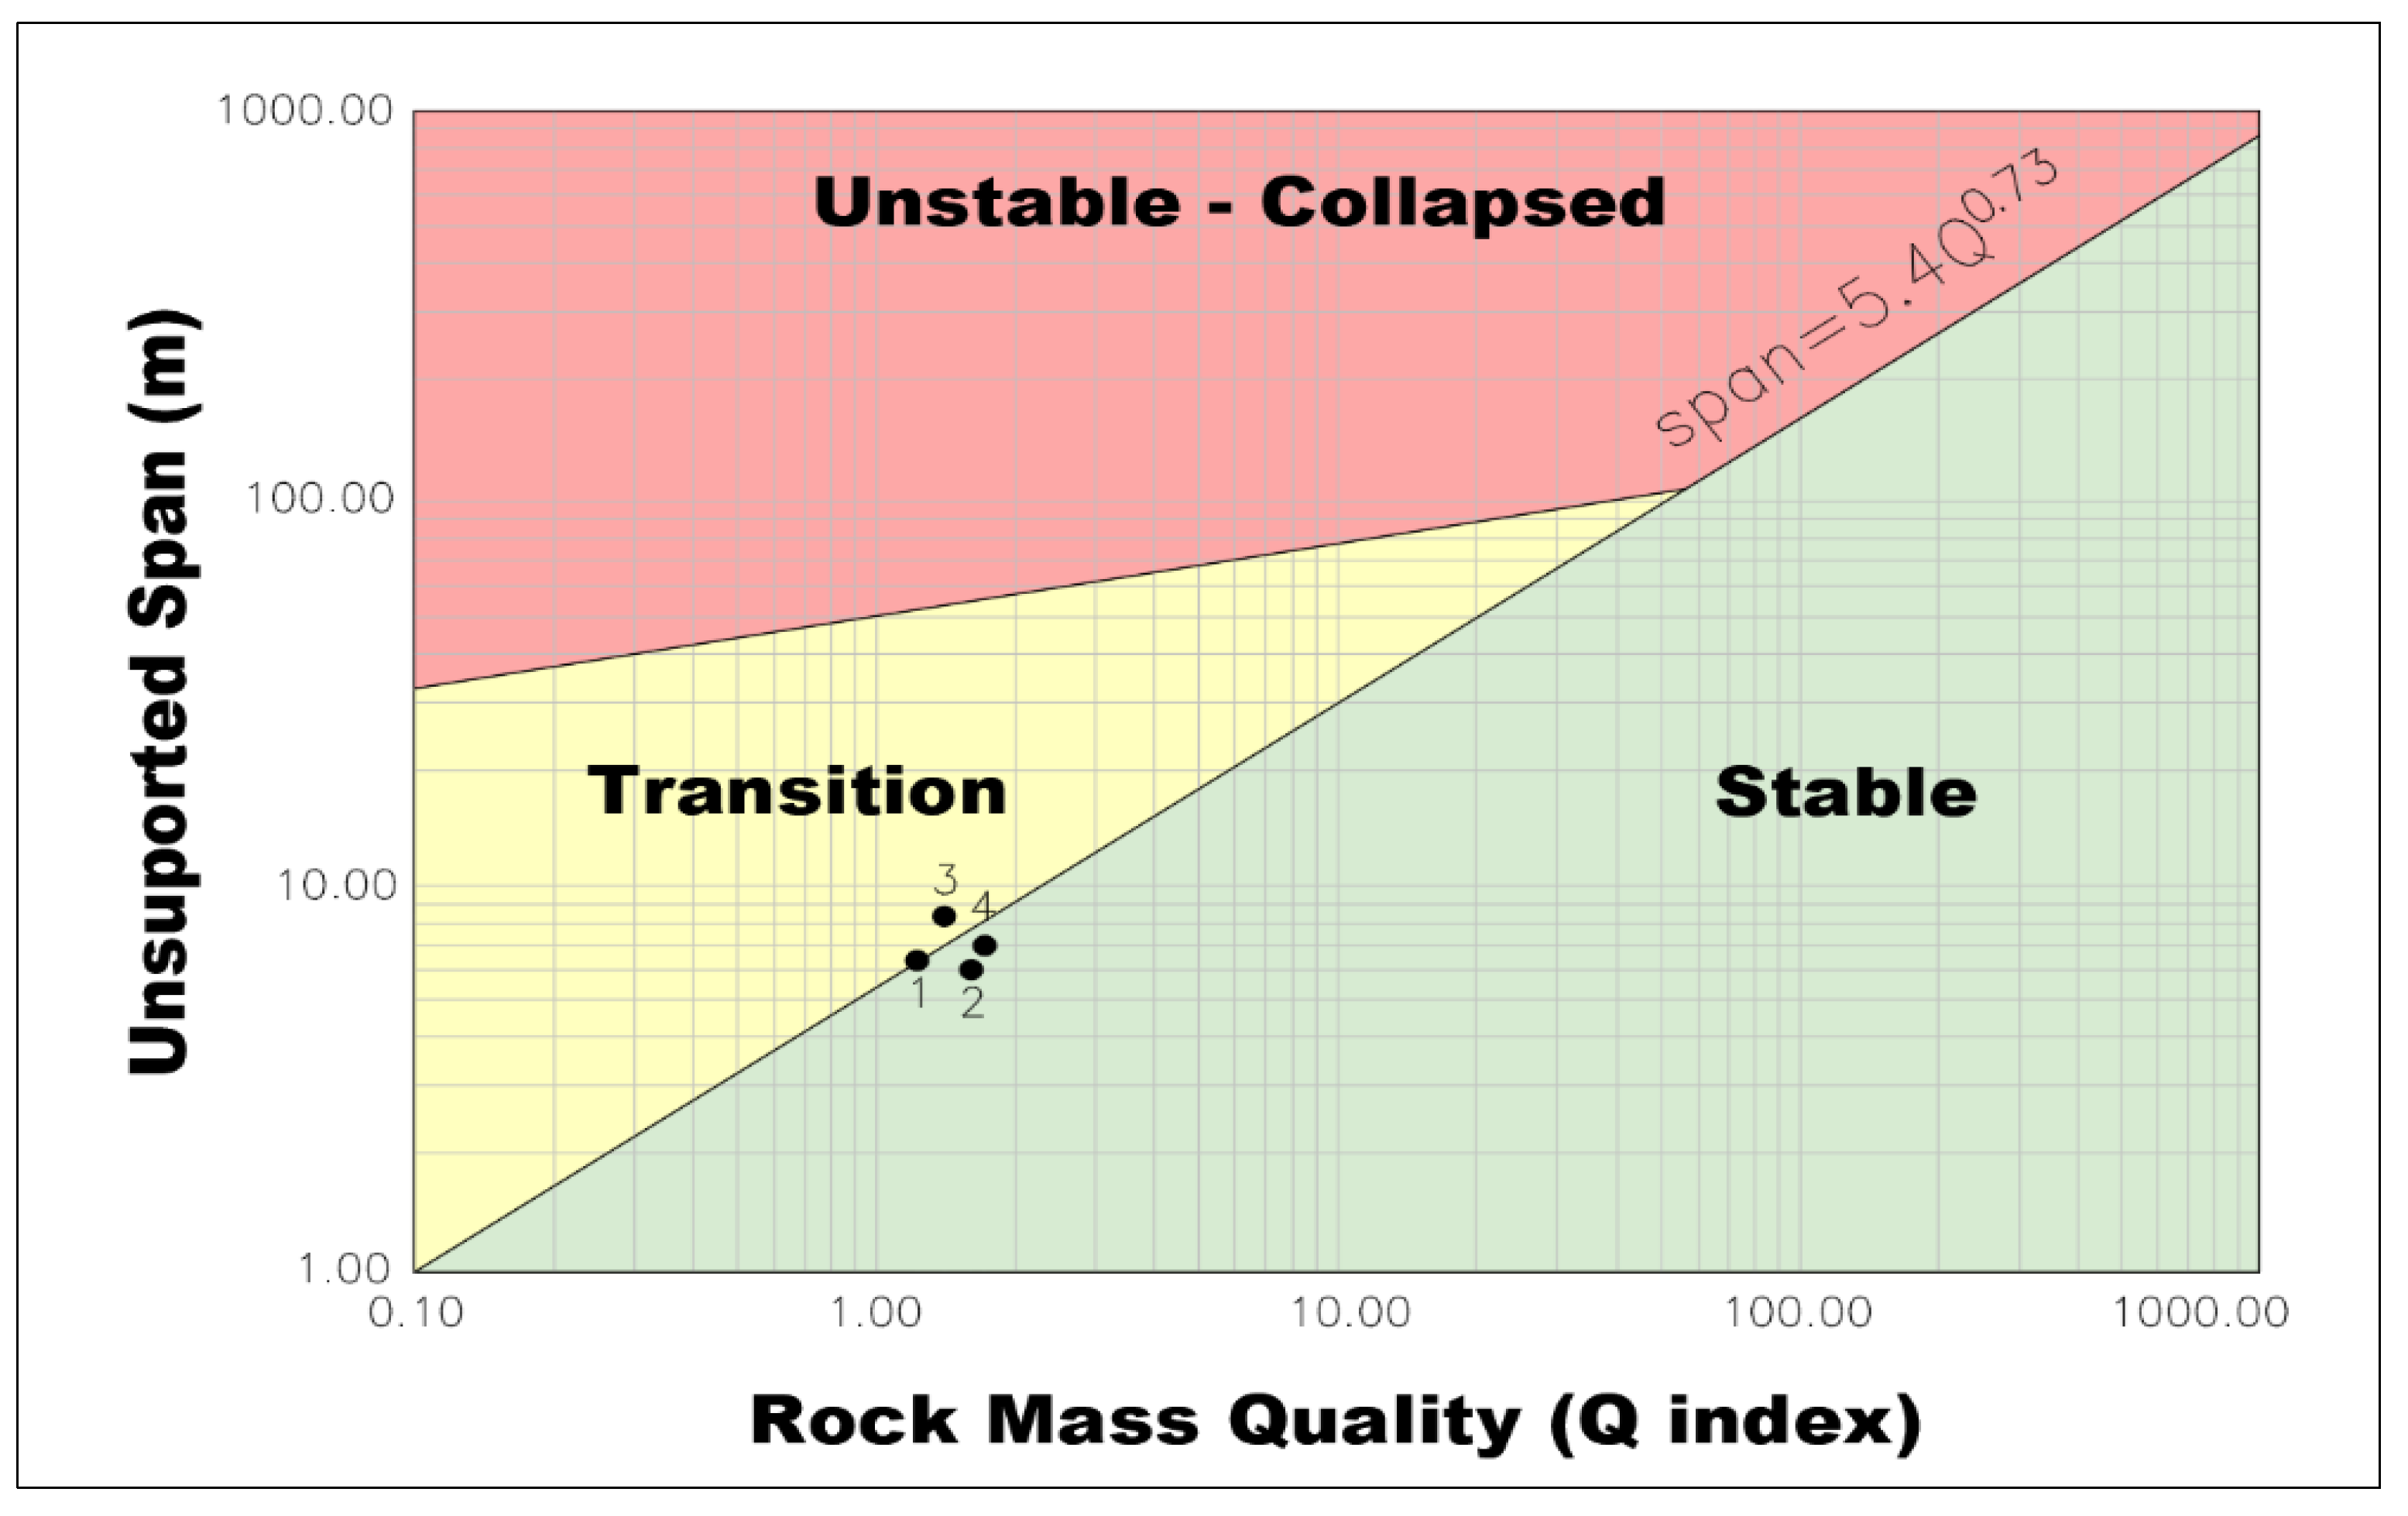
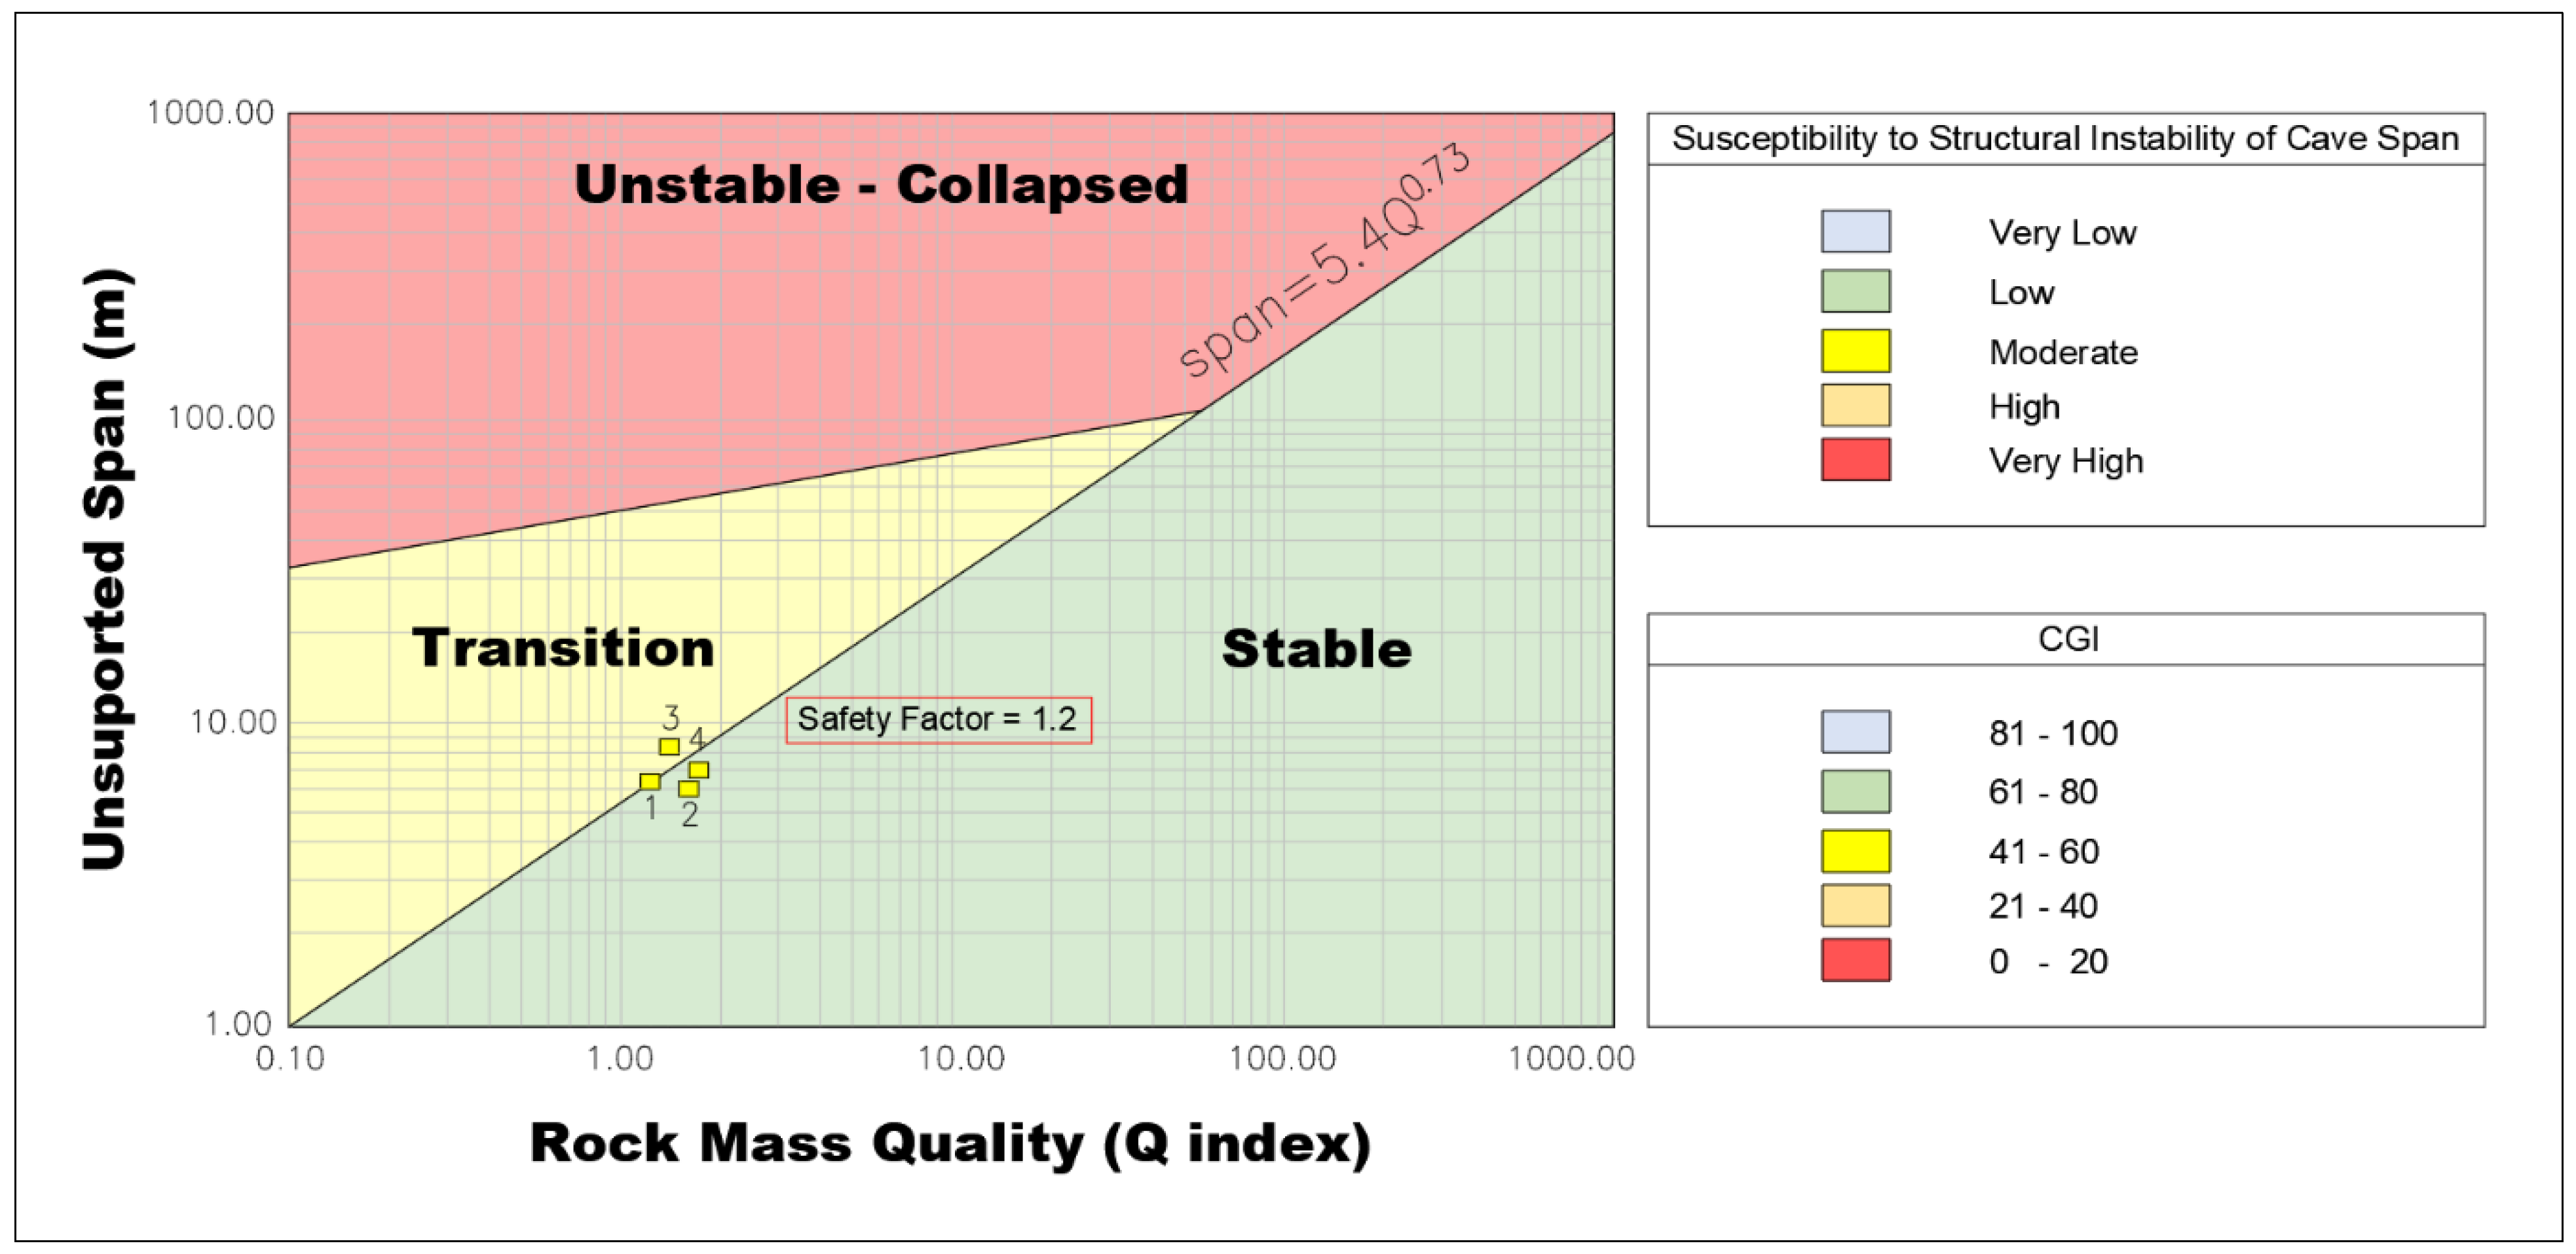
For the stability analysis of the volcanic cave, a specific graph has been used where the values obtained for the Q Index, the RMR and the RMR are entered on the 'X' axis, Or the CGI depending on the case; and on the 'Y' axis the value of the unsupported span. The points generated indicate the state of the lava tunnel for each station surveyed.
In
Figure 6, it is possible to see that all the analyzed sections are between the stable zone and the transition zone. The result is due to the fact that the tunnel width is quite wide, and the Q index has low values.
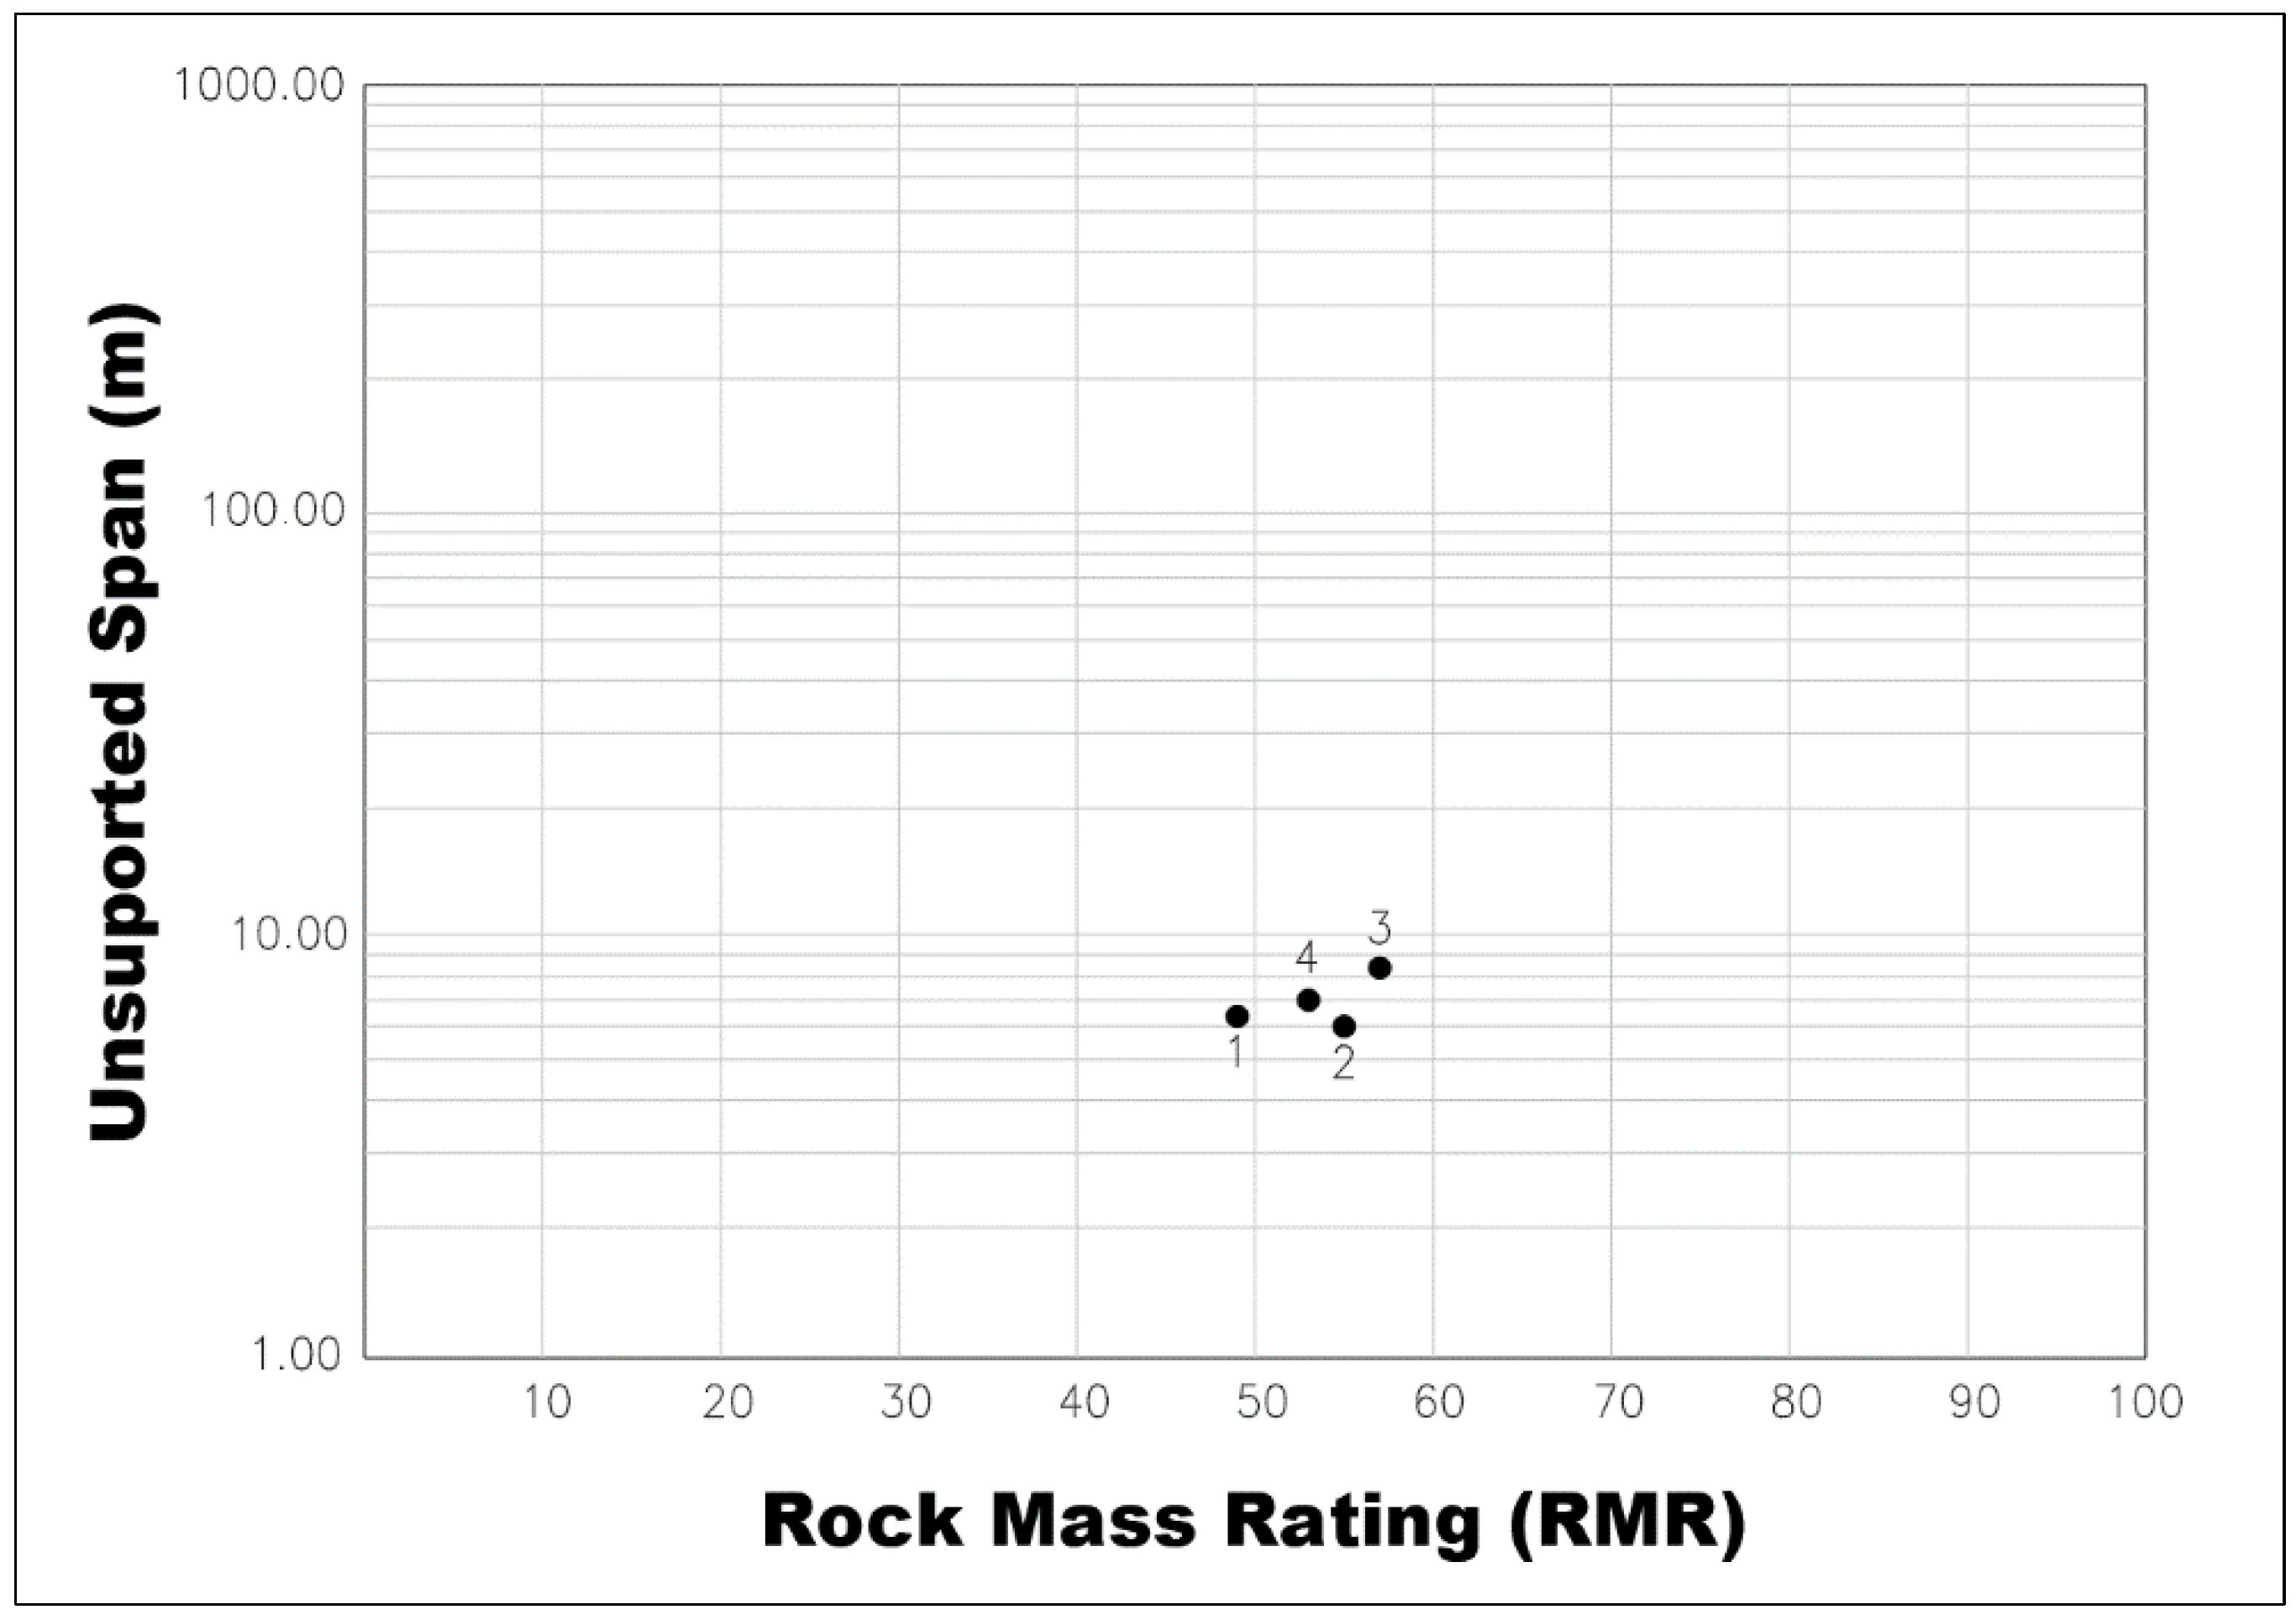
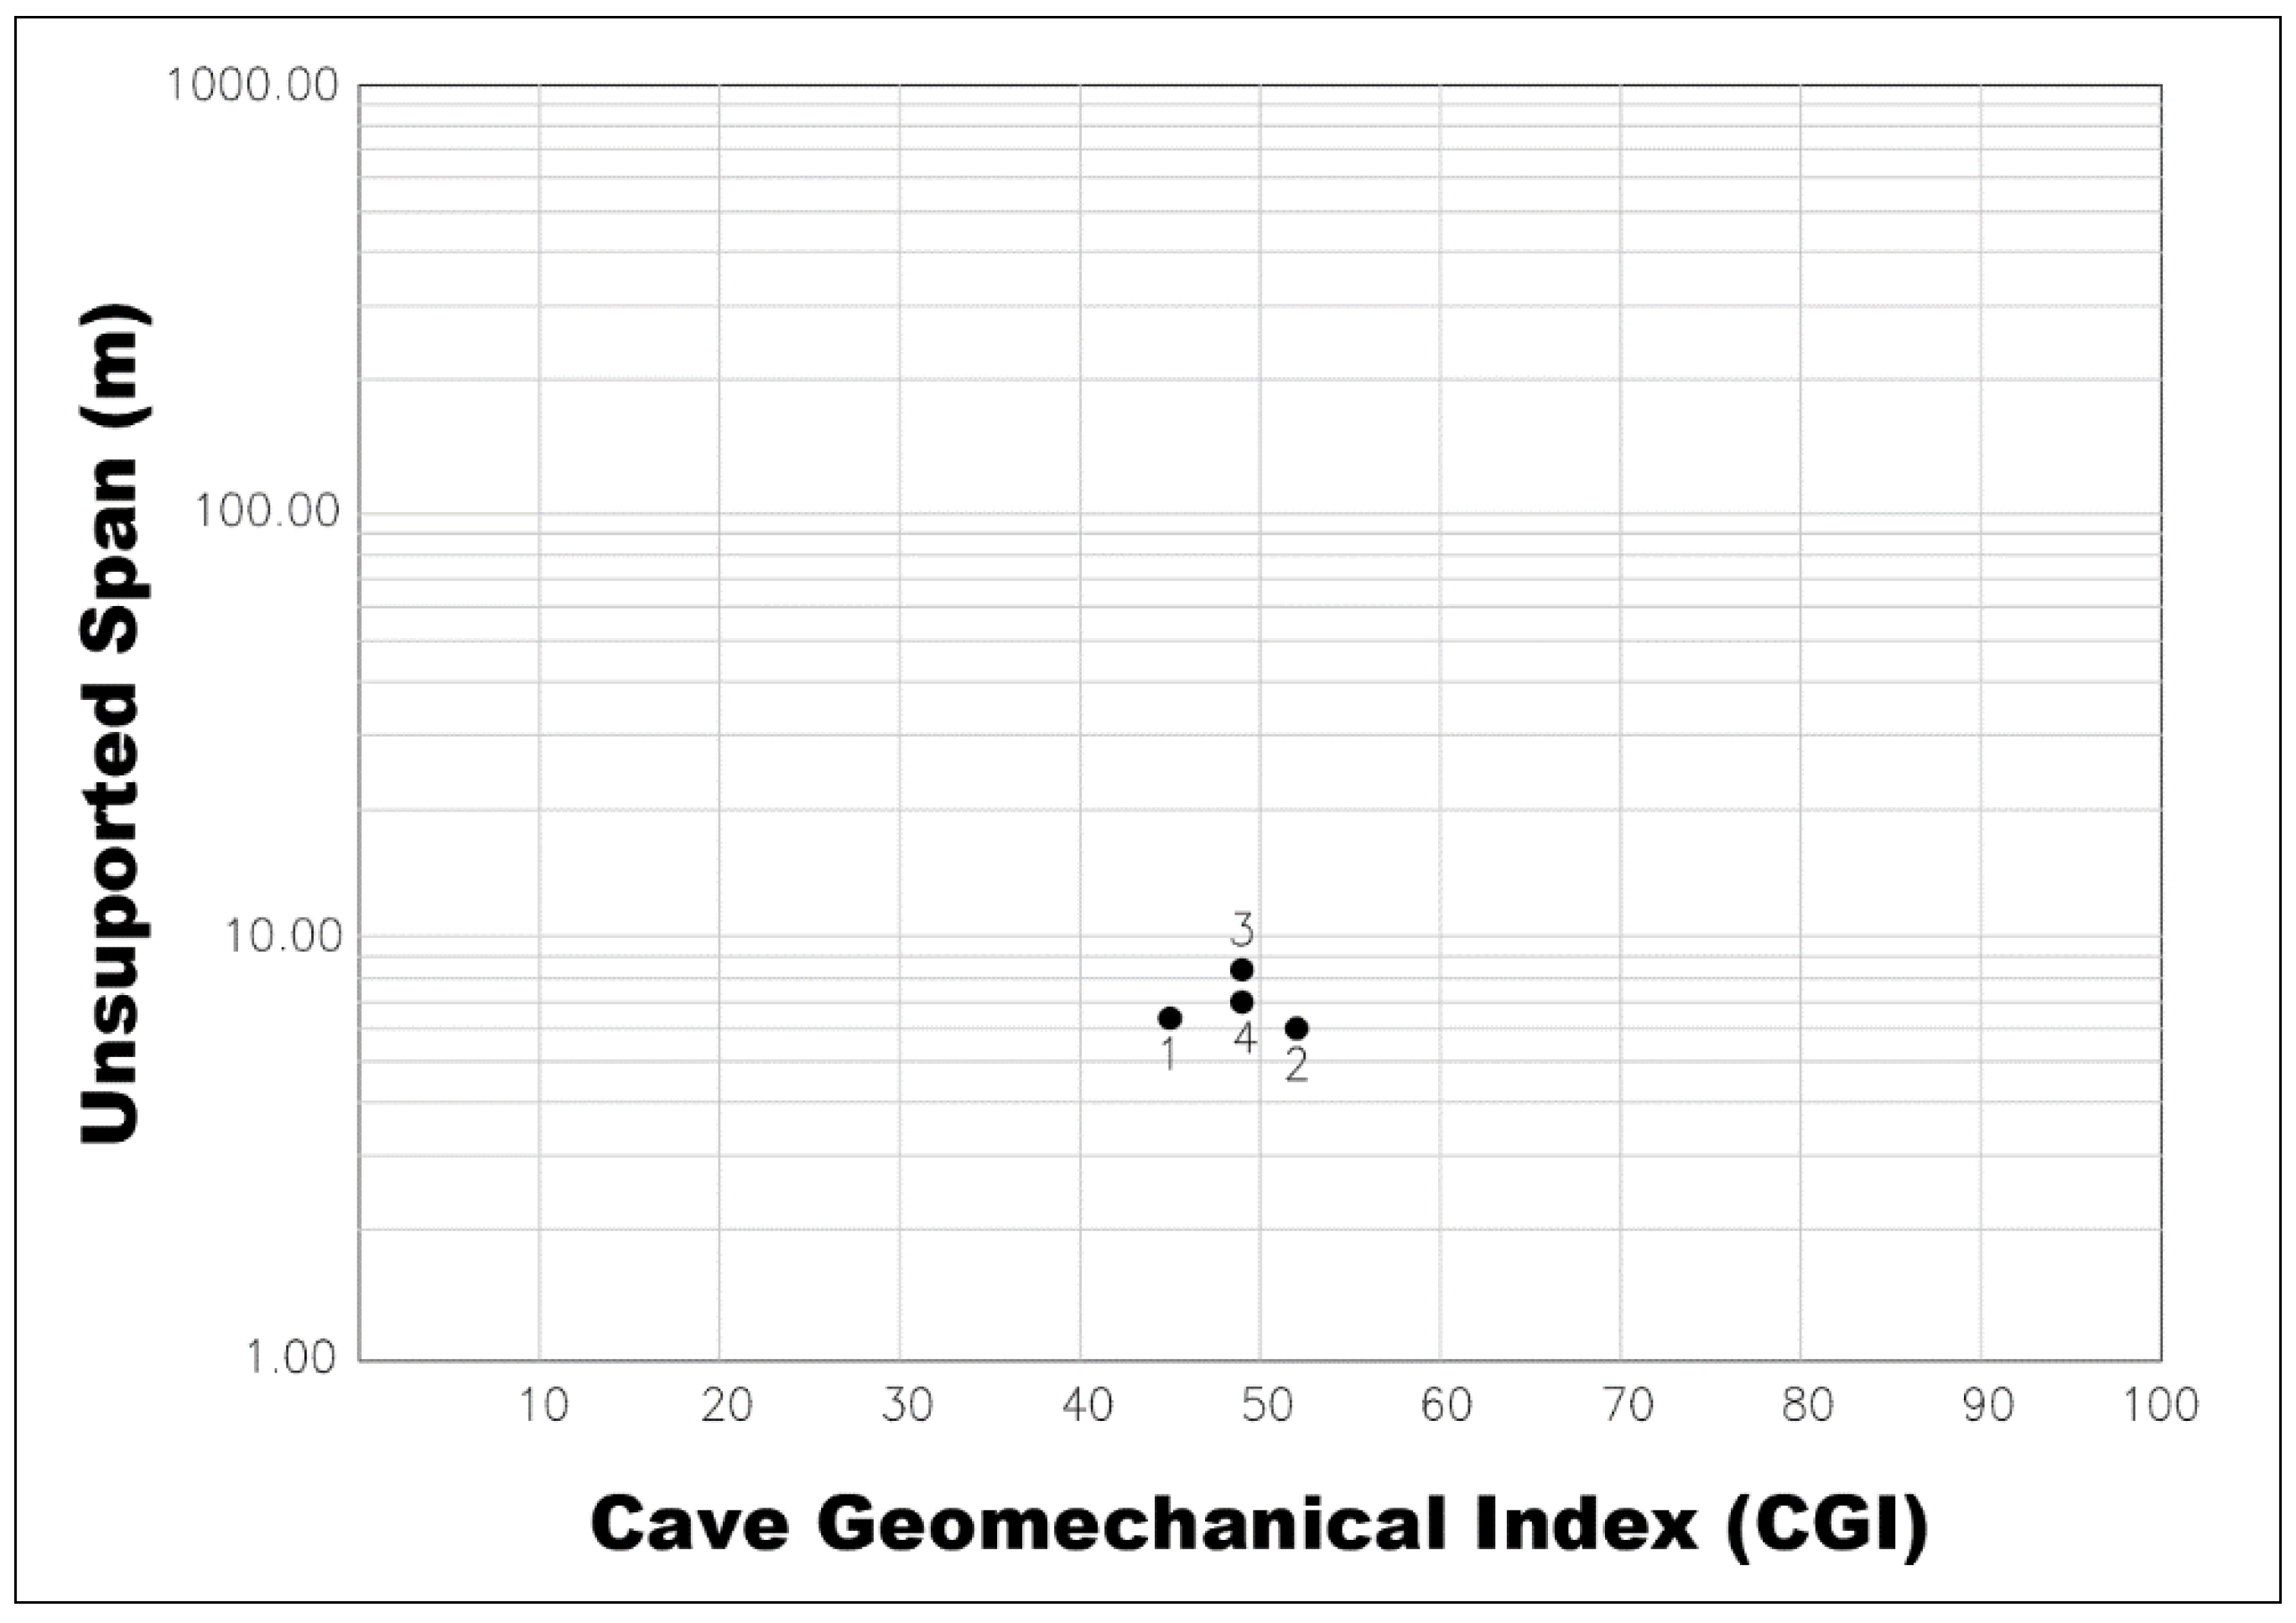
Figure 7 and
Figure 8 present the analyzed sections for the RMR and CGI, respectively. The RMR values range from 49 to 57, and the CGI values range from 45 to 52. Visually, the tunnel is stable, although there are specific areas where roof blocks have detached.
Figure 7 and
Figure 8 only show the situation of each analyzed station: span versus rock quality. Q index measurements can be plotted over an existing data base which shows the stability areas in colors. There is not yet a database and “stability plot” for RMR and CGI specific for caves.
3.4. Deformational Stress Analysis
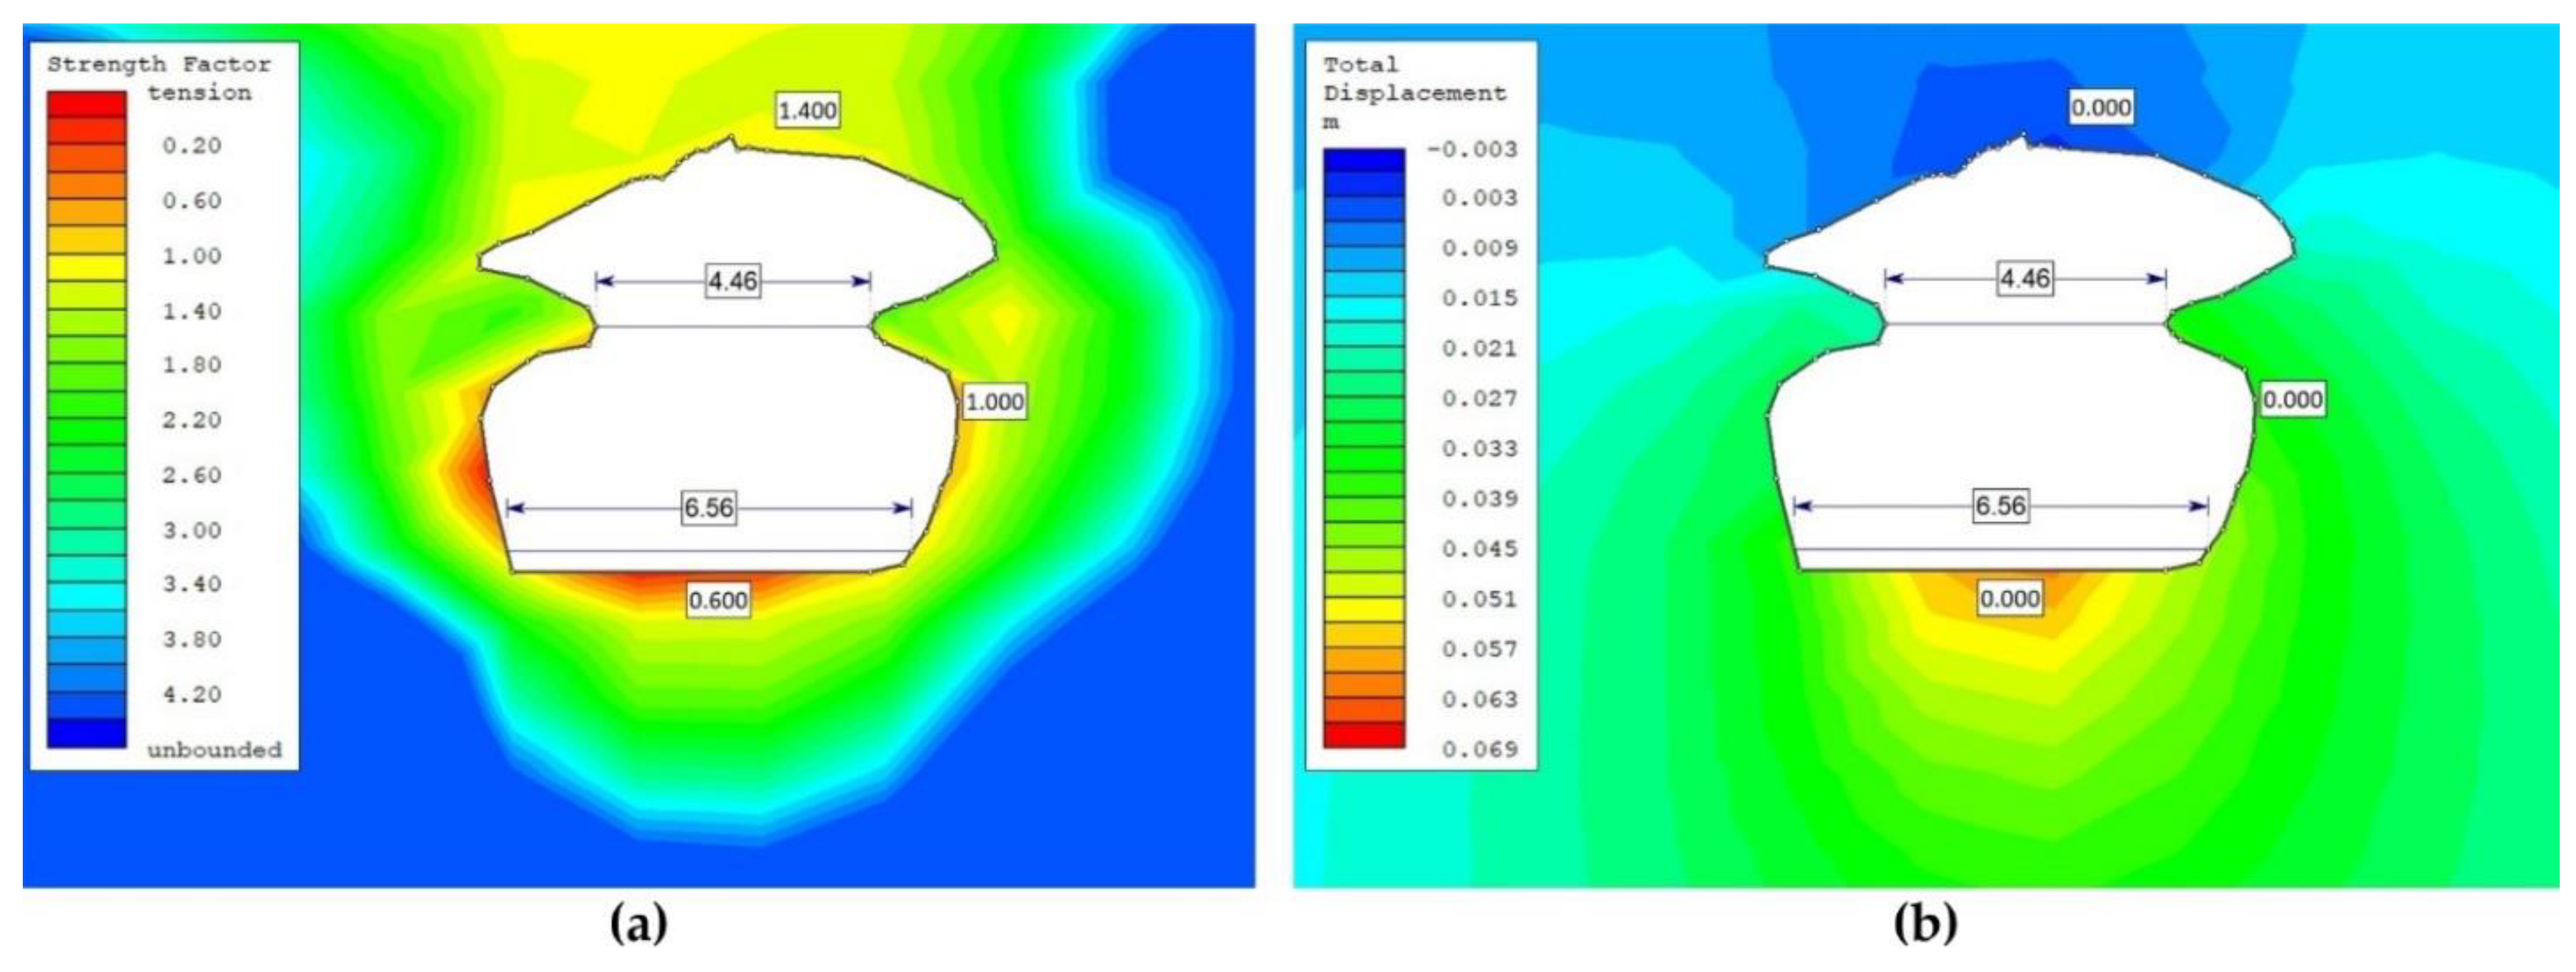
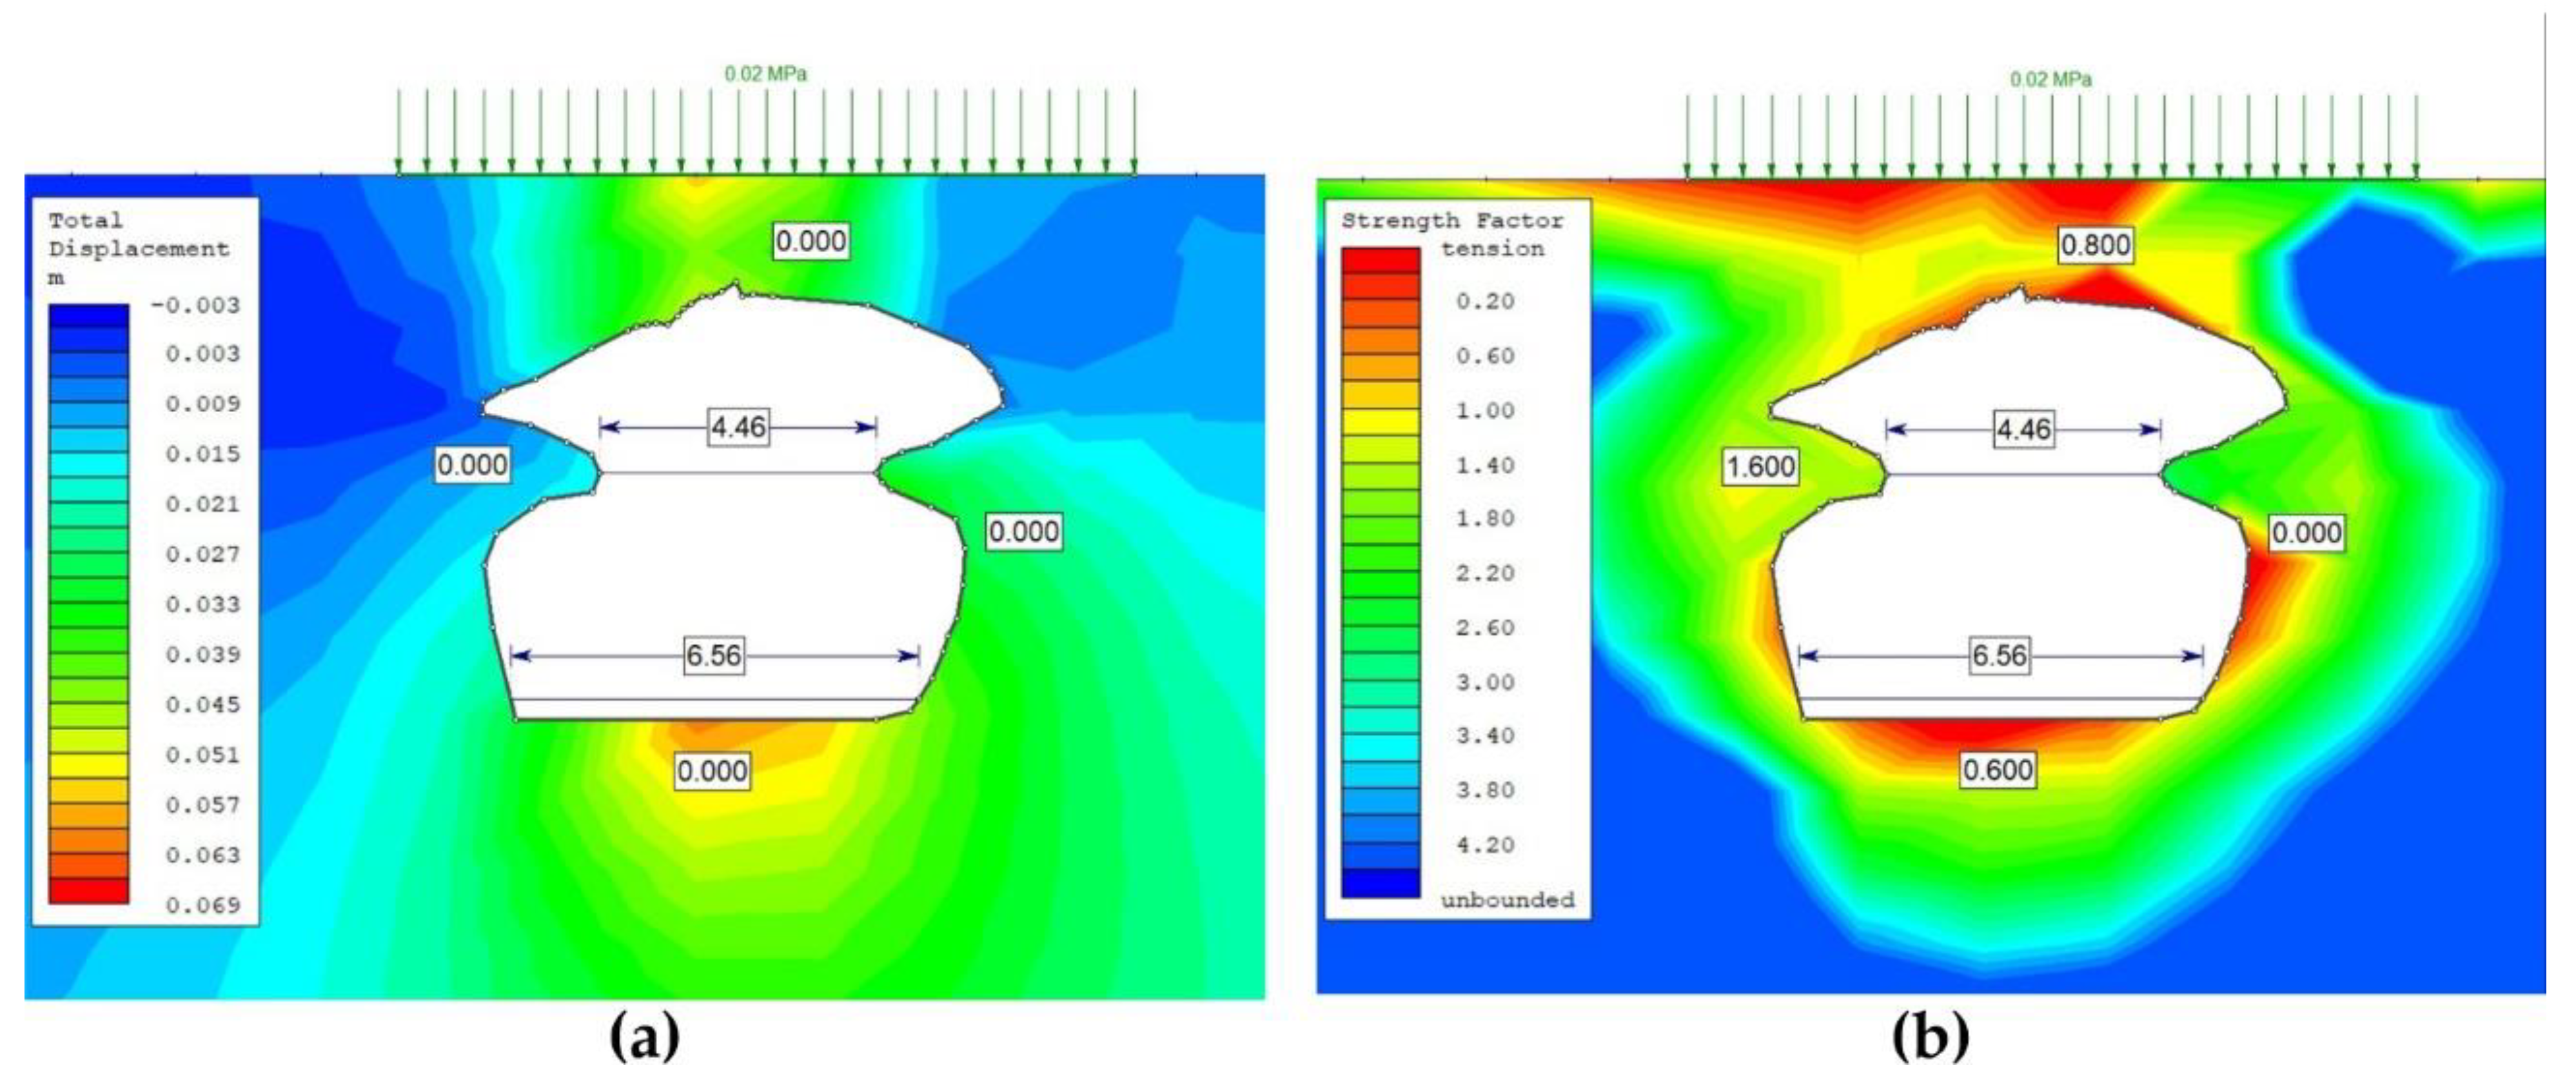
The finite element calculation has been carried out on the section where the geomechanical station 3 has been erected. Station 3 was chosen because it is inside the lava tunnel and does not show 3D entrance effects. The geometric model was also more reliable. It was simply intended to verify the empirical models in an unfavorable section.
Since the regime is elastic, the Examine 2D program was chosen, which works with boundary elements; and different scenarios have been considered for comparison.
Figure 9 shows the modelling results without considering surface overloads. The total displacements are negligible, and the cavity is in elastic regime-stable. However, huge unstable blocks are visible at the entrance, which are kept in situ only by the roughness and interlocking of the discontinuities. From the generation of the strength factor graph, it is possible to deduce that except for very specific areas where stresses accumulate, no tensile effects are expected in the tunnel.
Figure 10 presents a graph showing the correlation of information for geomechanical station 3. This station has a factor of safety of 1.2 and medium to moderate CGI values. The failure mode is expected to be block fall as seen in the field.
A second modelling exercise was carried out to determine the most unfavorable scenarios for the development of the model. For this purpose, the rock bridge or thickness was set to less than 1 m.
Figure 11 shows that there are no displacements. The stresses around the cavity are small and there are only point stress concentrations in the gables and part of the cave roof.
A load of 0,020 MPa was simulated. This load has been distributed over the surface as a slab throughout the cavity in order to analyze its interaction.
From the analysis of
Figure 12, it is determined that with the simulated overload there are no relevant displacements and the stresses around the cave are greater than the previous scenarios with emphasis on certain areas around the gables and the roof. However, it can be said that the cave remains stable.
4. Discussion
The cave has been analyzed from the perspective of different methods, three empirical: the Q index, RMR and CGI. It is important to note that the CGI index is very new and there are few applications. Data have been taken manually and completed with remote techniques for areas that are difficult to access or dangerous. A particular section has been chosen, station 3, and the degree of stability has been verified there by numerical methods, which shows a safety factor of 1.2 in line with the empirical results. The cave is globally stable but there are specific areas where instabilities can be seen: falls of slabs and some blocks.
As shown in the results, the inside of the tunnels' two joint sets can be clearly seen. A third joint set is more evident at the entrances of the caves (transversal) but hardly recognizable inside where is detected only by means the shape of the fallen blocks. With three joint sets, the rock mass can be analyzed using the Hoek and Brown’s criteria with care. Since the aim is to complete the empirical analysis, we believe that this criterion is sufficient for a preliminary stage of analysis. Empirical approaches have been used to give conservative stability recommendations based on data obtained in the field. The effect of the joints dilatancy the low confinement of the shallow caves is incorporated in the 2x factor that is applied in the Jn of the Q index. On the other hand, the effects of the joints roughness is an input of the Jr parameter. A more detailed analysis of the behavior of the joints is outside the scope of this investigation. The models are considered to reflect reality reasonably well despite their simplicity (which is actually one of the objectives: to characterize with simple field data). Lava tubes can be considered as "longitudinal caves" and for this reason a 2D analysis by cross sections can be sufficiently valid. In the cave entrances and where the caves intersect it is recommendable in complex cases use three-dimensional models. However, the Q index and the CGI already consider these effects in several parameters such as the Jn and SRF and the shape factor of the roof.
5. Conclusions
The research philosophy has been mainly the use of empirical methodologies (Q index, RMR and CGI), combining manual data acquisition and remote techniques for inaccessible areas. Using a simple 2D model and a generalized Hoek and Brown failure criterion, an approximate safety factor has been sought by means of an approximation. Future lines of research can model the environment through programs and techniques that, based on geometric data such as those obtained, model the blocks and their interactions more precisely, including finer parameters for roughness and including joints dilatancy.
The application of a geotechnical study made it possible to define the stability and safety conditions of the El Mirador lava tunnel. With the collection of information in the field and the methodology applied for its analysis, it has been determined that there are no instability problems. However, it must be considered that there are specific areas along the tunnel where safety is not completely guaranteed.
With the SfM photogrammetric technique it has been possible to generate a geometric model that allowed the acquisition of data that were difficult to take in situ and that helped to complete the parameters established in the geomechanical classifications. It is important to mention that remote techniques do not replace the field survey and manual data acquisition but are complementary to them.
Different graphs have been developed and compared with the empirical methods used. The resulting values from the Q Index presented the lowest score compared to the RMR and CGI, however they were the best fit to the tunnel conditions and the numerical models developed. Q index measurements can be plotted over an existing data base which shows the stability areas in colors. There is not yet a database and “stability plot” for RMR and CGI specific for caves. The next investigations are aimed at developing specific stability-instability graphs with RMR and CGI data.
Finally, some openings in the roof and old rock falls were observed, therefore, constant monitoring should be carried out and visitors should be restricted. In the virtual repository (VR techniques) different sections of the tunnel are shown where it is possible to analyze the geometric and geotechnical aspects described in the study.
Author Contributions
Conceptualization, G.R., M.M., S.L. and L.J.B.; methodology, G.R. and L.J.B.; software, G.R. and L.J.B.; validation, G.R. and L.J.B.; formal analysis, G.R.; investigation, G.R., M.M. and L.J.B.; writing—original draft preparation, G.R.; writing—review and editing, G.R., M.M., M.D.P.V.E., E.L., S.L. and L.J.B.; supervision, M.M., M.D.P.V.E., E.L., S.L. and L.J.B., funding acquisition A.A.Y.V. All authors have read and agreed to the published version of the manuscript.
Funding
This research is part of a master thesis of the Geotechnics Master Program of the Faculty of Engineering in Earth Sciences (FICT, acronym in Spanish) of ESPOL Polytechnic University in Guayaquil, Ecuador.
Data Availability Statement
Acknowledgments
This work has been made possible thanks to support from ESPOL Polytechnic University. The authors would like to thank three anonymous reviewers for their constructive comments and the editorial office for the editorial handling. The research has algo been granted from Polytechnical University of Madrid through the Innovative Project: flipped classroom and virtual volcanoes UPM 2022. "Volcanes virtuales: aula invertida de geotecnia de materiales volcánicos a través de entornos virtuales y TICs" Proyecto de Innovación Educativa UPM IE22.0404 in Spanish.
Conflicts of Interest
The authors declare no conflict of interest.
References
- Barton, N. Unsupported Underground Openings. In Rock Mechanics Discussion Meeting; Befo, Swedish Rock Mechanics Research Foundation, Stifrelsen Bergteknisk Forskning: Stockholm, Sweden, 1976; pp. 61–94. [Google Scholar]
- Waltham, T.; Bell, F.G.; Culshaw, M.G.; Knez, M.; Slabe, T. Sinkholes and Subsidence: Karst and Cavernous Rocks in Engineering and Construction; Springer: Berlin/Heidelberg, Germany, 2005; Volume 382. [Google Scholar]
- Mulas, M.; Cioni, R.; Andronico, D.; Mundula, F. The explosive activity of the 1669 Monti Rossi eruption at Mt. Et-na (Italy). J. Volcanol. Geotherm. Res. 2016, 328, 115–133. [Google Scholar] [CrossRef]
- Alejano, L.R.; Rodriguez-Dono, A.; Alonso, E.; Manín, G.F. Ground reaction curves for tunnels excavated in different quality rock masses showing several types of post-failure behaviour. Tunn. Undergr. Space Technol. 2009, 24, 689–705. [Google Scholar] [CrossRef]
- Jordá Bordehore, L. Stability Assessment of Natural Caves Using Empirical Approaches and Rock Mass Classifications. Rock Mech. Rock Eng. 2017, 50, 2143–2154. [Google Scholar] [CrossRef]
- Halliday, W.R. A Short History of Vulcanospeleology. In Proceedings of the Ninth International Symposium on Vulcanospeleology, Catania, Italy, 11–19 September 1999. [Google Scholar]
- Calvari, S.; Pinkerton, H. Lava tube morphology on Etna and evidence for lava flow emplacement mechanisms. J. Volcanol. Geotherm. Res. 1999, 90, 263–280. [Google Scholar] [CrossRef]
- Martellato, E. Analysis of Lava Tubes and Skylights in the Lunar Exploration Context. Meteorit. Planet. Sci. 2004, 39, 217–231. [Google Scholar]
- Zhang, Z.; Jiang, D.; Liu, W.; Chen, J.; Li, E.; Fan, J.; Xie, K. Study on the mechanism of roof collapse and leakage of horizontal cavern in thinly bedded salt rocks. Environ. Earth Sci. 2019, 78, 292. [Google Scholar] [CrossRef]
- De Fino, M.; Ceppi, C.; Fatiguso, F. Virtual tours and informational models for improving territorial attractiveness and the smart management of architectural heritage: The 3d-imp-act project. Int. Arch. Photogramm. Remote Sens. Spat. Inf. Sci. 2020, XLIV–M–1, 473–480. [Google Scholar] [CrossRef]
- Jordá Bordehore, L.; Toulkeridis, T.; Romero Crespo, P.L.; Jordá Bordehore, R.; García Garizabal, I. Stability Assessment of Volcanic Lava Tubes in the Galápagos Using Engineering Rock Mass Classifications and an Empirical Approach. Int. J. Rock Mech. Min. Sci. 2016, 89, 55–67. [Google Scholar] [CrossRef]
- Bastidas, G.; Soria, O.; Mulas, M.; Loaiza, S.; Bordehore, L.J. Stability Analysis of Lava Tunnels on Santa Cruz Island (Galápagos Islands, Ecuador) Using Rock Mass Classifications: Empirical Approach and Numerical Modeling. Geosciences 2022, 12, 380. [Google Scholar] [CrossRef]
- Geist, D.; Naumann, T.; Larson, P. Evolution of Galápagos Magmas: Mantle and Crustal Fractionation without Assimilation. J. Petrol. 1998, 39, 953–971. [Google Scholar] [CrossRef]
- Hoernle, K.; van den Bogaard, P.; Werner, R.; Lissinna, B.; Hauff, F.; Alvarado, G.; Garbe-Schönberg, D. Missing History (16–71 Ma) of the Galápagos Hotspot: Implications for the Tectonic and Biological Evolution of the Americas. Geology 2002, 30, 795–798. [Google Scholar] [CrossRef]
- Werner, R.; Hoernle, K.; Barckhausen, U.; Hauff, F. Geodynamic Evolution of the Galápagos Hot Spot System (Central East Pacific) over the Past 20 My: Constraints from Morphology, Geochemistry, and Magnetic Anomalies. Geochem. Geophys. Geosystems 2003, 4, 12. [Google Scholar]
- White, W.M.; McBirney, A.R.; Duncan, R.A. Petrology and Geochemistry of the Galápagos Islands: Portrait of a Pathological Mantle Plume. J. Geophys. Res. Solid Earth 1993, 98, 19533–19563. [Google Scholar] [CrossRef]
- Štefka, J.; Hoeck, P.E.A.; Keller, L.F.; Smith, V.S. A Hitchhikers Guide to the Galápagos: Co-Phylogeography of Galápagos Mockingbirds and Their Parasites. BMC Evol. Biol. 2011, 11, 284. [Google Scholar] [CrossRef] [PubMed]
- Bow, C.S. The Geology and Petrogeneses of the Lavas of Floreana and Santa Cruz Islands: Galápagos Archipielago; University of Oregon: Eugene, OR, USA, 1979. [Google Scholar]
- D’Ozouville, N.; Deffontaines, B.; Benveniste, J.; Wegmüller, U.; Violette, S.; de Marsily, G. DEM Generation Using ASAR (ENVISAT) for Addressing the Lack of Freshwater Ecosystems Management, Santa Cruz Island, Galápagos. Remote Sens. Environ. 2008, 112, 4131–4147. [Google Scholar] [CrossRef]
- Gregg, T.K.P. Patterns and Processes: Subaerial Lava Flow Morphologies: A Review. J. Volcanol. Geotherm. Res. 2017, 342, 3–12. [Google Scholar] [CrossRef]
- Calvari, S.; Pinkerton, H. Formation of Lava Tubes and Extensive Flow Field during the 1991–1993 Eruption of Mount Etna. J. Geophys. Res. Solid Earth 1998, 103, 27291–27301. [Google Scholar] [CrossRef]
- Kennish, M.J.; Lutz, R.A. Morphology and distribution of lava flows on mid-ocean ridges: A review. Earth-Sci. Rev. 1998, 43, 63–90. [Google Scholar] [CrossRef]
- Hoek, E. Practical Rock Engineering; 2000. [Google Scholar]
- Palmstrom, A.; Broch, E. Use and Misuse of Rock Mass Classification Systems with Particular Reference to the Q-System. Tunn. Undergr. Sp. Technol. 2006, 21, 575–593. [Google Scholar] [CrossRef]
- Alejano Monge, L.; Ramírez Oyanguren, P. Mecánica de Rocas: Fundamentos e Ingeniería de Taludes; Red DESIR: Madrid, Spain, 2004. [Google Scholar]
- Barton, N.; Lien, R.; Lunde, J. Engineering Classification of Rock Masses for the Design of Tunnel Support. Rock Mech. 1974, 6, 189–236. [Google Scholar] [CrossRef]
- Bieniawski, Z.T. Engineering Rock Mass Classifications: A Complete Manual for Engineers and Geologists in Mining, Civil, and Petroleum Engineering; John Wiley & Sons: Hoboken, NJ, USA, 1989. [Google Scholar]
- Brandi, I.; Barbosa, M.; Barata, A.; De Paula, R.; Correa, T.; Lima, H.; Osborne, R. Cave Geomechanical Index (CGI). Classification and Contribution to the Conservation of Natural Caves in the Iron Mines. Geoconservation Res. 2020, 3, 134–161. [Google Scholar]
- Jordá, L.; Tomás, R.; Arlandi, M.; Abellán, A. Manual de Estaciones Geomecánicas y Descripción de Macizos Rocosos En Afloramientos; ETSI Minas: Madrid, Spain, 2016. [Google Scholar]
- Miranda, T.; Dias, D.; Eclaircy-Caudron, S.; Correia, A.G.; Costa, L. Back analysis of geomechanical parameters by optimisation of a 3D model of an underground structure. Tunn. Undergr. Space Technol. 2011, 26, 659–673. [Google Scholar]
- Kainthola, A.; Singh, P.K.; Wasnik, A.B.; Sazid, M.; Singh, T.N. Finite Element Analysis of Road Cut Slopes Using Hoek and Brown Failure Criterion. Int. J. Earth Sci. Eng. 2012, 5, 1100–1109. [Google Scholar]
- Rocscience. RS2 9.0–Rock and Soil 2-Dimensional Analysis Program; Rocscience Inc.: Toronto, ON, Canada, 2017. [Google Scholar]
- Villalta Echeverria, M.D.P.; Viña Ortega, A.G.; Larreta, E.; Romero Crespo, P.; Mulas, M. Lineament Extraction from Digital Terrain Derivate Model: A Case Study in the Girón–Santa Isabel Basin, South Ecuador. Remote Sens. 2022, 14, 5400. [Google Scholar] [CrossRef]
- Anderson, K.; Westoby, M.J.; James, M.R. Low-Budget Topographic Surveying Comes of Age: Structure from Motion Photogrammetry in Geography and the Geosciences. In Progress in Physical Geography: Earth and Environment; SAGE Publications Sage UK: London, UK, 2019; pp. 163–173. [Google Scholar]
- Westoby, M.J.; Brasington, J.; Glasser, N.F.; Hambrey, M.J.; Reynolds, J.M. ‘Structure-from-Motion’Photogrammetry: A Low-Cost, Effective Tool for Geoscience Applications. Geomorphology 2012, 179, 300–314. [Google Scholar] [CrossRef]
- An, P.; Fang, K.; Jiang, Q.; Zhang, H.; Zhang, Y. Measurement of Rock Joint Surfaces by Using Smartphone Structure from Motion (SfM) Photogrammetry. Sensors 2021, 21, 922. [Google Scholar] [CrossRef]
- Tomás-Jover, R.; Guill, A.J.R.; González, M.C.; Fernández, A.A.; Jordá, L. Structure from Motion (SfM): Una Técnica Fotogramétrica de Bajo Coste Para La Caracterización y Monitoreo de Macizos Rocosos. In Reconocimiento, Tratamiento y Mejora del Terreno: 10° Simposio Nacional de Ingeniería Geotécnica: A Coruña, 19, 20 y 21 de Octubre de 2016; Sociedad Española de Mecánica del Suelo e Ingeniería Geotécnica: Madrid, Spain, 2016; pp. 209–216. [Google Scholar]
- Tung, W.Y.; Nagendran, S.K.; Ismail, M.A.M. 3D Rock Slope Data Acquisition by Photogrammetry Approach and Extraction of Geological Planes Using FACET Plugin in CloudCompare. In IOP Conference Series: Earth and Environmental Science; IOP Publishing: Bristol, UK, 2018; Volume 169, p. 12051. [Google Scholar]
- Jordá Bordehore, L.; Riquelme, A.; Tomás, R.; Cano, M. Análisis Estructural y Geomecánico En Zonas Inaccesibles de Cavernas Naturales Mediante Técnicas Fotogramétricas: Aplicación En La Entrada de La Cueva de Artá (Mallorca). El Karst y el Hombre las Cuevas Como Patrim. Mund. 2016, 528, 255–265. [Google Scholar]
- Agisoft Metashape software Manual, Professional Edition; Version 1.6; Agisoft LLC: Petersburg, Russia, 2018.
- Rajendra, Y.D.; Mehrotra, S.C.; Kale, K.V.; Manza, R.R.; Dhumal, R.K.; Nagne, A.D.; Vibhute, A.D. Evaluation of Partially Overlapping 3D Point Cloud’s Registration by Using ICP Variant and CloudCompare. Int. Arch. Photogramm. Remote Sens. Spat. Inf. Sci. 2014, 40, 891. [Google Scholar]
- Riquelme, A.J.; Tomás, R.; Abellán, A. Characterization of Rock Slopes through Slope Mass Rating Using 3D Point Clouds. Int. J. Rock Mech. Min. Sci. 2016, 84, 165–176. [Google Scholar] [CrossRef]
| Disclaimer/Publisher’s Note: The statements, opinions and data contained in all publications are solely those of the individual author(s) and contributor(s) and not of MDPI and/or the editor(s). MDPI and/or the editor(s) disclaim responsibility for any injury to people or property resulting from any ideas, methods, instructions or products referred to in the content. |
© 2023 by the authors. Licensee MDPI, Basel, Switzerland. This article is an open access article distributed under the terms and conditions of the Creative Commons Attribution (CC BY) license (https://creativecommons.org/licenses/by/4.0/).


 ,
, 


