Article

Identifying the Driving Impact Factors on Water Yield Service in Mountainous Areas of the Beijing-Tianjin-Hebei Region in China

1
Key Laboratory of Agricultural Water Resources, Hebei Key Laboratory of Agricultural Water-Saving, Center for Agricultural Resources Research, Institute of Genetics and Developmental Biology, Chinese Academy of Sciences, Shijiazhuang 050001, China
2
Institute of Geographical Sciences, Hebei Academy of Sciences, Shijiazhuang 050011, China
3
Hebei Technology Innovation Center for Geographic Information Application, Shijiazhuang 050011, China
*
Author to whom correspondence should be addressed.
Remote Sens. 2023, 15(3), 727; https://doi.org/10.3390/rs15030727
Submission received: 21 December 2022 / Revised: 19 January 2023 / Accepted: 21 January 2023 / Published: 26 January 2023

Abstract

:
Clarifying the interrelationship between climate and land use/land cover (LULC) changes on water yield in mountainous areas is very urgent due to the dramatic decrease in the water availability of mountainous areas. In this study, the InVEST model was used to calculate the water yield of the mountainous area in Beijing–Tianjin–Hebei region (BTH) from 1980 to 2020, and six scenarios were designed to identify the contribution rates of climate and LULC change on the water yield. The results showed that, in 1980–2020, the water yield in the mountainous area of BTH was the largest in 1990, at 377.95 mm and the smallest in 1980, at 150.49 mm. After 2000, the interannual water yield showed a slightly increasing trend, which was significantly lower than the water yield in 1990, the values ranging from 217.01 mm to 324.65 mm. During the study period, the spatial distribution of the water yield was similar over the years, with high values in the south-central Taihang Mountain (THM) and the northeastern Yanshan Mountain (YSM). The THM was the main water yield area of the mountainous area in BTH. The annual water yield of farmland was the highest, followed by forest land and grassland, while the proportion of volumetric water yield was the largest in forest land with an increasing trend from 1980 to 2020 and the grassland showed a decreasing trend, while that of farmland increased first from 1980 to 2000 and decreased from 2000 to 2020. Climate is the key factor controlling the water yield of the mountainous area in BTH from 1980–2000, 2000 to 2020, and 1980 to 2020. In the period of 2000–2020, the effect of LULC on the water yield is negative, while the effect is positive in 1980–2000 and 1980–2020. The contribution rate of climate to the water yield increases in the THM, Bashang region (BSR) and YSM from the period 1980–2000 to 2000–2020, while that of LULC in those three regions changes from a positive impact in 1980–2000 to a negative impact in 2000–2020, and the contribution rate is also greatly reduced. In the long term, land revegetation will gradually benefit the water yield in the mountainous areas of BTH, including the THM, BSR, and YSM. These results can provide an important scientific and technological reference for the ecological management and protection of water source sites, as well as the planning and utilization of water resources in mountainous areas of BTH.

1. Introduction

Ecosystem services are the basis for human well-being and sustainable development [1,2], and have become a hot topic of research in ecology and related disciplines [3,4,5]. Generally, ecosystem services include four primary categories—supporting, provisioning, regulating, and cultural services, along with eleven corresponding secondary categories [6]. Among those services, water yield service is a critical ecosystem service for its roles in characterizing regional water resource availability [7], which is particularly important in water-limited regions [8]. Meanwhile, water yield service plays a critical role in the sustainable development of regional economies and ecosystems [9], such as the provision of drinking water, agriculture, ranching, and production [10]. Nevertheless, with the intensification of anthropogenic activities and climate change for the past few years, land use/landcover (LULC) and climate change will have potentially large impacts on watershed hydrological processes [11]. Climate change alters precipitation and evapotranspiration (solar radiation and temperature) in watersheds [12], which alters the regional water cycle, infiltration processes, water holding model, and thus water yield [13]. The anthropogenic demand for water resources has been increasing rapidly in response to rapid economic development and urbanization, and has been directly changing regional water yield [14]. In addition, the uneven distribution of water resources has led to an increasingly prominent imbalance between the supply and demand of water resources [15].
Multiple satellite products consistently show that Earth’s terrestrial systems have been greening for nearly three decades [16,17,18], and similarly, the terrestrial systems in China have also experienced extensive greening trends [19,20], with China contributing 25% of the net increase in global green foliage from 2000 to 2017 [21]. The starting point of afforestation is still mainly to increase carbon stocks and reduce soil erosion, while water is rarely considered in forest management [22]. In recent years, increasing concerns have been expressed about afforestation projects that focus only on carbon sequestration while ignoring significant decreases in water yield [23,24]. In large-scale afforestation processes, if the trade-offs and synergies between water and carbon benefits in ecosystem are not fully considered, serious ecological problems will result [17]. Under the change of climate and LULC, a profound understanding of the impact of vegetation greening on water cycle processes is important for enhancing integrated water resources management in watersheds and solving contemporary water resources problems [24,25]. The relationship between vegetation change and water resources or water yield is not only an important theoretical issue of academic interest in the field of hydrology and ecology, but also an important applied topic related to ecological restoration and conservation [26].
The debate on the relationship between forest and water dates back at least to the middle of the 19th century [27] and the scientific debate is still very intense today [28,29]. The reason for this debate lies in the fact that different scholars have obtained different results and conclusions in previous studies on the relationship between forest and water. It includes the cases where there is a negative relationship [30,31,32], no relationship [33,34,35], and a positive relationship [36,37] between vegetation change and water resources. The same amount of deforestation (or revegetation) can significantly increase (or decrease) water yield in many watersheds, but can also have little effect on water yield in other watersheds. The water yield of some watersheds may even be reduced (or increased) [29]. Thus, the relationship between forest and water resources is neither exactly the trade-off concluded by Jackson et al. [38], nor is it an ideal, mutually reinforcing, relationship, but it may depend on the environment in which the forest is located. Interestingly, the areas with positive and no effect results are mostly wet areas, or those with complex terrain or large watersheds [39].
Generally, water yield from a watershed is the basis of a river’s flow, and over time scales, is the balance of precipitation less evapotranspiration with negligible groundwater losses [40,41]. Some studies have directly used water yield to characterize water conservation, while others have used related parameters to modify water yield and obtain a measure of water conservation [42,43]. Water supply and conservation are integrated concepts, and water yield is the basis for both. There are quantitative methods for estimating water yield based on different variation conditions, and here the main focus has been on models, including the Soil and Water Assessment Tool (SWAT) [44], the Artificial Intelligence for Ecosystem Services (ARIES) [45], and the Integrated Valuation of Ecosystem Services and Tradeoffs (InVEST) [46]. Compared with other models, based on the principle of water balance [47], the InVEST model requires fewer data, is easier and more convenient to calculate, and shows the spatial and temporal variation of water yield in raster, shapefile, and table formats [48,49]. Therefore, the InVEST model has been applied to different study areas by many scholars around the world, including 22 UK catchments [50], the Dongting Lake wetland region [51], the Xiangjiang River Basin [49], the Yellow River Basin [52], the Yangtze River Basin [53], and the Danjiang River Basin [43] in China, the Narmab dam watershed in Iran [54] and regions, such as Northeast China [55], Beijing, and its surrounding areas in China [56], the Beijing–Tianjin–Hebei region [57], and the agro-pastoral ecotone of northern China [58].
Promoting the coordinated development of the Beijing–Tianjin–Hebei region (BTH) is a major national strategy in China, and the regional ecological environment is the primary issue facing this strategy. Water resource shortages have become one of the major obstacles for the coordinated development of BTH [59,60]. Mountain areas, including the Taihang Mountain (THM), the Yanshan Mountain (YSM), and the Bashang region (BSR), are important water resource sites of the BTH, and national energy bases, taking into account the important task of decongesting the non-capital functions of Beijing, the capital of China. As the irreplaceable water towers for the plain areas, mountain areas hold the headwaters of rivers and sustain large and growing populations in the downstream regions [61]. Mountain ecosystems account for a much larger supply of the water yield service [62]. Improved understanding of water yield changes in mountains is thus crucial for optimal water resources management, especially in view of the vulnerability of the headwater ecosystems to climate change [63].
Meanwhile, to alleviate land degradation and address global warming, multiple ecosystem restoration programs have been implemented in BTH successively [64], including the “Three-North Forest Shelterbelt Program” (since 1979), the “Grain for Green Program” (since 1999), the “Beijing-Tianjin Sandstorm-Control Program” (since 2002), and the “Taihang Mountain Greening Program” (since 1986). These programs have planted billions of trees and have caused dramatic changes in the substrate of the mountainous areas [23]. Over the past 30 years, the forest cover of the THM and YSM in Hebei province, China has increased to 30% and 45.7% [65]. While for the Haihe River Basin, which originates in the mountainous areas of BTH, the amount of water resources in the mountainous areas of the Haihe River Basin has been reduced by 40% [66]. Moreover, Jia et al. [67] also showed that runoff in the THM has declined significantly since 2000, with surface water resources declining by more than 40% in the eastern region and even more than 50% in the THM of Hebei province, China.
Is the dramatic decrease in water availability in mountainous areas due to climate change or to LULC change under human activities? How do large changes in forests and the main land use type in mountainous areas affect water yield in mountainous areas? How can it be expressed quantitatively? These have become the focal questions to be addressed in the sustainable development of ecological resources in mountainous watersheds, and it is urgent to clarify the interrelationship between vegetation change and water resources and the regulating mechanisms [26,68]. Afforestation in drylands, especially in the transition zones, from arid to humid climates, has a high potential to provide ecosystem services, including high carbon sequestration [69], climate regulation [70], and prevention of desertification [71]. However, for these environments with limited water carrying capacity, more research is needed to explore the inevitable trade-offs, and the cost-benefit of different LULC types, such as between afforestation and water harvesting and its impacts on local water resources from a hydrological cycle perspective [72].
Previous studies also showed that even in arid and semi-arid zones, afforestation may also have various consequences on water resources. Feng et al. [10] found the “Grain for Green Program” has increased net primary productivity in the semi-arid Loess Plateau region, China, while resulting in a significant reduction in the runoff coefficient of the hydrological basins in the Loess Plateau region. However, the natural growth of vegetation in the Qilian Mountains, China, which is located in an arid to semi-arid region, has not reduced runoff, and the runoff has remained fairly constant over the years [73]. Zhou et al. [26] believes that the principle of artificial vegetation restoration in China should be based on achieving the sustainable use of water resources.
At the same time, as mentioned before, the mountainous areas of BTH in China, which is located in the semi-arid zone, have also seen the implementation of a large number of ecological restoration projects, and there is also the current situation of decreasing water resources, so the relationship between afforestation and water resources in this region needs to be studied. Therefore, in this paper, we selected the mountainous areas of BTH in China as the study area. The goal of this paper is an attempt to figure out the impact of climate and LULC changes on water yield service in the study area, especially the impact of the changes on water yield before and after the implementation of a series of ecological forestry projects in different regions of the study area. We estimated the water yield in the mountainous areas of BTH in China over the period from 1980 to 2020 with the InVEST model, including 1980, 1990, 1995, 2000, 2005, 2010, 2015, and 2020. Through setting six scenarios, the contributions of climate and LULC changes to the water yield were obtained in different periods, including 1980–2000, 2000–2020, and 1980–2020. The results can provide an important scientific and technological reference for the ecological management and protection of water source sites, as well as the planning and utilization of water resources, the research of water conservation measures, and the assessment of the ecological engineering benefits in the mountainous areas of BTH.

2. Materials and Methods
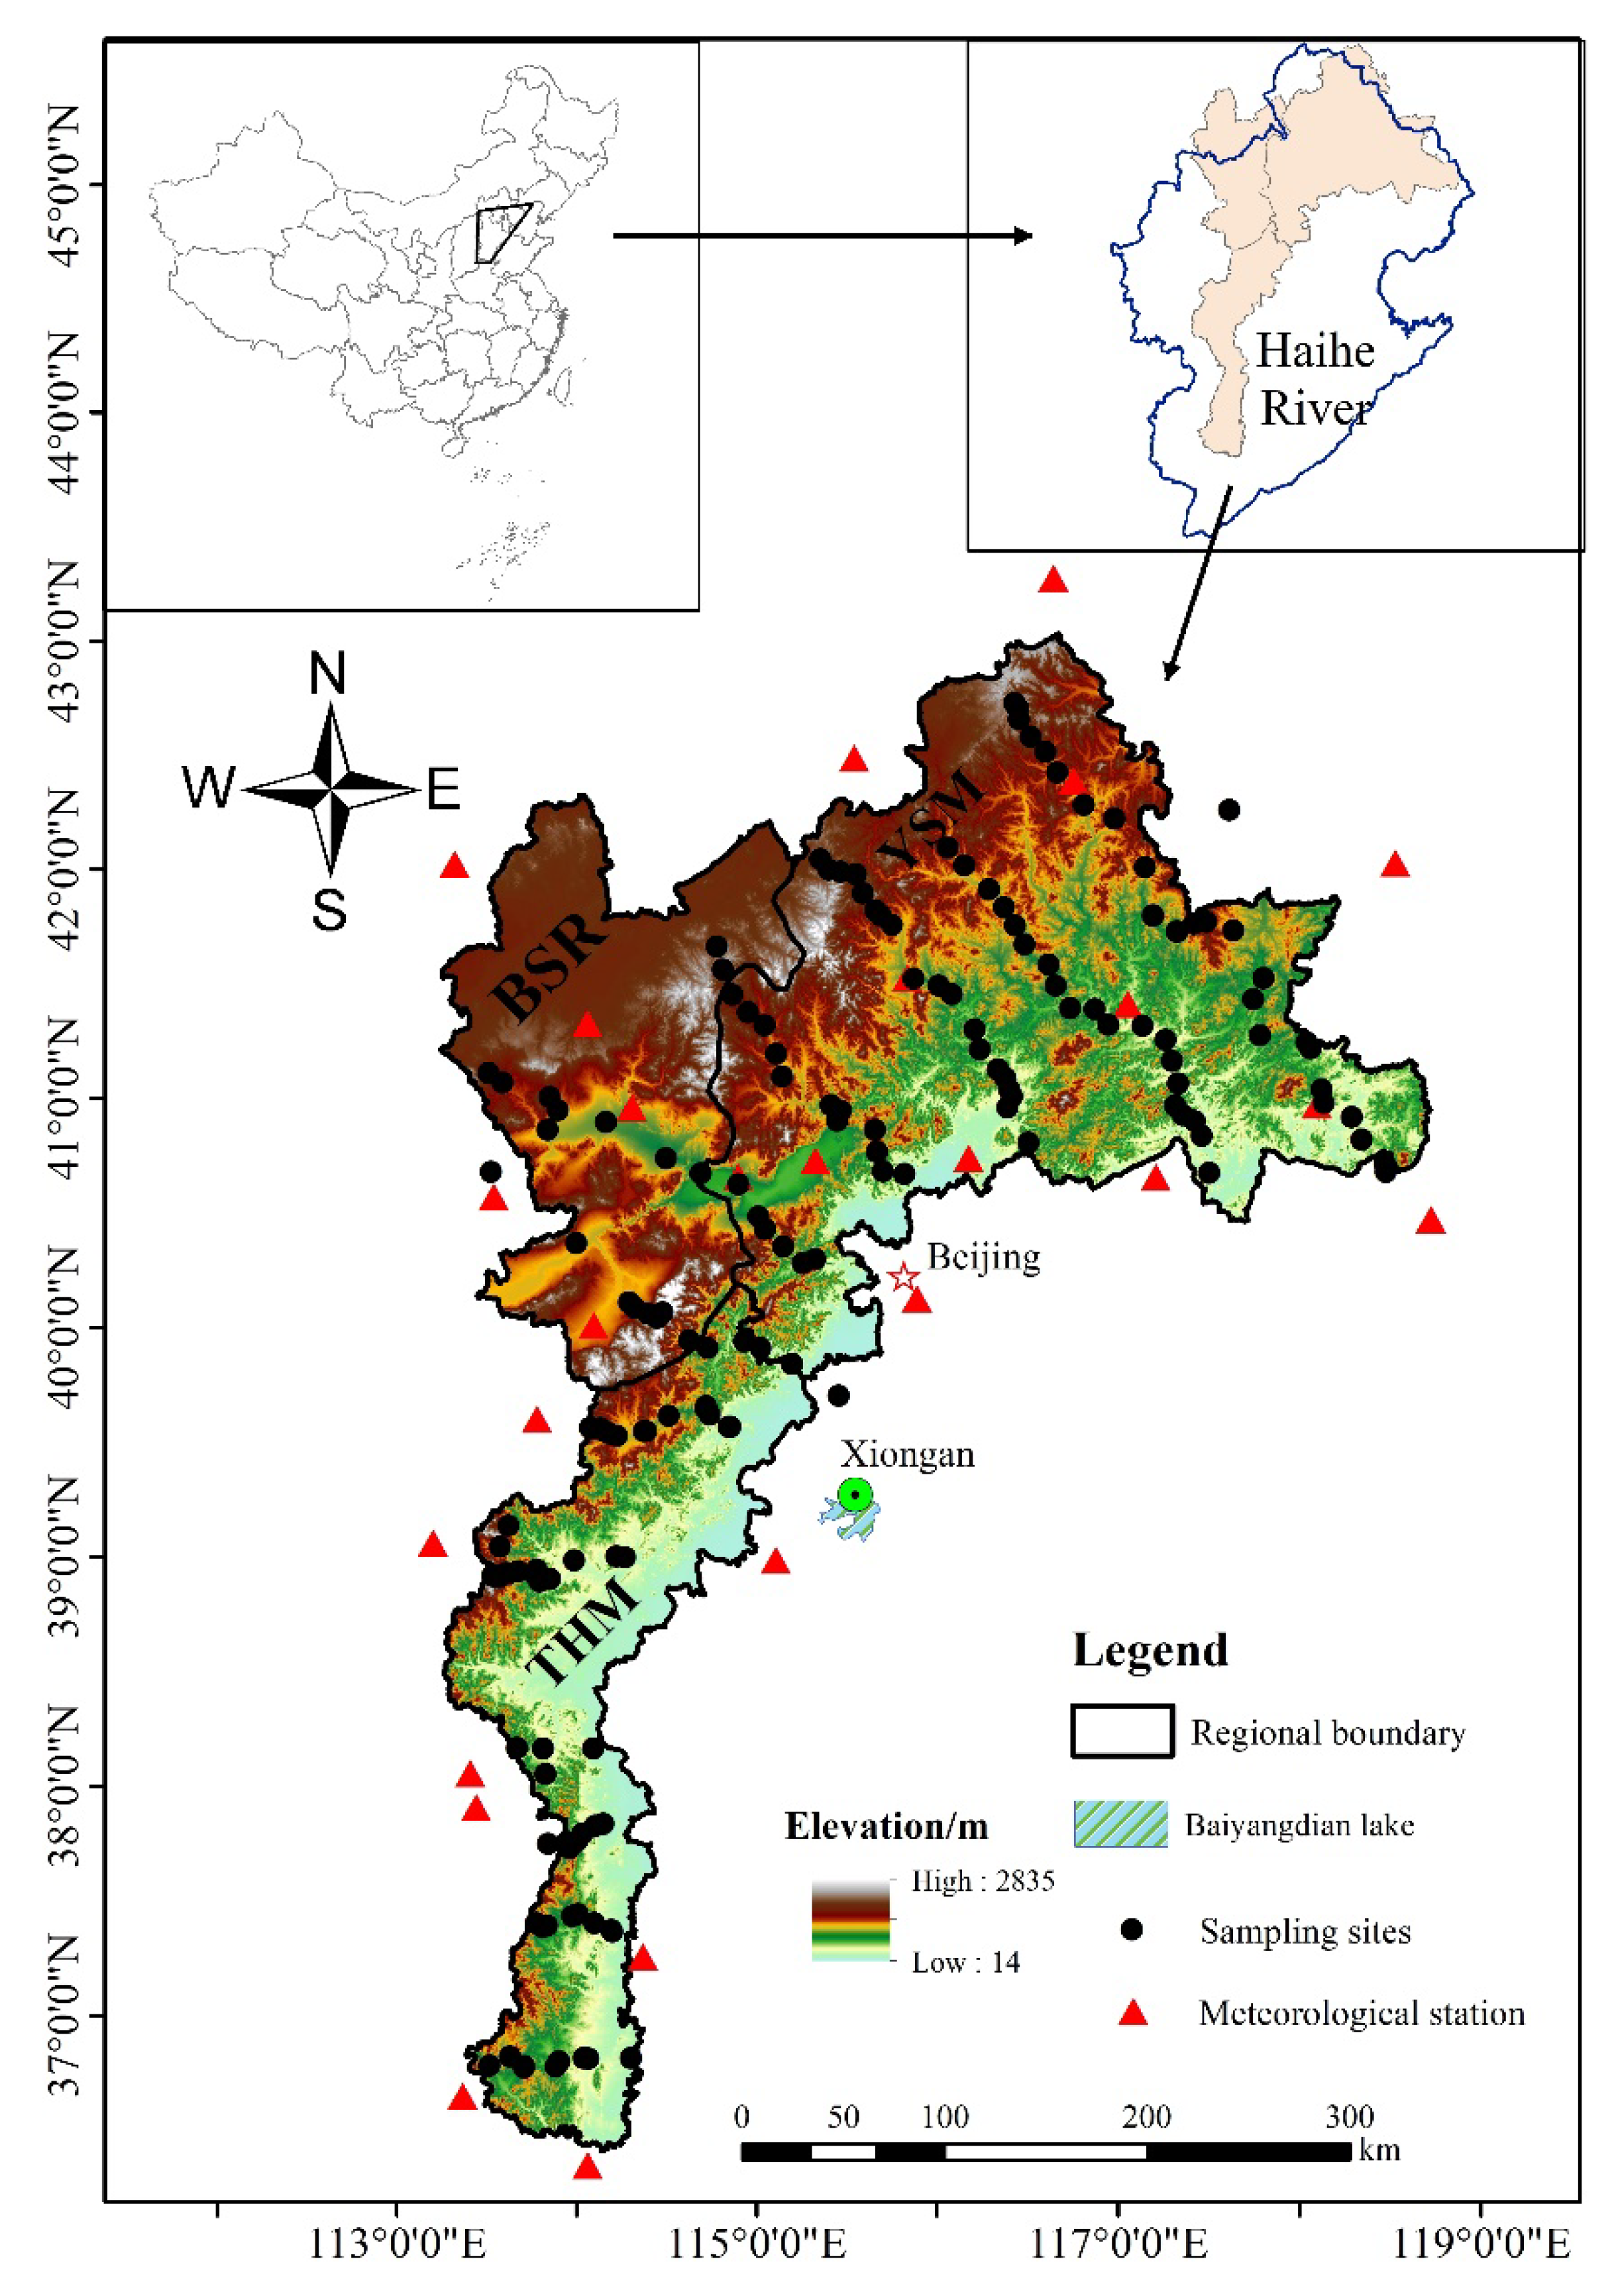
2.1. Study Area

The mountainous area of BTH is located at E113°30′0″-119°34′40″, N36°14′0″-42°38′10″ and its total area is 121,869 km2, of which, the THM is 29,361 km2, accounting for 24% of the total area, the BSR is 29,610 km2, accounting for 24.6%, and the YSM is 62,899 km2, accounting for 51.4%. It is in the upstream of Xiongan New Area and Baiyangdian lake, and the Haihe River basin flows through the region (Figure 1). It is in the warm-temperate continental monsoon climate zone, which is hot and rainy in summer and cold and dry in winter. The region has an average annual temperature of about 11 °C and the average multi-year rainfall is 512.86 mm.

2.2. Annual Water Yield Simulation

The water yield module of InVEST 3.8.9 was used to analyze the total annual water yield in mountainous areas of BTH in 1980, 1990, 1995, 2000, 2005, 2010, 2015, and 2020 in this paper. The water yield module is based on the Budyko curve and annual average precipitation. The basic output of this module is a gridded map of water yield. We determine annual water yield (x) for each pixel on the landscape x as follows:
Y x = 1 AET x P x · P x
where AET(x) is the annual actual evapotranspiration for pixel x and P(x) is the annual precipitation on pixel x.
For vegetated LULC types, the evapotranspiration portion of the water balance, AET(x)/P(x), is based on an expression of the Budyko curve proposed by Fu [74] and Zhang et al. [75]:
AET x P x = 1 + PET x P x [ 1 + PET x P x ω ] 1 / ω
where PET(x) is the potential evapotranspiration and ω(x) is a non-physical parameter that characterizes the natural climatic-soil properties, both detailed below:
PET x = K c l x · ET 0 x
x = Z AWC x P x + 1.25
where ET0(x) is the reference evapotranspiration from pixel x, and was calculated using the ‘modified Hargreaves’ equation [76], which generates superior results than the Pennman–Montieth when information is uncertain.
ET 0 = 0.0013 × 0.408 × RA × T av + 17 × TD 0.0123 P 0.76
where RA is extraterrestrial radiation, in MJ·m−2·d−1, with equation provided by FAO Irrigation Drainage Paper 56 [77], T av is the average of the daily maximum and daily minimum temperatures, in °C, TD is the difference between daily maximum and daily minimum temperatures, in °C, P is daily precipitation, in mm. K C l x is the plant (vegetation) evapotranspiration coefficient associated with the LULC l x on pixel x, Z is an empirical constant, sometimes referred to as “seasonality factor”, which captures the local precipitation pattern and additional hydrogeological characteristics and can be estimated as follows [78,79].
Z = 0.2 × N
where N is the number of rain events (>1 mm) per year.
The 1.25 term is the minimum value of (x), which can be seen as a value for bare soil (when root depth is 0), as explained by Donohue et al. [78]. Following the literature [78,80], values of (x) are capped to a value of 5. AWC(x) is the volumetric (mm) plant available water content, which is estimated as the product of the plant available water capacity (PAWC, i.e., the difference between field capacity and wilting point) and the minimum of root restricting layer depth (Rest. layer. depth) and vegetation rooting depth (root. depth):
AWC x = Min Rest . layer . depth ,   root . depth · PAWC

2.3. Data Preparation and Processing

Datasets prepared as inputs to the InVEST water yield module were listed in Table 1. The statistical analysis of daily precipitation data from 26 meteorological stations (Figure 1) in the study area is analyzed to verify the average annual number of rainfall events from 1980 to 2020 is approximately 50.35 and Z is 10.07 with the calculation of Formula 6.

2.4. Scenario Settings and Contribution Analysis

As mentioned before, the implementation of the ecological restoration project basically started in about 1980 to 2000. Therefore, in this paper, we designed six scenarios to identify the drivers on water yield in mountainous areas of BTH, which are shown in Table 2. In real conditions, climate and LULC data were input to the model in accordance with actual conditions, including 1980, 2000, and 2020. We set up six scenarios, including three climate change scenarios and three LULC change scenarios. Under the climate change scenario, actual LULC data remained in 1980 and 2000, but the corresponding climate data changed into the future data, including 2000 and 2020, namely, S1, S2, and S3. In the LULC change scenario, we maintained actual climate data in 1980 and 2000 but future LULC data of 2000 and 2020, that is, S4, S5, and S6. The water yield in each scenario was calculated using the InVEST model. Then, the contribution of climate and LULC to water yield in different periods was calculated quantitatively by using formulas (8), (9), (10), and (11) according to the results of water yield in the different scenarios.
The contribution of climate and LULC changes to the water yield was distinguished with residual trends [81]. Thus, the extent to which climate change and LULC change contribute to water yield under different scenarios can be quantified by the following formula:
Δ W c = W a W c
Δ W L = W a W l
R C = Δ W c Δ W c + Δ W L × 100 %
R L = Δ W L Δ W c + Δ W L × 100 %
where Δ W c   is the changes of water yield in a climate change scenario, in mm; W a is the water yield in real condition, W c is the water yield in climate change scenario in the same period, in mm; Δ W L is the changes of water yield in the LULC change scenario, in mm, W l is the water yield in LULC change scenario in the same period, in mm; R C and R L   refer to the contributions of climate and LULC changes to water yield in climate change and LULC change scenarios, respectively, in %.
Pearson correlation analysis is used to identify the relationship and degree of relationship of two variables with IBM SPSS Statistics 20. Other processing and analysis of data is based on Arc GIS 10.5 and Microsoft Excel 2016.

3. Results

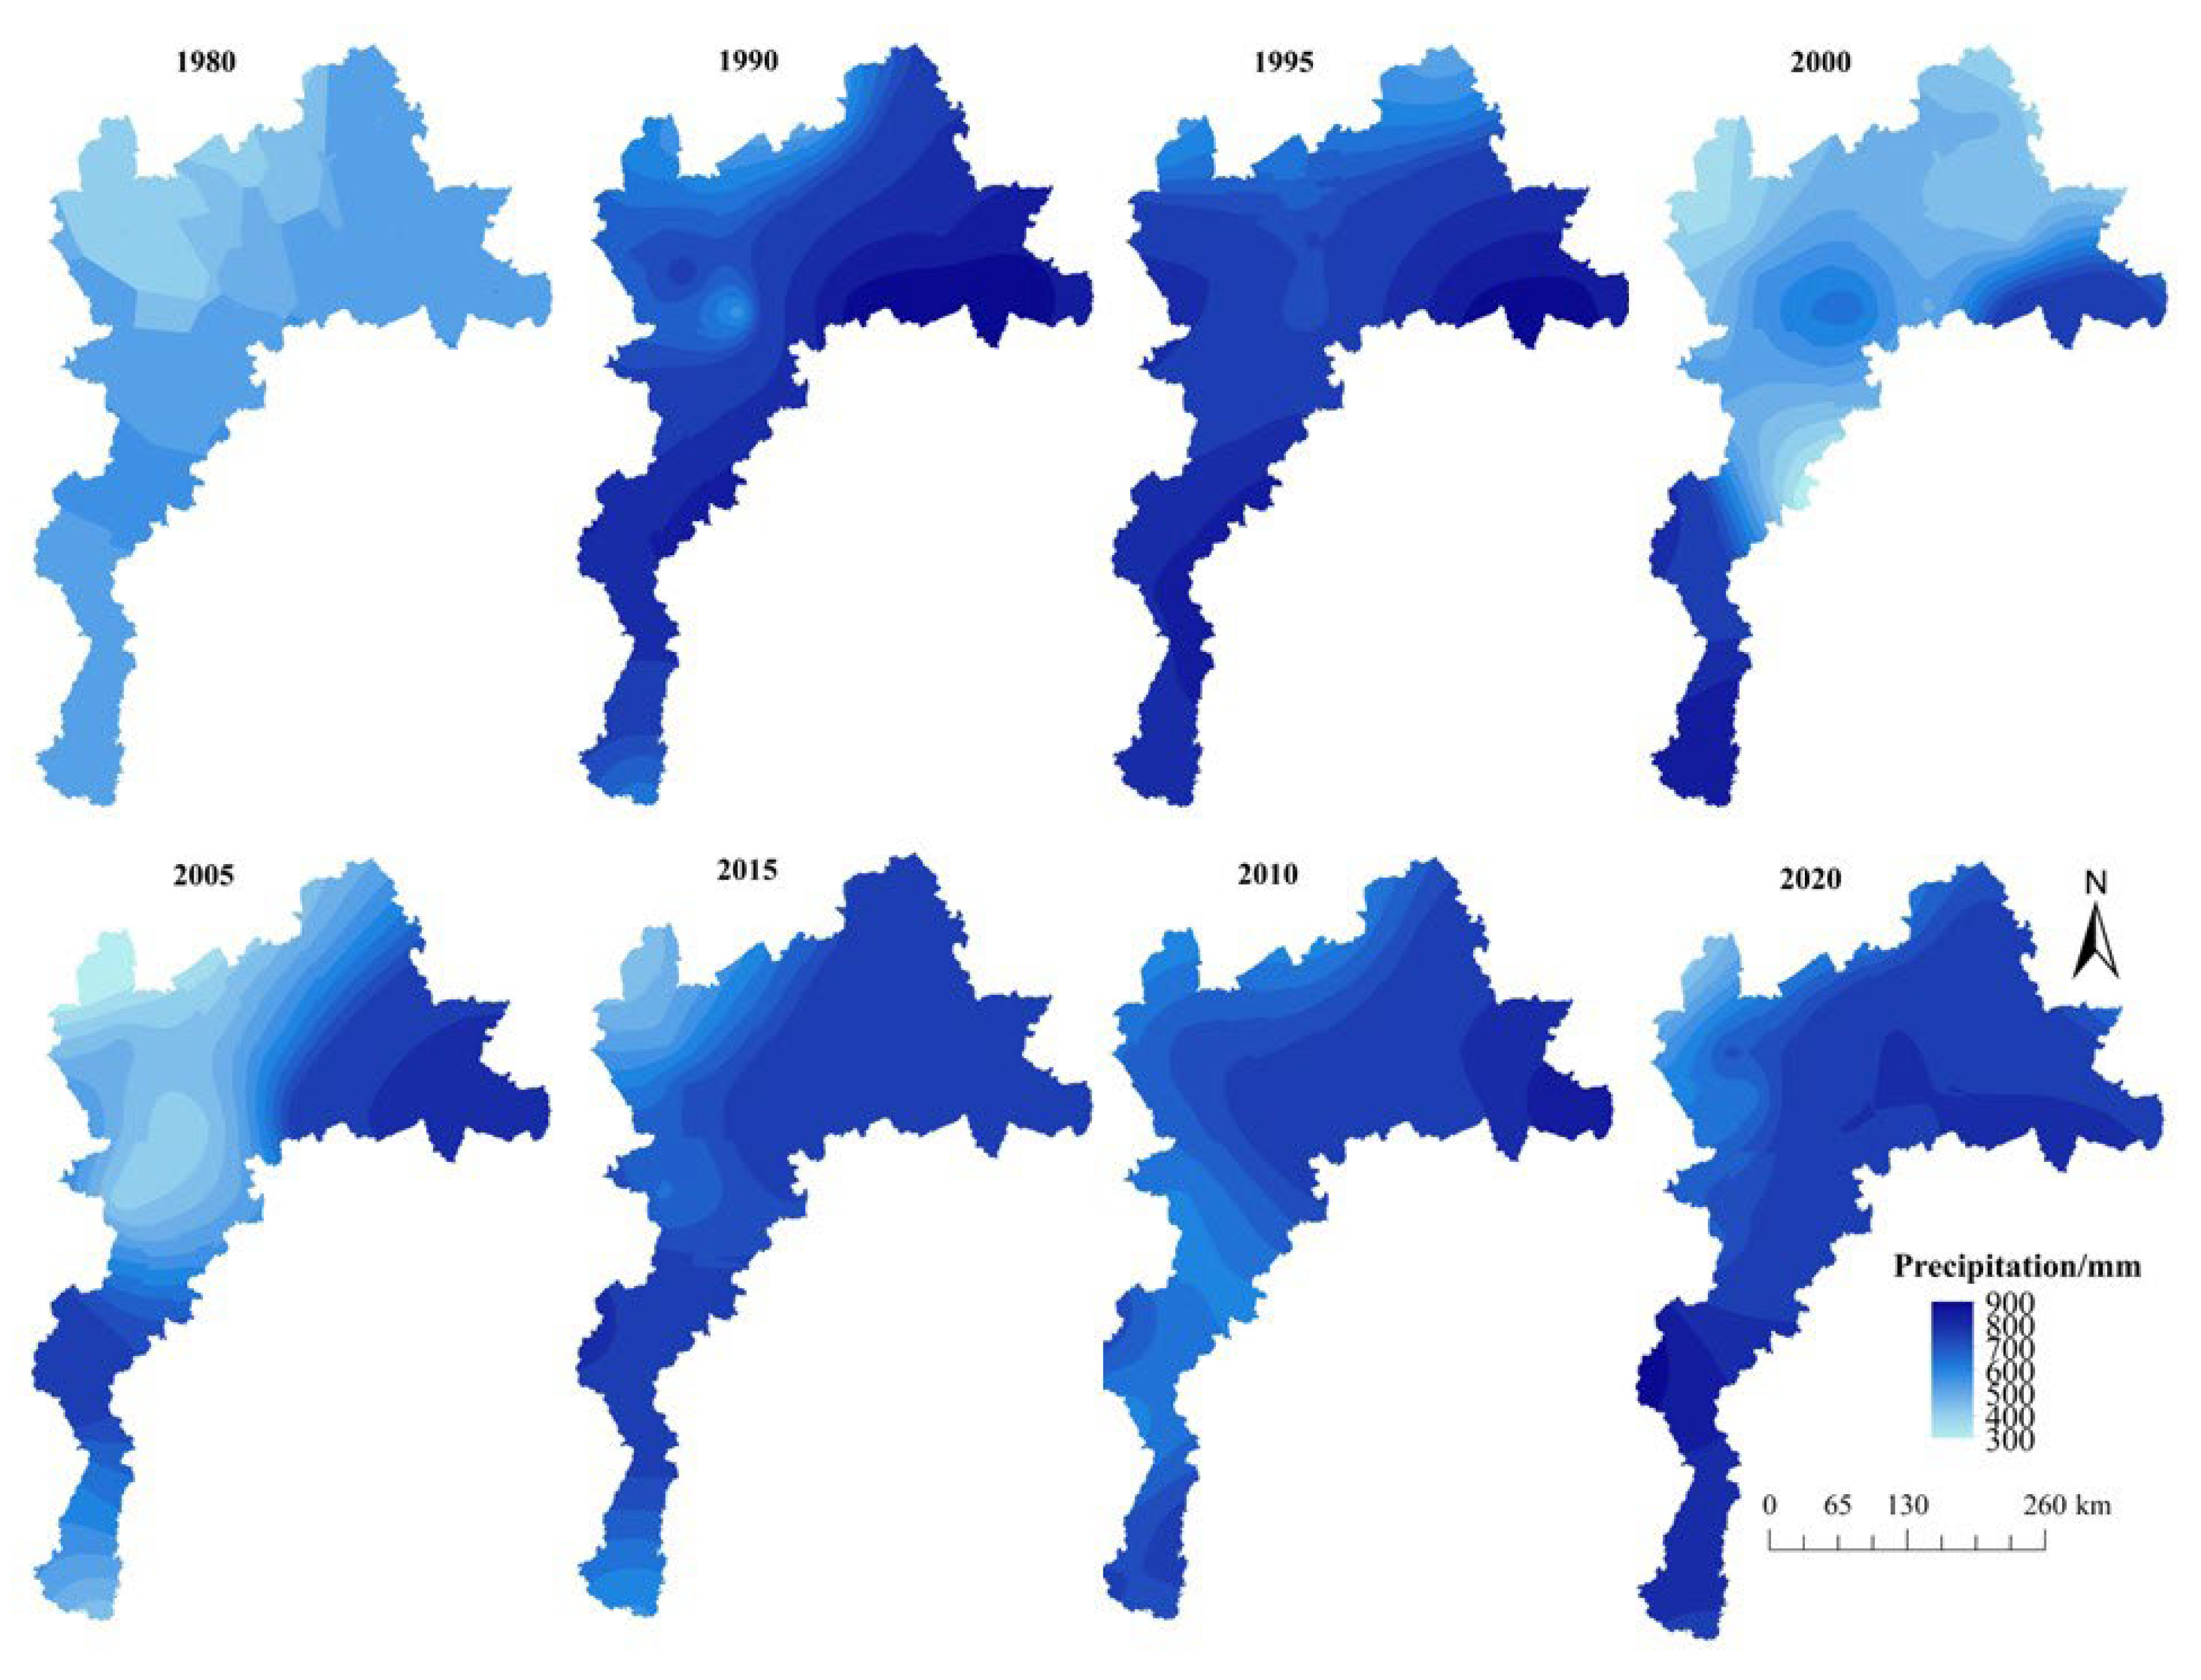
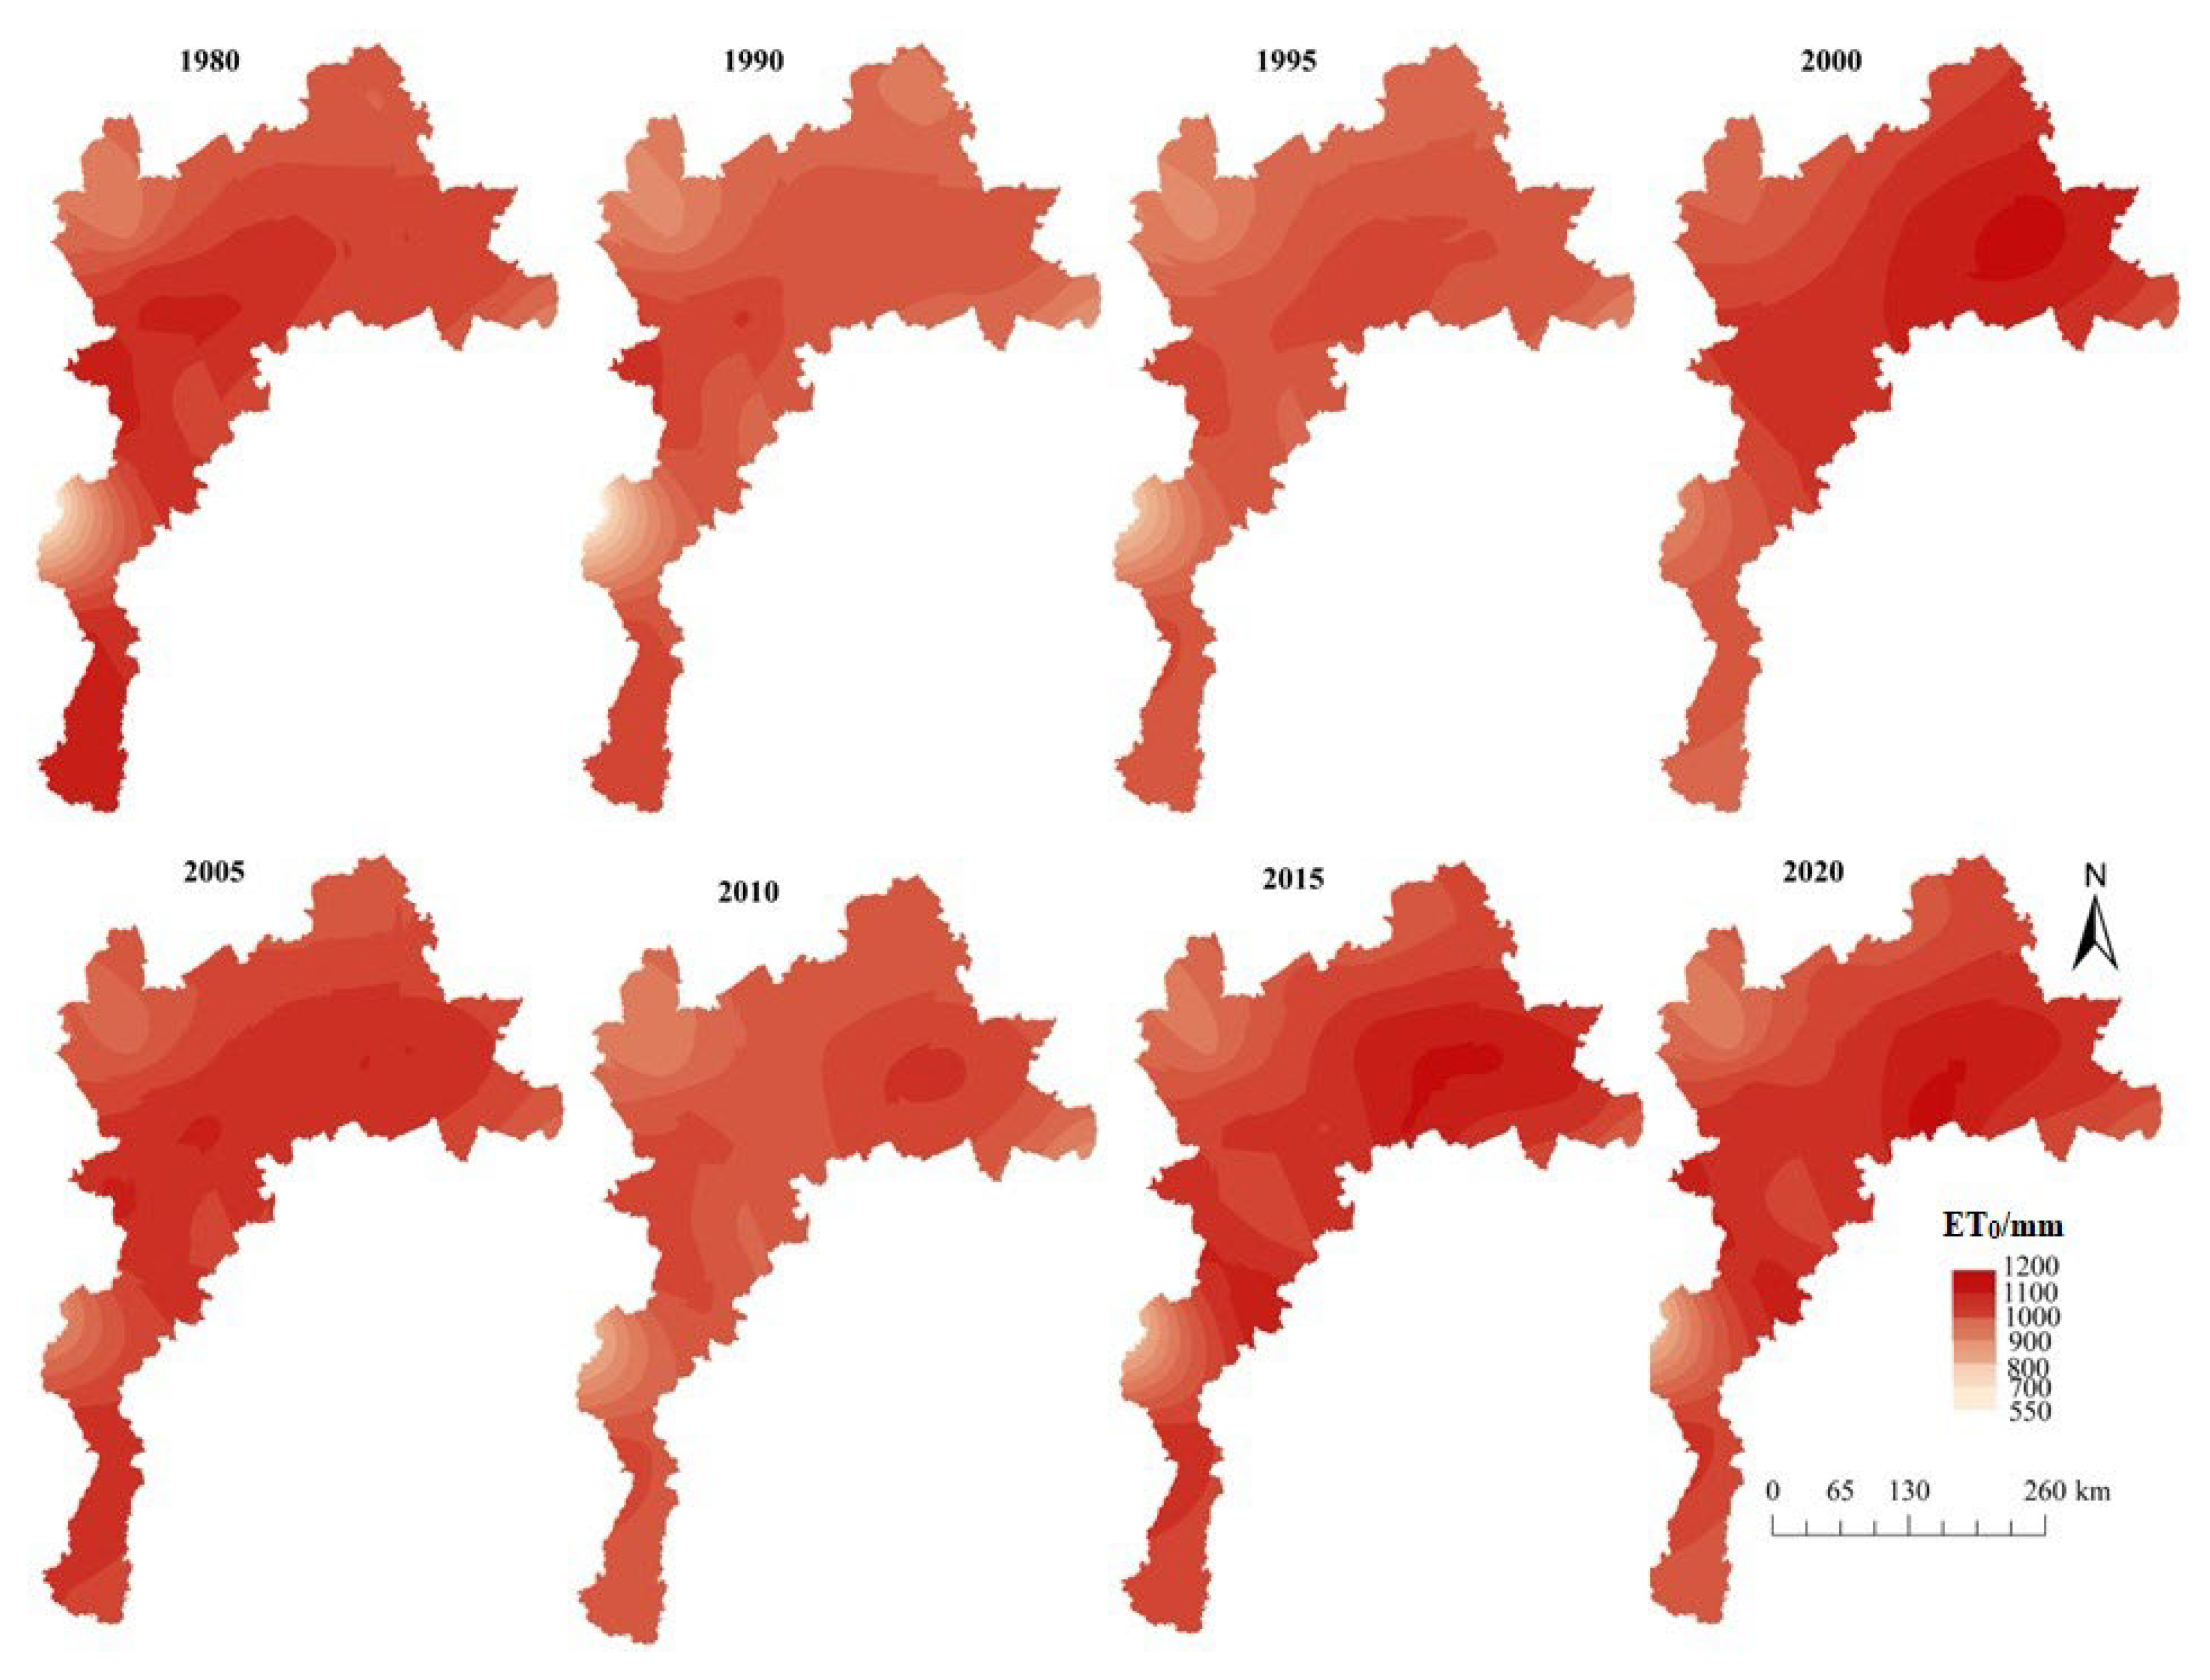
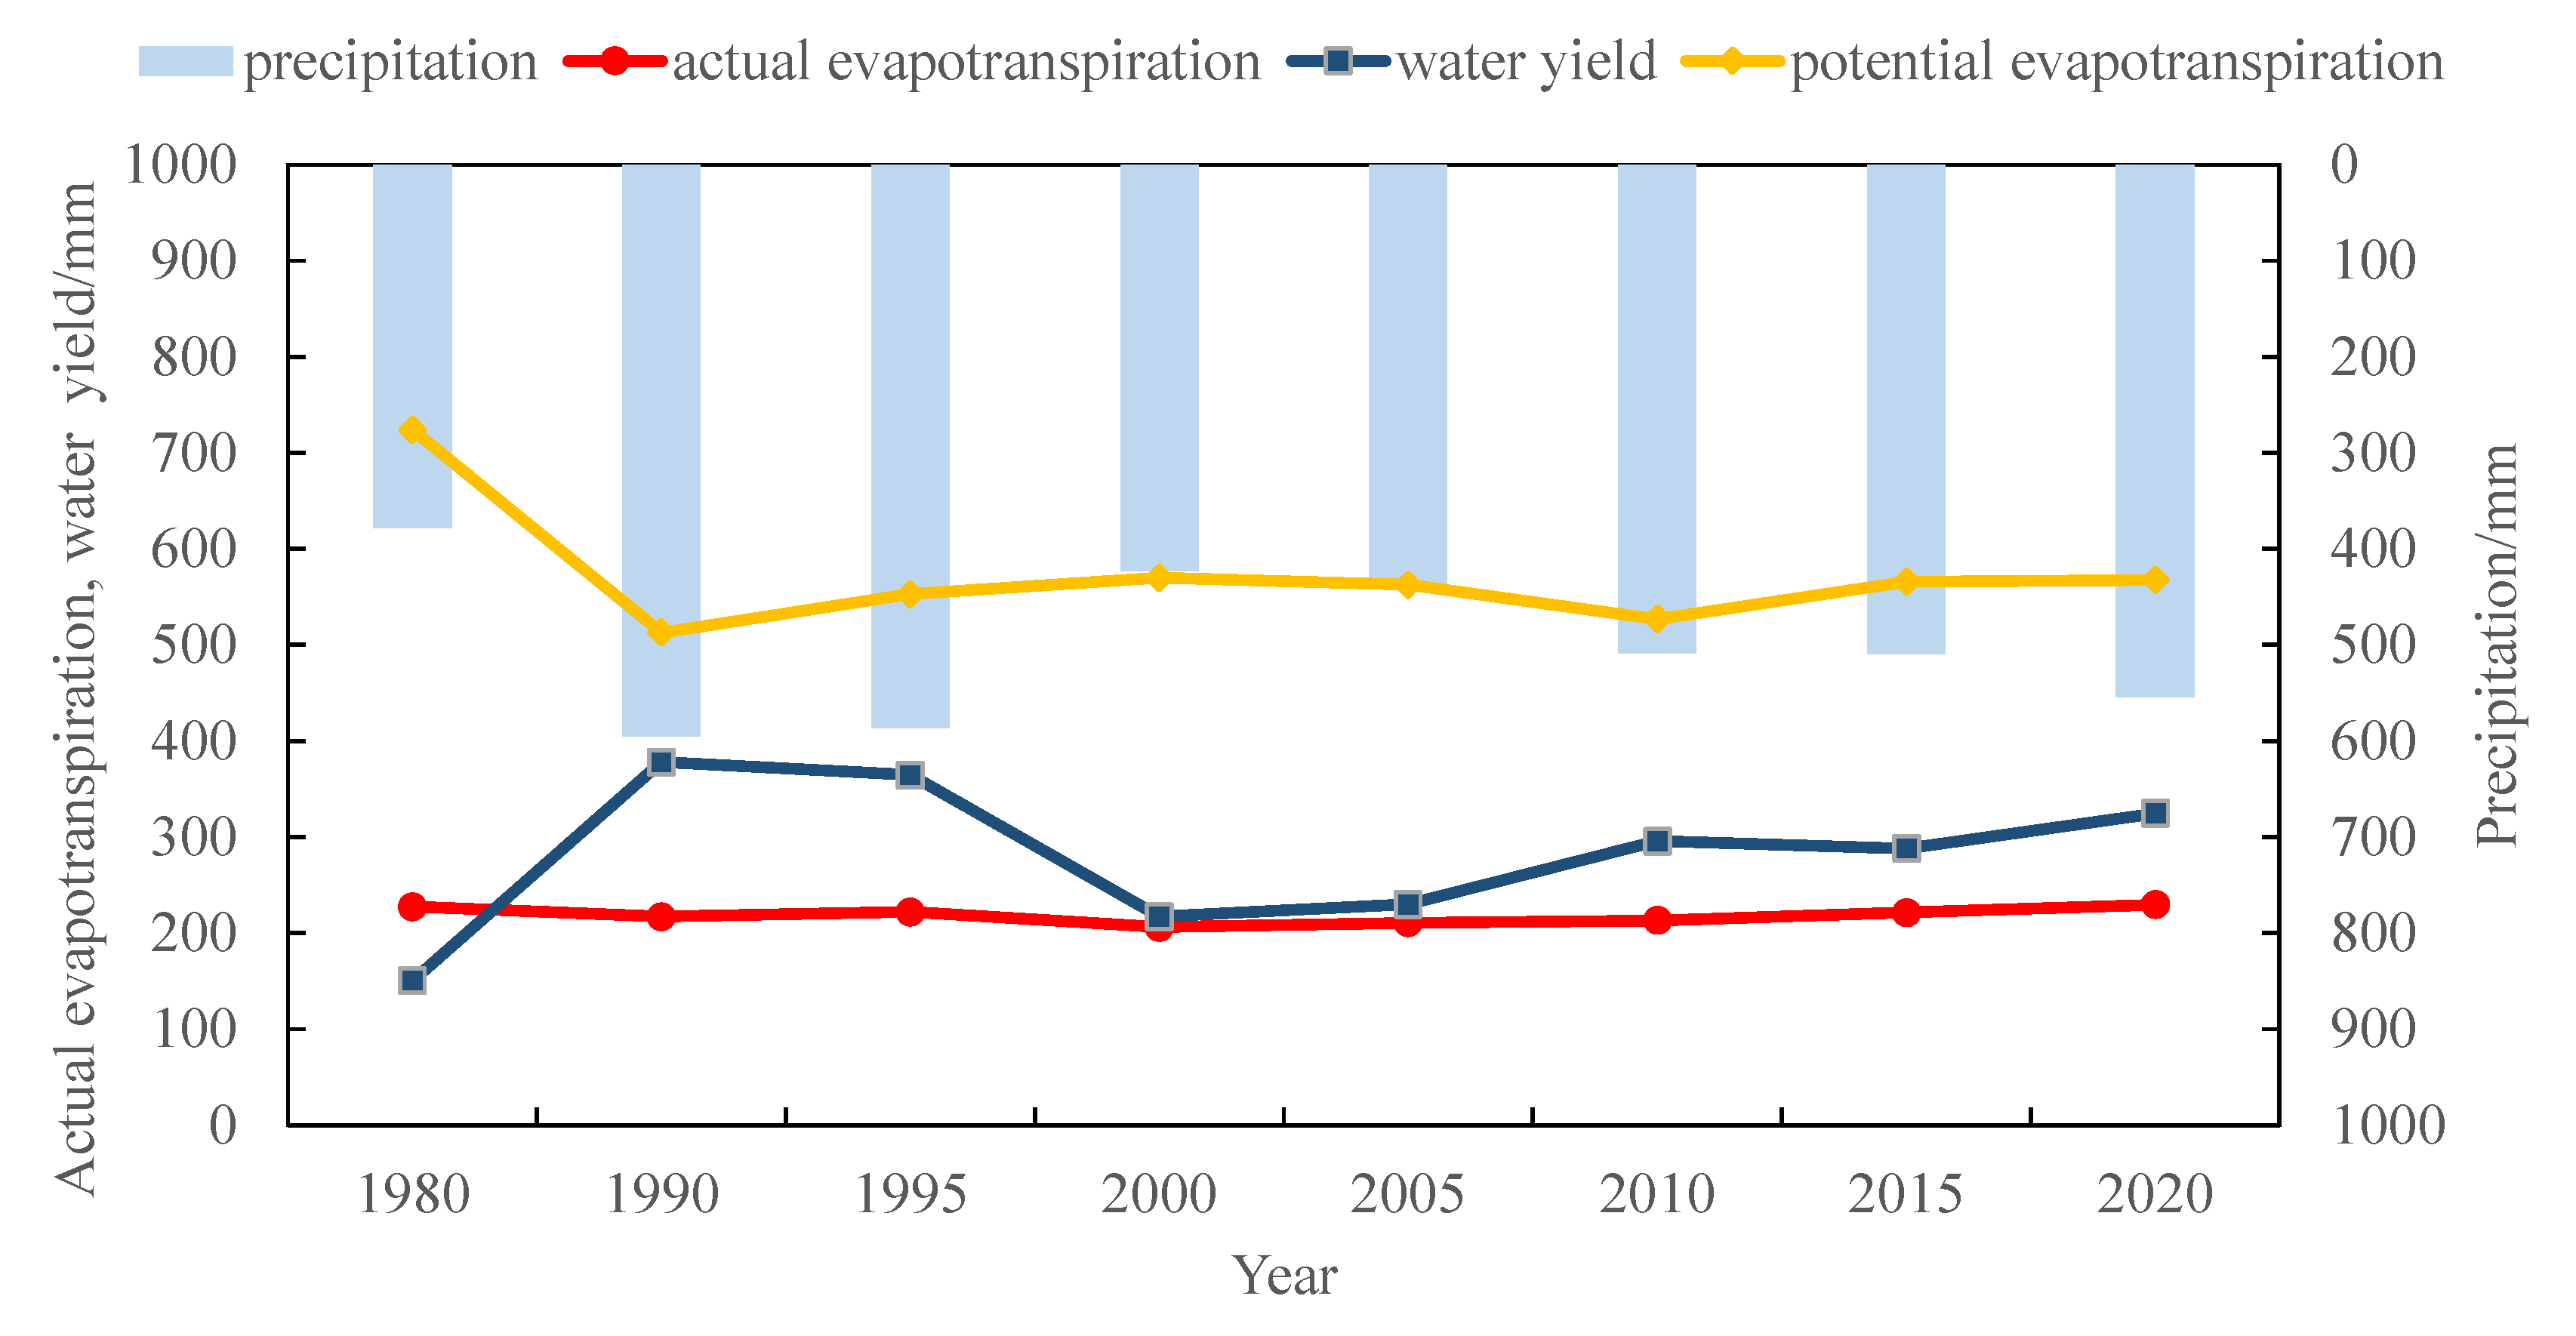
3.1. Spatio-Temporal Variation of Climate Change

Although the interannual precipitation and ET0 in the mountainous area of BTH showed interannual fluctuations, there was a slight increasing trend in 1980, 1990, 1995, 2000, 2005, 2010, 2015, and 2020, especially in the ET0 (Figure 2 and Figure 3). The annual precipitation was lowest in 1980, which was less than 400 mm, followed by 2000 and 2005. The spatial differences of annual precipitation in the study area were large. While the distribution characteristics during the study period basically showed the same, with high values distributed in the northeast, namely, the YSM and the south, that is, the THM, and the lowest precipitation in the northwest, that is, the BSR. However, in the rest of the years with a precipitation greater than 500 mm, the spatial distribution differences are not so obvious. In general, the spatial distribution of precipitation in the study area shows a decrease from southeast to northwest, which is in line with our general understanding.
The potential evapotranspiration showed a clear opposite trend to precipitation. From 1980 to 2020, the high values of ET0 tended to migrate from the central region to the northeastern mountain–plain interface, and of course, the potential evapotranspiration was higher in the south compared with other regions. In contrast, the low value of ET0 appears in the western and northwestern regions in all years. Combined with the spatial distribution of precipitation, it is tentatively inferred that the northwestern region, that is, the BSR, is a dry and low temperature region, and the southern and northeastern regions, that is, the YSM and THM, are hot and humid.

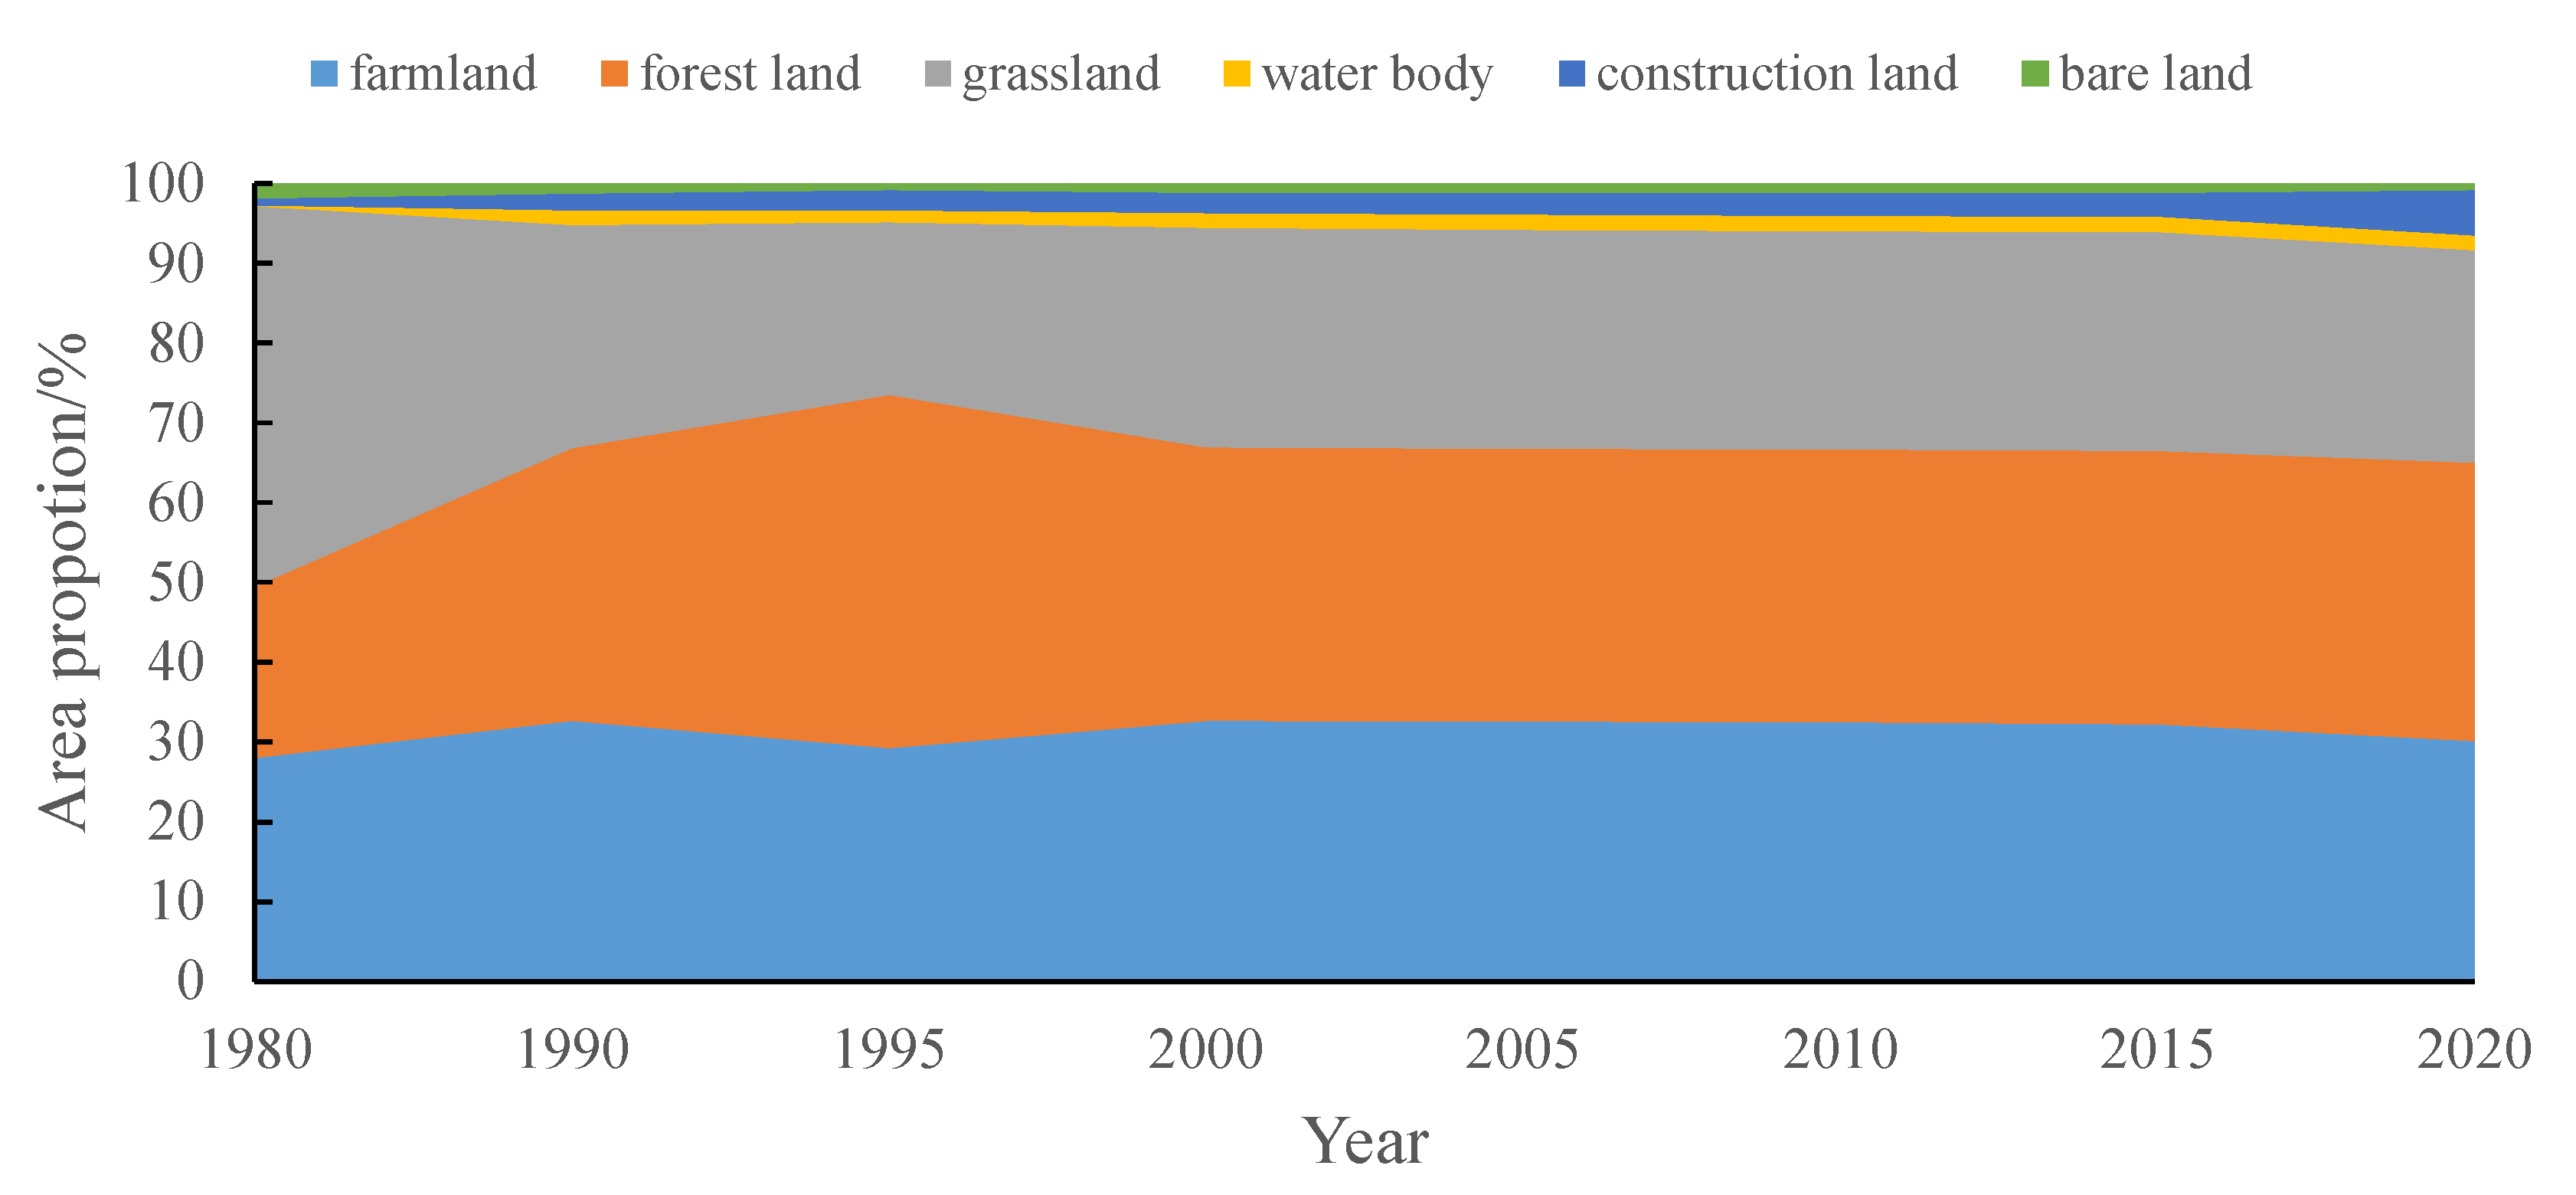
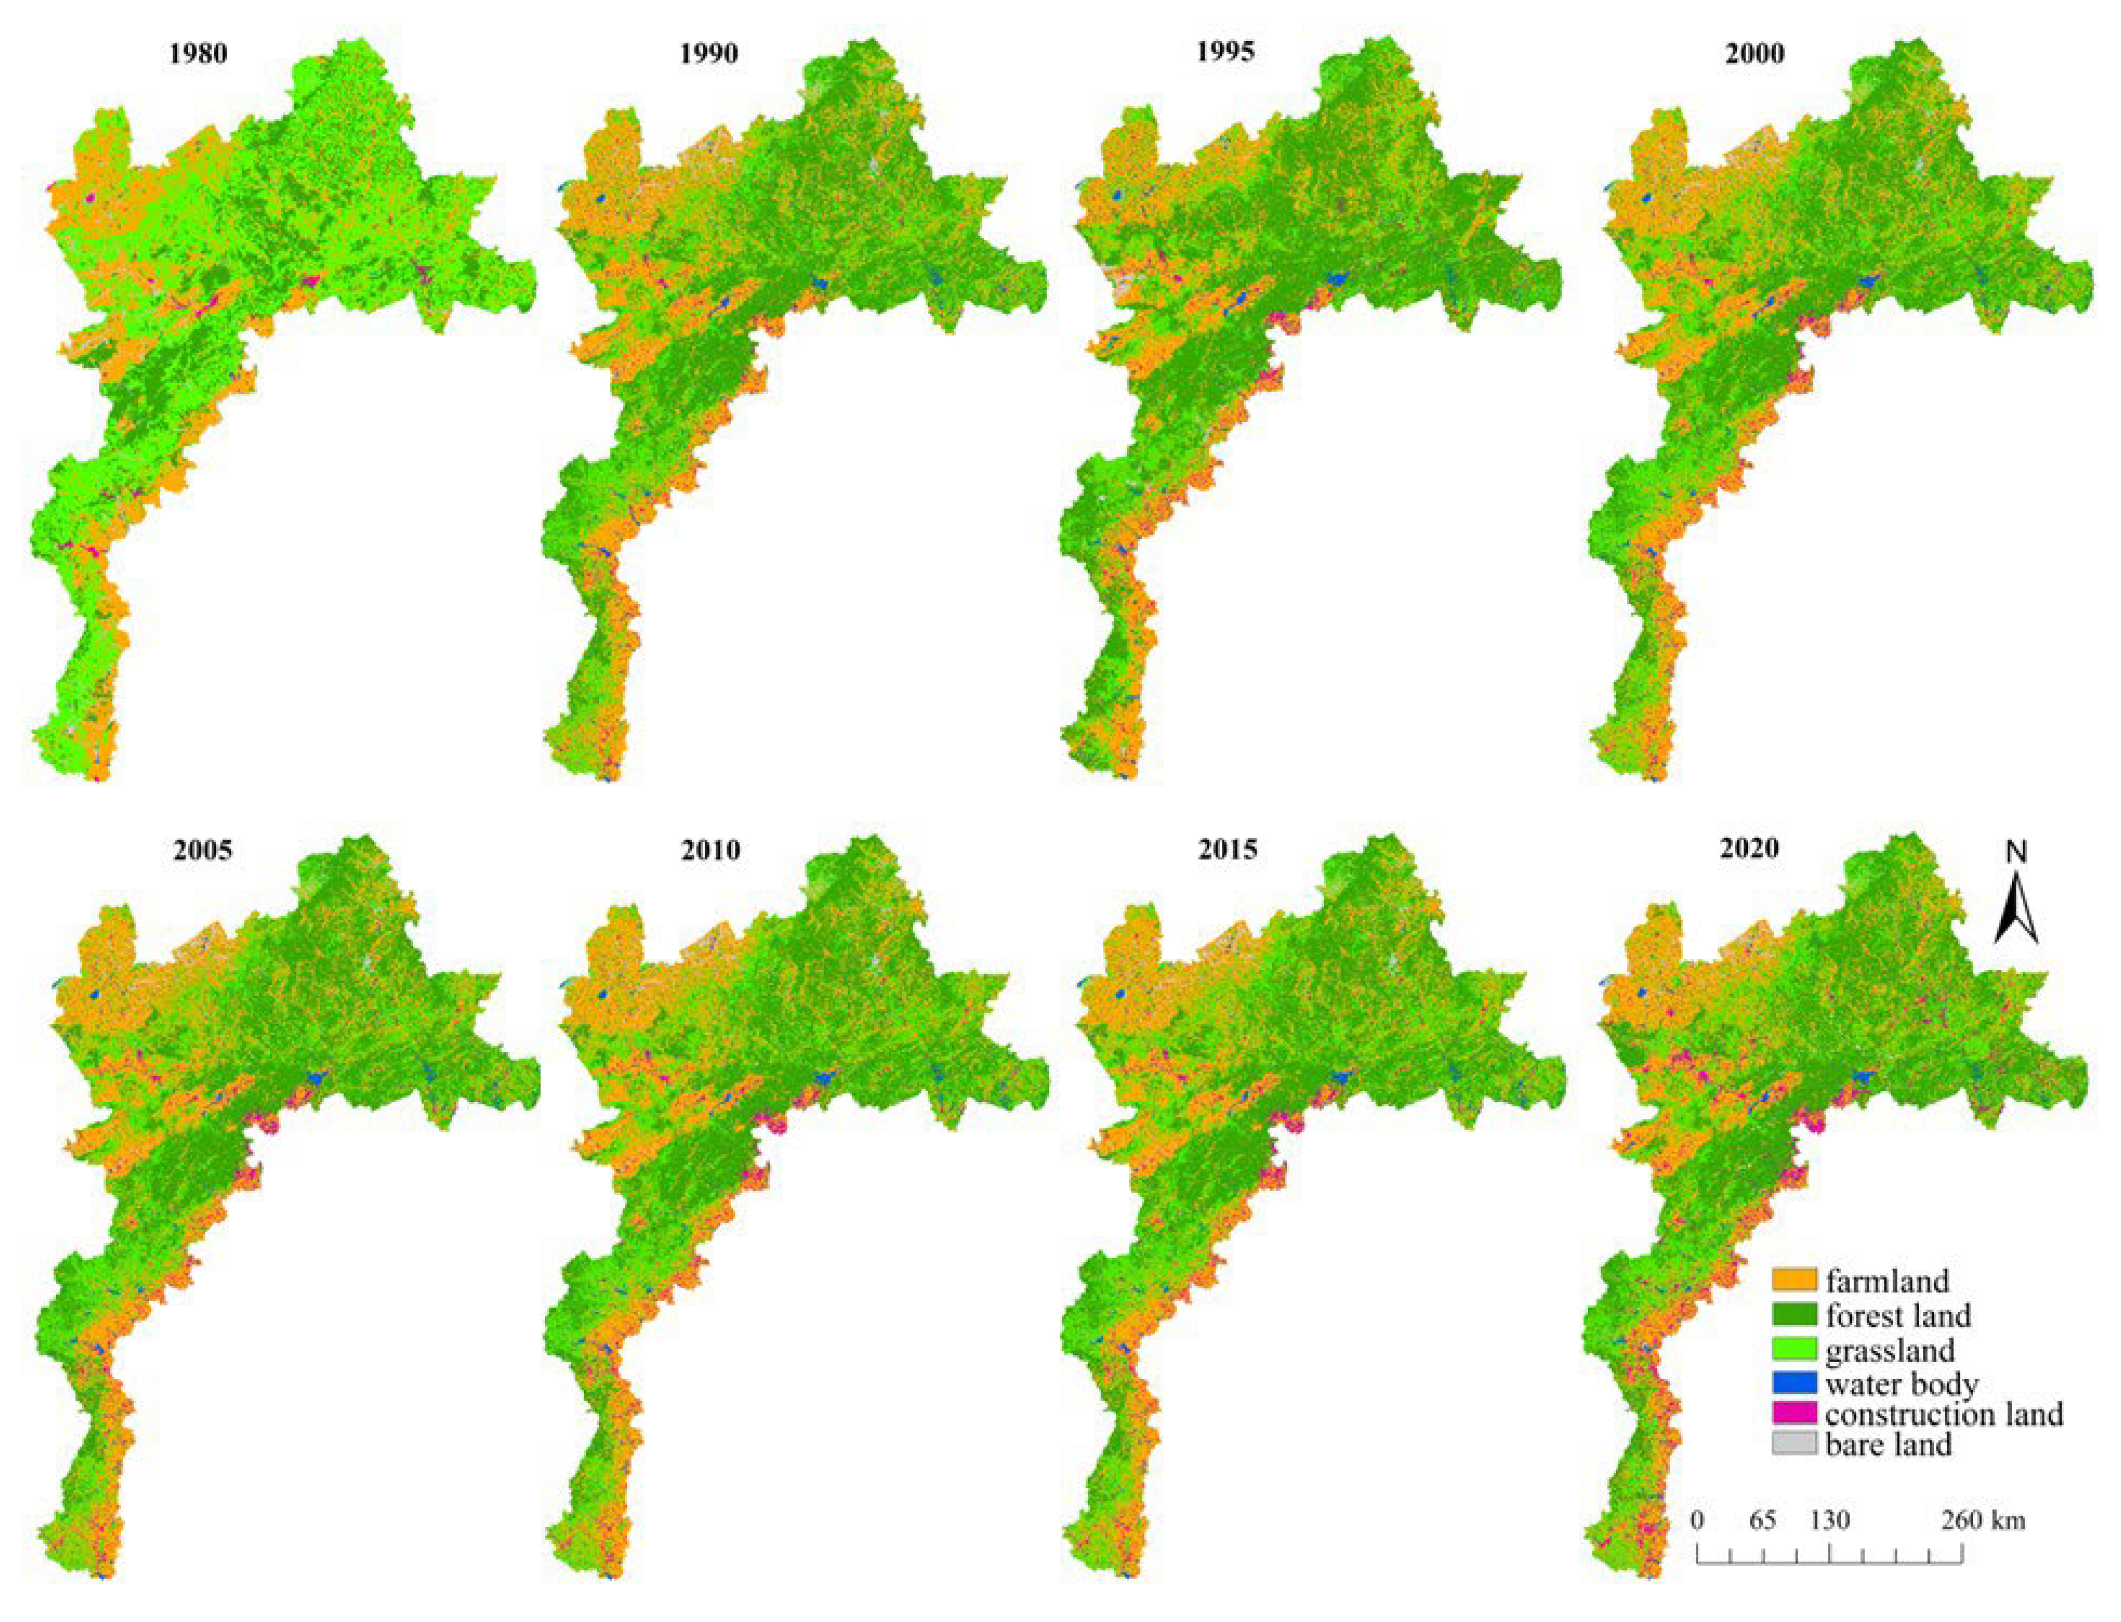
3.2. Spatio-Temporal of Variation Land Use/Land Cover Change

The LULC of the mountainous area in BTH changed mainly before 2000, especially for farmland, forest land, and grassland, which were dominant in the mountainous area of BTH region (Figure 4). In comparison with 1980, in the next seven years, grassland decreased greatly while, during the study period, forest land showed a significant increasing trend.
Farmland was mainly distributed in the BSR and the junction of mountain and plain in the THM, and forest land was mainly distributed in the YSM and the junction of the THM and YSM, showing a trend of conversion of grassland to forest land during 1980 to 2020. Meanwhile, farmland in the junction of mountain and plain in the THM converted into construction land during 1980 to 2020. Since 2000, the spatial distribution of each LULC type changed slightly except the grassland in the BSR changed into forest land (Figure 5). In general, the regional spatial distribution of LULC types varied widely, with forest land dominating in the YSM, accounting for 49.06% of the total area, grassland, and farmland dominating in the THM, and both accounting for a similar proportion of the total area, being about 30%, while for the BSR, farmland dominated, accounting for about 50% of the total area.

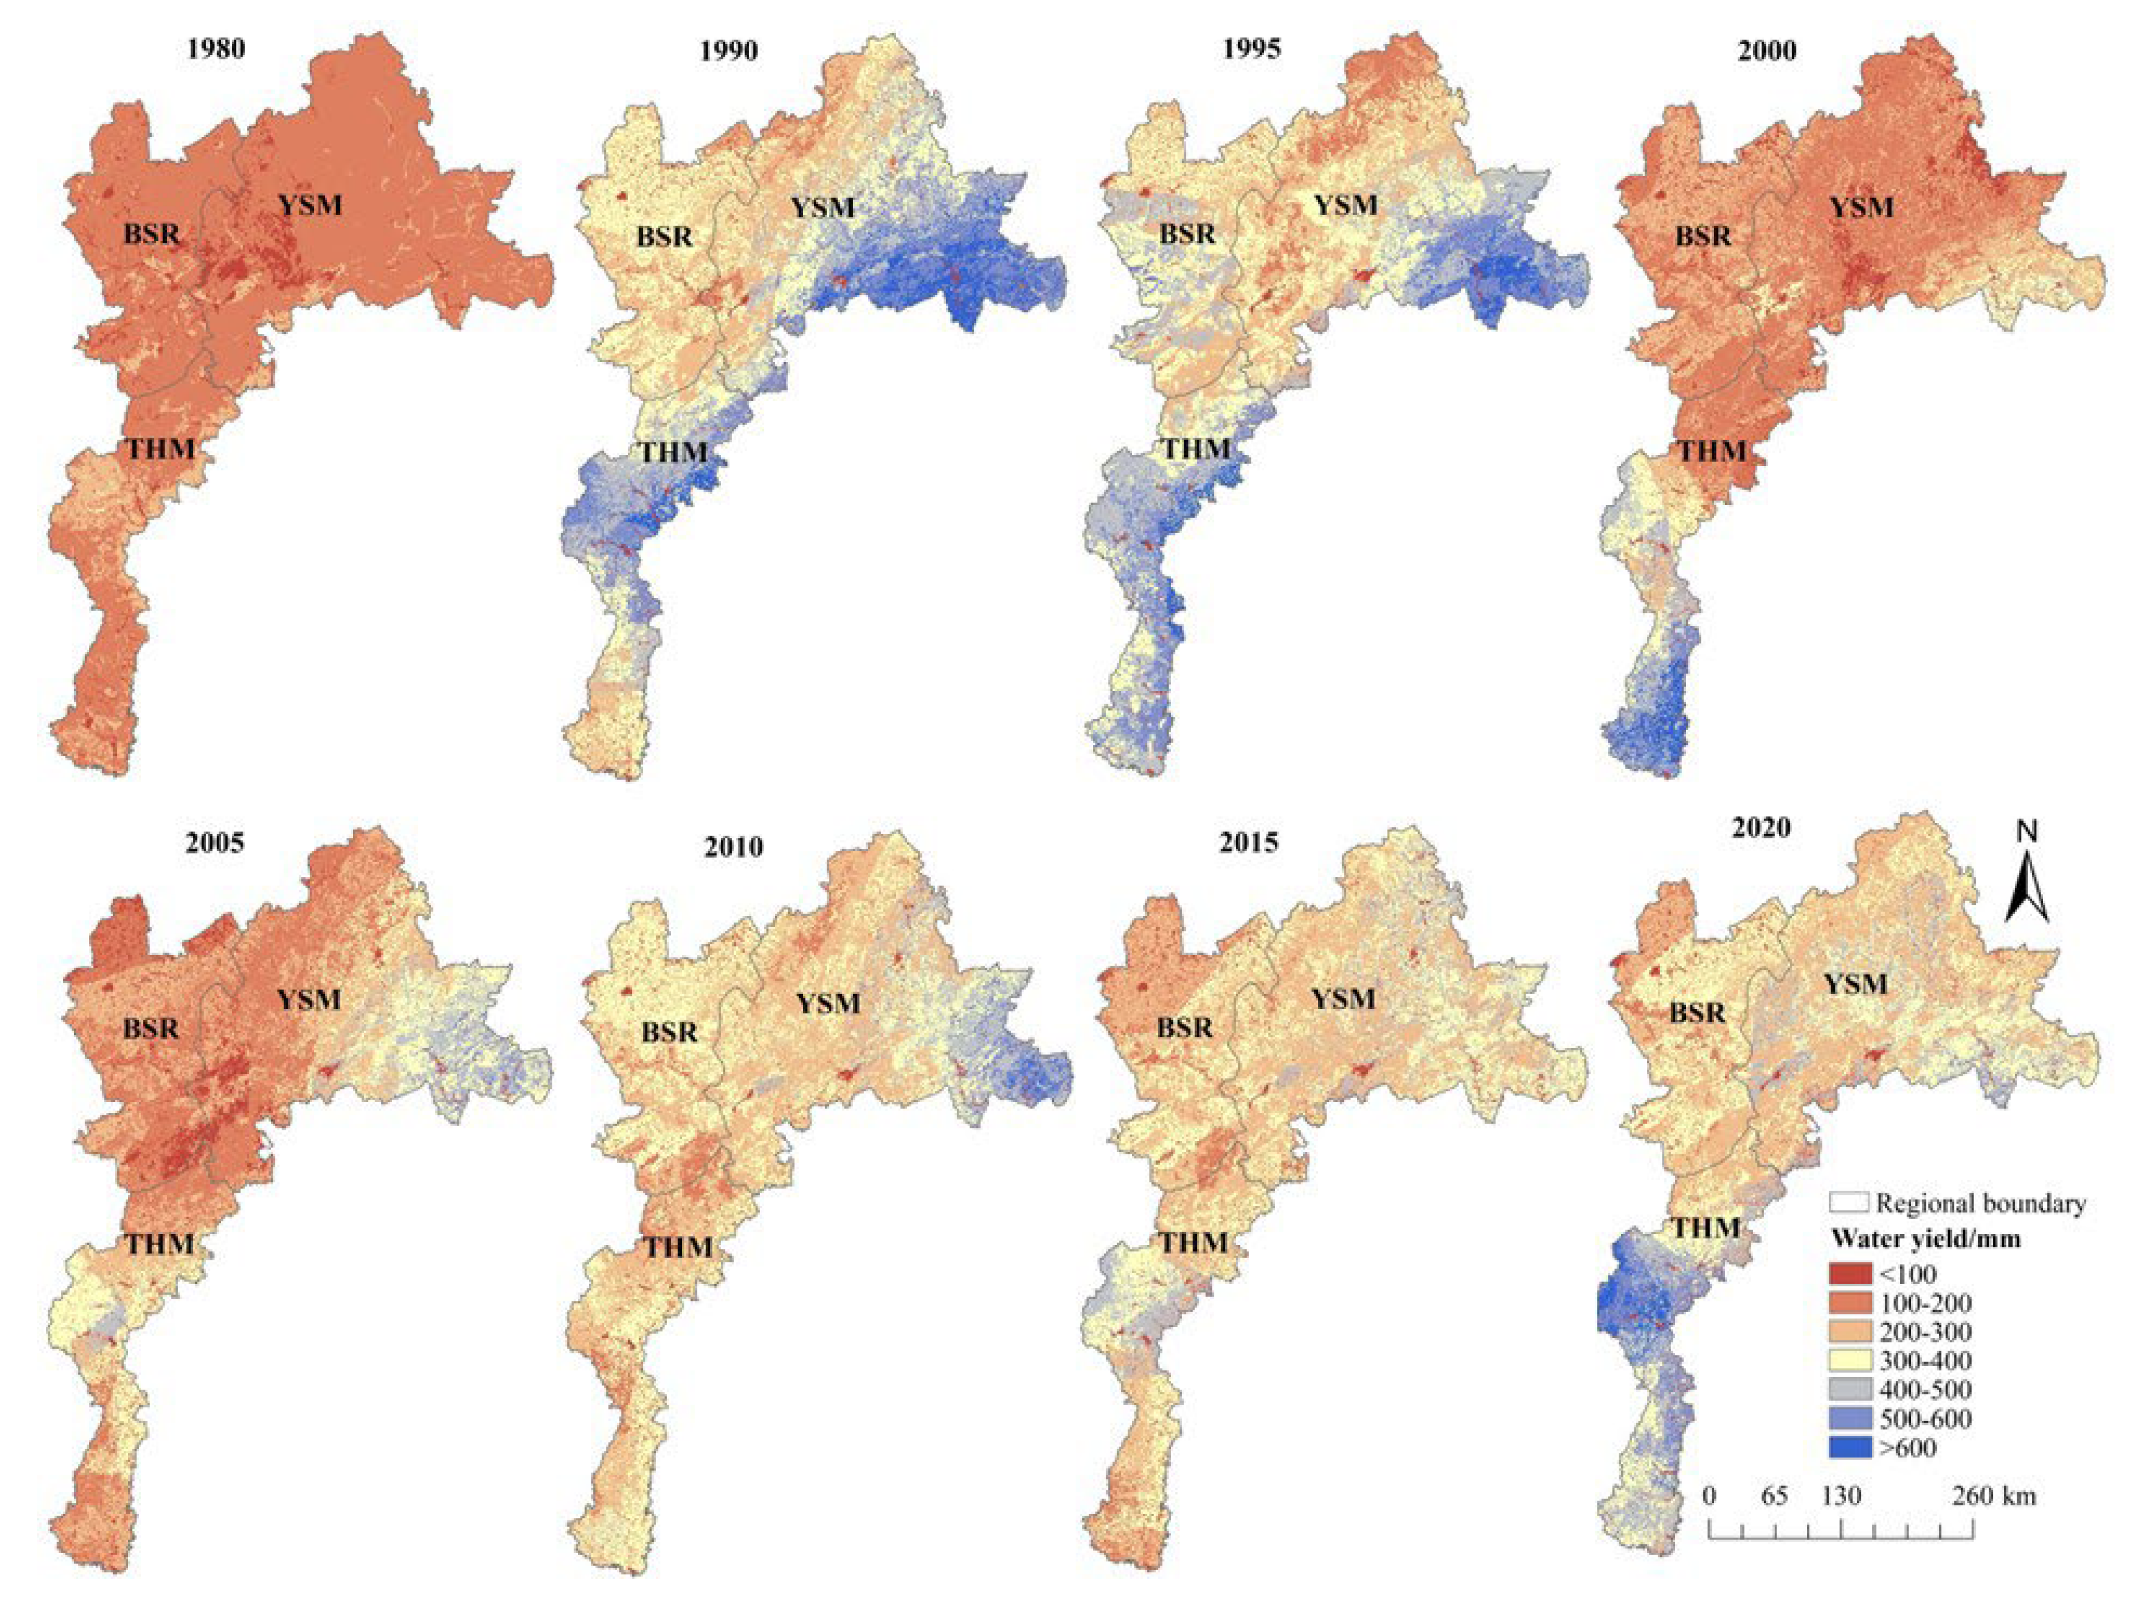
3.3. Spatio-Temporal Change in Water Yield

Based on the calculated output of the model, we obtained the annual precipitation, potential evapotranspiration, water yield, and actual evapotranspiration for the study area (Figure 6). In the study period, the water yield in the mountainous area of BTH was the largest in 1990, at 377.95 mm, and the smallest in 1980, at 150.49 mm. Relatively speaking, after 2000, the interannual water yield showed a slightly increasing trend, which was significantly lower than the water yield in 1990 and the values of water yield from 2000 to 2020 ranged from 217.01 mm to 324.65 mm. The actual evapotranspiration had a small interannual variation, which was basically around 210 mm. Meanwhile, the Pearson correlation analysis of annual precipitation, potential evapotranspiration, and water yield showed that water yield was significantly positively correlated with precipitation at p = 0.01 level with a correlation coefficient of 0.99, and negatively correlated with potential evapotranspiration at p = 0.05 level with a correlation coefficient of −0.78. Thus, it seems that the variation of water yield is very closely related to climate change factors.
Further, we plotted the spatial distribution of water yield in the eight years during 1980–2020 (Figure 7). During the study period, the spatial distribution of water yield was similar over the years, with high values in the south-central THM and the northeastern YSM, while the higher water yield in the northeastern YSM was most evident in 1990 and 1995, when precipitation was higher, and began to decrease in the northeastern YSM after 2010. The area of low water yield was mainly located at the junction of central YSM and BSR, but, after 2010, this area showed a shift toward the southwestern junction of BSR and TSM.
The THM was the main water yield area accounting for 30.77–47.69% of the total water yield of the mountainous area in BTH during the study period, followed by the YSM, which accounted for approximately 30% of the total water yield of the study area. For the water yield of the BSR, it accounted for about 25% of the total water yield of the study area (Table 3). The water yield in those three regions increased linearly before 2000. After 2000, the water yield changed quadratically, in the THM, the water yield decreased first and then increased, while the water yield in the YSM and BSR increased first and then decreased, and the turning point was 2010.

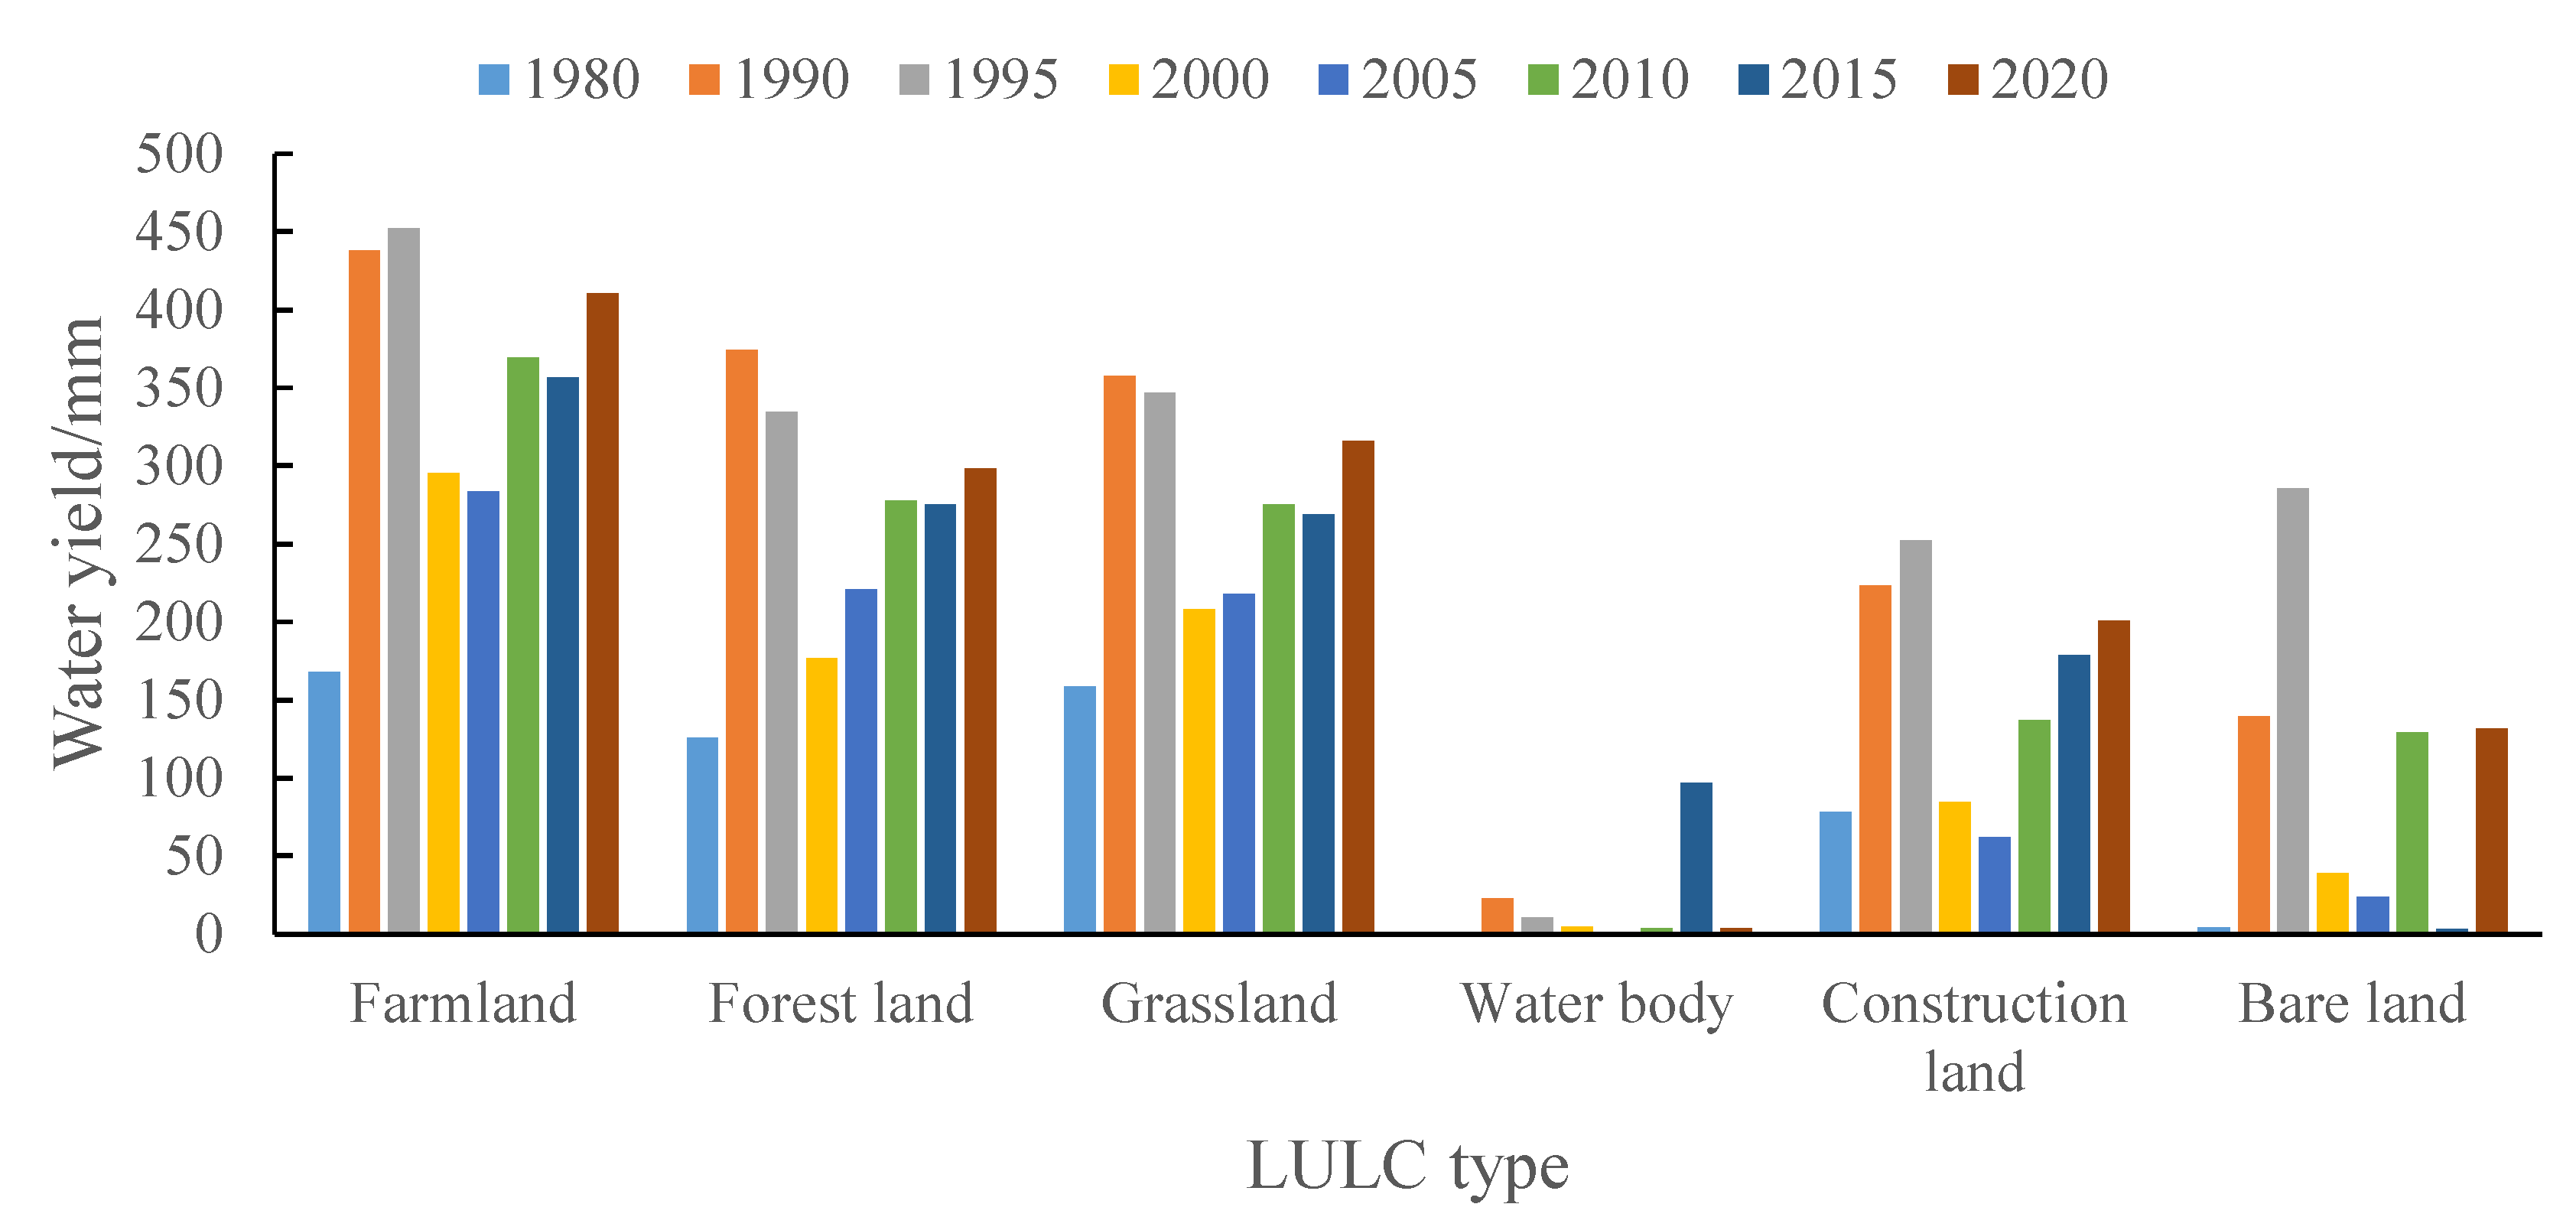
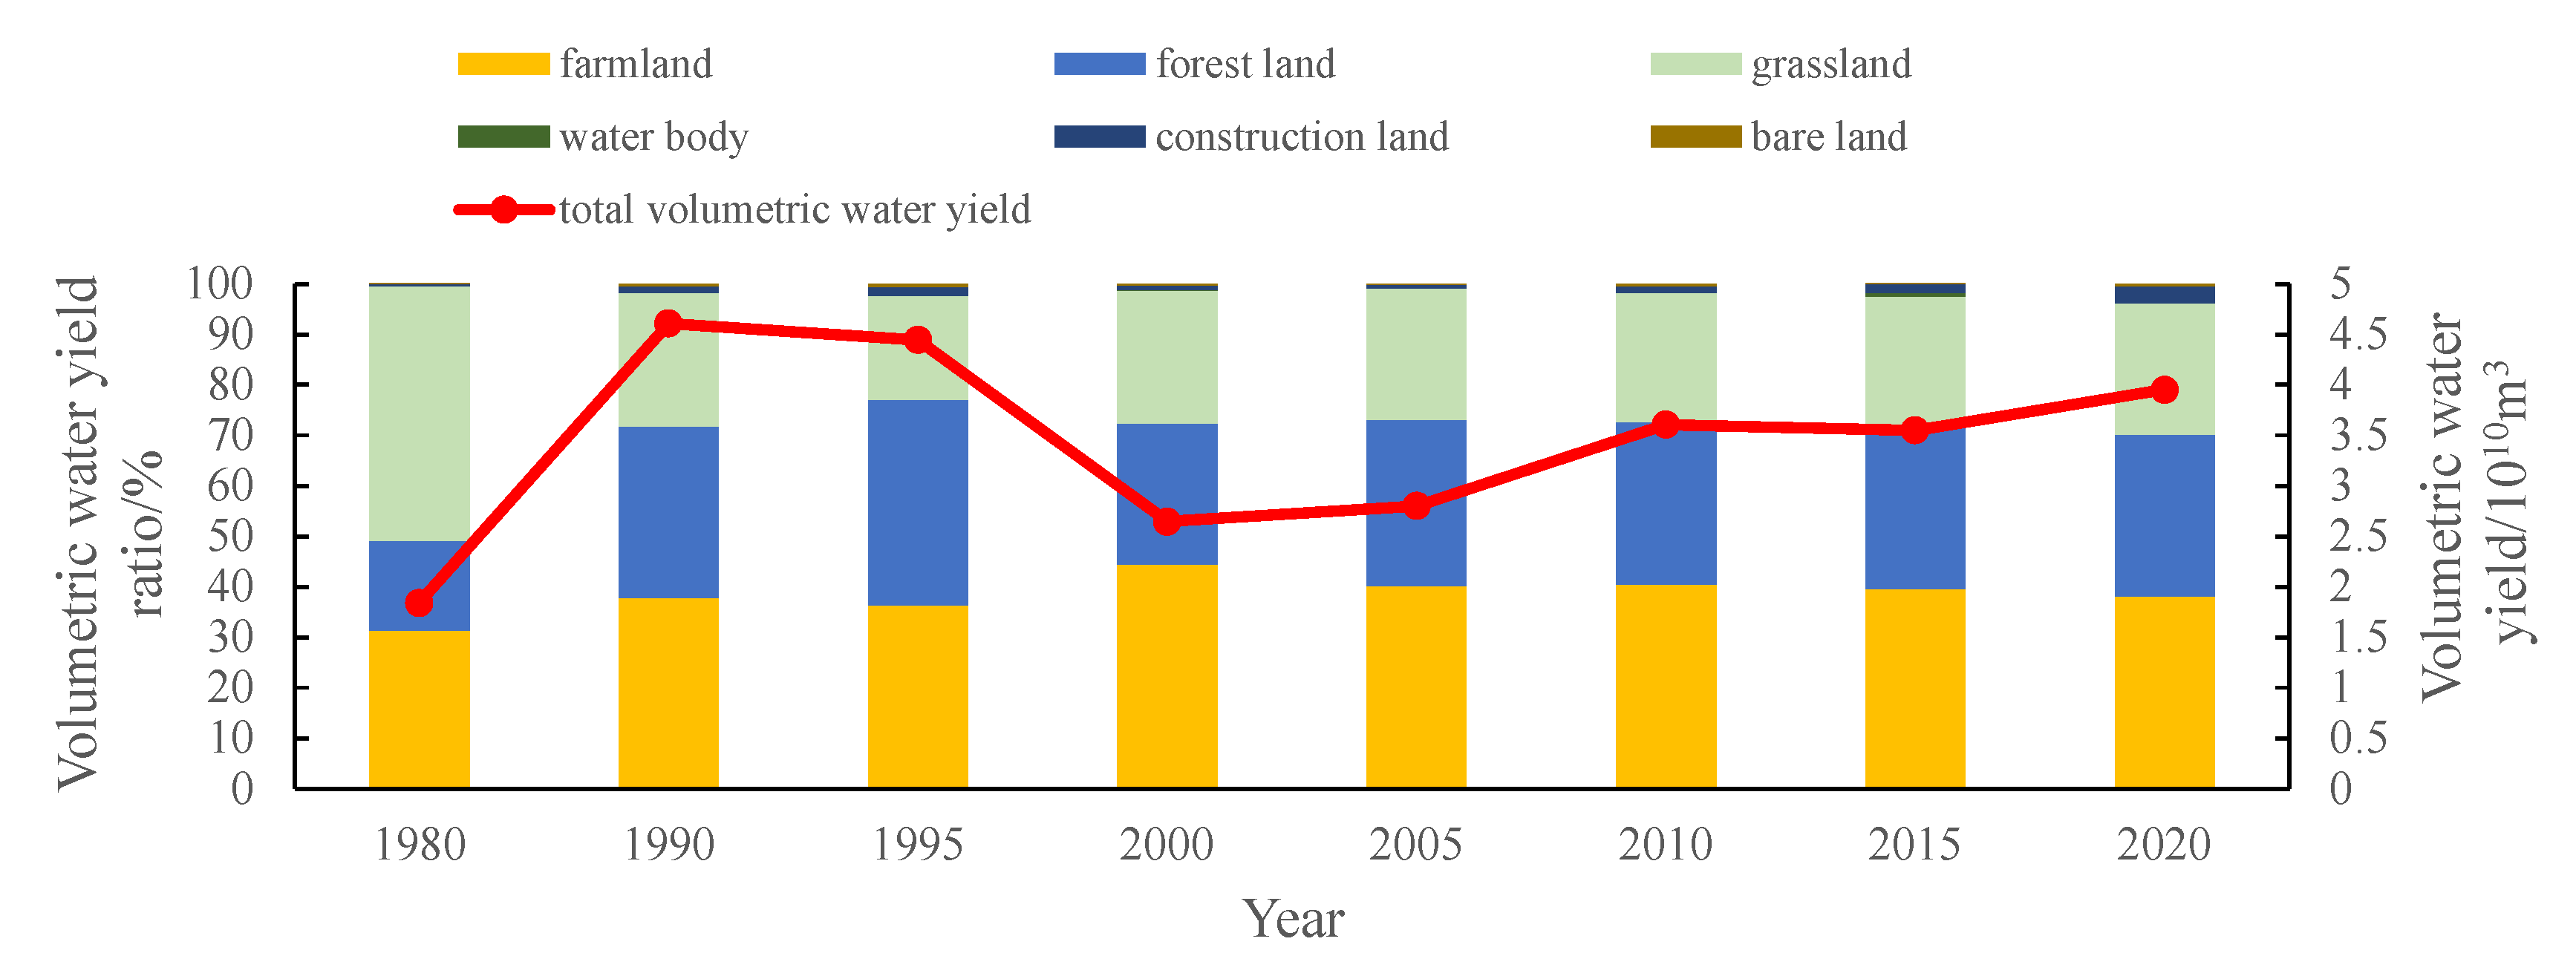
3.4. Water Yield of Different Land Use/Land Cover

Further, we zoned the water yield of the different LULC types for the eight years of the study period (Figure 8). The LULC type with the highest annual water yield was farmland in 1995 at 452.66 mm, followed by forest land in 1990 at 374.17 mm, and grassland in 1990 at 367.63 mm from 1980 to 2020. The water yield of these three LULC types, including farmland, forest land, and grassland, also showed cyclical changes, dividing into two stages of change before and after 2000, both showing an increasing trend, although the increase after 2000 was less than that before 2000. The water yield of the other three LULC types showed fluctuating changes with large interannual differences during the study period. Among them, the annual water yield of water body was the lowest, ranging from 0 to 96.67 mm, with a multi-year average of 17.82 mm.
We converted the depth of water yield into the volume of water yield to show that the volumetric water yield of the mountainous area in BTH was at a maximum in 1990, at 4.61 × 10¹⁰ m3, followed by 4.45 × 10¹⁰ m3 in 1995 (Figure 9). The volumetric water yield after 2000 was lower than that of 1990 and 1995, but showed an increasing trend. The volumetric water yield in 2020 was 3.95 × 10¹⁰ m3, increasing by 1.84 × 10¹⁰ m3 in 1980 and 2.65 × 10¹⁰ m3 in 2000. The trends in the proportion of volumetric water yield for forest land, grassland, and farmland also differed from the depth of water yield. Although the depth of water yield was highest in farmland in 1995, the proportion of volumetric water yield was the largest in forest land, at 40.65%. At the same time, comparing the proportion of volumetric water yield of forest land, grassland, and farmland in 1980, 2000, and 2020, it can be seen that although the proportion of volumetric water yield of farmland was still the highest in 2020, at 38.15%, which was greater than 31.32% in 1980, but lower than 44.45% in 2000. The proportion of volumetric water yield of grassland decreased even more, from 50.24% in 1980 to 26.43% in 2000 and 25.95% in 2020, respectively. The proportion of volumetric water yield of forest land, on the other hand, showed an increasing trend, from 17.93% in 1980 to 27.89% in 2000 and 32.04% in 2020. As for the other three LULC types, the proportions of volumetric water yield were below 5% or less, and they did not change much over the study period.

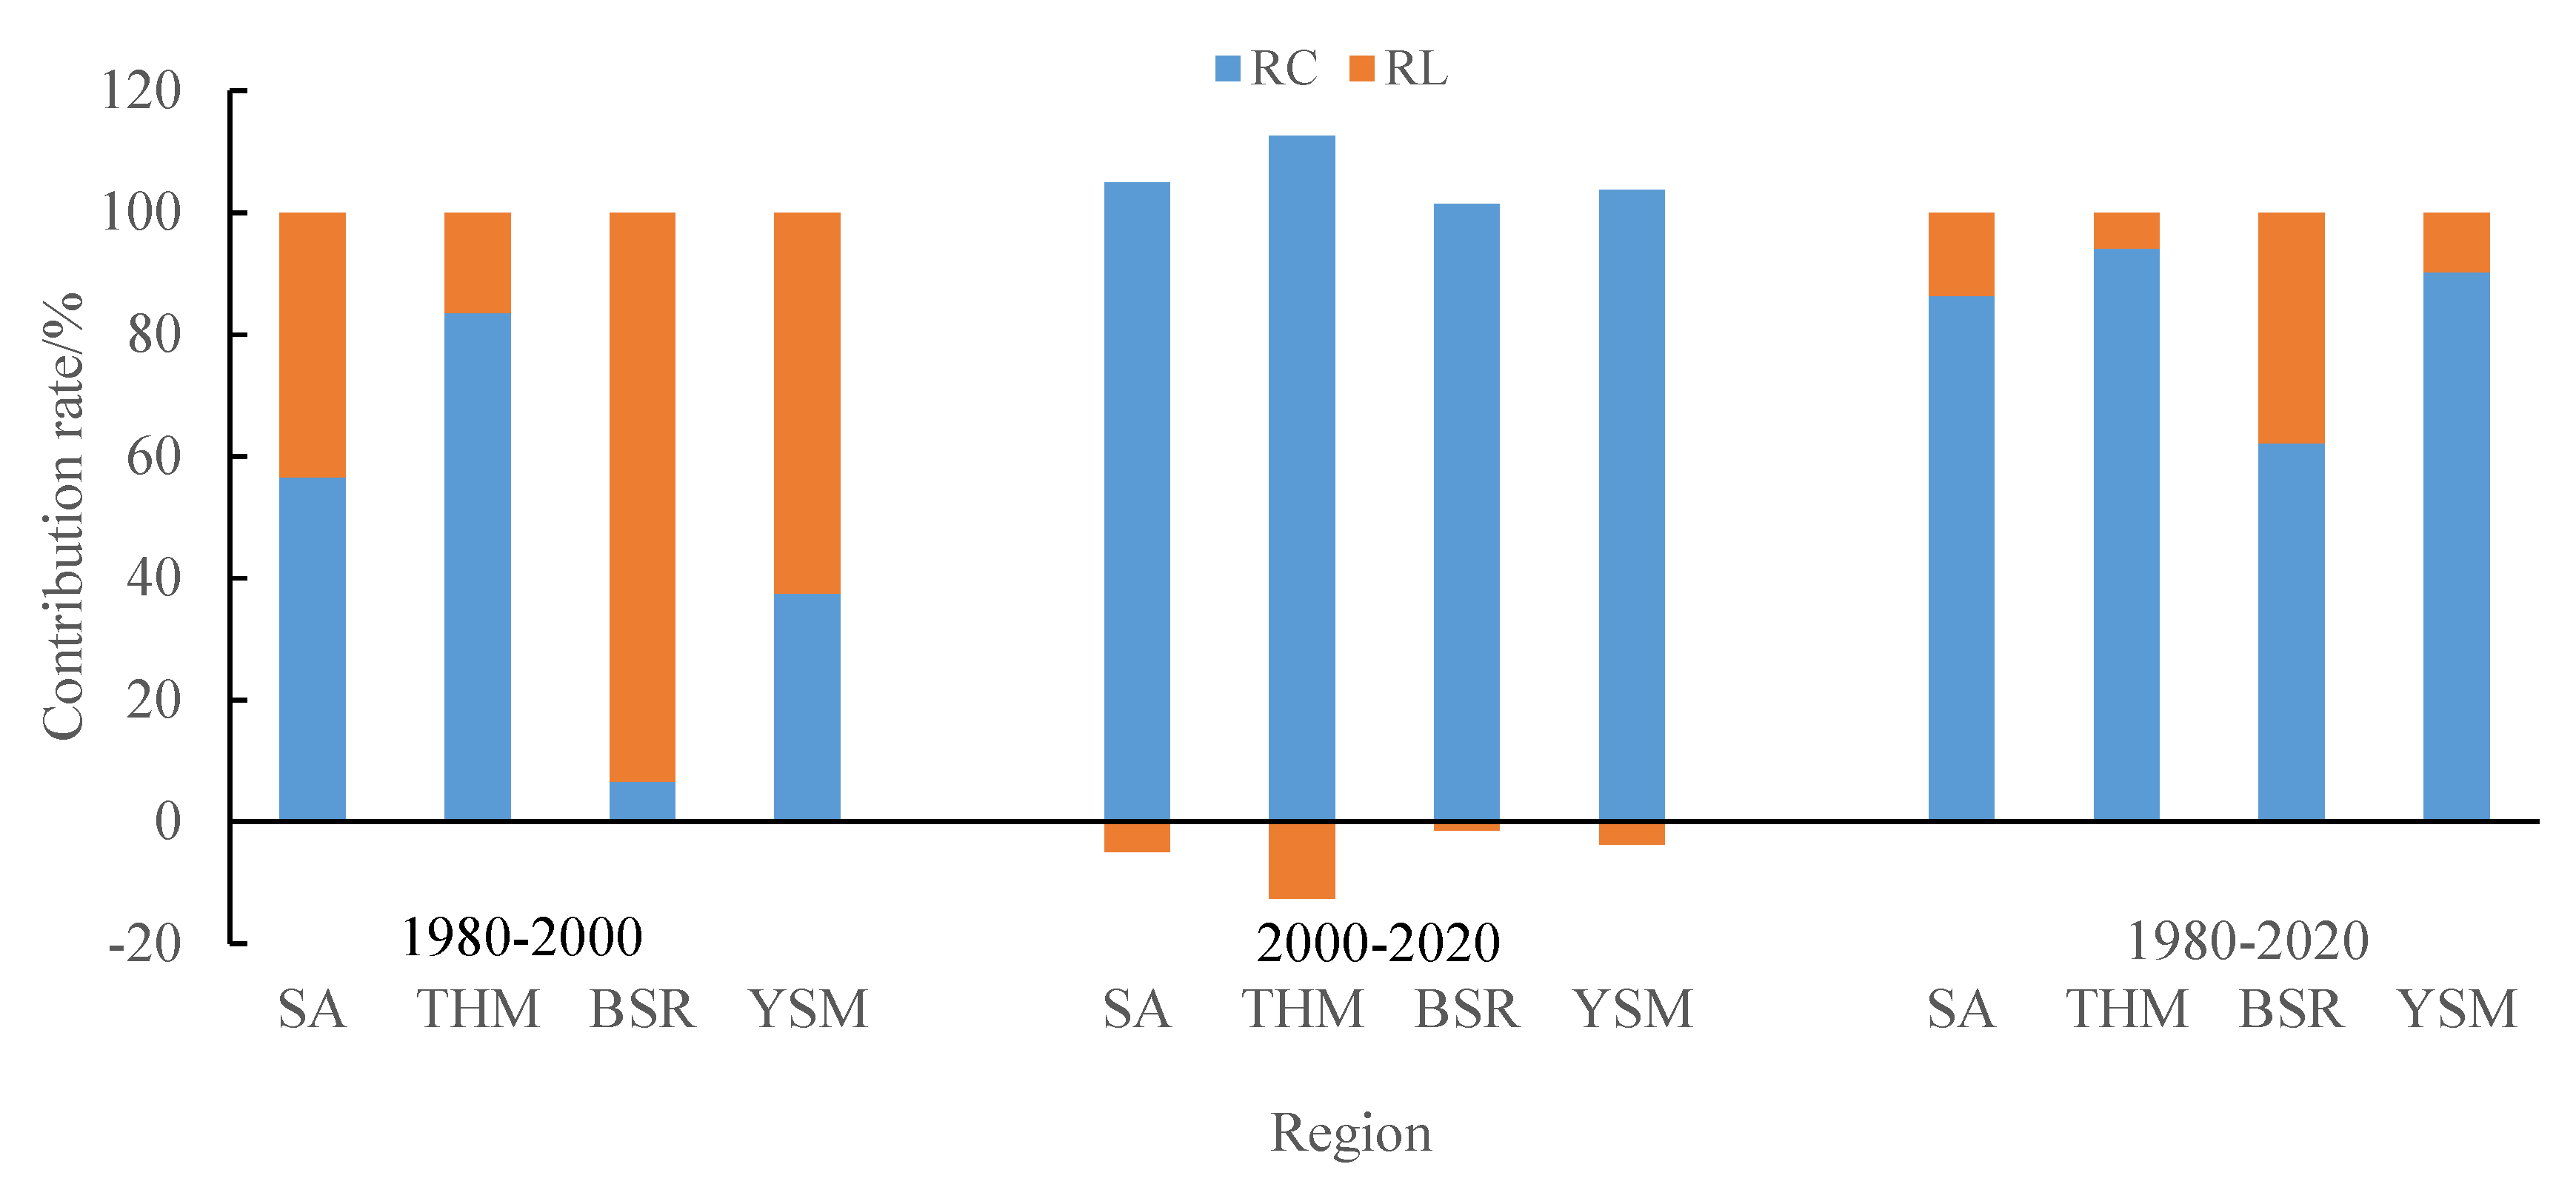
3.5. Contributions of Climate and LULC to Water Yield

The contribution rates of the climate and LULC changed to regional water yield can be quantitatively estimated by comparing the differences using different scenario results. As shown in Figure 10, climate was the key factor controlling the water yield of the mountainous area in BTH from 1980 to 2000, 2000 to 2020, and from 1980 to 2020. LULC had a negative effect on the water yield of the study area during 2000–2020, which was the opposite of that in 1980–2000 and 1980–2020. This result suggests that LULC change may have a negative impact on water yield during the initial reforestation period 2000–2020, but in the long period, LULC change will be beneficial to water yield in the mountains of the BTH.
The contribution of climate to the water yield increased in the THM, BSR, and YSM from 83.48% to 112.63%, 6.59% to 101.43%, and 37.41% to 103.73% in 1980–2000 and 2000–2020, respectively. The contribution of LULC to water yield in the THM, BSR, and YSM changed from a positive impact in 1980–2000 to a negative impact in 2000–2020, and the contribution rate was also greatly reduced. In particular, the BSR and YSM had changed from 93.41% and 62.59% to −1.43% and −3.73%, respectively, and the negative impact of LULC on water yield in THM during 2000–2020 was the largest, at −12.63%.

4. Discussion

Mounting evidence has suggested that climate change plays an important role in controlling the water cycle [82]. An investigation of the changes in precipitation is the first step in understanding the impact of climate change on water yield. Varying amounts of precipitation can cause significant differences in water yield [83]. Therefore, it can be seen in Figure 6 that the trends of annual water yield and precipitation are highly consistent, especially in 1990 and 1995 when precipitation was high, and the spatial distribution of the annual water yield and precipitation is also very similar (Figure 3 and Figure 7), i.e., the high value areas are located in the northeastern YSM and central THM.
Meanwhile, based on the water yield module of the InVEST model, except for the precipitation, the water yield is also determined by the actual evapotranspiration. Therefore, evapotranspiration is the key factor in determining the water yield under the assumption that precipitation is constant. Evapotranspiration is mediated primarily by transpiration through plants [84]. Moreover, the plant layer shades the land surface and further reduces the heat fluxes coming into the soil, decreasing evaporation [85]. Hence, the spatio-temporal nature of LULC is essential for water yield. In arid and semi-arid areas, the conversion from crops to forest and grass land reduces evapotranspiration [21]. This is why the water yield is low in the predominantly farmland BSR, even in 1990 and 1995, when precipitation was high, despite the low potential evapotranspiration. Similarly, the mountain-plain junction of the farmland-dominated THM does not have a high-water yield despite the relative high precipitation, and the high values of water yield in the THM are distributed in the lower areas of evapotranspiration in the western forest-grass distribution.
According to the results of the current study, LULC and climate change are both crucial elements that determine the water yield [86]. However, they are not independent of each other but have a close mutual feedback effect. Climate change affects the interannual land cover change and vegetation dynamics, especially in arid and semi-arid areas. Vegetation growth is obviously limited by precipitation and LULC changes also affects regional climate, including temperature and precipitation [44]. Therefore, as this paper demonstrates, in 1980–2000 the contribution of LULC and climate change to the water yield in the BSR and THM occupied an overwhelmingly dominant position with 93.41% and 83.48%, respectively, while for the YSM, the contribution of both was not significantly different. As precipitation is the only source of water yield, the annual precipitation in 1980 and 2000 was less than 400 mm for both the BSR and YSM. Therefore, it is tentatively inferred that for the BSR, where annual precipitation and evapotranspiration are low, LULC becomes the dominant factor affecting water yield, while the contribution of LULC change to water yield is relatively weak for the YSM due to the influence of evapotranspiration. While in 2000–2020, climatic factors became the main factor affecting water yield in all three regions, with a contribution rate greater than 100%, and LULC has a negative effect on water yield in all three regions. As mentioned earlier, this period, which was the main implementation period of a series of ecosystem restoration programs, and the extension of vegetation phenology, were also affected by climate change, directly resulting in an increase in vegetation transpiration during its growth period [87]. However, in 1980–2020, LULC had a positive effect, especially for the dry and cold BSR, where the positive effect of LULC factors on water yield was significantly higher than in the THM and YSM. It can be concluded that, in the long term, land revegetation will gradually benefit the water yield in the mountainous areas of BTH.
However, it seems that there is no very obvious change in the area of farmland due to the influence of LULC data sources and resolution. According to our fieldwork, we find that many lands in mountainous areas, especially on both sides of rivers, due to the seasonal breakage, are planted with crops by local people, which become farmland on remote sensing images, and some of the farmlands are actually retired and planted with economic forests such as walnuts and jujube trees. However, because the planting is not on a large scale, it is still treated as farmland on remote sensing images. Therefore, in the next step, we will need to further analyze the impact on water yield by revising and refining the LULC remote sensing images in conjunction with field surveys.
In addition, according to our study, the water yield in the mountainous areas of BTH after 2000, although it was lower than that in 1990 and 1995, had an overall upward trend. This point seems to contradict the decay of water resources in mountainous areas mentioned in the previous section. In this paper, the InVEST model is used to calculate the amount of water that can be yielded in an area under the existing natural conditions of the climate, LULC, and soil, but not all water yield will be captured, and some of it may leave the area in the form of evapotranspiration or flooding before water harvesting. Therefore, we need to further study the complex hydrological processes involved in water capturing from water yield.

5. Conclusions

In this study, the water yield module of the InVEST model was used to calculate the water yield of the mountainous area in BTH over the past 40 years, the water yield of different coverage types was analyzed, and a scenario simulation method was applied to identify the contribution rates of climate and LULC change on the water yield of three regions in BTH, including the THM, BSR, and YSM. The results showed that, in 1980–2020, the water yield in the mountainous area of BTH was the largest in 1990, at 377.95 mm and the smallest in 1980, at 150.49 mm. After 2000, the interannual water yield showed a slightly increasing trend with an increasing rate of 5.38 mm per year. During the study period, the spatial distribution of water yield was similar over the years, with high values in the south-central THM and the northeastern YSM. The THM was the main water yield area of the mountainous area in BTH, which had accounted for about 40% of the total water yield over the years.
The annual average water yield of farmland was the highest, at 346.85 mm, followed by forest land and grassland, while the proportion of volumetric water yield was the largest in forest land with an increasing trend from 1980 to 2020 and the grassland showed a decreasing trend, while that of farmland increased first from 1980 to 2000 and decreased from 2000 to 2020.
Climate is the key factor controlling the water yield of the mountainous area in BTH over the 40 years. The contribution of climate change to water yield increases from 56.51% in 1980–2000 to 104.95% in 2000–2020. The effect of LULC change on water yield is relatively complex, specifically, from 1980 to 2000, LULC change has had a positive effect on water yield especially in the BSR, with a contribution rate of 93.41%. While from 2000 to 2020, LULC change has had a negative effect on water yield, especially in the THM, with a contribution rate of -12.63%. However, overall, the effect of LULC change on water yield in the mountainous areas of BTH has been positive in the last 40 years, especially in the BSR, with a contribution of 37.80%. In the long term, land revegetation will gradually benefit the water yield in the mountainous areas of BTH, including the THM, BSR, and YSM.

Author Contributions

Writing—original draft, H.Y.; Writing—review and editing, J.C. and X.H. All authors have read and agreed to the published version of the manuscript.

Funding

This research was financially supported by the Science and Technology Fundamental Resources Investigation Program (grant numbers 2022FY100104), the Natural Science Foundation of Hebei Province (grant numbers D2021503001), the National Natural Science Foundation of China (grant numbers 42001009, 41877170) and the Key Research and Development Plan Project of Hebei Province (grant numbers 20324201D, 22324202D, 20324203D).

Data Availability Statement

Data is contained within the article.

Conflicts of Interest

The authors declare no conflict of interest.

References

  1. Costanza, R.; Ralph, D.; Rudolf, D.G.; Stephen, F.; Monica, G.; Bruce, H.; Karin, L.; Shahid, N.; Robert, V.O.; Jose, P.; et al. The value of the world’s ecosystem services and natural capital. Nature 1997, 387, 253–260. [Google Scholar] [CrossRef]
  2. Millennium Ecosystem Assessment. Ecosystems and Human Well-Being: Synthesis; Island Press: Washington, DC, USA, 2005. [Google Scholar]
  3. Barral, M.P.; Rey Benayas, J.M.; Meli, P.; Maceira, N.O. Quantifying the impacts of ecological restoration on biodiversity and ecosystem services in agroecosystems: A global meta-analysis. Agric. Ecosyst. Ecosyst. Environ. 2015, 202, 223–231. [Google Scholar] [CrossRef] [Green Version]
  4. Han, R.; Feng, C.C.; Xu, N.; Guo, L. Spatial heterogeneous relationship between ecosystem services and human disturbances: A case study in Chuandong, China. Sci. Total Environ. 2020, 721, 137818. [Google Scholar] [CrossRef] [PubMed]
  5. Wang, A.Y.; Liao, X.Y.; Tong, Z.J.; Du, W.L.; Zhang, J.Q.; Liu, X.P.; Liu, M.S. Spatial-temporal dynamic evaluation of the ecosystem service value from the perspective of “production-living-ecological” spaces: A case study in Dongliao River Basin, China. J. Clean. Prod. 2022, 333, 130218. [Google Scholar] [CrossRef]
  6. Jiang, W.; Wu, T.; Fu, B.J. The value of ecosystem services in China: A systematic review for twenty years. Ecosyst. Serv. 2021, 52, 101365. [Google Scholar] [CrossRef]
  7. Lu, N.; Sun, G.; Feng, X.M.; Fu, B.J. Water yield responses to climate change and variability across the North-South Transect of Eastern China (NSTEC). J. Hydrol. 2013, 481, 96–105. [Google Scholar] [CrossRef]
  8. Newman, B.D.; Wilcox, B.P.; Archer, S.R.; Breshears, D.D.; Dahm, C.N.; Duffy, C.J.; Mcdowell, N.G.; Phillips, F.M.; Scanlon, B.R.; Vivoni, E.R. Ecohydrology of water-limited environments: A scientific vision. Water Resour. Res. 2006, 42, W06302. [Google Scholar] [CrossRef]
  9. Mo, W.B.; Zhao, Y.L.; Yang, N.; Xu, Z.G.; Zhao, W.P.; Li, F. Effects of climate and land use/land cover changes on water yield services in the Dongjiang Lake Basin. ISPRS Int. J. Geo-Inf. 2021, 10, 466. [Google Scholar] [CrossRef]
  10. Feng, X.M.; Fu, B.J.; Piao, S.L.; Wang, S.; Ciais, P.; Zeng, Z.Z.; Lu, Y.H.; Zeng, Y.; Li, Y.; Jiang, X.H.; et al. Revegetation in China’s Loess Plateau is approaching sustainable water resource limits. Nat. Clim. Change 2016, 6, 1019–1022. [Google Scholar] [CrossRef]
  11. Anand, J.; Gosain, A.K.; Khosa, R. Prediction of land use changes based on Land Change Modeler and attribution of changes in the water balance of Ganga basin to land use change using the SWAT model. Sci. Total Environ. 2018, 644, 503–519. [Google Scholar] [CrossRef]
  12. Legesse, D.; Vallet-Coulomb, C.; Gasse, F. Hydrological response of a catchment to climate and land-use changes in Tropical Africa: Case study South Central Ethiopia. J. Hydrol. 2003, 275, 67–85. [Google Scholar] [CrossRef]
  13. Sharp, R.; Tallis, H.T.; Ricketts, T.; Guerry, A.D.; Wood, S.A.; Chaplin-Kramer, R.; Nelson, E.; Ennaanay, D.; Wolny, S.; Olwero, N. InVEST 3.2.0 User’s Guide; The Natural Capital Project; Stanford University. University of Minnesota: Minneapolis, MN, USA, The Nature Conservancy; World Wildlife Fund:; 2015. [Google Scholar]
  14. Gamfeldt, L.; Snäll, T.; Bagchi, R.; Jonsson, M.; Gustafsson, L.; Kjellander, P.; Ruiz-Jaen, M.C.; Fröberg, M.; Stendahl, J.; Philipson, C.D.; et al. Higher levels of multiple ecosystem services are found in forests with more tree species. Nat. Commun. 2013, 4, 1340. [Google Scholar] [CrossRef] [Green Version]
  15. Lang, Y.; Song, W.; Zhang, Y. Responses of the water-yield ecosystem service to climate and land-use change in Sancha River Basin, China. Phys. Chem. Earth 2017, 101, 102–111. [Google Scholar]
  16. Zhu, Z.; Piao, S.; Myneni, R.B.; Huang, M.; Zeng, Z.; Canadell, J.; Ciais, P.; Sitch, S.; Friedlingstein, P.; Zaehle, S.; et al. Greening of the Earth and its drivers. Nat. Clim. Change 2016, 6, 791–795. [Google Scholar] [CrossRef]
  17. Zhang, J.H.; Zhang, Y.L.; Sun, G.; Song, C.; Li, J.; Liu, N. Climate Variability Masked Greening Effects on Water Yield in the Yangtze River Basin During 2001–2018. Water Resour. Res. 2022, 52, e2021WR030382. [Google Scholar] [CrossRef]
  18. de Jong, R.; de Bruin, S.; Schaepman, M.E.; Dent, D.L. Analysis of monotonic greening and browning trends from global NDVI time-series. Remote Sens. Environ. 2011, 115, 692–702. [Google Scholar] [CrossRef] [Green Version]
  19. Mao, J.F.; Shi, X.Y.; Thornton, P.E.; Hoffman, F.M.; Myneni, R.B. Global latitudinal-asymmetric vegetation growth trends and their driving mechanisms: 1982–2009. Remote Sens. 2013, 5, 1484–1497. [Google Scholar] [CrossRef] [Green Version]
  20. Piao, S.; Yin, G.; Tan, J.; Cheng, L.; Huang, M.; Li, Y.; Liu, R.; Mao, J.; Myneni, R.B.; Peng, S. Detection and attribution of vegetation greening trend in China over the last 30 years. Glob. Change Biol. 2015, 21, 1601–1609. [Google Scholar] [CrossRef]
  21. Chen, Y.L.; Wang, S.S.; Ren, Z.G.; Huang, J.F.; Wang, X.Z.; Liu, S.S.; Deng, H.J.; Lin, W.K. Increased evapotranspiration from land cover changes intensified water crisis in an arid river basin in northwest China. J. Hydrol. 2019, 574, 383–397. [Google Scholar] [CrossRef]
  22. IUFRO. Forest and Water on a Changing Planet: Vulnerability, Adaptation and Governance Opportunities: A Global Assessment Report; International Union of Forest Research Organizations (IUFRO): Vienna, Austria, 2018. [Google Scholar]
  23. Bai, P.; Liu, X.M.; Zhang, Y.Q.; Liu, C.M. Assessing the impacts of vegetation greenness change on evapotranspiration and water yield in China. Water Resour. Res. 2020, 56, e2019WR027019. [Google Scholar] [CrossRef]
  24. Li, Y.; Piao, S.; Li, L.Z.X.; Chen, A.; Wang, X.; Ciais, P.; Huang, L.; Lian, X.; Peng, S.S.; Zeng, Z.Z.; et al. Divergent hydrological response to large-scale afforestation and vegetation greening in China. Sci. Adv. 2018, 4, eaar4182. [Google Scholar] [CrossRef] [PubMed]
  25. Hao, L.; Sun, G.; Liu, Y.; Wan, J.H.; Qin, M.S.; Qian, H.; Liu, C.; Zheng, J.K.; John, R.; Fan, P.L.; et al. Urbanization dramatically altered the water balances of a paddy field dominated basin in Southern China. Hydrol. Earth Syst. Sci. Discuss. 2015, 12, 1941–1972. [Google Scholar] [CrossRef] [Green Version]
  26. Zhou, G.Y.; Zhou, P.; Shi, T.T.; Li, L. Inappropriate revegetation leads to reduction of water resources. Sci. Sin. (Terrae) 2021, 51, 175–182, (In Chinese with English Abstract). [Google Scholar]
  27. Calder, I.R.; Smyle, J.; Aylward, B. Debate over flood-proofing effects of planting forests. Nature 2007, 450, 945. [Google Scholar] [CrossRef] [PubMed] [Green Version]
  28. Laurance, W.F. Forests and floods. Nature 2007, 449, 409–410. [Google Scholar] [CrossRef] [PubMed]
  29. Andréassian, V. Waters and forests: From historical controversy to scientific debate. J. Hydrol. 2004, 291, 1–27. [Google Scholar] [CrossRef]
  30. Bosch, J.M.; Hewlett, J.D. A review of catchment experiments to determine the effect of vegetation changes on water yield and evapotranspiration. J. Hydrol. 1982, 55, 3–23. [Google Scholar] [CrossRef]
  31. Brown, A.E.; Zhang, L.; McMahon, T.A.; Western, A.W.; Vertessy, R.A. A review of paired catchment studies for determining changes in water yield resulting from alterations in vegetation. J. Hydrol. 2005, 310, 28–61. [Google Scholar] [CrossRef]
  32. Hibbert, A.R. Forest Treatment effects on water yield. In Proceedings of the International Symposium on Forest Hydrology; Pennsylvania State University: State College, PA, USA, 1967; Volume 1965, pp. 527–543. [Google Scholar]
  33. Dyhr-Nielsen, M. Hydrologic effects of deforestation in the Chao Phraya Basin in Thailand. In Proceedings of the International Symposium on Tropical Forest Hydrology and Application 12 (World Bank), Chiang Mai, Thailand, 11–14 June 1986. [Google Scholar]
  34. Ceballos-Barbancho, A.; Morán-Tejeda, E.; Luengo-Ugidos, M.Á.; Llorente-Pinto, J.M. Water resources and environmental change in a Mediterranean environment: The south-west sector of the Duero river basin (Spain). J. Hydrol. 2008, 351, 126–138. [Google Scholar] [CrossRef]
  35. Buttle, J.M.; Metcalfe, R.A. Boreal Forest disturbance and streamflow response, northeastern Ontario. Can. J. Fish. Aquat. Sci. 2000, 57, 5–18. [Google Scholar] [CrossRef]
  36. Zhou, G.Y.; Wei, X.H.; Luo, Y.; Zhang, M.F.; Li, Y.L.; Qiao, Y.N.; Liu, H.G.; Wang, C.L. Forest recovery and river discharge at the regional scale of Guangdong Province, China. Water Resour. Res. 2010, 46, W09503. [Google Scholar] [CrossRef] [Green Version]
  37. Wang, S.; Fu, B.J.; He, C.S.; Sun, G.; Gao, G.Y. A comparative analysis of forest cover and catchment water yield relationships in northern China. For. Ecol. Manag. 2011, 262, 1189–1198. [Google Scholar] [CrossRef]
  38. Jackson, R.B.; Jobbágy, E.G.; Avissar, R.; Roy, S.B.; Barrett, D.J.; Cook, C.W.; Farley, K.A.; le Maitre, D.C.; McCarl, B.A.; Murray, B.C. Trading water for carbon with biological carbon sequestration. Science 2005, 310, 1944–1947. [Google Scholar] [CrossRef] [Green Version]
  39. Zhou, G.Y.; Wei, X.H.; Chen, X.Z.; Zhou, P.; Liu, X.D.; Xiao, Y.; Sun, G.; Scott, D.F.; Zhou, S.Y.D.; Han, L.S.; et al. Global pattern for the effect of climate and land cover on water yield. Nat. Commun. 2015, 6, 5918. [Google Scholar] [CrossRef] [Green Version]
  40. Caldwell, P.V.; Minniat, C.F.; Elliott, K.J.; Swank, W.T.; Beantley, S.T.; Laseterr, S.H. Declining water yield from forested mountain watersheds in response to climate change and forest mesophication. Glob. Change Biol. 2016, 22, 2997–3012. [Google Scholar] [CrossRef]
  41. Yang, J.; Xie, B.P.; Zhang, D.G.; Tao, W.Q. Climate and land use change impacts on water yield ecosystem service in the Yellow River Basin, China. Environ. Earth Sci. 2021, 80, 1–12. [Google Scholar] [CrossRef]
  42. Pei, X.; Guo, Y.M.; Fu, B. Regional Impacts of climate and land cover on ecosystem water retention services in the Upper Yangtze River Basin. Sustainability 2019, 11, 5300. [Google Scholar]
  43. Li, M.Y.; Liang, D.; Xia, J.; Song, J.X.; Cheng, D.D.; Wu, J.T.; Cao, Y.L.; Sun, H.T. Evaluation of water conservation function of Danjiang River Basin in Qinling Mountains, China-based on InVEST model. J. Environ. Manag. 2021, 286, 112212. [Google Scholar] [CrossRef]
  44. Baker, T.J.; Miller, S.N. Using the Soil and Water Assessment Tool (SWAT) to assess land use impact on water resources in an East African watershed. J. Hydrol. 2013, 486, 100–111. [Google Scholar] [CrossRef]
  45. Villa, F.; Bagstad, K.J.; Voigt, B.; Johnson, G.W.; Portela, R.; Honzak, M.; Batker, D. A methodology for adaptable and robust ecosystem services assessment. PLoS ONE 2014, 9, e91001. [Google Scholar] [CrossRef] [Green Version]
  46. Leh, M.D.K.; Matlock, M.D.; Cummings, E.C.; Nalley, L.L. Quantifying and mapping multiple ecosystem services change in West Africa. Agric. Ecosyst. Environ. 2013, 165, 6–18. [Google Scholar] [CrossRef]
  47. Zhang, C.Q.; Li, W.H.; Zhang, B.; Liu, M.C. Water yield of Xitiaoxi river basin based on InVEST modeling. J. Resour. Ecol. 2012, 3, 50–54. [Google Scholar]
  48. Vigerstol, K.L.; Aukema, J.E. A comparison of tools for modeling freshwater ecosystem services. J. Environ. Manag. 2011, 92, 2403–2409. [Google Scholar] [CrossRef] [PubMed]
  49. Yang, D.; Liu, W.; Tang, L.; Chen, L.; Li, X.; Xu, X. Estimation of water provision service for monsoon catchments of South China: Applicability of the InVEST model. Landsc. Urban Plan. 2019, 182, 133–143. [Google Scholar] [CrossRef]
  50. Redhead, J.W.; Stratford, C.; Sharps, K.; Jones, L.; Ziv, G.; Clarke, D.; Oliver, T.H.; Bullock, J.M. Empirical validation of the InVEST water yield ecosystem service model at a national scale. Sci. Total Environ. 2016, 560–570, 1418–1426. [Google Scholar] [CrossRef] [Green Version]
  51. Hu, W.; Li, G.; Gao, Z.; Jia, G.; Wang, Z.; Li, Y. Assessment of the impact of the Poplar Ecological Retreat Project on water conservation in the Dongting Lake wetland region using the InVEST model. Sci. Total Environ. 2020, 733, 139423. [Google Scholar] [CrossRef]
  52. Li, G.Y.; Jiang, C.H.; Zhang, Y.H.; Jiang, G.H. Whether land greening in different geomorphic units are beneficial to water yield in the Yellow River Basin? Ecol. Indic. 2021, 120, 106926. [Google Scholar] [CrossRef]
  53. Zhang, X.; Zhang, G.S.; Long, X.; Zhang, Q.; Liu, D.S.; Wu, H.J.; Li, S. Identifying the drivers of water yield ecosystem service: A case study in the Yangtze River Basin China. Ecol. Indic. 2021, 132, 108304. [Google Scholar] [CrossRef]
  54. Daneshi, A.; Brouwer, R.; Najafinejad, A.; Panahi, M.; Zarandian, A.; Maghsood, F.F. Modelling the impacts of climate and land use change on water security in a semi-arid forested watershed using InVEST. J. Hydrol. 2021, 593, 125621. [Google Scholar] [CrossRef]
  55. Wu, J.; Li, Y.H.; Huang, L.Y.; Lu, Z.M.; Yu, D.P.; Zhou, L.; Dai, L.M. Spatiotemporal variation of water yield and its driving factors in Northeast China. Chin. J. Ecol. 2017, 36, 3216–3223, (In Chinese with English Abstract). [Google Scholar]
  56. Chen, T.Q.; Feng, Z.; Zhao, H.F.; Wu, K.N. Identification of ecosystem service bundles and driving factors in Beijing and its surrounding areas. Sci. Total Environ. 2020, 711, 134687. [Google Scholar] [CrossRef]
  57. Feng, Z.; Jin, X.R.; Chen, T.Q.; Wu, J.S. Understanding trade-offs and synergies of ecosystem services to support the decision-making in the Beijing–Tianjin–Hebei region. Land Use Policy 2021, 106, 105446. [Google Scholar] [CrossRef]
  58. Pei, H.W.; Liu, M.Z.; Shen, Y.J.; Xu, K.; Zhang, H.J.; Li, Y.L.; Luo, J.M. Quantifying impacts of climate dynamics and land-use changes on water yield service in the agro-pastoral ecotone of northern China. Sci. Total Environ. 2022, 809, 151153. [Google Scholar] [CrossRef]
  59. Wang, Y.; Xie, Y.J.; Qi, L.; He, Y.; Bo, H. Synergies evaluation and influencing factors analysis of the water–energy–food nexus from symbiosis perspective: A case study in the Beijing–Tianjin–Hebei region. Sci. Total Environ. 2022, 818, 151731. [Google Scholar] [CrossRef]
  60. Cao, X.F.; Hu, C.Z.; Qi, W.X.; Zheng, H.; Shan, B.Q.; Zhao, Y.; Qu, J.H. Strategies for water resources regulation and water environment protection in Beijing–Tianjin–Hebei region. China Eng. Sci. 2019, 21, 130–136, (In Chinese with English Abstract). [Google Scholar] [CrossRef]
  61. Pritchard, H.D. Asia’s shrinking glaciers protect large populations from drought stress. Nature 2019, 569, 649–654. [Google Scholar] [CrossRef]
  62. Bendix, J.; Beck, E.; Bräuning, A.; Makeschin, F.; Mosandl, R.; Scheu, S.; Wilcke, W. Ecosystem Services, Biodiversity and Environmental Change in a Tropical Mountain Ecosystem of South Ecuador; Springer Science & Business Media: Berlin/Heidelberg, Germany, 2013. [Google Scholar]
  63. Panwar, S. Vulnerability of Himalayan springs to climate change and anthropogenic impact: A review. J. Mt. Sci. 2020, 17, 117–132. [Google Scholar] [CrossRef]
  64. Wei, X.; Sun, G.; Liu, S.; Jiang, H.; Zhou, G.; Dai, L. The Forest-Streamflow relationship in China: A 40-year retrospect. J. Am. Water Resour. Assoc. 2008, 44, 1076–1085. [Google Scholar] [CrossRef] [Green Version]
  65. National Forestry and Grassland Administration. China Forest Resources Report (2014–2018); China Forestry Press: Beijing, China, 2020. (In Chinese)
  66. Haihe Water Conservancy Commission; Ministry of Water Resources. In Haihe River Basin Water Resources Bulletin in 2016; 2017. (In Chinese)
  67. Jia, Y.W.; Hao, C.P.; Niu, C.W.; Qiu, Y.Q.; Du, J.K.; Xu, F.; Liu, H. Spatial-temporal variations of precipitation and runoff and analyses of water-heat-human-land matching characteristics in a typical mountainous area of China. Acta Geogr. Sin. 2019, 74, 2288–2302, (In Chinese with English Abstract). [Google Scholar]
  68. Zhang, B.Q.; Shao, R.; Zhao, X.N.; Wu, P.T. Effects of large-scale vegetation restoration on eco-hydrological processes over the Loess Plateau, China. J. Basic Sci. Eng. 2020, 28, 594–606, (In Chinese with English Abstract). [Google Scholar]
  69. Lal, R. Carbon sequestration in dryland ecosystems. Environ. Manag. 2004, 33, 528–544. [Google Scholar] [CrossRef] [PubMed]
  70. Zeng, N.; Neelin, J.D.; Lau, K.-M.; Tucker, C.J. Enhancement of interdecadal climate variability in the Sahel by vegetation interaction. Science 1999, 286, 1537–1540. [Google Scholar] [CrossRef] [PubMed] [Green Version]
  71. Ma, Q. Appraisal of tree planting options to control desertification: Experiences from the Three-North Shelterbelt Programme. Int. For. Rev. 2004, 6, 327–334. [Google Scholar] [CrossRef]
  72. Rohatyn, S.; Rotenberg, E.; Ramati, E.; Tatarinov, F.; Tas, E.; Yakir, D. Differential impacts of land use and precipitation on “ecosystem water yield”. Water Resour. Res. 2018, 54, 5457–5470. [Google Scholar] [CrossRef]
  73. Hao, S.S. Investigation of water resources among Qilian mountains. J. Qinghai Univ. Nat. Sci. 2006, 24, 38–41, (In Chinese with English Abstract). [Google Scholar]
  74. Fu, B.P. On the calculation of the evaporation from land surface. Chin. J. Atmos. Sci. 1981, 5, 23–31. (In Chinese) [Google Scholar]
  75. Zhang, L.; Hickel, K.; Dawes, W.R.; Chiew, F.H.S.; Western, A.W.; Briggs, P.R. A rational function approach for estimating mean annual evapotranspiration. Water Resour. Res. 2004, 40. [Google Scholar] [CrossRef]
  76. Droogers, P.; Allen, R.G. Estimating reference evapotranspiration under inaccurate data conditions. Irrig. Drain. Syst. 2002, 16, 33–45. [Google Scholar] [CrossRef]
  77. Allen, R.G.; Pereira, L.S.; Raes, D.; Smith, M. Crop Evapotranspiration. Guidelines for Computing Cropwater Requirements; FAO Irrigation and Drainage Paper 56; Food and Agriculture Organization of the United Nations: Rome, Italy, 1998. [Google Scholar]
  78. Donohue, R.J.; Roderick, M.L.; McVicar, T.R. Roots, storms and soil pores: Incorporating key ecohydrological processes into Budyko’s hydrological mode. J. Hydrol. 2012, 436–437, 35–50. [Google Scholar] [CrossRef]
  79. Hamel, P.; Guswa, A.J. Uncertainty analysis of a spatially explicit annual water balance model: Case study of the Cape Fear basin, North Carolina. Hydrol. Earth Syst. Sci. 2015, 19, 839–853. [Google Scholar] [CrossRef] [Green Version]
  80. Yang, H.; Yang, D.; Lei, Z.; Sun, F. New analytical derivation of the mean annual water-energy balance equation. Water Resour. Res. 2008, 44. [Google Scholar] [CrossRef]
  81. Pan, T.; Wu, S.H.; Liu, Y.J. Relative contributions of land use and climate change to water supply variations over yellow river source area in Tibetan Plateau during the past three decades. PLoS ONE 2015, 10, e0123793. [Google Scholar] [CrossRef]
  82. Chang, X.X.; Zhao, W.Z.; Liu, B.; Liu, H.; He, Z.B.; Du, J. Can forest water yields be increased with increased precipitation in a Qinghai spruce forest in arid northwestern China? Agric. For. Meteorol. 2017, 247, 139–150. [Google Scholar] [CrossRef]
  83. Pessacg, N.; Flaherty, S.; Brandizi, L.; Solman, S.; Pascual, M. Getting water right: A case study in water yield modelling based on precipitation data. Sci. Total Environ. 2015, 537, 225–234. [Google Scholar] [CrossRef]
  84. Seneviratne, S.I.; Corti, T.; Davin, E.L.; Hirschi, M.; Jaeger, E.B.; Lehner, I.; Orlowsky, B.; Teuling, A.J. Investigating soil moisture–climate interactions in a changing climate: A review. Earth-Sci. Rev. 2010, 99, 125–161. [Google Scholar] [CrossRef]
  85. Cascone, S.; Coma, J.; Gagliano, A.; Perez, G. The evapotranspiration process in green roofs: A review. Build. Environ. 2019, 147, 337–355. [Google Scholar] [CrossRef]
  86. Zhang, L.; Cheng, L.; Chiew, F.; Fu, B.J. Understanding the impacts of climate and land use change on water yield. Curr. Opin. Environ. Sustain. 2018, 33, 167–174. [Google Scholar] [CrossRef]
  87. Lian, X.L.; Piao, S.L.; Li, L.Z.X.; Li, Y.; He, G. Summer soil drying exacerbated by earlier spring by earlier spring greening of northern vegetation. Sci. Adv. 2020, 6, eaax0255. [Google Scholar] [CrossRef]
Figure 1. Location of study area (THM—Taihang Mountain, BSR—Bashang region, YSM—Yanshan Mountain).
Remotesensing 15 00727 g001
Figure 2. The spatial patterns of annual precipitation in the eight years during 1980–2020.
Remotesensing 15 00727 g002
Figure 3. The spatial patterns of annual ET0 in the eight years during 1980–2020.
Remotesensing 15 00727 g003
Figure 4. LULC change in the eight years during 1980–2020.
Remotesensing 15 00727 g004
Figure 5. The spatial patterns of LULC in the eight years during 1980–2020.
Remotesensing 15 00727 g005
Figure 6. Annual precipitation, actual evapotranspiration, water yield, and potential evapotranspiration in the eight years during 1980–2020.
Remotesensing 15 00727 g006
Figure 7. The spatial patterns of water yield in the eight years during 1980–2020 (THM—Taihang Mountain, BSR—Bashang region, YSM—Yanshan Mountain).
Remotesensing 15 00727 g007
Figure 8. Water yield of different land use/land cover in the eight years during 1980–2020.
Remotesensing 15 00727 g008
Figure 9. Volumetric water yield ratio of different land use/land cover in the eight years during 1980–2020.
Remotesensing 15 00727 g009
Figure 10. Contribution rates of land use/land cover and climate to the water yield change of different regions during 1980–2000, 2000–2020, and 1980–2020 (SA—Study area, THM—Taihang Mountain, BSR—Bashang region, YSM—Yanshan Mountain; RC—rate of climate, RL—rate of LULC).
Remotesensing 15 00727 g010
Table 1. Input files for the InVEST water yield module.
InputDescriptionFormat/UnitsSource
PrecipitationAverage annual precipitation generated by the Kriging interpolation of daily precipitation data of 26 national meteorological stations (Figure 1) around the study area with Arc GIS 10.5 from 1980 to 2020GIS raster with a resolution of 100 m /mmDaily precipitation data are downloaded from China Meteorological Data Network (http://data.cma.cn/) (accessed on 20 December 2022)
Reference evapotranspirationAverage annual reference evapotranspiration estimated based on the daily meteorological data of 26 national meteorological stations using the modified Hargreaves’ equation and generated the same as the precipitation dataGIS raster with a resolution of 100 m /mmDaily meteorological data (including temperature, wind speed, sunshine duration, etc.) are downloaded from China Meteorological Data Network (http://data.cma.cn/) (accessed on 20 December 2022)
Root restricting layer depthSoil depth at which root penetration is strongly inhibited, a conversion from soil depth data in feature formatGIS raster with a resolution of 100 m /mmSoil depth data in feature format are extracted from the 1:1,000,000 Soil Database of China downloaded from the Nanjing Institute of Soil Science, Chinese Academy of Sciences (http://www.issas.cas.cn/) (accessed on 20 December 2022)
Plant available water content (PAWC)Fraction of water that can be stored in the soil profile that is available for plants’ use. It is defined as the difference between the fraction of volumetric field capacity and permanent wilting pointGIS raster with a resolution of 100 m /mmCalculated with SPAW software using soil texture data and content of soil organic matter obtained from 193 sampling sites collected in 2019 (Figure 1)
Land use/land cover (LULC)Land use/land cover map in 1980, 1990, 1995, 2000, 2005, 2010, 2015, and 2020GIS raster with a resolution of 100 mThe Resources and Environmental Sciences Data Center (RESDC), Chinese Academy of Sciences
(http://www.resdc.cn) (accessed on 20 December 2022)
WatershedsMain watershedGIS polygonThe study area boundary in this paper obtained according to administrative boundaries and contour data downloaded from China Meteorological Data Network (http://data.cma.cn/) (accessed on 20 December 2022)
Plant evapotranspiration
coefficient
Plant evapotranspiration coefficient for each LULC classDecimal in the range of 0 to 1.5FAO (http://www.fao.org) (accessed on 20 December 2022)
Biophysical tableContaining model information corresponding to each of the land use classes in the LULC raster (LULC class (Lucode), LULC_veg, root_depth and Kc).csv tableLucode is the same as the land use raster map, LULC_veg is 1 for vegetated land use except wetlands, and 0 for all other land uses, root_depth is the value of root restricting layer depth, and Kc is plant evapotranspiration coefficient
Z parameterCorresponding to the seasonal distribution of precipitationFloating point value on the order of 1 to 30Calculated from the precipitation data
Table 2. The scenario settings of climate change and LULC change.
FactorReal ConditionClimate Change ScenarioLULC Change Scenario
198020002020S1S2S3S4S5S6
Climate198020002020200020202020198019802000
LULC198020002020198019802000200020202020
Table 3. Water yield (in mm) and ratio of water yield in different regions to the total water yield in the eight years during 1980–2020.
YearParameterRegions *
THMBSRYSM
1980Water yield (mm)179.44131.61145.81
Ratio (%)39.2828.8131.91
1990Water yield (mm)414.42288.15403.47
Ratio (%)37.4726.0536.48
1995Water yield (mm)449.41326.64343.82
Ratio (%)40.1329.1730.70
2000Water yield (mm)331.51185.44178.12
Ratio (%)47.6926.6825.63
2005Water yield (mm)251.86163.30251.98
Ratio (%)37.7524.4837.77
2010Water yield (mm)266.55284.65315.14
Ratio (%)30.7732.8636.38
2015Water yield (mm)305.26251.71298.04
Ratio (%)35.7029.4434.86
2020Water yield (mm)414.5271.11307.71
Ratio (%)41.7327.2930.98
* THM—Taihang Mountain, BSR—Bashang region, YSM—Yanshan Mountain.
Disclaimer/Publisher’s Note: The statements, opinions and data contained in all publications are solely those of the individual author(s) and contributor(s) and not of MDPI and/or the editor(s). MDPI and/or the editor(s) disclaim responsibility for any injury to people or property resulting from any ideas, methods, instructions or products referred to in the content.

