Abstract
The expansion of urban areas has resulted in a substantial increase in demand for water ecosystem services. To address this issue, this study aims to investigate how the interaction between urbanization and water ecosystem services changed in response to different levels of urbanization in the Dongjiang River Basin from 1985 to 2020. The research examines four water ecosystem services (water yield, soil retention, and water purifications of N and P) and three types of urbanizations (population urbanization, economic urbanization, and land urbanization) to identify spatial heterogeneities among developed urban areas, developing urban areas, and rural regions, as well as their dynamic interactions. The findings indicate that water ecosystem services and urbanizations tend to be spatially polarized, with high values downstream and low values upstream. Although they have become more closely aligned, there is a local mismatch under basin-level homogeneity. Urbanization has migrated and centralized in a southward direction, while water ecosystem services have moved westward. This difference of migration results in an increasing trade-off in the west band of Dongjiang River. In particular, the developing urban area has been strengthening the function of the transition zone between the developed urban area and rural area, resulting in a dramatic decrease in synergy. The synergy of the rural area dominates the increasing synergy of the entire basin, but the developed urban area tends to lower the water ecosystem services that lag behind urbanization. The study recommends that policymakers consider different urban levels when developing urbanization plans and water resource management strategies, and implement measures to maintain the synergy in the rural area and mitigate the trade-off in the developing area.
1. Introduction
Water is a critical resource that sustains the entire Earth’s ecosystem and provides essential ecological services that support natural ecosystem structures, processes, and functions, while also maintaining human life and production activities [1]. The scarcity of water resources, deterioration of water ecosystems, and their impact on other ecosystems have become global challenges in recent years, making the study of water ecosystem services increasingly important [2]. China’s rapid urbanization since the reform and opening up period has resulted in an increasing demand for water ecosystem services, and achieving sustainable development between urbanization and water ecosystems has been extensively studied.
Water ecosystem services refer to the natural environmental conditions and utilities that are essential for human survival, maintained by the water ecosystem and its ecological processes [3,4]. These services focus broadly on sustaining the environment and providing benefits to humans [5,6]. The Millennium ecosystem assessment (MA), as reported by the United Nations, has categorized ecosystem services into four functions: supply, regulation, culture, and support [4,7]. Several methods, including the evaluation method, material quality method, and energy method, have been applied to evaluate these functions [8,9,10]. Among these, the material quality method has been widely used due to its ability to retrieve the amount of ecosystem services accurately and intuitively. Notably, the Integrated Valuation of Ecosystem Services and Trade-offs (InVEST) model is one of the most effective tools for evaluating various ecosystem services, as it can integrate both the evaluation method and the material quality method [11]. For instance, Yang et al. [12] used the InVEST model to evaluate the water yield service in South China and obtained satisfactory results. The SDR module from InVEST was also applied by He et al. [13] to study the spatial distribution of soil erosion in the Qihe River Basin in the Taihang Mountains in China. Additionally, Yang and Huang [14] analyzed and simulated the water yield and purification services of the Bosten Lake basin in the arid region of Northwest China based on InVEST.
Urbanization poses a significant threat to water ecosystem services, and its impact has become a major research topic in geography. Researchers have studied the relationship between water yield and urbanization in several regions, including the Beiyun River Basin [15] and Xiangjiang River Basin [16] in China. It was found that urban expansion would lead to a certain increase in water yield despite high water demand [16]. Urban green spaces have been found to play a positive role in water regulation and purification [17]. However, previous studies lacked dynamic interaction in terms of spatial and local relationships and ignored the influence of different urbanization levels. Due to the positive relationship between urbanization and water yield [18], the mismatch between regions with high levels of urbanization (demander) and high-water ecosystem service (supplier) was often overlooked [19]. Therefore, it was necessary to study the interactive processes between urbanization and water ecosystem services in space to obtain more information on how water ecosystem services respond to difference urbanization levels and whether this response persists, changes, or even reverses.
Various methods, including the correlation coefficients [20], trade-off degree [6], and spatial autocorrelation model [21], have been employed to examine the trade-off and synergy between urbanization and ecosystem services. However, the correlation coefficients and trade-off degree methods overlook the spatial clustering modes and dependencies between urbanization and ecosystem services. The bivariate spatial autocorrelation model can overcome this limitation and measure the spatial clustering patterns between urbanization and ecosystem services. Thus, the bivariate spatial autocorrelation model was applied in this research to investigate the local variations in cluster patterns between urbanization and water ecosystem services, providing more detailed insights into the developed urban area, developing urban area and rural area.
The Dongjiang River Basin (DRB) represents a critical water resource in the eastern region of the Pearl River Basin and is affected by various water ecology issues of significant impact. Given its importance as a fundamental constituent of the Pearl River Delta’s economy, this area has undergone rapid urbanization, exhibiting notable spatial variation across the basin. This study employs the DRB as the research region and assesses the spatiotemporal heterogeneity of water ecosystem services and urbanization from 1985 to 2020, utilizing the InVEST model and grid analysis. The study utilizes geographically weighted centers and standard deviation ellipses to track their movements over time from a global perspective. Furthermore, it explores the spatial relationship between urbanization and water ecosystem services through a bivariate spatial autocorrelation model, with the goal of providing a scientific reference for the sustainable development of watershed urbanization and water ecology.
2. Study Area
The Dongjiang River is located in southern China (113°25′–115°53′E, 22°27′–25°12′N, as depicted in Figure 1) and is one of the three primary water systems in the Pearl River Basin. Originating from the Yajibo Mountain in Jiangxi Province, the river flows through the cities of Heyuan, Huizhou, and Dongguan before eventually reaching the Pearl River Delta and entering the sea via the northern and southern waterways. The Dongjiang River Basin (DBR) covers a total area of 3.6 × 10⁴ km2 and has a maximum elevation of 1489 m. The DRB is characterized by a subtropical monsoon climate, with an annual average temperature of approximately 20 °C. The highest temperatures occur in July and August, reaching up to 35 °C. The annual precipitation ranges from 1500 to 2500 mm, with the majority of the rainfall occurring from May to September.
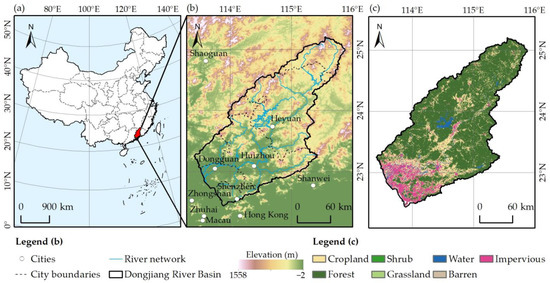
Figure 1.
The study area. (a) The location of the Dongjiang River Basin (DRB) in China. (b) The topography and administrative regions in the DRB. (c) The land use/land cover distribution in the DRB in 2020.
The DRB exhibits significant terrain differences and corresponding urbanization patterns, making it an ideal area to explore differences in urbanization models. The level of urbanization in the DRB increases from upstream to downstream, transitioning from economically underdeveloped regions to the most developed areas in China, with population concentration increasing towards the downstream areas. Additionally, the DRB is a relatively complete and closed system with less interference from external water systems. The hydrological and geomorphological features within the basin exhibit significant differences, transitioning from mountainous areas in the upstream to plain areas with river networks in the downstream. The spatial heterogeneity of the water network structure is strong, making it suitable for studying water ecological spatial heterogeneity. Therefore, selecting the Dongjiang River Basin as the study area is conducive to analyzing the spatial relationship between urbanization and water ecological system services.
Studying the relationship between water ecology and urbanization has high application value, particularly with regards to the most crucial source of drinking water in the Guangdong–Hong Kong–Macao Greater Bay Area, which is one of the largest urban agglomerations globally. Under the pressure of water supply for megacities such as Guangzhou, Dongguan, Shenzhen, and Hong Kong, the per capita water resources are just one-third of the national average. Consequently, the water supply capacity of the Dongjiang River has reached its limit, while the demand for water continues to rise, resulting in a tense supply–demand contradiction. Therefore, optimizing the aquatic ecological structure and function from the perspective of urban water spatial regulation to solve the problem of water supply–demand contradiction is an urgent demand under the sustainable development strategy of the Guangdong–Hong Kong–Macao Greater Bay Area.
3. Materials and Methods
3.1. Materials
This study employed the InVEST model to evaluate four types of water ecosystem services. To collect multiple datasets from various sources, we referred to Table 1 for input parameters.
The Digital Elevation Model (DEM), named the Global Digital Elevation Model (GDEM), was acquired from the Advanced Spaceborne Thermal Emission and Reflection Radiometer (ASTER). It was released jointly by America’s National Aeronautics and Space Administration (NASA) and Japan’s Ministry of Economy, Trade, and Industry (METI) at a spatial resolution of 30 m. In 2019, Version 3 was issued with additional stereo pairs, revealing significant improvements from Versions 1 and 2 (https://asterweb.jpl.nasa.gov/gdem.asp (accessed on 10 May 2022)). We downloaded the mirrored GDEM in China from the Geospatial Data Cloud (http://www.gscloud.cn/ (accessed on 24 April 2022)). Additionally, according to previous studies [22,23], the river networks were extracted via DEM, with small tributaries being removed to reflect the main structure of the network.
This study utilized the annual Land Use and Land Cover classification (LULC) data with a spatial resolution of 30 m [14]. The land cover types were classified into seven categories, including cropland, forest, shrub, grassland, water, barren, and impervious land. The datasets from 1985, 1990, 1995, 2000, 2005, 2010, 2015, and 2020 were used in this study, with a five-year phase considered reasonable to reflect urban development track based on previous studies [16,24,25]. Although rapid urbanization occurred in DRB starting from the early 1980s, it was challenging to acquire standard data from that time period. Therefore, 1985 was chosen as the starting year, as it was the earliest year from which all necessary materials could be obtained.
The sand, silt, clay, and organic carbon contents were obtained from the Harmonized World Soil Database (HWSD) at a spatial resolution of 1 km. Meanwhile, root depth data were acquired from the International Soil Reference and Information Center (ISRIC) at a spatial resolution of 30 m. Prior to calculating the soil retention, all data were resampled to 30 m.
Meteorological data, including precipitation and temperature, were extracted from 32 meteorological stations around the study area for the years 1985, 1990, 1995, 2000, 2005, 2010, 2015, and 2020. As precipitation is known to exhibit variation with elevation due to the influence of topography on atmospheric processes, the CoKriging method was employed to develop a spatial model of the relationship between precipitation and DEM. The resulting model was then used to interpolate precipitation values at unsampled locations. Notably, this method yielded more precise interpolated precipitation values than traditional interpolation methods that do not consider the topography.
The population demographic statistics and GDP statistics were collected from the city statistical yearbook for the years 1985, 1990, 1995, 2000, 2005, 2010, 2015, and 2020. The data were gathered from administrative units within the DRB, which includes Shenzhen, Dongguan, Guangzhou, Huizhou, Heyuan, Shaoguan, Ganzhou, and Meizhou. Administrative vector data attributes, obtained from the National Geomatics Center of China (http://bzdt.ch.mnr.gov.cn/index.html (accessed on 10 May 2022)), were used to assign population and GDP. These data were then rasterized using the grid spatialization method [26].
To classify urbanization levels, nighttime lights (NTL) data were utilized. Wu et al. [27] developed the time-series DMSP-OLS-Like data of 1km to address cross-sensor inconsistencies by integrating DMSP-OLI (1992–2013) and SNPP-VIIRS (2013 to present). According to Zhang et al. [28], an NTL value greater than 50 was classified as an urban area and less than 50 as a rural area. Urban–rural boundaries were established in 1992, 1995, 2000, 2005, 2010, 2015, and 2020, and three urbanization levels were divided into developed urban area, developing urban area, and rural area. For example, in 2020, if an area was urban in both 2020 and 2015, it was considered a developed urban area. If it was urban in 2020 but rural in 2015, it was categorized as a developing urban area. Otherwise, it was deemed a rural area. It is important to note that urbanization levels were not included in the data for 1985 and 1990. Additionally, due to the loss of NTL data before 1992, the urban–rural boundary in 1990 was replaced with the boundary established in 1992.

Table 1.
Data list.
Table 1.
Data list.
| Data Type | Source |
|---|---|
| DEM | Geospatial data cloud |
| LULC | [14] |
| Soil information | HWSD & ISRIC |
| Meteorological data | 32 meteorological stations |
| Population and GDP | City statistic yearbook |
| Night light images | DMSP-OLS-Like Data [27] |
3.2. Methods
This study aimed to evaluate the spatial interactions between water ecosystem services and urbanization across different urban levels in the DRB. To achieve this, the Comprehensive Ecosystem Services Index (CESI) was created using the InVEST model to evaluate water yield, soil retention, and water purification of phosphorus and nitrogen. Additionally, the Comprehensive Urbanization Index (CUI) was created using three urbanization indicators, including population density, GDP density, and built-up rate. For the basin scale, spatial migration trend analysis was conducted using the geographically weighted center and standard deviation ellipse to examine the general movement and directional difference of urbanization and water ecosystem services. For the local scale, bivariate spatial autocorrelation analysis was conducted to reveal the spatial heterogeneity of interaction between water ecosystem services and urbanization in response to different urban levels (developed urban, developing urban, and rural) (Figure 2).
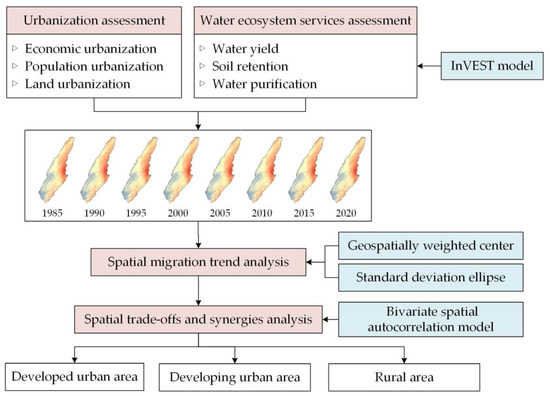
Figure 2.
Flow chart of methods.
All data were reprojected to the Albers equal area projection to account for the area effect. Parameters related to water ecosystem services were interpolated to a 30 m resolution using the Kriging method since most of the original data were at that resolution. On the other hand, parameters related to urbanization were rasterized to a 1 km resolution using the grid spatialization method [26]. Finally, both the water ecosystem service and urbanization data were unified into a 1 km resolution by Kriging for interactive analysis.
3.2.1. Water Ecosystem Services Assessment Based on the InVEST Model
The InVEST model is a comprehensive tool that integrates various biophysical and socio-economic data to provide a range of ecosystem service assessment capabilities, and therefore is widely used [24,29,30] to evaluate water ecosystem services. This model was used to assess the four water ecosystem services, namely water yield, soil retention, and water purification of phosphorus (P) and nitrogen (N), using the corresponding modules of the InVEST model. Based on previous studies [6,31], the values of these services were normalized and combined into a CESI index that represents the overall level of water ecosystem services provided. Because all four services were deemed essential, they were given equal weight [6,32].
where ESi is one of the four ecosystem services introduced as follows:
- Water yield
The Water Yield model is one of the core modules in the InVEST model, which is designed to quantify the water provision ecosystem service by estimating the amount and timing of surface water flow from a landscape. It is based on the principle of the water balance equation (Equation (2)), which calculates the difference between the amount of water that enters and leaves a given area. The module considers various factors that affect water yield, including precipitation, evapotranspiration, soil water holding capacity, and land cover type. Further information about the water yield module can be found in the InVEST user guide [33].
where Y(x) is the annual water yield of pixel x, AET(x) is the actual annual evapotranspiration of pixel x on the corresponding LULC, and P(x) is the annual total precipitation of pixel x.
- 2.
- Soil retention
The Sediment Delivery Ratio (SDR) module was used to quantify the proportion of sediment generated within a watershed that is delivered to a river network. The module considers the interactions between the land use/land cover, soil properties, rainfall, and topography to predict the potential sediment yield of a watershed. This can be expressed by Equation (3).
where SR is soil retention, RKLS is the potential soil loss, USLE is the actual soil loss, R is the rainfall erosivity, K is the soil erodibility, LS is the slope length gradient factor, C is the cover management factor, and P is the support practice factor.
The Universal Soil Loss Equation (USLE) is a widely used model in InVEST to calculate the annual average rate of soil loss caused by rainfall and runoff at the pixel size. It is based on the idea that soil erosion is caused by the interaction of several factors, such as the impact of soil and water conservation practices (P) as well as specific crop or vegetation cover (C). For mountainous areas, adjustments were made to P and C based on the land use/land cover types (Table 2), as outlined in previous studies [33,34,35]. For other parameters, please refer to reference [6].

Table 2.
The referencing values of the cover management factor (C) and support practice factor (P).
- 3.
- Water purification of N and P
The Nutrient Delivery Ratio (NDR) module is one of the modules in the InVEST model that is designed to estimate the nutrient export and delivery from a watershed to the downstream water bodies. The module estimates nutrient loads from different sources and combines it with land use/land cover data and hydrologic and erosion data to simulate the transport of nutrients through the watershed, as shown in Equation (6). It also takes into account the nutrient retention capacity of the watershed, such as nutrient uptake by vegetation, nutrient retention in the soil, and nutrient retention in wetlands, before estimating nutrient delivery to downstream water bodies. In this study, nitrogen (N) and phosphorus (P) were chosen as the key nutrients.
where Ax is the pollution load value of pixel x, Hx is the hydrological sensitivity, Px is the output coefficient, Nx is the runoff coefficient, Nw is the mean runoff coefficient over the basin, and is the total water yield from the upstream basin fed into pixel x.
3.2.2. Urbanization Assessment
Urbanization was identified through four dimensions, including population urbanization, economic urbanization, land urbanization, and social urbanization [36,37]. However, social urbanization is abstract and difficult to qualify spatially. As population, economic, and land urbanizations can reasonably reflect social urbanization, we exclude social urbanization from our analysis. Therefore, we used population density, GDP density, and built-up rate as proxies for measuring population, economic, and land urbanization, respectively, based on previous studies [28,37,38]. These parameters were then spatialized and mapped using LULC at 1 km resolution.
The three indicators were normalized and aggregated into CUI using Equation (9).
where PU′, EU′, and LU′ are normalized population urbanization, economic urbanization, and land urbanization, respectively.
3.2.3. Spatial Migration Trend Analysis
This study explored the distribution shape, migrated direction, and trends of urbanization and water ecosystem services using two analytical methods: the geographically weighted center and standard deviation ellipse. The former was utilized to analyze the general movement of an object [39], while the latter measured the directional distribution of movement and was widely applied to sociological and geographical spatial analysis [40,41,42]. These equations have been extensively applied in determining impervious surface expansion [43,44] and pest distribution analysis [45].
- Geographically weighted center
The geographically weighted center method is a spatial analysis technique used to identify the central point of a distribution for the urbanization (CUI) and water ecosystem services (CESI), as shown in Equation (10). In order to estimate the tracking routes of these centers over time, the least square method is often utilized, which provides valuable insights into the overall migrated orientation of urbanization or water ecosystem services. Moreover, the angles of tracking routes are used to quantify changes in orientation.
where and are the coordinate pairs of feature i, is the geographical weight of CUI or ECSI, and n is the number of features. The weighted values are based on their distance from the center point, with closer cells receiving higher weights.
- 2.
- Standard deviation ellipse
The standard deviation ellipse is a graphical representation of the spread and orientation of a two-dimensional dataset. It determines the standard deviation of x- and y-coordinates relative to feature center, resulting in the derivation of the axes of the ellipse. The standard deviation ellipse can provide information on the dispersion and shape of the dataset, as well as the correlation between the two dimensions. The difference in major and minor axes indicates the direction of oblateness, where a larger difference signifies a more significant direction. The size of the area enclosed by the ellipse is indicative of spatial range, with larger areas suggesting dispersion and smaller ones indicating clustering.
3.2.4. Spatial Trade-Offs and Synergies Analysis
The bivariate Moran’s Index, as one of the bivariate spatial autocorrelation models [46], is a statistical method used to measure the spatial autocorrelation between urbanization and water ecosystem services simultaneously, which was commonly employed by researchers [24,37,47] to analyze the spatial correlation between multiple variables.
Bivariate Moran’s Index is based on the Moran’s I statistic, which is a measure of spatial autocorrelation for a single variable. The bivariate version (Equation (11)) of the Moran’s I statistic is used to measure the spatial dependence between two variables.
where is the bivariate Moran’s index, n is the number of features, is the spatial weight matrix, is the CESI of feature i, and is the CUI of feature j.
The output of the analysis is a single coefficient () that ranges from −1 to 1. If is close to −1, it implies trade-off correlation and indicates whether the location has a high level of water ecosystem services surrounded by a low urbanization level (HL) or whether it has fewer water ecosystem services surrounded by high urbanization (LH). If is close to 1, it implies synergetic correlation and indicates whether the location has a high level of water ecosystem services surrounded by a high urbanization level (HH) or whether it has fewer water ecosystem services surrounded by lower urbanization (LL). If is close to 0, it indicates no spatial correlation. Therefore, four spatial clusters were identified in Figure 3.
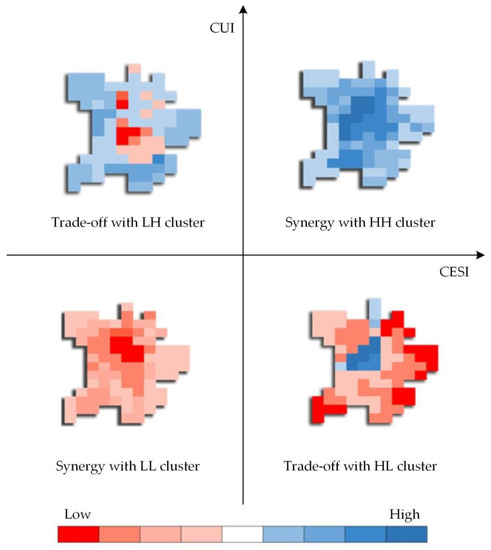
Figure 3.
Spatial clusters and relationship between water ecosystem services and urbanization.
4. Results
4.1. Spatio-Temporal Variations in Water Ecosystem Services
The total water yield of the DRB experienced fluctuations and a decrease from 1985 to 2020 (Figure 4a). Specifically, the water yield dropped by 38.9%, from 3.7 × 10¹⁰ m3 in 1985 to 2.2 × 10¹⁰ m3 in 2020. Although there was an increase of 50% during the 1990s, it continued to fluctuate until it reached a minimum level between 2015 and 2020. The trend of soil retention mirrored that of the water yield, with a decline from 8.8 × 10⁹ t to 7.0 × 10⁹ t during 1985–2020, representing a reduction of 20.4% (Figure 4a). There was also a rebound of 13.6% in the 1990s, followed by a drop of 22.7% from 2000 to 2020.
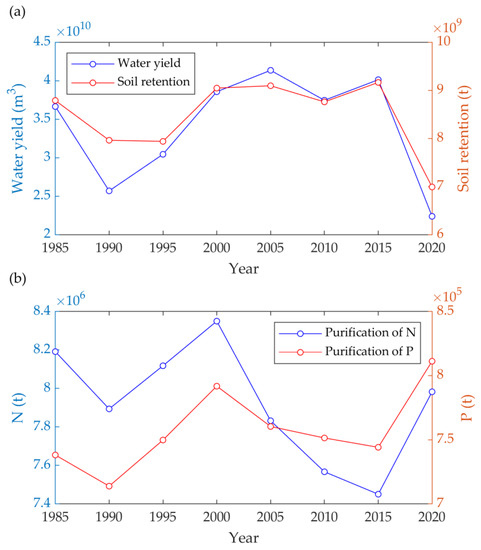
Figure 4.
Temporal variations of single water ecosystem service. (a) Variations of water yield and soil retention. (b) Variations in water purifications of N and P.
Water purification services showed a contrasting trend for N and P output. The N output demonstrated a wavelike decrease of 2.6% from 8.2 × 10⁶ t in 1985 to 8.0 × 10⁶ t in 2020 (Figure 4b). In contrast, the P output exhibited an increase of 9.9%, rising from 7.4 × 10⁵ t to 8.1 × 10⁵ t (Figure 4b). Taking both outputs into account, it is evident that the water purification services have become degraded due to the higher increment of P output.
In terms of spatial distribution, the water yield and purification services exhibited high values in the southwest, while registering low values in the northeast (Figure 5a). However, soil retention presented an opposite trend (Figure 5b). In the northeast, all service values indicated a downward trend from 1985 to 2020, gradually weakening towards the southwest (Figure 5e–h). Specifically, the water yield and purification of P were reversed in the southwest. Conversely, the services of water yield and soil retention improved in the southwest, but degraded in the northeast. Meanwhile, water purification services improved in the northeast and became degraded in the southwest.
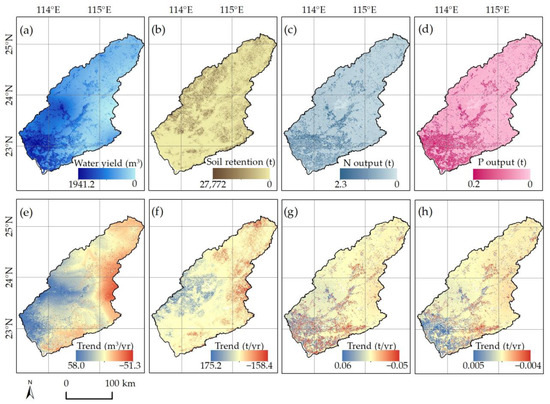
Figure 5.
Spatial distribution of water ecosystem services in 2020 and their trends during 1985–2020. (a–d) The spatial distribution of water yield, soil retention, water purification of N and P, of which the annual mean trends were (e–h).
Considering all the services, the CESI demonstrated a high value in the southwest that progressively decreased toward the northeast (Figure 6a). This finding was consistent with the distribution of water yield and purification of N and P, but contradicted the trend for soil retention. The CESI decreased in the northeast and increased in the southwest (Figure 6b), in line with the trend observed for all ecosystem services.
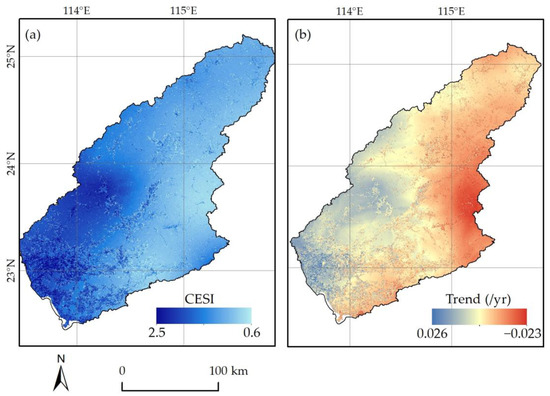
Figure 6.
The spatial distribution of CESI (a) in 2020 and its annual mean trend (b) during 1985–2020.
4.2. Spatio-Temporal Characteristics of Urbanization
Only the CUI is shown in Figure 7 because the three urbanization types were consistently distributed. The CUI exhibited a high value in the southwest and decreased towards the northeast. Urbanization was most concentrated in the DRB delta, which experienced the fastest growth in cities. The level of urbanization in the DRB displayed an incessant upward trend, with downstream regions developing substantially faster than the middle and upper reaches.
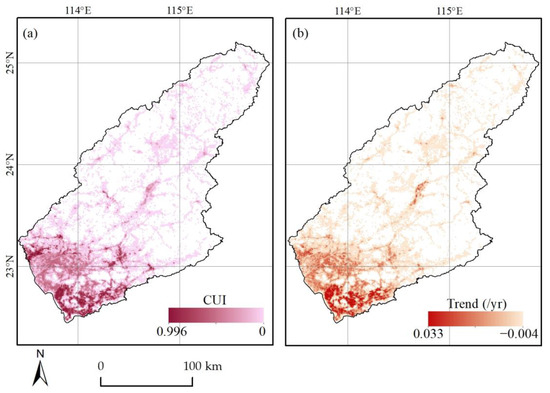
Figure 7.
The spatial distribution of (a) CUI in 2020 and its annual mean trend (b) during 1985–2020.
Compared to water ecosystem services, urban distribution remained relatively uniform, displaying high values in the southwest and low values in the northeast. This suggested that highly developed areas offered relatively high-quality ecological services. Additionally, trend analysis indicated a similar pattern, with the southwest exhibiting a higher rate of urban development and ecosystem service improvement than the northeast. This implied that rapid urban development corresponded to improved water ecological services.
4.3. Spatial Migration Trend Analysis
The geographically weighted center of the CUI was situated in the downstream area of the DRB, while the CESI was centered in the middle reaches, proximal to the geometric center of the entire watershed (Figure 8). Both centers exhibited temporal shifts, and their trends were comparable, indicating that they both tended to migrate downstream in a northeast–southwest direction, with the CUI moving a greater distance than the CESI.
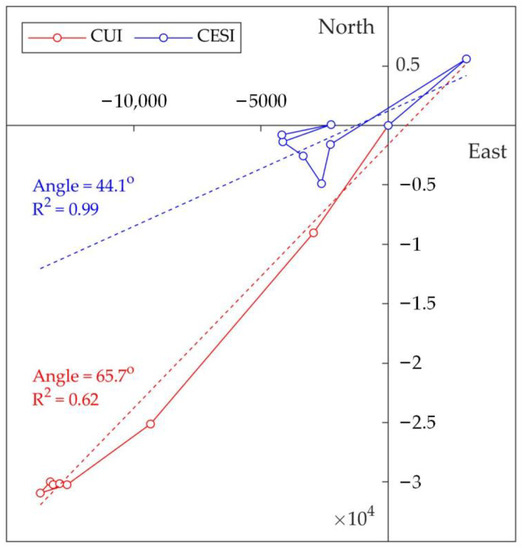
Figure 8.
Migration routes of geographically weighted center. These coordinates were normalized under the condition that the migration angle was unchanged. The dotted line was the least square estimation of migration routes with R2. The angle is measured with respect to east, which is taken as 0 degrees. The origin of the coordinate axis (0, 0) represents the year 1985.
CUI displayed a relatively high migration rate before 2000, which subsequently decreased rapidly and rotated in a clockwise direction. Similarly, CESI weakened after 1995 and migrated clockwise. The greatest migration transpired between 1990 and 2000, encompassing both CUI and CESI.
The migration angles of the centers demonstrated significant discrepancies, despite both migrating from the northeast to the southwest. The averaged migration angle of CUI was 65.7°, signifying a southward movement, while the averaged angle of CESI was 44.1°, indicating a westward movement. The difference in their angles was 21.6°, suggesting that the water ecosystem services and urbanization were not entirely synchronized, leading to a potential trade-off in the mismatch zone.
The standard deviation ellipse of the CUI exhibited a northeast to southwest direction, indicating that the urban development of the DRB was significantly directional and aligned with water ecosystem services (Figure 9a). This directionality was consistent with the distribution of the river, suggesting a robust constraint from the hydrological network. However, their trends displayed a marked divergence.
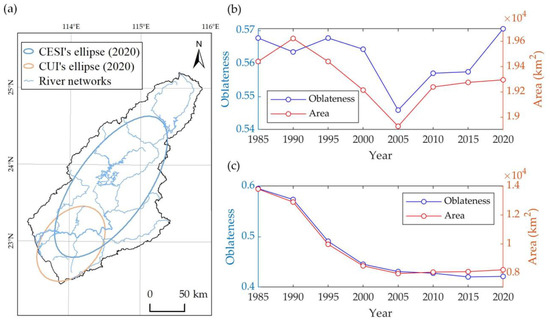
Figure 9.
Standard deviation ellipses of CUI and CESI and their trends. (a) Standard deviation ellipses of CUI and CESI. (b) CESI ellipse trend. (c) CUI ellipse trend.
During 1985–2020, the area of the CESI ellipse fluctuated, and its shape remained almost constant. The ellipse’s oblateness increased, indicating that the directionality was enhanced, and the water ecosystem services were closer to the rivers. Conversely, the area and oblateness of the CUI ellipse both decreased, suggesting that urbanization was becoming increasingly centralized, and the constraining effect of the river was diminishing.
4.4. Spatial Trade-Offs and Synergies Analysis
To investigate the variations of trade-offs and synergies across different levels of urbanization, the developed urban area, developing urban area, and rural area were classified, as depicted in Figure 10. The majority of the DRB regions were categorized as rural areas, accounting for 83.3% of the entire DRB in 2020 and distributed in the middle and north regions. The developed and developing urban areas were clustered together in the southwest, constituting 13.4% and 3.3% of the DRB in 2020, respectively.
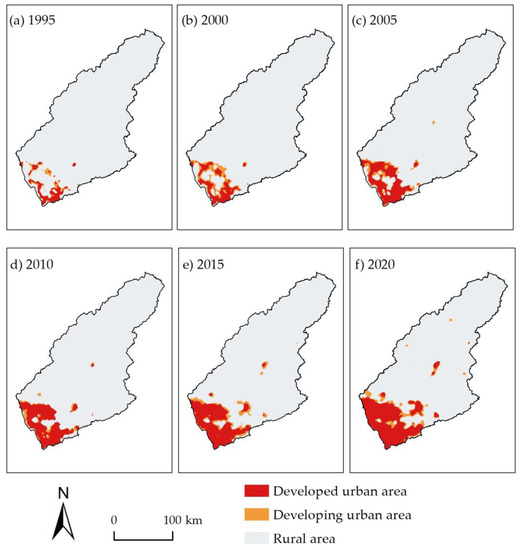
Figure 10.
Distributions of different urbanization levels in (a) 1995, (b) 2000, (c) 2005, (d) 2010, (e) 2015, and (f) 2020.
Between 1995 and 2020, the developed area underwent a significant expansion, increasing from 8.9 × 10² km2 to 4.7 × 10³ km2, while the rural area contracted from 3.4 × 10⁴ km2 to 2.9 × 10⁴ km2. Two periods of rapid urbanization were observed: 1995–2000 (P1) and 2010–2020 (P2). The developing urban areas in 2000, 2015, and 2020 were all 1.1 × 10² km2, indicating that the urban area expanded 1.1 × 10² km2 and 2.2 × 10² km2 in P1 and P2, respectively.
The proportion of synergies in the DRB showed a notable increase over time, rising from 4.2% in 1985 to 33.7% in 2000, and then gradually to 40.4% in 2020 (Figure 11a). In contrast, the proportion of trade-offs slightly decreased from 20.0% in 1985 to 14.2% in 2020. Synergies and trade-offs exhibited opposing trends, with fluctuating patterns after 2000, moving up and down at precisely opposite rates.
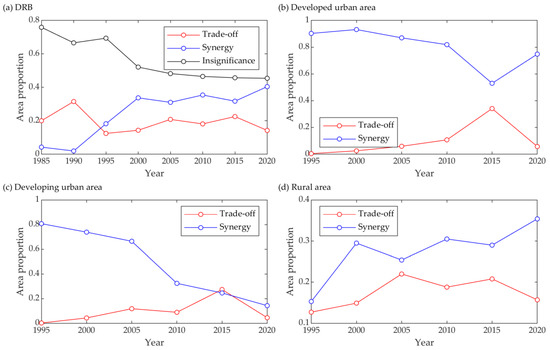
Figure 11.
Trends of trade-offs and synergies with the study area and different urbanization levels. (a) The whole study area of DRB. (b) Developed urban area. (c) Developed urban area. (d) Rural area.
However, significant differences were observed in the variation of subregions based on urbanization levels. Only the rural area exhibited a similar trend of increased synergy to that of the DRB, rising significantly from 15.3% in 1995 to 35.4% in 2020 (Figure 11d), while trade-offs slightly increased. In contrast, the developed (Figure 11b) and developing (Figure 11c) urban areas both showed decreasing trends for synergies. The developed urban area was dominated by synergy, which slightly decreased from 90.3% to 74.8% during 1985–2020, while the synergy in the developing urban area plummeted from 80.8% to 14.3%. After 2010, more than 50% of the regions in the developing urban area were insignificant, indicating that the developing urban area, as the boundary or transition zone between the developed urban area and rural area, was strengthened. For trade-offs, all urbanization levels exhibited a slightly increasing trend after 1995, consistent with the DRB.
Regarding the spatial distribution, the LL cluster of synergy expanded from 71 km2 to 1.1 × 10⁴ km2, dominating the northeast and east (Figure 12). This expansion was the largest contribution to the synergy increase trend in DRB, as shown in Figure 11a. The HH cluster was predominantly concentrated in the southwest, expanding from a small patch to almost the entire southwest, with an area from 1.4 × 10³ km2 to 3.8 × 10³ km2. The maximum expansion process occurred before 2000, during which the LL cluster increased 127 times, and the HH increased 1.1 times.
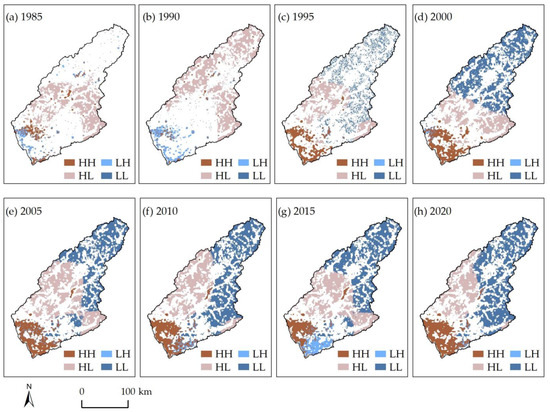
Figure 12.
Trends of spatial trade-offs and synergies between water ecosystem service and urbanization in (a) 1985, (b) 1990, (c) 1995, (d) 2000, (e) 2005, (f) 2010, (g) 2015, and (h) 2020, the black space is statistically insignificant. Spatial patterns of HH or LL indicated the synergy; otherwise, it was the trade-off.
As shown in Figure 11, the trade-offs, including HL and LH, tended to slowly increase in all urbanization levels. This increase was mainly induced by the expansion of HL in the northwest, consistent with the results induced by the difference in migration angles. As the CUI moved to the south and CESI moved to the west (Figure 8), a mismatch occurred in the northwest. In the Northeastern Huizhou City, the patterns of HL and LL translated to each other over the years (Figure 12e–h), which was the reason for the fluctuation of trade-offs up and down after 2000 in the rural area (Figure 11d). The conversion from HH to LH in 2015 (Figure 12g) dominated the whole Shenzhen City, leading to the abnormal fluctuation of trade-off and synergy in the developed urban area, as shown in Figure 11b.
The non-significant area showed a monotonically decreasing trend from 3.2 × 10⁴ km2 to 1.7 × 10⁴ km2. In 1985, it was widespread throughout the study area but was dispersedly distributed in 2020. These changes implied that the relationship between water ecosystem services and urbanization became closer with pronounced spatial aggregation.
5. Discussion
The analysis of the whole DRB revealed that the increase in synergy was mainly due to the increment of cluster LL in the rural area. This finding suggests that the vast rural area plays a pivotal role in promoting the harmonious development of water ecosystem services and urbanization in the DRB. Therefore, it is imperative for the government to focus on coordinating the economy and ecosystem of the rural area. However, both developed and developing urban areas experienced a decline in synergies and an increase in trade-offs. The primary reason for this was the increment of cluster LH, which indicates that the improvement of water ecosystem services lagged behind the pace of urbanization. Notably, in Shenzhen City, the insufficiency of ecosystem services could potentially hinder sustainable economic development in the future. In contrast, Dongguan City, which is adjacent to Shenzhen City, managed to maintain synergy (cluster HH) since 2005. In the west bank of the middle Dongjiang River, the trade-off increased due to the expansion of cluster HL. Nevertheless, the surplus of water ecosystem services as a sending system [48] could support interregional flows and offset the ecological deficit in the urban area.
The spatial distribution of water ecosystem services is significantly influenced by various factors, including precipitation, topography, and land cover. Water yield was positively associated with precipitation, and its trend was dominantly influenced by precipitation. Soil retention was affected by topography and vegetation cover, owing to strong erosion in the mountains and soil fixation by dense vegetation. Land cover, which is considered one of the most critical factors influencing ecosystem services [44,49], was utilized in the NDR module to simulate water purification. This approach represented a potential state with some deviation from the measured nutrient content. The water yield exhibited more significant variations than the other services, dominating the changes in CESI. According to the trend analysis and bivariate spatial autocorrelation model, there were unusual migrations and spatial patterns of synergy and trade-off in 1990. This was primarily due to lower precipitation than in previous years, leading to an abnormal distribution of the water yield and CESI. This finding highlights the significant influence of meteorological changes on the results. Therefore, it is crucial to ensure the availability of reliable meteorological data sources and other underlying surface data, as the underlying surface properties significantly impact the water cycle processes [50,51].
For the entire basin, the difference in migration between CESI and CUI suggested that the improvement of water ecosystem services lagged behind urban development, which could exacerbate water conflicts in the future. However, this situation did not occur at the local scale. In some regions, the synergic relationship between urbanization and water ecosystem services has expanded in the past, as urbanization kept pace with water ecosystem services. This delay in conflicts provided a feasible way for the sustainable development of urban water ecosystems. However, the mismatch of migration routes (Figure 8) has left a gap in space, particularly in the northwest regions, which have been dominated by the trade-off relationship (Figure 12). In such situations, the aquatic ecosystem would face significant pressure from urbanization, further increasing the risk of water conflicts. These regions are predominantly located in the transition zone between developed and underdeveloped areas, and the government managers should pay more attention to them.
The synergies observed between water ecosystem services and urbanization were consistent with the findings of other studies that have indicated a positive relationship. For instance, Zhou et al. [18] highlighted that urban expansion could increase surface runoff and base flow, while the increase in construction land could also enhance water yield and soil retention services [52]. However, water purification services were negatively related to urbanization, which is consistent with the findings of Gao et al. [52] and Li et al. [24]. Nevertheless, as the water purification change accounted for a smaller proportion than the other two services, it did not reverse the CESI trend.
The models and methods employed in this study were limited to multisource data from meteorological stations, land use/land cover, and statistical yearbooks. However, there were only 32 meteorological stations around the study area, which may make it challenging to accurately represent the spatial distribution of meteorological factors, despite the use of spatial interpretation considering topography. Moreover, the land use and land cover data retrieved from remote sensing satellites of Landsat missions posed considerable challenges in mapping the long time-series classification. The availability of Landsat 5, which was the only operational platform prior to 1999, was further limited by following the commercial pre-order acquisition plan before 1990 [53,54,55], and it lost its relay capability in 1992 [56]. Additionally, the urbanization data retrieved from the statistical yearbook using the downscaling method also had some uncertainties in terms of spatial information. Furthermore, statistical errors during the demographic census needed to be corrected to restore the real distribution.
In this study, migration analysis and the bivariate spatial autocorrelation model were utilized to explore the correlation between water ecosystem services and urbanization. However, their quantitative relationship remains unclear, raising the question of how they affect each other and to what extent. Further attribution analyses are necessary to provide more detailed insights into the dynamics of water or urban ecology systems. It is worth noting that the spatial relationships were affected by the scale of analysis. Li et al. [24] reached the opposite conclusions to those of Chen et al. [57] and Xia et al. [58] when analyzing the impact of land use and land cover on the services of water yield and soil erosion, depending on the landscape pattern scale. While land use was examined at the basin scale, land cover was analyzed at the pixel scale. Therefore, future studies should account for this scale difference when analyzing spatial relationships. Furthermore, it is important to acknowledge that the bivariate Moran’s Index is sensitive to outliers, which can distort the results and lead to incorrect conclusions. Additionally, this method assumes that the data follow a normal distribution, and if the data are not normally distributed, the results may be inaccurate.
6. Conclusions
In our study, we utilized the migration trend analysis and bivariate spatial autocorrelation model to investigate the variation of interaction between water ecosystem services and urbanization in different levels of urbanization, with the aim of revealing a local mismatch under basin-level homogeneity. Our analysis revealed several key findings:
- The water ecosystem service exhibited a spatial polarization, with a decrease in the northeast (upstream) and an increase in the southwest (downstream). Among the three services analyzed, namely water yield, soil retention, and P purification, only N purification showed an improvement during 1985–2020.
- Urbanization was found to result in a spatial polarization that was consistent with water ecosystem services. The developed urban area was concentrated downstream and exhibited a faster growth rate than the underdeveloped cities upstream.
- The mismatch of migration routes was the main cause of increasing trade-off. While both water ecosystem services and urbanization exhibited a similar direction of distribution, their spatial migration showed significant differences. Specifically, the urban area was increasingly centralized and moved southward. On the other hand, the aquatic ecosystem moved westward. This deviation in migration angles resulted in a trade-off (cluster HL) in the west band of middle Dongjiang River.
- The interactions between water ecosystem services and urbanization responded differently to different urban levels. Particularly in the developing urban area, as a transition zone between the developed urban area and rural area, it faced a great challenge of dramatically decreasing synergies. Furthermore, the rural area dominated the increasing synergies of the entire basin, which plays a pivotal role in promoting the sustainable development of urban-water space configuration.
This study recommends that policy-makers consider the spatial heterogeneity of water ecosystem services and urbanization in different urban levels when developing urbanization plans and water resource management strategies. Additionally, implementing measures to maintain the synergy in the rural area and mitigate the trade-off in the developing urban area is crucial. In terms of future research, the study attempts to explore the solutions to the water resource supply–demand conflict from the perspective of the ecosystem service flow, in order to optimize the spatial allocation of urban-water resources in the Dongjiang River Basin.
Author Contributions
K.J. and A.H. contributed equally to this work. Conceptualization, J.Y.; Data curation, L.D.; Formal analysis, Z.L.; Funding acquisition, K.J., X.Y. and J.Y.; Methodology, A.H.; Project administration, X.Y.; Software, L.D.; Supervision, X.Y.; Validation, Z.L.; Writing—original draft, K.J. and A.H.; Writing—review & editing, K.J. All authors have read and agreed to the published version of the manuscript.
Funding
This research was funded by GDAS’ Project of Science and Technology Development (grant number 2020GDASYL-20200301003, 2021GDASYL-20210103003), the National Natural Science Foundation of China (Grant No. 42201379, 41976189), Natural Science Foundation of Guangdong Province (2020A1515011068), Science and Technology Program of Guangzhou, China (Grant No. 202201010321).
Institutional Review Board Statement
Not applicable.
Informed Consent Statement
Not applicable.
Data Availability Statement
Not applicable.
Acknowledgments
We would like to thank Editage for English language editing and reviewers for their thoughtful comments towards improving our manuscript.
Conflicts of Interest
The authors declare no conflict of interest.
References
- Zhao, T.; Ouyang, Z.; Wang, X.; Miao, H.; Wei, Y. Ecosystem services and their valuation of terrestrial surface water system in China. J. Nat. Resour. 2003, 18, 443–452. [Google Scholar]
- Aznar-Sánchez, J.A.; Velasco-Muñoz, J.F.; Belmonte-Ureña, L.J.; Manzano-Agugliaro, F. The worldwide research trends on water ecosystem services. Ecol. Indic. 2018, 99, 310–323. [Google Scholar] [CrossRef]
- Loomes, R.; O'Neill, K. Nature's Services: Societal Dependence on Natural Ecosystems. Conserv. Biol. 1997, 6, 220–221. [Google Scholar] [CrossRef]
- Ouyang, Z.; Zhao, T.; Wang, X.; Miao, H. Ecosystem services analyses and valuation of China terrestrail surface water system. Acta Ecol. Sin. 2004, 24, 2091–2099. [Google Scholar]
- Armatas, C.; Campbell, R.M.; Watson, A.E.; Borrie, W.; Christensen, N.; Venn, T.J. An integrated approach to valuation and tradeoff analysis of ecosystem services for national forest decision-making. Ecosyst. Serv. 2018, 33, 1–18. [Google Scholar] [CrossRef]
- Zhang, H.; Deng, W.; Zhang, S.; Peng, L.; Liu, Y. Impacts of urbanization on ecosystem services in the Chengdu-Chongqing Urban Agglomeration: Changes and trade-offs. Ecol. Indic. 2022, 139, 108920. [Google Scholar] [CrossRef]
- Millennium Ecosystem Assessment (MEA). Ecosystems and Human Well-Being: Synthesis; Island Press: Washington, DC, USA, 2005. [Google Scholar]
- Egan, K.J.; Herriges, J.A.; Kling, C.L.; Downing, J.A. Valuing Water Quality as a Functionof Water Quality Measures. Am. J. Agric. Econ. 2004, 91, 106–123. [Google Scholar] [CrossRef]
- Dennedy-Frank, P.J.; Muenich, R.L.; Chaubey, I.; Ziv, G. Comparing two tools for ecosystem service assessments re-garding water resources decisions. J. Environ. Manag. 2016, 177, 331–340. [Google Scholar] [CrossRef]
- Deng, L.; Yang, Z.; Su, W. Valuing the Water Ecosystem Service and Analyzing Its Impact Factors in Chongqing City Under the Background of Urbanization. Res. Soil Water Conserv. 2019, 26, 208–216. [Google Scholar]
- Yang, Y.; Li, M.; Feng, X.; Yan, H.; Su, M.; Wu, M. Spatiotemporal variation of essential ecosystem services and their trade-off/synergy along with rapid urbanization in the Lower Pearl River Basin, China. Ecol. Indic. 2021, 133, 108439. [Google Scholar] [CrossRef]
- Yang, D.; Liu, W.; Tang, L.; Chen, L.; Li, X.; Xu, X. Estimation of water provision service for monsoon catchments of South China: Applicability of the InVEST model. Landsc. Urban Plan. 2018, 182, 133–143. [Google Scholar] [CrossRef]
- He, S.; Zhu, W.; Cui, Y.; He, C.; Ye, L.; Feng, X.; Zhu, L. Study on Soil Erosion Characteristics of Qihe Watershed in Taihang Mountains Based on the InVEST Model. Resour. Environ. Yangtze Basin. 2019, 28, 426–439. [Google Scholar]
- Yang, J.; Huang, X. The 30 m annual land cover dataset and its dynamics in China from 1990 to 2019. Earth Syst. Sci. Data 2021, 13, 3907–3925. [Google Scholar] [CrossRef]
- Xu, J.; Liu, S.; Zhao, S.; Wu, X.; Hou, X.; An, Y.; Shen, Z. Spatiotemporal Dynamics of Water Yield Service and Its Response to Urbanization in the Beiyun River Basin, Beijing. Sustainability 2019, 11, 4361. [Google Scholar] [CrossRef]
- Deng, C.; Zhu, D.; Nie, X.; Liu, C.; Zhang, G.; Liu, Y.; Li, Z.; Wang, S.; Ma, Y. Precipitation and urban expansion caused jointly the spatiotemporal dislocation between supply and demand of water provision service. J. Environ. Manag. 2021, 299, 113660. [Google Scholar] [CrossRef]
- Yang, L.; Zhang, L.; Li, Y.; Wu, S. Water-related ecosystem services provided by urban green space: A case study in Yixing City (China). Landsc. Urban Plan. 2015, 136, 40–51. [Google Scholar] [CrossRef]
- Zhou, F.; Xu, Y.; Chen, Y.; Xu, C.-Y.; Gao, Y.; Du, J. Hydrological response to urbanization at different spatio-temporal scales simulated by coupling of CLUE-S and the SWAT model in the Yangtze River Delta region. J. Hydrol. 2013, 485, 113–125. [Google Scholar] [CrossRef]
- Qin, K.; Liu, J.; Yan, L.; Huang, H. Integrating ecosystem services flows into water security simulations in water scarce areas: Present and future. Sci. Total. Environ. 2019, 670, 1037–1048. [Google Scholar] [CrossRef] [PubMed]
- Deng, C.; Liu, J.; Nie, X.; Li, Z.; Liu, Y.; Xiao, H.; Hu, X.; Wang, L.; Zhang, Y.; Zhang, G.; et al. How trade-offs between ecological construction and urbanization expansion affect ecosystem services. Ecol. Indic. 2021, 122, 107253. [Google Scholar] [CrossRef]
- Yang, M.; Gao, X.; Siddique, K.H.; Wu, P.; Zhao, X. Spatiotemporal exploration of ecosystem service, urbanization, and their interactive coercing relationship in the Yellow River Basin over the past 40 years. Sci. Total. Environ. 2023, 858, 159757. [Google Scholar] [CrossRef] [PubMed]
- Sarker, S.; Veremyev, A.; Boginski, V.; Singh, A. Critical Nodes in River Networks. Sci. Rep. 2019, 9, 1–11. [Google Scholar] [CrossRef]
- Gao, Y.; Sarker, S.; Sarker, T.; Leta, O.T. Analyzing the critical locations in response of constructed and planned dams on the Mekong River Basin for environmental integrity. Environ. Res. Commun. 2022, 4, 101001. [Google Scholar] [CrossRef]
- Li, J.; Zhou, K.; Xie, B.; Xiao, J. Impact of landscape pattern change on water-related ecosystem services: Comprehensive analysis based on heterogeneity perspective. Ecol. Indic. 2021, 133, 108372. [Google Scholar] [CrossRef]
- Xu, Z.; Peng, J.; Liu, Y.; Qiu, S.; Zhang, H.; Dong, J. Exploring the combined impact of ecosystem services and urbanization on SDGs realization. Appl. Geogr. 2023, 153, 102907. [Google Scholar] [CrossRef]
- Zhang, Y.; Du, F.; Wang, T. Spatialization of Population and GDP Data Based on Grid in Xi'an Area. Geomat. World 2016, 23, 74–78. [Google Scholar]
- Wu, Y.; Shi, K.; Chen, Z.; Liu, S.; Chang, Z. Developing Improved Time-Series DMSP-OLS-Like Data (1992–2019) in China by Integrating DMSP-OLS and SNPP-VIIRS. IEEE Trans. Geosci. Remote. Sens. 2022, 60, 1–14. [Google Scholar] [CrossRef]
- Zhang, Z.; Peng, J.; Xu, Z.; Wang, X.; Meersmans, J. Ecosystem services supply and demand response to urbanization: A case study of the Pearl River Delta, China. Ecosyst. Serv. 2021, 49, 101274. [Google Scholar] [CrossRef]
- Natural Capital Project. InVEST 3.13.0.post5+ug.gce76c6e User’s Guide. Stanford University, University of Minnesota, Chinese Academy of Sciences, The Nature Conservancy, World Wildlife Fund, and Stockholm Resilience Centre. Available online: https://storage.googleapis.com/releases.naturalcapitalproject.org/invest-userguide/latest/index.html (accessed on 5 December 2022).
- Wang, H.; Wang, W.J.; Liu, Z.; Wang, L.; Zhang, W.; Zou, Y.; Jiang, M. Combined effects of multi-land use decisions and climate change on water-related ecosystem services in Northeast China. J. Environ. Manag. 2022, 315, 115131. [Google Scholar] [CrossRef]
- Lang, Y.; Song, W. Quantifying and mapping the responses of selected ecosystem services to projected land use changes. Ecol. Indic. 2019, 102, 186–198. [Google Scholar] [CrossRef]
- Paracchini, M.L.; Pacini, C.; Jones, M.L.M.; Pérez-Soba, M. An aggregation framework to link indicators associated with multifunctional land use to the stakeholder evaluation of policy options. Ecol. Indic. 2011, 11, 71–80. [Google Scholar] [CrossRef]
- Hamel, P.; Chaplin-Kramer, R.; Sim, S.; Mueller, C. A new approach to modeling the sediment retention service (InVEST 3.0): Case study of the Cape Fear catchment, North Carolina, USA. Sci. Total. Environ. 2015, 524–525, 166–177. [Google Scholar] [CrossRef]
- Keller, A.A.; Fournier, E.; Fox, J. Minimizing impacts of land use change on ecosystem services using multi-criteria heuristic analysis. J. Environ. Manag. 2015, 156, 23–30. [Google Scholar] [CrossRef] [PubMed]
- Yao, X.; Yu, J.; Jiang, H.; Sun, W.; Li, Z. Roles of soil erodibility, rainfall erosivity and land use in affecting soil erosion at the basin scale. Agric. Water Manag. 2016, 174, 82–92. [Google Scholar] [CrossRef]
- Bai, X.; Shi, P.; Liu, Y. Realizing China's urban dream. Nature 2014, 509, 158–160. [Google Scholar] [CrossRef] [PubMed]
- Ouyang, X.; Tang, L.; Wei, X.; Li, Y. Spatial interaction between urbanization and ecosystem services in Chinese urban agglomerations. Land Use Policy 2021, 109, 105587. [Google Scholar] [CrossRef]
- Ouyang, X.; Zhu, X.; He, Q. Spatial Interaction between Urbanization and Ecosystem Services: A Case Study in Chang-sha-Zhuzhou-Xiangtan Urban Agglomeration, China. Acta Ecol. Sin. 2019, 39, 7502–7513. [Google Scholar]
- Gaile, G.L.; Willmott, C.J. Spatial Statistics and Models; Springer: Dordrecht, The Netherlands, 1984. [Google Scholar]
- Lefever, D.W. Measuring Geographic Concentration by Means of the Standard Deviational Ellipse. Am. J. Sociol. 1926, 32, 88–94. [Google Scholar] [CrossRef]
- Zhai, Y.; Baran, P.K.; Wu, C. Spatial distributions and use patterns of user groups in urban forest parks: An examination utilizing GPS tracker. Urban For. Urban Green. 2018, 35, 32–44. [Google Scholar] [CrossRef]
- Wang, S.; Wu, M.; Hu, M.; Fan, C.; Wang, T.; Xia, B. Promoting landscape connectivity of highly urbanized area: An ecological network approach. Ecol. Indic. 2021, 125, 107487. [Google Scholar] [CrossRef]
- Xu, J.; Zhao, Y.; Zhong, K.; Zhang, F.; Liu, X.; Sun, C. Measuring spatio-temporal dynamics of impervious surface in Guangzhou, China, from 1988 to 2015, using time-series Landsat imagery. Sci. Total. Environ. 2018, 627, 264–281. [Google Scholar] [CrossRef]
- Li, F.; Zhu, G.; Ji, C.; Hou, D.; Sun, H. Analysis on the Trend and Driving Mechanism of Urban Growth Based on Impervious Surface Index: Taking Nanjing City for Example. Resour. Environ. Yangtze Basin. 2021, 30, 575–590. [Google Scholar]
- Al-Kindi, K.M.; Kwan, P.; Andrew, N.R.; Welch, M. Modelling spatiotemporal patterns of dubas bug infestations on date palms in northern Oman: A geographical information system case study. Crop. Prot. 2017, 93, 113–121. [Google Scholar] [CrossRef]
- Anselin, L. The Local Indicators of Spatial Association—LISA. Geogr. Anal. 1995, 27, 93–115. [Google Scholar] [CrossRef]
- Zhao, Y.; Shi, Y.; Feng, C.-C.; Guo, L. Exploring coordinated development between urbanization and ecosystem services value of sustainable demonstration area in China-take Guizhou Province as an example. Ecol. Indic. 2022, 144, 109444. [Google Scholar] [CrossRef]
- Schröter, M.; Koellner, T.; Alkemade, R.; Arnhold, S.; Bagstad, K.J.; Marques, A.; Frank, K.; Kastner, T.; Kissinger, M.; Liu, J.; et al. Interregional flows of ecosystem services: Concepts, typology and four cases. Ecosyst. Serv. 2018, 31, 231–241. [Google Scholar] [CrossRef]
- Wang, Z.; Mao, D.; Li, L.; Jia, M.; Dong, Z.; Miao, Z.; Ren, C.; Song, C. Quantifying changes in multiple ecosystem services during 1992–2012 in the Sanjiang Plain of China. Sci. Total. Environ. 2015, 514, 119–130. [Google Scholar] [CrossRef]
- Li, J.; Zhou, Z. Coupled analysis on landscape pattern and hydrological processes in Yanhe watershed of China. Sci. Total. Environ. 2015, 505, 927–938. [Google Scholar] [CrossRef]
- Teutschbein, C.; Grabs, T.; Laudon, H.; Karlsen, R.H.; Bishop, K. Simulating streamflow in ungauged basins under a changing climate: The importance of landscape characteristics. J. Hydrol. 2018, 561, 160–178. [Google Scholar] [CrossRef]
- Gao, J.; Li, F.; Gao, H.; Zhou, C.; Zhang, X. The impact of land-use change on water-related ecosystem services: A study of the Guishui River Basin, Beijing, China. J. Clean. Prod. 2017, 163, S148–S155. [Google Scholar] [CrossRef]
- Loveland, T.R.; Dwyer, J.L. Landsat: Building a strong future. Remote Sens. Environ. 2012, 122, 22–29. [Google Scholar] [CrossRef]
- Pekel, J.-F.; Cottam, A.; Gorelick, N.; Belward, A.S. High-resolution mapping of global surface water and its long-term changes. Nature 2016, 540, 418–422. [Google Scholar] [CrossRef]
- Yang, X.; Chen, R.; Ji, G.; Wang, C.; Yang, Y.; Xu, J. Assessment of Future Water Yield and Water Purification Services in Data Scarce Region of Northwest China. Int. J. Environ. Res. Public Health 2021, 18, 8960. [Google Scholar] [CrossRef] [PubMed]
- Wulder, M.A.; White, J.C.; Loveland, T.R.; Woodcock, C.E.; Belward, A.S.; Cohen, W.B.; Fosnight, E.A.; Shaw, J.; Masek, J.G.; Roy, D.P. The global Landsat archive: Status, consolidation, and direction. Remote. Sens. Environ. 2016, 185, 271–283. [Google Scholar] [CrossRef]
- Chen, J.; Li, Z.; Xiao, H.; Ning, K.; Tang, C. Effects of land use and land cover on soil erosion control in southern China: Implications from a systematic quantitative review. J. Environ. Manag. 2021, 282, 111924. [Google Scholar] [CrossRef]
- Xia, H.; Kong, W.; Zhou, G.; Sun, O.J. Impacts of landscape patterns on water-related ecosystem services under natural restoration in Liaohe River Reserve, China. Sci. Total. Environ. 2021, 792, 148290. [Google Scholar] [CrossRef] [PubMed]
Disclaimer/Publisher’s Note: The statements, opinions and data contained in all publications are solely those of the individual author(s) and contributor(s) and not of MDPI and/or the editor(s). MDPI and/or the editor(s) disclaim responsibility for any injury to people or property resulting from any ideas, methods, instructions or products referred to in the content. |
© 2023 by the authors. Licensee MDPI, Basel, Switzerland. This article is an open access article distributed under the terms and conditions of the Creative Commons Attribution (CC BY) license (https://creativecommons.org/licenses/by/4.0/).