Abstract
In this paper, we propose a processing chain jointly employing Sentinel-1 and Sentinel-2 data, aiming to monitor changes in the status of the vegetation cover by integrating the four 10 m visible and near-infrared (VNIR) bands with the three red-edge (RE) bands of Sentinel-2. The latter approximately span the gap between red and NIR bands (700 nm–800 nm), with bandwidths of 15/20 nm and 20 m pixel spacing. The RE bands are sharpened to 10 m, following the hyper-sharpening protocol, which holds, unlike pansharpening, when the sharpening band is not unique. The resulting 10 m fusion product may be integrated with polarimetric features calculated from the Interferometric Wide (IW) Ground Range Detected (GRD) product of Sentinel-1, available at 10 m pixel spacing, before the fused data are analyzed for change detection. A key point of the proposed scheme is that the fusion of optical and synthetic aperture radar (SAR) data is accomplished at level of change, through modulation of the optical change feature, namely the difference in normalized area over (reflectance) curve (NAOC), calculated from the sharpened RE bands, by the polarimetric SAR change feature, achieved as the temporal ratio of polarimetric features, where the latter is the pixel ratio between the co-polar and the cross-polar channels. Hyper-sharpening of Sentinel-2 RE bands, calculation of NAOC and modulation-based integration of Sentinel-1 polarimetric change features are applied to multitemporal datasets acquired before and after a fire event, over Mount Serra, in Italy. The optical change feature captures variations in the content of chlorophyll. The polarimetric SAR temporal change feature describes depolarization effects and changes in volumetric scattering of canopies. Their fusion shows an increased ability to highlight changes in vegetation status. In a performance comparison achieved by means of receiver operating characteristic (ROC) curves, the proposed change feature-based fusion approach surpasses a traditional area-based approach and the normalized burned ratio (NBR) index, which is widespread in the detection of burnt vegetation.
1. Introduction
The Sentinel-1 and Sentinel-2 missions are part of the European Space Agency (ESA) Copernicus program. The Sentinel-2 twin satellite constellation (2A and 2B) provides multispectral (MS) data in the visible and near-infrared (VNIR) and shortwave infrared (SWIR) wavelengths at decametric spatial resolution with a 5-day revisit time at the Equator. Sentinel-1 provides C-band synthetic aperture radar (SAR) data with either HH or VV polarization, possibly with a cross-polar channel, either HV or VH. The ground resolution of geo-coded multilooked Sentinel-1 products is comparable with the highest resolution attained in the VNIR bands of Sentinel-2; the revisit time is also comparable for the two systems, at least after the launch of Sentinel-1B. The routine availability of optical and microwave image data with large swaths (290 Km for Sentinel-2, varying with the acquisition mode for Sentinel-1) constitutes a unique opportunity to perform environmental monitoring tasks.
Monitoring changes in vegetation status is of chief importance [1]. This activity is mainly based on observations taken at red, NIR and SWIR spectral regions [2]. In the case of forest fires, spectral indexes based on red and NIR bands, such as the normalized differential vegetation index (NDVI), increase their correlation with burn severity when the upper part of the red spectrum, namely, the red-edge (RE), is considered [3]. Thus, Sentinel-2, which provides three bands in the RE spectral region, has opened up new horizons for accurate vegetation monitoring and the estimation of burned areas. Recent studies have experimentally shown the usefulness of Sentinel-2 data when characterizing fire-affected regions and estimating burn severity [4].
The growing severity of fire disturbances in forests is increasing interest in the monitoring of fires and their effects. While in situ observations cannot provide a global and frequent mapping of fire disturbances, remote sensing techniques represent a valuable tool for this goal. Current large-scale fire-surveillance systems, however, do not accomplish the timely detection of active fires due to the physical constraints concerning the spatial, radiometric and time resolutions of spaceborne remote sensing systems.
The intrinsic complementarity of optical and SAR imaging modalities makes multisensor fusion extremely attractive: a fusion product should contain the easy interpretability of optical data but incorporate features that can be appreciated in SAR but not in optical data. The objectives are as follows: (a) to favor a more comprehensive display and visual interpretation, and (b) to emphasize the thematic information of the multisensor images for the subsequent analysis stage.
The Sentinel-2 bands in the RE regions, namely, B5 and B6, with a 15 nm spectral width, and B7, with a 20 nm width (see Figure 1), are provided at 20 m spatial resolution. The VNIR bands, specifically B2, B3, B4 and B8, have a higher spatial resolution of 10 m and lower spectral resolution. The difference in spatial resolution is a consequence of the fundamental trade-off in the design of electro-optical systems between spatial resolution, spectral resolution and radiometric sensitivity [5]. Thus, MS resolution enhancement may improve the spatial resolution of the Sentinel-2 bands acquired at 20 and 60 m and the derived spectral indices, specifically those computed from the RE bands.
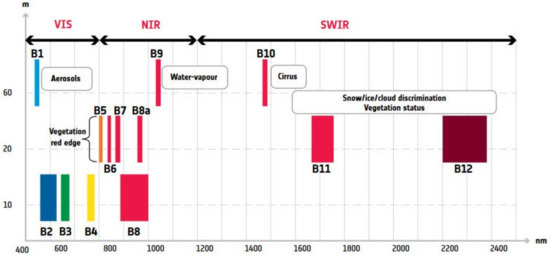
Figure 1.
Sentinel-2 layout of spectral bands.
MS resolution enhancement refers to the joint processing of the data in order to synthesize an image product that ideally exhibits the spectral characteristics of the observed MS image at the spatial resolution, and, hence, spatial sampling, of the higher-resolution image. When this higher-resolution image is a panchromatic band, spatial enhancement is referred to as MS pansharpening [5]; when a panchromatic band is unavailable, hyper-sharpening denotes the sharpening of the less spatially resolved bands by means of the proper selection or combination of the more spatially resolved VNIR bands [6,7] in order to maximize a certain similarity function, either global or local, of the spatial/spectral patterns between the sharpening and sharpened bands, as in advanced hyperspectral (HS) data compression [8].
Since the spatially enhanced channels may not be spectrally encompassed by the enhancing channel(s), a proper detail-injection model should be envisaged, possibly exploiting the knowledge of instruments, e.g., noise model [9], modulation transfer function (MTF) [10], and atmosphere [11]. These methods adopt a modulation-based (multiplicative) detail injection model, belonging to the spatial (multi-resolution analysis, MRA, either separable [12] or not [13]), or the spectral (component substitution, CS) sharpening approach. MRA fusion may comprise a decimator/interpolator pair to achieve a Laplacian pyramid decomposition [14]. The multiplicative injection model can be interpreted in terms of the radiative transfer model [15]: a low-spatial-resolution spectral reflectance, preliminarily estimated from the MS bands and a lowpass version of the Pan image, is sharpened via multiplication by the high-spatial-resolution Pan image [16]. In this context, the estimation of atmospheric path radiance and its correction in the multiplicative model plays a major role [17,18], especially concerning phenological changes in the vegetation cover [19].
Whenever both the spectral coverage and the imaging mechanism are different, e.g., reflectivity and emissivity, fusion may be targeted to provide an increment in spatial resolution without penalizing the radiometry of the coarser dataset, typically a thermal image [20] or a SAR image. The fusion of optical and SAR images acquired on the same scene is strongly affected by the different imaging mechanisms and acquisition geometries of the instruments. The nadiral, i.e., vertical view of Sentinel-2 clashes against the side-looking, or lateral view, specific to all SAR systems. Furthermore, in the presence of steep terrain, even if data products that are not only geo-referenced but also ortho-rectified are considered, registration errors usually appear as local misalignments between such “heterogeneous” images. Therefore, the pixel-based fusion of SAR and optical images has seldom been investigated, while feature-based methods have been pursued, as they are less sensitive to misalignment problems. In the most widely investigated case, the image being enhanced is optical, and the enhancing one is from SAR [21]. A classical approach preserving the signal-to-noise-ratio (SNR) of the original optical image is based on the use of noise-robust spatial/temporal/polarimetric features extracted from the SAR image, either based on information-theoretic [22,23] or statistical [24,25] approaches. Although learning-based approaches have recently been developed [26], intensity modulation represents a viable solution for merging heterogeneous datasets, such as those provided by optical and SAR systems [27].
In this paper, we propose a processing chain jointly employing Sentinel-1 and Sentinel-2 data, aiming to monitor changes in the status of the vegetation cover by integrating the three RE bands of Sentinel-2 with polarimetric features calculated from the Interferometric Wide (IW) Ground-Range-Detected (GRD) product of Sentinel-1, available at 10 m pixel spacing. Unlike solutions based on unmixing, [28] or plain nearest-neighbor resampling, [4] the spatial enhancement of the 20 m RE bands is performed through hyper-sharpening, using VNIR bands at 10 m. For the change analysis of vegetated landscapes, multimodal fusion between optical and SAR data was performed at the level of change by merging separately calculated proper optical and SAR change features: the optical change feature was modulated by the SAR change feature to emphasize subtle variations in vegetation over time.
2. Proposed Method
The proposed processing chain, integrating Sentinel-2 (optical) and Sentinel-1 (SAR) data, aiming to monitor changes in the status of vegetation cover can be summarized by the following steps:
- The three Sentinel-2 20 m RE bands are hyper-sharpened to 10 m by a combination of the 10 m VNIR bands. For each RE band, the sharpening band is a linear weighted combination of the 10 m VNIR bands, with least squares (LS) weights between the lowpass-filtered sharpening band and the RE band interpolated to 10 m.
- Maps of normalized indexes are calculated from the hyper-sharpened RE bands.
- Maps of polarimetric features are extracted from the 10 m multilook backscatter of Sentinel-1 [29].
- The differential maps of the optical index are modulated by polarimetric SAR change features, with unity means, to yield the maps of changes. In the presence of known events (e.g., fires, but also floods or droughts), it will be possible to relate the amount of temporal change to the severity of the event that originated this.
2.1. Hyper-Sharpening of Sentinel-2 Data
Our attention is focused on the three RE bands, whose relevance to the analysis of vegetation characteristics has been largely recognized [30]. Originally produced at 20 m resolution, these bands are hyper-sharpened by means of the four 10-m VNIR bands.
While pansharpening increases the geometric resolution of a multi-band image by means of a panchromatic observation of the same scene with greater resolution, whenever the sharpening image is not unique, hyper-sharpening deals with the synthesis of a unique sharpening image, the source of the spatial details, to obtain the best-fused products [6]. This synthetic Pan is generally different for each band that shall be sharpened.
Let denote the higher-resolution VNIR bands, the lower-resolution RE bands, and R the scale ratio between the spatial resolutions of and (, , and , for Sentinel-2), the enhancing band , of the ith lower-resolution band, , is synthesized according to the following procedure.
First, the bands are lowpass-filtered with a cutoff frequency , providing the bands degraded at the resolution of the RE bands. Then, the relationship between the RE band interpolated by R, , and is modeled through a multivariate linear regression [31]:
in which is the space-varying residue. The set of space-constant optimal weights, , is calculated as the minimum MSE (MMSE) solution of Equation (1). The weights, , are used to synthesize the set of enhancing bands, :
Finally, the sharpened RE bands , at a 10 m resolution for Sentinel-2, are computed by applying a contrast-based fusion algorithm to and :
in which is the lowpass-filtered version of , or, equivalently,
Note that the sharpening bands (VNIR) and the sharpened bands (RE) are simultaneously acquired by the same platform, while, for VHR/EHR MS scanners, such an acquisition is not simultaneous and may lead to local shifts between the two datasets [32] in the presence of some relief of the ground. The absence of spatial shifts between VNIR and RE entails the use of MRA or spatial methods based on the spatial filtering of the sharpening image [33].
The coefficients of determination (CD) of the multivariate regressions in Equation (1) determine the histogram-matching between each of the low-resolution bands and the enhancing image synthesized from the 10 m VNIR bands [34]. It is noteworthy that the use of a multivariate regression to synthesize the sharpening band makes the method independent of the data format [35], which is either floating-point or packed fixed-point. However, while the math derivation of the sharpening bands does not depend on the physical format of the data, e.g., spectral radiance or surface reflectance, the fusion rule in Equation (3), derived from the radiative transfer model [15], would assume that all the band data are in the surface-reflectance format.
The surface reflectance is a level-two (L2) product and is only distributed for global-coverage systems (OLI, Sentinel-2) when an instrument network is available for atmospheric measurements [36], which are usually carried out by means of lidar instruments [37]. If only the spectral radiance format is available, the band data should be haze-corrected, that is, each should be diminished by the corresponding term of atmospheric path radiance, a.k.a. haze, when they are used in Equation (3). Path-radiance estimation may follow image-based approaches [38,39] or rely on radiative transfer models of the atmosphere and its constituents [40], as well as knowledge of acquisition parameters, such as actual Sun–Earth distance, solar zenith angle and satellite platform observation angle. The haze term is trivially zero for data in surface reflectance format whenever they are available.
2.2. Normalized Area over Reflectance Curve
A unique optical feature that is suitable for the analysis of vegetation cover can be defined from the three RE bands of Sentinel-2. Originally introduced for HS data with several bands in the (700–800) nm RE wavelength interval, the normalized area over reflectance curve (NAOC) [30] can be extended to Sentinel-2 data:
in which the integral is calculated from the available bands as a zero-order approximation. NAOC in Equation (5) is the one complement of the integral of the surface reflectance function normalized to the product between the reflectance of the NIR channel and the difference of center wavelengths of the NIR and RED channels, as shown in Figure 2.
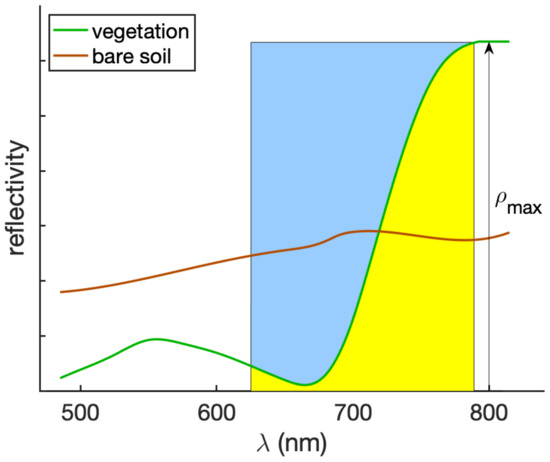
Figure 2.
Illustration of NAOC for two sample reflectance spectra. The area shaded in blue corresponds to the NAOC of vegetation. The red edge, corresponding to the point, in which the spectral reflectance of vegetation attains the maximum of its slope, is clearly visible at approximately 730 nm. The maximum of reflectance, , is attained in the NIR wavelengths.
Equation (5) can be rewritten for Sentinel-2 bands as:
in which is the pixel reflectance value of the ith band and the five bands used for NAOC calculation are described in Table 1.

Table 1.
Band name, spatial resolution, center wavelength and spectral width of the Sentinel-2 bands used for NAOC calculation.
All the data should be expressed as surface reflectances; de-hazed spectral radiances, however, provide a good approximation, thanks to the normalization of the integral in Equation (5) and of the summation in Equation (6), which roughly removes the dependencies on solar irradiance and atmospheric transmittance [15]. NAOC is directly related to the chlorophyll content of the scene [30] and seems ideal for assessing damage to vegetation after a fire.
2.3. Polarimetric Features from Sentinel-1 Data
In the context of analysis of the vegetated areas, especially trees and forests, the use of SAR observations with polarization diversity, such as those provided by the dual-pol ability of Sentinel-1, seems adequate to investigate not only the volumetric scattering of canopies [41] but also cross-polar scattering mechanisms [42,43]. The automated analysis and classification of forests, however, would require an inversion of the scattering model of canopies, whose complexity and mathematical intractability has recently fostered the use of artificial intelligence tools [44].
Given a pair of dual-pol images, either HH and HV or VV and VH, depending on the variable settings of the SAR system, the polarimetric features that emphasize burnt vegetation can be defined as the pixel ratio of co-polar to cross-polar observations, either HH/HV or VV/VH. Pixel ratios can be enforced by a preliminary despeckling step. In this case, care should be taken of considering the spatial correlation introduced by the SAR processor [45]. Alternatively, the pixel ratio of co-polar to cross-polar channels, which is sensitive to noise, can be replaced by a noise-robust change feature [46]. Although the geometrical accuracy of nonparametric change methods [47], which do not require prior despeckling, is greater than that of pixel ratioing [48], the spatial correlation introduced by the SAR processor may impair their change detection accuracy and should be preliminarily removed [49].
The routine availability of SAR observations of the same scene every 4–7 days, specific to the Sentinel-1 satellite constellation, entails the use of a simple temporal multilooking, provided that pre-event and post-event observations are kept separate. In this case, there is no need for despeckling and/or spatial decorrelation.
2.4. Optical-SAR Integration
Once the maps of optical and SAR features have been calculated from datasets taken before and after the fire event, there are two ways of performing an analysis of change through the products of a feature-based fusion:
- The maps of optical and SAR features are separately merged for the two dates, and the resulting fused maps are jointly analyzed to find changes;
- A map of optical change features is calculated from the pre- and post-event optical feature and, analogously, a map of polarimetric SAR change features is calculated from the maps of polarimetric features calculated before and after the event. The two change maps are merged together to highlight changes.
The fusion rule for features calculated from heterogeneous datasets is the pixel-by-pixel product, where the modulated feature can be negative and also zero-mean; the modulating feature is strictly nonnegative and possibly normalized to obtain a unity mean.
In the first case, the optical feature is NAOC (see Equation (5)) calculated before or after the event and the SAR feature is the pixel ratio of co-polar to cross-polar channels, both in amplitude formats, calculated pre- or post-event:
where is and is , while is either or , and analogously for the post-event polarimetric SAR feature. NAOC is calculated from the RE bands that are hyper-sharpened to 10 m, the same resolution as the SAR data. The final step is the computation of the cumulative change feature, which can be defined as either a difference or a ratio of post- and pre-event cumulative features. However, the difference is better suited to changes in optical features, as NAOC is; the ratio is mandatory for change analyses using SAR data. For this reason, an alternative strategy has been devised.
In the second case, the optical change feature is the difference in NAOC calculated after and before the event; the polarimetric SAR change feature is the ratio of polarimetric features calculated after and before the event. The optical and SAR change features are multiplied together to yield the cumulative change feature. Note that the optical change is never inflated or reversed in sign because the SAR change is always unity-mean and non-negative.
The cumulative change feature is devised to balance the spectral information of the optical observations encapsulated in the radiometric variability of NAOC and the spatial information of polarimetric SAR. The combination of optical and SAR information is expected to improve the visual assessment of possible changes in the vegetation cover. Traditional, unsupervised, full-scale quality assessments [50] may not be applicable in the context of feature-based multimodal data fusion.
3. Experimental Results
3.1. Dataset
Experimental tests were carried out on Sentinel-1 and Sentinel-2 data acquired on Mount Serra (Italy) before and after a fire event occurred on 24 September 2018. The fire burned more than 1400 hectares of forests, crops and olive trees. Table 2 and Table 3 report the dates of the five pre-event and five post-event Sentinel-1 SAR acquisitions and the two pre/post-event Sentinel-2 MS acquisitions, respectively. Each S1A scene was thermal-noise-filtered, radiometrically calibrated, and terrain-corrected. Figure 3 reports the geographic location of the fire event. Figure 4 shows a true-color composite of the Sentinel-2 image on the tested area. Figure 5 shows the detail, highlighted in Figure 4, of the Sentinel-2 true-color image over the fire-affected area.

Table 2.
S1A data: 10 scenes (VV and VH polarizations; Ground-range detected).

Table 3.
S2A data: 2 scenes [L2A format].
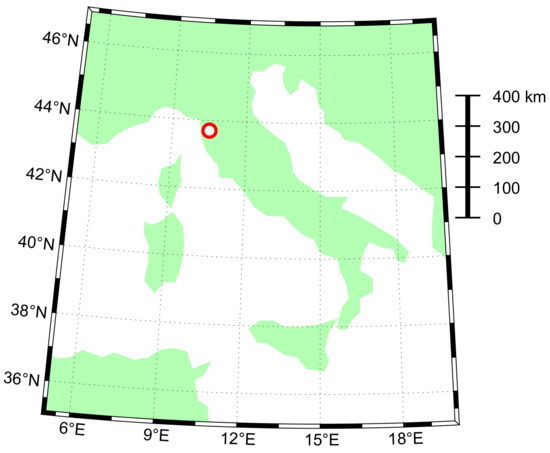
Figure 3.
Geographic position of the fire event.
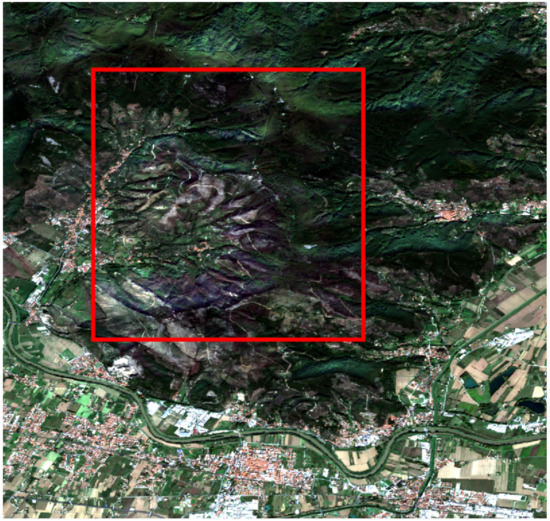
Figure 4.
True-color representation of the Sentinel-2 image after the fire event (Mount Serra, Pisa, Italy, 24 September 2018). The investigated area is highlighted by the red box.
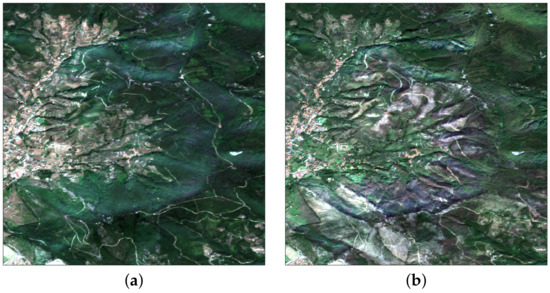
Figure 5.
True-color close-ups: (a) pre-event; (b) post-event.
3.2. Fusion Results
The experimental results on the multitemporal optical-SAR dataset acquired in the Mount Serra area are visually presented. Figure 6 reports pre- and post-event color composites from the three RE Sentinel-2 bands, namely B7, B6 and B5. Both the image at the original 20 m resolution and the 10 m hyper-sharpened image show that detection and delineation of the fire-affected areas, completely or partially burnt, are possible, and that hyper-sharpening improves spatial resolution without introducing any significant spectral distortion.
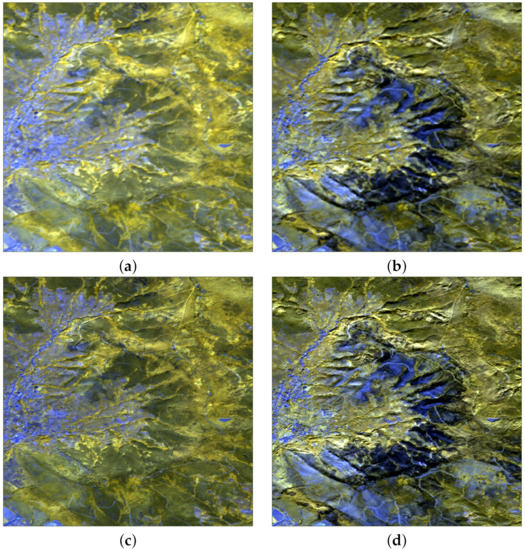
Figure 6.
Pre-event (left) and post-event (right) color composites of B7-B6-B5 RE bands: (a,b) at 20 m GSD; (c,d) hyper-sharpened at 10 m GSD.
NAOC before and after the fire is shown in Figure 7, together with differential NAOC, i.e., NAOC–NAOC. As it appears, the NAOC index abruptly drops to zero in areas where the forest was completely burned. Overall, this provides a clear representation of vegetated and non-vegetated areas, either before or after the fire. The differential NAOC mostly highlights negative changes due to the fire, which dramatically abated the chlorophyll content of vegetation; positive changes, however, occurred in the left part, below the inhabited center, due to the presence of new crops that were missing on the pre-event date. Note that the spatial sharpening step may influence the outcome of a vegetation index [51]; however, while pansharpening may not affect normalized differential indexes based on the ratios of spectral pixels [16], e.g., NDVI, the sharpening band being unique, this does not hold for hyper-sharpening, because there are as many sharpening bands as there are bands to be sharpened. Hence, the NAOC map calculated from hyper-sharpened RE bands is not only spatially more resolved but also spectrally more informative than if it were calculated from plain 20 m RE data or from 10 m pansharpened RE data in the case where a 10 m panchromatic image was hypothetically available. This is an asset of hyper-sharpening, in which a different synthetic sharpening band is tailored to each of the available 20 m RE bands.
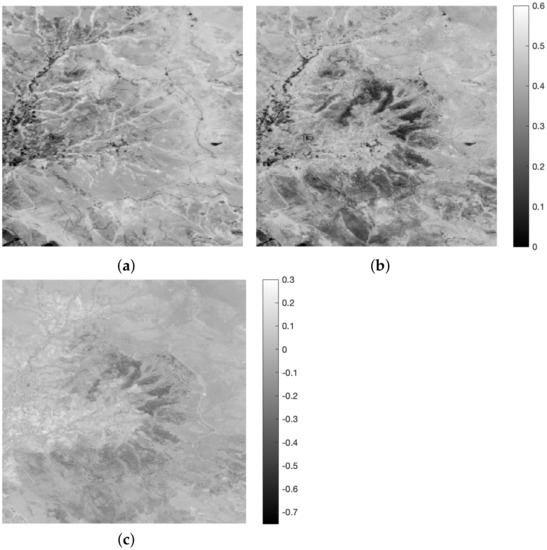
Figure 7.
NAOC computed on hyper-sharpened bands: (a) pre-event; (b) post-event; (c) differential NAOC, i.e., (b) minus (a).
The polarimetric features defined in Section 2.3 were calculated for the pre- and post-event SAR images. The phenological evolution was sacrificed in favor of a reduction in the speckle noise by pixel-averaging the intensities of the five pre-event observations and the five post-event observations reported in Table 2. The amplitudes of the temporal multilooks are shown in Figure 8. They are a little noisy, notwithstanding that the ratio operation tends to increase the noisiness. Unlike the optical image, in which the severity of the fire stands out, neither the co-polar (VV) nor the cross-polar (VH) channels seem to show any particular ability to detect the burnt area after the fire. Even the VV and VH channels are hardly distinguishable from one another, both before and after the fire.
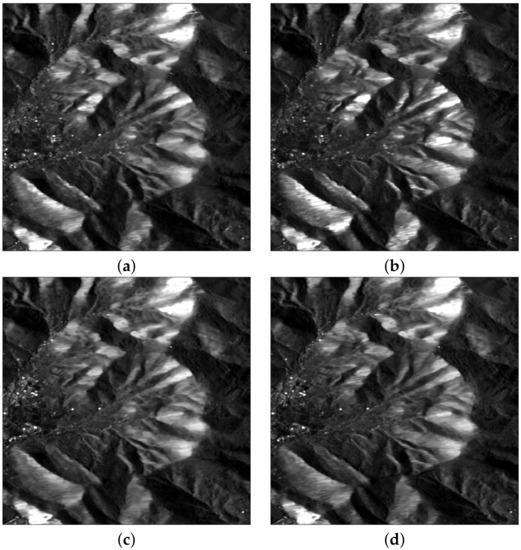
Figure 8.
Pre-event (left) and post-event (right) Sentinel-1 amplitude images: (a,b) VV-pol; (c,d) VH-pol.
The ratio of co-polar to cross-polar channels in Figure 9a,b is more informative and highlights that the effect of fire on the response of vegetation is an increment of the polar ratios, mainly due to (i) the destruction of tree canopies and consequent reduction in their volumetric scattering contribution, and (ii) the significant decrement in depolarization effects caused by vegetation after it has burnt. The post-event to pre-event polar ratios, displayed in Figure 9c, carefully outline the burnt vegetation and separate it from the urban settlements. Thanks to its ability to jointly describe the depolarization effects and volumetric scattering of canopies, the polarimetric SAR feature was tailored to the characteristics of vegetation, with a specific focus on tree canopies. This can be regarded as the microwave counterpart of the differential NAOC, used as an optical change feature in the RE wavelengths.
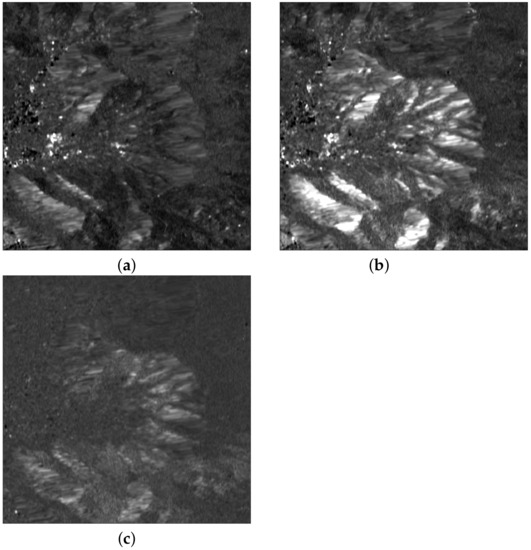
Figure 9.
Ratio of VV to VH amplitudes: (a) pre-event ; (b) post-event ; (c) ratio .
In a parallel experiment, two Sentinel-1 images taken before the fire and two after (see Table 2) were separately processed for change analysis. The polarimetric features on the two dates before the fire are shown in Figure 10, together with the ratio measuring the amount of change. It appears that the polarimetric ratios are mostly similar, especially in the forest area, and the temporal ratio of polarimetric ratios is almost unitary, apart from small glitches originating from speckle noise, which were removed by the temporal multilooking performed in the previous experiment, whereas the focus now is on the phenological variations that occurred before the fire. Analogously, Figure 11 presents the polarimetric changes in the two dates after the fire, and their ratio. In this case, small phenological changes only occurred outside the burned area, where the disturbance to the surrounding vegetation is slowly vanishing. The latter experiment is significant for the constant monitoring of vegetation recovery in the burned areas [52].
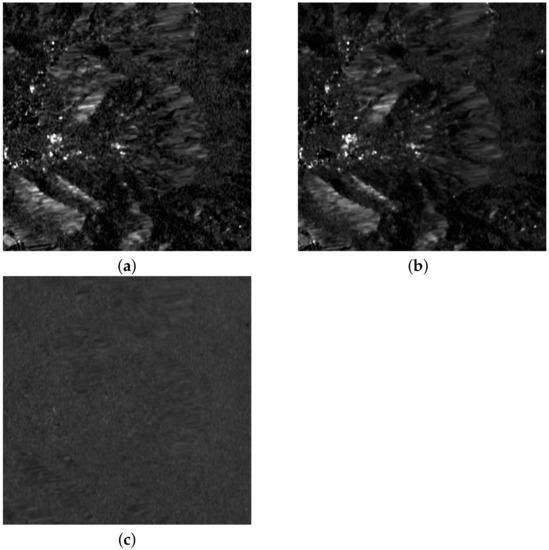
Figure 10.
Ratio VV/VH: (a) pre-event (time 1) ; (b) pre-event (time 2) ; (c) ratio .
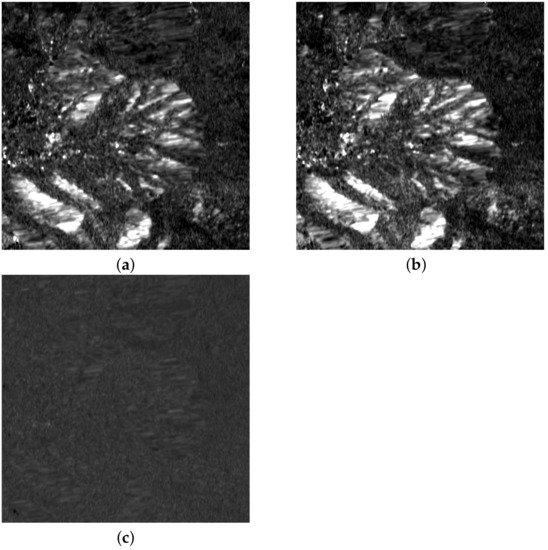
Figure 11.
Ratio of VV to VH amplitudes: (a) post-event (time 1) ; (b) post-event (time 2) ; (c) ratio .
The last step merges the microwave and optical change features. The fusion model considers the change in NAOC (see Figure 12a) modulated by the temporal polarimetric change feature (see Figure 12b). This feature is strictly non-negative and exhibits a mean approximately equal to one; hence, the spatial variation trends of Figure 12a are never reversed. The two change features and their coupling law were chosen in such a way that the optical and SAR change features are often anti-correlated: volumetric scattering and depolarization decrease as the chlorophyll content decreases, but the cross-polar term appears as a denominator in the polarimetric feature. Therefore, optical changes are emphasized after the product by the SAR change feature; optical changes not captured by SAR are preserved and vice-versa. Optical and SAR changes that follow opposite trends and cancel each other never occur, at least in the test dataset.
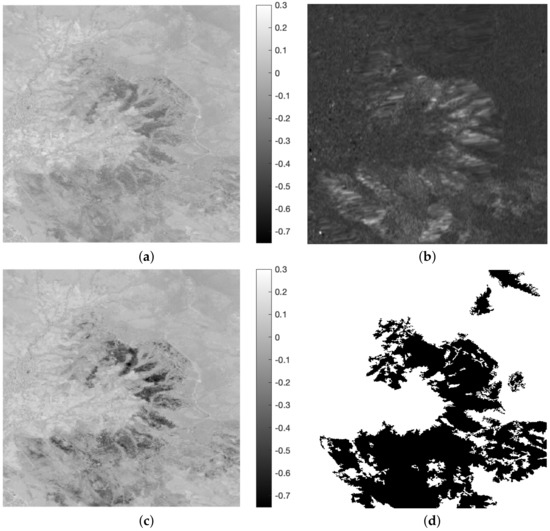
Figure 12.
Optical and SAR change features and their combination. (a) Differential NAOC; (b): Ratio ; (c): differential NAOC modulated by the Ratio , i.e., (c) = (a) × (b); (d) ground truth.
The availability of the ground truth (GT) map of burnt areas entails a quantitative evaluation of the discrimination ability of the novel change feature, compared with earlier methods by some of the authors [53], in which no polarimetric information is used and the change feature is calculated after a separate fusion of the hyper-sharpened RE and some spatial features of VV SAR. Addirionally, the widespread normalized burn ratio (NBR) [54], calculated from all the bands of Sentinel-2, was included in the comparison. Figure 13 shows the receiver operating characteristic (ROC) plots of the four methods. What immediately stands out is that the change in optical bands separately modulated by SAR, determined using traditional methods for optical change analysis, provided the worst results. The difference in NBR, which uses both the VNIR and SWIR bands of Sentinel-2, is effective in outlining burnt areas. The proposed method, dNAOC × dPolSAR, is slightly better than dNAOC. The increment in performance between dNBR and dNAOC is presumably due to hyper-sharpening, because the GT map is very detailed and fragmented, beyond the original 20 m resolution of RE bands. Considerations regarding spatial resolution may explain why the advantages of SAR are limited. The IW-GRD product of Sentinel-1, delivered at a 10 m pixel spacing, was the sole polarimetric product available for the test site. However, this derives from a wide-swath acquisition mode, in which the beam is steered across the track to enlarge the swath width. The true resolution is 20 m × 22 m, but the distributed product is resampled to 10 m × 10 m, analogously to the other Sentinel-1 products. Thus, while the RE bands are hyper-sharpened to 10 m, the SAR data are intrinsically oversampled and the resulting polarimetric change feature has few details and is unable to match the extremely detailed GT map of the burnt area. Thus, the spatial discrimination ability largely depends on the sharp optical data and has little dependence on the smooth SAR data. Nevertheless, there is still an improvement when using the polarimetric SAR data.
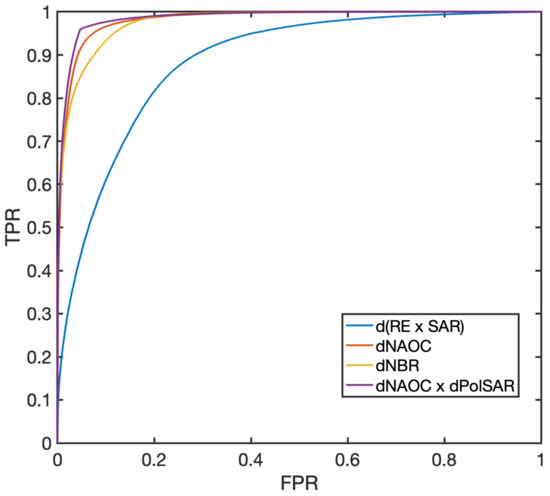
Figure 13.
ROC curves calculated from the GT in Figure 12d. The four compared methods are: change vector of hyper-sharpened RE bands modulated by spatial feature of VV SAR [53], d(RE × SAR); difference in NBR [54], dNBR, calculated from Sentinel-2 bands; difference in NAOC, dNAOC, calculated from hyper-sharpened Sentinel-2 bands (Figure 12a); dNAOC modulated by polarimetric SAR change feature, dNAOC × dPolSAR, (Figure 12c).
Furthermore, the proposed approach of performing fusion at the change level, an alternative to measuring changes in fused RE and SAR images, allows for the specificity of each type of change, difference for optical and ratio for SAR, to be retained in the cumulative change feature. The theoretical soundness of this approach is expected to be strengthened once the map of changes is forwarded to expert agronomists to obtain their feedback and possible suggestions to improve the steps of the processing chain.
4. Conclusions
This paper presented a processing chain that jointly employs Sentinel-1 SAR and Sentinel-2 MS data to monitor vegetation changes after a fire by integrating the three RE bands of Sentinel-2 with polarimetric features calculated from Sentinel-1. The RE bands were first hyper-sharpened from a 20 m to 10 m resolution using the 10 m VNIR bands. Dense maps of polarimetric change features were extracted from the 10 m multilook backscatter of Sentinel-1 to modulate the optical change. Namely, the difference in the areas overlying the spectral responses in the RE wavelength interval before and after the fire event are measured on the hyper-sharpened RE bands. The optical and polarimetric change maps, together with their fusion, highlight changes in the status and disturbances of the vegetation cover. The results of this analysis will be forwarded to experts to obtain their feedback on vegetation studies. Therefore, changes in land cover will be related to changes in biophysical parameters originating from the fire event. Specifically, the burn severity and disturbance of vegetation in burned and nearby areas will be investigated.
A key point of the proposed processing chain is that the multimodal fusion step between optical and SAR datasets is performed at the change level: a generalization of fusion at the feature level in which the optical and SAR features are separately designed before being merged together. The optical change feature (master) is modulated by the polarimetric SAR change feature (slave). Thus, a new approach is proposed to standardize the fusion of optical and SAR data and provide new achievements with an exact placement in terms of expected features, e.g., the spatial resolution, SNR and spectral diversity of fusion products and their suitability for expediting solutions to fire-impact evaluation. Thus, the fire damage assessment goal will provide a benchmark for unimodal and multimodal change detection methods, where multimodal change detection highlights that the change map is obtained from the fusion of optical and SAR observations at pre- and post-event dates.
The emphasis throughout this paper is on an assessment of damage to vegetation originated by fires. The proposed integrated processing chain of Sentinel-1/2 data is thoroughly general in its applications, which include not only fires, but also floods, hailstorms and droughts, provided that the analysis is restricted to vegetated areas, for example, tree canopies and herbaceous crops, such as corn, sunflower, rice, etc.
Future developments of the proposed procedure will concern the following: trying different optical indexes, e.g., NBR, NDVI and leaf area index (LAI), depending on the application; devising other SAR change indexes relying on polarimetric models of vegetation [41,43].
As a final consideration, we wish to underline that the proposed change analysis procedure is fully reproducible in results and makes use of routinely available data, whose Earth coverage is global with short repeat times, and whose geometric and radiometric consistency is guaranteed, as the MS and SAR data are provided by the same organization.
Author Contributions
Conceptualization and methodology: L.A., A.G. and C.Z.; validation and software: A.G. and C.Z.; data curation: A.G.; writing: L.A. and A.G. All authors have read and agreed to the published version of the manuscript.
Funding
This research received no external funding.
Data Availability Statement
Data available in a publicly accessible repository that does not issue DOIs. Publicly available datasets were analyzed in this study. This data can be found at the Copernicus Open Access Hub https://scihub.copernicus.eu/dhus, accessed on 1 December 2022.
Acknowledgments
The authors wish to give full credit and recognition to the invaluable support of their former coauthor, Bruno Aiazzi, who prematurely passed away in December 2021, with whom the present study was originally conceived. The hyper-sharpening software was originally developed by Alberto Arienzo, to whom the authors are grateful. The contribution of Simone Lolli of CNR-IMAA, in Italy, regarding atmospheric scattering and its relationship with the phenology of vegetation, is gratefully acknowledged.
Conflicts of Interest
The authors declare no conflict of interest.
References
- Aiazzi, B.; Bovolo, F.; Bruzzone, L.; Garzelli, A.; Pirrone, D.; Zoppetti, C. Change detection in multitemporal images through single- and multi-scale approaches. In Mathematical Models for Remote Sensing Image Processing: Models and Methods for the Analysis of 2D Satellite and Aerial Images; Moser, G., Zerubia, J., Eds.; Springer International Publishing: Cham, Switzerland, 2018; pp. 325–355. [Google Scholar]
- Souza, C., Jr.; Firestone, L.; Silva, L.M.; Roberts, D. Mapping forest degradation in the Eastern Amazon from SPOT 4 through spectral mixture models. Remote Sens. Environ. 2003, 87, 494–506. [Google Scholar] [CrossRef]
- Chuvieco, E. Global Impacts of Fire. In Earth Observation of Wildland Fires in Mediterranean Ecosystems; Springer: Berlin/Heidelberg, Germany, 2009; pp. 1–10. [Google Scholar] [CrossRef]
- Fernández-Manso, A.; Fernández-Manso, O.; Quintano, C. SENTINEL-2A red-edge spectral indices suitability for discriminating burn severity. Int. J. Appl. Earth Obs. Geoinf. 2016, 50, 170–175. [Google Scholar] [CrossRef]
- Alparone, L.; Aiazzi, B.; Baronti, S.; Garzelli, A. Remote Sensing Image Fusion; CRC Press: Boca Raton, FL, USA, 2015. [Google Scholar]
- Selva, M.; Aiazzi, B.; Butera, F.; Chiarantini, L.; Baronti, S. Hyper-sharpening: A first approach on SIM-GA data. IEEE J. Sel. Top. Appl. Earth Observ. Remote Sens. 2015, 8, 3008–3024. [Google Scholar] [CrossRef]
- Selva, M.; Santurri, L.; Baronti, S. Improving hypersharpening for WorldView-3 data. IEEE Geosci. Remote Sens. Lett. 2019, 16, 987–991. [Google Scholar] [CrossRef]
- Aiazzi, B.; Alparone, L.; Baronti, S.; Lastri, C. Crisp and fuzzy adaptive spectral predictions for lossless and near-lossless compression of hyperspectral imagery. IEEE Geosci. Remote Sens. Lett. 2007, 4, 532–536. [Google Scholar] [CrossRef]
- Aiazzi, B.; Alparone, L.; Baronti, S.; Selva, M.; Stefani, L. Unsupervised estimation of signal-dependent CCD camera noise. Eurasip J. Adv. Signal Process. 2012, 2012, 231. [Google Scholar] [CrossRef]
- Aiazzi, B.; Selva, M.; Arienzo, A.; Baronti, S. Influence of the system MTF on the on-board lossless compression of hyperspectral raw data. Remote Sens. 2019, 11, 791. [Google Scholar] [CrossRef]
- Vivone, G.; Alparone, L.; Garzelli, A.; Lolli, S. Fast reproducible pansharpening based on instrument and acquisition modeling: AWLP revisited. Remote Sens. 2019, 11, 2315. [Google Scholar] [CrossRef]
- Aiazzi, B.; Alparone, L.; Baronti, S.; Carlà, R. Assessment of pyramid-based multisensor image data fusion. In Image and Signal Processing for Remote Sensing IV; Serpico, S.B., Ed.; International Society for Optics and Photonics, SPIE: Bellingham, WI, USA, 1998; Volume 3500, pp. 237–248. [Google Scholar] [CrossRef]
- Garzelli, A.; Nencini, F.; Alparone, L.; Baronti, S. Multiresolution fusion of multispectral and panchromatic images through the curvelet transform. In Proceedings of the 2005 IEEE International Geoscience and Remote Sensing Symposium (IGARSS), Seoul, Republic of Korea, 25–29 July 2005; pp. 2838–2841. [Google Scholar]
- Aiazzi, B.; Alparone, L.; Baronti, S.; Garzelli, A.; Selva, M. Advantages of Laplacian pyramids over ”à trous” wavelet transforms for pansharpening of multispectral images. In Image and Signal Processing for Remote Sensing XVIII; Bruzzone, L., Ed.; International Society for Optics and Photonics, SPIE: Bellingham, WI, USA, 2012; Volume 8537, pp. 12–21. [Google Scholar] [CrossRef]
- Pacifici, F.; Longbotham, N.; Emery, W.J. The importance of physical quantities for the analysis of multitemporal and multiangular optical very high spatial resolution images. IEEE Trans. Geosci. Remote Sens. 2014, 52, 6241–6256. [Google Scholar] [CrossRef]
- Garzelli, A.; Aiazzi, B.; Alparone, L.; Lolli, S.; Vivone, G. Multispectral pansharpening with radiative transfer-based detail-injection modeling for preserving changes in vegetation cover. Remote Sens. 2018, 10, 1308. [Google Scholar] [CrossRef]
- Li, H.; Jing, L. Improvement of a pansharpening method taking into account haze. IEEE J. Sel. Top. Appl. Earth Observ. Remote Sens. 2017, 10, 5039–5055. [Google Scholar] [CrossRef]
- Arienzo, A.; Alparone, L.; Garzelli, A.; Lolli, S. Advantages of nonlinear intensity components for contrast-based multispectral pansharpening. Remote Sens. 2022, 14, 3301. [Google Scholar] [CrossRef]
- Jing, L.; Cheng, Q. An image fusion method taking into account phenological analogies and haze. Int. J. Remote Sens. 2011, 32, 1675–1694. [Google Scholar] [CrossRef]
- Addesso, P.; Longo, M.; Restaino, R.; Vivone, G. Sequential Bayesian methods for resolution enhancement of TIR image sequences. IEEE J. Sel. Top. Appl. Earth Observ. Remote Sens. 2015, 8, 233–243. [Google Scholar] [CrossRef]
- Alparone, L.; Facheris, L.; Baronti, S.; Garzelli, A.; Nencini, F. Fusion of multispectral and SAR images by intensity modulation. In Proceedings of the 7th International Conference on Information Fusion, Stockholm, Sweden, 28 June–1 July 2004; Volume 2, pp. 637–643. [Google Scholar]
- D’Elia, C.; Ruscino, S.; Abbate, M.; Aiazzi, B.; Baronti, S.; Alparone, L. SAR image classification through information-theoretic textural features, MRF segmentation, and object-oriented learning vector quantization. IEEE J. Sel. Top. Appl. Earth Observ. Remote Sens. 2014, 7, 1116–1126. [Google Scholar] [CrossRef]
- Aiazzi, B.; Alparone, L.; Baronti, S. Information-theoretic heterogeneity measurement for SAR imagery. IEEE Trans. Geosci. Remote Sens. 2005, 43, 619–624. [Google Scholar] [CrossRef]
- Aiazzi, B.; Alparone, L.; Baronti, S.; Garzelli, A. Coherence estimation from multilook incoherent SAR imagery. IEEE Trans. Geosci. Remote Sens. 2003, 41, 2531–2539. [Google Scholar] [CrossRef]
- Arienzo, A.; Argenti, F.; Alparone, L.; Gherardelli, M. Accurate despeckling and estimation of polarimetric features by means of a spatial decorrelation of the noise in complex PolSAR data. Remote Sens. 2020, 12, 331. [Google Scholar] [CrossRef]
- Hu, J.; Hong, D.; Zhu, X. MIMA: MAPPER-induced manifold alignment for semi-supervised fusion of optical image and polarimetric SAR data. IEEE Trans. Geosci. Remote Sens. 2019, 57, 9025–9040. [Google Scholar] [CrossRef]
- Iervolino, P.; Guida, R.; Riccio, D.; Rea, R. A novel multispectral, panchromatic and SAR data fusion for land classification. IEEE J. Sel. Top. Appl. Earth Observ. Remote Sens. 2019, 12, 3966–3979. [Google Scholar] [CrossRef]
- Li, W.; Jiang, J.; Guo, T.; Zhou, M.; Tang, Y.; Wang, Y.; Zhang, Y.; Cheng, T.; Zhu, Y.; Cao, W.; et al. Generating Red-Edge images at 3 m spatial resolution by fusing Sentinel-2 and Planet satellite products. Remote Sens. 2019, 11, 1422. [Google Scholar] [CrossRef]
- Bai, Y.; Sun, G.; Li, Y.; Ma, P.; Li, G.; Zhang, Y. Comprehensively analyzing optical and polarimetric SAR features for land-use/land-cover classification and urban vegetation extraction in highly-dense urban area. Int. J. Appl. Earth Observ. Geoinform. 2021, 103, 1–12. [Google Scholar] [CrossRef]
- Delegido, J.; Alonso, L.; González, G.; Moreno, J. Estimating chlorophyll content of crops from hyperspectral data using a normalized area over reflectance curve (NAOC). Int. J. Appl. Earth Obs. Geoinf. 2010, 12, 165–174. [Google Scholar] [CrossRef]
- Carpentiero, M.; Vivone, G.; Restaino, R.; Addesso, P.; Chanussot, J. An optimization procedure for robust regression-based pansharpening. IEEE Trans. Geosci. Remote Sens. 2022, 60, 5410416. [Google Scholar] [CrossRef]
- Aiazzi, B.; Alparone, L.; Garzelli, A.; Santurri, L. Blind correction of local misalignments between multispectral and panchromatic images. IEEE Geosci. Remote Sens. Lett. 2018, 15, 1625–1629. [Google Scholar] [CrossRef]
- Aiazzi, B.; Alparone, L.; Baronti, S.; Carlà, R.; Garzelli, A.; Santurri, L. Sensitivity of pansharpening methods to temporal and instrumental changes between multispectral and panchromatic data sets. IEEE Trans. Geosci. Remote Sens. 2017, 55, 308–319. [Google Scholar] [CrossRef]
- Alparone, L.; Garzelli, A.; Vivone, G. Intersensor statistical matching for pansharpening: Theoretical issues and practical solutions. IEEE Trans. Geosci. Remote Sens. 2017, 55, 4682–4695. [Google Scholar] [CrossRef]
- Arienzo, A.; Aiazzi, B.; Alparone, L.; Garzelli, A. Reproducibility of pansharpening methods and quality indexes versus data formats. Remote Sens. 2021, 13, 4399. [Google Scholar] [CrossRef]
- Lolli, S.; Di Girolamo, P. Principal component analysis approach to evaluate instrument performances in developing a cost-effective reliable instrument network for atmospheric measurements. J. Atmos. Ocean. Technol. 2015, 32, 1642–1649. [Google Scholar] [CrossRef]
- Lolli, S.; Sauvage, L.; Loaec, S.; Lardier, M. EZ LidarTM: A new compact autonomous eye-safe scanning aerosol Lidar for extinction measurements and PBL height detection. Validation of the performances against other instruments and intercomparison campaigns. Opt. Pura Apl. 2011, 44, 33–41. [Google Scholar]
- Chavez, P.S., Jr. An improved dark-object subtraction technique for atmospheric scattering correction of multispectral data. Remote Sens. Environ. 1988, 24, 459–479. [Google Scholar] [CrossRef]
- Chavez, P.S., Jr. Image-based atmospheric corrections–Revisited and improved. Photogramm. Eng. Remote Sens. 1996, 62, 1025–1036. [Google Scholar]
- Fu, Q.; Liou, K.N. On the correlated k-distribution method for radiative transfer in nonhomogeneous atmospheres. J. Atmos. Sci. 1992, 49, 2139–2156. [Google Scholar] [CrossRef]
- Ratha, D.; Mandal, D.; Kumar, V.; Mcnairn, H.; Bhattacharya, A.; Frery, A.C. A generalized volume scattering model-based vegetation index from polarimetric SAR data. IEEE Geosci. Remote Sens. Lett. 2019, 16, 1791–1795. [Google Scholar] [CrossRef]
- Treuhaft, R.N.; Siqueira, P.R. Vertical structure of vegetated land surfaces from interferometric and polarimetric radar. Radio Sci. 2000, 35, 141–177. [Google Scholar] [CrossRef]
- Freeman, A. Fitting a two-component scattering model to polarimetric SAR data from forests. IEEE Trans. Geosci. Remote Sens. 2007, 45, 2583–2592. [Google Scholar] [CrossRef]
- Lapini, A.; Pettinato, S.; Santi, E.; Paloscia, S.; Fontanelli, G.; Garzelli, A. Comparison of machine learning methods spplied to SAR images for forest classification in Mediterranean areas. Remote Sens. 2020, 12, 369. [Google Scholar] [CrossRef]
- Lapini, A.; Bianchi, T.; Argenti, F.; Alparone, L. Blind speckle decorrelation for SAR image despeckling. IEEE Trans. Geosci. Remote Sens. 2014, 52, 1044–1058. [Google Scholar] [CrossRef]
- Aiazzi, B.; Alparone, L.; Baronti, S.; Garzelli, A.; Zoppetti, C. A robust change detection feature for Cosmo-SkyMed detected SAR images. In Proceedings of the 2011 6th International Workshop on the Analysis of Multi-Temporal Remote Sensing Images (Multi-Temp), Ispra, Italy, 12–14 July 2011; pp. 125–128. [Google Scholar] [CrossRef]
- Aiazzi, B.; Alparone, L.; Baronti, S.; Garzelli, A.; Zoppetti, C. Nonparametric change detection in multitemporal SAR images based on mean-shift clustering. IEEE Trans. Geosci. Remote Sens. 2013, 51, 2022–2031. [Google Scholar] [CrossRef]
- Garzelli, A.; Zoppetti, C. Geometrically accurate change mapping From VHR SAR Images. In Proceedings of the 2019 IEEE International Geoscience and Remote Sensing Symposium, Yokohama, Japan, 28 July–2 August 2019; pp. 25–28. [Google Scholar] [CrossRef]
- Garzelli, A.; Aiazzi, B.; Alparone, L.; Argenti, F.; Arienzo, A.; Zoppetti, C. Impact of a spatial decorrelation of the noise on the estimation accuracy of temporal changes in the scene from a couple of single-look SAR images. In Image and Signal Processing for Remote Sensing XXVI; Bruzzone, L., Bovolo, F., Santi, E., Eds.; International Society for Optics and Photonics, SPIE: Bellingham, WI, USA, 2020; Volume 11533, pp. 107–117. [Google Scholar] [CrossRef]
- Aiazzi, B.; Alparone, L.; Baronti, S.; Carlà, R.; Garzelli, A.; Santurri, L. Full-scale assessment of pansharpening methods and data products. In Image and Signal Processing for Remote Sensing XX; Bruzzone, L., Ed.; International Society for Optics and Photonics, SPIE: Bellingham, WI, USA, 2014; Volume 9244, pp. 1–12. [Google Scholar] [CrossRef]
- Johnson, B. Effects of pansharpening on vegetation indices. ISPRS Int. J. Geo-Inf. 2014, 3, 507–522. [Google Scholar] [CrossRef]
- Minchella, A.; Del Frate, F.; Capogna, F.; Anselmi, S.; Manes, F. Use of multitemporal SAR data for monitoring vegetation recovery of Mediterranean burned areas. Remote Sens. Environ. 2009, 113, 588–597. [Google Scholar] [CrossRef]
- Aiazzi, B.; Alparone, L.; Arienzo, L.; Garzelli, A.; Zoppetti, C. Monitoring of changes in vegetation status through integration of time series of hyper-sharpened Sentinel-2 red-edge bands and information-theoretic textural features of Sentinel-1 SAR backscatter. In Image and Signal Processing for Remote Sensing XXV; Bruzzone, L., Ed.; International Society for Optics and Photonics, SPIE: Bellingham, WI, USA, 2014; Volume 9244, pp. 313–324. [Google Scholar]
- López García, M.J.; Caselles, V. Mapping burns and natural reforestation using Thematic Mapper data. Geocarto Int. 1991, 6, 31–37. [Google Scholar] [CrossRef]
Disclaimer/Publisher’s Note: The statements, opinions and data contained in all publications are solely those of the individual author(s) and contributor(s) and not of MDPI and/or the editor(s). MDPI and/or the editor(s) disclaim responsibility for any injury to people or property resulting from any ideas, methods, instructions or products referred to in the content. |
© 2023 by the authors. Licensee MDPI, Basel, Switzerland. This article is an open access article distributed under the terms and conditions of the Creative Commons Attribution (CC BY) license (https://creativecommons.org/licenses/by/4.0/).