Article

Spatiotemporal Monitoring of Urban Sprawl in a Coastal City Using GIS-Based Markov Chain and Artificial Neural Network (ANN)

1
Geography Department, College of Arts and Social Sciences, Sultan Qaboos University, El Khodh, Aseeb, Muscat 123, Oman
2
Department of Geography and GIS, Faculty of Arts, Alexandria University, Alexandria 21526, Egypt
3
Department of Earth and Ocean Sciences, University of North Carolina, Wilmington, 601 South College Road, Wilmington, NC 28403-5944, USA
*
Author to whom correspondence should be addressed.
Remote Sens. 2023, 15(3), 601; https://doi.org/10.3390/rs15030601
Submission received: 21 November 2022 / Revised: 18 December 2022 / Accepted: 16 January 2023 / Published: 19 January 2023

Abstract

:
Over the last two decades, globally coastal areas have urbanized rapidly due to various socioeconomic and demographic driving forces. However, urban expansion in towns and cities of the developing world has been characterized by entangled structures and trends exacerbating numerous negative consequences such as pollution, ecological degradation, loss of agricultural land and green areas, and deprived settlements. Substantially, spatial simulation of urban growth and their consequences on coastal areas particularly in Egypt is still very rare. Geospatial modelling coastal urban growth is crucial and has enormous potential for coastal land use transformation and urban sustainability. The key aim of this study was to analyze spatiotemporal changes (2010–2020) and simulate future dynamics (2030 to 2050) of land use/land cover (LULC) in Alexandria Governorate, Egypt. Artificial Neural Network–Multiple Layer Perceptron (ANN-MLP) and Markov Chain techniques were employed within the GIS platform to assess processes of land transitions and predict urban growth trends, patterns and dimensions. The forecasting process was based on three maps of LULC derived from classified Landsat images of 2000, 2010 and 2020. In addition, topographical, demographic, accessibility, proximity factors were generated and developed in the form of raster spatial parameters of urbanization driving forces. The findings revealed that the observed expansion of the built-up area during one decade (2010–2020) was 12,477.51 ha, with a decline in agricultural area (7440.39 ha) and bare land (4904.91 ha). The projected change was forecasted to be 71,544 ha by 2030 and 81,983 ha in 2040 with a total of 35,998 ha increase in the built-up area and residential expansion by 2050. Despite this expected pattern of rapid changes, urban growth will be shaped by the key drivers of proximity to coastline and agricultural land transformation. The analysis indicates that the vertical urban growth will be most likely dominant along the coastal zone due to the lack of vacant lands, whereas the horizontal urban expansion will primarily take place towards the east-northeastern and south-southeastern directions of the city. The present work provides a holistic framework for establishing initial coastal land use plans not only for planners and urban administrators in Alexandria but also for policymakers and coastal municipalities in developing nations.

1. Introduction and Theoretical Framework

At present, approximately 4 billion people (55% of the world’s population) live in cities and urban zones and more than 2.4 billion people (40% of the world’s population) live within 100 km of the coasts [1]. It is projected that global urban population will double by 2050, and that 7 out of 10 persons will live in urban agglomerations [2]. Globally, coastal urban settlements have always attracted human populations for their rich natural resources, economic revenues and high living standards [3]. Therefore, coastal areas are undergoing unprecedented and intricate urban processes that are impacting environmental diversity and marine ecosystems. Coastal urban growth is a multifaceted, heterogeneous and entangled phenomenon that is highly associated with numerous spatial, socioeconomic and demographic driving forces. Indeed, in most developing countries, coastal urban expansion leads to rapid and unplanned forms of agglomerations and settlements [4]. Accordingly, several coastal cities and towns are being subjected to human-induced development and conversion of natural resources. In most cases, coastal cities serve as major ports and are therefore important economic centres, particularly for external and internal trades.
As polarized urban centers, coastal cities are desirable places for living and working and serve as major hubs for rural–urban population migration. Nevertheless, and due to the limited vacant lands, urbanization has resulted in several forms of vertical growth, housing overcrowding, sprawl and slums. In essence, the rapid urban dynamics of coastal cities in developing nations trigger inevitable stressors on local biospheres, species extinction and habitat loss. Besides the natural population increase, rural–urban mobility is another crucial indicator in predicting urban expansion in large coastal cities. Migration and the movement of people from villages and rural places to cities is an essential driver of housing growth and contributes significantly to urbanization.
Owing to several socioeconomic and demographic factors, specifically urban-based employment, coastal cities have experienced significant population growth and urban expansion in the last two decades [5]. In coastal areas, the growth rate is outpacing that of the surrounding rural areas, due to economic diversification and migration to coastal cities [6]. One major concern of unplanned residential expansion and urban sprawl in coastal cities is the conversion of agricultural lands into residential areas where ecosystem services and habitats are altering [7,8,9]. The shrinking of agricultural hinterland areas usually negatively influences the ecosystem of coastal urban agglomeration, particularly the rise in air pollution due to increasing urban heats and concentration of carbon dioxide emissions [10].
The agricultural land transition is primarily associated with spatial factors, specifically proximity to urban cores, education and health facilities, amenities and major roads. The decision and likelihood of agricultural land conversion into residential and commercial properties is also associated with land prices and the economic value [11,12].
Given the growing awareness of urbanization trends globally and their consequences, utilizing GIS and remote sensing methods on monitoring and forecasting spatio-temporal changes of the LULC is quite effective in terms of enhancing our understanding of the essential key components of land changes and their spatial ramifications [13,14]. Such advanced techniques and models combine satellite images, aerial photos, spatial layers and ancillary attribute data for the projection of urban changes at different scales [15,16,17,18,19]. A variety of models offer platforms to characterize and simulate LULC patterns and human activities that shape the driving forces of change processes. Therefore, the growing body of literature that has adopted such geospatial techniques has fundamentally provided a more profound and comprehensive understanding of land change. The geospatial models range from mathematical approaches that involve all components of the transition mechanism [17,20,21] to agent-based models that undertake the modelling process according to individual decision making [22,23,24]. Similarly, and to improve the accuracy of urban land use/cover prediction, other studies have relied on the integration of mathematical models, particularly Markov Chain and Cellular Automata (CA-Markov) with agent-based models [25,26,27,28].
The increasing availability of satellite images at finer resolutions has allowed the incorporation of advanced geospatial techniques to monitor land changes globally at different scales [29]. Furthermore, the employment of Machine Learning techniques, as computational algorithms, in LULC projections has also enriched image classification and provided accurate estimates for land dynamics [30]. For instance, emulating the nerve biological system of the human brain, Multi–Layer Perceptron–Artificial Neural Networks (MLP-ANN) is a computational model which is utilized to recognize land patterns and simulate urban changes [31,32,33,34]. Aburas et al. 2016 conducted an invaluable review highlighting the strength of utilizing Cellular Automata (CA) models in simulating spatiotemporal urban growth [35]. Another example [36] employed advanced models (Dynamics of Land System (DLS) and Computable General Equilibrium of Land Use Change (CGELUC)) to spatially simulate land use structure across Shandong Province, China. The findings indicated that spatial variations in land allocations are expected to occur within two decades. In addition, grass, cultivated and vacant lands will decline based on green development and resource consumption scenarios.
Recently, a great body of literature has been developed that has incorporated spatial algorithms and geospatial techniques to forecast urban dynamics. For instance, many attempts have been made to project changes in land use distribution patterns in coastal cities of developing countries utilizing integrated GIS and remote sensing techniques (e.g., [16,37,38,39]) and a growing number of studies focus on investigating land use dynamics in coastal areas of the Middle East region, e.g., [40,41,42]. However, few studies have explored land use changes in Egyptian coastal areas [43,44]; even fewer have projected urban growth and expansion along northwestern coasts of Egypt [45,46]. Despite the numerous studies that have addressed the LULC changes in the Egyptian coastal and non-coastal areas, e.g., [45,47,48,49], no study has accounted for the prediction of Alexandria’s urban growth over the coming decades.
Alexandria is one of Egypt’s oldest cities and the country’s second most populous metropolis after Cairo. Alexandria Governorate reached a population of 5,450,371 inhabitants in August 2021 [50]. The name Alexandria stems from its founder, Alexander the Great, who established it in 331 BC [51]. Throughout its history, the city has served as a melting pot of several global and local cultures and therefore it is regarded as a multicultural and exceptional coastal metropolis [52]. Due to these characteristics, Alexandria attracts people from all across the country, which has made the city a rich and diversified place. Consequently, and during the last two decades, Alexandria has exhibited rapid urban growth and extraordinary land cover changes [53]. The changes in LULC are predominately due to a variety of driving forces that influence built-up area expansion including population mobility, immigration from rural areas, industrialization, port commercialization, employment opportunities and modernization. In a rapidly urbanizing coastal zone like Alexandria, understanding LULC dynamics is crucial to sustain the urban ecosystems, identify the driving forces of change and diminish the negative consequences of urban expansion. The analysis and simulation of LULC changes in Alexandria Governorate, as a coastal zone, is not only necessary for urban planning and policy actions but also is essential for protecting agricultural land and controlling sprawl.
In order to enhance the understanding of coastal urban dynamics of Alexandria, the main aim of the present study is to deploy advanced geospatial techniques, in particular the Artificial Neural Network–Multi-Layer Perceptron (ANN-MLP) model, to spatially monitor and forecast land changes across Alexandria Governorate. Conceptually, underlying this research aim, the following questions were answered:
  • What are the spatial patterns of urban growth in the coastal governorate of Alexandria?
  • What are the major driving forces that have a significant impact on land changes and what are its spatial characteristics?
  • To what extent can future scenarios of LULC changes be successfully projected using remote sensing data and Machine Learning approaches?
  • How will unplanned urbanization affect ecosystems and natural resources, especially agricultural land and biodiversity?
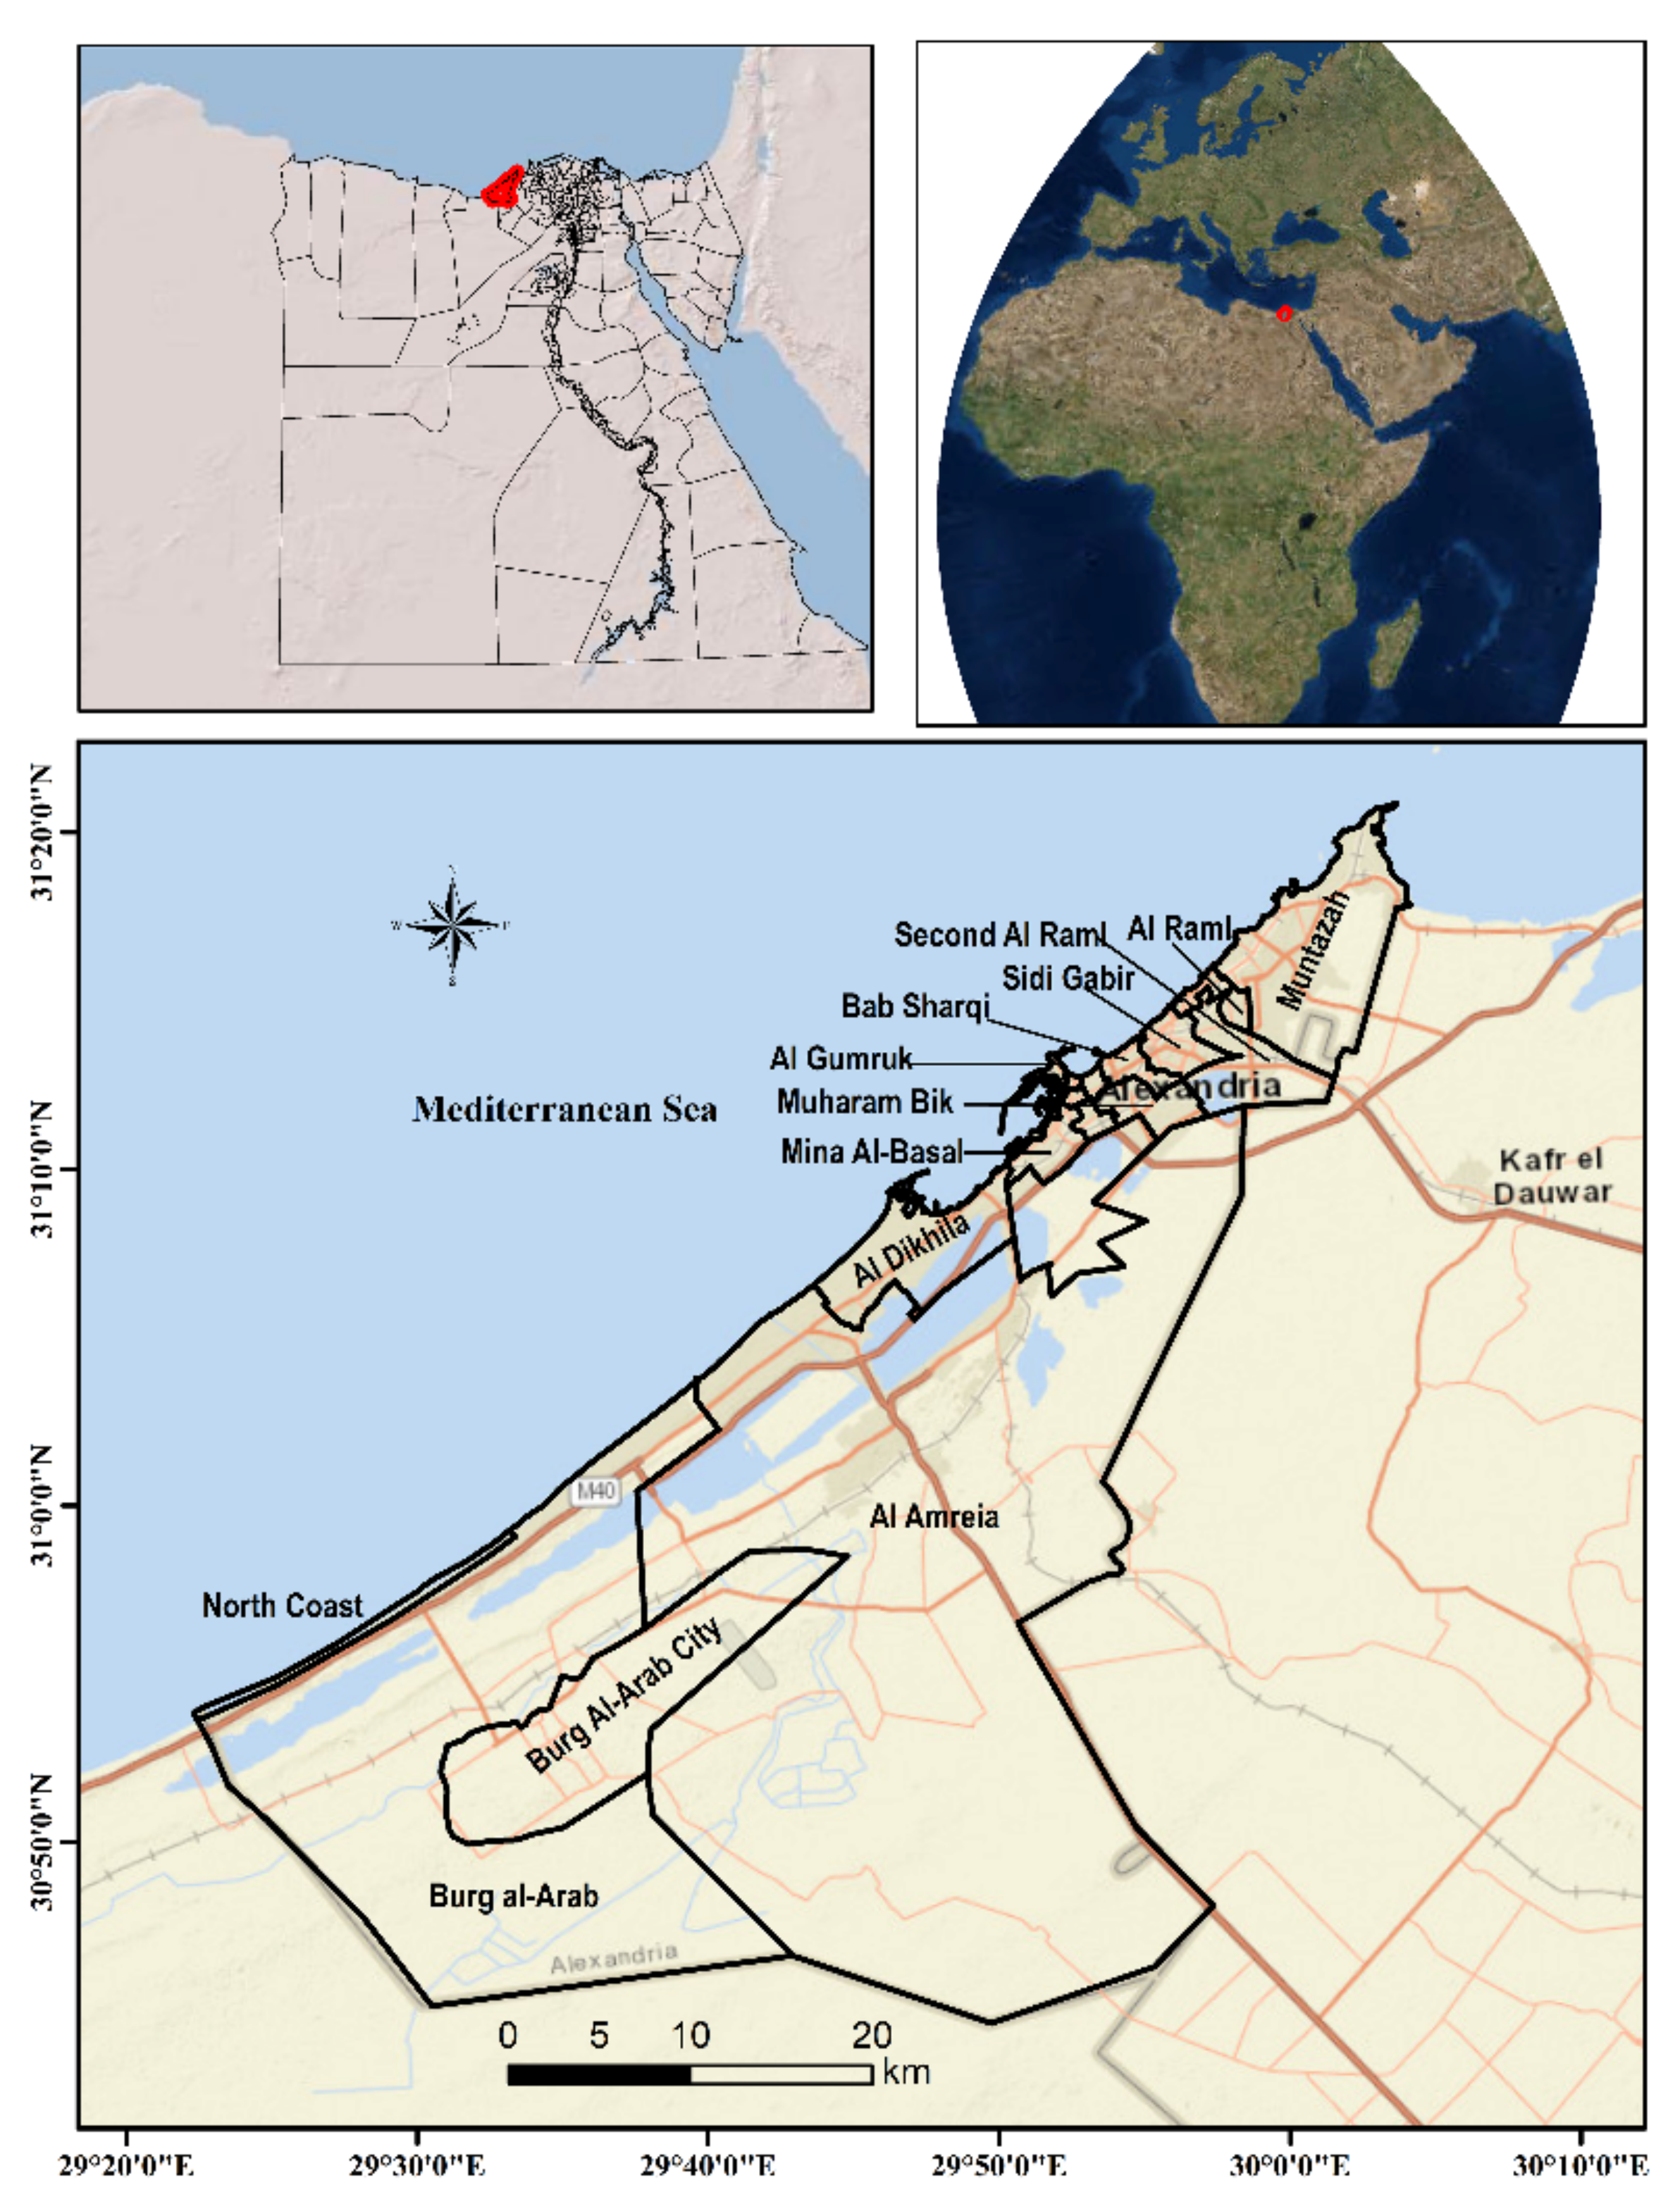
To achieve the research goal and answer the aforementioned research questions, advanced geospatial techniques were deployed and spatial modelling processes were carried out within GIS and remote sensing environments. The integrated GIS and image processing platforms can offer invaluable information and an essential basis for modelling and forecasting land change patterns and identifying driving forces that are fundamentally responsible for urban expansion and growth mechanisms.
An extensive amount of literature has addressed how rapid coastal urban growth may influence marine ecosystems, e.g., [54,55]. For instance, in his seminal work about the health of coastal marine ecosystem, the author of [54] pointed out that marine ecosystems of coastal cities are under massive pressure, mainly from coastal development and urban sprawl. Similarly, ref. [34] pinpoints a number of stressors that impact marine ecosystems, particularly urban expansion and anthropogenic activities that cause severe environmental pollution. In the same vein, ref. [55] 2015 adopted a geospatial analysis to examine pressure on marine ecosystems in Latin America and its drivers, particularly socioeconomic activities, development of settlements, population growth and land use dynamics. The findings of this analysis indicated that during the last seven decades, populations of deltas and estuaries increased eightfold.
In the same line of literature, several studies have highlighted human-induced threats on Alexandria shorelines, e.g., [56,57,58]. For example, a broader perspective was adopted by [58] to shed light on the influence of urban development in Alexandria on marine ecosystems. The analysis specifically created a coastal vulnerability index (CVI) incorporating many geological and physical criteria. The results of the analysis revealed that Alexandria coasts encounter various environmental hazards and almost 32% of the shoreline was under very high and high risks while 42% were at moderate vulnerability. Another study explicitly reported significant negative influences of urbanization across Alexandria Governorate on vegetation and agricultural lands [53].
Our review demonstrated that explicit geospatial modelling research on land use dynamics, urban growth and future forecasting of urban change processes across Alexandria Governorate is still very rare. Notably, the dynamics of coastal urban patterns, its directions and associated consequences need to be spatially examined and estimated. Accordingly, this study, through integrated MC and ANN-MLP techniques within the GIS platform, is the first attempt to bridge the gap in the existing literature by projecting urban growth and its spatial ramifications in Alexandria up to 2050. The outcomes of this analysis result in crucial information and may serve as essential guidelines for governmental strategies and policy makers not only in the fields of controlling urban sprawl, agricultural land loss and housing provision but also in the domains of coastal area management and environmental degradation.

2. Study Area

Over the past two decades, Alexandria has been a fast-growing large coastal governorate in Egypt as it emerged as the premier port commercial, industrial and transportation centre of the northwest Nile Delta. The governorate stretches over a 70 km long coast with a total area size of approximately 2300 km². It is situated on the Mediterranean Sea and has the most important harbor in Egypt. Alexandria encompasses a number of lakes and water canals for agricultural activities and population needs. The governorate is bordered by El Behera Governorate in the south and the east and Matrouh Governorate in the west while it is bordered by the Mediterranean Sea in the north (Figure 1). Approximately half of Egyptian industrial activities are located in and around Alexandria, particularly food, chemicals, spinning and weaving, fertilizers and oil industries—mainly extraction and refining.
Geographically, the study area consists of 19 neighborhoods including New Borg Al-Arab City. The population distribution and concentration across the administrative zones vary from the far east, where population density is the highest, to the southwest part, which is described as the least populous part. For instance, Al-Amiriya Second Neighborhood is considered the largest area (596.7 km²), while only 5.38% of the total population of the governorate (5,450,371) live within it [50]. In contrast, the area of Al-Raml First Neighborhood is only 4.2 km², while it is characterized by a large population concentration and is the highest in terms of population density (66,115 people/km²). Likewise, neighborhoods of ElGomrok (57,725 people/km²), Bab Shark (41,060 people/km²) and Al-Labban (39,288 people/km²) are characterized by high population density. On the other hand, the administrative zones with low population concentration are located in the south and southwest such as neighborhoods of the northern coastal part (195 people/km²), New Borg Al-Arab City (263 people/km²) and the Borg Al-Arab City (286 people/km²) and Second Al-Amiriya (466 people/km²).
As a main centre and destination for internal immigration, Alexandria has experienced a rapid population growth. Therefore, population size had increased from 4,110,015 in 2006 to 5,163,750 in 2017 [50]. The increase in population size, particularly due to immigration currents from the surrounding governorates, has led to rampant suburbanization patterns and has significantly expanded the built-up areas outward onto the agricultural hinterland in the south and southwest directions. Presumably, the rapid urban expansion in Alexandria is likely to continue during the coming decades, which may impact the urban fabric and alter the LULC structure.

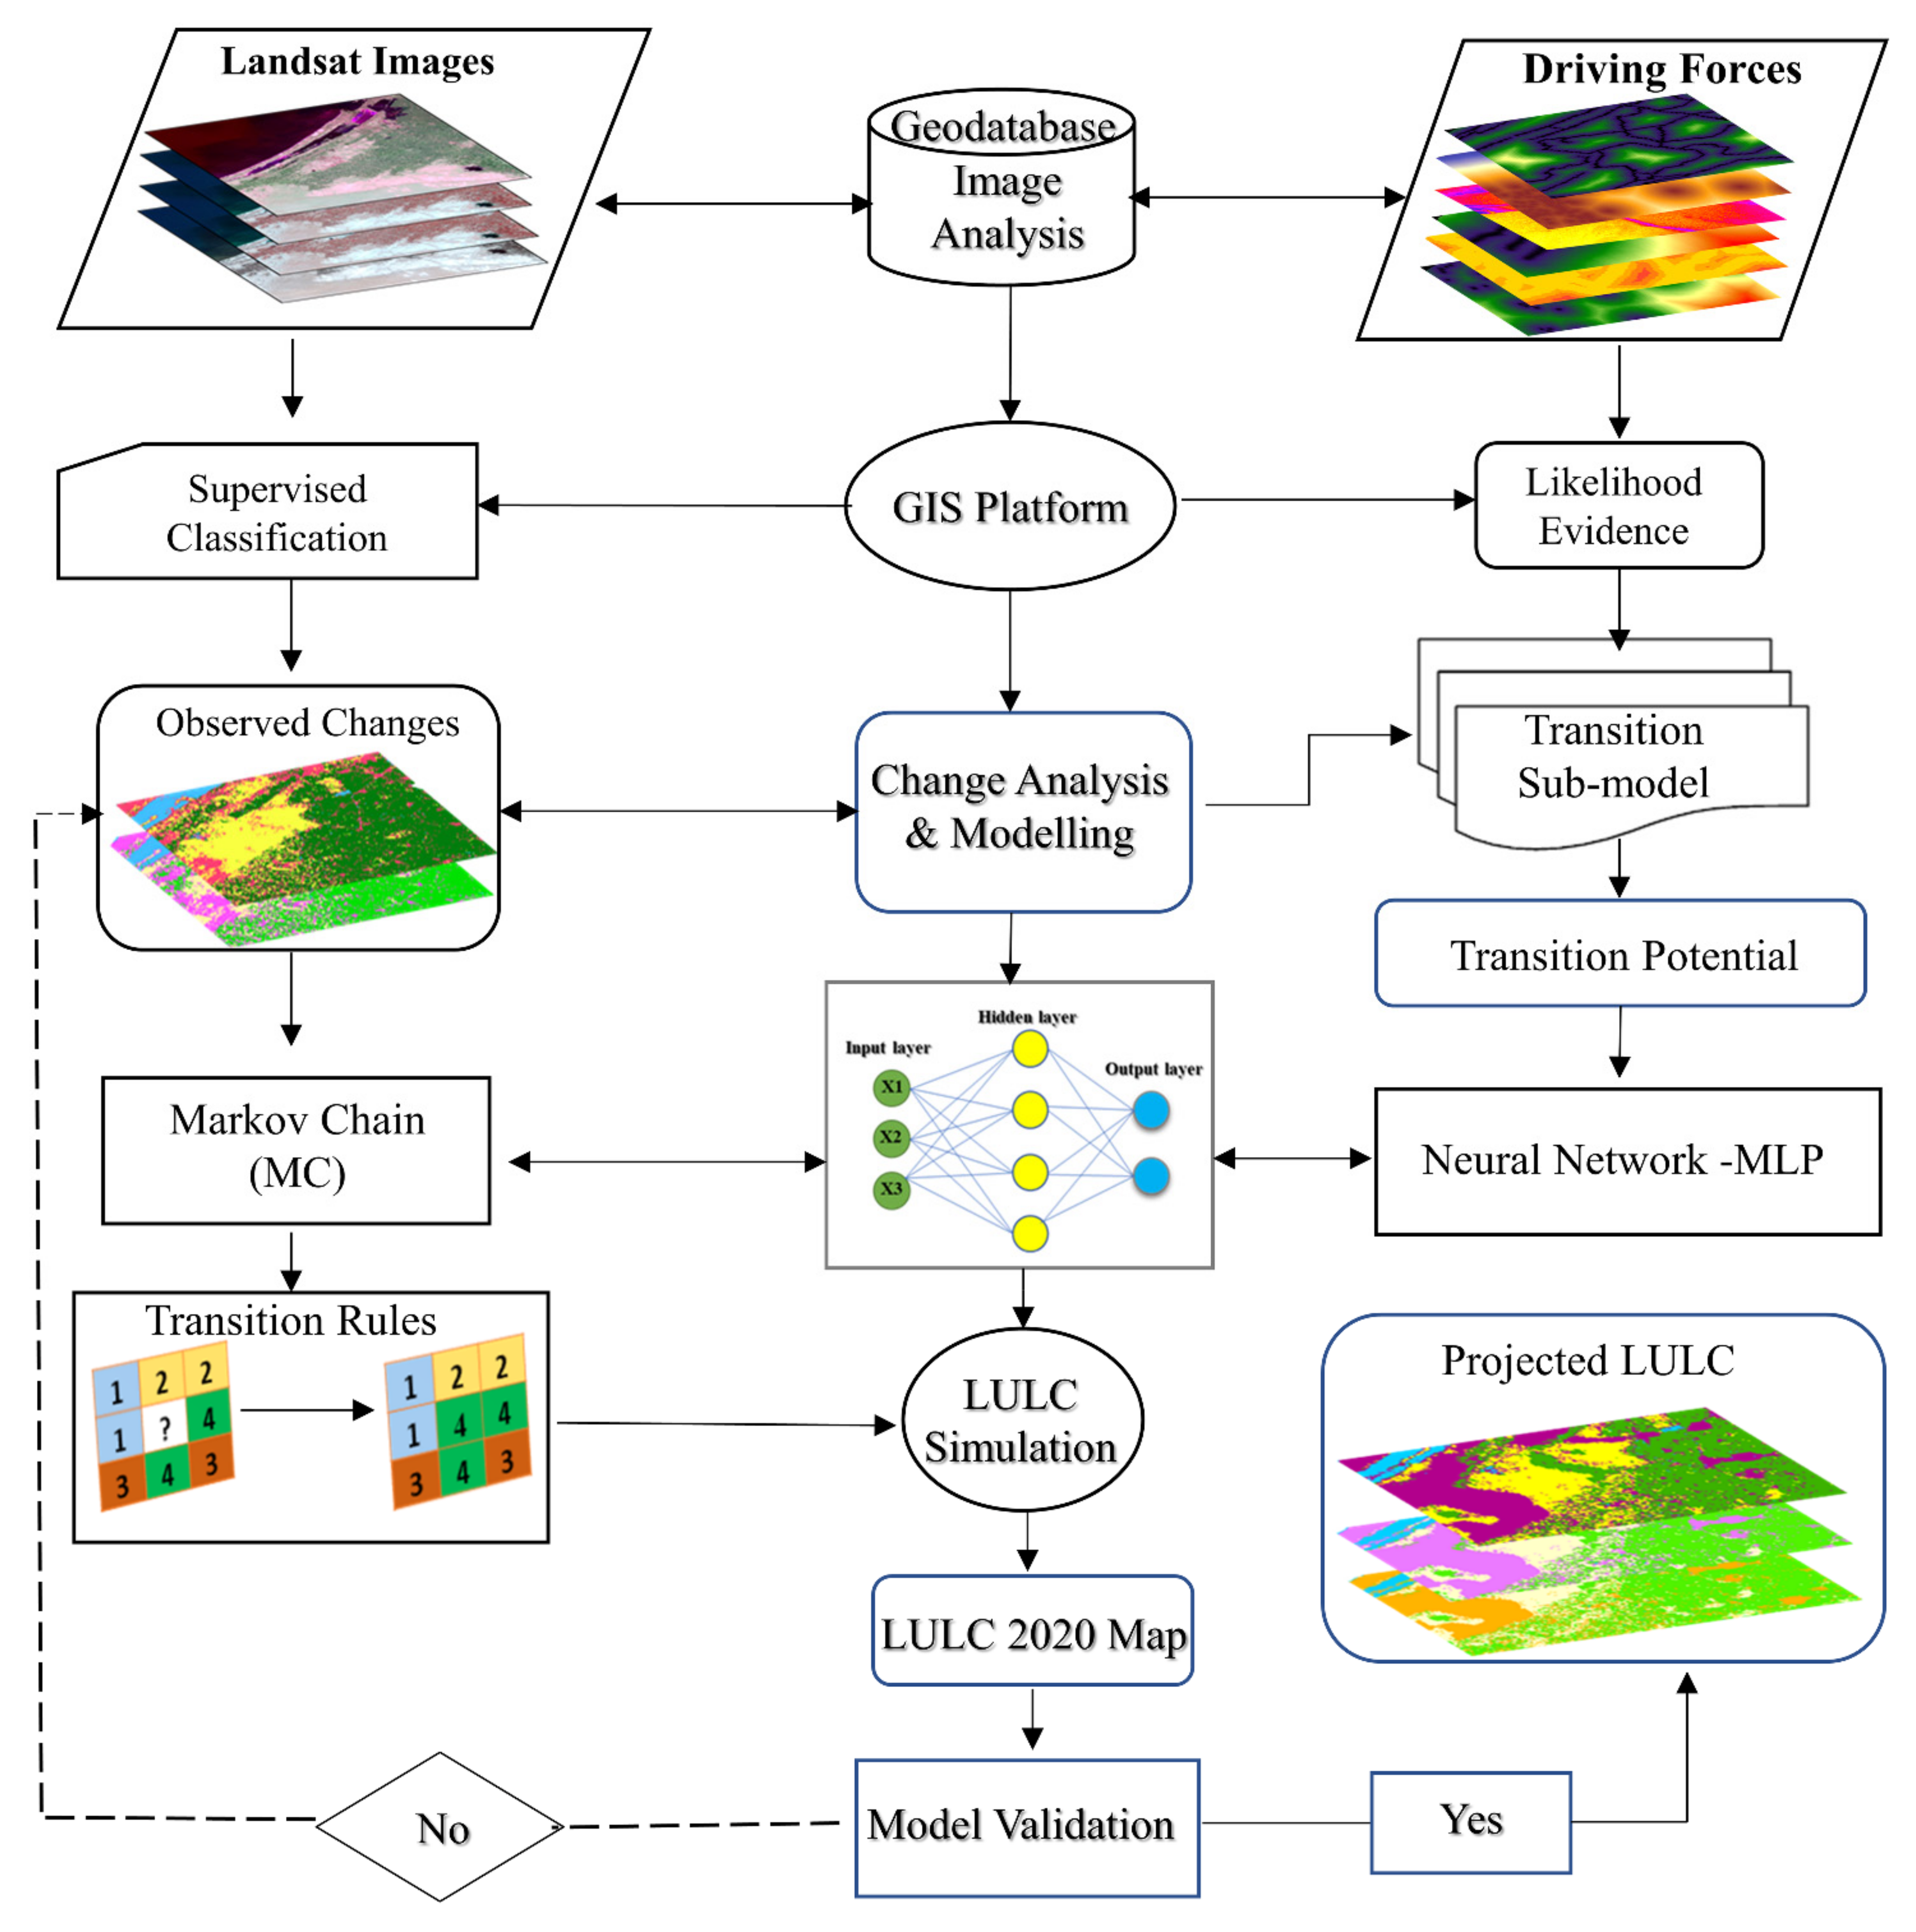
3. Methods of Data Acquisition and Analysis

The methodological framework and the implemented stages of this analysis and modelling process are depicted in Figure 2.

3.1. Satellite Imagery and LULC Classification

In order to derive LULC classifications across the study area, Landsat 7 and 8 (LS) satellite images for the years 2000, 2010 and 2020 with 30 m spatial resolution were acquired from the United State Geological Survey (USGS). To avoid the influence of seasonal weather variations, all images were selected based on scene quality (cloud and haze) and integrated season period and thus all acquired images were cloud free and had 0% cloud cover over the study area. The collected images were subdivided, stacked and mosaiced within ENVI 5.3 software. A detailed description of these images is given in Table 1.
Using the Maximum Likelihood Classification (MLC) method, the three LS mosaics were classified and four LULC classes (i.e., built-up, bare land, agricultural and water) were produced. The category of built-up area includes spatial features of residential and commercial zones, towns, urban agglomerations, transportation networks, bridges, urban infrastructures, facilities and urban amenities. The second class represents barren land including all bare soils, non-vegetated areas and lands that are not being used and are free of buildings or human activities. Most of the barren land across Alexandria Governorate consists of desert sands. The third land category is agricultural land, which comprises all arable land and contains plant types, trees, farms, grass, pastures, cultivated lands, and croplands. The last class is water which involves inland water, and ponds as well as water bodies of Mariout and Abu Qir Lakes. Driving forces that influence change of LULC classes are characterized in (Table 2).

3.2. Accuracy Assessment of Classification

The assessment of the classified images is an important step to examine the reliability and accuracy of LULC classes [68]. In order to calculate the accuracy of the classified images, a confusion matrix analysis was used and the overall accuracy assessment, including both producer and user accuracies, was generated. Additionally, kappa coefficients were computed to account for the random distribution effects and examine whether the result of the error matrix was significantly better than any random classification pattern [69].

3.3. Markov Chain (MC)

The Markov Chain algorithm, as a function for modeling urban growth, was implemented in the present study to generate the required simulation maps. This approach is suitable for simulating land cover change, particularly in areas where understanding landscape relations is somehow challenging. Markov Chain works by employing the immediate state of the inputs along with a spatially representative base of potential pixel transformations to dynamically extrapolate a simulation [70]. The Markov Chain model produces hard and soft simulation maps, which offers a unique change prediction map for the area under investigation. The hard simulation displays specific pixels that will change, while a soft simulation represents vulnerability of change in a continuous format.
The Markov Chain technique is a stochastic model which characterizes a sequence of temporal events and substantially calculates temporal probability matrices of transformation from one LULC type to another [70,71]. However, the model lacks the advantage of producing the forecasting results on explicit spatial bases. Utilizing this model in forecasting LULC changes, the algorithm determines a temporal base from which a matrix of probability transformation change between land categories can be generated.
In this research, an MC model was implemented to project LULC changes three decades ahead (2030, 2040 and 2050) as follows:
S t + 1 = P i j × s t
where S(t) and S(t + 1) specify the LULC types at time t and t + 1; Pij is the transition probability matrix in a state and is calculated as follows:
M t = P i j = P 11 P 12 P 1 n P 21 P 22 P 2 n P n 1 P n 2 P n n
S t + 1 = P _ i j × s t
where Mt indicates the Markov transition matrix, i,j is the LULC type at the first and second time, Pij shows the probability of LULC type i changing into type j and N represents the number of LULC classes across the study area.

3.4. Multi-Layer Perceptron (MLP)

Multi-Layer Perceptron (MLP) is a feedforward neural network technique which mimics the biological system of the human brain. It is eventually utilized to solve entangled spatial problems. In this research, the MLP was employed to generate the potential transition of LULC changes according to the historical classified images (2000, 2010 and 2020). The computed transitional probabilities have the advantage of capturing the influences of environmental, socioeconomic, and demographic drivers on LULC transformation [70]. The algorithm is hierarchically structured in three major components: input (variables or drivers), hidden and output layers, each of which consists of a set of neurons. Each hidden layer receives values from the preliminary input layers and an assigned weight is calculated before passing the total values to the output layers from which the results are produced [71]. Through the first stage of processing, MLP allows the entered variables (inputs) to transfer and each neuron receives the value from the previous layer and a weighted sum is calculated as follows:
L U L C i = f j = 1 n w i j x j + b i
where LULCi specifies the output at node i while f represents an activation function; x displays the inputs or drivers (x1, xi,, xn), w is the weights (w1j,…, wij,…, wnj) and wij is the weight connection from the ith node to node j. bi is a constant which adjusts the output along with synaptic weights to optimize the model fit. In the MLP, the value of a neuron N can be computed as follows:
u N = j = 1 k w k j x j
where uN is a linear combination, and wk1, wk2,…, wkn indicate the synaptic weights of neuron N. The output of the neuron N is computed as follows:
y N = u N θ N
where is the action function (linear or nonlinear) and θ k is the threshold.

3.5. Spatial Trends

To measure the rate and directions of LULC changes across the study area, trend surface analysis was employed, defined mathematically as:
S = i = 0 k j = 0 i b i j x i j y j
where S denotes the interpolated surface; k signifies the maximum order to be generated, while b displays a coefficient of the polynomial. Both i and j are iteration parameters associated with k, in which i = 0, , k and j = 0, , i.

4. Results

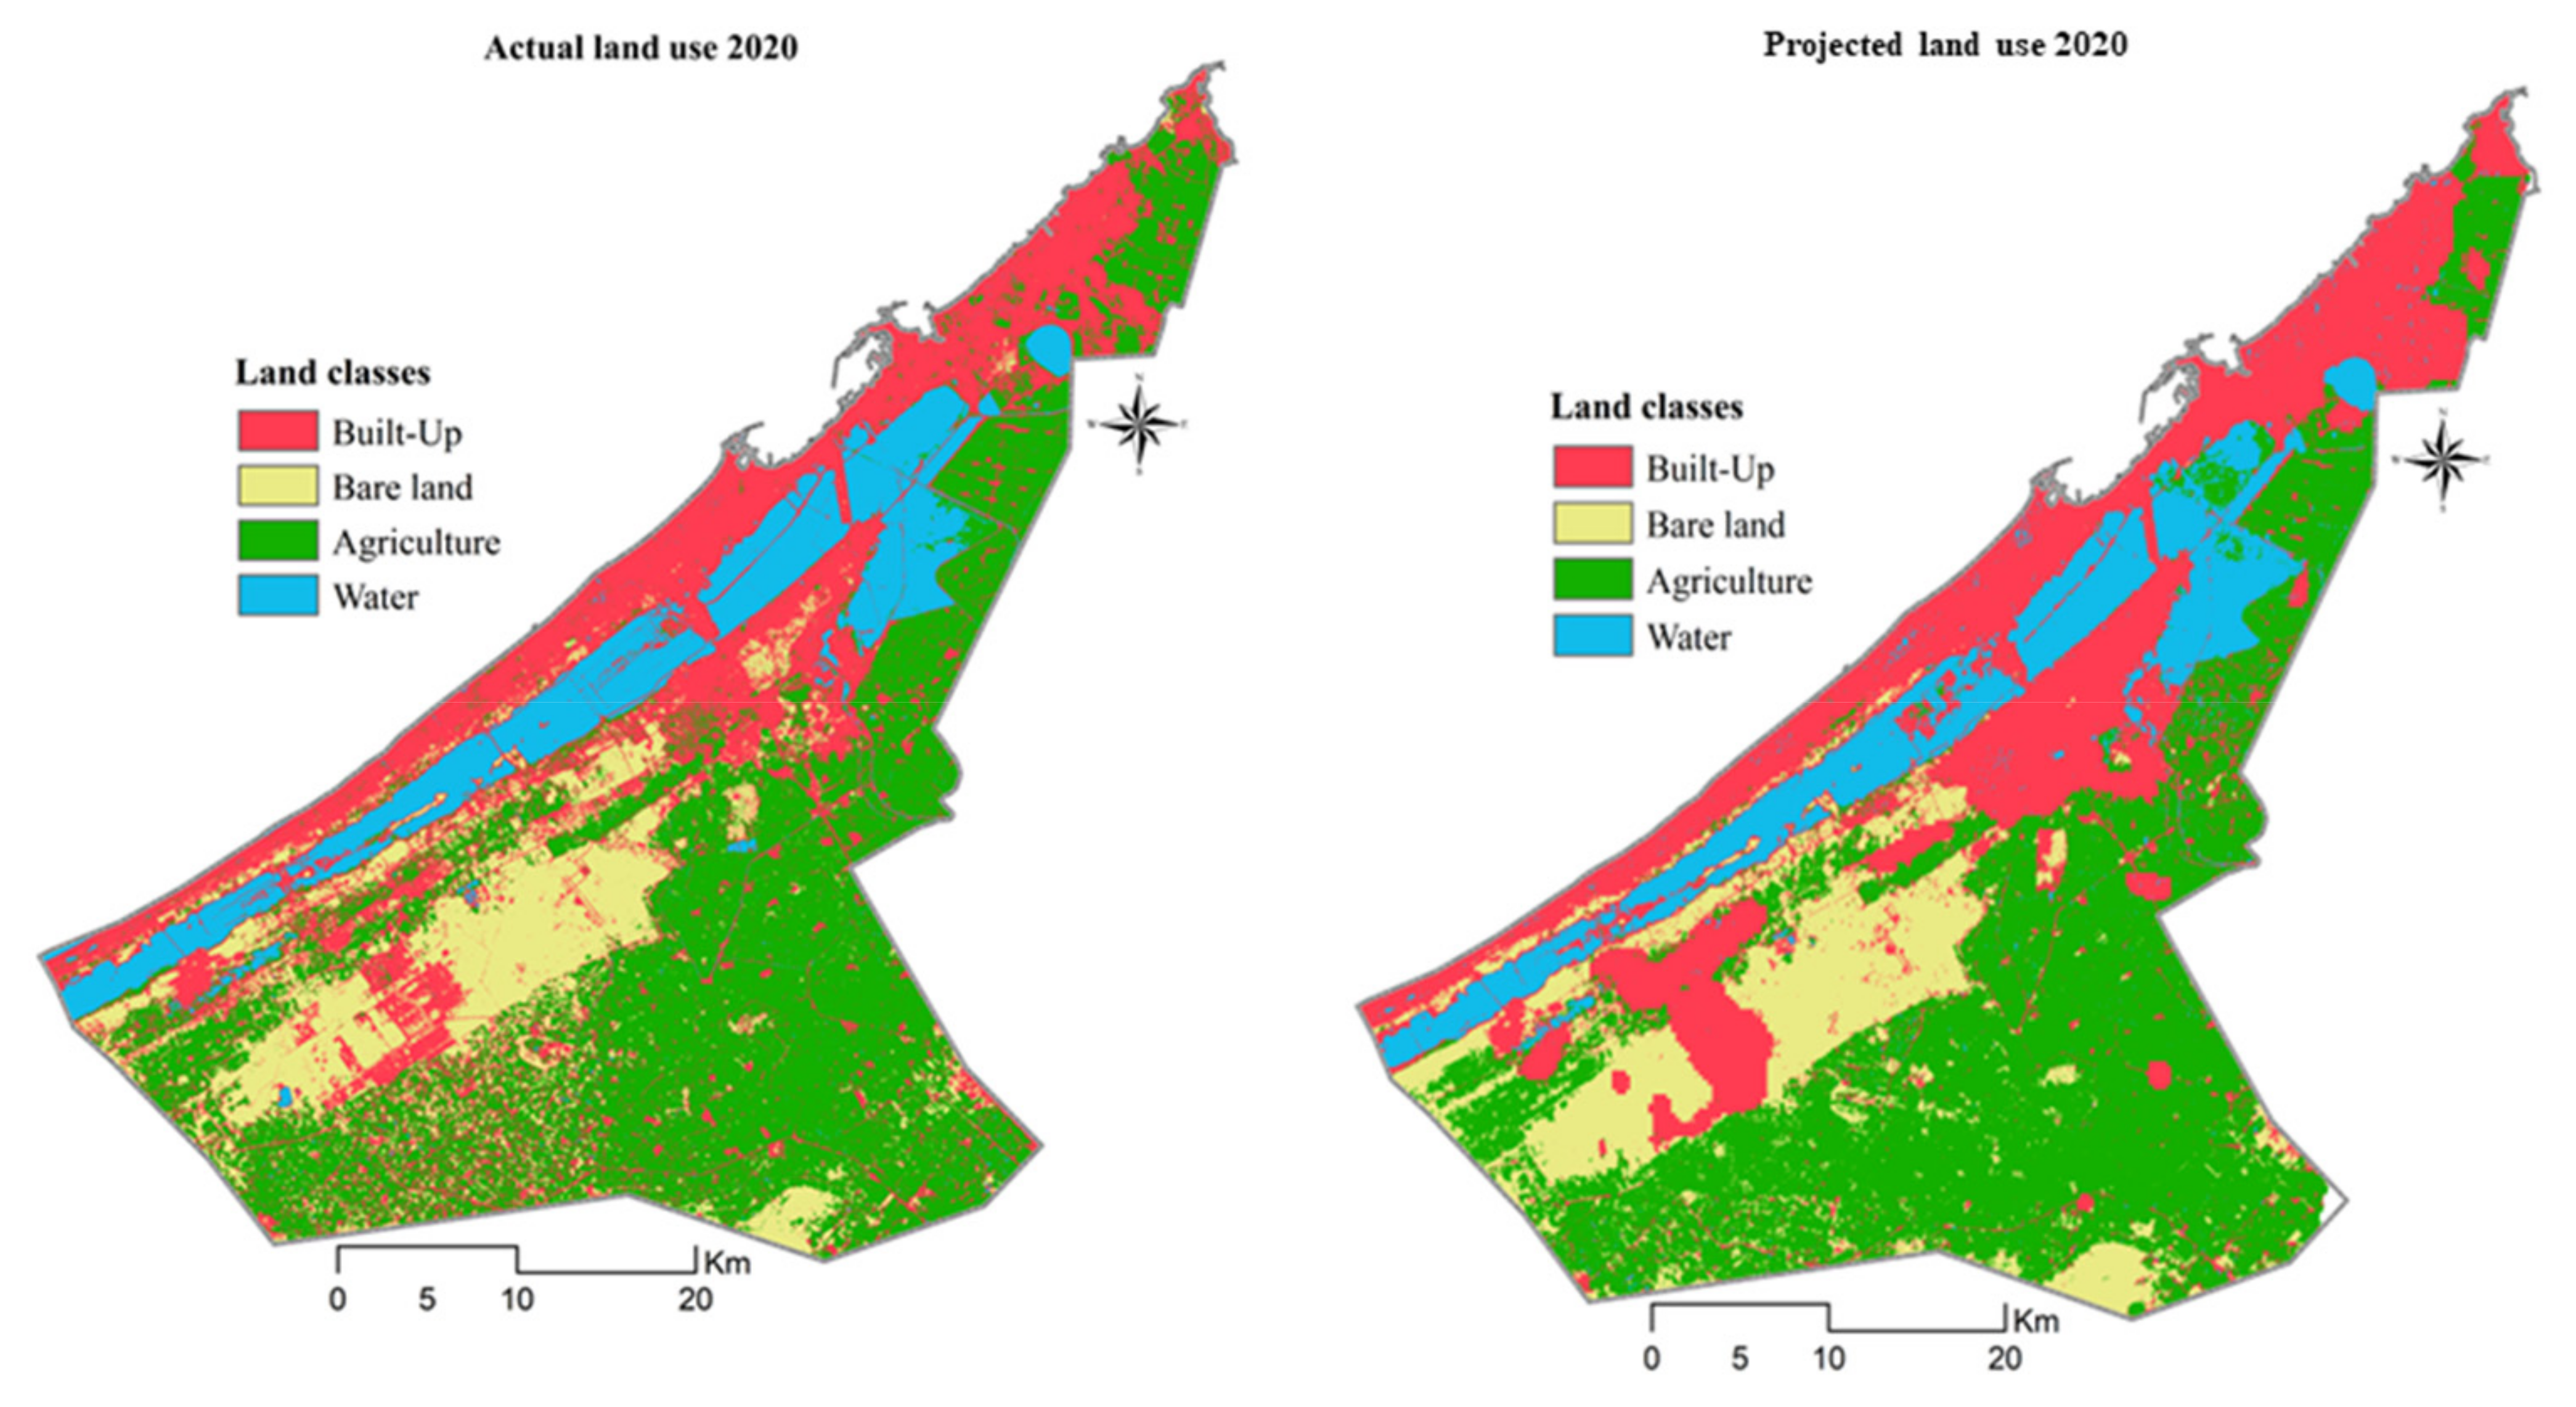
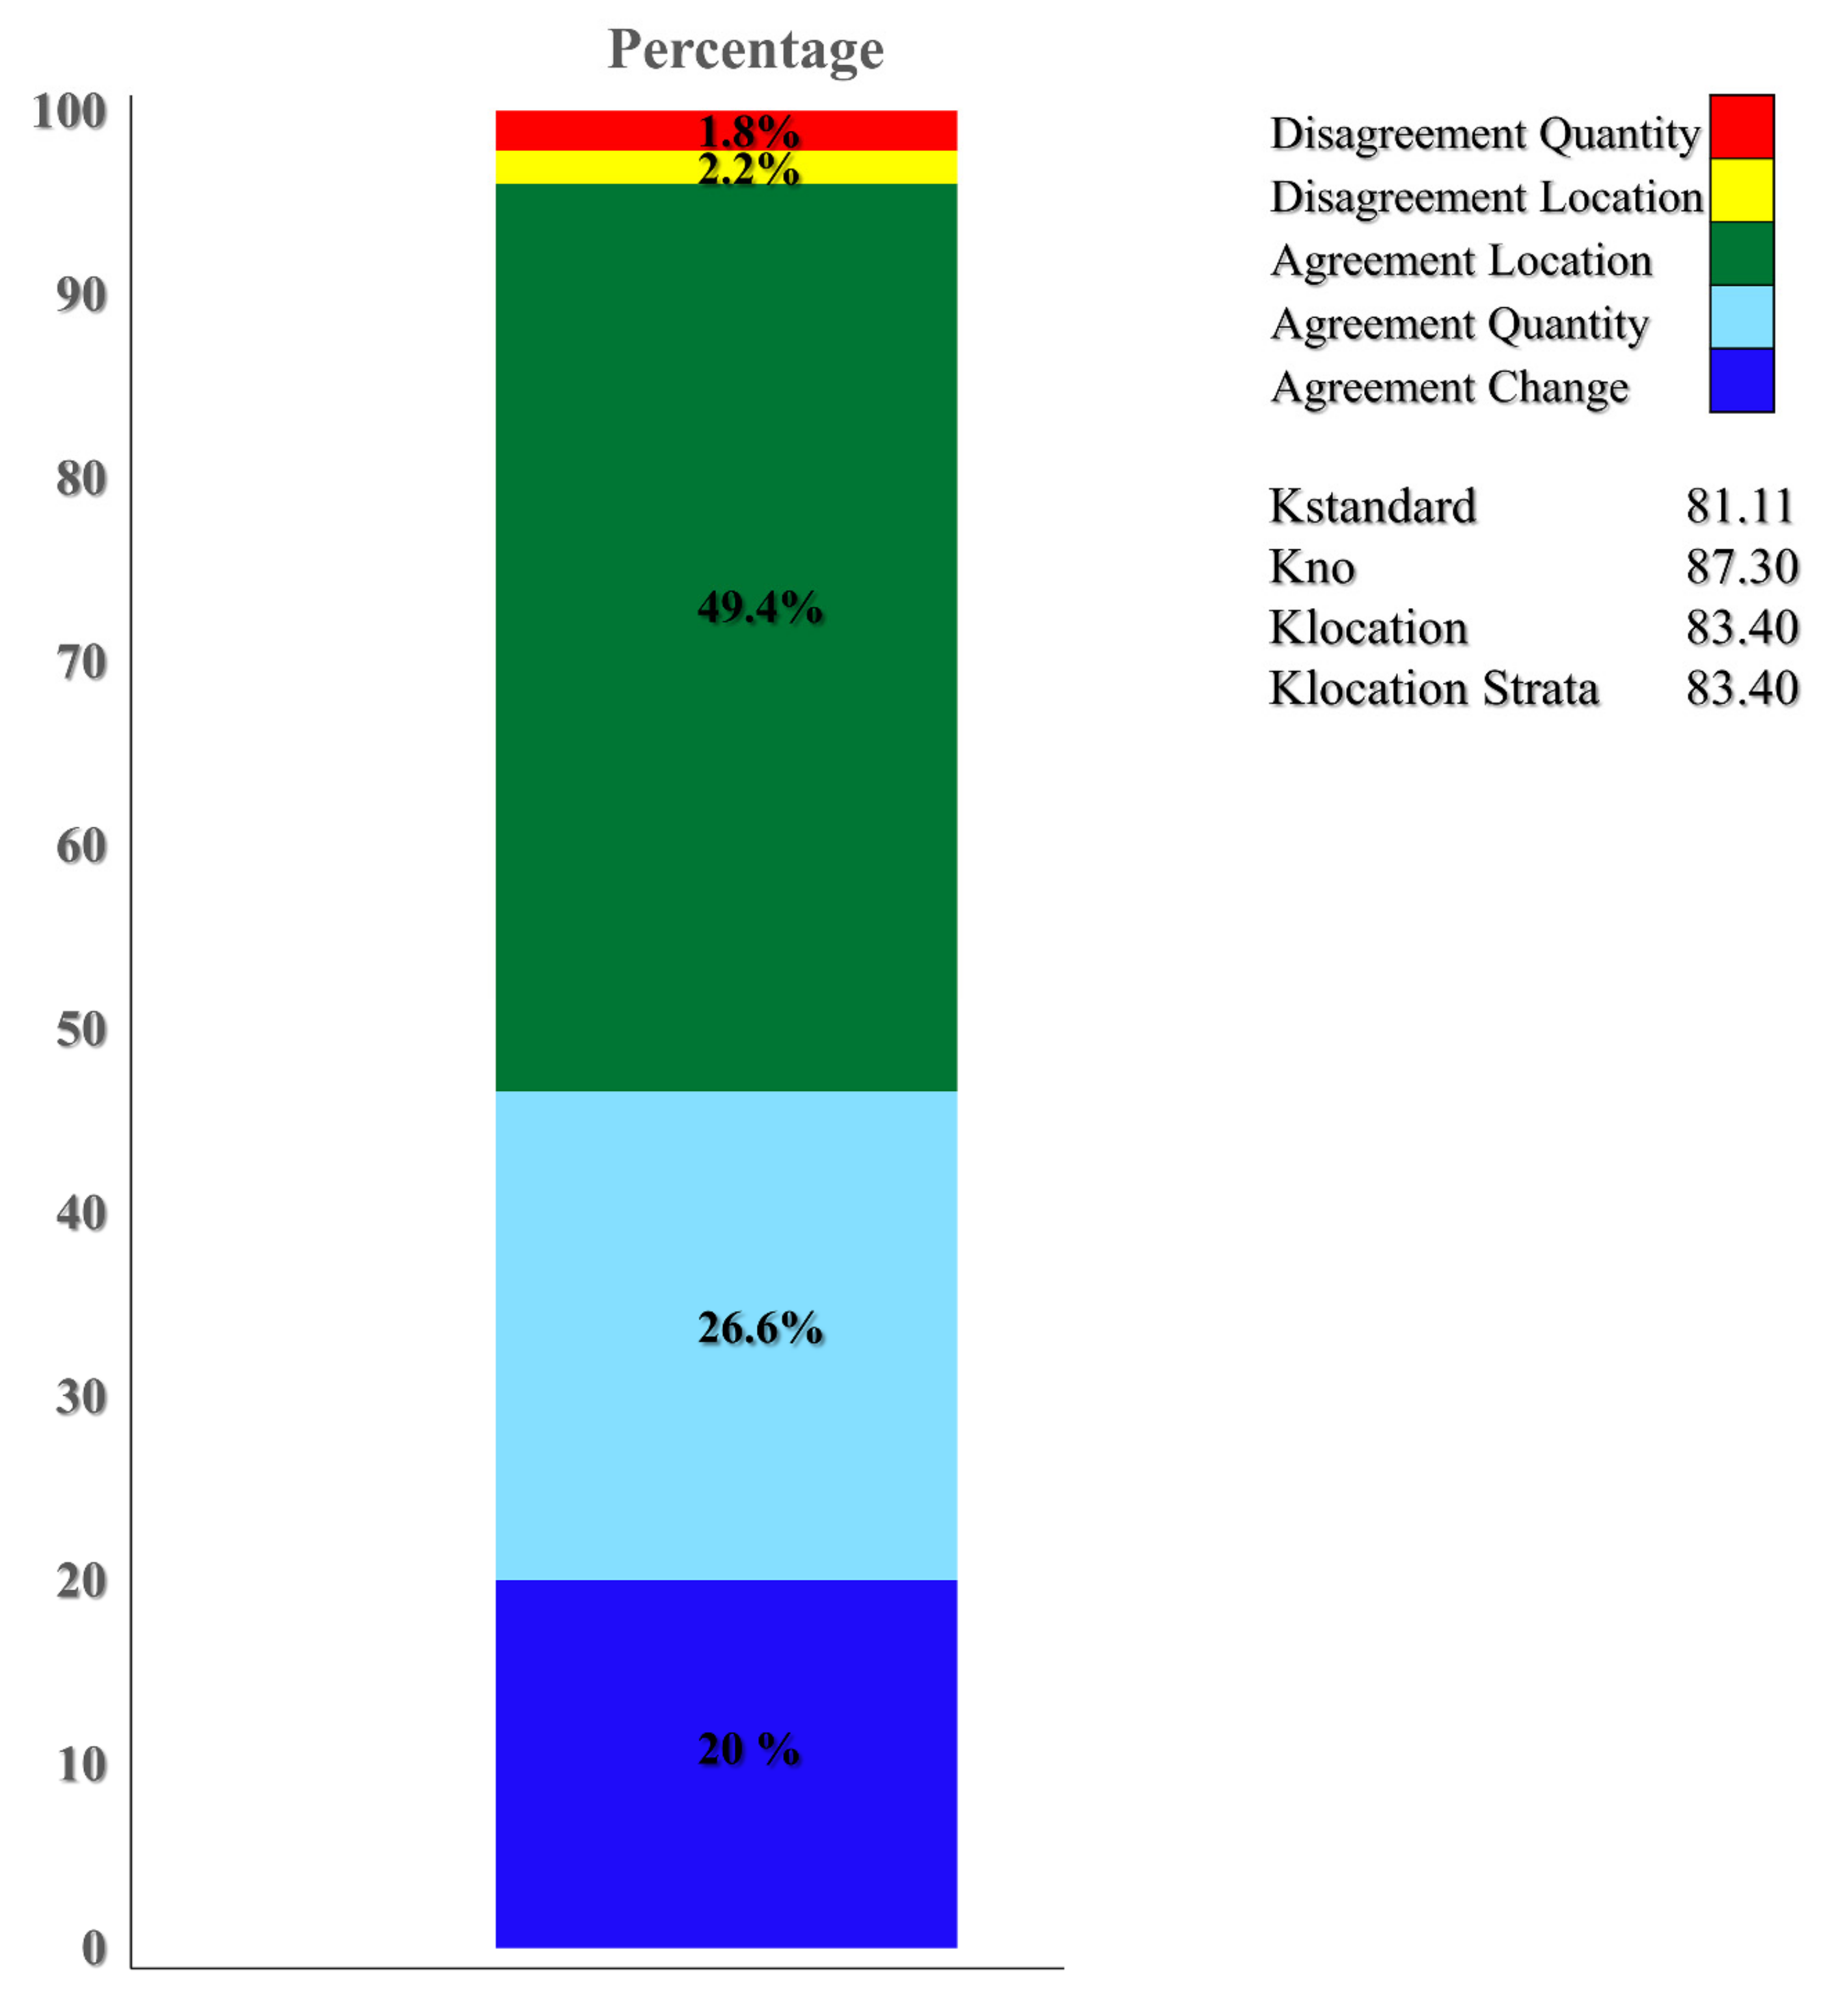
4.1. Model Validation and Accuracy

To assess the predictive capabilities of the model, both the 2020 reference map and the simulated map were compared and assessed. The first map reflects the actual LULC categories, whereas the simulated map was projected by implementing the same procedures that were employed to predict the future of LULC changes in 2030 (Figure 3). A cross tabulation analysis was performed to assess the model accuracy. The output reveals several Kappa indices which examine quantity, agreement, disagreement and pixel allocation such as Kno, Klocation and Kstandard. Overall, a kappa statistic of 0 indicates that the agreement between the actual and simulated maps is due to chance, while a value of 1 means a high level or perfect agreement. In this modelling process, 49.4% of the projected LULC changes were correctly allocated and the agreement quantity was 26.6 of the changes. On the other hand, quality and location disagreement together exhibited only 4% (Figure 4).
Measuring the overall model accuracy, Kno, Kstandard and Klocation were computed and illustrated much higher values. The Kno parameter was 87.30, indicating a very high agreement between the actual and projected maps. Similarly, the value of the Klocation parameter was 83.4 indicating higher accuracy of the LULC category locations. Overall, the outcome of the validation process clearly shows great similarity between the two maps. Therefore, the model was vigorous, has much better performance and is quite accurate in projecting the future scenarios of LULC changes in Alexandria.

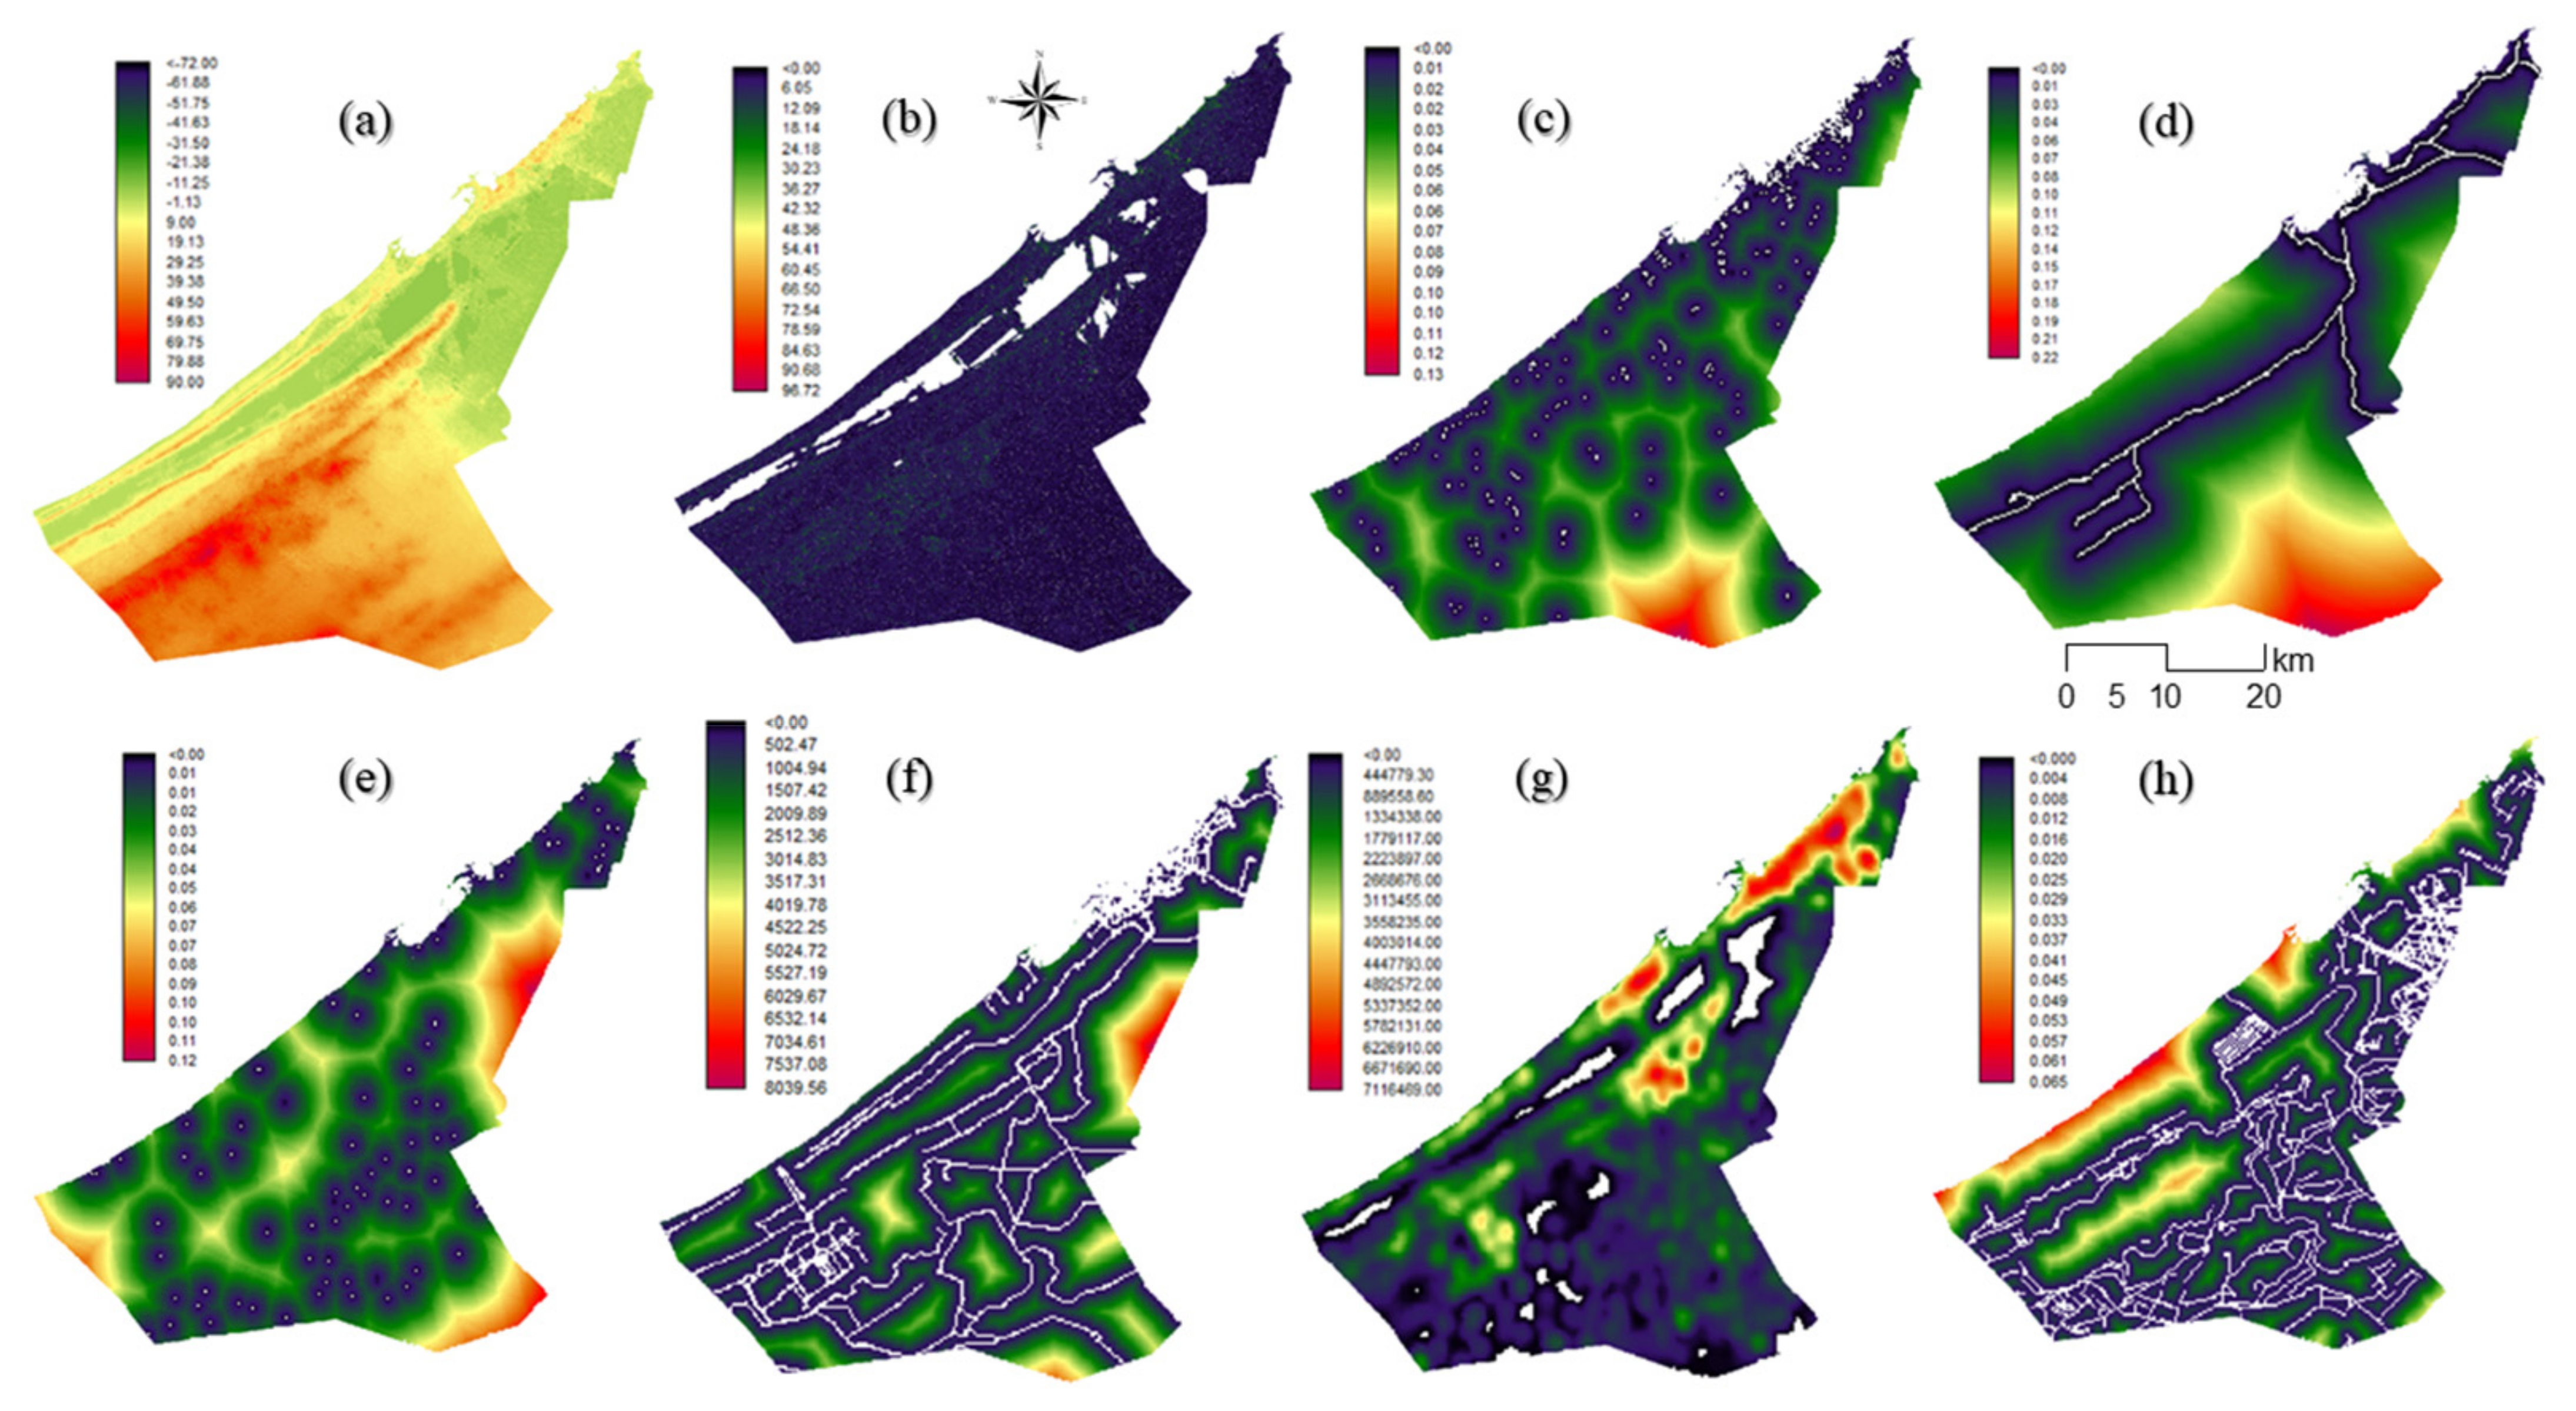
4.2. Driving Forces of Urban Changes

LULC changes can be predominately caused by a variety of socioeconomic and environmental factors. Identifying driving forces that influence LULC dynamics is crucial in understanding and forecasting change patterns and trends. In addition to development processes and governmental intervention and policies, multiple environmental, demographic and socioeconomic factors contribute effectively to land use changes and act directly as driving forces. Figure 5 exhibits the essential driving forces of LULC across the study area. Elevation and slope are physical factors and both are considered as restrictive drivers where flat areas witness a rapid expansion and high density of housing units, while hilly lands and areas with high elevations often are vacant (Figure 5a,b). Further, the steep areas across Alexandria are located in the south and southwest and are characterized by low rates of urban expansion as constructing houses and infrastructure is highly costly.
Distance to public and private facilities (e.g., schools, banks, sport centres, shopping malls and hospitals) is another vital driver that affects urban development (Figure 5c). Short distances to these facilities always indicate a rapid pattern of urbanization. Barren lands near public and private facilities are high in price and value, and thus are favored by households for new home construction. Similarly, in the south, east and southwest of the governorate, the agricultural lands that are located close to these facilities are more likely to be converted into residential zones. That is, the higher the concentration of these facilities, the more they contribute to the quick conversion of bare and agricultural land into new housing clusters and built-up areas.
In Alexandria, urban growth directions and trends are significantly associated with railways and major road networks (Figure 5d,f). The railways in the city are extended in a longitudinal direction from the northeast towards the southwest (Figure 5d). Spatial distance from railways is a key driver influencing urbanization. Thus, through the marginal parts of the governorate, particularly in eastern neighborhoods, the railway line (Abou Qir to City Centre) has significantly accelerated urban expansion through providing populations with better mobility and accessibility. This railway line has reconfigured the economic value of the nearby lands, specifically in the southern direction. This extension has contributed to the growth of some areas such as El Muntazah neighborhood (e.g., Sidi Bishr, Asafra and Mandara neighborhoods), which is now becoming one of the most densely populated areas in Alexandria. In addition, the main roads that link the urban centres of eastern and western Alexandria (the Geesh Road, Abu Qir (also known as the Gamal Abdel Nasser), the Mahmoudia Canal and recently the International Coastal Road) have all stimulated residential and built-up area development.
As an exogenous factor for urban growth, distance from urban centres is an indicator that estimates urban expansion pace. The proximity of vacant and agricultural lands to old residential coastal neighborhoods is an important proxy of urban development in Alexandria. Most of the bare and agricultural land in the northeast and southwest is near core residential areas (Figure 5e). The vacant land near these centres is being rapidly converted into residential and built-up areas; in particular, most of the new public infrastructure (e.g., bridges and water plants) and private facilities (e.g., private international schools and hospitals) are constructed within these land parcels.
Population concentration and density is an essential driver of urban growth in Alexandria where vacant and agricultural lands that are near the highly populated areas are exposed to rapid shift into residential zones. Figure 5g illustrates the spatial distribution of the population aged 14–29 as a group of marriage age and persons often seeking to buy or rent a housing unit. Neighborhoods with high shares of youth and young people in the age of marriage such as El Muntazah in the east and Mina El-Basel in the west tend to show a high rate of urban expansion over bare and agricultural lands.
Water canals are a major factor affecting urbanization where populations prefer to construct their houses along canal banks and near sources of irrigation water as well as other economic activities such as agriculture, trade and fishing. Figure 5h shows the distribution of water canals over the study area. It is obvious that a high concentration of canals is found in the south and southeast where large areas of agricultural lands and a high number of villages are located.

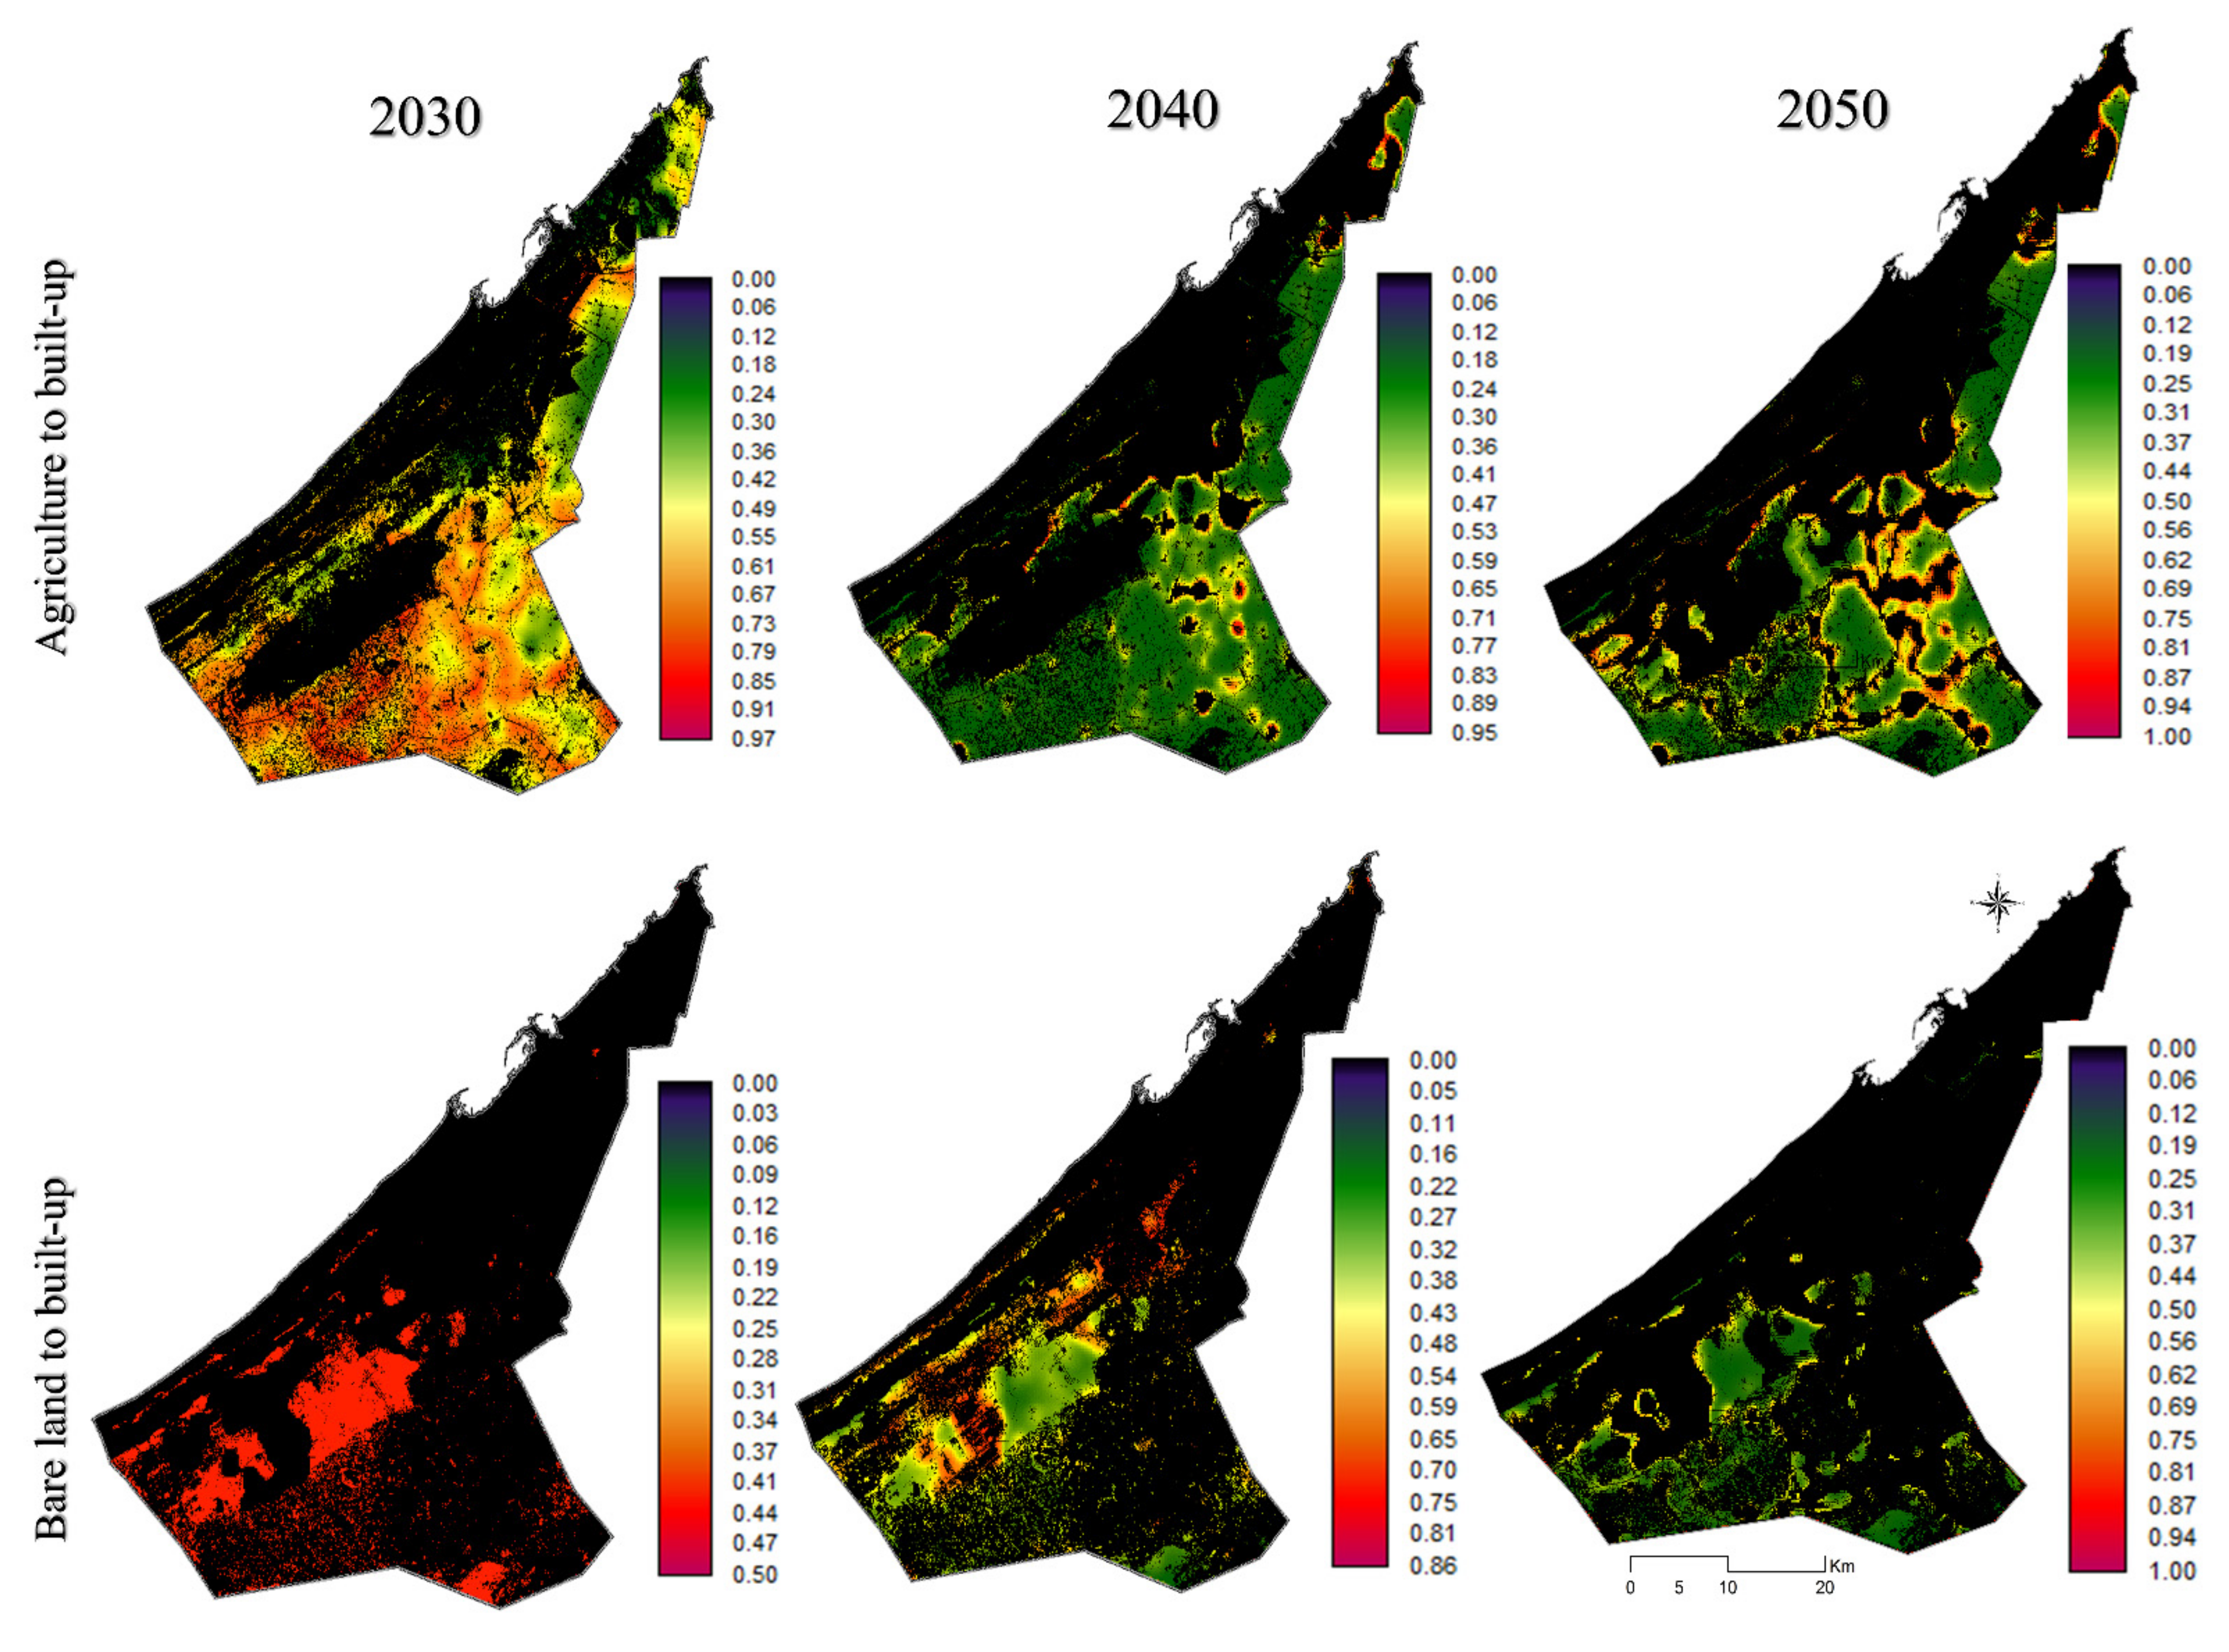
4.3. Simulation of Potential Transition Changes

Two transition probability maps, including vacant land and agricultural land, were mainly generated to quantify land transformation into urban and built-up areas. The transition layers were generated through the implementation of MLP, which is a robust neural network-based technique due to its capacity to produce multiple transitions (up to 9) at once. Consequently, any driving force was specifically selected if it was significantly influential on the overall model accuracy and skill measure.
The outcome of the MLP performance showed a high value of 95.9%, which is much larger than the cut off percentage of 80% suggested by Sangermano and Eastman (2010), demonstrating excellent model accuracy (Table 3). Similarly, assessing the skill measure statistic (a value of −1 denotes no skill while a value of +1 indicates perfect forecasting) indicates that the model has significantly performed well. The high skill measure value of 0.92 (91.8%) signifies an accurate simulation of urban dynamics and affirms an appropriate selection of driving forces of urban expansion in Alexandria.
Table 4 presents the results of testing the transition from bare land to built-up area and forcing a single independent variable to be constant. The outcome shows that the most influential driving force on potential transition from bare land to urban was elevation while the least influential was distance to water canals. This pattern of influence can be interpreted as the steepest and hilly vacant lands being characterized by low suitability while flat lands are highly suitable for constructing new houses and settlements. On the other hand, water canals are located mainly outside of the major urban centers and far from the populous areas.
As the skill performance of the MLP model increases by eliminating a chosen one driving force each time, the backward stepwise technique was adopted and the findings (Table 5) reveal that the selected eight driving forces were the best combination and, thus, these variables can be used to forecast LULC changes.
The transition maps of potential areas and the likelihoods of urban transformation are illustrated in Figure 6. Projecting land use dynamics of year 2030, the potential transition map indicated that high probability of agricultural land conversion into residential area appeared substantially in the eastern part of Alexandria, particularly in the area of El-Muntazah. In contrast, low probabilities of transformation were found specifically in the central east of the governorate. The transition map of bare land showed that the probability of transformation varies markedly across the study area. For example, lands that are located in the southwest will most likely be transformed into residential zones while low probabilities appeared substantially in other parts of the governorate. Noticeably, most areas located in the southwest are characterized as sandy vacant land and open space areas and the probability of land transforming into built-up areas is particularly high especially in Al-Amreia and Burg Al-Arab (see Figure 1). The potential transition of LULC change in 2040 exhibits isolated patches of agricultural lands with high probability of transformation into urban areas. These places are located especially in the southeast and far east. The potential likelihood of bare land conversion into built-up areas was also high in the central parts of Al-Amreia and Burg Al-Arab neighborhoods. In 2050, the probability of agricultural land conversion into urban areas appeared to be mainly located and spread towards the southeast direction. In addition to these changes and during the modelled period of 2050, the bare land to built-up area will remain active. Nevertheless, the matrix of probabilities of transition illustrates some changes that might be less expanded in this period compared to 2030 and 2040. This is the case with the probability of bare land conversion into urban areas which is observed specifically in the central and north south.

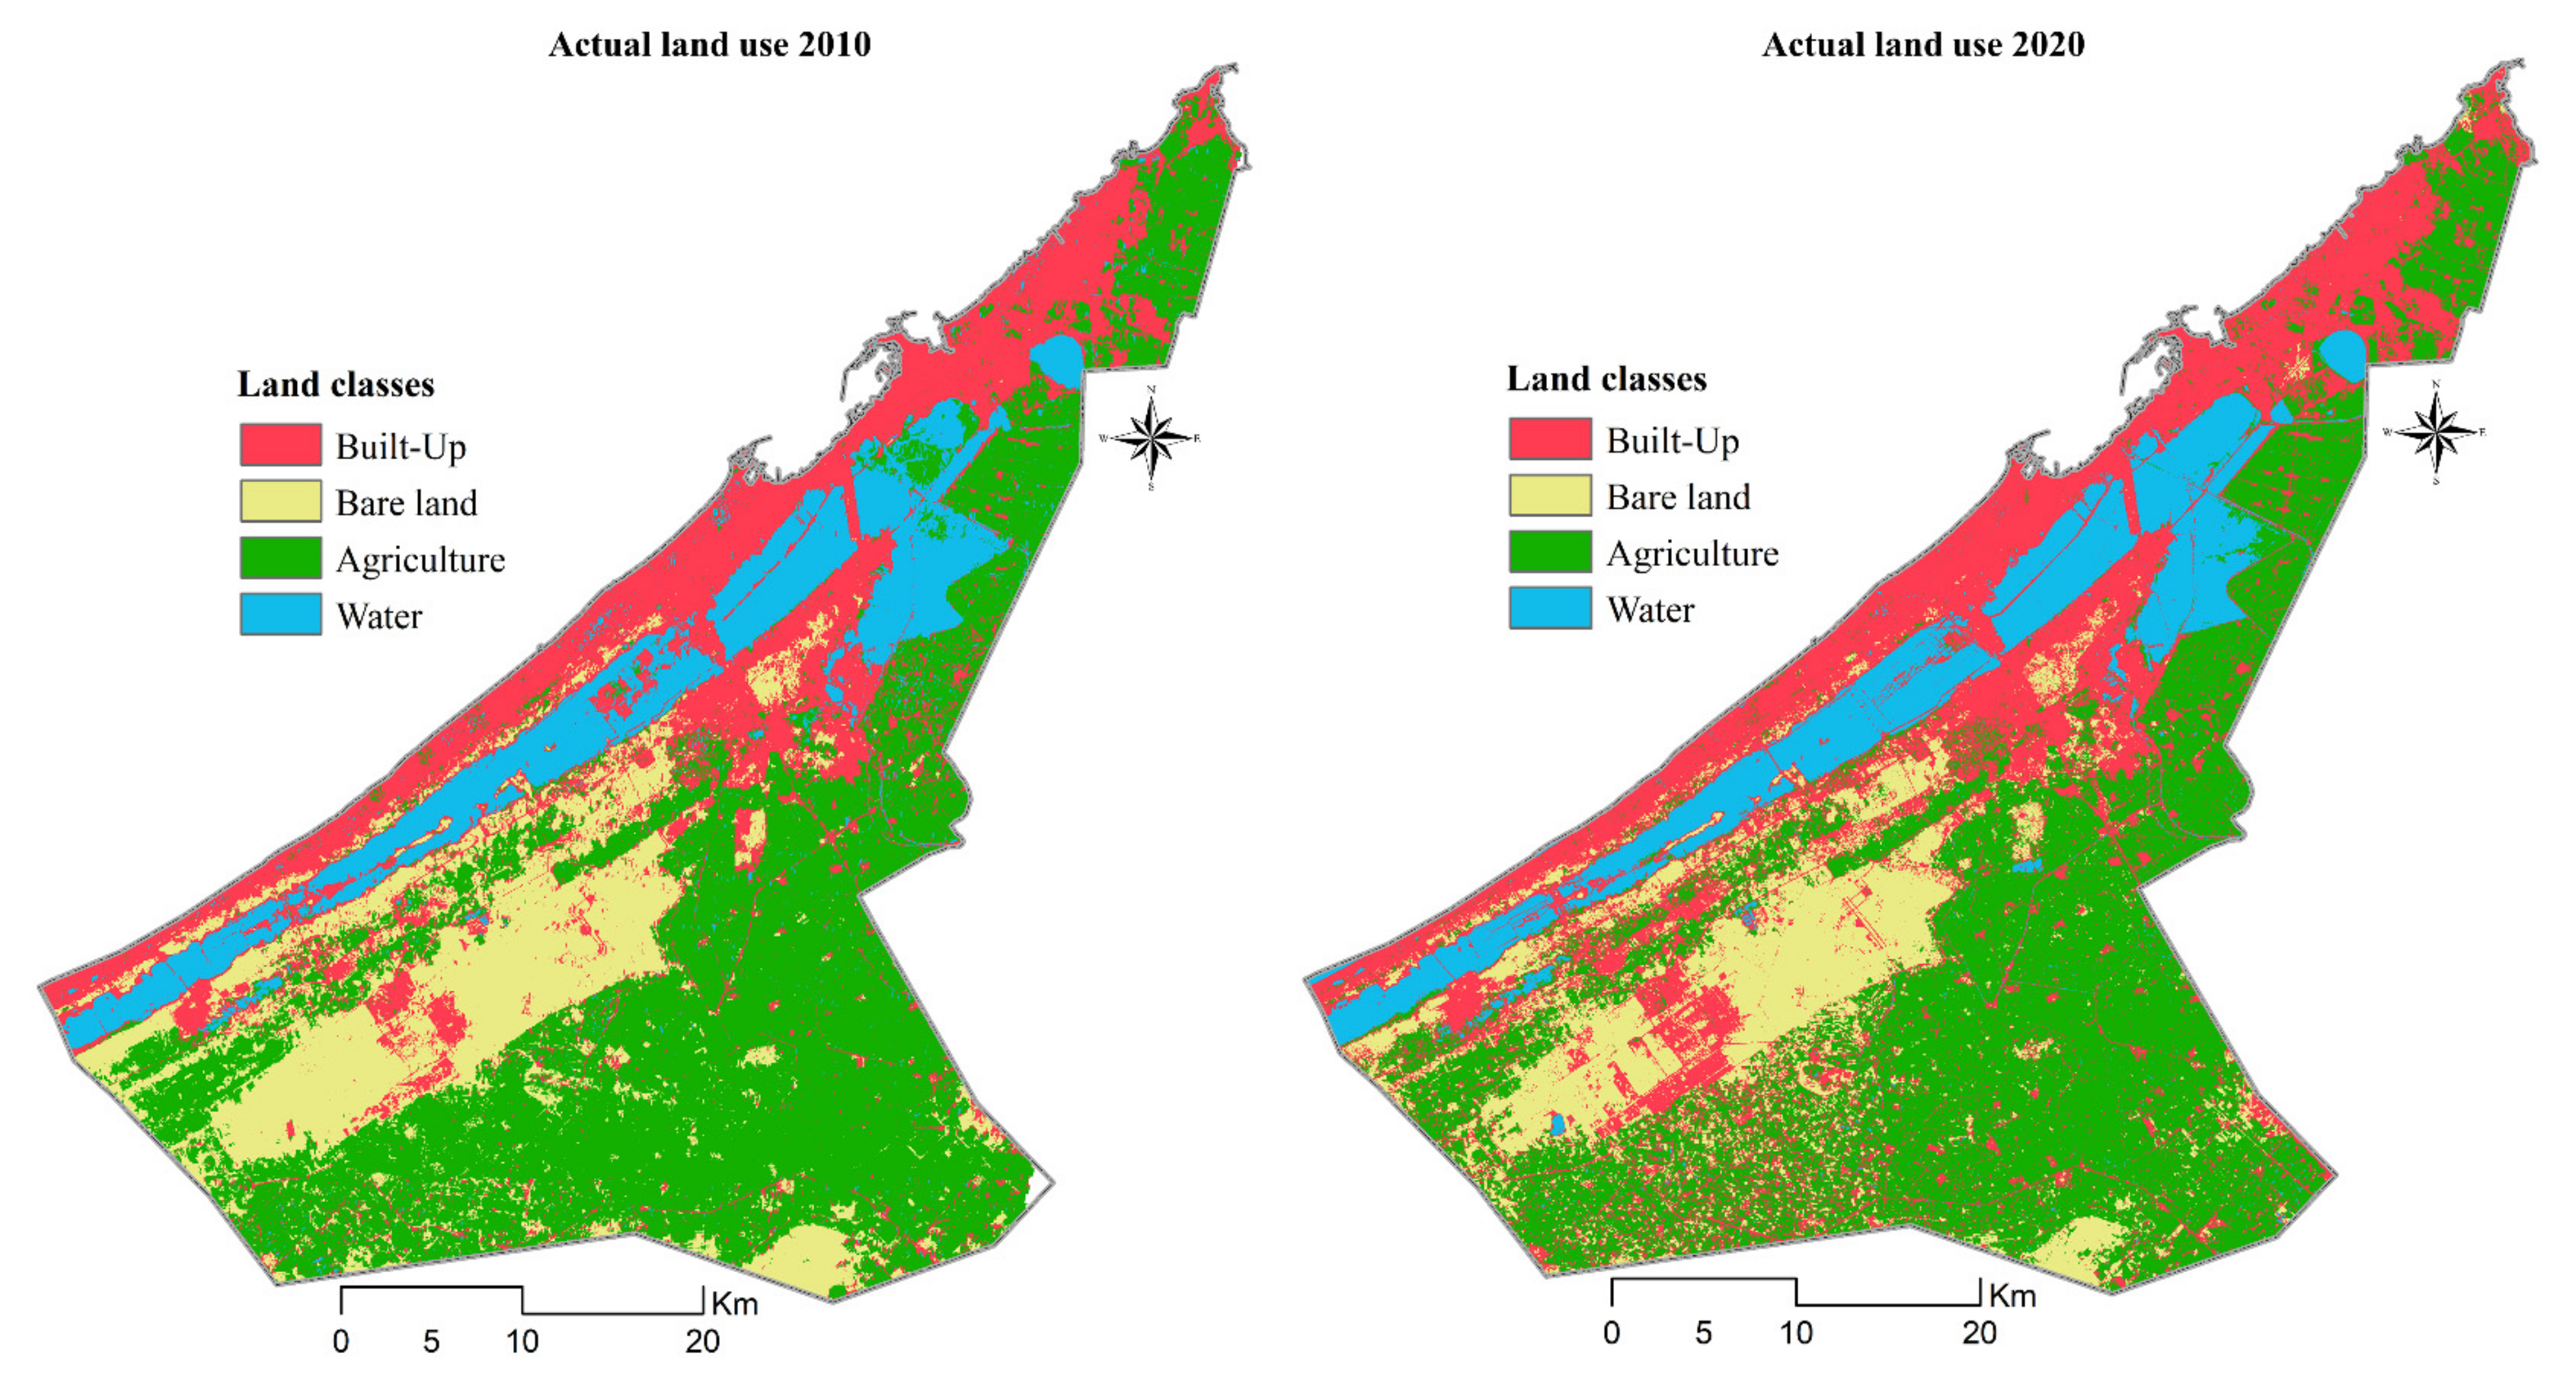
4.4. Observed LULC Changes

Over one decade (2010–2020) and with the pressures of population growth and local demand for housing units, Alexandria Governorate witnessed a significant change from agricultural and bare lands into residential zones (Figure 7). The distribution pattern of LULC changes during this period occurred specifically over the agricultural lands where large areas were transformed into housing units. The urban expansion had taken place in the northeastern part with recognized trends in the eastern section of El-Muntazah. Similarly, the urban expansion concentrated predominately near the central part of Mariout Lake and towards the eastern direction. Table 6 lists the calculated changes for all the observed LULC categories between 2010 and 2020. The agricultural land lost the largest area (7440.39 ha), while there was a decline in the bare land of 4904.91 ha (19.7% of total change). In contrast, the urban area exhibited a massive increase where an area of 12,477.5 ha was added to the built-up area in 2020. Overall, the spatial distribution of the historical LULC changes revealed a rapid urban expansion from the coastal area in the north and west towards the agricultural land in the south and east. Likewise, a recognized pattern of growth was observed from the west to the east and from the north toward the southeast, particularly in Al-Amreia and Burg Al-Arab. Nevertheless, the depleting trend of agricultural and bare lands varies from place to place across the governorate. For instance, rapid expansion and high rates of land transformation into built-up area occurred in the far north and northeast and across El-Muntazah, while the urban growth rate was less in the southwest.

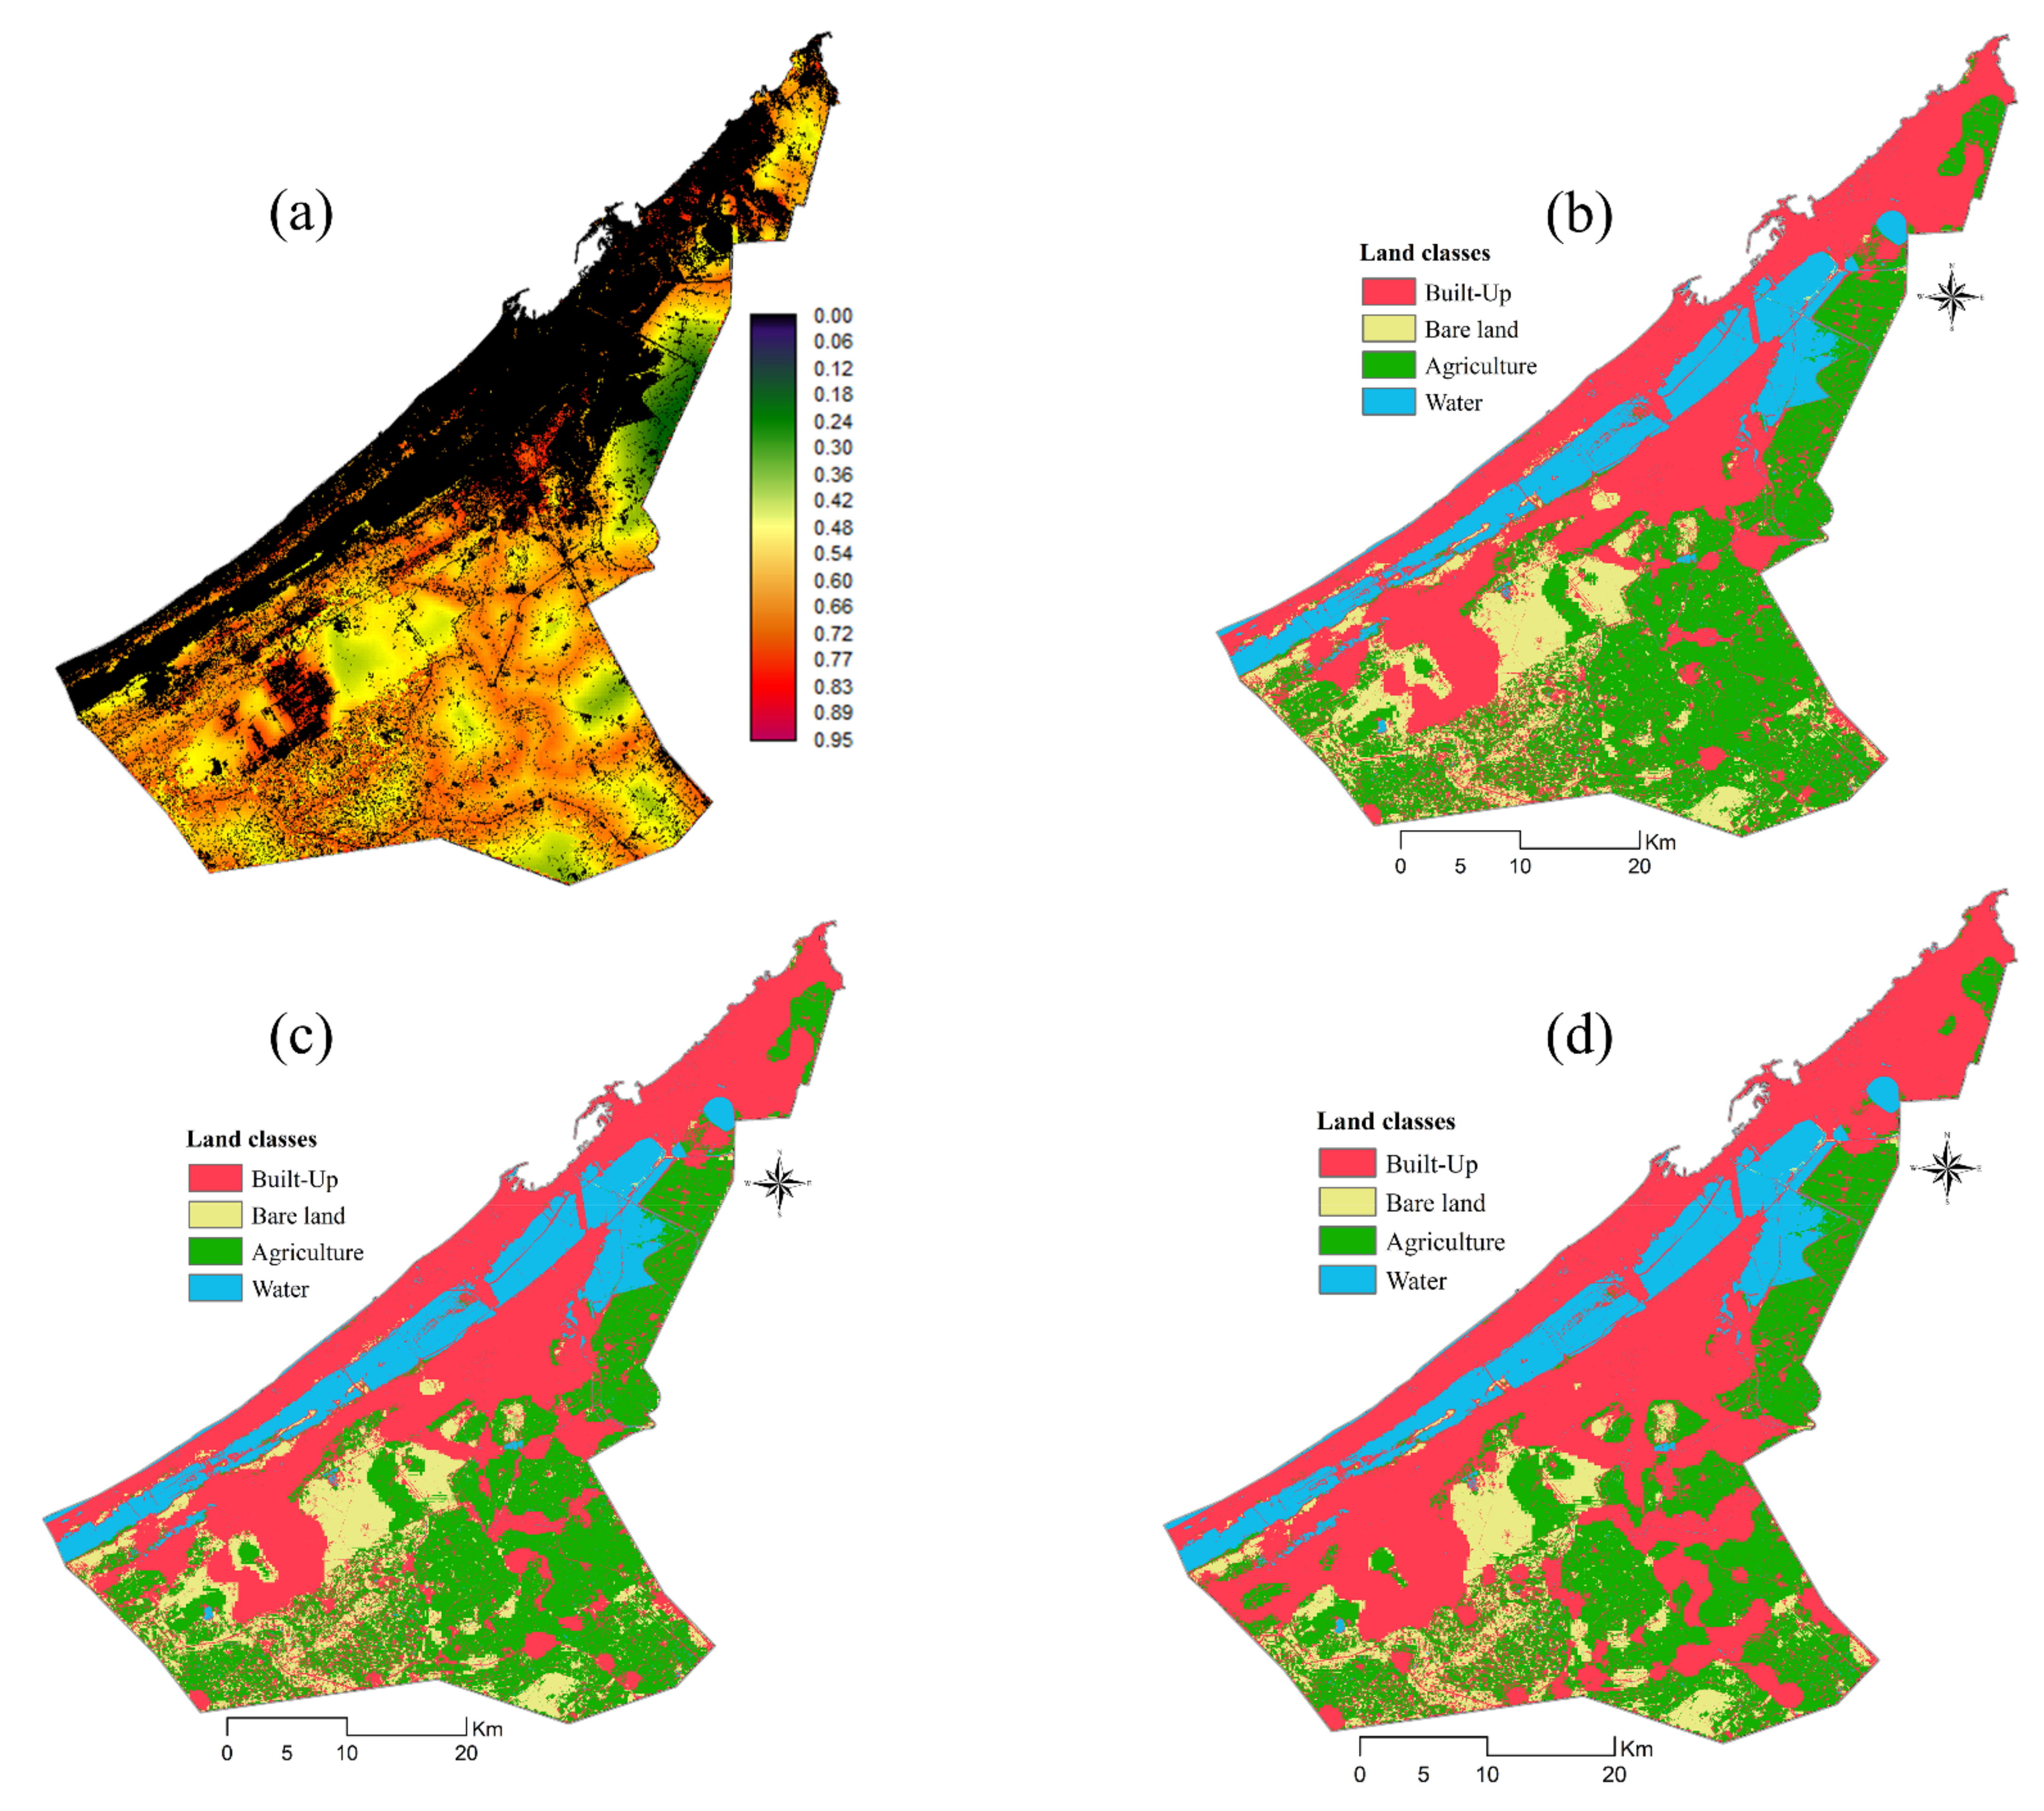
4.5. Spatial Forecasting of LULC Changes

In accordance with the computed transitional matrices using satellite images of 2010 and 2020, urban dynamics and LULC changes were projected for the coming three decades (2030, 2040, 2050). Figure 8 exhibits potential striking negative changes for the agricultural lands, which essentially indicates a higher rate of loss, accounting for 50% of the total change in all land categories. This is more likely and is due to the rapid urban development and population increase; agricultural land will continue its decreasing trend and lose nearly 11,023 ha by 2030 (Table 7). Correspondingly, Alexandria will experience a pronounced decline in bare land, which is likely to be the spatial context of governmental and national urban planning of new residential neighborhoods. Thus, bare land will exhibit a sharp decrease from 26,644 ha in 2020 to 21,200 ha in 2030, losing almost 5444 hectares particularly in the south and southwest areas. In contrast, the built-up area will continue to expand where a large area of 16,467 ha is expected to be transformed into built-up areas (Figure 8a,b).
In the second forecasted period of time (2030–2040), the same trends of growth and expansion will continue where residential and urban areas expand while the extent of agricultural and barren lands largely decreases. Large areas (10,439 ha) of agricultural lands are expected to be converted into residential zones and at the same rate of change (50%) as the previous period (2020–2030). The estimated urbanization pattern is expected to cover about 81,983 ha, demonstrating an increase of approximately 10,439 ha in only one decade (between 2030 and 2040) (Figure 8c). Moreover, the bare land is expected to contribute about 3152 ha to the total increase in built-up area, which reflects a comprehensive loss of fertile land, green cover and open spaces due to expansion of urban settlements. The projected map for 2040–2050 demonstrates a significant increase in built-up areas, which proves that residential zones are expected to be the dominant LULC (91,074.7 ha), while massive areas of agricultural lands (6257 ha), bare soils and sandy lands (2835 ha) primarily will be converted into residential and housing units (Figure 8d). Such a constantly intensive increase in built-up area will add millions of urban dwellers which indisputably underscores the spatial association with the pronounced driving forces of natural population increase, rural–urban migration, and the ongoing development across the study area.
The map of soft prediction output indicates the spatial distribution of intensified vulnerable agricultural and barren lands to significant urbanization (Figure 8a). Overall, the major projected urbanization trends concentrate in three areas: First, in the northeast part where urban expansion follows an outer longitudinal trend from northwest to southeast. Indeed, in this area, urban settlements expand while agricultural lands sharply decline. Second, a considerable increase of housing clusters and residential patches is likely to spread over the lands that are located in the southeast direction from the central part of Mariout Lake. Noticeably, this pattern of urban growth is predominantly linked to the underlying construction of a new road network. Third, while the urban expansion towards the east and southeast directions occurs rapidly horizontally in all places that are located in the east and south of Mariout Lake, a vertical urban growth pattern takes place along the coastal neighborhoods associated with the renewing of old buildings.

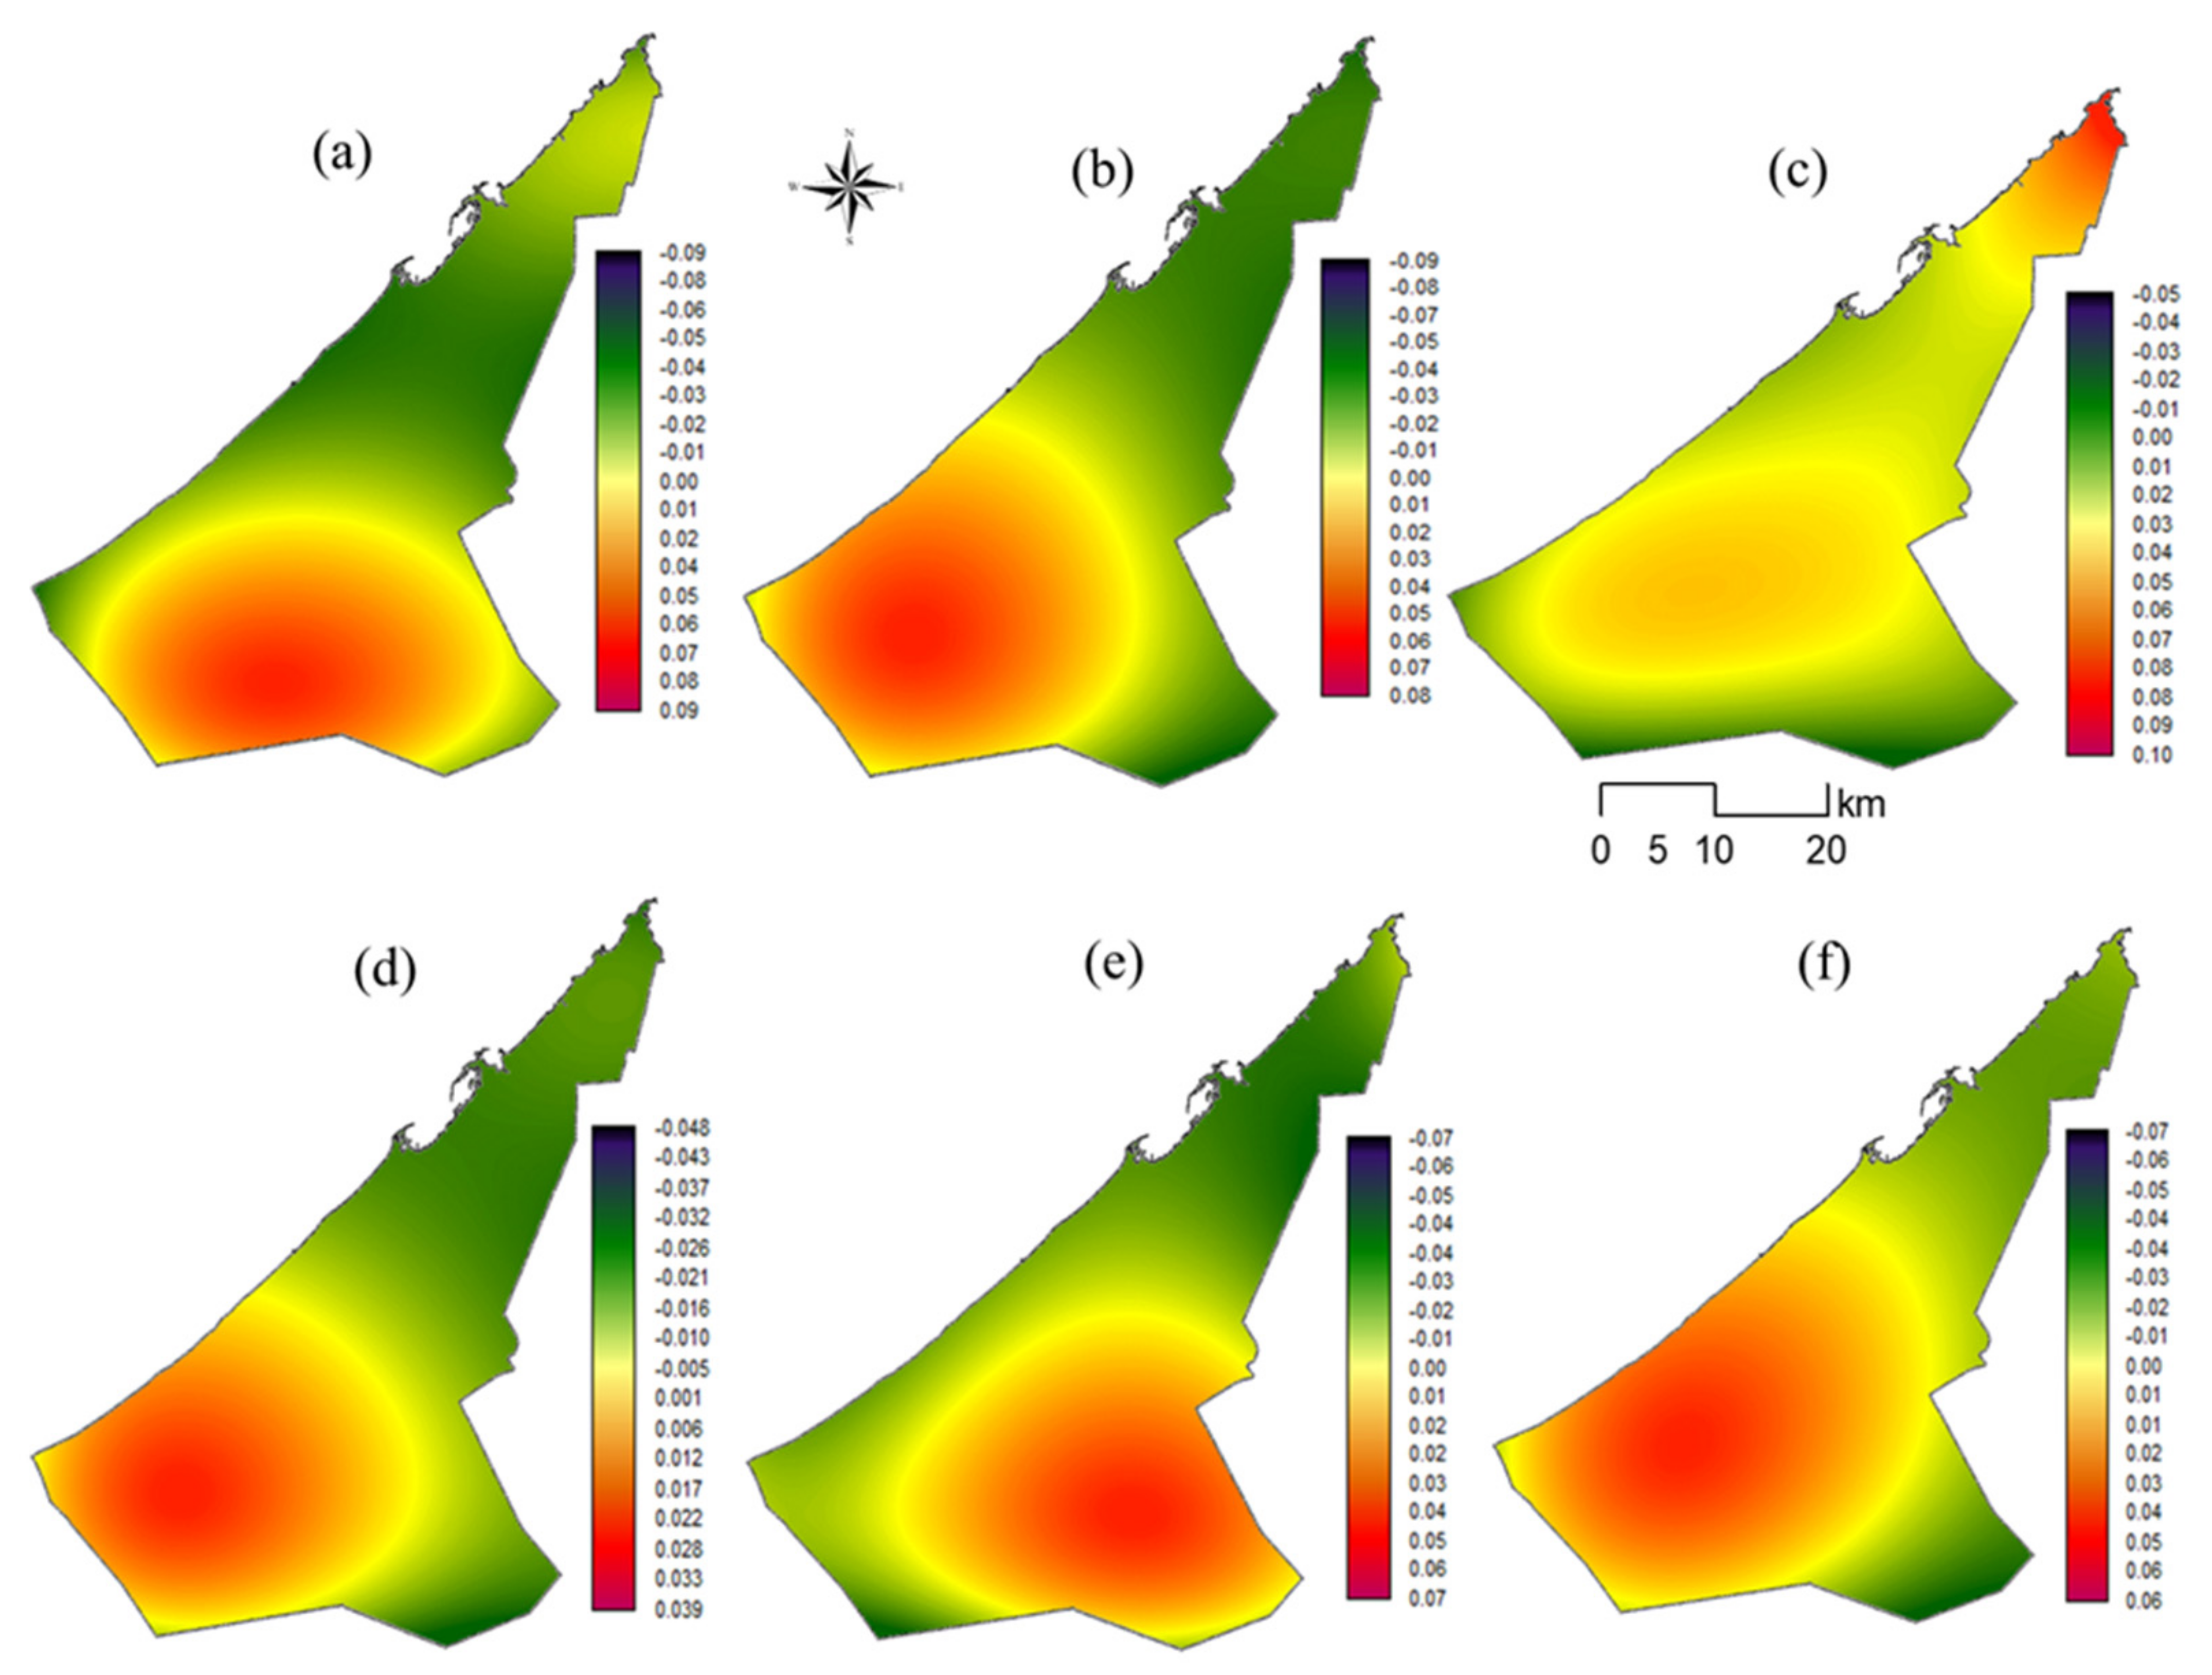
4.6. Spatial Trends of LULC Changes

Exploring the spatiotemporal change dynamics, trends and orientations of the predicted LULC changes, Figure 9a demonstrates gradually increased urban expansion in 2030 over agricultural lands from the far south outwards. This dispersed pattern of residential patches indicates a spatial tendency and high concentrations of the projected newly built-up areas located near and surrounding the Amreia neighborhood. During the same period, the transformation of barren land into built-up area is likely to occur in the far southwest where sandy soils and desert land are dominant (Figure 9b). In the second period (2030–2040), the direction of the estimated urban expansion over green areas appears to be concentrated in the central eastern part near Mariout Lake and the outer part (Figure 9c). However, the transformation intensity and concentration are likely to be less compared to the previous period. Additionally, the lowest intensity of this transformation pattern is expected to be in the neighborhoods located in the northeast and northwest (e.g., El-Muntazah).
The contribution of desert land to urban expansion in this period of time is expected to be relatively concentrated in the southwest direction and the major loss of vacant land will be around core settlements within Borg-Al-Arab and Al-Amriea neighborhoods (Figure 9d). In 2050, the built-up areas are expected to expand more over agricultural land and towards the southeast direction, while bare lands are likely to contribute largely to urban sprawl and expansion towards the southwest Figure 9e,f. Notably, during the next three decades, these places are initially expected to witness the highest rates of urban expansion and sprawl as well as planned residential settlements through governmental polices.

5. Discussion

Despite the fact that urban areas are accelerating globally, impacted by various sociodemographic and environmental factors, urbanization in coastal areas of developing countries has specific shape, trends and structure. Even though the urban population is projected to continue increasing, most of this expansion will occur in developing countries triggering several significant societal and environmental ramifications. One of the key goals of this study was substantially to address, simulate and forecast urban growth patterns across the coastal governorate of Alexandria. Spatial driving forces in the context of topographical, socioeconomic and environmental factors were generated and integrated with remotely sensed classified images to project coastal urban dynamics. Methodologically, the ANN-MLP model within the advanced GIS environment was implemented to forecast urban growth patterns and trends up to 2050 across the study area. To assess the reliability of the predicted outcomes, the model was validated utilizing cross-tabulation and kappa statistics. The indices revealed quite satisfactory accuracy and fair agreement between the reference and simulated 2020 maps.
Overall, the findings clearly indicate that, during the upcoming three decades, Alexandria will experience rapid urban growth initially due to population-induced increase and internal migration pressures. Focusing on the historical (2010–2020) dynamics, significant LULC changes were observed from the city centre outwards to the east and southeast directions. Consequently, it is likely that over these longitudinal trends and directions built-up areas will continue to expand over agricultural and barren lands.
Incorporating several driving forces, the model successfully projected the LULC changes up to 2050; throughout that period the topographical variables were identified as the most influential driving forces. That is, flat and less steep lands are likely to largely diminish, contributing to residential, infrastructure and housing expansions. The shrinking of agricultural land area is expected to be the key pattern which shapes urbanization in Alexandria, particularly in the northeast, south and southwest. This prominent pattern can be specifically attributed to land availability and proximity to the old core urban centres. The increase rate of urbanization and the agricultural land conversion are significantly associated with natural increase in population as well as rural–urban migration. In addition, this expansion is associated with infrastructure development, specifically the construction of new private and public infrastructure and facilities such as major roads, banks, international schools, institutions, companies and warehouses.
The simulation results indicated a substantial increase in built-up area over bare and agricultural lands where each category is expected to contribute largely to urbanization during the next three decades, losing approximately 11,430 and 24,566 ha, respectively. However, rates of urban growth vary across neighborhoods of Alexandria due to several spatial driving forces, particularly bare land availability and attractiveness as well as governmental regulation of housing construction over agricultural lands. The dynamism of Alexandria, as a major harbor city, provides social mobility, attractive livelihood activities and economic opportunities that undoubtedly are not found in the surrounding rural areas [50,51]. Accordingly, there is tremendous pressure—and this pressure will continue—on vacant land availability, generating rapid and unprecedented urbanization rates over agricultural lands, particularly across coastal neighborhoods.
Similar to other coastal cities and places in developing countries [4,5,6], the rapid expansion of urban residential areas in Alexandria is associated predominantly with the lack of proper hinterlands, limited public spaces and demographic pressures. Indeed, urban growth in Alexandria is spatially shaped by socioeconomic and social class structure factors. Hence, housing type and affordability are significant indicators that imitate the distribution patterns of land prices and residential expansion. That is, the elite and upper income class populations are located along the coastlines and near the city centre. Within these central and coastal neighborhoods (e.g., Sidi Gaber, Bab Sharqi and Al-Attrain), residents have easy spatial access to public facilities and urban amenities. However, the prices and demand on vacant lands are both high, while the supply and land availability are limited. Therefore, urban growth is characterized by vertical expansion, causing various negative impacts, particularly traffic congestion, air pollution, housing overcrowding and ventilation obstacles. On the other hand, urban households of low incomes usually live in the marginal areas as houses were constructed on barren or agricultural lands and thus cheaper accommodation is available.
The urban growth across Alexandria is also influenced by natural topographical barriers, particularly Mariout Lake, which stretches from the northwest to the southeast in four major parts (Figure 1). The lake is considered a key natural barrier to urban expansion, specifically from the northwest towards the east and south. Subsequently, horizontal urban growth in most coastal neighborhoods is restricted by the locations of the lake water bodies and salt marches. On the other hand, and from the lake towards the east and southwest, urban sprawl is a dominant pattern, where converting agricultural land into residential and built-up areas is a low cost and preferable option. The forecasted urban sprawl patterns over the east and southeast directions can be mainly attributed to the unbalance between population increase and the availability of housing units. The desert hinterlands (Borg Al-Arab and the far southeast part) not only are less attractive as residential places, but also the housing units over the agricultural lands are more affordable and closer to the old existing settlements and the city centre. In many instances, however, urban sprawl areas form a specific type of slum that tends to be a main hub for social problems and deprivation. Moreover, these areas are characterized by deterioration of public services, facilities and infrastructure where residents have low access to basic needs such as drinking water and sanitation.
The dynamics of urban expansion across coastal cities in Egypt puts a strain on a range of environmental aspects, particularly ecological balance, air quality degradation and natural habitats [7,8,9]. Given its entangled and complex urban growth patterns, Alexandria as a coastal governorate, faces formidable challenges with regards to to controlling and managing the effects and spatial ramifications of demographic development and urban sprawl. The inability of new planned settlements and desert hinterlands to attract populations will accelerate urbanization along the existing urban centres and thus intensive anthropogenic pressures will negatively influence the productive lands and green areas. The forecasted conversion of large agricultural areas to residential patches mostly across the east and southwest parts of the governorate will cause significant destruction to the natural resources of ecological services as well as impairment of biodiversity. In addition, such unplanned urban growth alters urban fabrics, producing compact and dense urban structures that lead to a spread of deprived urban settlements.

6. Conclusions

Alexandria, as a coastal governorate and the second largest city in Egypt, may be under immediate threat with regard to environmental challenges, particularly the risks of climate change ramifications and sea level rise. Furthermore, while the impacts of sea level rise may increase salinity levels of groundwater, which directly decreases the productivity of agricultural lands in the interior neighborhoods, residents of coastal zones that are located on low-laying lands are more likely to suffer from severe floods and inundations. Nonetheless, urban expansion and sprawl across the governorate is another key challenge and should be taken into account.
This study represents a significant contribution to the simulation and forecast of urban changes and the variability of urban growth patterns across the coastal city of Alexandria. The robustness of the implemented ANN-MLP model and the remotely sensed data within advanced GIS platforms has produced reliable and accurate spatiotemporal prediction of urban development. Incorporating several driving forces (e.g., topography, population and transportation factors), the model has successfully projected LULC changes up to 2050. Moreover, over the past two decades, residential growth and urbanization have dramatically increased. For example, during the period 2010–2020, urban sprawl grew by 29% throughout the study area. This pattern of accelerated urban expansion has caused a pronounced decline in fertile agricultural lands and produced fragmented urban fabrics and scattered settlements. The major findings reveal that expansion of residential areas and infrastructure over agricultural and bare lands are directly causing loss of large areas of arable and cultivated lands. The forecasted patterns of urban changes are generally expected to occur within the eastern neighborhoods and along the stretch of Mariout Lake in the east and southeast directions. Furthermore, the decline of agricultural areas is expected to continue in the future due to severe urban pressures, with an estimated agricultural land loss of about 11,023 ha, 10,439 ha and 6257 ha by 2030, 2040 and 2050, respectively. The employed geospatial techniques successfully detected and predicted spatiotemporal changes in LULC dynamics. Local municipalities and planners in Alexandria need to adopt different planning policies to improve urban resilience and protect agricultural land vulnerable to urbanization. The extensive and comprehensive outputs of the geospatial modelling processes in this research may provide decision makers with a potent spatial framework which strengths sustainable urbanization and promotes smart urban growth and new urbanization policies. Likewise, utilizing advanced GIS methods and ANN techniques to quantify and identify areas that are susceptible to urbanization would be indispensable guidelines to help decision makers and planners develop national spatial plans and local strategies that effectively control urban sprawl and alleviate its ramifications.
Due to the absence of detailed environmental datasets and finer resolution images, this research is limited to using coarse resolution satellite images. Future work could extend this scope of analysis and add more detailed ancillary datasets which involve wider domains and driving forces of urbanization. Nevertheless, this research provides new insights and sheds lights on understanding urbanization dynamisms and their entangled urban fabrics in the coastal governorate of Alexandria. To the best of our knowledge, this is the first study which explicitly simulates coastal LULC changes and forecast its spatial patterns during the upcoming three decades. Accordingly, the modelling processes and its results could contribute effectively to the research on coastal urbanization not only in Alexandria but also across all coastal cities and agglomerations in developing nations.

Author Contributions

Methodology, S.M. and E.G.; Formal analysis, S.M.; Data curation, S.M., A.E.-K., S.S. and S.A.; Writing—original draft, S.M. and E.G.; Writing—review & editing, S.M., E.G., A.E.-K., S.S. and S.A.; Visualization, S.M. All authors have read and agreed to the published version of the manuscript.

Funding

This research received no external funding.

Data Availability Statement

Not applicable.

Conflicts of Interest

The authors declare no conflict of interest.

References

  1. UN. World Urbanization Prospects: The 2019 Revision. Available online: https://population.un.org/wpp/publications/files/wpp2019_highlights.pdf (accessed on 25 July 2022).
  2. WorldBank. Urban Development. Available online: https://www.worldbank.org/en/topic/urbandevelopment/overview (accessed on 20 July 2021).
  3. Tibbetts, J. Coastal cities: Living on the edge. Environ. Health Perspect. 2002, 110, A674–A681. [Google Scholar] [CrossRef] [PubMed] [Green Version]
  4. Moschetto, F.; Ribeiro, R.; De Freitas, D. Urban expansion, regeneration and socioenvironmental vulnerability in a mangrove ecosystem at the southeast coastal of São Paulo, Brazil. Ocean. Coast. Manag. 2020, 200, 105418. [Google Scholar] [CrossRef]
  5. Small, C.; Nicholls, R.J. A global analysis of human settlement in coastal zones. J. Coast. Res. 2003, 19, 584–599. [Google Scholar]
  6. Neumann, B.; Vafeidis, A.T.; Zimmermann, J.; Nicholls, R.J. Future coastal population growth and exposure to sea-level rise and coastal flooding-a global assessment. PLoS ONE 2015, 10, e0118571. [Google Scholar] [CrossRef] [PubMed] [Green Version]
  7. Lee, Y.-C.; Ahern, J.; Yeh, C.-T. Ecosystem services in peri-urban landscapes: The effects of agricultural landscape change on ecosystem services in Taiwan’s western coastal plain. Landsc. Urban Plan. 2015, 139, 137–148. [Google Scholar] [CrossRef]
  8. Baude, M.; Meyer, B.C.; Schindewolf, M. Land use change in an agricultural landscape causing degradation of soil based ecosystem services. Sci. Total Environ. 2019, 659, 1526–1536. [Google Scholar] [CrossRef]
  9. Hersperger, A.M.; Grădinaru, S.R.; Siedentop, S. Towards a better understanding of land conversion at the urban-rural interface: Planning intentions and the effectiveness of growth management. J. Land Use Sci. 2020, 15, 644–651. [Google Scholar] [CrossRef]
  10. Güneralp, B.; Seto, K.C. Environmental impacts of urban growth from an integrated dynamic perspective: A case study of Shenzhen, South China. Glob. Environ. Change 2008, 18, 720–735. [Google Scholar] [CrossRef]
  11. Simon, D. Urban environments: Issues on the peri-urban fringe. Annu. Rev. Environ. Resour. 2008, 33, 167–185. [Google Scholar] [CrossRef]
  12. Malaque, I.R., III; Yokohari, M. Urbanization process and the changing agricultural landscape pattern in the urban fringe of Metro Manila, Philippines. Environ. Urban. 2007, 19, 191–206. [Google Scholar] [CrossRef]
  13. Parsa, V.A.; Yavari, A.; Nejadi, A. Spatio-temporal analysis of land use/land cover pattern changes in Arasbaran Biosphere Reserve: Iran. Model. Earth Syst. Environ. 2016, 2, 1–13. [Google Scholar] [CrossRef]
  14. Wang, J.; Maduako, I.N. Spatio-temporal urban Growth dynamics of Lagos Metropolitan Region of Nigeria based on Hybrid methods for LULC modeling and prediction. Eur. J. Remote Sens. 2018, 51, 251–265. [Google Scholar] [CrossRef] [Green Version]
  15. Almeida, C.M.D.; Monteiro, A.M.V.; Câmara, G.; Soares-Filho, B.S.; Cerqueira, G.C.; Pennachin, C.L.; Batty, M. GIS and remote sensing as tools for the simulation of urban land-use change. Int. J. Remote Sens. 2005, 26, 759–774. [Google Scholar] [CrossRef] [Green Version]
  16. Kaliraj, S.; Chandrasekar, N.; Ramachandran, K.; Srinivas, Y.; Saravanan, S. Coastal landuse and land cover change and transformations of Kanyakumari coast, India using remote sensing and GIS. Egypt. J. Remote Sens. Space Sci. 2017, 20, 169–185. [Google Scholar] [CrossRef]
  17. Liu, Y.; Long, H. Land use transitions and their dynamic mechanism: The case of the Huang-Huai-Hai Plain. J. Geogr. Sci. 2016, 26, 515–530. [Google Scholar] [CrossRef] [Green Version]
  18. Costache, R.; Bao Pham, Q.; Corodescu-Roșca, E.; Cîmpianu, C.; Hong, H.; Thi Thuy Linh, N.; Ming Fai, C.; Najah Ahmed, A.; Vojtek, M.; Muhammed Pandhiani, S. Using GIS, remote sensing, and machine learning to highlight the correlation between the land-use/land-cover changes and flash-flood potential. Remote Sens. 2020, 12, 1422. [Google Scholar] [CrossRef]
  19. Khawaldah, H.; Farhan, I.; Alzboun, N. Simulation and prediction of land use and land cover change using GIS, remote sensing and CA-Markov model. Glob. J. Environ. Sci. Manag. 2020, 6, 215–232. [Google Scholar]
  20. Mansour, S.; Al-Belushi, M.; Al-Awadhi, T. Monitoring land use and land cover changes in the mountainous cities of Oman using GIS and CA-Markov modelling techniques. Land Use Policy 2020, 91, 104414. [Google Scholar] [CrossRef]
  21. Munthali, M.; Mustak, S.; Adeola, A.; Botai, J.; Singh, S.; Davis, N. Modelling land use and land cover dynamics of Dedza district of Malawi using hybrid Cellular Automata and Markov model. Remote Sens. Appl. Soc. Environ. 2020, 17, 100276. [Google Scholar] [CrossRef]
  22. Guzy, M.R.; Smith, C.L.; Bolte, J.P.; Hulse, D.W.; Gregory, S.V. Policy research using agent-based modeling to assess future impacts of urban expansion into farmlands and forests. Ecol. Soc. 2008, 13, 38. [Google Scholar] [CrossRef] [Green Version]
  23. Mena, C.F.; Walsh, S.J.; Frizzelle, B.G.; Xiaozheng, Y.; Malanson, G.P. Land use change on household farms in the Ecuadorian Amazon: Design and implementation of an agent-based model. Appl. Geogr. 2011, 31, 210–222. [Google Scholar] [CrossRef] [PubMed] [Green Version]
  24. Singh, V.K. An Algorithm Development Using Agent-Based Modeling and Simulation for Land Use Land Cover Change under Geospatial Framework. Ph.D. Thesis, Indian Institute of Remote Sensing (ISRO), Dehradun, India, 2014; p. 90. [Google Scholar]
  25. Tian, G.; Ma, B.; Xu, X.; Liu, X.; Xu, L.; Liu, X.; Xiao, L.; Kong, L. Simulation of urban expansion and encroachment using cellular automata and multi-agent system model—A case study of Tianjin metropolitan region, China. Ecol. Indic. 2016, 70, 439–450. [Google Scholar] [CrossRef]
  26. Liu, Y.; Kong, X.; Liu, Y.; Chen, Y. Simulating the conversion of rural settlements to town land based on multi-agent systems and cellular automata. PLoS ONE 2013, 8, e79300. [Google Scholar] [CrossRef] [PubMed]
  27. Mustafa, A.; Cools, M.; Saadi, I.; Teller, J. Coupling agent-based, cellular automata and logistic regression into a hybrid urban expansion model (HUEM). Land Use Policy 2017, 69, 529–540. [Google Scholar] [CrossRef] [Green Version]
  28. Liu, D.; Zheng, X.; Wang, H. Land-use Simulation and Decision-Support system (LandSDS): Seamlessly integrating system dynamics, agent-based model, and cellular automata. Ecol. Model. 2020, 417, 108924. [Google Scholar] [CrossRef]
  29. Zhu, X.; Helmer, E.H.; Gao, F.; Liu, D.; Chen, J.; Lefsky, M.A. A flexible spatiotemporal method for fusing satellite images with different resolutions. Remote Sens. Environ. 2016, 172, 165–177. [Google Scholar] [CrossRef]
  30. Kafy, A.-A.; Shuvo, R.M.; Naim, M.N.H.; Sikdar, M.S.; Chowdhury, R.R.; Islam, M.A.; Sarker, M.H.S.; Khan, M.H.H.; Kona, M.A. Remote sensing approach to simulate the land use/land cover and seasonal land surface temperature change using machine learning algorithms in a fastest-growing megacity of Bangladesh. Remote Sens. Appl. Soc. Environ. 2021, 21, 100463. [Google Scholar] [CrossRef]
  31. Basse, R.M.; Omrani, H.; Charif, O.; Gerber, P.; Bódis, K. Land use changes modelling using advanced methods: Cellular automata and artificial neural networks. The spatial and explicit representation of land cover dynamics at the cross-border region scale. Appl. Geogr. 2014, 53, 160–171. [Google Scholar] [CrossRef]
  32. Yang, J.; Guo, A.; Li, Y.; Zhang, Y.; Li, X. Simulation of landscape spatial layout evolution in rural-urban fringe areas: A case study of Ganjingzi District. GISci. Remote Sens. 2019, 56, 388–405. [Google Scholar] [CrossRef]
  33. Chettry, V.; Surawar, M. Delineating Urban Growth Boundary Using Remote sensing, ANN-MLP and CA model: A Case Study of Thiruvananthapuram Urban Agglomeration, India. J. Indian Soc. Remote Sens. 2021, 49, 1–14. [Google Scholar] [CrossRef]
  34. Islam, M.S.; Tanaka, M. Impacts of pollution on coastal and marine ecosystems including coastal and marine fisheries and approach for management: A review and synthesis. Mar. Pollut. Bull. 2004, 48, 624–649. [Google Scholar] [CrossRef] [PubMed]
  35. Rajakumari, S.; Sundari, S.; Meenambikai, M.; Divya, V. Impact analysis of land use dynamics on coastal features of Deshapran block, Purba East Medinipur, West Bengal. J. Coast. Conserv. 2020, 24, 19. [Google Scholar] [CrossRef]
  36. Berlanga-Robles, C.A.; Ruiz-Luna, A. Integrating remote sensing techniques, geographical information systems (GIS), and stochastic models for monitoring land use and land cover (LULC) changes in the northern coastal region of Nayarit, Mexico. GISci. Remote Sens. 2011, 48, 245–263. [Google Scholar] [CrossRef]
  37. Abdullah, A.Y.M.; Masrur, A.; Adnan, M.S.G.; Baky, M.; Al, A.; Hassan, Q.K.; Dewan, A. Spatio-temporal patterns of land use/land cover change in the heterogeneous coastal region of Bangladesh between 1990 and 2017. Remote Sens. 2019, 11, 790. [Google Scholar] [CrossRef] [Green Version]
  38. Hosseini, S.; Gholami, H.; Esmaeilpoor, Y. Assessment of land use and land cover change detection by using remote sensing and gis techniques in the coastal deserts, South of Iran. Int. Arch. Photogramm. Remote Sens. Spat. Inf. Sci. 2019, 42, 489–492. [Google Scholar] [CrossRef] [Green Version]
  39. Rahman, M.T.; Aldosary, A.S.; Mortoja, M. Modeling future land cover changes and their effects on the land surface temperatures in the Saudi Arabian eastern coastal city of Dammam. Land 2017, 6, 36. [Google Scholar] [CrossRef] [Green Version]
  40. Hussein, K.; Alkaabi, K.; Ghebreyesus, D.; Liaqat, M.U.; Sharif, H.O. Land use/land cover change along the Eastern Coast of the UAE and its impact on flooding risk. Geomat. Nat. Hazards Risk 2020, 11, 112–130. [Google Scholar] [CrossRef] [Green Version]
  41. El-Hattab, M.M. Applying post classification change detection technique to monitor an Egyptian coastal zone (Abu Qir Bay). Egypt. J. Remote Sens. Space Sci. 2016, 19, 23–36. [Google Scholar] [CrossRef] [Green Version]
  42. El-Gammal, M.I.; Ali, R.R.; Eissa, R. Land use assessment of barren areas in Damietta Governorate, Egypt using remote sensing. Egypt. J. Basic Appl. Sci. 2014, 1, 151–160. [Google Scholar] [CrossRef] [Green Version]
  43. Halmy, M.W.A.; Gessler, P.E.; Hicke, J.A.; Salem, B.B. Land use/land cover change detection and prediction in the north-western coastal desert of Egypt using Markov-CA. Appl. Geogr. 2015, 63, 101–112. [Google Scholar] [CrossRef]
  44. Shalaby, A.; Tateishi, R. Remote sensing and GIS for mapping and monitoring land cover and land-use changes in the Northwestern coastal zone of Egypt. Appl. Geogr. 2007, 27, 28–41. [Google Scholar] [CrossRef]
  45. Abd El-Kawy, O.; Rød, J.; Ismail, H.; Suliman, A. Land use and land cover change detection in the western Nile delta of Egypt using remote sensing data. Appl. Geogr. 2011, 31, 483–494. [Google Scholar] [CrossRef]
  46. El-Zeiny, A.M.; Effat, H.A. Environmental monitoring of spatiotemporal change in land use/land cover and its impact on land surface temperature in El-Fayoum governorate, Egypt. Remote Sens. Appl. Soc. Environ. 2017, 8, 266–277. [Google Scholar] [CrossRef]
  47. Esmail, M.; Masria, A.; Negm, A. Monitoring land use/land cover changes around Damietta Promontory, Egypt, using RS/GIS. Procedia Eng. 2016, 154, 936–942. [Google Scholar] [CrossRef] [Green Version]
  48. Radwan, T.M.; Blackburn, G.A.; Whyatt, J.D.; Atkinson, P.M. Dramatic loss of agricultural land due to urban expansion threatens food security in the Nile Delta, Egypt. Remote Sens. 2019, 11, 332. [Google Scholar] [CrossRef] [Green Version]
  49. Ferro, L.; Magli, G. The astronomical orientation of the urban plan of Alexandria. Oxf. J. Archaeol. 2012, 31, 381–389. [Google Scholar] [CrossRef] [Green Version]
  50. Heysham, N. Alexandria’s cultural landscapes: Historical parks between originality and deterioration. WIT Trans. Built Environ. 2017, 170, 73–83. [Google Scholar]
  51. Azaz, L. Dilemma of Vibrant City and Endless Urban Growth, Lessons from Alexandria, Egypt. In Proceedings of the REAL CORP 2015. PLAN TOGETHER–RIGHT NOW–OVERALL. From Vision to Reality for Vibrant Cities and Regions. Proceedings of 20th International Conference on Urban Planning, Regional Development and Information Society, Ghent, Belgium, 5–6 May 2015; pp. 759–765. [Google Scholar]
  52. Von Glasow, R.; Jickells, T.D.; Baklanov, A.; Carmichael, G.R.; Church, T.M.; Gallardo, L.; Hughes, C.; Kanakidou, M.; Liss, P.S.; Mee, L. Megacities and large urban agglomerations in the coastal zone: Interactions between atmosphere, land, and marine ecosystems. Ambio 2013, 42, 13–28. [Google Scholar] [CrossRef]
  53. Todd, P.A.; Heery, E.C.; Loke, L.H.; Thurstan, R.H.; Kotze, D.J.; Swan, C. Towards an urban marine ecology: Characterizing the drivers, patterns and processes of marine ecosystems in coastal cities. Oikos 2019, 128, 1215–1242. [Google Scholar] [CrossRef] [Green Version]
  54. Wells, P.G. Biomonitoring the health of coastal marine ecosystems–the roles and challenges of microscale toxicity tests. Mar. Pollut. Bull. 1999, 39, 39–47. [Google Scholar] [CrossRef]
  55. De Andres, M.; Barragan, J.M. Development of coastal cities and agglomerations: Pressure and impacts on coastal and marine ecosystems. Coast. Cities Sustain. Future 2015, 148, 63–71. [Google Scholar]
  56. Frihy, O.E.; Dewidar, K.M.; El Raey, M.M. Evaluation of coastal problems at Alexandria, Egypt. Ocean Coast. Manag. 1996, 30, 281–295. [Google Scholar] [CrossRef]
  57. El-Asmar, H.; Ahmed, M.; Taha, M.; Assal, E. Human impacts on geological and cultural heritage in the coastal zone west of Alexandria to Al-Alamein, Egypt. Geoheritage 2012, 4, 263–274. [Google Scholar] [CrossRef]
  58. Mohamed, S.A. Coastal vulnerability assessment using GIS-Based multicriteria analysis of Alexandria-northwestern Nile Delta, Egypt. J. Afr. Earth Sci. 2020, 163, 103751. [Google Scholar] [CrossRef]
  59. Seto, K.C.; Fragkias, M.; Güneralp, B.; Reilly, M.K. A meta-analysis of global urban land expansion. PLoS ONE 2011, 6, e23777. [Google Scholar] [CrossRef]
  60. Samat, N.; Hasni, R.; Elhadary, Y.A.E. Modelling land use changes at the peri-urban areas using geographic information systems and cellular automata model. J. Sustain. Dev. 2011, 4, 72. [Google Scholar] [CrossRef]
  61. Zhu, X.; Qian, T.; Wei, Y. Do high-speed railways accelerate urban land expansion in China? A study based on the multi-stage difference-in-differences model. Socio-Econ. Plan. Sci. 2020, 71, 100846. [Google Scholar] [CrossRef]
  62. Liang, X.; Liu, X.; Li, X.; Chen, Y.; Tian, H.; Yao, Y. Delineating multi-scenario urban growth boundaries with a CA-based FLUS model and morphological method. Landsc. Urban Plan. 2018, 177, 47–63. [Google Scholar] [CrossRef]
  63. Xian, G.; Crane, M. Assessments of urban growth in the Tampa Bay watershed using remote sensing data. Remote Sens. Environ. 2005, 97, 203–215. [Google Scholar] [CrossRef]
  64. Fazal, S. The need for preserving farmland: A case study from a predominantly agrarian economy (India). Landsc. Urban Plan. 2001, 55, 1–13. [Google Scholar] [CrossRef]
  65. Martinuzzi, S.; Gould, W.A.; González, O.M.R. Land development, land use, and urban sprawl in Puerto Rico integrating remote sensing and population census data. Landsc. Urban Plan. 2007, 79, 288–297. [Google Scholar] [CrossRef]
  66. Gaur, S.; Mittal, A.; Bandyopadhyay, A.; Holman, I.; Singh, R. Spatio-temporal analysis of land use and land cover change: A systematic model inter-comparison driven by integrated modelling techniques. Int. J. Remote Sens. 2020, 41, 9229–9255. [Google Scholar] [CrossRef]
  67. Viana, C.M.; Rocha, J. Evaluating Dominant Land Use/Land Cover Changes and Predicting Future Scenario in a Rural Region Using a Memoryless Stochastic Method. Sustainability 2020, 12, 4332. [Google Scholar] [CrossRef]
  68. Foody, G.M. Sample size determination for image classification accuracy assessment and comparison. Int. J. Remote Sens. 2009, 30, 5273–5291. [Google Scholar] [CrossRef]
  69. Verma, P.; Raghubanshi, A.; Srivastava, P.K.; Raghubanshi, A. Appraisal of kappa-based metrics and disagreement indices of accuracy assessment for parametric and nonparametric techniques used in LULC classification and change detection. Model. Earth Syst. Environ. 2020, 6, 1045–1059. [Google Scholar] [CrossRef]
  70. Bratley, K.; Ghoneim, E. Modeling urban encroachment on the agricultural land of the eastern Nile Delta using remote sensing and a GIS-based Markov chain model. Land 2018, 7, 114. [Google Scholar] [CrossRef] [Green Version]
  71. Saeidi, S.; Mohammadzadeh, M.; Salmanmahiny, A.; Mirkarimi, S.H. Performance evaluation of multiple methods for landscape aesthetic suitability mapping: A comparative study between multi-criteria evaluation, logistic regression and multi-layer perceptron neural network. Land Use Policy 2017, 67, 1–12. [Google Scholar] [CrossRef]
Figure 1. Location of the study area.
Remotesensing 15 00601 g001
Figure 2. Flowchart of the implemented methodological framework including data preparation, analysis process, neural network type and simulation process.
Remotesensing 15 00601 g002
Figure 3. The reference and projected 2020 LULC classes.
Remotesensing 15 00601 g003
Figure 4. Statistics of kappa parameters.
Remotesensing 15 00601 g004
Figure 5. Raster layers of driving forces: elevation (a), slopes (b), distance to public and private facilities (c), distance to railways (d), villages and urban centres (e), distance to major roads (f), population concentration (14 to 29 age group) (g), distance to canals (h).
Remotesensing 15 00601 g005
Figure 6. Potential transition from agricultural and bare lands into built-up areas during the coming three decades (2030, 2040, 2050).
Remotesensing 15 00601 g006
Figure 7. Historical changes of LULC classes between 2010 and 2020.
Remotesensing 15 00601 g007
Figure 8. Spatial distribution of predicted LULC dynamics: potential transition (a), projected LULC in 2030 (b), projected LULC in 2040 (c) and projected LULC in 2050 (d).
Remotesensing 15 00601 g008
Figure 9. Spatial trends (4th order) of LULC dynamics: transition from agriculture to built-up 2030 (a), transition from bare land to built-up 2030 (b), transition from agriculture to built-up 2040 (c), transition from bare land to built-up 2040 (d), transition from agriculture to built-up 2050 (e), transition from bare land to built-up 2050 (f).
Remotesensing 15 00601 g009
Table 1. Details of used Landsat satellite images.
Satellite/SensorPixel SizePath/RawDate Acquired Product TypeCorrection
Landsat 7 ETM30 m178/0389 November 2000L1TPScanline
Landsat 7 ETM30 m178/03827 April 2010L1TP-
Landsat 8 OLI-TIRS 30 m178/0387 October 2020L1TP-
Table 2. Description of spatial parameters and driving forces of LULC changes.
ParametersSuitability for ExpansionRationale for UrbanizationData Source
Elevation−1 m to −10 m = high suitability
−11 m to 40 m = decreasing suitability
−41 m to 90 m = lowest suitability
Relatively low elevations are more suitable for urban development and expansion than high rugged lands [59,60,61].Elevation data were extracted from DEM (30 m), USGS: http//www.edc.usgs.gov (accessed on 11 July 2021).
Slopes0 degree to 40 degree = high suitability
41 degrees to 70 degrees = decreasing suitability
71 km to 97 degrees = lowest suitability
Upslopes and steeper lands are less suitable for built-up expansion, while lower slopes are considered the most suitable for residential development [20].Slopes generation from DEM (30 m), USGS: source: http//www.edc.usgs.gov (accessed on 19 June 2021)
Proximity to Points of Interests 10 m to 50 km = high suitability
51 m to 1000 m = decreasing suitability
1001 m to 13,000 m = lowest suitability
Major public and private infrastructure and facilities such as schools, colleges, universities, hospitals and banks play significant roles in increasing residential expansion, particularly over surrounded vacant land [62].Central Agency for Public Mobilization and Statistics (CAPMAS), 2021. https://www.capmas.gov.eg/ (accessed on 3 August 2021)
Proximity to Railways<1 km = high suitability
1 km to 15 km = decreasing suitability
15 km to 22 km = lowest suitability
Railway network is considered an influential driving force on urban development and often new added stations accelerate urban expansion [63,64].Central Agency for Public Mobilization and Statistics (CAPMAS), 2021. https://www.capmas.gov.eg/ (accessed on 10 May 2021)
Proximity to Urban Centres<1 km to 1 km = high suitability
1 km to 6 km = decreasing suitability
6 km to 12 km = lowest suitability
Agricultural and barren lands near the existing urban centres are often high in price and highly suitable for urban development and constructing new housing units; the shorter the distance, the quicker the land transformation into a built-up area [65].Central Agency for Public Mobilization and Statistics (CAPMAS), 2021. https://www.capmas.gov.eg/ (accessed on 10 May 2021)
Proximity to Major Roads<1 km to 1 km = high suitability
1 km to 6 km = decreasing suitability
6 km to 9 km = lowest suitability
Vacant and agricultural lands near highways and major roads are highly accessible and more valuable; subsequently, are highly suitable for housing construction and urbanization [64].Central Agency for Public Mobilization and Statistics (CAPMAS), 2021. https://www.capmas.gov.eg/ (accessed on 10 May 2021)
Population Concentration (14 to 29 Age Group)Very high density = high suitability
High to medium = decreasing suitability
Low to very low = lowest suitability
Vacant, agricultural and desert lands near densely inhabited neighborhoods are more attractive than land adjacent to sparsely populated settlements [20,66].Central Agency for Public Mobilization and Statistics (CAPMAS), 2021. https://www.capmas.gov.eg/ (accessed on 10 May 2021)
Proximity to Water Canals<1 km to 1 km = high suitability
1 km to 3 km = decreasing suitability
3 km to 6 km = lowest suitability
Proximity to water canals is a vital factor which accelerates urban expansion where households prefer to construct new houses along water canals. Thus, land near water canals is highly susceptible to urbanization [67].Central Agency for Public Mobilization and Statistics (CAPMAS), 2021. https://www.capmas.gov.eg/ (accessed on 10 May 2021)
Table 3. Parameters of MLP performance.
ParameterOutcome
Input layer neurons8
Hidden layer neurons4
Output layer neurons2
Requested samples per class10,000
Final learning rate0.0000
Momentum factor0.5
Sigmoid constant1
Acceptable RMS0.01
Iterations10,000
Training RMS0.2196
Testing RMS0.2217
Accuracy rate95.94%
Skill measure0.9188
Table 4. The results of testing transition from bare land to urban.
ModelAccuracy (%)Skill MeasureInfluence Order
With all variables95.940.9188N/A
Var. 1 constant (Elevations)62.070.24141 (most influential)
Var. 2 constant (Slope)96.800.93607
Var. 3 constant (Facilities)95.940.91886
Var. 4 constant (Railways)95.940.91885
Var. 5 constant (Urban Centres)95.940.91884
Var. 6 constant (Major Roads)95.940.91883
Var. 7 constant (Populations)95.940.91882
Var. 8 constant (Water canals)95.940.91888 (least influential)
Table 5. The outcome of MLP model with backwards stepwise constant forcing.
ModelVariables IncludedAccuracy (%)Skill Measure
With all variablesAll variables95.940.9188
Step 1: var. [2] constant[1,3–8]96.800.9360
Step 2: var. [2,3] constant[1,4–8]96.800.9360
Step 3: var. [2–4] constant[1,5–8]96.800.9360
Step 4: var. [2–5] constant[1,6–8]96.800.9360
Step 5: var. [2–6] constant[1,7,8]96.800.9360
Step 6: var. [2–6,8] constant[1,7]96.800.9360
Step 7: var. [2–8] constant[1]96.790.9358
Table 6. Calculated LULC changes between 2010–2020.
LULC TypeArea in 2010 (ha)Area in 2020 (ha)Change (2010–2020)
Built-up42,599.4555,076.9612,477.51
Agriculture78,873.5771,433.18−7440.39
Bare land31,549.0826,644.17−4904.91
Water20,735.9020,735.900.00
Table 7. Projected changes in LULC between the years 2030 and 2050.
LULC TypeArea in 2020 (ha)Area in 2030 (ha)Change (2020–2030)
Built-up55,076.9671,543.9916,467.03
Bare land26,644.1721,200.25−5443.92
Agriculture71,433.1960,410.08−11,023.11
Water20,735.9020,735.900.00
LULC TypeArea in 2030 (ha)Area in 2040 (ha)Change (2030–2040)
Built-up71,543.9981,982.9510,438.96
Bare land21,200.2518,047.80−3152.45
Agriculture60,410.0853,123.58−7286.50
Water20,735.9020,735.900.00
LULC TypeArea in 2040 (ha)Area in 2050 (ha)Change (2040–2050)
Built-up81,982.9591,074.719091.76
Bare land18,047.8015,213.01−2834.79
Agriculture53,123.5846,866.61−6256.97
Water20,735.9020,735.900.00
Disclaimer/Publisher’s Note: The statements, opinions and data contained in all publications are solely those of the individual author(s) and contributor(s) and not of MDPI and/or the editor(s). MDPI and/or the editor(s) disclaim responsibility for any injury to people or property resulting from any ideas, methods, instructions or products referred to in the content.

