Article

The Transmission Effect and Influencing Factors of Land Pressure in the Yangtze River Delta Region from 1995–2020

1
School of Public Policy and Management, China University of Mining and Technology, Daxue Road 1, Xuzhou 221116, China
2
Research Center for Transformation Development and Rural Revitalization of Resource-Based Cities in China, China University of Mining and Technology, Daxue Road 1, Xuzhou 221116, China
3
Department of Geography, Earth System Sciences, Vrije Universiteit Brussel, Pleinlaan 2, 1050 Brussels, Belgium
4
Key Laboratory of Geographic Information Science (Ministry of Education), School of Geographic Sciences, East China Normal University, Shanghai 200241, China
5
School of Humanities and Law, Jiangsu Ocean University, Lianyungang 222005, China
6
School of Geography and Ocean Science, Nanjing University, Nanjing 210023, China
7
School of Political Science and Law, Shao Guan Uiversity, Daxue Road 288, Shaoguan 512005, China
8
School of Resources and Geoscience, China University of Mining and Technology, Daxue Road 1, Xuzhou 221116, China
*
Author to whom correspondence should be addressed.
Remote Sens. 2023, 15(1), 250; https://doi.org/10.3390/rs15010250
Submission received: 22 November 2022 / Revised: 27 December 2022 / Accepted: 28 December 2022 / Published: 1 January 2023

Abstract

:
Human societal growth has greatly pressured available land resources. The key to reducing land pressure and fostering regional synergistic development is revealing the transmission effect of land pressure. We used a modified gravity model to construct a spatial correlation network (SCN) of the land pressure in the Yangtze River Delta region (YRDR) for the years 1995, 2000, 2005, 2010, 2015 and 2020. To examine how the land pressure is transmitted throughout the cities in the YRDR, we used a social network analysis to examine the overall network structure, individual network characteristics and spatial clustering characteristics. Finally, the center of gravity-GTWR model that coupled the inter-city interactions and the temporal non-smoothness further revealed the spatiotemporal evolution and the different patterns of the influencing factors. The results revealed that (1) the spatial correlation structure of the land pressure in the YRDR was relatively stable. Nanjing, Shanghai, Suzhou, Hangzhou and Changzhou played a significant role as linkages. (2) The YRDR was beyond the geographical limit for the land pressure transmission effect and each block had a considerable and mostly steady transmission impact. (3) The center of gravity-GTWR model that coupled the inter-city interactions and the temporal non-stationarity was a viable method for analyzing the factors that influence the land pressure. (4) There were significant regional and temporal variations in the factors influencing land pressure. The influencing factors differed in intensity and direction from city to city. Our results can provide a new perspective on relieving land pressure from the perspective of urban agglomerations and help accomplish the sustainable development of regional land resources.

1. Introduction

Land is a complex of different resources, making it scarce and irreplaceable. As the most valuable non-productive asset of cities, relieving land pressure is important for both national development and human existence [1]. However, the issue of an incompatible relationship between humans and land has recently become more prevalent as a result of ongoing urbanization, rapid population expansion and environmental degradation [2,3]. Meanwhile, the imbalance between the scarcity of land resources and the demands of social development has led scholars to focus on land pressure [4,5]. Zhu et al. [6] concluded that land pressure is inversely correlated with human food output, economic output and the ecological functions of land, and they developed a quantitative land pressure assessment approach for these three key needs. Chen et al. [7] used the ratio of the existing area of each type of land use to the intended area to assess the situation of land pressure in the Heilongjiang Province from three perspectives: arable land, construction land and ecological land. Hao et al. [8] developed a quantitative land pressure index evaluation approach in terms of food production, economic development and environmental protection. An appropriate scientific foundation has been established by previous research for the evaluation of land pressure.
The region’s land carrying capacity is limited, and when the land pressure of the region rises to a certain degree, the land pressure will be transmitted [9,10]. The interconnectedness of the land resources between the regions has grown as a result of the reciprocal integration of economic development, exhibiting significant spatial correlation characteristics [11,12] Therefore, there is some reciprocal influence of land pressure among cities and the transmission effect of land pressure should also be taken into account while researching land pressure concerns. The locations cannot be regarded as geographically independent observations [13,14]. Ma et al. [15] demonstrated that, since cities in urban agglomerations are closely connected, the synergistic and optimum allocation of urban land may considerably ease the demand for land in developed central cities while promoting the growth of less developed periphery cities.
Scholars have constructed models such as the spatial Durbin model, the Moran index and the social network analysis to investigate the effects of the transmission effect on land intensive use [16], land use efficiency [17], industrial agglomeration [18], ecological efficiency [19] and carbon emissions [20]. However, as research on the transmission effects of these cases continues, research on the transmission effect of land pressure has received less attention [21]. There is a definite interplay between the land pressure of cities, and the land pressure in cities impacts not just the city but also the nearby cities [22,23]. Existing studies have primarily concentrated on the linear causality of land pressure at the provincial scale. There are still limitations in depicting the overall regional linkage structure and the individual micro-connections, lacking an interactive perspective to explore the transmission of land pressure between the regions and ignoring the spillover effects of land pressure.
The research of land pressure influencing factors is a critical component of land pressure research. Identifying the main factors that influence land pressure, establishing a scientific basis for the efficient allocation of land resources and reducing land pressure is facilitated by revealing the link between land pressure and its influencing factors. Most scholars use relatively simple methods to analyze the influencing factors qualitatively, such as expert consultations and empirical knowledge [24,25], whereas some scholars use traditional analysis methods to analyze the influencing factors quantitatively, such as principal component analyses, correlation analyses and regression analyses [26,27,28]. However, the imbalanced impacts of the temporal dimension and the geographical dimension are ignored by the conventional regression approach. Therefore, the spatial Durbin model [16], the barrier degree model [29,30], the geographic detector model [31,32], the geographically weighted regression model [33] and the spatiotemporal geographically weighted regression model [34] were used by researchers to analyze the influencing factors.
Urban agglomerations, a result of economic development and urbanization, have increased the pressure on land resources due to the influx of different demand drivers between cities [35], mainly in the form of excessive encroachment on land resources. Urban agglomerations are physically interconnected and city areas can be linked together in a variety of spatially interactive ways, including social, economic and energy elements [36].
In this context, using the social network analysis method, we created a spatial correlation network (SCN) of land pressure in 41 cities in the Yangtze River Delta region (YRDR) based on the pertinent research data. The specific objectives of this study were (1) to reveal the spatial network structure characteristics of land pressure, (2) to explore the transmission relationship among different cities and (3) to analyze the influencing factors of land pressure through the coupled center of gravity-GTWR model. Our findings serve as a foundation for advancing coordinated regional development, which is essential for reforming the utilization and development of land resources and persistently advancing their sustainable usage.

2. Materials and Methods

2.1. Study Area

The YRDR (Figure 1), which contains 41 cities in the Shanghai, Anhui, Zhejiang and Jiangsu Provinces, is the most economically developed and highly concentrated region in China. The land area is approximately 186,800 km2 and the total resident population reached 232 million in 2020. The annual growth area of built-up land exceeded 700 km2 from 1995 to 2020.

2.2. Data

The data utilized in this study primarily consisted of land use data, DEM data, normalized vegetation index data, socioeconomic data and fossil energy consumption data. The land use data at a 30-m spatial resolution and the normalized vegetation index data at a 1-km spatial resolution were obtained from the Resource and Environmental Science Data Center of the Chinese Academy of Sciences (https://www.resdc.cn/ accessed on 15 January 2022). The DEM data at a 90-m spatial resolution were obtained from the Geospatial Data Cloud (http://www.gscloud.cn/ accessed on 20 January 2022). The socioeconomic data were obtained from the city- and province-level Statistical Yearbook and China Urban Statistical Yearbook for the 41 cities. The fossil energy consumption data were obtained from the city- and province-level Energy Statistical Yearbook, China Urban Construction Statistical Yearbook, and China Energy Statistical Yearbook.

2.3. Methods

This study builds an SCN of land pressure in the YRDR using the modified gravity model to expose the transmission effects of land pressure. Based on the coupled center of gravity-GTWR model, we also examined the influencing factors of land pressure. An analytical flowchart is shown in Figure 2.

2.3.1. Modified Gravity Model

The spatial correlation matrix was the foundation for depicting the social network relationship of land pressure in the YRDR and the core of the social network analysis was to assess the strength of the spatial association network. In this study, the 41 cities in the YRDR were used as the network nodes. A directed SCN was created by building a total of 2503 spatial correlation groups of land pressure throughout six time periods: 1995, 2000, 2005, 2010, 2015 and 2020. To describe the spatial relationship between the individuals, we mainly adopted two methods: the gravity model [38] and the vector auto-regression (VAR) Granger causality [39]. The dynamic evolution characteristics of the land pressure network structure cannot be described by the SCN based on the VAR model. Additionally, the model cannot study the cross-sectional data and is susceptible to time lag requirements [20]. The law of gravity gave rise to the gravity model, which was originally employed in population geography analyses [40]. Scholars subsequently modified the gravity model as its use expanded and the modified gravity model is now extensively utilized in social, economic and geographical research [17,20,39]. On the other hand, the modified gravity model can be used to visualize the trend of the spatial connection using cross-sectional data and it has progressively grown into an important method for assessing the strength of the spatial association and researching spatial relationships [41]. We added the GDP, population and land pressure scores to the original gravity model and introduced the parameter K to indicate the weight of land pressure in cities to depict the gravitational relationship of land pressure more intuitively across the cities in the YRDR. The SCN of land pressure in the YRDR was calculated using a modified gravity model as follows.
R i j = k i j × G i P i l i 3 × G j P j l j 3 D i j 2
k i j = l i l i + l j
where R i j is the spatial correlation intensity of land pressure from city i to city j; G i and G j are the GDP of the city i and j; P i and P j are the population of the city i and j; l i and l j are the land pressure score of the city i and j. The land pressure score was based on 22 indicators that were chosen from the production, living and ecology aspects. The values of the indicators were translated into fuzzy evaluation scores using the fuzzy comprehensive evaluation method and the weights were created using the entropy weighting method (Table A1). D i j represents the spatial distance between cities i and j, and k i j reflects the contribution of land pressure from city i to city j. Equations (1) and (2) were used to calculate the spatial correlation matrix of the land pressure in the YRDR. When the spatial association strength was larger than the critical value, it was represented as 1, indicating a strong influence between the cities. Otherwise, it was marked as 0, indicating no major effect between cities. The mean value in the matrix was used as the critical value [42].

2.3.2. Social Network Characteristics

With the spatial correlation matrix of land pressure obtained in Section 2.3.1, the overall network, individual network and spatial clustering characteristics were examined. The overall network characteristics were used to explain the overall evolution characteristics of the spatial network and it primarily referred to four indicators: network density, network connectedness, network hierarchy and network efficiency. The position and significance of the node cities were described by the individual network characteristics, which primarily included the degree centrality, betweenness centrality and closeness centrality. The CONCOR method was used in Ucinet 6.0 to implement the spatial clustering characteristics. For further explanations of the feature definitions, operation steps and formulae of specific indicators, please refer to our previous studies [43].

2.3.3. Center of Gravity-GTWR Model

Studies of land use patterns, urban evolution and the dynamic evolution of population and economic development frequently use the center of gravity, which is the average spatial location of all the geographic features [44,45]. The center of gravity shift model is an important tool for describing the spatial organization of the cities because it can objectively reflect the spatial concentration of regional factor development and its pattern of displacement.
The spatial and temporal nonstationary problem is resolved by the geographically and temporally weighted regression model, which adds the time dimension to the geographically weighted regression model and overcomes the constraint that the model parameters cannot be estimated due to the limited amount of sample data [46].
In contrast to the traditional GWR model, the GTWR model demands different spatial coordinates for the object of research at various time points. The greater coordinate overlap will cause the model findings to be closer to a linear regression analysis with the time dimension of the study [47]. As one of the key factors contributing to increasing land pressure, this study built a center of gravity-GTWR model by coupling the GTWR model with the center of gravity shift model for the built-up land. To explore the spatial and temporal variations of the land pressure influencing factors in urban agglomerations more scientifically, the weight shift model provided the spatial coordinates of the distribution of construction land over time and the GTWR model dealt with the spatial elements on this basis.
The basic formula of the center of gravity-GTWR is as follows:
Y i = β 0 ( u i t , v i t , t i ) + 1 q β p ( u i t , v i t , t i ) X i p + ε i
where Y and X are the independent variable and the dependent variable, respectively; β 0 ( u i t , v i t , t i ) is the constant term in the model; β p ( u i t , v i t , t i ) is the regression coefficient of the explanatory variable p; ( u i t , v i t , t i ) are the spatiotemporal coordinates of unit i; q represents the number of factors, in this study q = 10; X i p represents the variable p data of unit i; ε i is the random disturbance term; and u i t , v i t and t i represent the latitude, longitude and data time of gravity center, respectively. The calculations for u i t and v i t are as follows:
u i t = m = 1 n c m t × u m m = 1 n c m t
v i t = m = 1 n c m t × v m m = 1 n c m t
where c m t is the area (km2) of the m-th patch in the year t, u m and v m are the gravity center coordinates of the m-th patch and n is the number of the patches.
The GTWR coefficients at ( u i t , v i t , t i ) can be expressed by introducing a space-time weight matric as follows:
β ^ ( u i t , v i t , t i ) = [ X T W ( u i t , v i t , t i ) X ] 1 X T W ( u i t , v i t , t i ) Y
where W ( u i t , v i t , t i ) is the space-time weight matrix of the unit i, W ( u i t , v i t , t i ) = diag ( α i 1 , α i 2 , α i n ) and n is the number of observations. The diagonal element α i j is the weight of the space-time weight function of the unit i at the observation unit j. X and Y are the matrices composed of the independent variables and dependent variables, respectively. X T is the transposed matrix of X.
The choice of a spatial weight function forms the basis of the GTWR and the creation of a spatial weight matrix results in the spatial correlation of the data. The space-time geographic weighting model combines time and space by using the Gaussian function method to establish the space-time weight function and space-time distance [47].
d i j S T = λ [ ( u i t u j t ) 2 + ( v i t v j t ) 2 ] + μ ( t i t j ) 2
w i j S T = e x p { ( λ [ ( u i t u j t ) 2 + ( v i t v j t ) 2 ] + μ ( t i t j ) 2 b S T 2 ) }
where d i j S T is the space-time distance between the unit i and the unit j; w i j S T is the influence weight of the unit j on the unit I; and λ and μ are the scale factors that measure the different effects of the spatial and temporal distances of the different measurement systems in this study, the ratio of λ to μ was set to 1; and b S T is a parameter of the spatiotemporal bandwidth. In order to obtain more accurate results, this study adopted an adaptive bandwidth based on the AICc criterion [48].

3. Results

3.1. Overall Network Characteristics

This study demonstrated that the SCN of land pressure has a network connectedness of 1, indicating high stability and that there are direct or indirect land pressure connections between the cities with strong transmission effects in the YRDR (Figure 3). The network efficiency of the SCN of land pressure in the YRDR showed an overall weak increasing trend from 0.6615 to 0.7090 during 1995–2015 and fluctuated during 2015–2020, decreasing to 0.7026 with a higher network efficiency, indicating an increase in the redundant relationships in the network structure. The network density had a minor downward tendency from 1995 to 2020, the total network density was low, the connectivity between the cities was insufficient and there was still potential for further development. The network hierarchy remained 0, meaning that there were no cities in the SCN of land pressure that had extreme dominance or extreme periphery and that all the cities were in a relatively equal position. The total number of land pressure correlations in the YRDR exhibited a varying downward trend, with the maximum correlation in 1995 being 434, which was significantly less than the theoretical maximum relationship of 1640 (41×40). This suggests that there was room for improvement in the YRDR’s land pressure correlation, which was not very high.
To further investigate the development characteristics of the SCN of land pressure in the YRDR, this study constructed an SCN of land pressure in the YRDR based on the modified gravity model and visualized and analyzed the gravitational intensity data using ArcGIS 10.2 (Figure 4). We obtained a total of 1640 data points on the gravitational intensity of the SCN of land pressure and then analyzed the top ten cities in terms of the gravitational intensity in each of the years 1995, 2000, 2005, 2010, 2015 and 2020 (Table 1).
The lowest value of the gravitational intensity of the SCN of land pressure had increased from 0.75 to 21.20, expanding approximately 28.26 times. The highest value had increased from 8271.77 to 66,530.36, expanding approximately 8.04 times between 1995 and 2020. As the gravitational intensity strengthened, the transmission effect of land pressure became more and more obvious. The repetition rate of the city gravitational intensity in the top 10 ranking from 1995 to 2020 was up to 70% and the cities were primarily situated in SH and the Jiangsu Province, with fewer cities in Zhejiang and Anhui, only ZJ, JX, XZ and SZ. With the top 10 cities maintaining close connections to SH, SH had a strong central position. The inter-city connections were primarily between cities within the province, with weaker connections between cities across the province. According to the natural breakpoint classification, we classified the gravitational intensity of land pressure into five levels, and the SCN strength of land pressure in the eastern YRDR was much higher than that in the western part. The spatial pattern gradually evolved into a three-axis development pattern with SH-JX, SH-NT and SH-SU-WX-CA as the axes. Throughout the study period, the SCN of land pressure steadily grew stronger, displaying highly networked characteristics. The network level also gradually revealed the spatial structural characteristics of small groups and pole-core diffusion.

3.2. Individual Network Characteristics

Three indicators—the degree centrality, closeness centrality and betweenness centrality—were used to explore the individual characteristics of the SCN of land pressure in the YRDR. The results are shown in Figure 5 after the centrality indicators were normalized.
Following the development trends, the degree centrality of NJ, HF, TA, CI and SQ was increasing and the degree centrality of HZ, QZ, LA, HN, MAS, NB, TZ, LS and SZ was constant, while the remaining cities were decreasing. The mean values of the degree centrality for the 41 study nodes (cities) in 1995, 2000, 2005, 2010, 2015 and 2020 were 37.07, 34.02, 33.78, 33.53, 32.56 and 33.17, respectively, with a declining trend in the mean values of the degree centrality. When compared to the average value for the study period, the degree centrality for NJ, SH, SU, HZ, HF, CA, WX, CU, XC, WH, ZJ, YZ and HU was higher in each. These cities were primarily found in the eastern and central regions of the YRDR, which were more closely connected to the other cities in the network and played a significant role. The cities with a lower degree centrality included HB, LS, BZ, WZ, ZS and CI, which occupied the periphery of the SCN of land pressure and were unable to effectively absorb the factor spillover from the other cities or have a significant transmission impact on them.
The closeness centrality of the majority of the cities throughout the research period ranged from 45 to 80, revealing a high efficiency of the overall SCN flow and a generally balanced network structure. In 1995, NJ, SH, YZ, SU and CU had a higher closeness centrality. After 2000, NJ, SH and SU continued to have a higher closeness centrality, while HZ was added as a city with a higher closeness centrality. These five cities (NJ, SH, SU, HZ and CA) were in front of the other cities in terms of the closeness centrality as of 2010, when CA was added as a city with a strong closeness centrality. The findings are the same for the degree centrality and the betweenness centrality. These cities used the transmission effect of the spatial network of land pressure to swiftly establish connections with the other cities, maintain a strong presence in the network and also sustain a strong access to resources.
SH, YZ, NJ, CU and SU were the top five cities in 1995 for the betweenness centrality. Since 2000, NJ, SH, HZ and SU have continually been among the top five cities for the betweenness centrality. This demonstrates that these four cities are important as links and bridges in the SCN of land pressure in the YRDR, with the transmission of land pressure primarily centered on SH and exchanged among the economically developed cities of NJ, SU and HZ. ZS, TZ, WZ, HB and LS all had a betweenness centrality that was less than 0.2, making them relatively less competitive, unable to absorb the factor overflow from the other cities and insufficiently connected to the other regions. Future exchanges and collaboration between these cities and other areas should be bolstered.

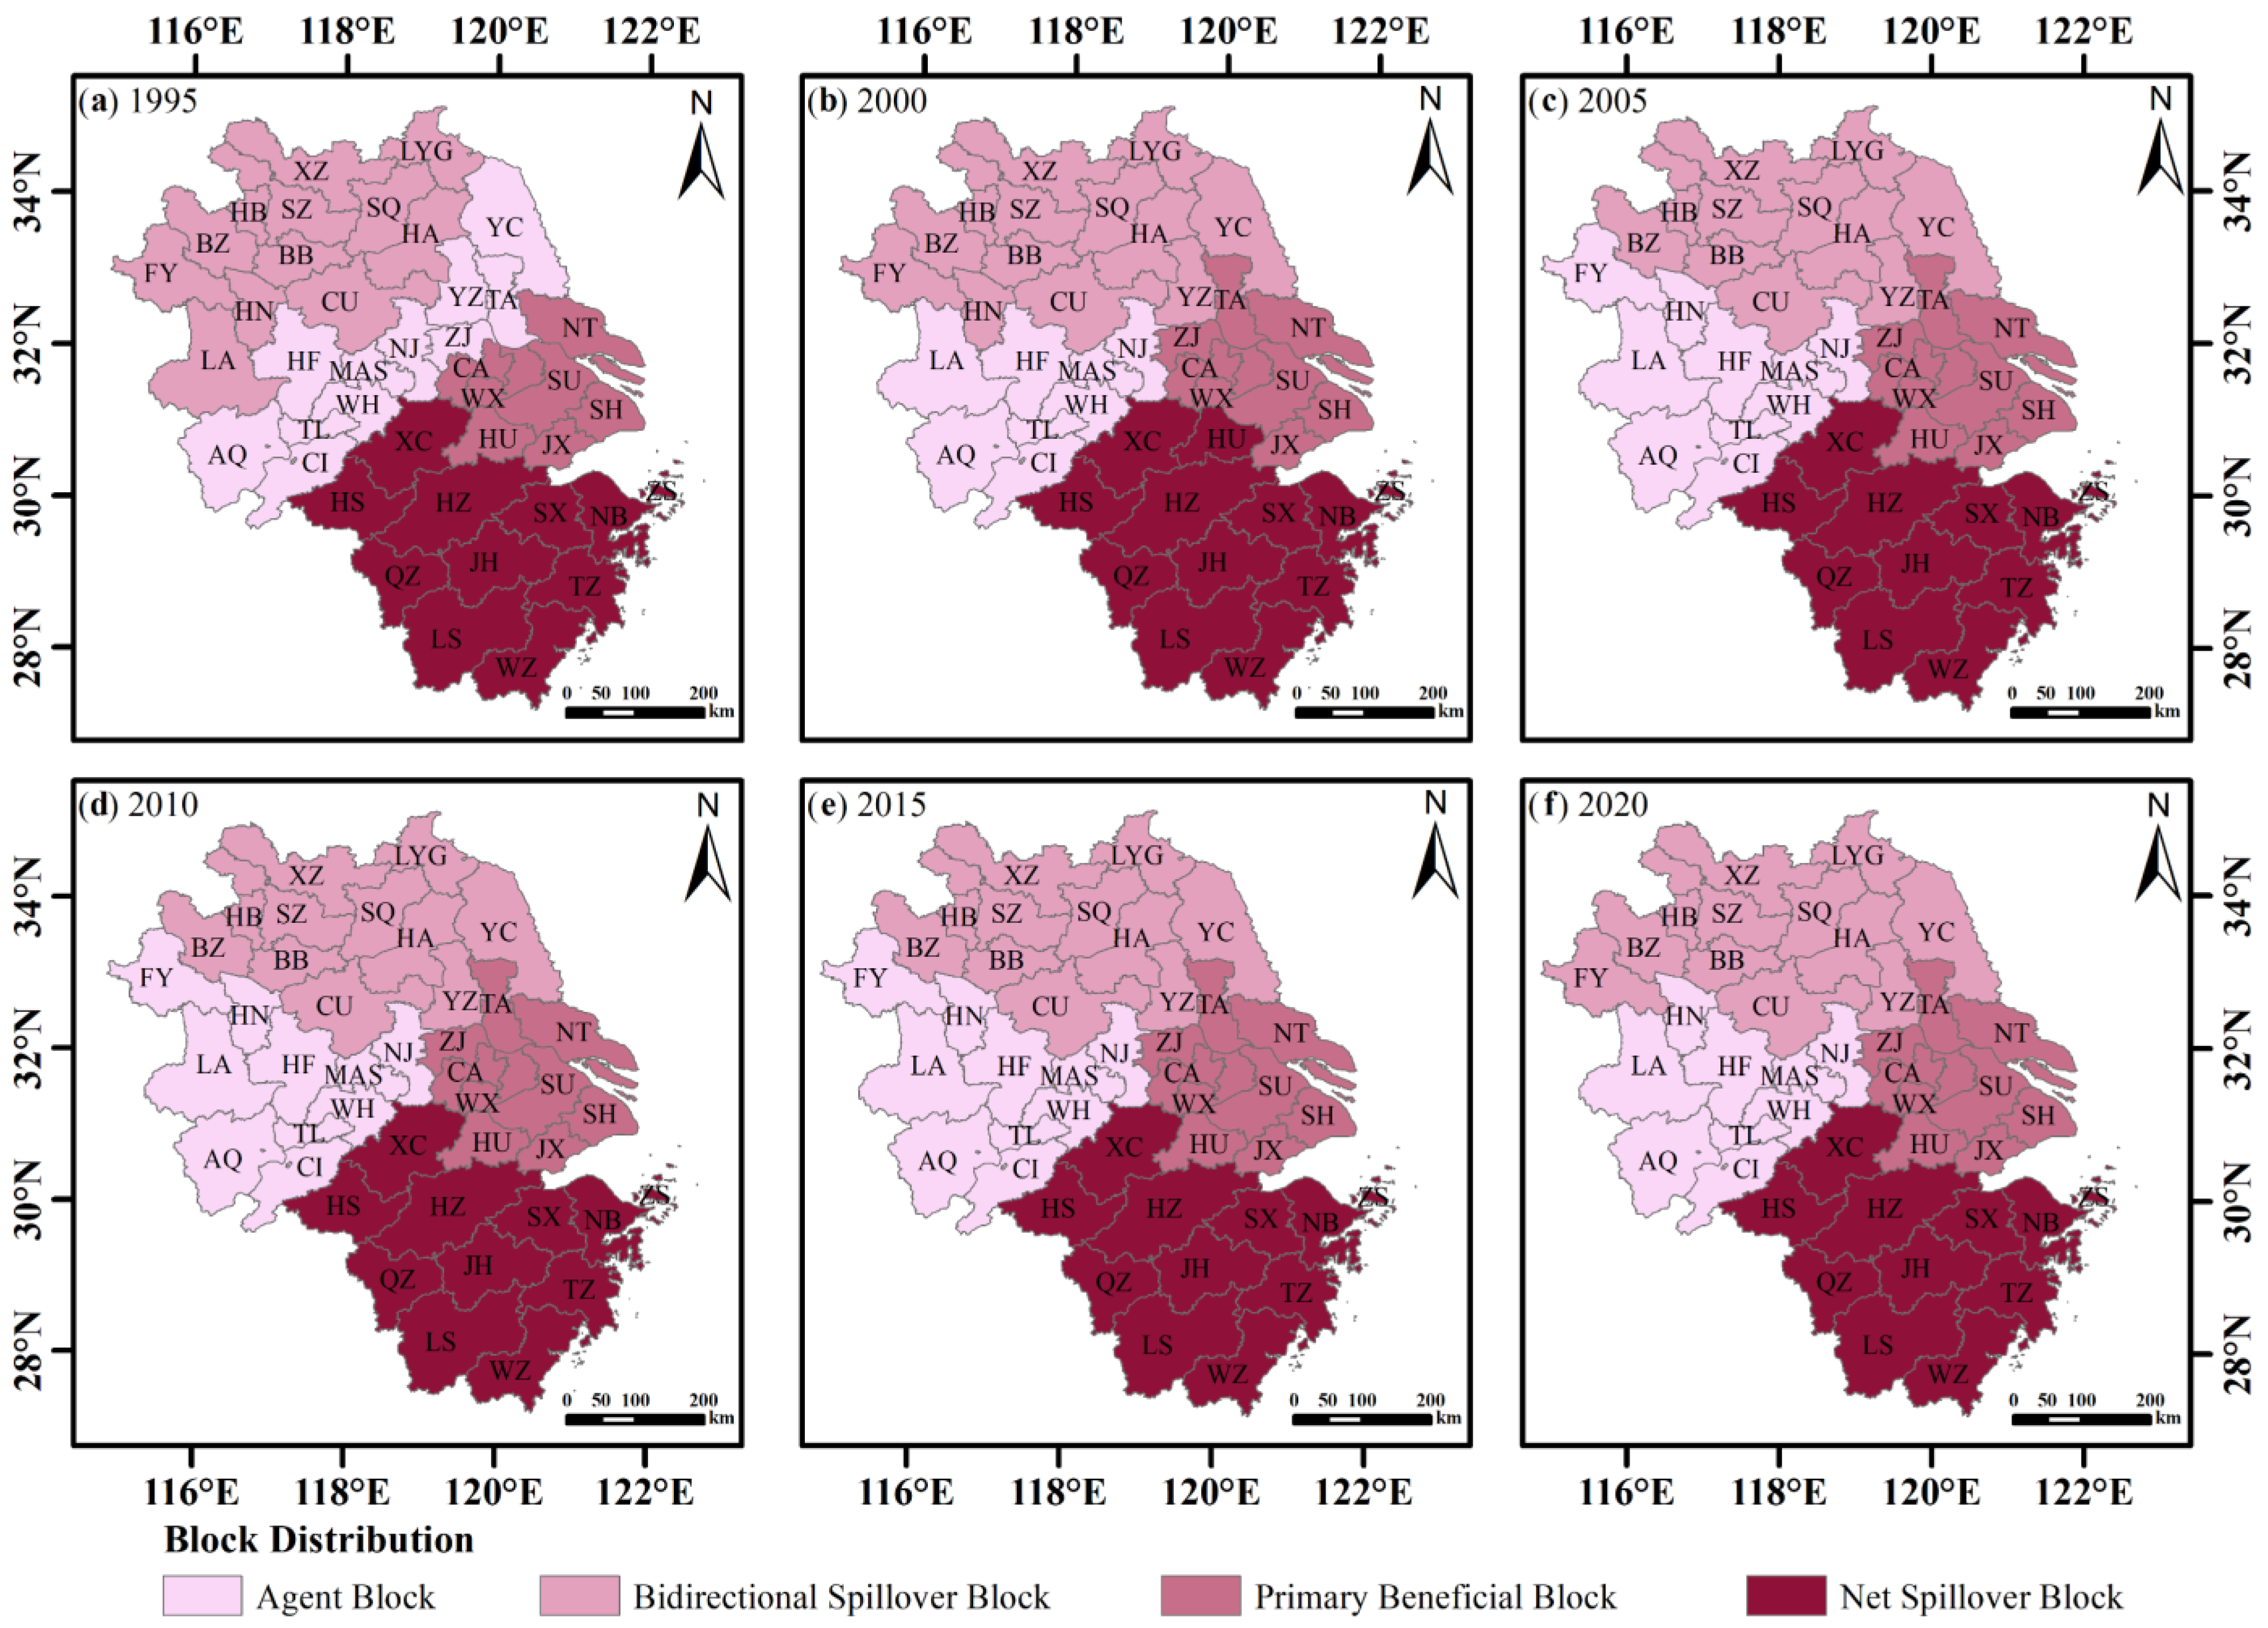
3.3. Spatial Clustering Characteristics

We used the spatial clustering method to divide the 41 cities in the YRDR into four blocks according to the attribute classification criteria of the blocks. Block I was the agent block, Block II was the bidirectional spillover block, Block III was the primary beneficial block and Block IV was the net spillover block (Table 2). This allowed us to better explore the clustering relationship, attribute relationship and transmission effect of each city in the SCN of land pressure in the YRDR.
The results from the six stages from 1995 to 2020 are depicted in Figure 6. YC and YZ migrated from the agent block to the bidirectional spillover block, LA migrated from the bidirectional spillover block to the agent block and TA migrated from the agent block to the primary beneficial block from 1995–2000. HN migrated from the bidirectional spillover block to the agent block after 2000. FY became an agent block between 2005–2015 and remained stable in the bidirectional spillover block for the rest of the period. It can be seen that, over time, each city’s attribute role in the SCN of land pressure was gradually clarified and the membership structure within each block was gradually and regionally stabilized. Eventually, the YRDR emerged with the eastern part serving as the primary beneficiary block, the southern part serving as the net spillover block, the western part serving as the agent block and the northern part serving as the bidirectional spillover block. The cities within the primary beneficiary block were situated at the center of the spatial network structure of land pressure. The developed economy of the city had a higher demand for resources and required the absorption of resources from the other cities to satisfy its demands. In addition to supplying resources to the other cities, the bidirectional spillover block also absorbed resources from the other cities. Through the resource factor spillover, the cities in the net spillover block had a considerable feeding effect on the other cities in the network, relieving the land pressure in the other cities. With more frequent resource transfers with neighboring cities, the cities in the agent block acted as intermediary bridges in the SCN of land pressure.
We built a matrix of the SCN of land pressure based on the total network density of each year to further investigated the transmission effect among the blocks. If the value inside the block exceeded the total network density, it was assigned a value of 1. Otherwise, it was given a value of 0 (Table 3).
The transmission relationship between the blocks is shown in Figure 7. The bidirectional spillover block had a transmission effect inside the block during the period 1995–2020 but only had a transmission effect for the agent block in 1995 and the primary beneficiary block in 2005 and 2010. The agent block had a transmission effect within the block as well as on the primary beneficiary block, the primary beneficiary block had a transmission effect on the internal block, the net spillover block had a transmission effect on the internal block and the primary beneficiary block also had a transmission effect within the block during the study period. The intra-block transmission relationship suggests that resource transfer between the cities within the block is active.

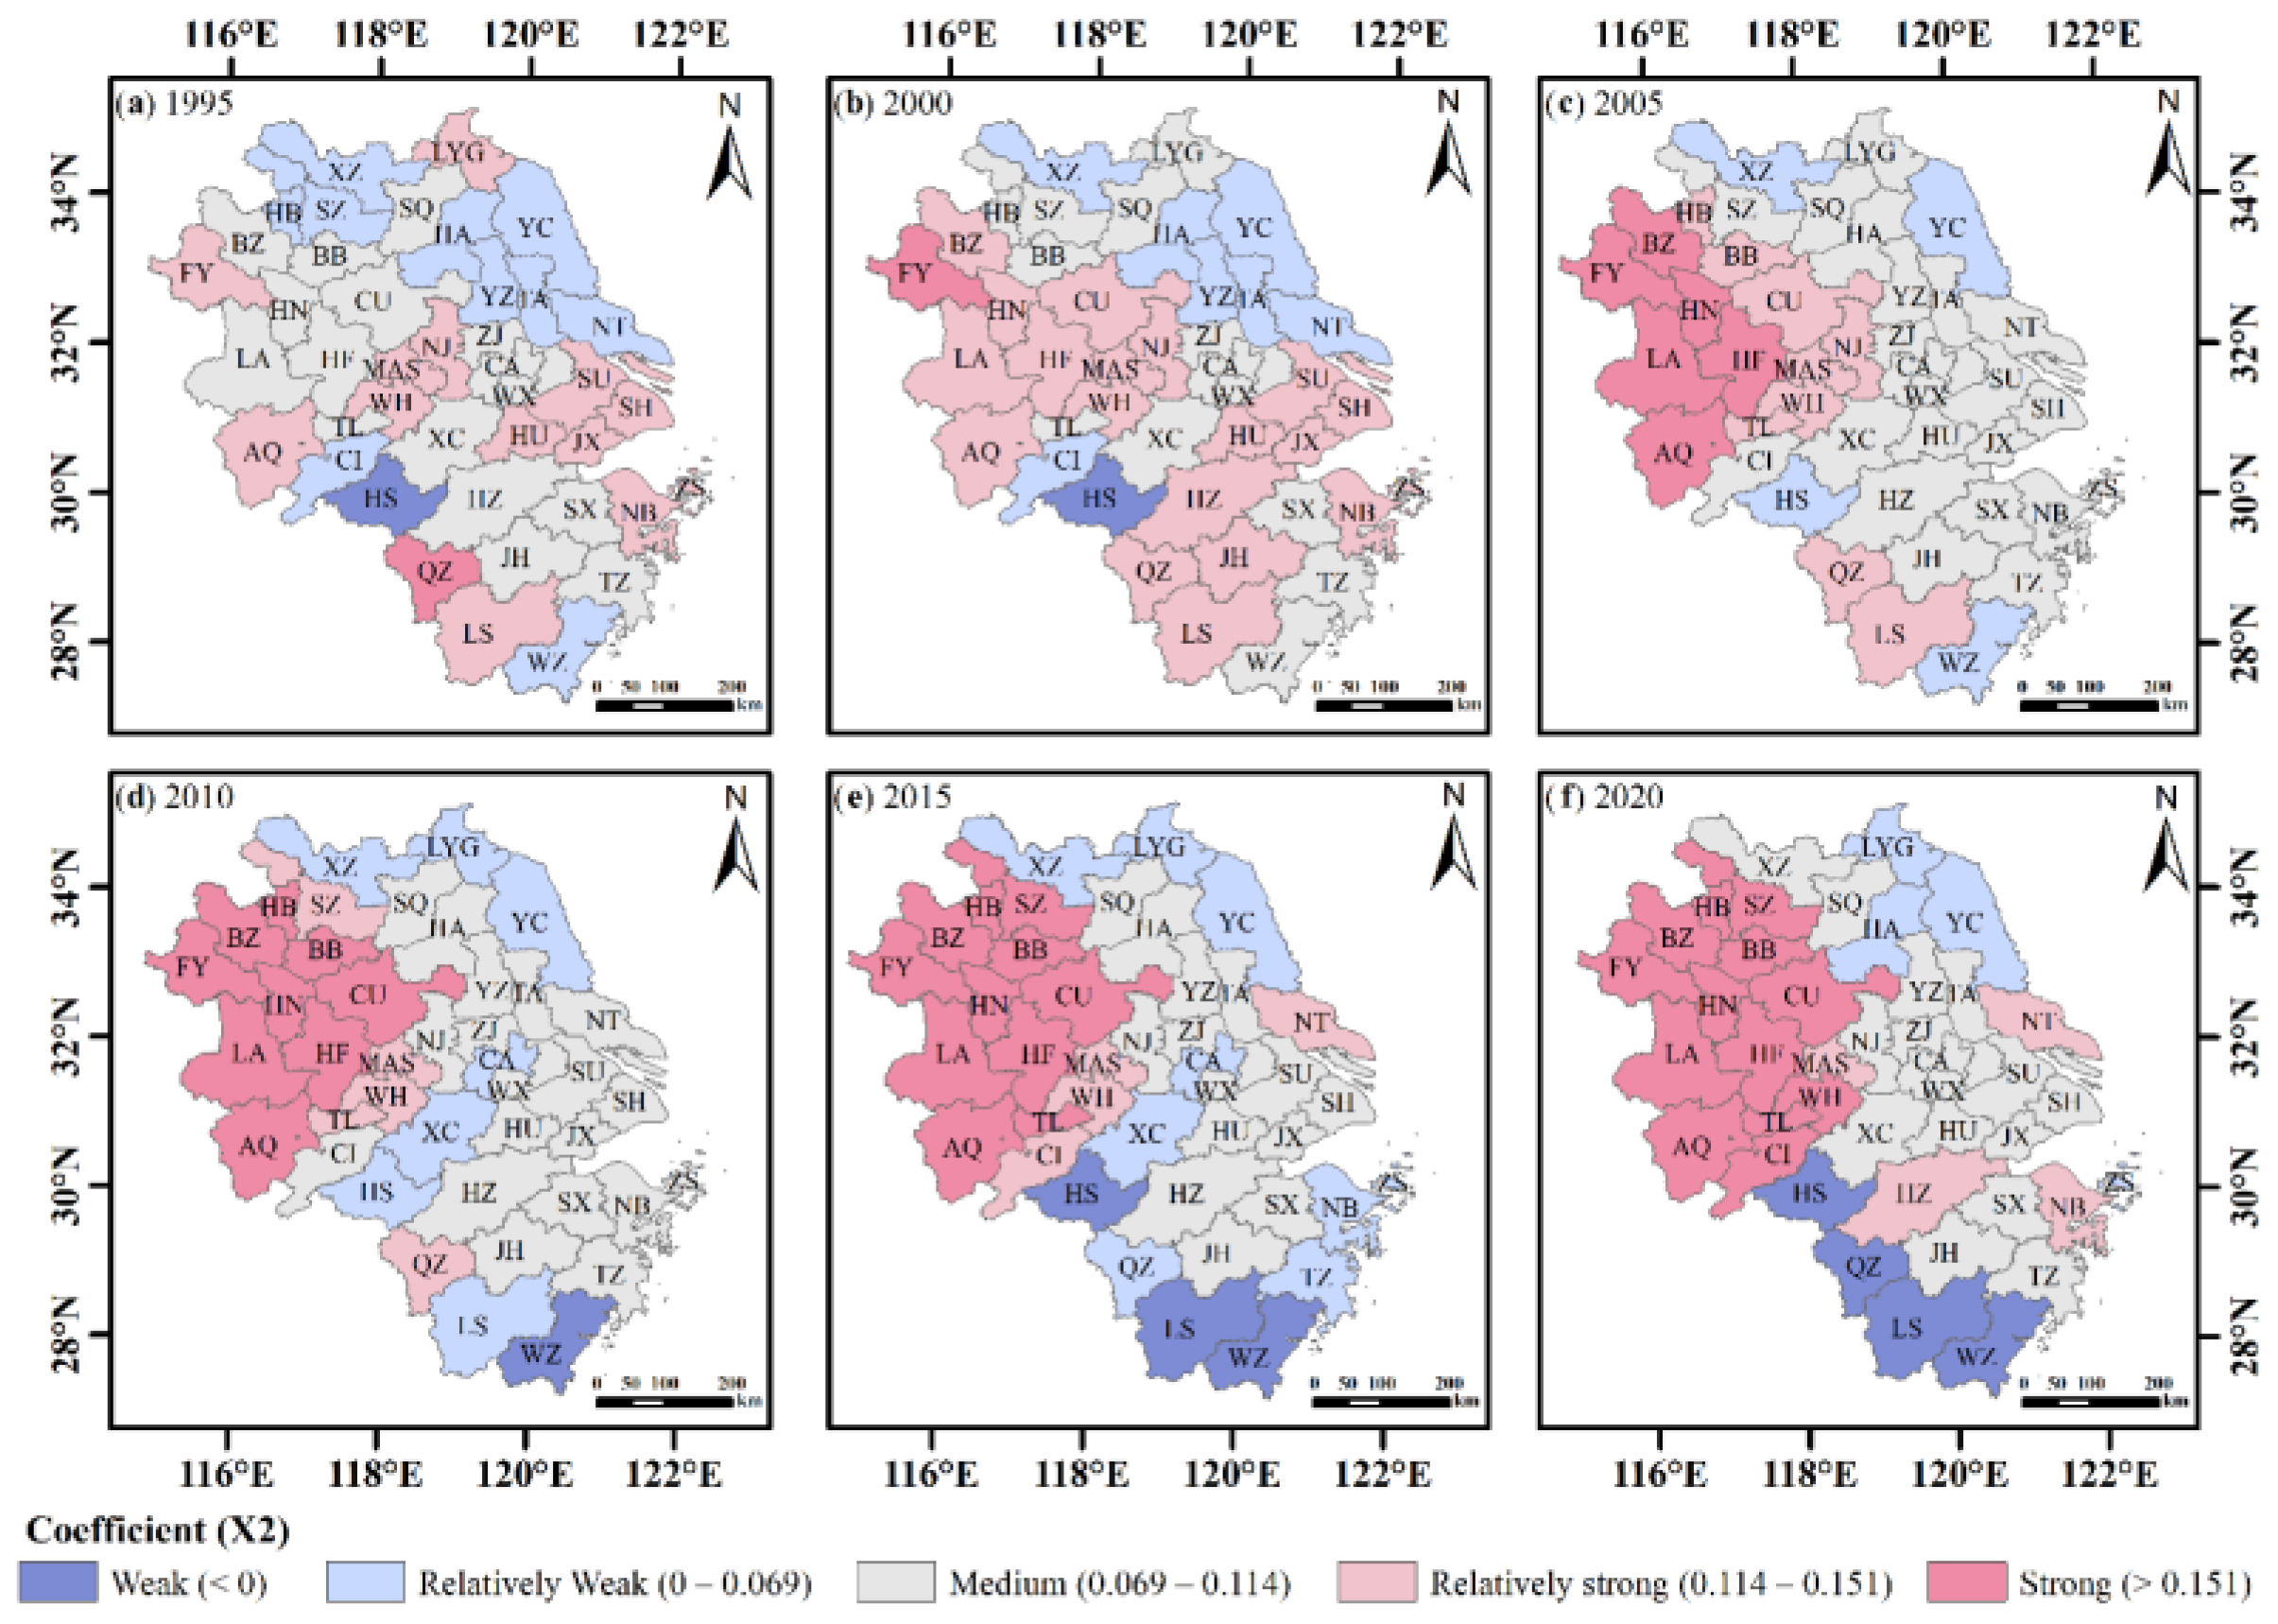
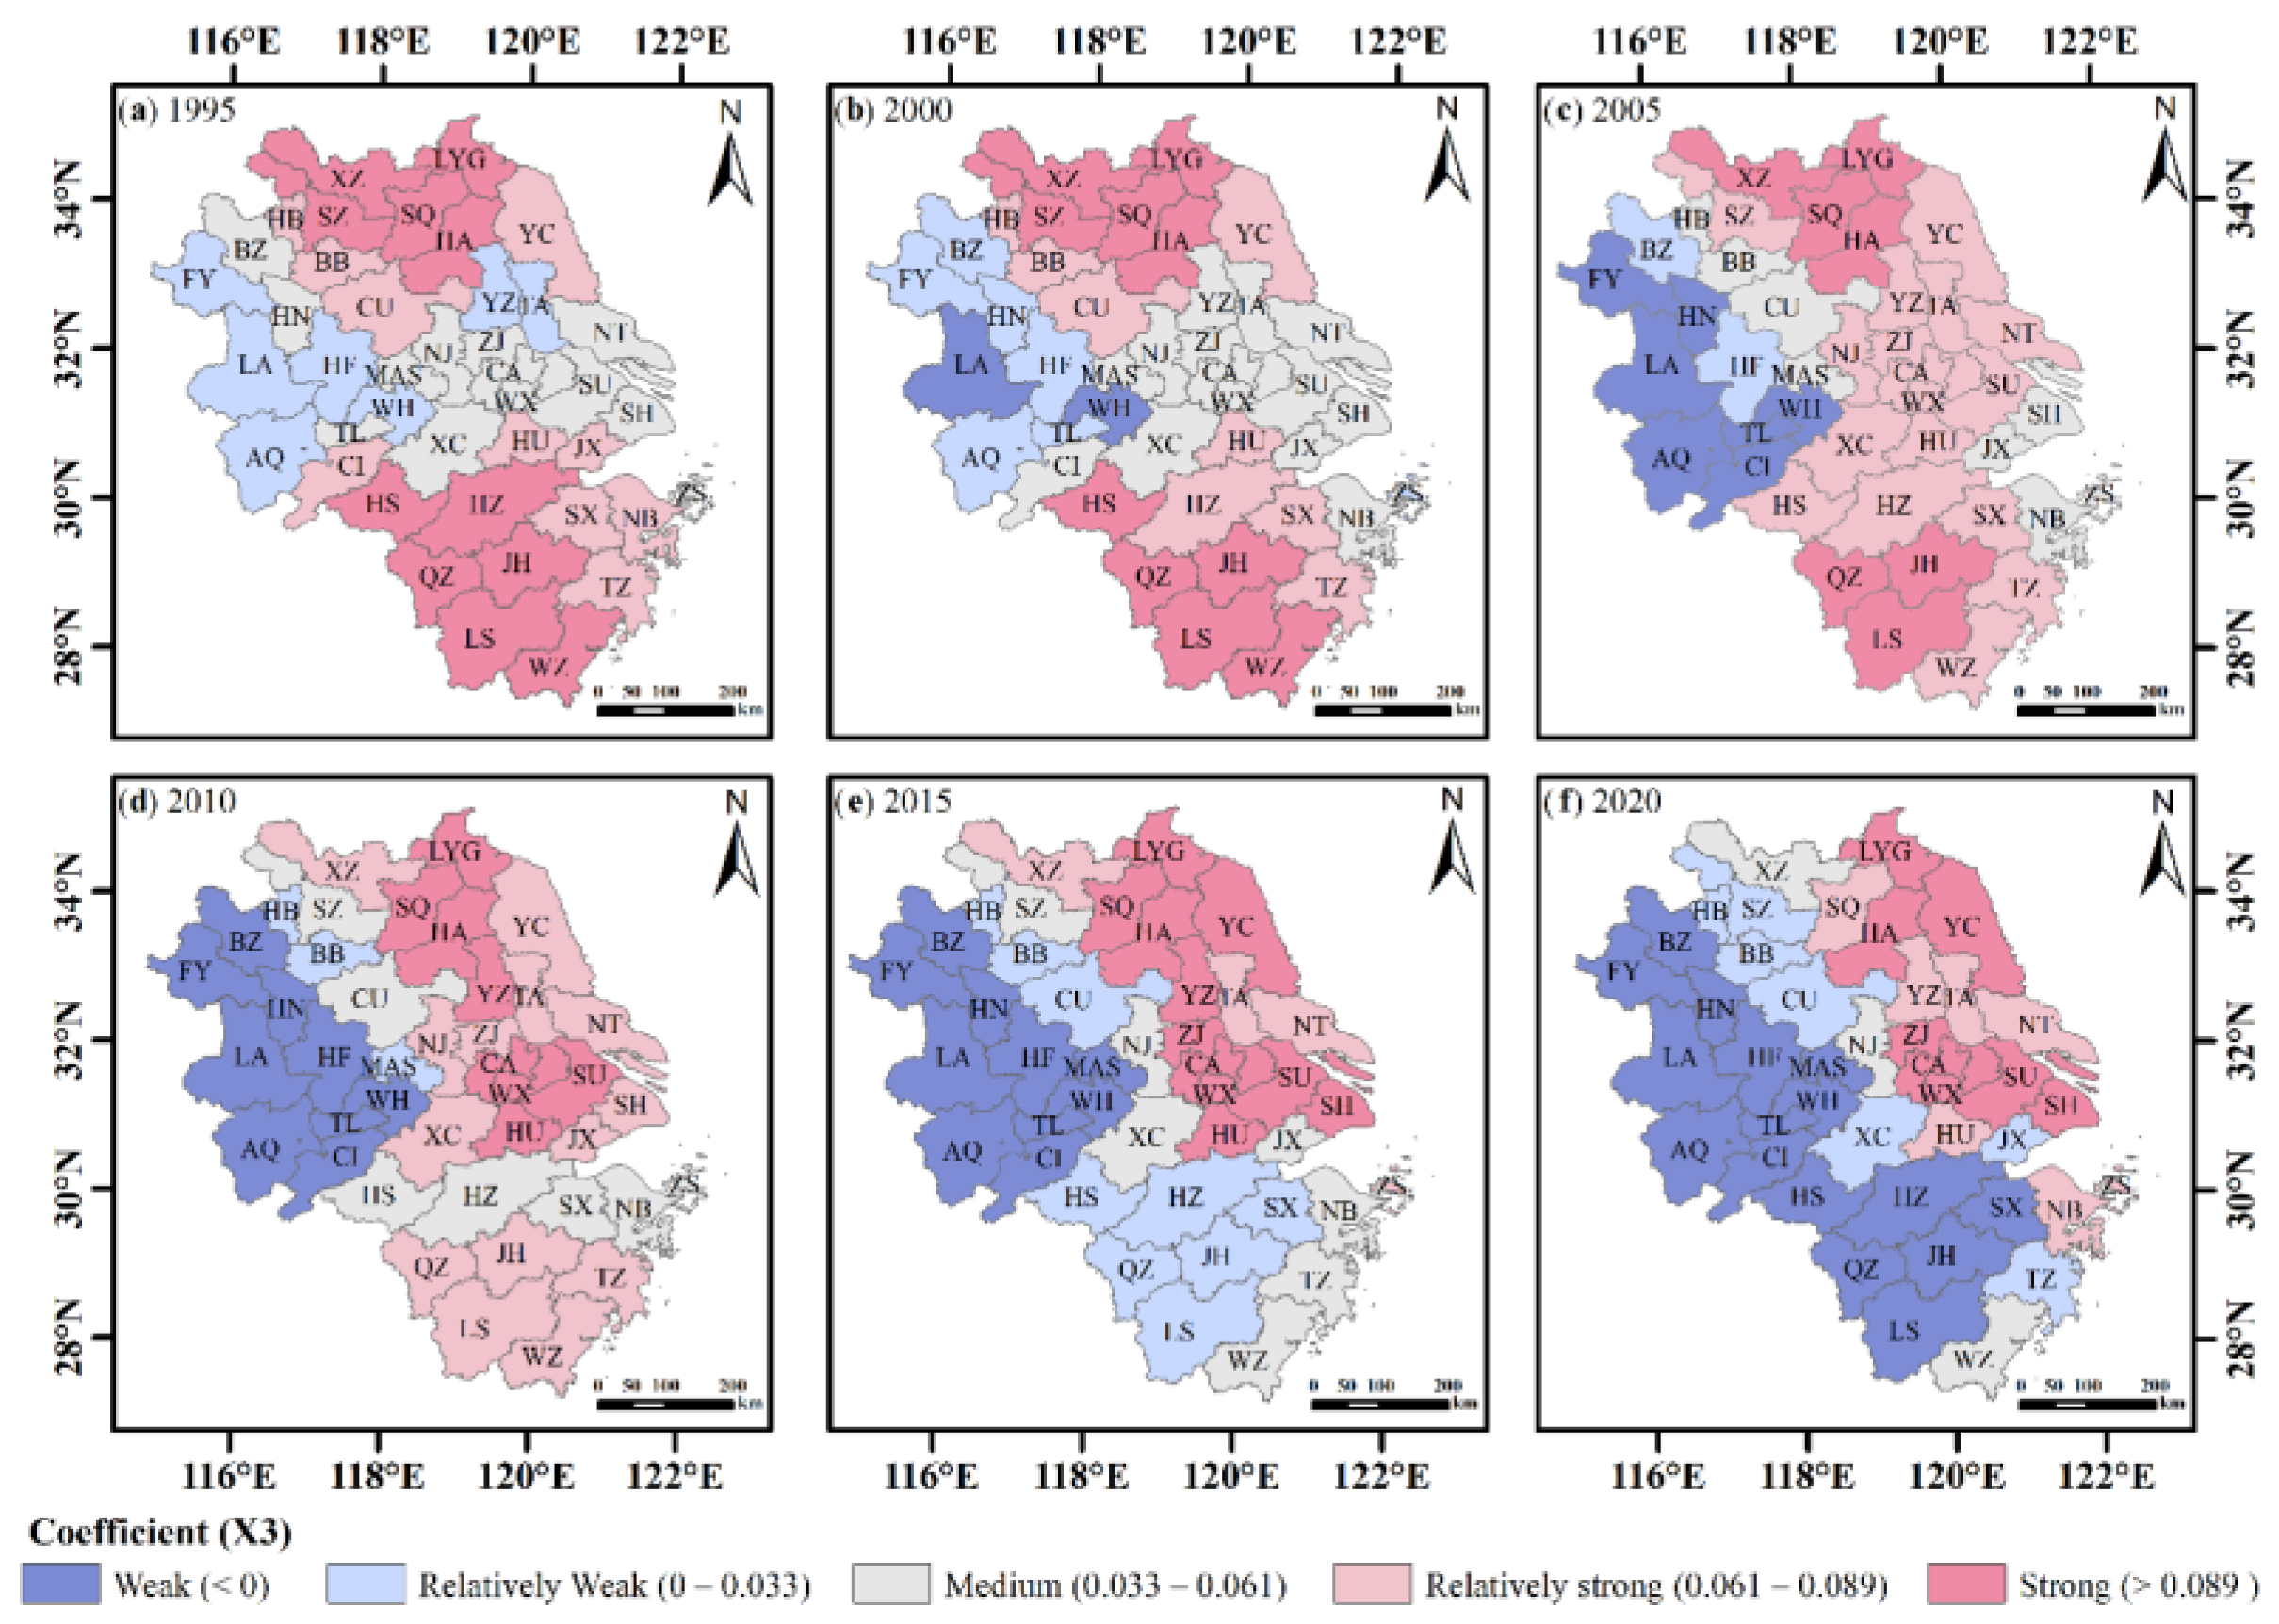
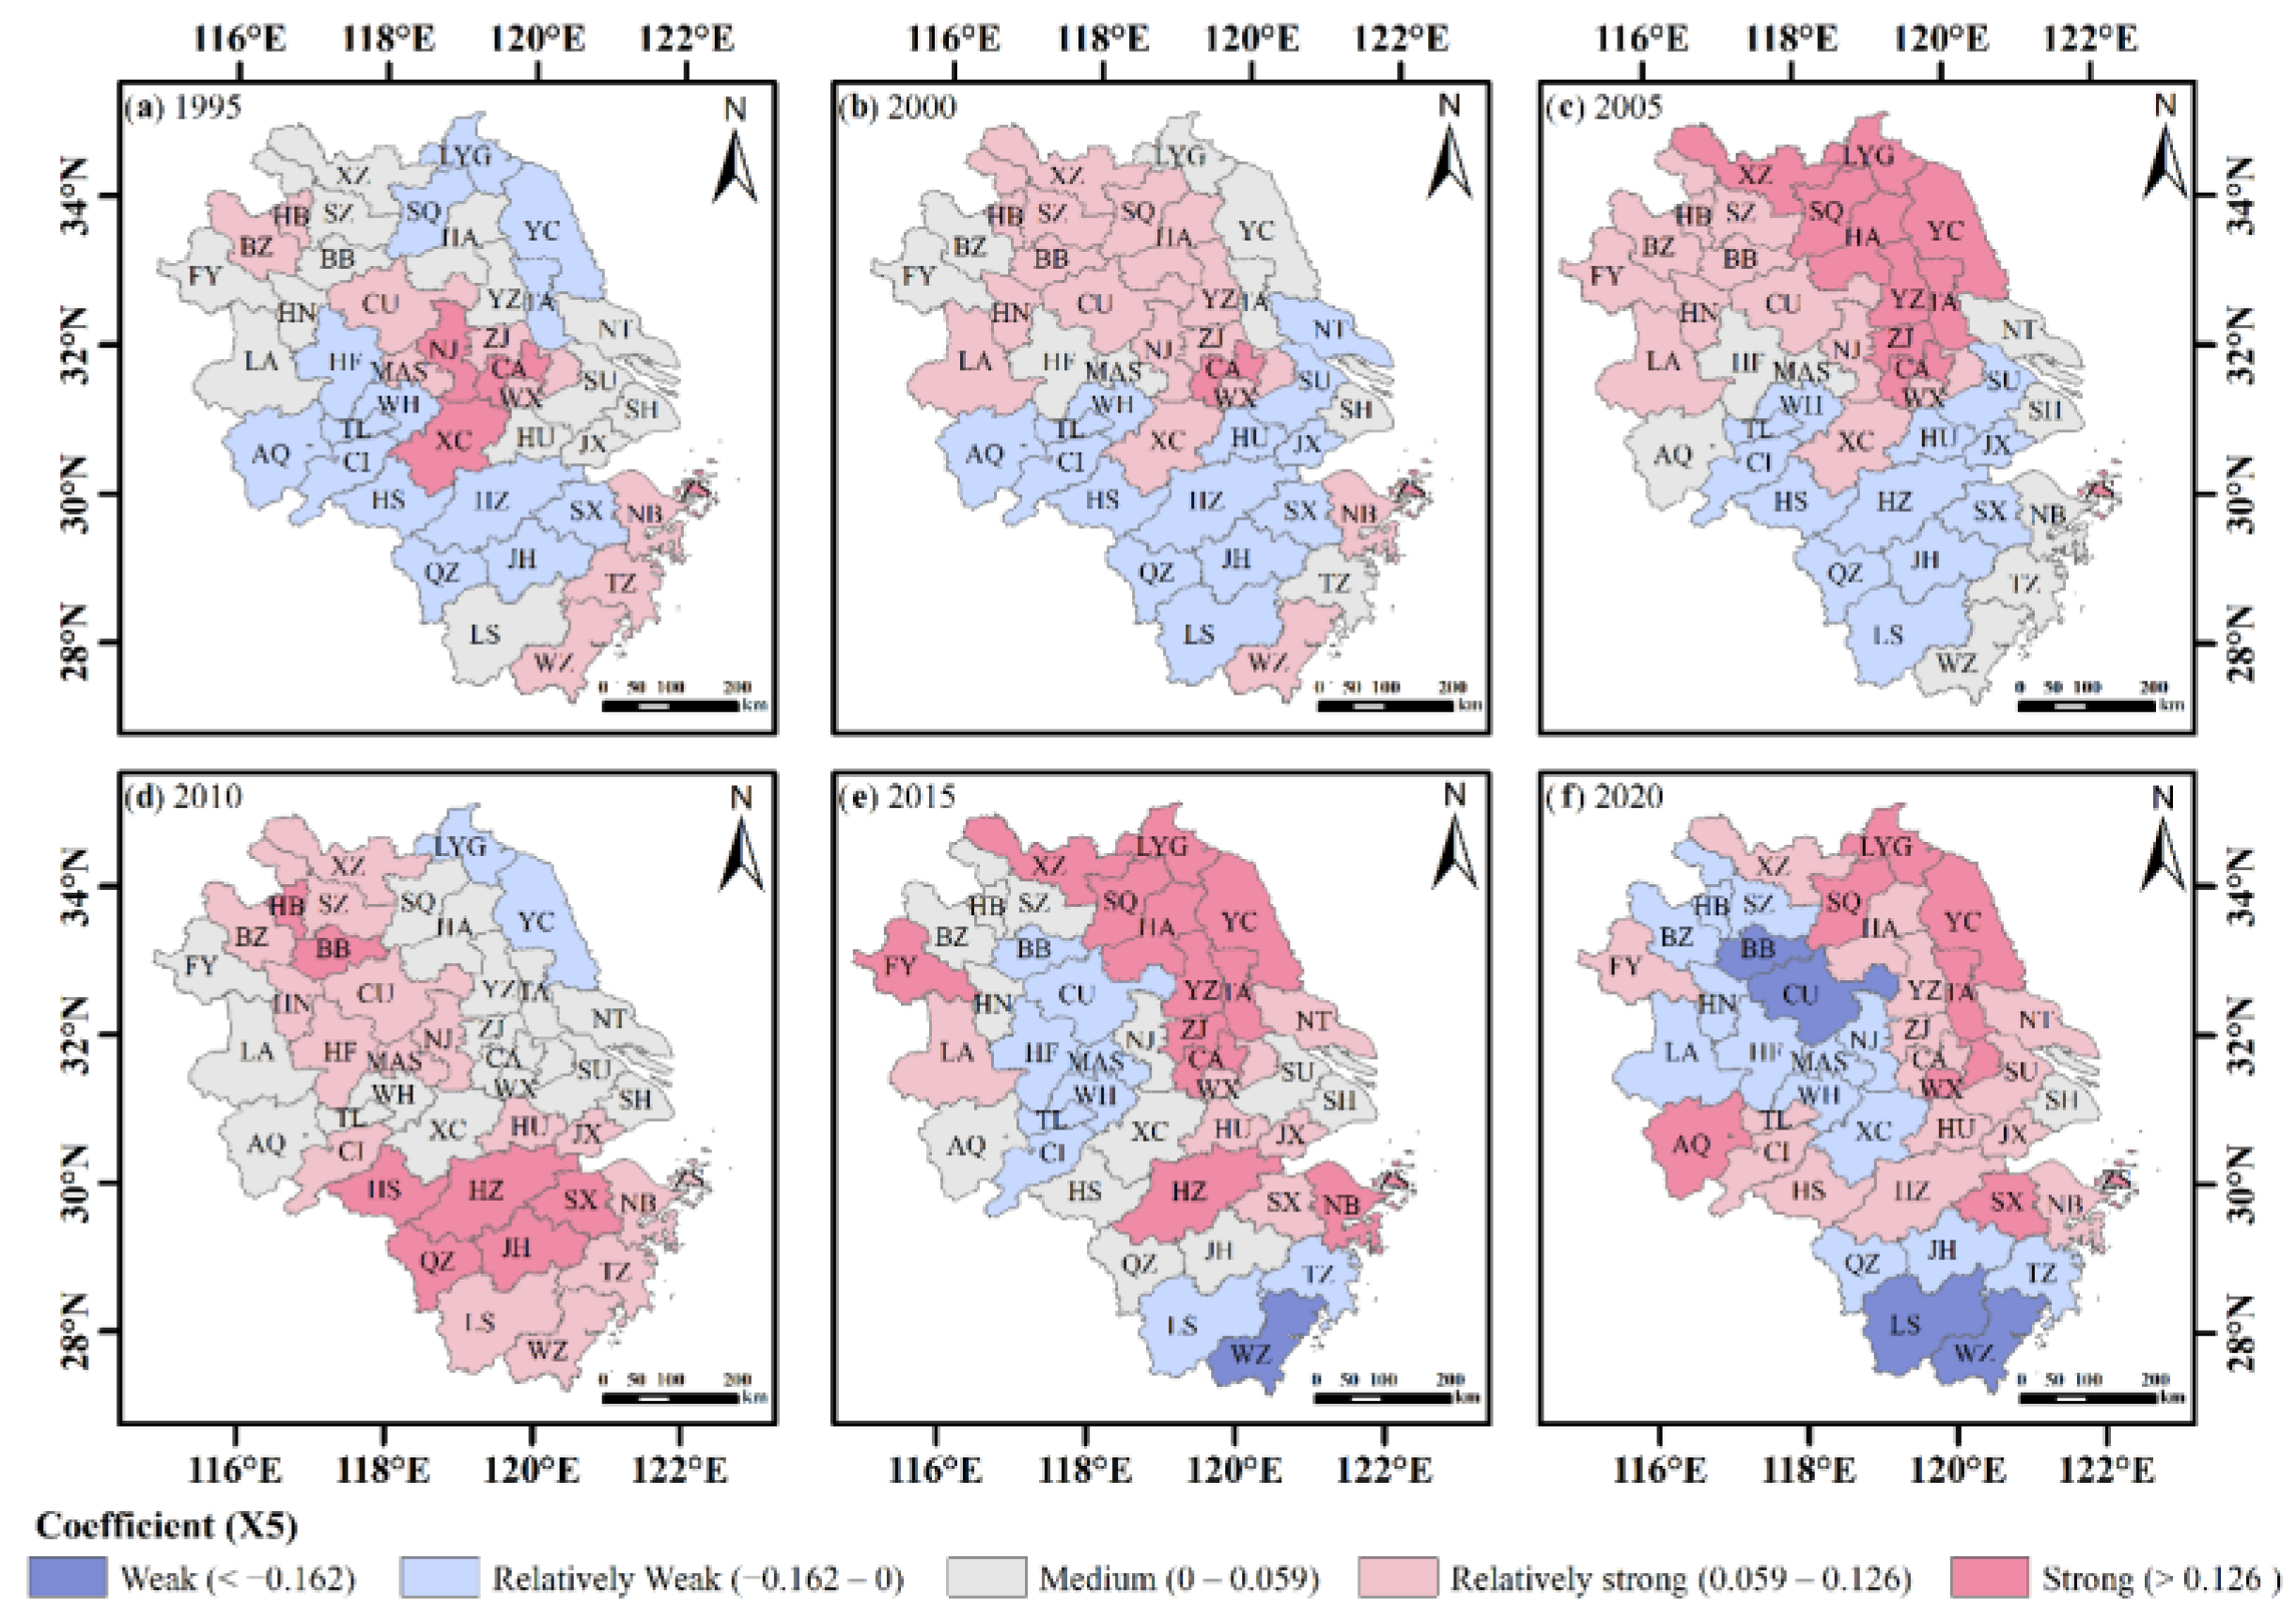
3.4. Analysis of the Influencing Forces of Land Pressure in the YRDR

Using the GTWR analysis module of ArcGIS 10.2 software created by Huang’s study [47,48,49,50], we entered the center of gravity coordinates into a geographically and chronologically weighted regression model (center of gravity-GTWR). The center of gravity-GTWR model was built with the primary goal of analyzing the spatial variation of the influencing factors on the 41 cities in the YRDR and exploring the extent of the impact. Based on the data of the impact factor indicators for the 41 cities in 1995, 2000, 2005, 2010, 2015 and 2020, we built the model and obtained the regression coefficients of the various influence factors for each city over each year. There are numerous factors that influence land pressure. According to the study of Li et al., marketization, industrialization, industrial upgrading, spatial connectedness and technical innovation are significant factors impacting the high-quality utilization of land resources [51]. Punzo et al. argued that the main factors influencing land use are demographic characteristics, economic structure and institutional factors [52]. Zhang et al. determined that urban spatial expansion, population concentration, economic growth and residential consumption all have a substantial impact on the Yangtze River Delta urban agglomeration’s water–energy-food pressure system [53]. We chose indicators from five aspects, including urban spatial expansion, population status, economic development scale, resident consumption level and ecological status, based on the relevant research and data availability [27]. To avoid the influence of multicollinearity on the model, we used the correlation analysis method to test the multicollinearity of each explanatory variable and finally identified ten influencing factors (Table 4).
The variance inflation factors (VIF) is a method to detect the multicollinearity among the independent variables and the results showed that the VIF of these ten influencing factors were all within 10 [54] (Table A2). Therefore, the multicollinearity has no substantial influence on these ten influencing factors, allowing for a simultaneous model-fitting investigation [55,56].
To further demonstrate the high fit of the model, considering both the temporal and spatial non-smooth characteristics, a comparison with six models (the center of gravity-GTWR, center of gravity-GWR, GTWR, GWR, TWR and OLS) in R2 was selected as an auxiliary validation of the center of gravity-GTWR model. The auxiliary validation results in Table 5 show that R2 of the center of gravity-GTWR was 0.96. Compared to the center of gravity-GWR, GTWR, GWR, TWR and OLS, R2 was increased by 0.06, 0.02, 0.06, 0.15 and 0.25, respectively (Table 6). The R2 of the center of gravity-GTWR and GTWR models, considering the temporal and spatial non-stationary characteristics, as well as the R2 of the center of gravity-GWR and GWR models considering the spatial non-stationary characteristics, were all greater than or equal to 0.90, indicating a better fit. The R2 of these four models was greater than that of the TWR and OLS models considering only the temporal non-stationary characteristics. Therefore, when analyzing the influencing factors of land pressure in the YRDR, the center of gravity-GTWR model that comprehensively considered the spatial heterogeneity and the time dimension was more appropriate.
To prevent overfitting the model caused by too many independent variables, we progressively increased the independent variables in the gravity-GTWR model and evaluated the model’s performance by combining R2 and the AICc [57,58]. The AICc is a measure of a model performance that helps to compare the different regression models. A model with lower AICc values will fit the observed data better when considering the model complexity. The AICc is not an absolute measure of the goodness of fit but is suitable for comparing models that apply to the same dependent variable and have different explanatory variables [48]. Table 7 demonstrates that the center of gravity-GTWR model’s R2 does not always increase as the number of independent variables increases. The R2 was 0.96 when the number of the independent variables was seven, dropped to 0.95 when it was eight, rose to 0.97 when it was nine and fell to 0.96 when it was ten. The AICc of the regression model established with the ten influencing factors was much lower than the AICc of the regression model established with the nine influencing factors. According to related research [59], NDVI is more important for the study of land pressure influencing factors. Therefore, the X10 influence factor still remained.
The various cities in the YRDR had different positive and negative correlations of the X1 factor with regard to land pressure. When there was a positive connection between the influencing factor and land pressure, it suggested that the influencing factor facilitated land pressure and, when there was a negative correlation, it inhibited land pressure. The positively correlated impact range expanded from 1995 to 2005 and reached 68% of the cities in the YRDR in 2005, whereas the impact range and intensity rapidly decreased after 2005. The cities with the highest levels of negative correlation were primarily located in FY, LA and HN. From 1995 to 2005, the influence of the negative correlation was reduced. After that, it progressively increased from the northern Anhui Province to the northern Jiangsu Province (Figure A1). HS was always the center of the negative correlation and the cities with a negative correlation gradually expanded to the HS–QZ–LS–WZ concentrated contiguous area during the study period. Meanwhile, a progressive expansion of the high-value region of the positive correlation impact of the X2 factor formed a dispersed distribution in the entirety of the Anhui Province, except for HS and XC (Figure A2).
From LA and WH in 2000, the negative correlation of the X3 factor increasingly covered all the cities in the northeast and southwest regions of the YRDR. HS, HZ, QZ, JH, SX and LS gradually shifted from a high-value area of positive correlation impact to a negative impact. In the end, the provinces of Anhui and SH accounted for the majority of the high-value area of positive correlation impact changes (Figure A3). The influence of the X4 factor on land pressure is depicted in Figure A4. The X4 factor’s regression coefficients are both positive and negative, demonstrating that higher levels of urbanization in certain cities have a catalytic influence on rising land pressure while other cities experience the reverse inhibitory effect. In comparison to the X3 factor, the X4 factor had a stronger positive association with land pressure. The majority of the cities in the YRDR in 1995 demonstrated a positive correlation between the X4 factor and land pressure, and the cities demonstrating a negative correlation were primarily centered in the eastern part of the region, demonstrating a weak to strong spatial pattern. The YRDR’s high southeast and the northwest spatial pattern was the result of the high-value area of the positive correlation impact from 1995 to 2020, steadily enlarging from a dispersed distribution. The influence of the X4 factor on land pressure progressively switched to a stronger positive correlation in the majority of the cities in the provinces of Anhui and Zhejiang over time and LYG, SQ, HA, YC, TA, ZJ, CA, WX and SU also gradually established a broad region of negative correlation.
For each city in the YRDR, Figure A5 shows the distribution of the X5 factor regression coefficients for the various years. The distribution of the negatively correlated cities shifted from a belt-like agglomeration distribution in the southeast and northwest regions in 1995 to a piecewise agglomeration distribution in the northeast and south regions in 2020, indicating that different cities in the YRDR have different correlations between industrial structure and land pressure. This relationship was considered to be highly volatile. Some cities had positive regression coefficients for the industrial structure influencing factors. LYG, SQ, YC and TA sustained strong positive regression coefficients in 2005, 2015 and 2020, showing that excessive industrial structure will worsen the growth in land pressure. Some cities had negative industrial structure influencing factor regression coefficients, which means that increasing the proportion of secondary industry will decrease the city’s land pressure. WZ was a typical city that restructured its industrial structure to relieve the pressure on its land. The regional variance in the YRDR for the X6 factor’s impact on land pressure grew, the positive correlation suggested that an increase in the actual foreign capital had a catalytic influence on the growth of land pressure, whilst the contrary reflected an inhibitory effect (Figure A6). Geographically, the YRDR ‘s eastern and western regions were negatively correlated, whereas the middle portion was positively correlated. Up to 2020, 17 cities exhibited negative correlations between the X6 factor and land pressure, indicating a favorable interaction between the X6 factor and land pressure.
With a strong spatial clustering and a strengthening trend of both positive and negative influences over time, the influence of the X7 factor on land pressure in the YRDR changed from a positive correlation in 1995 to a spatial pattern of “positive correlation in the north and south and negative correlation in the center” in 2020 (Figure A7). The fact that X7 factors in certain cities progressively shifted from positive to negative suggests that the improvement in the urban-rural income ratio had a beneficial impact on the alleviation of land pressure. Cities with a positive X8 factor influence showed a falling trend, whereas cities with a negative X8 factor influence showed a rising trend (Figure A8). In 1995, the X8 factor had a substantial impact on 39% of the cities in the YRDR, showing that social consumption had a larger range of influence on land pressure in the YRDR at this stage. HS, CI, TL, LS and WZ were the cities that were most favorably affected by the X8 factor from 2010–2020. The X8 factor shifted from a negative to a positive influence in CA, WX, AQ, LS and WZ, but had the opposite effect in BB, BZ, HB, HN, CU, HF, SX, TZ and ZS.
The area with the highest positive impact of the X9 factor on land pressure had a triangular diffusion pattern with SH as the center and achieved the maximum growth area in 2020. In contrast, the area with the most negative impact progressively moved from central Jiangsu to northern Anhui (Figure A9). Among all the factors, the X10 factor had the widest range of variation in the intensity of the effect. After 1995, the region with the highest positive effect intensity steadily diminished and moved to the middle of the YRDR. The intensity of the X10 factor’s negative influence on WZ and AQ was significant from 1995 to 2010 but changed in FY and LYG after 2010 (Figure A10).

4. Discussion

4.1. Analysis of the Transmission Effects

The geographic transmission of land pressure in the YRDR refers to the interchange of land pressure through direct or indirect channels between various urban nodes, creating a cross-regional spatial network structure. The connection of land pressure has transcended geographical boundaries and the spatial correlation of land pressure exists not only between nearby cities but also between cities that are not next to each other [60]. With the Jiangsu, Zhejiang and Anhui provinces, Shanghai has a significant central position in the SCN of land pressure for the transmission of land pressure. The land pressure transmission is mainly based on the cities in the province such as the “southern Jiangsu–northern Jiangsu”, “eastern Zhejiang–western Zhejiang” and “southern Anhui–northern Anhui”. This finding was consistent with the study of the industrial transfer in the YRDR by Jiang et al. [61]. With a propensity to transmit from the central cities to the periphery and the trait of cascade transmission, the land pressure was transmitted from developed cities to less developed cities. The study of Zhang et al. [62] also demonstrated that the YRDR’s core cities increasingly shift their conventional processing manufacturing businesses to the periphery cities to create space for industrial upgrades in the core cities. According to the study of Zhu et al. [63], Shanghai and Zhejiang had an excessive internal arable land pressure index due to a large amount of occupied arable land. However, after external pressure on arable land was introduced, the combined arable land pressure index in the economically developed regions decreased significantly. These studies demonstrate that while land pressure is rising in the YRDR’s central region, it is also transmitted to nearby cities through the transfer of industry and the pressure from agricultural land. The number of receiving relationships in SH, NJ, SU and WX was significantly higher than that in other regions. This difference was primarily attributed to these regions’ superior development conditions, better infrastructure and high economic development levels, which result in stronger resource allocation and concentration factors. The number of the generated relationships for the 41 cities in the six stages was maintained around ten. Combining the results of a low network density, high network connectedness, low network hierarchy, high network efficiency and low network relationship number shows that land pressure transmission and cross-regional movement of superior urban resources result in a relatively stable and balanced development of the YRDR ‘s spatial association structure. There is still space available to strengthen the intra-regional cooperation in the reorganization of resources, energy, etc. for the production and life in the YRDR. This further indicates that each city should have better regional coordination and an overall transmission level of land pressure.
With Shanghai as the center, the Nanjing, Hangzhou, Su-Xi-Chang and Hefei Economic Zones also benefit from favorable geographic regions and develop into agglomeration areas where the transmission effect occurs. This finding agrees with the study of Lin [64]. These cities, which are comparatively at the center of the network, have clear capabilities for communication, control and influence within the SCN of land pressure. They can also quickly receive more economic, demographic and other resource elements from other cities and have more direct connections with those cities. As a result, we should fully exploit the demonstration and driving role of these transmission effect agglomeration areas, increase the land-carrying potential of the edge cities represented by HB, LS, BZ, WZ, ZS, CI and TZ and promote the rational spatial allocation of economic, social, resource and ecological factors. Meanwhile, the sustainable development of land resources under the integration of the YRDR is further planned by strengthening the collaboration between the resources and technology of the nearby cities and improving the geographical connection between the regions. Centrality demonstrates non-equilibrium in the geographical distribution, which is consistent with Shi’s findings [65]. The cities in the eastern YRDR with established economies and greater resource endowments, such as SH, SU, NT, TA, ZJ, CA, WX, HU and JX, have remained in the primary beneficial block of resource absorption and reception. The cities in the province of Zhejiang have remained in the net spillover block and exhibit resource spillover effects. Other cities in the bidirectional spillover block and agent blocks act as a “bridge” in the SCN of land pressure, facilitating the flow of the resource factors and the exchanges, as well as cooperation between the cities. The transmission effect of each plate is substantial and largely steady. Therefore, we should focus on monitoring the eastern cities in the YRDR with Shanghai as the core. Regarding the transmission of land pressure for these source cities based on the transmission relationship and characteristics of land pressure, we should enhance the systemic and holistic nature of urban land use and realize the linkage development of land use in the urban clusters in the YRDR.

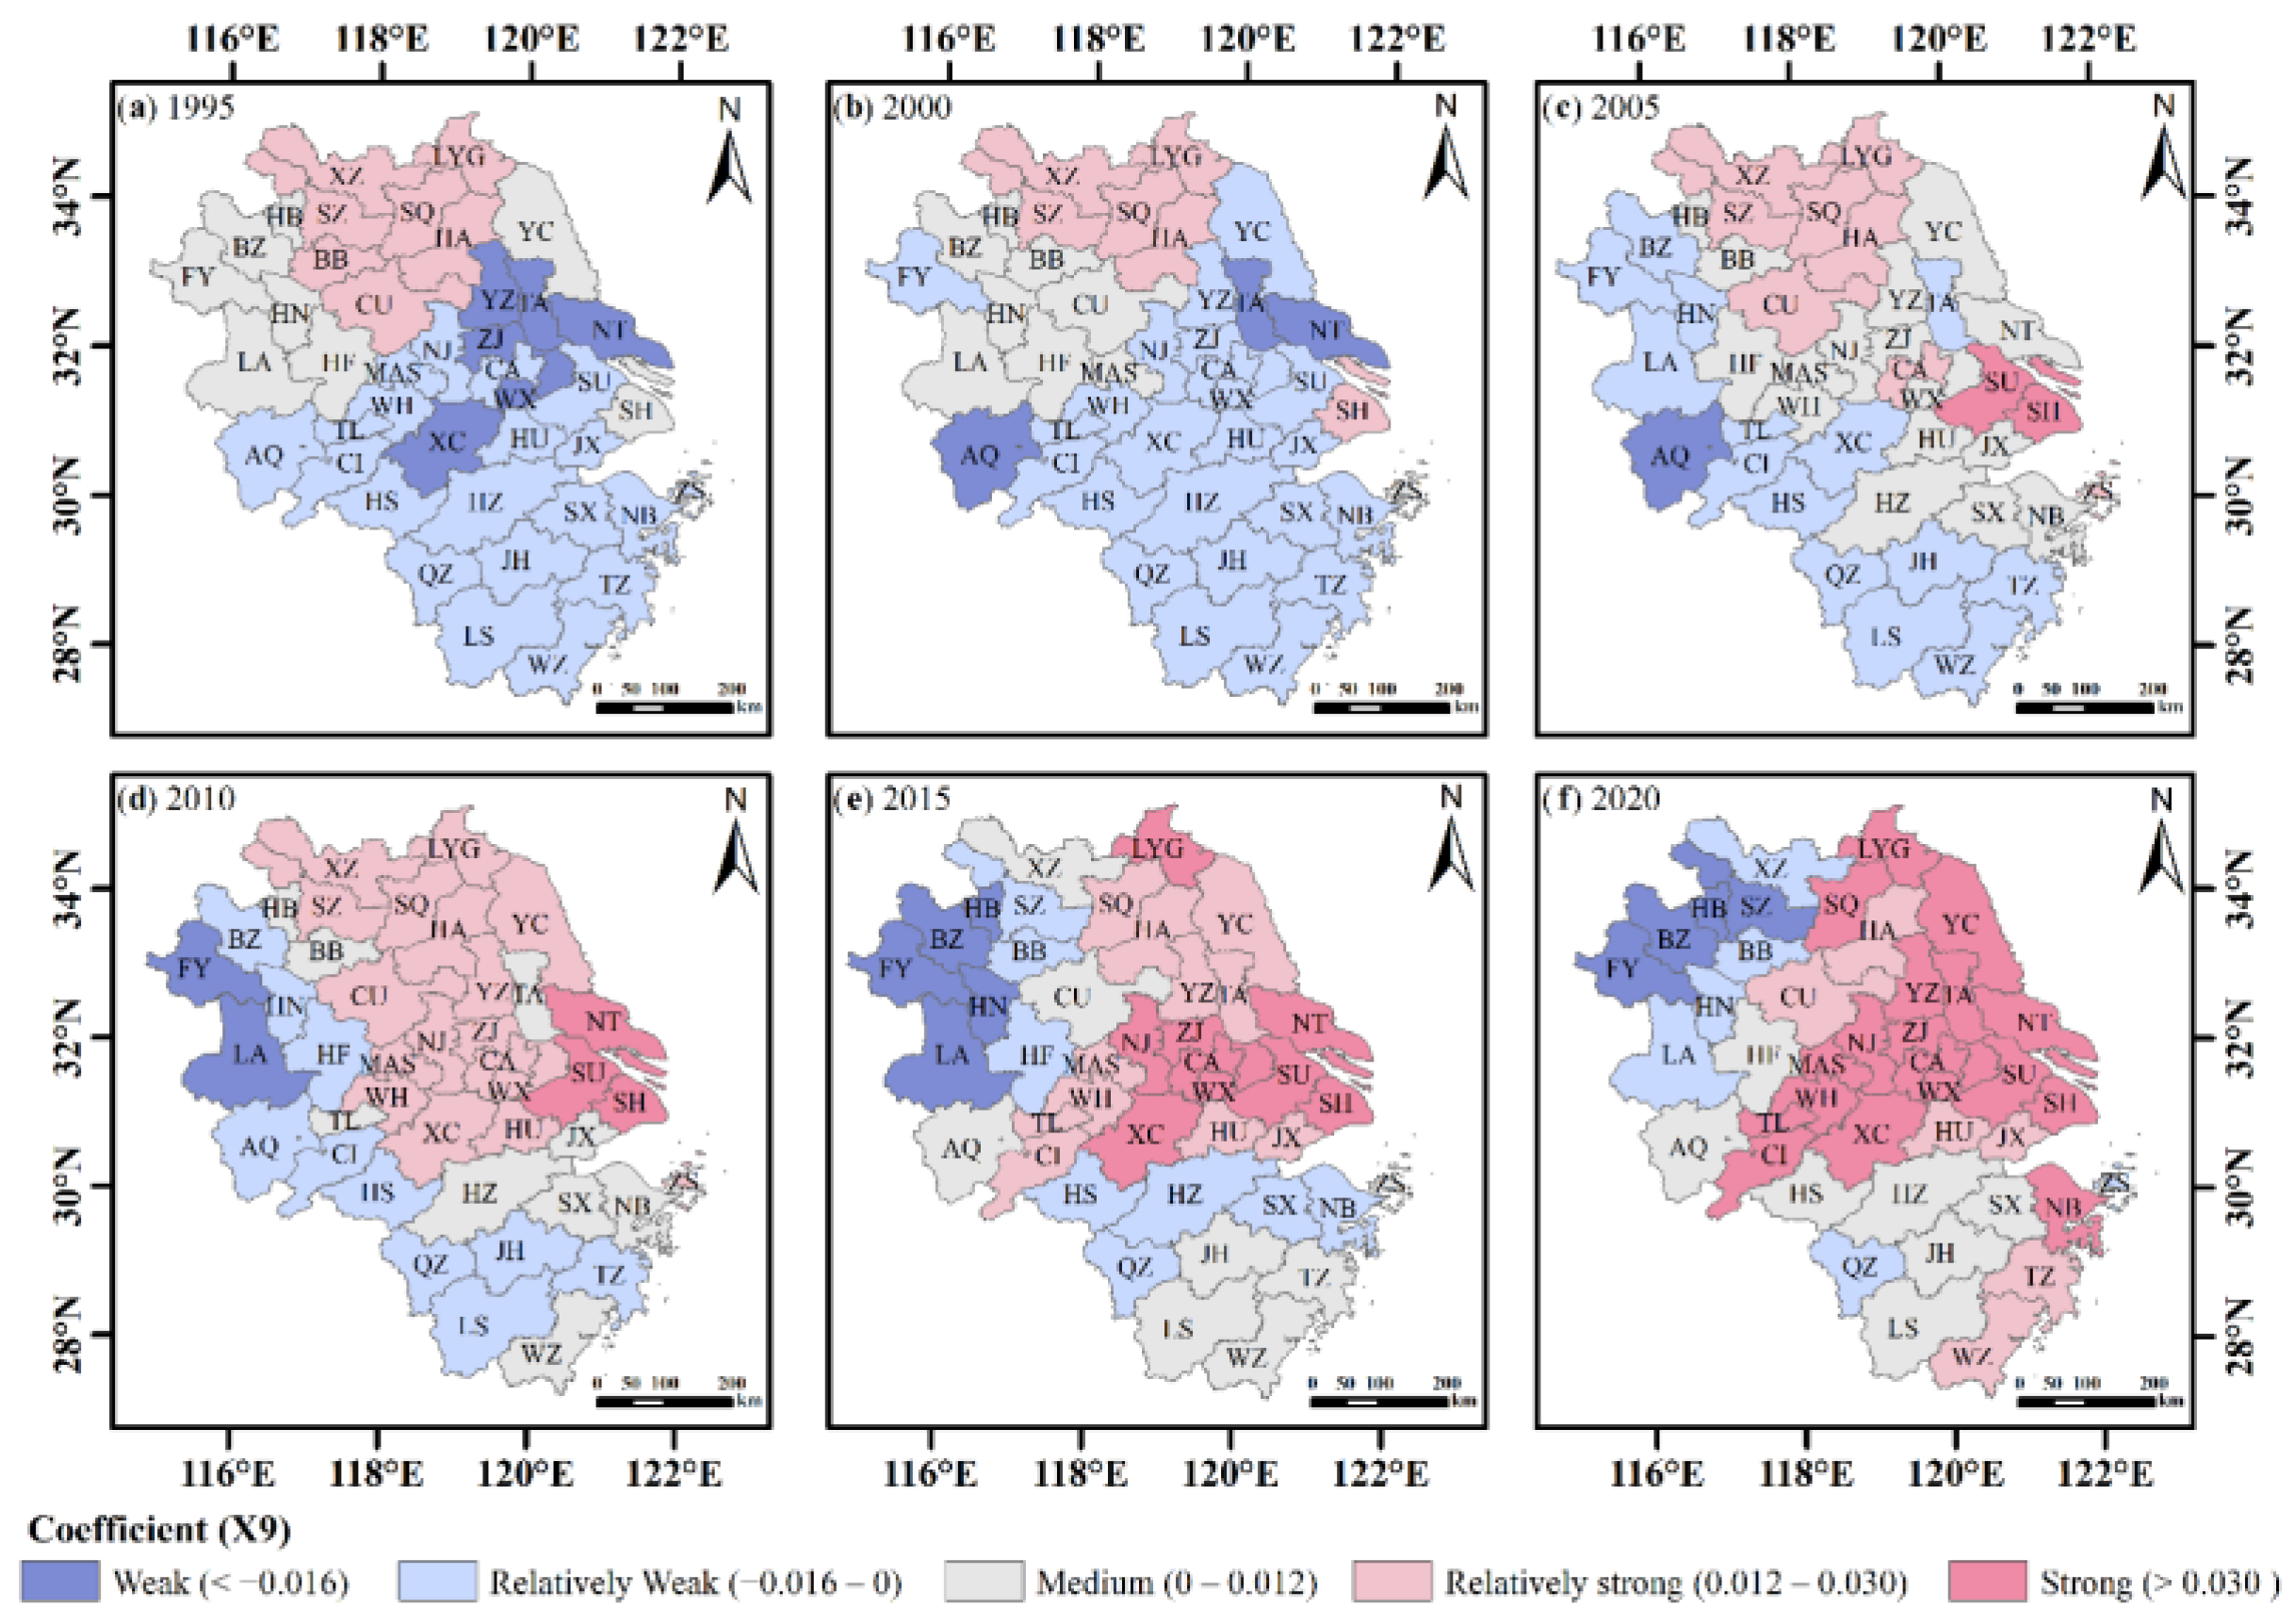
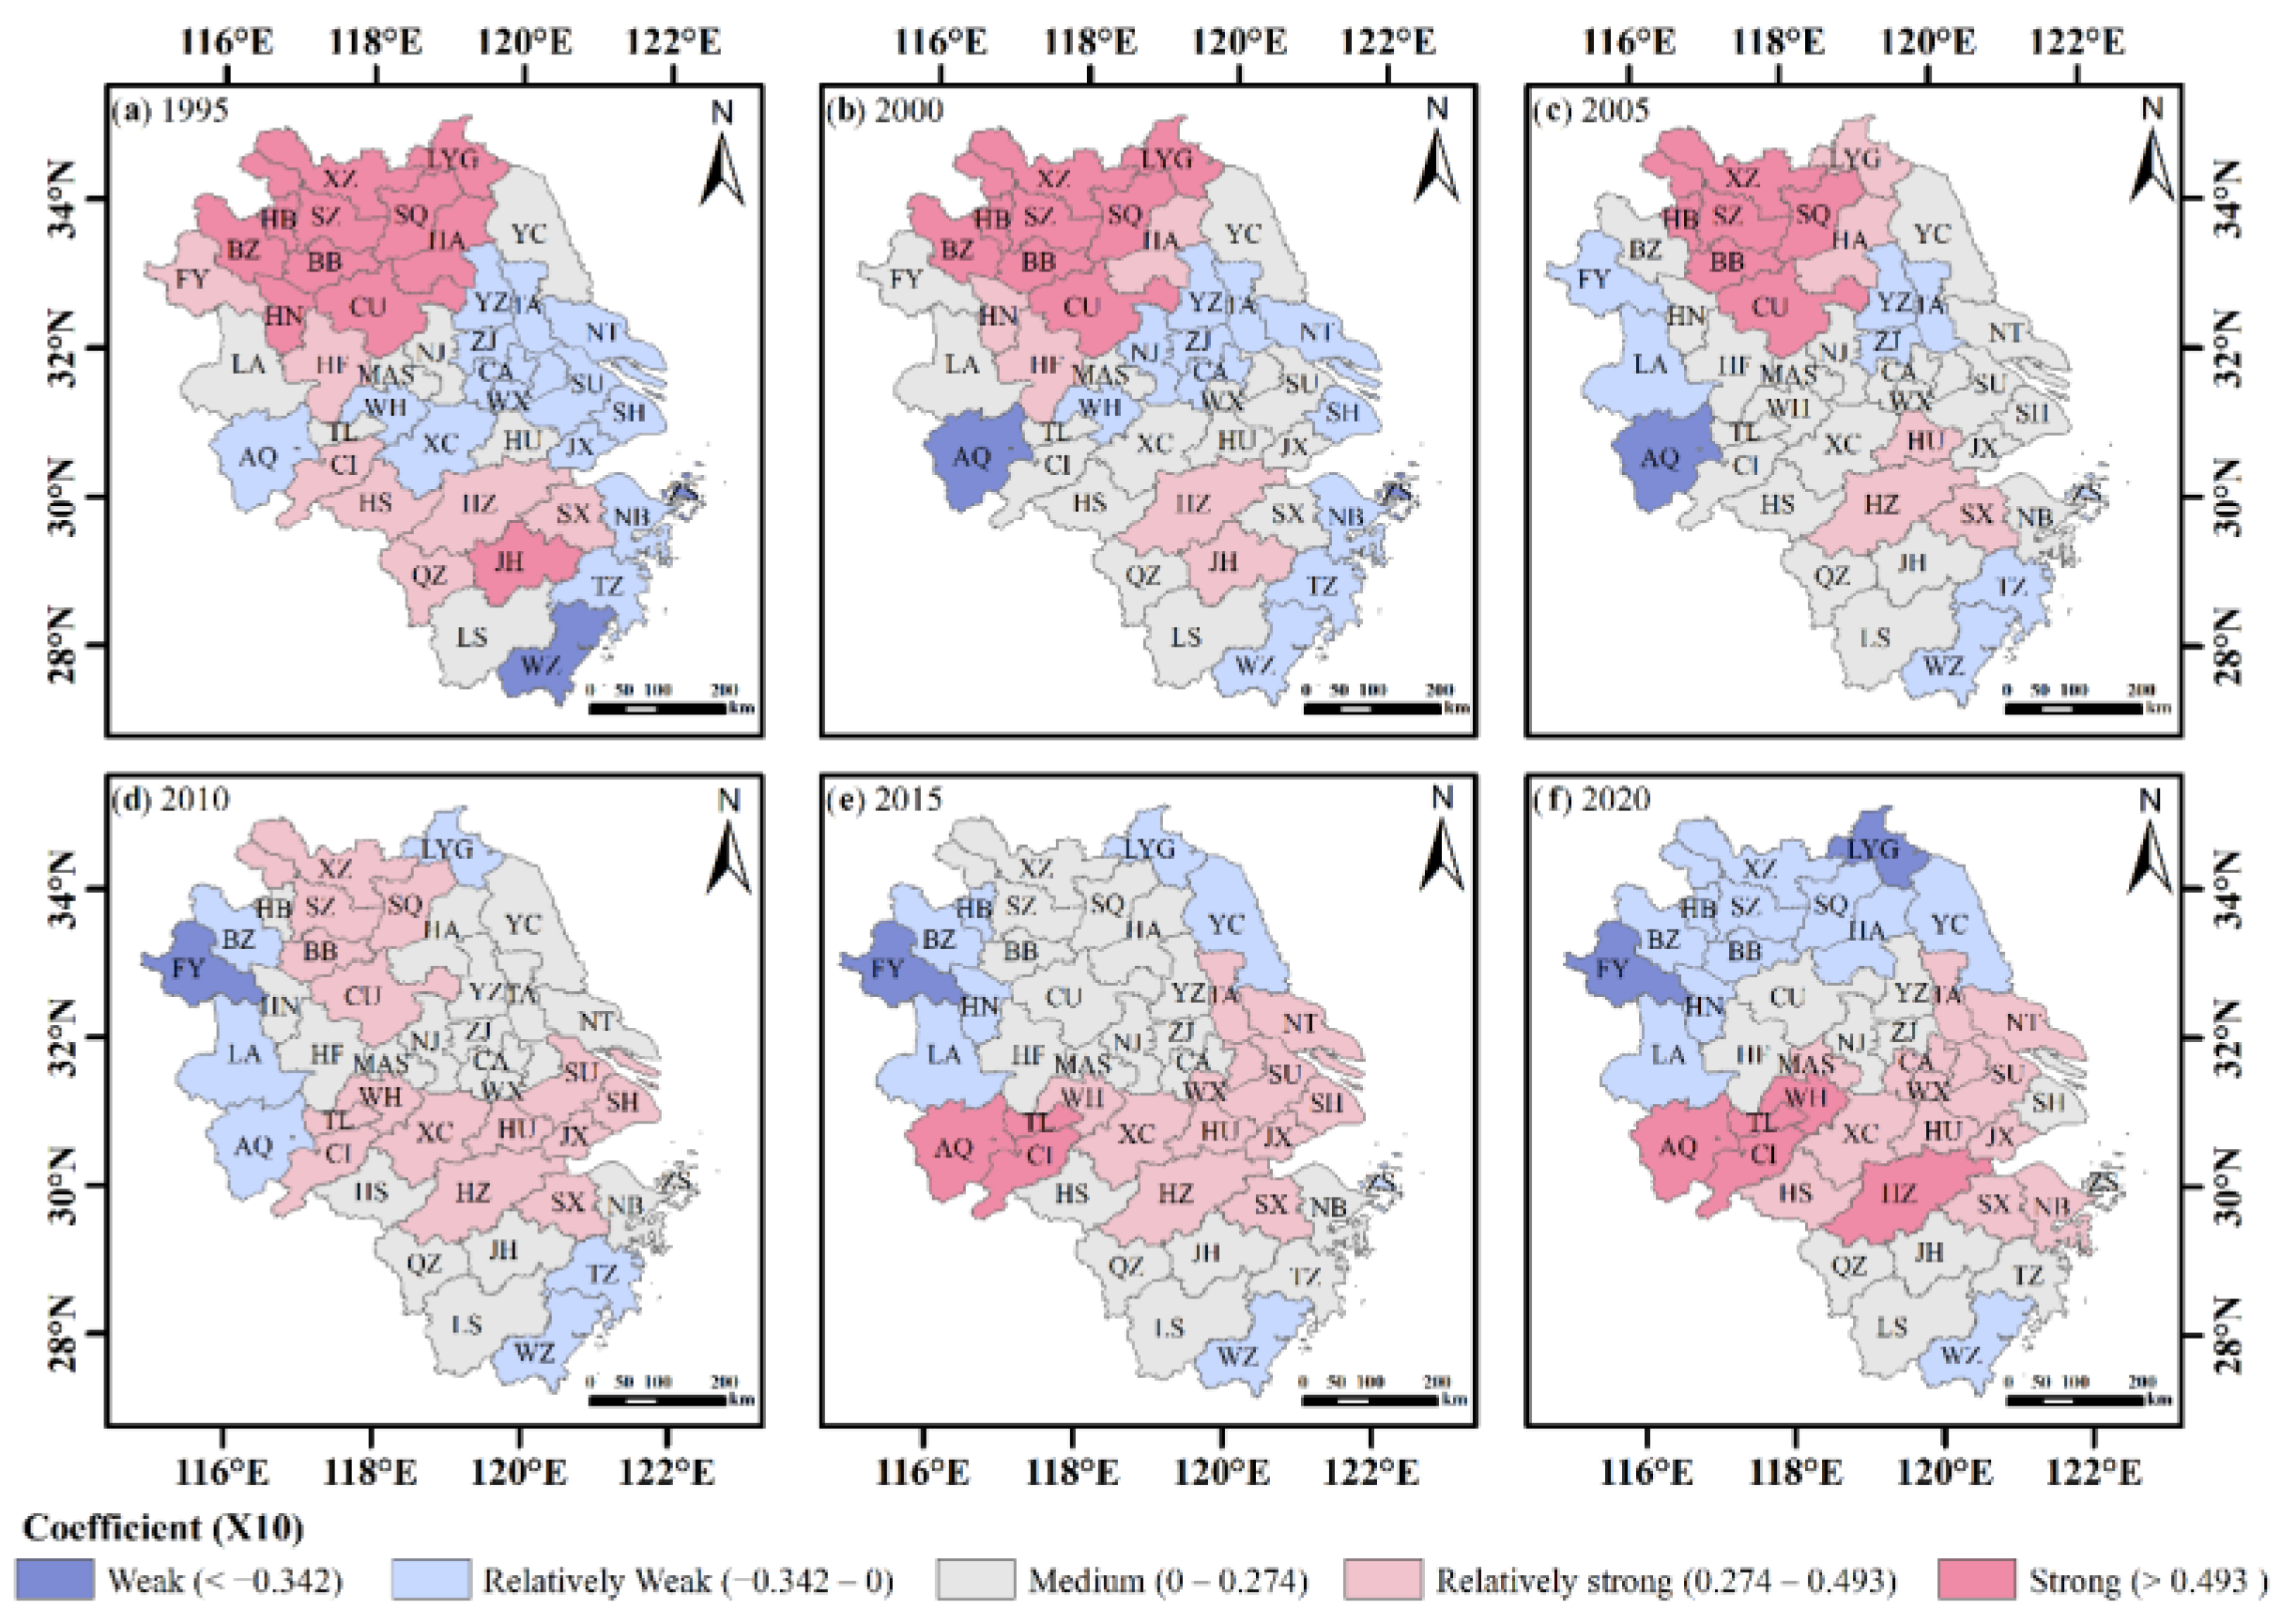
4.2. Spatial and Temporal Differences in Driving Forces

The YRDR has distinct geographical and chronological disparities in the influencing factors of land pressure as a result of unequal regional development and there are variations in the influencing factors’ strength and direction effects across the different regions [66]. Local decision-makers can benefit from an understanding of how land pressure variables differ from city to city when planning and regulating land use [52]. Similar to the findings of Ma et al. [67], Wu et al. [68] and Yang et al. [59] on arable land pressure, resource and environmental carrying capacity and land carrying capacity, respectively, the YRDR’s land pressure is strongly influenced by the land use structure, population urbanization, urban-rural income ratio and normalized vegetation index. The correlation between the urban development intensity and land pressure shifts from primarily positive to primarily negative, whilst the carbon emission intensity does the reverse in the YRDR. While the total population factor and land pressure in the YRDR have decreased from uniform positive correlations to approximately 60.9% of cities, the connection between land use structure and land pressure has been primarily positive. Land pressure and the population urbanization rate are primarily positively correlated. However, the number of cities with negative correlations tends to decrease first and then increase.
The industrial structure’s balance of the positive and negative correlations is essentially intact, but both the intensity of the positive and negative correlations has increased. The connection between external development, urban-rural income ratio, social consumption and land pressure is primarily favorable, although the number of cities with negative relationships is steadily growing. The expansion of the urban development intensity along with the rapid regional economic growth has led to a continual shift in the direction of intensification in the use of urban land resources, which is beneficial for reducing land pressure [69]. The cities in the Anhui Province should fairly adjust their land use structures since this will increase their capacity for regional sustainable development and decrease land pressure. There is a need to better optimize the spatial distribution of the urban population and to direct urban population diversion through social security and policies since the total population contributes to land pressure. Although population urbanization contributes to an increase in land pressure to a certain extent, it also focuses more on enhancing the efficiency of land resource usage within the confines of limited land resources, which helps to relieve land pressure [70]. In contrast to the northwestern and southwestern parts of the YRDR, which have lower levels and a lower quality of population urbanization and more careless use of land resources, the northeastern and central parts of the region focus more on the pattern of economical and intensive use of land resources in the process of rapid urbanization, which helps to relieve land pressure.
An unreasonably industrial structure will strain the available land and will not support the sustainable development of local urban land resources [71]. In order to further accomplish the transition from sloppy speed growth to an intense growth mode with coordinated development of efficiency and speed, it is still important to continually improve and restructure the industrial structure. Increased external development levels can enhance money, technology and other variables that promote the development of land resources, improving the level of sustainable development of urban land and reducing land pressure [72]. The increase in land pressure can be effectively prevented by reducing the gap between urban and rural areas, consistently promoting the equalization of the public service capacity between urban and rural areas and optimizing the allocation pattern of cultural, medical and educational resources in urban and rural areas. In economically less developed countries, social consumption levels are growing, leading to higher resource consumption and increased land pressure. In economically developed regions, the contribution of social consumption to land pressure is declining. The YRDR’s key areas are gradually being affected by both the influencing factors of carbon emission intensity and NDVI, so more funding should be apportioned for environmental treatment and ecological protection as well as the development of green and ecological industries.

4.3. Innovations and Limitations

Research on the transmission effects of land pressure in the YRDR is currently scarce. Using a modified gravity model, this study identified the SCN of land pressure in the YRDR in 1995, 2000, 2005, 2010, 2015 and 2020. We also examined the overall network characteristics, the individual network characteristics and the spatial clustering characteristics of the SCN of land pressure and investigated the transmission effects of land pressure among the cities as an exploratory addition to the research on land pressure transmission in the region. Furthermore, this study built a center of gravity-GTWR model to interpret the influencing factors of land pressure in the YRDR over 25 years. This model revealed the spatial and temporal differences in the influencing factors of cities at the different development stages, and this provided some reference for promoting the sustainable use of land resources in the YRDR. Our study showed that the gravity-GTWR model can be used to analyze the factors that influence the land pressure in the YRDR. However, more research is required to determine the appropriate parameter ratios for the temporal and spatial dimensions, to maximize the model’s bandwidth and to determine the best time step units. The impact of additional influencing factors, such as the level of technology on land pressure and other factors, were not considered in the study of the influencing factors, which needs to be improved in future studies.

5. Conclusions

The problem of land pressure is prominent in the Yangtze River Delta region (YRDR) and the study of the land pressure transmission effects and the influencing factors provide a foundation for promoting the coordinated development of land resources. This study explored the structural characteristics of the spatial correlation network (SCN) of land pressure in the YRDR in 1995, 2000, 2005, 2010, 2015 and 2020 based on a modified gravity model to analyze the overall network characteristics and the individual network characteristics of the spatial network of land pressure in the region and to explore the role of each city in the network. From a geospatial perspective, the clustering connection and attribute roles of each city in the SCN of land pressure were further studied, revealing the transmission effects of land pressure in the YRDR. To further illuminate the regional and temporal evolution and divergence patterns of the factors influencing land pressure in the YRDR, a coupled center of gravity-GTWR model was developed. The key findings and main conclusions are as follows.
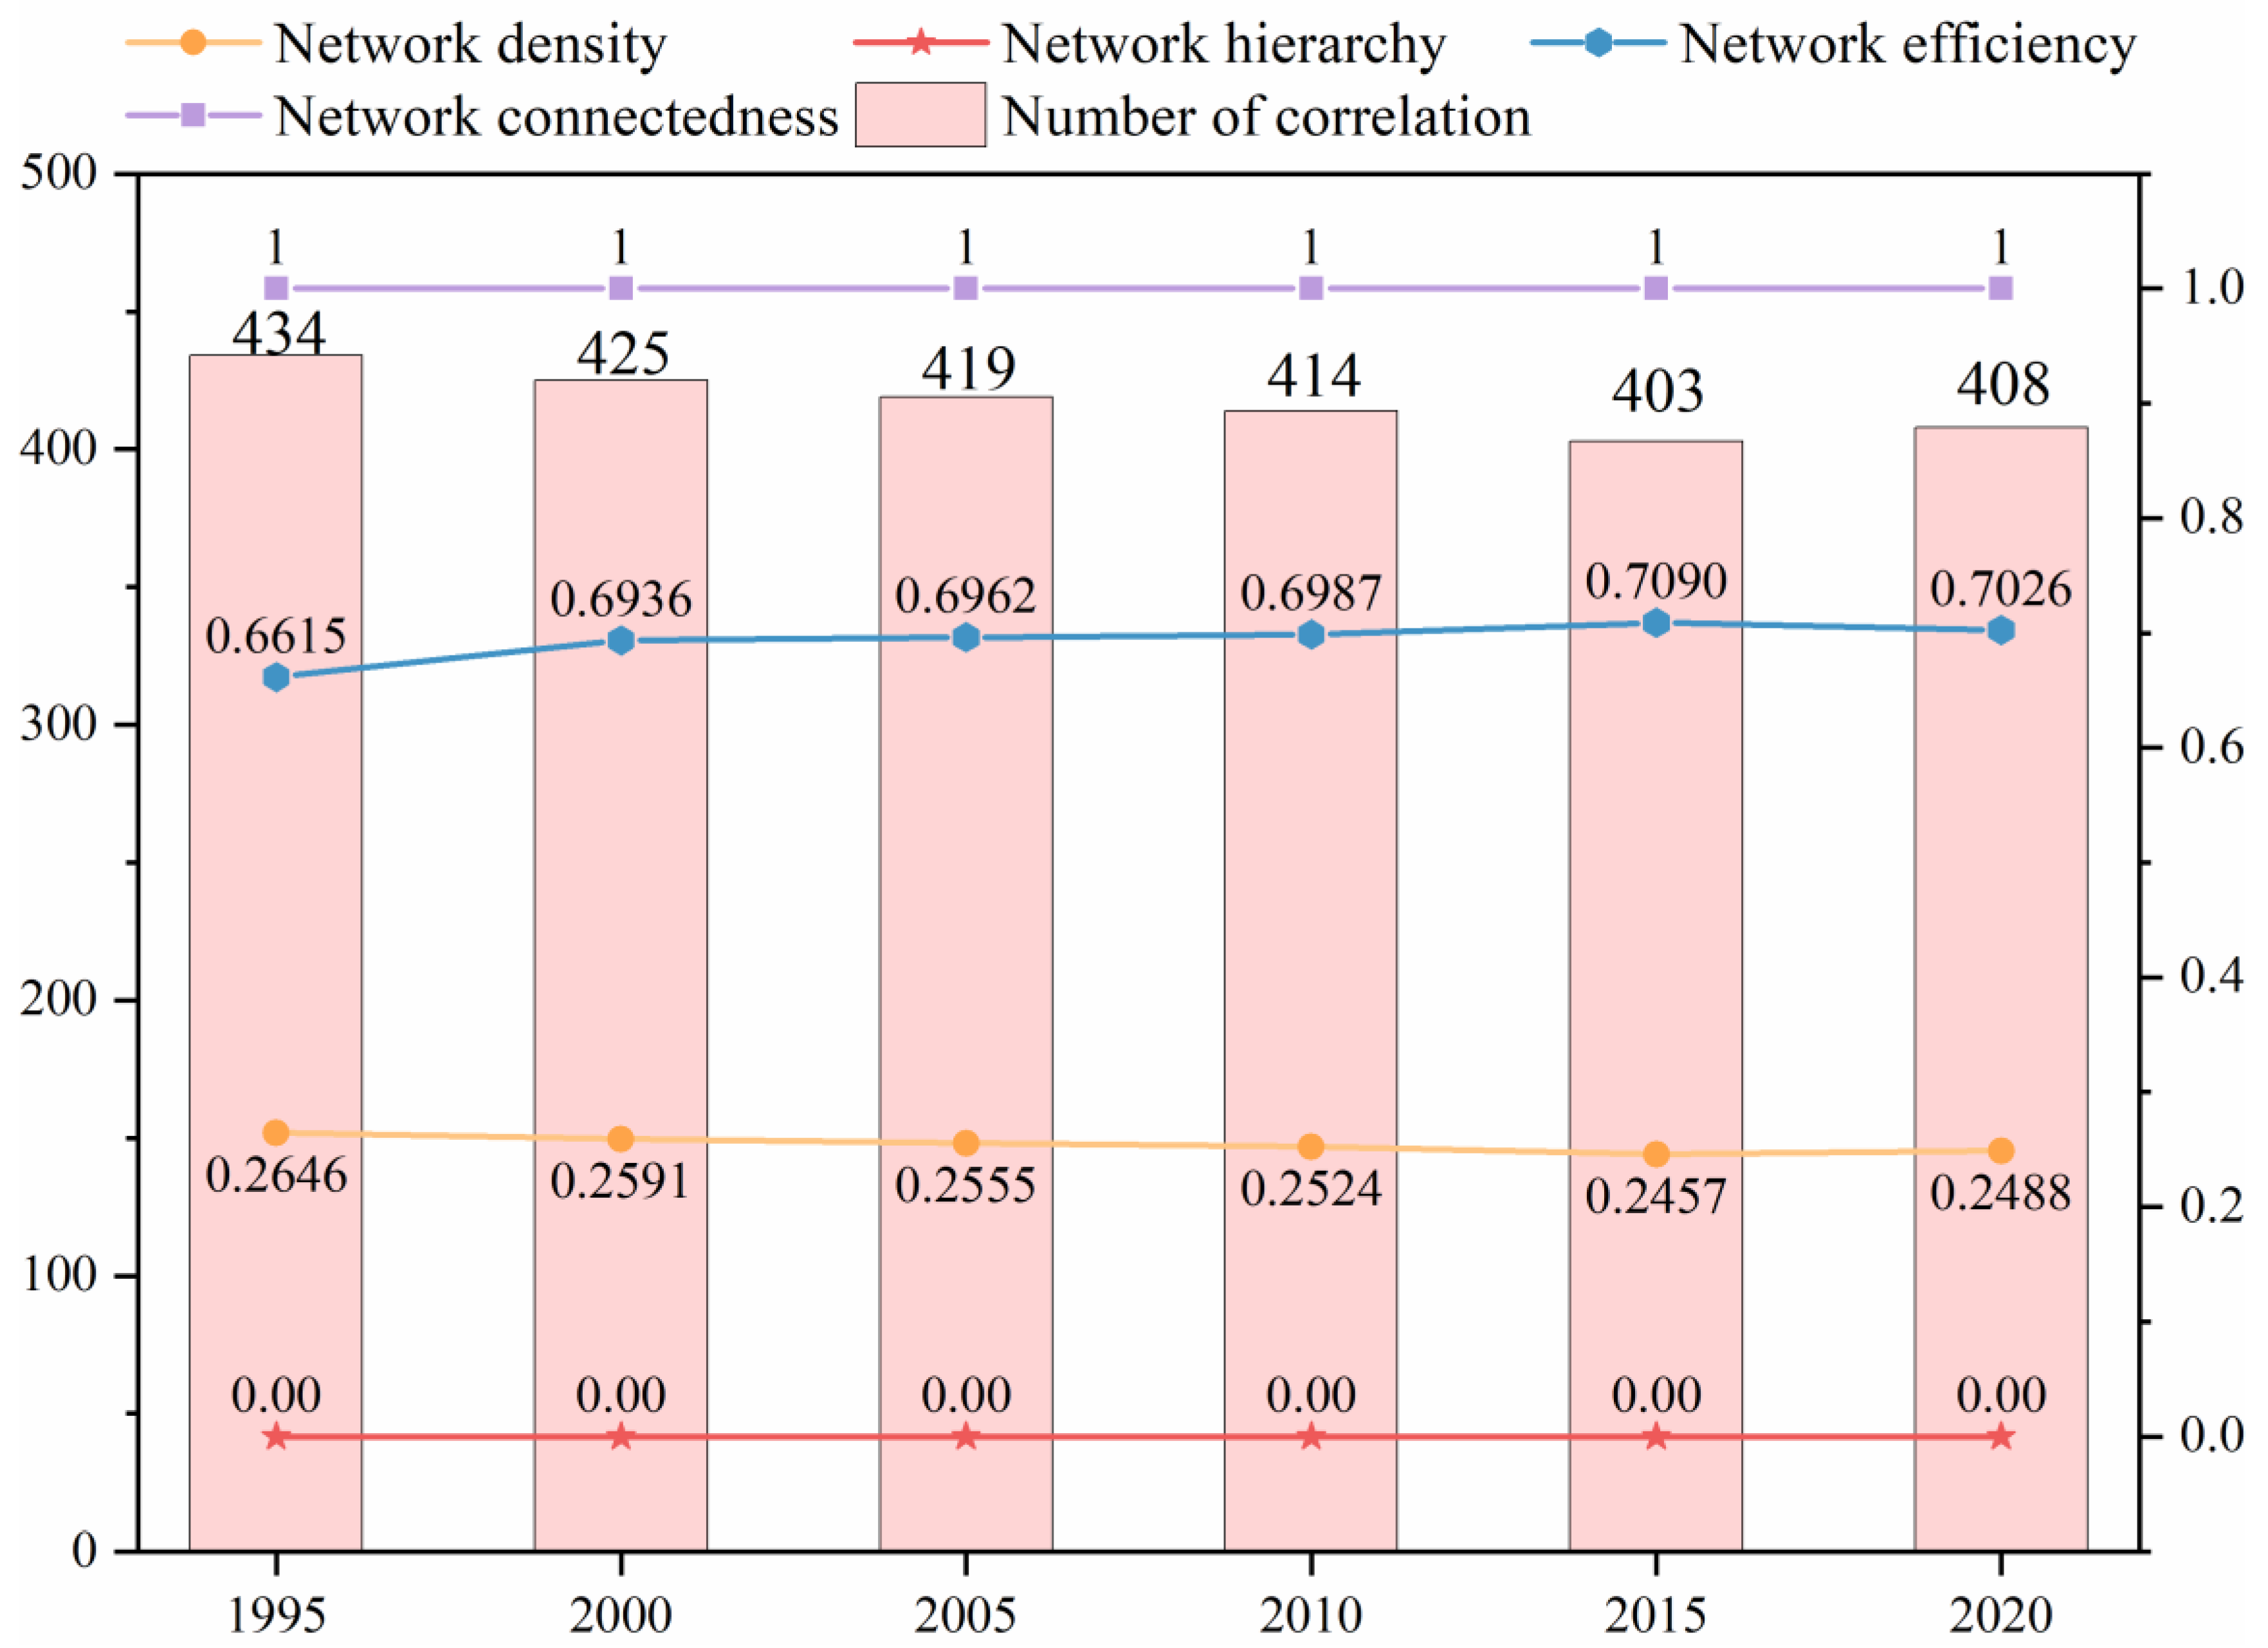
  • The network density decreased by 5.97%, the network efficiency increased by 6.21%, the network correlation remained constant at 1 and the network efficiency remained constant at 0 from 1995–2020, indicating that the spatial correlation structure of land pressure in the YRDR was relatively stable and showed a balanced development. However, the regional coordination and overall transmission level still need to be improved. It is crucial to consider the prominent bridging functions of Nanjing, Shanghai, Suzhou, Hangzhou and Changzhou when establishing a land pressure transmission mechanism to reduce land pressure from a more comprehensive regional synergy.
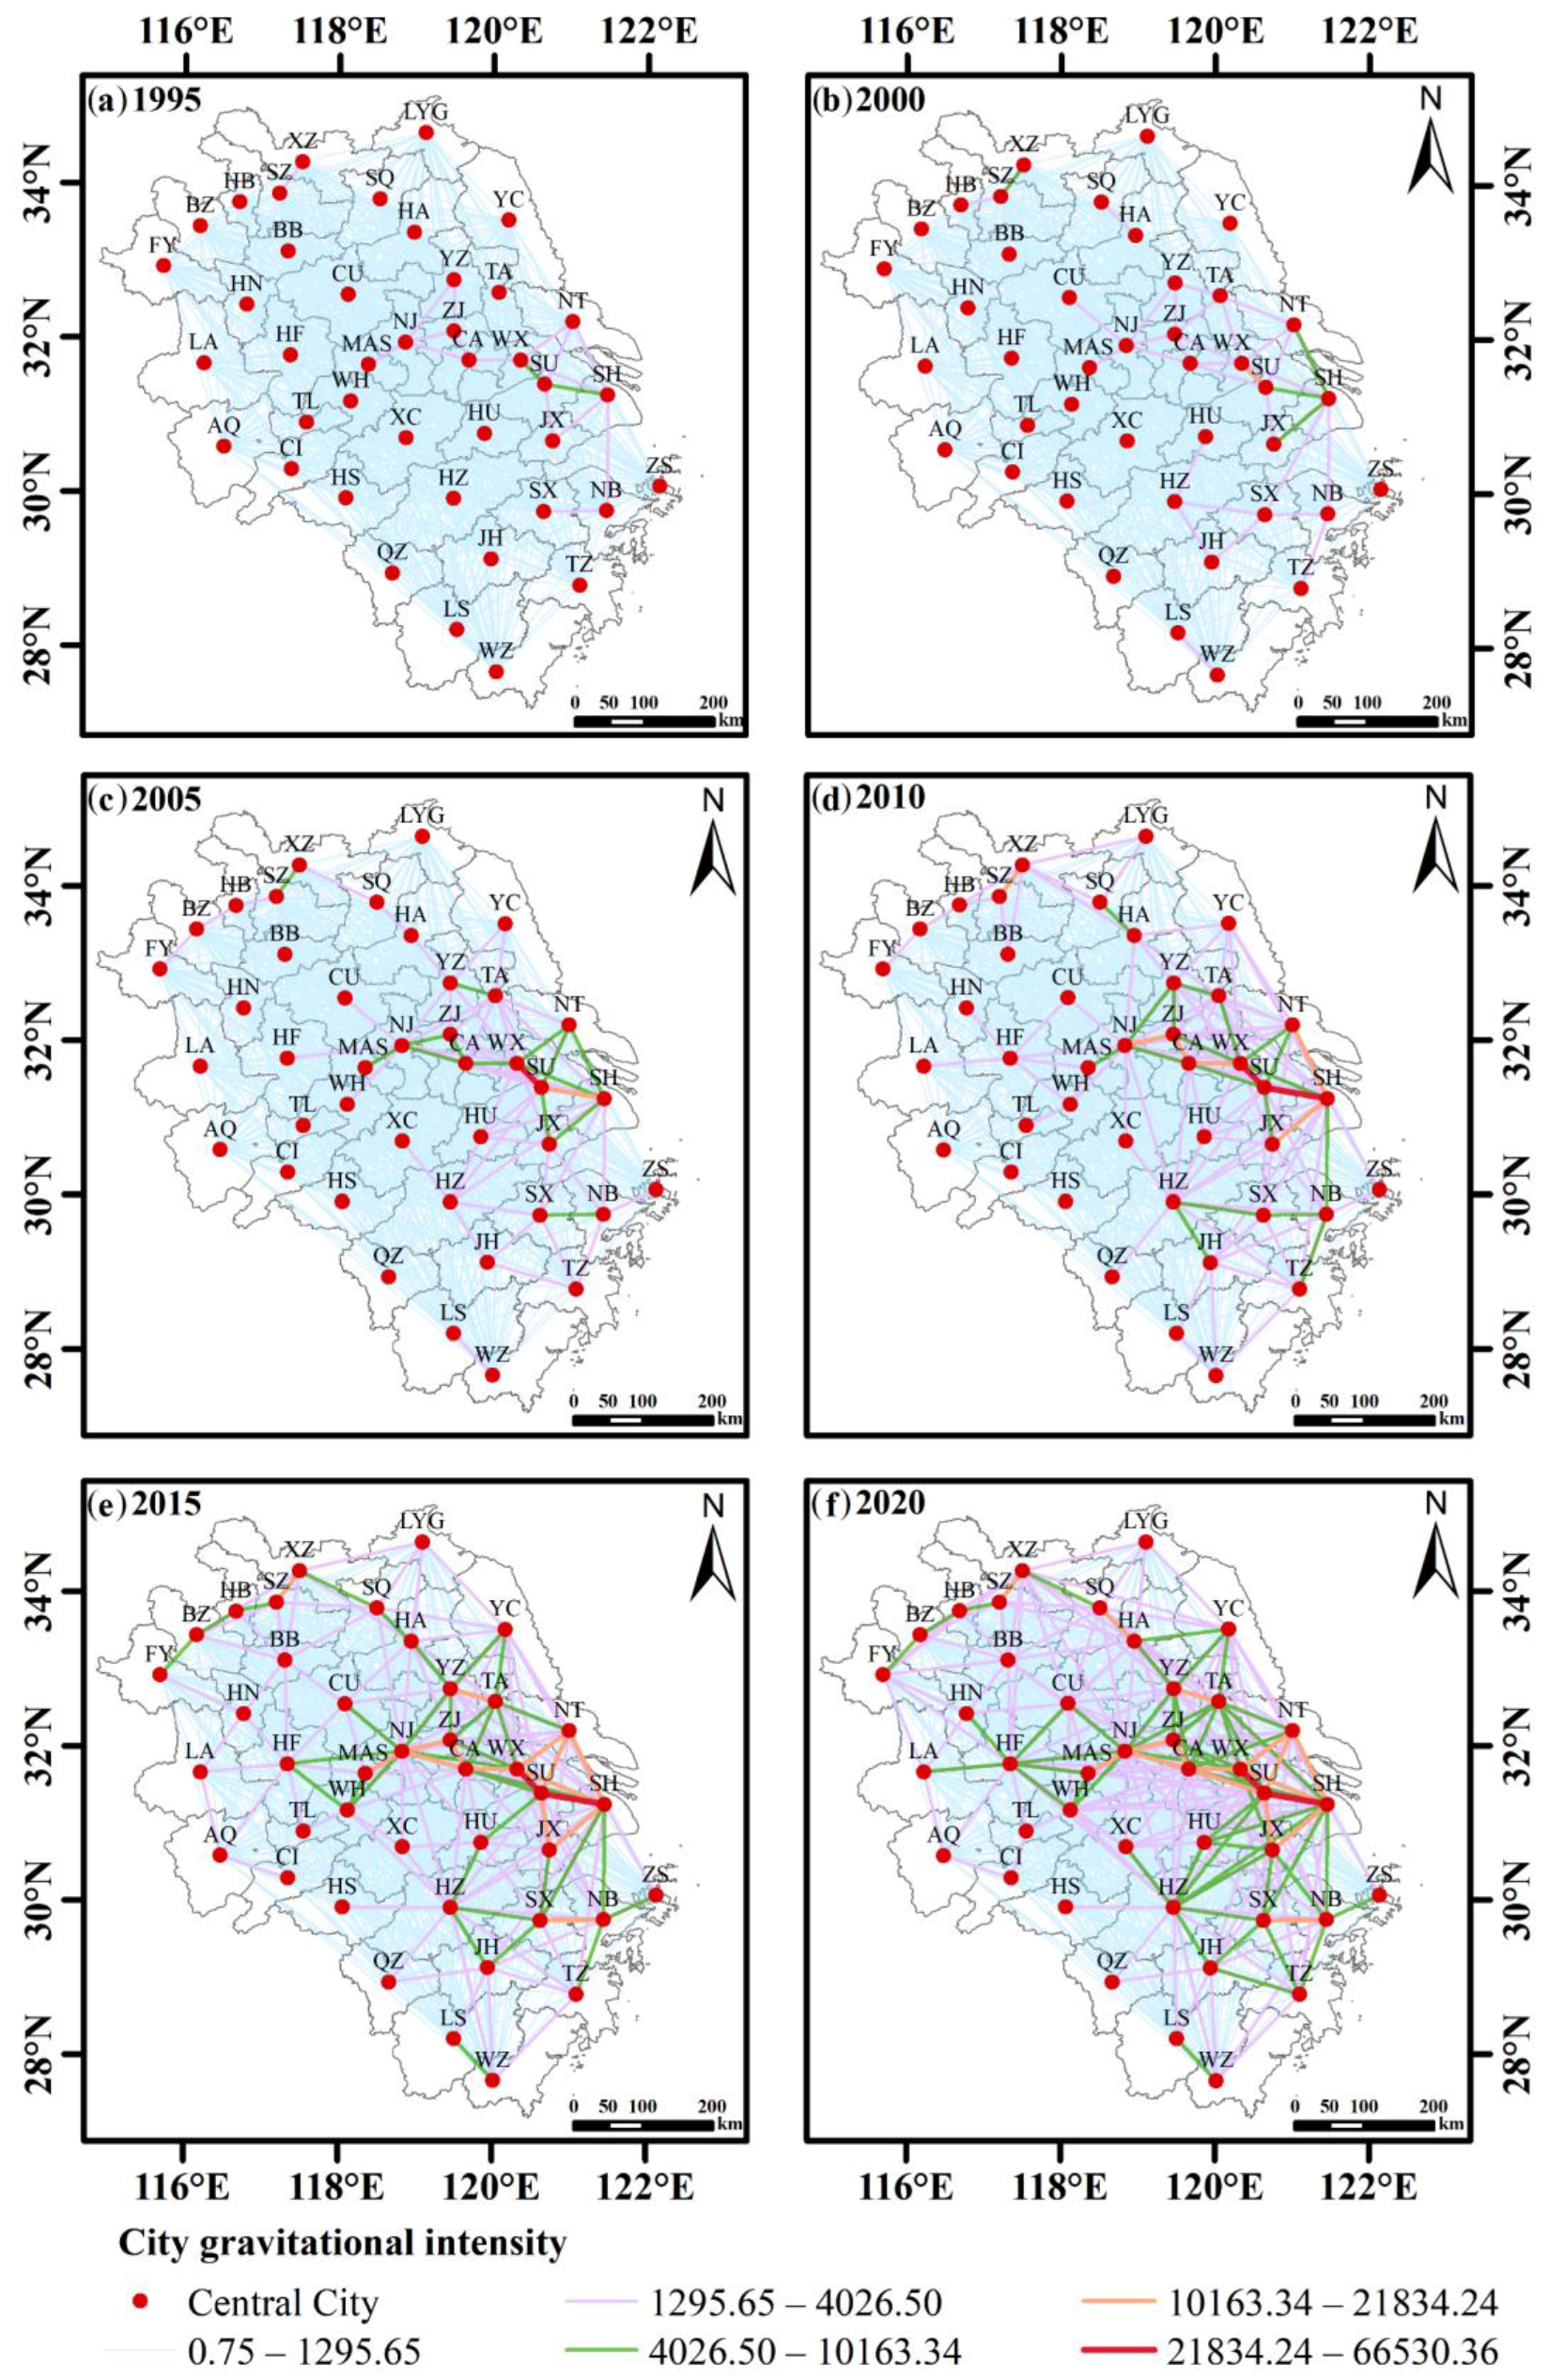
  • The geographical boundaries were disrupted by the YRDR’s transmission effect of land pressure and there was a tendency for spreading from the core city to the periphery and the characteristic of cascade transmission. The eastern cities of the YRDR absorbed resources from the other cities to meet their own needs. The southern cities relieved the land pressure of the other cities through the overflow of resource elements. The YRDR’s western and northern cities acted as bridges in the spatially linked network of land pressure, facilitating the flow of resource elements and inter-city exchanges and cooperation.
  • The coupled gravity-GTWR model’s R2 was 0.96 higher than that of the other regression analysis models, demonstrating the model’s applicability in the study of the influencing factors for land pressure. The land pressure influencing factors in the YRDR had obvious spatial and temporal differences, with various cities showing varying intensities and action directions of the influencing factors.
Our findings serve as a guide for the spatial network characteristics of land pressure, offer more spatial transmission routes to reduce regional land pressure and enhance the synergy and interconnection of sustainable land resource development in the YRDR. Further research is required to determine whether comparable transmission characteristics of urban land pressure exist for the various study scales. Moreover, further study is required to explore the land pressure development trend and the optimization path in the YRDR under the various development scenarios.

Author Contributions

Conceptualization, Z.Y. and L.C. (Longqian Chen); formal analysis, Z.Y.; funding acquisition, Z.Y., L.L. and S.H.; investigation, T.Z., L.Y. and S.H.; methodology, L.L., L.C. (Liang Cheng) and S.S.; software, L.C. (Liang Cheng) and J.X.; supervision, L.C. (Longqian Chen); visualization, T.Z. and S.S.; writing—original draft, Z.Y.; writing—review and editing, L.C. (Longqian Chen), L.Y. and J.X. All authors have read and agreed to the published version of the manuscript.

Funding

This research was funded by the Graduate Innovation Program of the China University of Mining and Technology (2022WLKXJ093), the Postgraduate Research & Practice Innovation Program of Jiangsu Province (KYCX22_2474), the National Natural Science Foundation of China (Grant No. 42001212) and the Humanities and Social Sciences Research Program of the Ministry of Education (22YJC630036).

Data Availability Statement

The input data used in this research can be accessed freely from online sources.

Acknowledgments

We would like to thank the Geographic Data Sharing Infrastructure, the Resource and Environment Science and the Data Center (http://www.resdc.cn accessed on 15 January 2022) and the Geospatial Data Cloud (http://www.gscloud.cn/ accessed on 20 January 2022) for access to the data. We appreciate the editors and reviewers for their constructive comments and suggestions.

Conflicts of Interest

The authors declare no conflict of interest.

Appendix A

Table A1. Land pressure score evaluation index system.
DimensionsIndex LayerWeightDimensionsIndex LayerWeight
Production pressureFertilizer application intensity (t·m−2) 0.0438Living pressurePopulation density (people·km−2)0.0328
Pesticide application intensity (t·m−2)0.0509Natural population growth rate (%)0.0255
The modified cropland pressure index0.0959Built-up land area (m−2) 0.0447
Cropland area (m−2) 0.0104Urbanization level (%) 0.0321
Producible land area per capita (people·m−2) 0.0094Water pressure index 0.0326
Gross domestic product (104 yuan) 0.0988Population pressure on built-up land (people·km−2) 0.0463
Ecology pressureCarbon sink pressure index 0.1098Slope (°)0.1137
Amount of meat (people−1) 0.0456Per capita net income of farmers (yuan) 0.0441
Grass area (m−2) 0.0077The ratio of urban and rural per capita disposable income 0.0277
Ecological service value (yuan·ha−2) 0.0104Number of beds in health facilities (104 people−1) 0.0409
Water area (m−2) 0.0066
Industrial SO2 emissions (t) 0.0703
Table A2. Variables of the covariance diagnosis in 1995, 2000, 2005, 2010, 2015 and 2020.
Variables199520002005201020152020
X11.871.673.062.012.371.71
X22.322.291.972.884.013.80
X31.251.581.512.132.172.65
X42.303.136.016.244.675.13
X51.852.222.972.442.292.66
X62.364.542.642.111.431.35
X71.941.812.162.161.421.84
X82.952.557.207.445.708.69
X92.112.411.732.051.681.82
X102.143.482.995.434.166.15
Figure A1. Spatial distribution of the regression coefficients of the urban development intensity.
Remotesensing 15 00250 g0a1
Figure A2. Spatial distribution of the regression coefficients of the land use structure.
Remotesensing 15 00250 g0a2
Figure A3. Spatial distribution of the regression coefficients of the total population.
Remotesensing 15 00250 g0a3
Figure A4. Spatial distribution of the regression coefficients of the population urbanization.
Remotesensing 15 00250 g0a4
Figure A5. Spatial distribution of the regression coefficients of the industrial structure.
Remotesensing 15 00250 g0a5
Figure A6. Spatial distribution of the regression coefficients of the external development level.
Remotesensing 15 00250 g0a6
Figure A7. Spatial distribution of the regression coefficients of the urban-rural income ratio.
Remotesensing 15 00250 g0a7
Figure A8. Spatial distribution of the regression coefficients of the social consumption.
Remotesensing 15 00250 g0a8
Figure A9. Spatial distribution of the regression coefficients of the carbon emission intensity.
Remotesensing 15 00250 g0a9
Figure A10. Spatial distribution of the regression coefficients of the normalized vegetation index.
Remotesensing 15 00250 g0a10

References

  1. Lv, H.; Guan, X.; Meng, Y. Study on economic value of urban land resources based on emergy and econometric theories. Environ. Dev. Sustain. 2021, 23, 1019–1042. [Google Scholar] [CrossRef]
  2. Luo, J.; Zhang, X.; Wu, Y.; Shen, J.; Shen, L.; Xing, X. Urban land expansion and the floating population in China: For production or for living? Cities 2018, 74, 219–228. [Google Scholar] [CrossRef]
  3. Zhou, Y.; Li, X.; Liu, Y. Rural land system reforms in China: History, issues, measures and prospects. Land Use Policy 2020, 91, 104330. [Google Scholar] [CrossRef]
  4. Foley, J.A.; DeFries, R.; Asner, G.P.; Barford, C.; Bonan, G.; Carpenter, S.R.; Chapin, F.S.; Coe, M.T.; Daily, G.C.; Gibbs, H.K.; et al. Global consequences of land use. Science 2005, 309, 570–574. [Google Scholar] [CrossRef] [Green Version]
  5. Zhou, D.; Xu, J.; Lin, Z. Conflict or coordination? Assessing land use multi-functionalization using production-living-ecology analysis. Sci. Total Environ. 2017, 577, 136–147. [Google Scholar] [CrossRef]
  6. Zhu, H.; He, S. Land pressure and adaptation in the mountainous region of northern China: An empirical analysis of 21 small watersheds. J. Geogr. Sci. 2010, 20, 913–922. [Google Scholar] [CrossRef]
  7. Chen, L.; Zhang, R.; Ai, D.; Wang, S.; Sun, W. Study on Land Pressure and Its Sustainable Utilization for Heilongjiang Province. Areal Res. Dev. 2017, 36, 123–128. [Google Scholar] [CrossRef]
  8. Hao, S.; Li, C. Changes of land pressure and land use mode in Loess hilly gully region. Trans. Chin. Soc. Agric. Eng. 2014, 30, 210–217. [Google Scholar] [CrossRef]
  9. Shen, L.; Cheng, G.; Du, X.; Meng, C.; Ren, Y.; Wang, J. Can urban agglomeration bring “1 + 1 > 2 Effect”? A perspective of land resource carrying capacity. Land Use Policy 2022, 117, 106094. [Google Scholar] [CrossRef]
  10. Cao, X.; Shi, Y.; Zhou, L. Research on Urban Carrying Capacity Based on Multisource Data Fusion-A Case Study of Shanghai. Remote Sens. 2021, 13, 2695. [Google Scholar] [CrossRef]
  11. Chen, W.; Chi, G.; Li, J. The spatial association of ecosystem services with land use and land cover change at the county level in China, 1995–2015. Sci. Total Environ. 2019, 669, 459–470. [Google Scholar] [CrossRef]
  12. Wu, C.; Wei, Y.D.; Huang, X.; Chen, B. Economic transition, spatial development and urban land use efficiency in the Yangtze River Delta, China. Habitat Int. 2017, 63, 67–78. [Google Scholar] [CrossRef]
  13. Qiu, F.; Tong, Q.; Zhang, J. Investigating the role of spatial spillovers as determinants of land conversion in urbanizing Canada. Environ. Dev. Econ. 2022, 27, 357–373. [Google Scholar] [CrossRef]
  14. Tang, Y.; Lu, X.; Yi, J.; Wang, H.; Zhang, X.; Zheng, W. Evaluating the spatial spillover effect of farmland use transition on grain production—An empirical study in Hubei Province, China. Ecol. Indicators. 2021, 125, 107478. [Google Scholar] [CrossRef]
  15. Ma, S.; Cai, Y.; Xie, D.; Zhang, X.; Zhao, Y. Towards balanced development stage: Regulating the spatial pattern of agglomeration with collaborative optimal allocation of urban land. Cities 2022, 126, 103645. [Google Scholar] [CrossRef]
  16. Luo, X.; Qin, J.; Cheng, C.; Pan, Y.; Yang, T. Spatial effects and influencing factors of urban land intensive use in the Yangtze River Delta under high-quality development. Front. Environ. Science. 2022, 10, 971466. [Google Scholar] [CrossRef]
  17. Gao, X.; Zhang, A.; Sun, Z. How regional economic integration influence on urban land use efficiency? A case study of Wuhan metropolitan area, China. Land Use Policy 2020, 90, 104329. [Google Scholar] [CrossRef]
  18. Zhang, W.; Wang, B.; Wang, J.; Wu, Q.; Wei, Y.D. How does industrial agglomeration affect urban land use efficiency? A spatial analysis of Chinese cities. Land Use Policy. 2022, 119, 106178. [Google Scholar] [CrossRef]
  19. Xu, J.; Huang, D.; He, Z.; Zhu, Y. Research on the Structural Features and Influential Factors of the Spatial Network of China’s Regional Ecological Efficiency Spillover. Sustainability 2020, 12, 3137. [Google Scholar] [CrossRef] [Green Version]
  20. Jiang, Q.; Ma, X. Spillovers of environmental regulation on carbon emissions network. Technol. Forecast. Soc. Chang. 2021, 169, 120825. [Google Scholar] [CrossRef]
  21. Sun, Y.; Yang, Z.; Yu, X.; Ding, W. Evaluating Sustainable Development of Land Resources in the Yangtze River Economic Belt of China. J. Glob. Inf. Manag. 2022, 30, 1–23. [Google Scholar] [CrossRef]
  22. Gao, H.; Zhang, Y.; Xu, C.; Yang, Y. Towards a Sustainable Grain Production Network: An Empirical Study from Northeast China. Sustainability 2022, 14, 8849. [Google Scholar] [CrossRef]
  23. Wu, C.; Huang, X.; Chen, B. Telecoupling mechanism of urban land expansion based on transportation accessibility: A case study of transitional Yangtze River economic Belt, China. Land Use Policy 2020, 96, 104687. [Google Scholar] [CrossRef]
  24. Hu, G.; Mao, D.; Xu, Y.; Feng, C.; Zhang, F. Assessment and Countermeasures of Integrated Land Carrying Capacity of Hunan Province“3 + 5”Urban Agglomeration. J. Nat. Sci. Hunan Norm. Univ. 2012, 35, 90–94. [Google Scholar]
  25. Zhang, L.; Zheng, X.; Meng, C.; Zhang, P. Spatio-Temporal Difference of Coupling Coordination Degree of Land Use Functions in Hunan Province. China Land Sci. 2019, 33, 85–94. [Google Scholar] [CrossRef]
  26. Zhou, D.; Lin, Z.; Lim, S.H. Spatial characteristics and risk factor identification for land use spatial conflicts in a rapid urbanization region in China. Environ. Monit. Assess. 2019, 191, 677. [Google Scholar] [CrossRef]
  27. Xue, Q.; Yang, X.; Wu, F. A three-stage hybrid model for the regional assessment, spatial pattern analysis and source apportionment of the land resources comprehensive supporting capacity in the Yangtze River Delta urban agglomeration. Sci. Total Environ. 2020, 711, 134428. [Google Scholar] [CrossRef]
  28. Xu, F.; Wang, Z.; Chi, G.; Zhang, Z. The impacts of population and agglomeration development on land use intensity: New evidence behind urbanization in China. Land Use Policy 2020, 95, 104639. [Google Scholar] [CrossRef]
  29. Fan, Y.; Fang, C. Evolution process and obstacle factors of ecological security in western China, a case study of Qinghai province. Ecol. Indic. 2020, 117, 106659. [Google Scholar] [CrossRef]
  30. Zhang, F.; Wang, Y.; Ma, X.; Wang, Y.; Yang, G.; Zhu, L. Evaluation of resources and environmental carrying capacity of 36 large cities in China based on a support-pressure coupling mechanism. Sci. Total Environ. 2019, 688, 838–854. [Google Scholar] [CrossRef]
  31. Wan, J.; Zhang, L.; Yan, J.; Wang, X.; Wang, T. Spatial-Temporal Characteristics and Influencing Factors of Coupled Coordination between Urbanization and Eco-Environment: A Case Study of 13 Urban Agglomerations in China. Sustainability 2020, 12, 8821. [Google Scholar] [CrossRef]
  32. Zhou, X.; Wu, D.; Li, J.; Liang, J.; Zhang, D.; Chen, W. Original Cultivated land use efficiency and its driving factors in the Yellow River Basin, China. Ecol. Indic. 2022, 144, 109411. [Google Scholar] [CrossRef]
  33. Huang, Q.; Peng, B.; Wei, G.; Wan, A. Dynamic assessment and early warning of ecological security: A case study of the Yangtze river urban agglomeration. Nat. Hazards 2021, 107, 2441–2461. [Google Scholar] [CrossRef]
  34. Zhou, X.; Zhou, Y. Spatio-Temporal Variation and Driving Forces of Land-Use Change from 1980 to 2020 in Loess Plateau of Northern Shaanxi, China. Land 2021, 10, 982. [Google Scholar] [CrossRef]
  35. Kattel, G.R.; Elkadi, H.; Meikle, H. Developing a complementary framework for urban ecology. Urban For. Urban Green. 2013, 12, 498–508. [Google Scholar] [CrossRef] [Green Version]
  36. Sun, Y.; Hou, G. Analysis on the Spatial-Temporal Evolution Characteristics and Spatial Network Structure of Tourism Eco-Efficiency in the Yangtze River Delta Urban Agglomeration. Int. J. Environ. Res. Public Health 2021, 18, 2577. [Google Scholar] [CrossRef]
  37. Yu, Z.; Chen, L.; Li, L.; Zhang, T.; Yuan, L.; Liu, R.; Wang, Z.; Zang, J.; Shi, S. Spatiotemporal Characterization of the Urban Expansion Patterns in the Yangtze River Delta Region. Remote Sens. 2021, 13, 4484. [Google Scholar] [CrossRef]
  38. Song, J.; Feng, Q.; Wang, X.; Fu, H.; Jiang, W.; Chen, B. Spatial Association and Effect Evaluation of CO2 Emission in the Chengdu-Chongqing Urban Agglomeration: Quantitative Evidence from Social Network Analysis. Sustainability 2019, 11, 1. [Google Scholar] [CrossRef] [Green Version]
  39. Liu, S.; Xiao, Q. An empirical analysis on spatial correlation investigation of industrial carbon emissions using SNA-ICE model. Energy 2021, 224, 120183. [Google Scholar] [CrossRef]
  40. Huff, D.L. A Note on the Limitations of Intraurban Gravity Models. Land Econ. 1962, 38, 64–66. [Google Scholar] [CrossRef]
  41. Shen, W.; Liang, H.; Dong, L.; Ren, J.; Wang, G. Synergistic CO2 reduction effects in Chinese urban agglomerations: Perspectives from social network analysis. Sci. Total Environ. 2021, 798, 149352. [Google Scholar] [CrossRef] [PubMed]
  42. He, Y.; Wei, Z.; Liu, G.; Zhou, P. Spatial network analysis of carbon emissions from the electricity sector in China. J. Clean. Prod. 2020, 262, 121193. [Google Scholar] [CrossRef]
  43. Yu, Z.; Chen, L.; Tong, H.; Chen, L.; Zhang, T.; Li, L.; Yuan, L.; Xiao, J.; Wu, R.; Bai, L.; et al. Spatial correlations of land-use carbon emissions in the Yangtze River Delta region: A perspective from social network analysis. Ecol. Indic. 2022, 142, 109147. [Google Scholar] [CrossRef]
  44. Wang, H.; Zhang, B.; Liu, Y.; Liu, Y.; Xu, S.; Zhao, Y.; Chen, Y.; Hong, S. Urban expansion patterns and their driving forces based on the center of gravity-GTWR model: A case study of the Beijing-Tianjin-Hebei urban agglomeration. J. Geogr. Sci. 2020, 30, 297–318. [Google Scholar] [CrossRef]
  45. Li, H.; Li, L.; Chen, L.; Zhou, X.; Cui, Y.; Liu, Y.; Liu, W. Mapping and Characterizing Spatiotemporal Dynamics of Impervious Surfaces Using Landsat Images: A Case Study of Xuzhou, East China from 1995 to 2018. Sustainability 2019, 11, 1224. [Google Scholar] [CrossRef] [Green Version]
  46. He, Q.; Huang, B. Satellite-based mapping of daily high-resolution ground PM2.5 in China via space-time regression modeling. Remote Sens. Environ. 2018, 206, 72–83. [Google Scholar] [CrossRef]
  47. Huang, B.; Wu, B.; Barry, M. Geographically and temporally weighted regression for modeling spatio-temporal variation in house prices. Int. J. Geogr. Inf. Sci. 2010, 24, 383–401. [Google Scholar] [CrossRef]
  48. Wu, B.; Li, R.; Huang, B. A geographically and temporally weighted autoregressive model with application to housing prices. Int. J. Geogr. Inf. Sci. 2014, 28, 1186–1204. [Google Scholar] [CrossRef]
  49. Wang, H.; Wang, J.; Huang, B. Prediction for spatio-temporal models with autoregression in errors. J. Nonparametric Stat. 2012, 24, 217–244. [Google Scholar] [CrossRef]
  50. Chu, H.; Huang, B.; Lin, C. Modeling the spatio-temporal heterogeneity in the PM10-PM2.5 relationship. Atmos. Environ. 2015, 102, 176–182. [Google Scholar] [CrossRef]
  51. Li, W.; Cai, Z. Spatiotemporal differences and influencing factors of high-quality utilization of land resources in the Yellow River Basin of China. Environ. Sci. Pollut. Res. 2022, 29, 89438–89448. [Google Scholar] [CrossRef] [PubMed]
  52. Punzo, G.; Castellano, R.; Bruno, E. Using geographically weighted regressions to explore spatial heterogeneity of land use influencing factors in Campania (Southern Italy). Land Use Policy 2022, 112, 105853. [Google Scholar] [CrossRef]
  53. Zhang, Z.; Sun, S.; Gao, J. Evolution characteristic and influencing mechanism of water-energy-food stress in Yangtze River Delta Urban Agglomeration. J. Nat. Resour. 2022, 37, 1586–1597. [Google Scholar] [CrossRef]
  54. Kennedy, P. A Guide to Econometrics, 6th ed.; Wiley-Blackwell: Oxford, UK, 2008. [Google Scholar]
  55. Hair, J.; Black, W.; Babin, B.; Anderson, R. Multivariate Data Analysis, 7th ed.; Pearson: Cambridge, UK, 2009. [Google Scholar]
  56. Li, L.; Bakelants, L.; Solana, C.; Canters, F.; Kervyn, M. Dating lava flows of tropical volcanoes by means of spatial modeling of vegetation recovery. Earth Surf. Process. Landf. 2018, 43, 840–856. [Google Scholar] [CrossRef]
  57. Symonds, M.R.E.; Moussalli, A. A brief guide to model selection, multimodel inference and model averaging in behavioural ecology using Akaike’s information criterion. Behav. Ecol. Sociobiol. 2011, 65, 13–21. [Google Scholar] [CrossRef]
  58. Nakagawa, S.; Schielzeth, H. A general and simple method for obtaining R2 from generalized linear mixed-effects models. Methods Ecol. Evol. 2013, 4, 133–142. [Google Scholar] [CrossRef]
  59. Yang, N.; Li, J.; Lu, B.; Luo, M.; Li, L. Exploring the Spatial Pattern and Influencing Factors of Land Carrying Capacity in Wuhan. Sustainability 2019, 11, 2786. [Google Scholar] [CrossRef] [Green Version]
  60. Dong, J.; Li, C. Structure characteristics and influencing factors of China’s carbon emission spatial correlation network: A study based on the dimension of urban agglomerations. Sci. Total Environ. 2022, 853, 158613. [Google Scholar] [CrossRef]
  61. Jiang, Y. The Influence of Yangtze River Economic Belt Strategy on Yangtze River Delta Integration. Shanghai Econ. 2016, 114, 50–73. [Google Scholar] [CrossRef]
  62. Zhang, Y.; Liu, L.; Huang, S. Does regional integration promote the high quality development of urban agglomeration economy: A quasi—Natural experiment based on the Yangtze river delta urban economic coordination commission. Stud. Sci. Science. 2021, 39, 63–72. [Google Scholar] [CrossRef]
  63. Zhu, H.; Sun, H. Study on Measurement of Spatio-temporal Change of Cultivated Land Pressure Index in China. Price Theory Practice. 2015, 1, 41–43. [Google Scholar] [CrossRef]
  64. Lin, Q.; Xiang, M.; Zhang, L.; Yao, J.; Wei, C.; Ye, S.; Shao, H. Research on Urban Spatial Connection and Network Structure of Urban Agglomeration in Yangtze River Delta-Based on the Perspective of Information Flow. Int. J. Environ. Res. Public Health 2021, 18, 10288. [Google Scholar] [CrossRef] [PubMed]
  65. Shi, T.; Qiao, Y.; Zhou, Q. Spatiotemporal evolution and spatial relevance of urban resilience: Evidence from cities of China. Growth Chang. 2021, 52, 2364–2390. [Google Scholar] [CrossRef]
  66. Ding, R.; Fu, J.; Zhang, Y.; Zhang, T.; Yin, J.; Du, Y.; Zhou, T.; Du, L. Research on the Evolution of the Economic Spatial Pattern of Urban Agglomeration and Its Influencing Factors, Evidence from the Chengdu-Chongqing Urban Agglomeration of China. Sustainability 2022, 14, 10969. [Google Scholar] [CrossRef]
  67. Ma, X.; Zheng, X.; Wang, Y.; Kathia, R.A. Study on the spatial-temporal evolution of cultivated land pressure and its driving factors in central plains economic region. Chin. J. Agric. Resour. Reg. Plan. 2021, 42, 58–66. [Google Scholar] [CrossRef]
  68. Wu, D.; Hu, Y.; Liu, Y.; Liu, Y. Empirical study on the coupling coordination between development intensity and resources-and-environment carrying capacity of core cities in Pearl River Delta. J. Nat. Resour. 2020, 35, 82–94. [Google Scholar] [CrossRef]
  69. Luo, Z.; Yuan, Y.; Qi, S.; Xu, J. Evaluating the Carrying Capacity and Spatial Pattern Matching of Urban and Rural Construction Land in a Representative City of Middle China. Forests 2022, 13, 1514. [Google Scholar] [CrossRef]
  70. Zhang, R.; Zhang, X.; Yin, P. Spatial-temporal differentiation and driving factors identification of urban land resources carrying capacity in the Yangtze River Economic Belt. Econ. Geogr. 2022, 42, 185–192. [Google Scholar] [CrossRef]
  71. Shi, L. Industrial Structure Changes, Spatial Spillover and Economic Growth in the Yangtze River Delta. J. Coast. Res. 2020, 107, 377–382. [Google Scholar] [CrossRef]
  72. Wen, Y. The spillover effect of FDI and its impact on productivity in high economic output regions: A comparative analysis of the Yangtze River Delta and the Pearl River Delta, China. Pap. Reg. Sci. 2014, 93, 341–365. [Google Scholar] [CrossRef]
Figure 1. Study area: (a) location of the Yangtze River Delta region (YRDR) in China. (b) The 41 cities in the YRDR. The abbreviations of city names refer to previous studies [37].
Remotesensing 15 00250 g001
Figure 2. Flow chart of land pressure transmission effects and influencing factors from 1995 to 2020.
Remotesensing 15 00250 g002
Figure 3. The overall network characteristics in 1995, 2000, 2005, 2010, 2015 and 2020.
Remotesensing 15 00250 g003
Figure 4. Spatial correlation network (SCN) of land pressure in the YRDR in 1995, 2000, 2005, 2010, 2015 and 2020.
Remotesensing 15 00250 g004
Figure 5. The individual network characteristics of land pressure in the YRDR. DC_1995, CC_1995 and BC_1995 represent the degree, closeness and betweenness centrality in 1995.
Remotesensing 15 00250 g005
Figure 6. SCN block distribution of land pressure in the YRDR in 1995, 2000, 2005, 2010, 2015 and 2020.
Remotesensing 15 00250 g006
Figure 7. The transmission relationship between the blocks in (a) 1995, (b) 2000, (c) 2005, (d) 2010, (e) 2015 and (f) 2020.
Remotesensing 15 00250 g007aRemotesensing 15 00250 g007b
Table 1. The List of the top 10 cities for land pressure network gravitational intensity in the Yangtze River Delta region (YRDR).
City1995City2000City2005City2010City2015City2020
WX-SU8271.77WX-SU11,457.29WX-SU22,076.94SU-WX37,191.92SU-WX49,064.48SU-WX66,530.36
SU-WX7848.91SU-WX10,815.96SU-WX20,829.12WX-SU36,521.96WX-SU47,432.02WX-SU64,054.35
SH-SU6554.31SH-SU9898.14SH-SU18,092.72SH-SU29,232.34SH-SU37,247.64SH-SU47,871.14
SU-SH5440.95SU-SH7838.94SU-SH14,295.09SU-SH24,845.38SU-SH32,779.03SU-SH45,428.34
CA-ZJ2958.17XZ-SZ4208.11SH-NT6904.63CA-ZJ11,884.37XZ-SZ17,684.42XZ-SZ21,834.24
ZJ-CA2942.87SH-NT4203.44SH-JX6831.47XZ-SZ11,275.40CA-ZJ17,192.10CA-ZJ20,955.38
SH-NT2858.60SH-JX4051.79CA-ZJ6728.25WX-CA11,135.58SZ-XZ16,549.96SZ-XZ20,336.91
WX-CA2710.67CA-ZJ4018.40WX-CA6690.89SH-NT11,066.87ZJ-CA15,586.60WX-CA20,043.53
SH-JX2691.21ZJ-CA3835.15SH-WX6454.53ZJ-CA10,721.01NJ-ZJ14,914.10SH-NT18,949.02
SH-WX2495.58WX-CA3720.19ZJ-CA6263.74SH-JX10,420.85WX-CA14,795.19CA-WX18,945.49
Table 2. Spillover effects of land pressure in the YRDR.
YearBlock TypeRelationships
Received
Relationships
Generated
Expected Internal
Relationship
Actual Internal
Relationship
InsideOutsideInsideOutside
1995I571265712325.00%31.67%
II72897212627.50%36.36%
III10130106515.00%13.33%
IV64896412025.00%34.78%
2000I4078408617.50%31.75%
II921189213630.00%40.35%
III48129487117.5040.34%
IV771007713227.50%36.84%
2005I55925510422.50%34.59%
II68996811425.00%37.36%
III60143608320.00%41.96%
IV64856411825.00%35.16%
2010I56925610522.50%34.78%
II66976611025.00%37.50%
III60141608320.00%41.96%
IV63846311625.00%35.20%
2015I5593559822.50%35.95%
II65946510725.00%37.79%
III60135608320.00%41.79%
IV61816111525.00%34.66%
2020I4992498820.00%35.77%
II761027612327.50%38.19%
III59134598220.00%41.84%
IV61806111525.00%34.66%
Table 3. The block density and image matrix of land pressure in the YRDR.
YearBlock NumberDensity MatrixImage Matrix
1995I0.5180.1290.4550.1161010
II0.3260.5450.1310.0001100
III0.1820.0000.9520.1430010
IV0.0990.0000.5710.5820011
2000I0.7140.1830.2340.1251000
II0.2020.5900.2210.0000100
III0.0780.0670.8570.1150010
IV0.1250.0000.4480.5830011
2005I0.6110.2180.1560.1001000
II0.1820.6180.2630.0000110
III0.0670.0710.8330.1010010
IV0.1000.0000.4340.5820011
2010I0.6220.2180.1560.1001000
II0.1730.6000.2530.0000110
III0.0670.0710.8330.1010010
IV0.1000.0000.4240.5730011
2015I0.6110.2000.1220.0911000
II0.1730.5910.2320.0000100
III0.0670.0710.8330.1010010
IV0.1180.0000.4140.5650011
2020I0.6810.1760.1360.0911000
II0.2220.5760.2130.0000100
III0.0740.0650.8190.1010010
IV0.1310.0000.4140.5550011
Table 4. Potential influencing factors of land pressure in the YRDR.
Variable TypeVariableFactorsDescription
Urban spatial expansionUrban development intensity (%)X1Built-up land expansion speed
Land use structure (%)X2The proportion of built-up land to the total area
Population statusTotal population (104 people)X3Total population at the end of the year
Population urbanization (%)X4Urban population to total population ratio
Economic development scaleIndustrial structure (%)X5The total output value of the secondary industry as a percentage of GDP
External development level (%)X6The proportion of actual foreign capital utilization to the GDP
Resident consumption levelUrban-rural income ratio (%)X7The proportion of urban per capita disposable income to rural per capita disposable income
Social consumption (yuan)X8Retail sales of social consumption per capita
Ecological statusCarbon emission intensity (%)X9Carbon emissions as a percentage of GDP
Normalized vegetation indexX10Normalized vegetation index
Table 5. Auxiliary validation of the center of gravity-GTWR model.
IndicatorModel Type
Center of gravity-GTWRCenter of gravity-GWRGTWRGWRTWROLS
R20.960.900.940.900.810.71
Table 6. Model comparison assessment of the center of gravity-GTWR model.
IndicatorModel Comparison
Center of gravity-GTWR–Center of gravity-GWRCenter of gravity-GTWR–GTWRCenter of gravity -GTWR–GWRCenter of gravity-GTWR–TWRCenter of gravity-GTWR–OLS
R20.060.020.060.150.25
Table 7. Model performance with gradually increasing independent variables.
X1X1–X2X1–X3X1–X4X1–X5X1–X6X1–X7X1–X8X1–X9X1–X10
R20.640.790.850.910.930.930.960.950.970.96
AICc−2306−2443−2497−2556−2511−2492−2405−2477−2310−2418
Disclaimer/Publisher’s Note: The statements, opinions and data contained in all publications are solely those of the individual author(s) and contributor(s) and not of MDPI and/or the editor(s). MDPI and/or the editor(s) disclaim responsibility for any injury to people or property resulting from any ideas, methods, instructions or products referred to in the content.

