Abstract
An urban agglomeration is the engine of regional and national economic growth, but also causes many ecological and environmental issues that emerge from massive land changes. In this study, the spatiotemporal evolution of an urban agglomeration was quantified and its impacts on the urban and regional landscape patterns were evaluated. It showed that the urbanized land area of the Pearl River Delta Urban Agglomeration (PRDUA) in China nearly quadrupled, having linearly increased from 1819.8 km2 to 7092.2 km2 between 1985 and 2015. The average annual growth rate presented a bimodal wave-like pattern through time, indicating that the PRDUA has witnessed two rounds of the urbanization process. The growth modes (e.g., leapfrog, edge-expansion, infilling) were detected and they exhibited co-existing but alternating dominating patterns during urbanization, demonstrating that the spatiotemporal evolution of the urban development of the PRDUA follows the “spiral diffusion-coalescence” hypothesis. The morphology of the PRDUA presented an alternating dispersal-compact pattern over time. The city-level and regional-level landscape patterns changed synchronously with the spatiotemporal evolution of the PRDUA over time. The urbanization of the PRDUA increased both the complexity and aggregation of the landscape, but also resulted in an increasing fragmentation and decreasing connectivity of the natural landscape in the Pearl River Delta region. These findings are helpful for better understanding how urban agglomerations evolve and in providing insights for regional urban planning and sustainable land management.
1. Introduction
Cities concentrate a large amount of labor, information, and financial resources [1,2]. They contributed nearly 85% of the global gross domestic product (GDP) in 2015 and are thus the engines of economic growth and social change [3]. In 2018, 55% of the world’s population inhabited urban areas, and this is predicted to rise to 68% by 2050 [4]. As the world’s most populous country, China has experienced accelerating urbanization in the past few decades, leading to large built-up areas replacing the natural landscapes [5]. Such urbanization has brought tremendous stress onto the environment and natural resources [6,7,8], and has affected ecosystem functions and services from the local to global scale [9]. Therefore, monitoring and quantifying the evolution of the spatiotemporal patterns of urbanization is essential in order to understand the impacts of urbanization on the natural environment and ecosystems [8,10,11,12,13].
With the rapid urbanization processes that have occurred in the past few decades, many urban agglomerations, such as the Yangtze River Delta urban agglomeration (YRDUA), the Pearl River Delta urban agglomeration (PRDUA), and the Greater Tokyo Area in Asia; the Greater London Area in Europe; the New York Metropolitan Area and the Greater Chicago Metropolitan Area in America (the USA), etc., have emerged worldwide [14]. Urban agglomerations have emerged as the new engine to facilitate economic growth and play an important role in promoting sociocultural and technological developments at the international, national, and regional levels [2,14]. At present, there is no consensus on the definition of what an urban agglomeration is, but it is considered to be a functional polycentric network that consists of multiple highly integrated metropolitan areas and lower-density peripheral areas within its boundaries [2,15]. An urban agglomeration originates from multiple individual cities of different sizes, each of which may experience a unique spatiotemporal growth pattern. Therefore, it is essential to quantify how the individual city grows spatially in order to better understand how cities evolve into an urban agglomeration [10,11,16,17]. Many studies have characterized the spatiotemporal patterns of urban growth at the national, regional, and city levels [16,18,19,20,21]. In the last decade, there has been increasing interest in investigating the spatiotemporal patterns of the urban growth of urban agglomerations [22,23,24,25,26,27,28,29,30,31,32]. However, most of these studies utilized data spanning very limited time periods, and thus can only identify some spatial and temporal episodes of the urban agglomeration evolution. How the urban agglomeration evolved and what its spatiotemporal growth trajectory is over multiple decades remain unclear.
Urban growth can present diverse spatial and temporal patterns and exhibit complex urban morphological dynamics during urbanization processes. Urban growth pattern dynamics are usually characterized by different growth modes, including leapfrog, edge-expansion, infilling, and their variants or hybrids [33,34], as well as spatial expansion over time [35,36,37,38]. Urban expansion usually exhibits a wave-like pattern, which has been observed in many cities worldwide [38,39,40,41,42,43]. Consequently, urban forms often display alternating diffusion and coalescence patterns, following the diffusion-coalescence hypothesis, which posits that urban growth can proceed in a diffusion mode, in which new urban areas are disconnected from the existing urban areas, or in a coalescence mode, where new urban growth fills in gaps, thus connecting previously disjointed urban areas [42]. Li et al. [16] developed a framework to quantify the spatiotemporal patterns of urban growth using the speed, growth mode, and landscape metrics derived from time series land-use data, and to test the diffusion-coalescence hypothesis. They found that the urbanization process in the central Yangtze River Delta region presented a spiraling process of diffusion and coalescence, rather than a dichotomous diffusion-coalescence alternate process, and thus proposed a spiraling diffusion-coalescence hypothesis. This hypothesis has been tested in three urban agglomerations in Switzerland [28]. However, some studies found that the diffusion-coalescence hypothesis held for some other urban agglomerations, such as the Beijing-Tianjin-Hebei Urban Agglomeration (BTHUA) in China [30] and Kolkata Urban Agglomeration in India [26]. Therefore, whether the spiraling diffusion-coalescence hypothesis fits other urban agglomerations is still unclear.
Changes in landscape patterns are widely considered not only as one of the urbanization consequences [16,44], but also as a cause of many ecological and environmental issues [45,46,47,48]. Landscape metrics have been widely used to quantify landscape patterns and the urban form [49,50,51,52,53]. Most previous studies are based on an individual city or cities, and showed that urbanization leads to landscape fragmentation, disconnection, and shape complexity [54,55,56]. Few studies focus on the entire urban agglomeration. Recent studies investigated the impacts of the urbanization of urban agglomerations on landscape patterns, but their results still focused on the analysis of individual cities. For instance, Xu et al. [25] found that rapid urbanization profoundly changed the spatial and temporal patterns of the urban landscape of seven cities in the PRDUA. The landscape metrics exhibited several distinct temporal trajectories, including a monotonous increase, and single–hump shaped and double–hump shaped patterns for different cities, while urban expansion had led to the fragmentation of green spaces, farmland, and grassland in the BTHUA, China [57]. However, how the spatial and temporal evolution of the entire urban agglomeration influences the urban and regional landscape patterns remains unclear.
The PRDUA is the fastest-growing metropolitan region in China [25] and has been undergoing a rapid urbanization process since China’s reform and opening-up and Deng Xiaoping’s “coastal development strategy” in the late 1970s [58], which transformed large farmlands and forests into an impervious surface [59]. Thus, it is an ideal area to investigate how a Chinese urban agglomeration has evolved over the past few decades. This study aims to investigate the spatiotemporal dynamics of urban growth in the PRDUA and their impacts on the urban and regional landscapes. We specifically address the following questions: (1) What are the evolution patterns of the PRDUA over space and through time? (2) Does the PRDUA follow the spiraling diffusion-coalescence hypothesis? (3) What are the impacts of the urban agglomeration evolution on the urban and regional landscape patterns of the PRDUA?
2. Materials and Methods
2.1. Study Area
The PRDUA is located in the lower reaches of the Pearl River in Guangdong Province, China, and borders the Hong Kong and Macao Special Administrative Regions. According to the Outline of the Reform and Development Plan of the Pearl River Delta Region (2008–2020) [60], the PRDUA encompasses nine independent but highly interconnected cities, i.e., Guangzhou, Shenzhen, Zhuhai, Foshan, Jiangmen, Dongguan, Zhongshan, Huizhou, and Zhaoqing (Figure 1). The PRDUA covers an area of approximately 55,300 km2 and has a typical subtropical monsoon climate. The GDP of the PRDUA had reached CNY 6.25 trillion (nearly USD 0.983 trillion) by the end of 2015, more than seven times that in 2000 (CNY 847.13 billion). The resident population of the PRDUA increased from 42.89 million in 2000 to 58.74 million in 2015 [61], resulting in rapid urbanization in the PRDUA. At present, the PRDUA, as one of China’s three major world-class urban agglomerations (the other two are the BTHUA and the YRDUA), is a pioneer region, implementing China’s reform and opening-up strategies, and is an important economic hub of China [60]. As the main body of the emerging Guangdong-Hong Kong-Macao Great Bay Area, the PRDUA plays a remarkable leading role in promoting regional cooperation and integration, as well as in driving national economic development [59]. Therefore, analyzing the spatiotemporal evolution of the PRDUA is beneficial to guide sustainable urban planning and land-use management of emerging urban agglomerations.
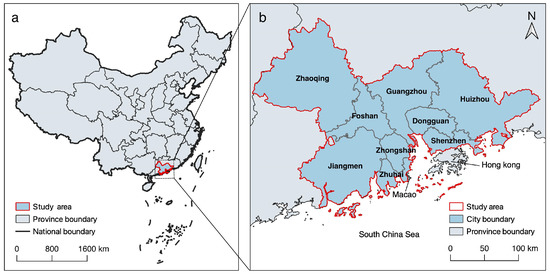
Figure 1.
The location (a) and administrative divisions (b) of the study area, the blue area covers the nine cities in the PRDUA.
2.2. Data Sources and Re-Processing
Urban growth is defined here as the expansion of urbanized land, i.e., the conversion of non-urban areas to urban areas [62]. Urbanized land refers to the impervious surface within urban administrative boundaries, mainly including residential, industrial, transportation, public facilities, and other land-use types [18,63]. The proportion of urbanized land has been widely used as another kind of index for measuring the urbanization degree in a city or a country [30,64,65,66]. In this study, the yearly urbanized land data covering the entire PRDUA between 1985 and 2015 were derived from the global annual urban dynamics (GAUD) dataset with a 30 m spatial resolution, which was developed by Liu et al. [67]. The original dataset includes yearly urbanized land, non-urbanized land, and green recovery land, and has an overall accuracy of 76% (1985–2000) and 82% (2000–2015) for the humid regions (accounting for over 90% of global urban lands) [67]. The dataset has been widely utilized to study urban growth [68,69,70,71] and can be freely downloaded [67]. To investigate the spatiotemporal evolution of the landscape of the PRDUA, the original dataset was processed using the following procedures.
Firstly, the time-series data of urban and non-urban land use during 1985–2015 was divided into six equidistant time periods, including 2015–2010, 2010–2005, 2005–2000, 2000–1995, 1995–1990, and 1990–1985, to match the China national “5-Year Plan” [21]. The land-use maps of urban and non-urban areas were then extracted from the original raster images in the years of 1985, 1990, 1995, 2000, 2005, 2010, and 2015, respectively. Secondly, we used administrative boundaries to clip the land-use map to generate land-use types of urban and non-urban for the study area. The administrative boundaries and divisions of the cities in the PRD region were downloaded from the National Geographic Information Resources Catalogue Service System of the Ministry of Natural Resources of China [72], and the Ministry of Civil Affairs of the PRC [73], respectively. Thirdly, the original land-use map contains numerous small patches, some of them may be noise pixels and must be excluded. We used the method proposed by Wu et al. [21] and adopted the 3 × 3 majority filter in ArcMap 10.7 to reprocess the maps of 2015, 2010, 2005, 2000, 1995, 1990, and 1985 to exclude the noise pixels. These seven reproduced maps of the PRDUA were used for calculating various landscape metrics and urban growth rates. The Figure 2 showed the steps of the data-processing in this study.
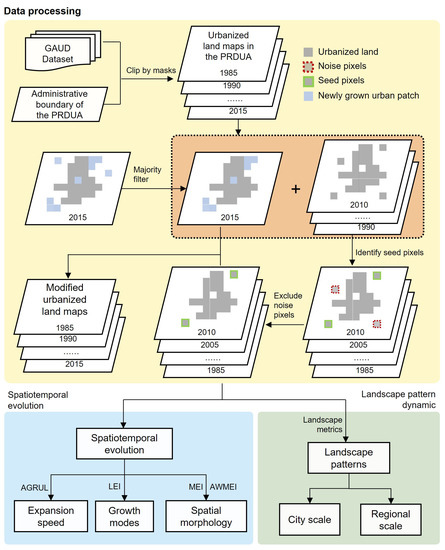
Figure 2.
Workflow for the quantification of spatiotemporal evolution of landscape patterns in the PRDUA.
2.3. Quantifying Urban Growth Rate of the PRDUA
Equation (1) was used to calculate the annual growth rate of urbanized land (AGRUL) and the urban growth rate over the past 30 years [16]:
where ULt+n and ULt are the areas of urbanized land in year t + n and t, respectively.
2.4. Measuring Growth Modes of the PRDUA
Urban growth generally exhibits three major types of growth modes, i.e., leapfrog, edge-expansion, and infilling [35,36,38]. Leapfrog refers to newly increased urbanized land occurring in areas beyond the existing urbanized land. Edge-expansion means that the newly grown urbanized land extends at the edge of the existing urban land. Infilling denotes that the new urban patches emerge in areas surrounding the existing urbanized land [16,36]. The Landscape Expansion Index (LEI) was used to model the urban growth modes in the PRDUA, and was calculated using Equation (2) [16,36]:
where A0 is the intersection between a predefined buffer zone of the new urban patch and an existing urban patch. Av is the intersection between the existing non-urban area and the buffer zone of the newly grown urban patch [16,21]. We set 1 m as a buffer distance according to the previous study [36]. The LEI value ranges between 0 and 100. When a patch has an LEI value of 0, it belongs to the leapfrog mode; with an LEI value between 0 to 50, it belongs to the edge-expansion mode; otherwise, it belongs to the infilling mode when the LEI is within 50 and 100 [16,36].
The mean expansion index (MEI), reflecting the aggregate properties of the patch mosaic, is the integration of the LEI of all the patches over the full extent of the data and is calculated using Equation (3) [36]:
To describe the characteristic of morphological variation, the area-weighted mean expansion index (AWMEI) was also computed using the following Equation (4) [16]:
where LEIi refers to the value of the LEI for a newly grown urban patch i, and ai is the area of the patch. N is the count of the newly grown urban patches. A refers to the total area of all the newly grown urban patches. A larger MEI or AWMEI value signals a more substantial compacting trend in addition to the landscape expansion [16,36].
2.5. Quantifying the Impact of Urban Agglomeration Evolution on Landscape Pattern Changes
To further quantify the spatial and temporal changes in urban morphology and the impact of urban agglomeration evolution on the city and regional landscape pattern, the landscape metrics were calculated at the class and landscape levels for the whole PRDUA using the Fragstats 4.2 software. Eight frequently used landscape metrics were selected and calculated, including Edge Density (ED), Largest patch index (LPI), Area-weighted Mean Patch Fractal Dimension (FRAC_AM), Area-weighted Mean Contiguity Index Distribution (CONTIG_AM), Contagion index (CONTAG), Aggregation Index (AI), Patch density (PD), and Landscape shape index (LSI). These landscape metrics can accurately capture and quantify urban morphological variations in shape complexity, density, dominance, and aggregation, and can be classified into three types, as shown in Table 1 [50,74]. We also profiled the landscape metrics over time and fitted the change trend of each metric to detect the landscape pattern dynamic along with the evolution of the PRDUA landscape.

Table 1.
The selected Landscape metrics.
3. Results
3.1. Urban Growth and Spatial Expansion of the Urban Agglomeration in the PRDUA
The urbanized land in the PRDUA increased from 1819.8 km2 to 7092.2 km2 between 1985–2015, nearly quadrupling over the 30-year period. The top three cities with the highest increase in urbanized land were Guangzhou, Foshan, and Dongguan, with areas of net increase up to 1036.7 km2, 985.2 km2, and 958.1 km2, respectively. Meanwhile, the top three cities with the fastest increase rates are Dongguan, Huizhou, and Zhongshan, whose increase rates were 5.4, 5.3, and 4.8 times, respectively. The urbanized land area increased linearly at the urban agglomeration scale (Figure 3a) and either linearly or non-linearly at the city scale (Figure 3b).
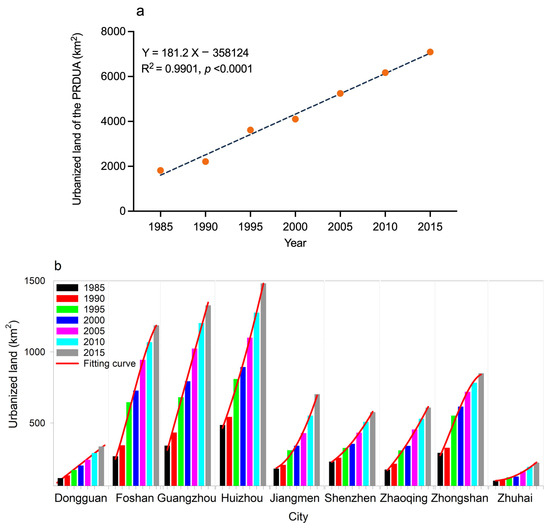
Figure 3.
The growth ways of the urbanized land of the entire urban agglomeration (a) and the nine major cities (b) in different time periods in the PRDUA.
The spatial expansion of the urbanized land exhibited a continuous trend between 1985 and 2015, and the urban expansion was mainly concentrated in the central and southeastern parts of the PRDUA, where Guangzhou, Foshan, Dongguan, and Shenzhen are located (Figure 4). In the earlier period of the urbanization process, between 1985 and 2000, the urban growth was characterized by a rapid expansion, with a large number of scattered newly urbanized patches and the emerging spatial framework of the urban agglomeration. While in the later period of the urbanization process, between 2001 and 2015, the urban growth exhibited a pattern of spatial coalitions, which was characterized by the edge-expansion and infilling modes from the old urban areas and newly grown patches, eventually forming the current morphology of the urban agglomeration.
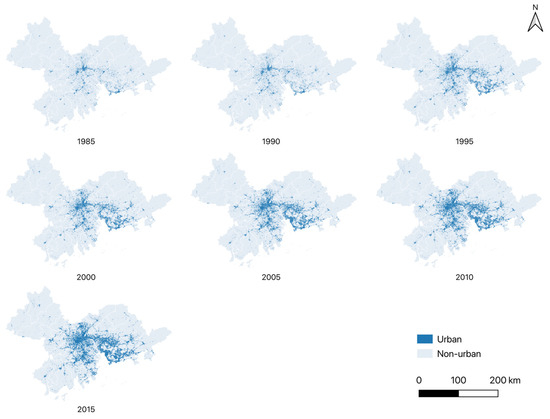
Figure 4.
Spatial patterns of urbanized land in the urban agglomeration in the Pearl River Delta region in different time periods between 1985 and 2015.
The average annual growth rate of urbanized land (AGRUL) in the PRDUA was 4.6% between 1985 and 2015. The AGRUL exhibited a bimodal change pattern, indicating that the PRDUA experienced two rounds of urbanization processes. The first round started in 1985 and covered three periods. During the earlier period of 1985–1990, the AGRUL of the whole PRDUA was 4.0%, and in 1990–1995, it quickly increased to the first peak of 10.4%, which is also the maximum value throughout the whole study period. The value then sharply declined to the minimum value of 2.5% in the period 1995–2000. The second round exhibited a relatively slower growth rate and came to the second peak value of 5.0% during 2000–2005, and then slipped into a gentle decline in the last two periods of 2005–2010 and 2010–2015 (Figure 5).
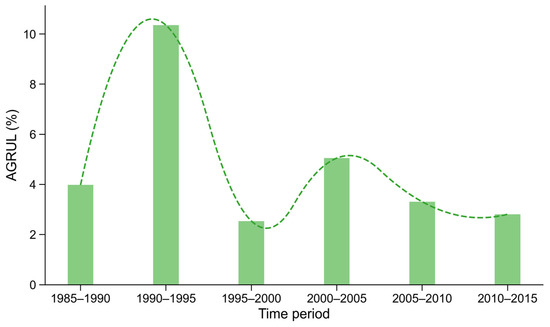
Figure 5.
The average annual growth rate of urbanized land (AGRUL) in the PRDUA in six periods from 1985 to 2015.
3.2. Spatiotemporal Evolution of the Urban Agglomeration in the PRDUA
The spatiotemporal evolutions of the PRDUA were well quantified by the spatial and temporal distribution of three urban growth modes over time, respectively. During the first round of urbanization, in the earlier period of 1985–1990, the spatial evolution of the PRDUA was characterized by the co-occurrence of numerous newly grown small urban patches in the leapfrog and edge-expansion growth modes (Figure 6a); the edge-expansion and infilling modes dominated in the middle period of 1990–1995 (Figure 6b), then switched to the dominance of the infilling mode in the later period of 1995–2000 (Figure 6c). In the second round of urbanization, the spatial expansion of the urban agglomeration was characterized by the co-existence of the edge-expansion and infilling modes between 2000–2005 (Figure 6d) and 2005–2010 (Figure 6e), respectively, while the infilling mode showed overwhelming dominance between 2010–2015 (Figure 6f).
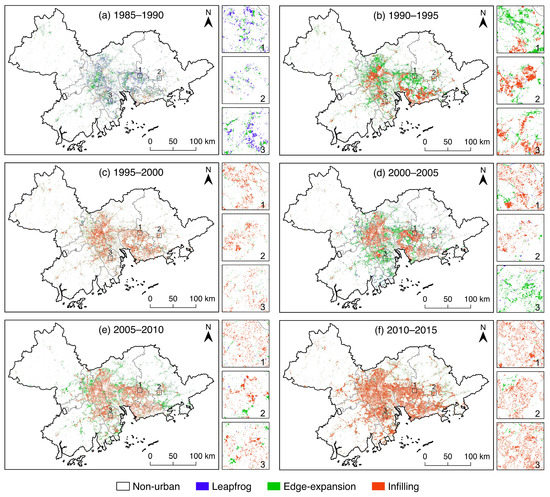
Figure 6.
Spatial patterns of growth modes (infilling, edge-expansion, and leapfrog) in the PRDUA in six periods during 1985–2015, the subplot on the right of each plot highlighted three growth modes.
The temporal trajectories of the urban agglomeration evolution in the PRDUA during the past three decades can be explicitly depicted by the area proportion and the number of newly increased urban patches in the growth modes of infilling, edge-expansion, and leapfrog (Figure 7). Firstly, the three growth modes coexisted in all periods, but presented a pattern of alternating relative dominance, which was indicated by their proportion of area and patch number during the six time periods. Secondly, each urban growth mode displayed a wave-like pattern over time, both in the proportions of patch area and the patch number. Thirdly, in the early stage of each urbanization round, such as the periods of 1985–1990 and 2000–2005, the leapfrog and edge-expansion modes were relatively dominant in terms of both area proportion and patch number. In the middle stages of 1990–1995 and 2005–2010, the edge-expansion and infilling modes were concurrently dominant. In the late stages of 1995–2000 and 2010–2015, the infilling mode was predominant, especially in terms of the area proportion (Figure 7a).
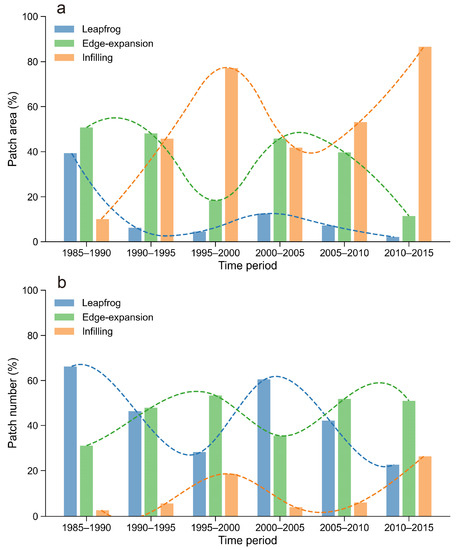
Figure 7.
Temporal patterns of the share of patch area (a) and patch number (b) of three growth modes in the PRDUA over six periods from 1985 to 2015.
The evolution of the PRDUA was also reflected in the other two indices of landscape expansion—the MEI and the AWMEI—both of which presented a wave-like pattern over time. They both started from a small value in the early stage of urbanization and increased gradually to a peak value, and then fell back to a small value and started a new round with a similar increase pattern. This meant that the urban morphological structure presented a dispersal form, indicated by small MEI and AWMEI values in the early urbanization stage, and gradually came to a compact form, indicated by a large and peak value in the late urbanization stage. This followed a process of diffusion and coalescence in the first round of urbanization, and then came to the second round and followed a similar diffusion-coalescence pattern (Figure 8).
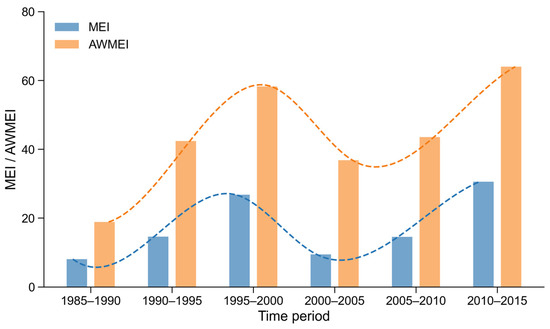
Figure 8.
The MEI and AWMEI in the PRDUA over six periods from 1985 to 2015.
3.3. Landscape Pattern Changes with the Evolution of the Urban Agglomeration in the PRDUA
The variations in the different landscape metrics effectively characterize the landscape pattern changes with urban agglomeration evolution over time in the PRDUA. The class-level landscape metrics reflected the landscape pattern of the urban agglomeration and presented three distinct characteristics. Firstly, the metrics that reflected the shape complexity of the cities, such as the edge density (Figure 9a), the area-weighted mean fractal dimension (Figure 9c), the patch density (Figure 9e), and the landscape shape index (Figure 9g), exhibited an M-shape change pattern, which nearly remained in sync with the wave-like patterns of the urban growth rate (Figure 5), the growth mode (Figure 7), and the landscape expansion indices, the MEI and AWMEI (Figure 8). Secondly, the largest patch index (Figure 9b), the aggregation index of the contiguity (Figure 9d), and the aggregation index (Figure 9f) present a stepwise increase over time. Thirdly, all the landscape metrics generally displayed an increasing trend over time, with the exceptions of the patch density and landscape shape index, which presented a decreasing trend over time.
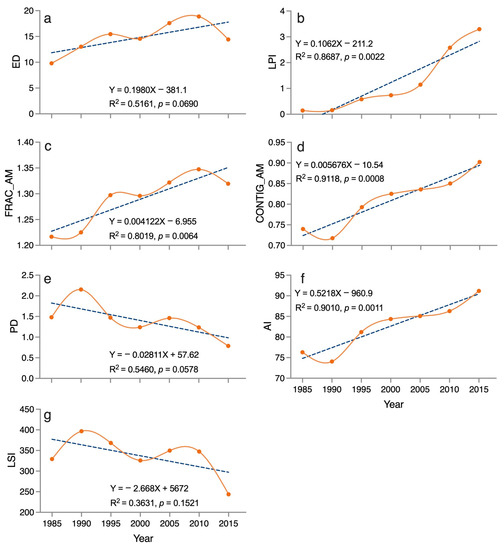
Figure 9.
The temporal change patterns of landscape metrics for urban class in the PRDUA from 1985 to 2015: (a) Edge Density (ED), (b) Largest patch index (LPI), (c) Area-weighted Mean Patch Fractal Dimension (FRAC_AM), (d) Contagion index (CONTAG), (e) Patch density (PD), (f) Aggregation Index (AI), (g) Landscape shape index (LSI). The orange solid lines are trajectories of landscape metrics changes over time, and the blue dash lines are fitting curves of linear regression equations.
The spatiotemporal evolution of the urban agglomeration also influenced the regional landscape pattern, which can be quantified by the changes in the landscape-level metrics over time. Firstly, the shape complexity indices of the edge density (Figure 10a), area-weighted mean fractal dimension (Figure 10c), landscape shape index (Figure 10g), along with the dominance index of patch density (Figure 10e), all presented an M-shaped pattern over time and remained synchronous with the wave-like pattern of urban growth, which was very similar to that of the class-level metrics. Secondly, the temporal pattern of the area-weighted mean contiguity index and the aggregation index showed a W-shaped pattern (Figure 10f,h), while the largest patch index (Figure 10b) and contagion index (Figure 10d) demonstrated a monotonic decline over time. Thirdly, the landscape became more complex, while the landscape dominance and aggregation presented an opposite trend, i.e., a declining trend over time.
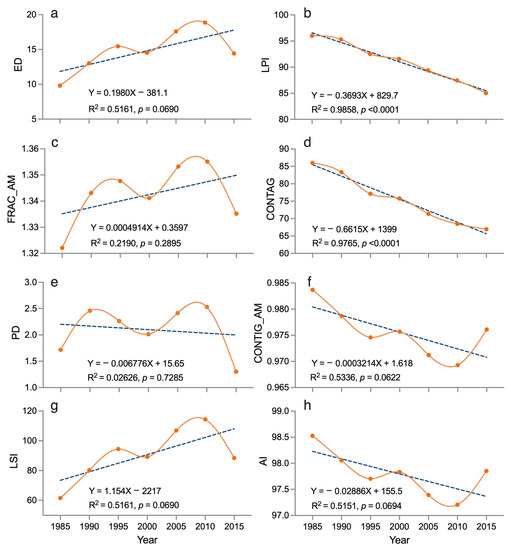
Figure 10.
The temporal change patterns of landscape metrics at the landscape level in the PRDUA from 1985 to 2015: (a) Edge Density (ED), (b) Largest patch index (LPI), (c) Area-weighted Mean Patch Fractal Dimension (FRAC_AM), (d) Contagion index (CONTAG), (e) Patch density (PD), (f) Area-weighted Mean Contiguity Index Distribution (CONTIG_AM), (g) Landscape shape index (LSI), (h) Aggregation Index (AI). The orange solid lines are trajectories of landscape metrics changes over time, and the blue dash lines are fitting curves of linear regression equations.
4. Discussion
4.1. Quantifying Spatiotemporal Evolution of Urban Agglomerations
An urban agglomeration is the outcome of urban growth and spatial aggregation in cities within a region over time. The evolution of an urban agglomeration is normally driven by multiple forces and follows a spatiotemporal pathway from a city cluster to a megalopolis [2]. However, quantifying such a complex spatiotemporal process is a challenge. Our study established a framework consisting of a series of metrics of growth rate, growth modes, and landscape pattern metrics to quantify the evolution of the urban agglomeration in the PRD region over a three-decade period.
Firstly, our temporal change detection, using the AGRUL and growth curve fitting of the urbanized area, explicitly reveals the wave-like urban growth pattern and the two urbanization processes of the PRDUA between 1985–2015 (Figure 5). This method has been applied to detect the urban growth pattern changes in four major cities in the central YRD region [16], as well as individual cities such as Shanghai, Nanjing, Hangzhou, etc. [21,77]. Our method is a more straightforward way to demonstrate the wave-like urban growth pattern than that of previous studies, which utilized landscape metrics along the urbanization gradient to test the wave-like urban growth pattern [42,43]. Our results showed diverse fitting patterns of the urbanized land in the PRD region; the entire urban agglomeration exhibited a linear growth trajectory, while the nine major cities under the PRDUA presented linear, exponential, logarithmic, and logistic growth trajectories over time (Figure 4), which have never been reported for urban agglomerations in other regions. Previous studies showed that three American metropolises outperformed three Chinese urban agglomerations in terms of the degree of compact development or the quality of urban expansion measured by population density [29]. Due to the following reasons, the diverse growth trajectories revealed in this study imply that the Chinese government should adopt different approaches to better manage land-use efficiency and improve the urbanization quality at the regional scale. The AGRUL of the entire PRDUA reached 4.6% in the past 30 years, which is nevertheless lower than that of 7.4% in the YRDUA between 2000–2015 [78].
Secondly, the spatial evolution of an urban agglomeration over time can be quantified and the exact spatial extents can be explicitly delineated using growth modes and landscape expansion indices. Based on the urban growth modes identified using the landscape expansion index, we found that the leapfrog and edge-expansion modes dominated in the early stage of urbanization, which facilitated fast urban expansion, while the infilling mode dominated in the later stages and promoted the coalescence of urban patches. Each mode presented its alternating relative dominance, measured using the proportion of patch area and the patch number in different time periods during the urbanization processes in the PRD region (Figure 6). Other studies that only used limited time period data could not find such an urban growth change pattern of an urban agglomeration. For instance, He et al. [29] and Zhou et al. [78] both identified that edge-expansion was the only primary growth mode in the PRDUA and the YRDUA, respectively, because they only used two and four time-period data, respectively. Yu and Zhou [79] revealed diverse patterns of growth modes in three Chinese urban agglomerations, such as edge-expansion dominating the urban growth in the BTHUA, edge-expansion and infilling dominating in the YRDUA, and infilling dominating in the PRDUA when using the land-use data of 2000, 2005, and 2010. Therefore, changing patterns of long-term urban growth modes can be helpful to explicitly detect the spatial and temporal evolutions of an urban agglomeration over time.
4.2. Morphological Dynamics with Urbanization Processes of Urban Agglomeration
Urban morphology can display highly dynamic and dramatic changes in spatial patterns during rapid urbanization processes. The spatial dynamic of urban morphology with urbanization processes has been widely detected in many countries and regions at the city scale using landscape metrics and/or urban expansion indices [16,21,30,38,42,49,55,70]. A wave-like change pattern of the urban fringe, which was proposed firstly by Blumenfeld [39] and tested by Boyce [40] to demonstrate metropolitan expansion, has been observed. The diffusion-coalescence theory has also been widely tested in individual cities to demonstrate the urban morphological change processes [16,21,38,42]. For urban agglomerations, previous studies successfully detected the morphological changes of urban agglomerations worldwide, but they only partially revealed the urban morphology, such as the landscape pattern [26,78] and the diffusion-coalescence processes of urban growth [25,30]. The earlier study on urban morphological change dynamics in the central YRD detected morphological changes of the urban agglomeration through multiple perspectives, simultaneously, in the landscape pattern, diffusion-coalescence processes, and dispersal-compact processes [16]. Our study revealed that the morphological change of the PRDUA exhibited a wave-like expansion pattern, co-existing diffusion-coalescence processes of the urban form, and an alternating switch between the compact urban form and dispersal urban form that corresponded to the coalescence and diffusion processes, respectively, during the urban form evolution of the past 30 years. Our study confirmed the spiral diffusion-coalescence hypothesis proposed by Li et al. [16], which demonstrated that the three growth modes of leapfrog, edge-expansion, and infilling alternated in relative dominance patterns in a spiral manner during the urbanization processes. Similarly, a study conducted in three Swiss urban agglomerations also supported the spiral diffusion-coalescence hypothesis [28].
Combining the LEI and AWMEI illustrates how the urban morphology changed during rapid urbanization in the PRDUA. The temporal change of the MEI and the AWMEI exhibited a wave-like pattern with two peaks, which implies that the PRDUA experienced two rounds of alternating between dispersal and compact urban forms, which correspond to the two rounds of diffusion and coalescence processes. The temporal variations of the MEI and AWMEI (Figure 7) exhibited a synchronous match with that of the proportions of the patch area and the patch number of infilling and edge-expansion urban patches (Figure 8), but were inverse to that of leapfrog. The diffusion process corresponds to the proliferation of the leapfrog in the early urbanization processes, which results in the dispersal of the urban morphology. The coalescence corresponds to the edge-expansion and infilling in the later urbanization processes, which make the urban form compact. This pattern of diffusion and compaction was also shown in Xinjiang, where the edge-expansion and infilling modes led to the compact growth of urbanized land [34].
4.3. Dual Reflectance of Landscape Metrics to Urban Form and Landscape Pattern Dynamics of Urban Agglomeration
Landscape metrics have been widely used to characterize the urban form and its changes during urbanization [49,53,80,81]. Most of the previous studies were from the perspective of individual cities to identify the compactness or sprawl of the urban form and classified the cities into different groups or types. For instance, Huang et al. [53] used seven landscape metrics and successfully identified the 77 selected cities from Asia, Europe, the USA, Latin America, and Australia as “sprawl” and “compact”, and classified these cities into different groups in terms of the spatial metrics. They also revealed that the urban form of the cities in the developing world was more compact and denser than their counterparts in Europe and North America. Similarly, Schwarz [49] utilized landscape metrics to quantify the urban form of 231 European cities and classified them into eight clusters. Another study used landscape metrics to identify the urban form of 194 cities of the world into four types, namely “compact-grey, transitional, ragged-small, and fragmented-complex”, and they found that the urban forms of these cities tended to be more homogeneous and most of them were in transitional states as a result of their fragmentation and compactness [80]. However, these studies only used one or two time series of land-use data to derive the landscape metrics and could not capture the temporal trajectories of the urban form evolutions over time. Using the landscape metrics derived from the long-term time series land-use data, our study demonstrated that, on one hand, the urban form of the entire PRDUA generally exhibited an increasingly complex evolution trend, reflected by the increasing edge density (Figure 9a), area-weighted mean fractal dimension index (Figure 9b), and regularity indicating by landscape shape index (Figure 9g), and the compact, demonstrated in the declining patch density (Figure 9e), increasing largest patch index (Figure 9b), contiguity (Figure 9d), and aggregation index (Figure 9f). They are similar to the increasing trends in the fragmentation, irregularity, and complexity of the urban form of the YRDUA when measured using landscape metrics [16,78]. On the other hand, the changing trajectory of each landscape metric showed a synchronous pattern with the diffusion and coalescence that resulted in the compactness or dispersal of the urban form of the entire urban agglomeration, which was also observed for the urban agglomeration in the central YRD region [16].
The evolution of the PRDUA influenced the regional landscape pattern, which exhibited a similar change trajectory to that of the urban form itself. Our results demonstrated that the regional landscape of the PRD region also presented temporal change patterns associated with the spatial and temporal evolution of urban agglomerations. For instance, the regional landscape patterns also exhibited wave-like trajectories (Figure 10a,c,e,g), which corresponded to the temporal change patterns of the urban expansion (Figure 5 and Figure 8) and urban form (Figure 9a,c,e,g). On one hand, the shape complexity (Figure 10a,c) and irregularity (Figure 10g) of the regional landscape increased over time, and that of the connectivity of the regional landscape decreased (Figure 10f,h), while the fragmentation increased (Figure 10b,d), which were similar to those observed in the YRDUA [16,78] and those in the BTHUA [57].
4.4. Limitations
There are some limitations in our research that should be addressed in future studies. Firstly, the more detailed urban expansion or the temporal change of urbanized land may not be fully captured using the five-year interval due to the high frequency of land surface changes in the PRDUA, especially for Shenzhen and Guangzhou [82,83]. Shortening the inter-annual interval for the analysis could render a more detailed view of the temporal features of urbanization, which is helpful in understanding the evolution of an urban agglomeration.
Secondly, the details of the spatial changes in the landscape patterns may not be well captured by the 30 m resolution urbanized land derived from the Landsat images. In general, the grain size and extent have been determined by default when the study area was determined; in particular, the data used were derived from remote sensing images. The higher the spatial resolution, the more accurate and finer the scale information of the landscape patterns presented [84,85]. Therefore, fine resolution is preferred when computation efficiency is not a limitation. However, it is hard to acquire satellite data with high resolution at periodical intervals [86], particularly at the regional scale. Therefore, a reliable spatiotemporal data fusion method, such as STARFM or FSDAF [87,88], to improve the spatial resolution and frequency of the images can be further explored.
Thirdly, the dataset we used allows the classification of urban, non-urban, and green recovery, which could not fully describe the complex features of landscapes, such as residential landscape and commercial landscape, and their dynamics. Thus, more detailed classification schemes for time-series remote sensing data for the analysis of landscape changes may provide more accurate characterization. Recently, increasing land-use and land cover datasets at national and global scales have been made freely available and accessible [89], providing us with the possibility to conduct more detailed urban expansion monitoring in the future.
Lastly, most of the landscape expansion indices that were proposed in the previous studies [33,34] only described the temporal change of urban expansion, but overlooked the spatial changes of the evolution process of urbanization. For example, how the cities and in-between areas spatially integrate into an agglomeration and how the interconnected transportation develops [37] still require further studies. Thus, it is suggested to conduct more spatial analysis, and even multiple spatial and temporal scales analyses, to provide more valuable insights for understanding the evolution of an urban agglomeration.
5. Conclusions
Based on the spatiotemporal trajectories of the urban agglomeration and its impacts on the urban and regional landscape patterns in the Pearl River Delta region between 1985 and 2015, we found that the urbanized land area of the entire urban agglomeration increased linearly, with an annual growth rate of 4.6%, while the nine major cities within the PRDUA presented diverse growth trajectories, varying between linear and non-linear. The PRDUA had experienced two cycles of urbanization processes, which were well reflected by a bimodal wave-like pattern of the average annual growth rate of the PRDUA over time. Three urban growth modes—infilling, edge-expansion, and leapfrog—existed simultaneously, but only one mode dominated at a particular period, and the dominant mode alternated during the urbanization processes, demonstrating that the spatiotemporal evolution of the urban growth of the PRDUA follows the “spiral diffusion-coalescence hypothesis”. The morphology of the PRDUA correspondingly showed an alternating dispersal-compacting pattern over time. The city- and regional-level landscape patterns changed synchronously with the spatiotemporal evolution of the PRDUA over time. The response of the landscape patterns agreed well with the change in the growth rate and growth modes. The urbanization of the PRDUA had increased the landscape complexity at the city and regional scales, but also resulted in the increasing fragmentation and decreasing connectivity of the natural landscape in the PRD region. These findings help to better understand how an urban agglomeration evolves and provide insights for regional urban planning and the sustainable development of urban agglomerations.
Author Contributions
Conceptualization, J.L. and C.W.; Methodology, J.L., C.W., J.W., H.W. and L.O.; Software, J.W. and H.W.; Validation, J.W., M.Z. and H.X.; Formal analysis, J.L., J.W. and H.W.; Investigation, Y.L. and C.M.; Resources, J.L.; Data curation, C.W., J.W. and L.O.; Writing—original draft preparation, J.W.; Writing—review and editing, J.L., C.W., Q.Z., C.S. and D.H.; Visualization, J.W.; Supervision, J.L.; Project administration, J.L. and C.W.; Funding acquisition, J.L. and C.W. All authors have read and agreed to the published version of the manuscript.
Funding
This research was partially funded by the Natural Science Foundation of China (Grant No. 32001162 to C.W., Grant No. 31971485 to J.L.), the National Key R&D Program of China (Grant No. 2022YFF1301105 to J.L.), China Postdoctoral Science Foundation 2021M702131 to C.W., and the Joint-PhD project of Shanghai Jiao Tong University and The University of Melbourne to J.L.
Data Availability Statement
The data presented in this study are available on request from the author.
Acknowledgments
We would like to thank the open-access data provided from Xiaoping Liu et al. (https://doi.org/10.6084/m9.figshare.11513178.v1 accessed on 12 March 2021).
Conflicts of Interest
The authors declare no conflict of interest.
References
- Hamel, P.; Guerry, A.D.; Polasky, S.; Han, B.; Douglass, J.A.; Hamann, M.; Janke, B.; Kuiper, J.J.; Levrel, H.; Liu, H.; et al. Mapping the benefits of nature in cities with the InVEST software. Npj Urban Sustain. 2021, 1, 25. [Google Scholar] [CrossRef]
- Fang, C.; Yu, D. Urban agglomeration: An evolving concept of an emerging phenomenon. Landsc. Urban Plan. 2017, 162, 126–136. [Google Scholar] [CrossRef]
- Gouldson, A.; Colenbrander, S.; Sudmant, A.; Godfrey, N.; Zhao, X. Accelerating Low-Carbon Development in the World’s Cities; New Climate Economy: Washington, DC, USA, 2015. [Google Scholar]
- UN. World Urbanization Prospects: The 2018 Revision; United Nations: Nairobi, Kenya, 2019. [Google Scholar]
- Seto, K.C.; Sánchez-Rodríguez, R.; Fragkias, M. The New Geography of Contemporary Urbanization and the Environment. Annu. Rev. Environ. Resour. 2010, 35, 167–194. [Google Scholar] [CrossRef]
- He, C.; Liu, Z.; Tian, J.; Ma, Q. Urban expansion dynamics and natural habitat loss in China: A multiscale landscape perspective. Glob. Chang. Biol. 2014, 20, 2886–2902. [Google Scholar] [CrossRef] [PubMed]
- Grimm, N.B.; Faeth, S.H.; Golubiewski, N.E.; Redman, C.L.; Wu, J.; Bai, X.; Briggs, J.M. Global Change and the Ecology of Cities. Science 2008, 319, 756–760. [Google Scholar] [CrossRef] [PubMed]
- Zhang, Y.; Liu, Y.; Zhang, Y.; Liu, Y.; Zhang, G.; Chen, Y. On the spatial relationship between ecosystem services and urbanization: A case study in Wuhan, China. Sci. Total Environ. 2018, 637–638, 780–790. [Google Scholar] [CrossRef]
- Wu, W.; Zhao, S.; Zhu, C.; Jiang, J. A comparative study of urban expansion in Beijing, Tianjin and Shijiazhuang over the past three decades. Landsc. Urban Plan. 2015, 134, 93–106. [Google Scholar] [CrossRef]
- Jenerette, G.D.; Wu, J. Analysis and simulation of land-use change in the central Arizona—Phoenix region, USA. Landsc. Ecol. 2001, 16, 611–626. [Google Scholar] [CrossRef]
- Luck, M.; Wu, J. A gradient analysis of urban landscape pattern: A case study from the Phoenix metropolitan region, Arizona, USA. Landsc. Ecol. 2002, 17, 327–339. [Google Scholar] [CrossRef]
- Wang, X.; Yan, F.; Su, F. Impacts of Urbanization on the Ecosystem Services in the Guangdong-Hong Kong-Macao Greater Bay Area, China. Remote Sens. 2020, 12, 3269. [Google Scholar] [CrossRef]
- Elmqvist, T.; Andersson, E.; McPhearson, T.; Bai, X.; Bettencourt, L.; Brondizio, E.; Colding, J.; Daily, G.; Folke, C.; Grimm, N.; et al. Urbanization in and for the Anthropocene. NPJ Urban Sustain. 2021, 1, 6. [Google Scholar] [CrossRef]
- Wu, J. A new frontier for landscape ecology and sustainability: Introducing the world’s first atlas of urban agglomerations. Landsc. Ecol. 2022, 37, 1721–1728. [Google Scholar] [CrossRef]
- He, D.; Sun, Z.; Gao, P. Development of Economic Integration in the Central Yangtze River Megaregion from the Perspective of Urban Network Evolution. Sustainability 2019, 11, 5401. [Google Scholar] [CrossRef]
- Li, C.; Li, J.; Wu, J. Quantifying the speed, growth modes, and landscape pattern changes of urbanization: A hierarchical patch dynamics approach. Landsc. Ecol. 2013, 28, 1875–1888. [Google Scholar] [CrossRef]
- Li, C.; Li, J.; Wu, J. What drives urban growth in China? A multi-scale comparative analysis. Appl. Geogr. 2018, 98, 43–51. [Google Scholar] [CrossRef]
- Zhao, S.; Zhou, D.; Zhu, C.; Qu, W.; Zhao, J.; Sun, Y.; Huang, D.; Wu, W.; Liu, S. Rates and patterns of urban expansion in China’s 32 major cities over the past three decades. Landsc. Ecol. 2015, 30, 1541–1559. [Google Scholar] [CrossRef]
- Chakraborty, S.; Maity, I.; Dadashpoor, H.; Novotnẏ, J.; Banerji, S. Building in or out? Examining urban expansion patterns and land use efficiency across the global sample of 466 cities with million+ inhabitants. Habitat Int. 2022, 120, 102503. [Google Scholar] [CrossRef]
- Dadashpoor, H.; Azizi, P.; Moghadasi, M. Analyzing spatial patterns, driving forces and predicting future growth scenarios for supporting sustainable urban growth: Evidence from Tabriz metropolitan area, Iran. Sustain. Cities Soc. 2019, 47, 101502. [Google Scholar] [CrossRef]
- Wu, C.; Li, C.; Ouyang, L.; Xiao, H.; Wu, J.; Zhuang, M.; Bi, X.; Li, J.; Wang, C.; Song, C.; et al. Spatiotemporal evolution of urbanization and its implications to urban planning of the megacity, Shanghai, China. Landsc. Ecol. 2023, 38, 1105–1124. [Google Scholar] [CrossRef]
- Novotný, J.; Chakraborty, S.; Maity, I. Urban expansion of the 43 worlds’ largest megacities: A search for unified macro-patterns. Habitat Int. 2022, 129, 102676. [Google Scholar] [CrossRef]
- Feng, R.; Wang, K. The direct and lag effects of administrative division adjustment on urban expansion patterns in Chinese mega-urban agglomerations. Land Use Policy 2022, 112, 105805. [Google Scholar] [CrossRef]
- Zhu, Z.; He, Q. Spatio-temporal evaluation of the urban agglomeration expansion in the middle reaches of the Yangtze River and its impact on ecological lands. Sci. Total Environ. 2021, 790, 148150. [Google Scholar] [CrossRef]
- Xu, S.; Sun, Y.; Zhao, S. Contemporary Urban Expansion in the First Fastest Growing Metropolitan Region of China: A Multicity Study in the Pearl River Delta Urban Agglomeration from 1980 to 2015. Urban Sci. 2021, 5, 11. [Google Scholar] [CrossRef]
- Chakraborty, S.; Maity, I.; Patel, P.P.; Dadashpoor, H.; Pramanik, S.; Follmann, A.; Novotný, J.; Roy, U. Spatio-temporal patterns of urbanization in the Kolkata Urban Agglomeration: A dynamic spatial territory-based approach. Sustain. Cities Soc. 2021, 67, 102715. [Google Scholar] [CrossRef]
- Meng, L.; Sun, Y.; Zhao, S. Comparing the spatial and temporal dynamics of urban expansion in Guangzhou and Shenzhen from 1975 to 2015: A case study of pioneer cities in China’s rapid urbanization. Land Use Policy 2020, 97, 104753. [Google Scholar] [CrossRef]
- Bosch, M.; Jaligot, R.; Chenal, J. Spatiotemporal patterns of urbanization in three Swiss urban agglomerations: Insights from landscape metrics, growth modes and fractal analysis. Landsc. Ecol. 2020, 35, 879–891. [Google Scholar] [CrossRef]
- He, Q.; Zeng, C.; Xie, P.; Tan, S.; Wu, J. Comparison of urban growth patterns and changes between three urban agglomerations in China and three metropolises in the USA from 1995 to 2015. Sustain. Cities Soc. 2019, 50, 101649. [Google Scholar] [CrossRef]
- Sun, Y.; Zhao, S. Spatiotemporal dynamics of urban expansion in 13 cities across the Jing-Jin-Ji Urban Agglomeration from 1978 to 2015. Ecol. Indic. 2018, 87, 302–313. [Google Scholar] [CrossRef]
- Tan, R.; Liu, Y.; Liu, Y.; He, Q.; Ming, L.; Tang, S. Urban growth and its determinants across the Wuhan urban agglomeration, central China. Habitat Int. 2014, 44, 268–281. [Google Scholar] [CrossRef]
- Kabisch, N.; Haase, D. Diversifying European agglomerations: Evidence of urban population trends for the 21st century. Popul. Space Place 2011, 17, 236–253. [Google Scholar] [CrossRef]
- Xia, C.; Zhang, A.; Yeh, A.G.-O. Shape-weighted landscape evolution index: An improved approach for simultaneously analyzing urban land expansion and redevelopment. J. Clean. Prod. 2020, 244, 118836. [Google Scholar] [CrossRef]
- Tian, Y.; Shuai, Y.; Ma, X.; Shao, C.; Liu, T.; Tuerhanjiang, L. Improved Landscape Expansion Index and Its Application to Urban Growth in Urumqi. Remote Sens. 2022, 14, 5255. [Google Scholar] [CrossRef]
- Berling-Wolff, S.; Wu, J. Modeling urban landscape dynamics: A case study in Phoenix, USA. Urban Ecosyst. 2004, 7, 215–240. [Google Scholar] [CrossRef]
- Liu, X.; Li, X.; Chen, Y.; Tan, Z.; Li, S.; Ai, B. A new landscape index for quantifying urban expansion using multi-temporal remotely sensed data. Landsc. Ecol. 2010, 25, 671–682. [Google Scholar] [CrossRef]
- Wilson, E.H.; Hurd, J.D.; Civco, D.L.; Prisloe, M.P.; Arnold, C. Development of a geospatial model to quantify, describe and map urban growth. Remote Sens. Environ. 2003, 86, 275–285. [Google Scholar] [CrossRef]
- Xu, C.; Liu, M.; Zhang, C.; An, S.; Yu, W.; Chen, J.M. The spatiotemporal dynamics of rapid urban growth in the Nanjing metropolitan region of China. Landsc. Ecol. 2007, 22, 925–937. [Google Scholar] [CrossRef]
- Blumenfeld, H. The Tidal Wave of Metropolitan Expansion. J. Am. Inst. Plan. 1954, 20, 3–14. [Google Scholar] [CrossRef]
- Boyce, R.R. The edge of the metropolis: The wave theory analog approach. Br. Columbia Geogr. Ser. 1966, 7, 31–40. [Google Scholar]
- Herold, M.; Goldstein, N.C.; Clarke, K.C. The spatiotemporal form of urban growth: Measurement, analysis and modeling. Remote Sens. Environ. 2003, 86, 286–302. [Google Scholar] [CrossRef]
- Dietzel, C.; Herold, M.; Hemphill, J.J.; Clarke, K.C. Spatio-temporal dynamics in California’s Central Valley: Empirical links to urban theory. Int. J. Geogr. Inf. Sci. 2005, 19, 175–195. [Google Scholar] [CrossRef]
- Li, J.; Li, C.; Zhu, F.; Song, C.; Wu, J. Spatiotemporal pattern of urbanization in Shanghai, China between 1989 and 2005. Landsc. Ecol. 2013, 28, 1545–1565. [Google Scholar] [CrossRef]
- Zhu, C.; Zhang, X.; Zhou, M.; He, S.; Gan, M.; Yang, L.; Wang, K. Impacts of urbanization and landscape pattern on habitat quality using OLS and GWR models in Hangzhou, China. Ecol. Indic. 2020, 117, 106654. [Google Scholar] [CrossRef]
- Grimm, N.B.; Foster, D.; Groffman, P.; Grove, J.M.; Hopkinson, C.S.; Nadelhoffer, K.J.; Pataki, D.E.; Peters, D.P.C. The changing landscape: Ecosystem responses to urbanization and pollution across climatic and societal gradients. Front. Ecol. Environ. 2008, 6, 264–272. [Google Scholar] [CrossRef]
- Xu, H.; Li, C.; Hu, Y.; Li, S.; Kong, R.; Zhang, Z. Quantifying the effects of 2D/3D urban landscape patterns on land surface temperature: A perspective from cities of different sizes. Build. Environ. 2023, 233, 110085. [Google Scholar] [CrossRef]
- Li, K.; Li, C.; Liu, M.; Hu, Y.; Wang, H.; Wu, W. Multiscale analysis of the effects of urban green infrastructure landscape patterns on PM2.5 concentrations in an area of rapid urbanization. J. Clean. Prod. 2021, 325, 129324. [Google Scholar] [CrossRef]
- Solano, F.; Praticò, S.; Piovesan, G.; Chiarucci, A.; Argentieri, A.; Modica, G. Characterizing historical transformation trajectories of the forest landscape in Rome’s metropolitan area (Italy) for effective planning of sustainability goals. Land Degrad. Dev. 2021, 32, 4708–4726. [Google Scholar] [CrossRef]
- Schwarz, N. Urban form revisited—Selecting indicators for characterising European cities. Landsc. Urban Plan. 2010, 96, 29–47. [Google Scholar] [CrossRef]
- Feng, Y.; Liu, Y. Fractal dimension as an indicator for quantifying the effects of changing spatial scales on landscape metrics. Ecol. Indic. 2015, 53, 18–27. [Google Scholar] [CrossRef]
- Hu, Y.; Zhang, Y. Spatial–temporal dynamics and driving factor analysis of urban ecological land in Zhuhai city, China. Sci. Rep. 2020, 10, 16174. [Google Scholar] [CrossRef]
- Darrel Jenerette, G.; Potere, D. Global analysis and simulation of land-use change associated with urbanization. Landsc. Ecol. 2010, 25, 657–670. [Google Scholar] [CrossRef]
- Huang, J.; Lu, X.X.; Sellers, J.M. A global comparative analysis of urban form: Applying spatial metrics and remote sensing. Landsc. Urban Plan. 2007, 82, 184–197. [Google Scholar] [CrossRef]
- Zhang, S.; York, A.M.; Boone, C.G.; Shrestha, M. Methodological Advances in the Spatial Analysis of Land Fragmentation. Prof. Geogr. 2013, 65, 512–526. [Google Scholar] [CrossRef]
- Wu, J.; Jenerette, G.D.; Buyantuyev, A.; Redman, C.L. Quantifying spatiotemporal patterns of urbanization: The case of the two fastest growing metropolitan regions in the United States. Ecol. Complex. 2011, 8, 1–8. [Google Scholar] [CrossRef]
- Dadashpoor, H.; Azizi, P.; Moghadasi, M. Land use change, urbanization, and change in landscape pattern in a metropolitan area. Sci. Total Environ. 2019, 655, 707–719. [Google Scholar] [CrossRef]
- Chu, M.; Lu, J.; Sun, D. Influence of Urban Agglomeration Expansion on Fragmentation of Green Space: A Case Study of Beijing-Tianjin-Hebei Urban Agglomeration. Land 2022, 11, 275. [Google Scholar] [CrossRef]
- Qu, S.; Hu, S.; Li, W.; Wang, H.; Zhang, C.; Li, Q. Interaction between urban land expansion and land use policy: An analysis using the DPSIR framework. Land Use Policy 2020, 99, 104856. [Google Scholar] [CrossRef]
- Liu, L.; Liu, J.; Liu, Z.; Xu, X.; Wang, B. Analysis on the Spatio-Temporal Characteristics of Urban Expansion and the Complex Driving Mechanism: Taking the Pearl River Delta Urban Agglomeration as a Case. Complexity 2020, 2020, 8157143. [Google Scholar] [CrossRef]
- Guangdong Provincal Development and Reform Commission (GPDRC). Outline of Planning of the Pearl River Delta Region Reform and Development (2008–2020). Available online: https://www.gd.gov.cn/attachment/0/513/513375/4094614.pdf (accessed on 12 March 2021).
- Statistics Bureau of Guangdong Province (SBGP). Guangdong Statistical Yearbook. Available online: http://stats.gd.gov.cn/gdtjnj/index.html (accessed on 12 March 2021).
- Zhang, Q.; Su, S. Determinants of urban expansion and their relative importance: A comparative analysis of 30 major metropolitans in China. Habitat Int. 2016, 58, 89–107. [Google Scholar] [CrossRef]
- Bai, X.; Chen, J.; Shi, P. Landscape Urbanization and Economic Growth in China: Positive Feedbacks and Sustainability Dilemmas. Environ. Sci. Technol. 2012, 46, 132–139. [Google Scholar] [CrossRef]
- Jiang, H.; Sun, Z.; Guo, H.; Weng, Q.; Du, W.; Xing, Q.; Cai, G. An assessment of urbanization sustainability in China between 1990 and 2015 using land use efficiency indicators. NPJ Urban Sustain. 2021, 1, 34. [Google Scholar] [CrossRef]
- Seto, K.C.; Güneralp, B.; Hutyra, L.R. Global forecasts of urban expansion to 2030 and direct impacts on biodiversity and carbon pools. Proc. Natl. Acad. Sci. USA 2012, 109, 16083–16088. [Google Scholar] [CrossRef] [PubMed]
- Barrington-Leigh, C.; Millard-Ball, A. A century of sprawl in the United States. Proc. Natl. Acad. Sci. USA 2015, 112, 8244–8249. [Google Scholar] [CrossRef] [PubMed]
- Liu, X.; Huang, Y.; Xu, X.; Li, X.; Li, X.; Ciais, P.; Lin, P.; Gong, K.; Ziegler, A.D.; Chen, A.; et al. High spatiotemporal resolution mapping of global urban change from 1985 to 2015. Nat. Sustain. 2020, 3, 564–570. [Google Scholar] [CrossRef]
- Cao, W.; Zhou, Y.; Li, R.; Li, X.; Zhang, H. Monitoring long-term annual urban expansion (1986–2017) in the largest archipelago of China. Sci. Total Environ. 2021, 776, 146015. [Google Scholar] [CrossRef]
- Ghazaryan, G.; Rienow, A.; Oldenburg, C.; Thonfeld, F.; Trampnau, B.; Sticksel, S.; Jürgens, C. Monitoring of Urban Sprawl and Densification Processes in Western Germany in the Light of SDG Indicator 11.3.1 Based on an Automated Retrospective Classification Approach. Remote Sens. 2021, 13, 1694. [Google Scholar] [CrossRef]
- Kuang, W.; Du, G.; Lu, D.; Dou, Y.; Li, X.; Zhang, S.; Chi, W.; Dong, J.; Chen, G.; Yin, Z.; et al. Global observation of urban expansion and land-cover dynamics using satellite big-data. Sci. Bull. 2021, 66, 297–300. [Google Scholar] [CrossRef]
- Shi, X.; Xu, Y.; Wang, G.; Liu, Y.; Wei, X.; Hu, X. Spatiotemporal Variations in the Urban Heat Islands across the Coastal Cities in the Yangtze River Delta, China. Mar. Geod. 2021, 44, 467–484. [Google Scholar] [CrossRef]
- National Catalogue Service for Geopraphic Information (NCSGI). The Administrative Boundaries and Divisions of the Cities in the PRD Region. Available online: https://www.webmap.cn/main.do?method=index (accessed on 12 March 2021).
- Ministry of Civil Affairs of the People’s Republic of China (MCAPRC). 2015 Administrative Code of the People’s Republic of China. Available online: https://www.mca.gov.cn/article/sj/xzqh/1980/201611/20161115002410.shtml (accessed on 12 March 2021).
- McGarigal, K.; Cushman, S.A.; Ene, E.; FRAGSTATS v4: Spatial Pattern Analysis Program for Categorical and Continuous Maps. Computer Software Program Produced by the Authors at the University of Massachusetts, Amherst. 2012. Available online: https://www.fragstats.org (accessed on 12 March 2021).
- LaGro, J. Assessing patch shape in landscape mosaics. Photogramm. Eng. Remote Sens. 1991, 57, 285–293. [Google Scholar]
- He, H.S.; DeZonia, B.E.; Mladenoff, D.J. An aggregation index (AI) to quantify spatial patterns of landscapes. Landsc. Ecol. 2000, 15, 591–601. [Google Scholar] [CrossRef]
- Fang, C.; Zhao, S. A comparative study of spatiotemporal patterns of urban expansion in six major cities of the Yangtze River Delta from 1980 to 2015. Ecosyst. Health Sustain. 2018, 4, 95–114. [Google Scholar] [CrossRef]
- Zhou, D.; Zhang, L.; Wang, R. Administrative-Hierarchical Urban Land Expansion in China: Urban Agglomeration in the Yangtze River Delta. J. Urban Plan. Dev. 2018, 144, 05018018. [Google Scholar] [CrossRef]
- Yu, W.; Zhou, W. The Spatiotemporal Pattern of Urban Expansion in China: A Comparison Study of Three Urban Megaregions. Remote Sens. 2017, 9, 45. [Google Scholar] [CrossRef]
- Lemoine-Rodríguez, R.; Inostroza, L.; Zepp, H. The global homogenization of urban form. An assessment of 194 cities across time. Landsc. Urban Plan. 2020, 204, 103949. [Google Scholar] [CrossRef]
- Schneider, A.; Woodcock, C.E. Compact, Dispersed, Fragmented, Extensive? A Comparison of Urban Growth in Twenty-five Global Cities using Remotely Sensed Data, Pattern Metrics and Census Information. Urban Stud. 2008, 45, 659–692. [Google Scholar] [CrossRef]
- Ding, K.; Huang, Y.; Wang, C.; Li, Q.; Yang, C.; Fang, X.; Tao, M.; Xie, R.; Dai, M. Time Series Analysis of Land Cover Change Using Remotely Sensed and Multisource Urban Data Based on Machine Learning: A Case Study of Shenzhen, China from 1979 to 2022. Remote Sens. 2022, 14, 5706. [Google Scholar] [CrossRef]
- Gong, J.; Hu, Z.; Chen, W.; Liu, Y.; Wang, J. Urban expansion dynamics and modes in metropolitan Guangzhou, China. Land Use Policy 2018, 72, 100–109. [Google Scholar] [CrossRef]
- Shao, G.; Wu, J. On the accuracy of landscape pattern analysis using remote sensing data. Landsc. Ecol. 2008, 23, 505–511. [Google Scholar] [CrossRef]
- Wu, J. Effects of changing scale on landscape pattern analysis: Scaling relations. Landsc. Ecol. 2004, 19, 125–138. [Google Scholar] [CrossRef]
- Geletič, J.; Lehnert, M.; Savić, S.; Milošević, D. Inter-/intra-zonal seasonal variability of the surface urban heat island based on local climate zones in three central European cities. Build. Environ. 2019, 156, 21–32. [Google Scholar] [CrossRef]
- Feng, G.; Masek, J.; Schwaller, M.; Hall, F. On the blending of the Landsat and MODIS surface reflectance: Predicting daily Landsat surface reflectance. IEEE Trans. Geosci. Remote Sens. 2006, 44, 2207–2218. [Google Scholar] [CrossRef]
- Zhu, X.; Helmer, E.H.; Gao, F.; Liu, D.; Chen, J.; Lefsky, M.A. A flexible spatiotemporal method for fusing satellite images with different resolutions. Remote Sens. Environ. 2016, 172, 165–177. [Google Scholar] [CrossRef]
- Yang, J.; Huang, X. The 30 m annual land cover dataset and its dynamics in China from 1990 to 2019. Earth Syst. Sci. Data 2021, 13, 3907–3925. [Google Scholar] [CrossRef]
Disclaimer/Publisher’s Note: The statements, opinions and data contained in all publications are solely those of the individual author(s) and contributor(s) and not of MDPI and/or the editor(s). MDPI and/or the editor(s) disclaim responsibility for any injury to people or property resulting from any ideas, methods, instructions or products referred to in the content. |
© 2023 by the authors. Licensee MDPI, Basel, Switzerland. This article is an open access article distributed under the terms and conditions of the Creative Commons Attribution (CC BY) license (https://creativecommons.org/licenses/by/4.0/).