Abstract
Combining images from multiple Earth Observing (EO) satellites increases the temporal resolution of the data, overcoming the limitations imposed by low revisit time and cloud coverage. However, this requires an intercalibration process to ensure that there is no radiometric difference in top-of-atmosphere (TOA) observations or to quantify any offset in the respective instruments. In addition, combining vicarious calibration processes to the intercalibration of instruments can provide a useful mechanism to validate and compare data from multiple sensors. The Radiometric Calibration Network (RadCalNet) provides automated surface and top-of-atmosphere reflectance data from multiple participating ground sites that can be used for instrument vicarious calibration. We present a comparative analysis of the Landsat 8 and Landsat 9 Operational Land Imagers (OLI) sensors and validate the data by comparing them to measurements from RadCalNet sites as a quantitative intercalibration approach. RadCalNet serves as a common reference for instrument radiometric calibration, providing SI-traceable TOA reflectance with its associated absolute uncertainties. This paper discusses the method of combining data from multiple sites and calculating the weighted average by comparing the TOA reflectance of the instruments and their associated uncertainties. The presented process provides a SI-traceable intercalibration methodology and quantifies the offset and uncertainty in the Landsat 8 and 9 OLI instruments, demonstrating that the two instruments are in good agreement with each other and the data can be reliably cross-correlated and used by the scientific community.
1. Introduction
The Landsat program is the longest running Earth Observing (EO) enterprise, beginning with the launch of Landsat 1 in 1972, enabling continuous satellite imagery of Earth from the visible to thermal infrared spectrum. The acquired EO images are used to monitor and study terrestrial changes, with applications ranging from investigating agricultural changes, measuring land surface temperatures, monitoring ground water discharge, and mapping snow and ice coverage to name a few [1]. The value of multidecadal Landsat data hinges on the program’s continuity, which provides the longest consistent satellite record, enabling analysis of the past and future terrestrial changes. The Landsat program has employed rigorous calibration and validation methodologies to ensure a consistent data record and to enable fusion of its data with other satellite’s data, with SI-traceable, absolute radiometric calibration being the cornerstone of this effort [2,3,4]. The SI-traceable radiometric calibration of the instruments begins prior to their launch with laboratory-based methods establishing the initial traceability of the sensors as well as establishing the absolute scale for any onboard calibrators. The laboratory calibrations are transferred to orbit through the onboard calibrators during on-orbit sensor commissioning and beyond throughout the life of the instrument. Periodic on-orbit calibrations help to evaluate the stability of the sensor while providing the ability to make corrections for any changes that take place due to the harsh space environment or launch stresses. Vicarious methods play a key role in this transfer to orbit and evaluating the instrument stability over the lifetime of the mission.
The current work describes the absolute radiometric results for the Landsat 9 Operational Land Imager (OLI) based on vicarious calibration data. The launch of Landsat 9 in September 2021, eight years after the launch of Landsat 8, continues the Landsat legacy. Landsat 9 was designed to be nearly identical to Landsat 8, sharing similar sensors: the OLI and the Thermal Infrared Sensor (TIRS), with a total of 11 spectral bands [5] in the visible, near infrared (VNIR), shortwave infrared (SWIR), and thermal infrared (TIR). OLI, built by Ball Aerospace & Technologies Corp in Boulder, Colorado, is a pushbroom imaging radiometer consisting of eight multispectral bands with 30 m spatial resolution and one (band 8) panchromatic band with 15 m spatial resolution [6]. The focal plane array (FPA) consists of 14 Sensor Chip Assemblies (SCAs) to provide the 185 km swath width of OLI. The SCAs are made of Silicon PIN detectors for the VNIRS bands and Mercury–Cadmium–Telluride for the SWIR. The similarity of the two OLI instruments can be seen in their relative spectral response, as shown in Figure 1.
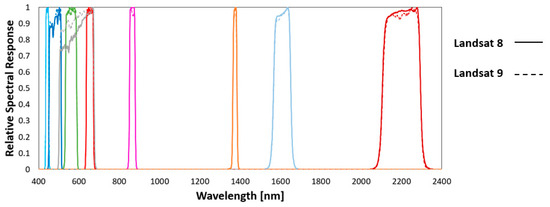
Figure 1.
Relative spectral response of OLI sensor for Landsat 8 and Landsat 9 instruments.
Landsat 9 was placed in the same 705 km, near-polar orbit with a 16-day repeat cycle that was originally occupied by Landsat 7. The orbit is eight days out of phase with Landsat 8 to provide increased temporal coverage. Making use of the eight-day repeat obtained by combining data from Landsats 8 and 9 requires the two instruments to be radiometrically calibrated with an absolute uncertainty <5% (k = 1) in terms of top-of-atmosphere (TOA) spectral radiance and <3% (k = 1) in TOA reflectance for each spectral band [7].
To ensure continuity in the radiometric scale, all Landsat sensors, including Landsat 9, are radiometrically calibrated with traceability to references developed by the National Institute of Standards and Technology (NIST). The prelaunch radiometric calibration and characterization of the Landsat 9 OLI followed similar approaches to those used for Landsat 8 to understand the impacts of non-linearity, polarization, out-of-band response, signal to noise, detector-to-detector uniformity, SCA-to-SCA uniformity, and straylight to the output signal, as well as deriving the sensor’s absolute radiometric gain. The source used for the prelaunch calibration, the dynamic range, linearity, and uniformity of the instrument was a large integrating sphere capable of filling the OLI aperture, though the sensor needed to be rotated in order to illuminate all of the SCAs. Prelaunch testing also evaluated the on-board diffuser and lamp calibrators that provided a transfer of the prelaunch absolute radiometric calibration to orbit.
Once on orbit, the calibration parameters were re-evaluated to determine whether any changes occurred with the sensor in going to orbit and whether updates to the sensor calibration were needed to correct for effects from the launch process, outgassing, and differences in operation on orbit relative to on-ground testing. On-orbit evaluation relies on multiple on-board calibration sources for OLI: one of the two solar diffusers illuminated by the sun and one of the two internal stimulation tungsten halogen lamps. The lamp pair acquisitions are performed once per day and solar diffuser measurements every 8 days. Diffuser calibrations are made most frequently with the working diffuser, while periodic collections make use of the pristine diffuser that allows for evaluation of any temporal degradation effects to the diffuser materials. While prelaunch calibration allows for careful measurement of the instrument parameters in laboratory settings over the full sensor dynamic range and a variety of environmental conditions, the limited sets of on-board calibrations allow for the calibration parameters to be characterized throughout the sensor’s life and correct for any changes that may occur due to the sensor’s operation in the less than hospitable space environment.
Vicarious calibration serves as an alternative radiometric calibration technique independent from on-board and prelaunch calibration. The term encompasses any calibration not directly connected to the satellite system, such as viewing celestial objects or terrestrial sites [8]. In the absence of prelaunch and on-board methods, vicarious approaches serve as the only opportunity for radiometric calibration. Vicarious calibrations also provide a check on the behavior of on-board sources to identify issues relating to failure and degradation of on-board sources. Some of the most commonly used vicarious calibration techniques [9] include imaging the lunar surface, Deep Convective Cloud (DCC), Pseudo-Invariant Calibration Sites (PICS), simultaneous nadir overpass (SNO), and in situ-based measurement approaches [10,11,12,13,14,15,16,17], such as those used by the Radiometric Calibration Network (RadCalNet). Each method has its own strengths and weaknesses, however, and those maintaining a robust Systeme International (SI) traceability can provide both absolute radiometric calibrations as well as offer the opportunity for direct intercomparisons between sensors.
The current work evaluates the early on-orbit absolute radiometric calibration of the Landsat 9 OLI visible and near infrared bands using in situ-based approaches based on RadCalNet data sets. A background on the RadCalNet system, its sites, and uncertainties are provided in Section 2 followed by a description of the general approach used to implement the RadCalNet data for the calibration assessment of the OLI sensors. The emphasis in the current work is on the use of multiple calibration sites in combination with each other rather than treating each site separately. Such an approach leverages the fact that the key element to every RadCalNet site is a documented and peer-reviewed error budget for that site. The methods discussion includes a description on how the results from multiple RadCalNet sites are combined to provide an absolute radiometric calibration of OLIs including an associated uncertainty.
The results of the calibration study indicate that the Landsat 9 OLI sensor agrees with the RadCalNet results to within the combined uncertainties of the OLI absolute calibration and the RadCalNet TOA reflectances. The Landsat 8 results are provided to demonstrate that one year of RadCalNet results for Landsat 9 are sufficient to assess the Landsat 9 OLI absolute calibration. The Landsat 8 results also allow for the intercomparison of Landsat 8 and 9 OLIs, confirming that work carried out by the Landsat 9 calibration team early during sensor commissioning has succeeded in placing both OLI sensors on a similar radiometric scale [18,19]. The results discussion also uses the intercomparison results to provide confidence that combining data sets from multiple RadCalNet sites can be used to increase the number of available calibration opportunities without causing an increase in uncertainties or a significant systematic bias.
2. RadCalNet Background
The Radiometric Calibration Network (RadCalNet) provides automated SI-traceable surface and atmospheric data of designated sites with their corresponding uncertainties to be used for radiometric calibration in the visible and shortwave infrared spectrum [20]. Established by the Working Group on Calibration and Validation of the Committee on Earth Observation Satellites (CEOS-WGCV), RadCalNet serves as a common reference for the calibration and intercalibration of satellite sensors. Currently, there are four RadCalNet sites, located in Railroad Valley Playa (RVUS) in the US, Gobabeb (GONA) in Namibia, LaCrau (LCFR) in France, and Baotou Sand (BSCN) in China. The sites rely on a radiance-based approach using downward-looking radiometers to retrieve the upwelling radiance, which is converted to a nadir-viewing bottom-of-atmosphere (BOA) reflectance from the ratio of the upwelling radiance to the downwelling total irradiance from the sun and sky [21,22]. The BOA reflectance and the measured atmospheric parameters such as column ozone and column water vapor are used as input parameters in the radiative transfer model, MODTRAN, to estimate the TOA reflectance. The TOA reflectance data accompanied with its associated uncertainties is reported in 30 min intervals between 9:00 and 15:00 local standard time [23]. All of the data, including their uncertainties and traceability chain, are quality controlled and peer-reviewed by the RadCalNet Working Group, which is made available through a web portal [24].
Using multiple sites increases the available data and reduces the impact of poor weather events, which is one of the drawbacks of relying on in situ measurements for comparisons to satellite-based imagery, such as is the case with the reflectance-based calibration approach. Combining results from multiple RadCalNet sites allows for data comparison from varying spectral radiance levels while providing enough data sets in a short period of time to allow for the evaluation of sensor calibrations, as is done here for the evaluation of Landsat 9 with less than one year of data.
Each site has its unique characteristics; some have a large uniform area, while others benefit from a more stable climate and thus provide a higher quantity of usable data. RVUS operated by the University of Arizona Remote Sensing Group, located in Nevada, is centered at latitude 38.497° and longitude 115.690°, covering a 1 km × 1 km area [25]. GONA in Namibia is located near the Gobabeb Research Training Center and is operated by the National Physical Laboratory (NPL) in the UK on behalf of the European Space Agency (ESA). The Gobabeb site centered at latitude −23.6002° and longitude 15.119° covers an area of a 30 m radius disk. The La Crau site, in operation since 1987, is the longest operating calibration site and is a 400 m × 400 m pebbly area in France centered at latitude 43.5589° and longitude 4.864°. The Baotou site has two independent areas: one, BTCN relying on an artificial surface consisting of four gravel targets that are each 48 × 48 m2 in size, and the other, BSCN, being an extended sandy site of 300 × 300 m2 centered at latitude 40.865° and longitude 109.6155°. Table 1 below summarizes some of the details of the RadCalNet sites discussed [23].

Table 1.
Description of the four RadCalNet sites with typical uncertainties for BOA and TOA reflectance [23,24].
Each RadCalNet data point has a corresponding uncertainty made available through the RadCalNet portal. The uncertainties are determined for each time and spectral band using a look-up table (LUT) approach derived by the Monte Carlo technique [23]. The solar zenith angle, aerosol type, BOA spectral reflectance, column ozone, and column water vapor are provided by each site owner for each acquisition time and date with their associated uncertainties, which are used as input parameters in a radiative transfer code for calculating the TOA reflectance. The TOA reflectance uncertainties included with each data point are based on the standard deviation of TOA reflectance output from a series of MODTRAN runs based on randomized inputs.
A sample TOA reflectance spectrum and its corresponding uncertainty for a representative date and time from the Railroad Valley site is shown in Figure 2. The reasonably flat TOA reflectance (shown in blue in the graph) is one reason that such sites are selected for vicarious calibration work as the impact from spectral variability is minimized. Band averaging RadCalNet data across sensor spectral bands, as described in Section 3, can effectively negate the spectral band effects, allowing RadCalNet-based calibration results to be compared across wide spectral ranges. It is worth noting that the TOA reflectance spectra show effects from atmospheric absorption by oxygen (the low value at 760 nm) and water vapor absorption (720 and 830 nm as well as the dip at 900 nm). The uncertainty as a function of wavelength is shown in orange in the graph. The uncertainties plotted here are those provided for the time and date corresponding to the TOA reflectance. The values of the uncertainties are those provided by RadCalNet in units of reflectance. A reflectance uncertainty of 0.01 would correspond to a percent uncertainty of 3% for a TOA reflectance of 0.30. The percent uncertainty in TOA reflectance for this date corresponds approximately to 3% to 4% across the spectrum. Similar assessments can be conducted for multiple dates from all four sites, and this leads to the values shown in Table 1, showing that RVUS and GONA have the lowest uncertainties, between 3% to 4%, compared to BSCN and LCFR [26].
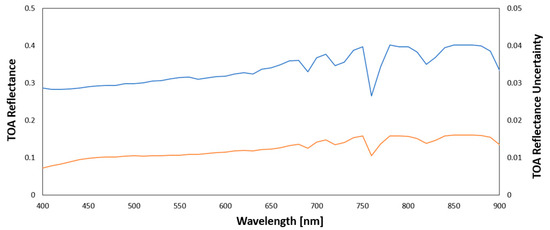
Figure 2.
TOA reflectance (blue) and uncertainty in the TOA reflectance (orange) of a typical RVUS data set.
3. Materials and Methods
The process of calibrating Landsat 9 and 8 with respect to RadCalNet sites [27] requires matching each satellite sensor’s acquisitions with a corresponding RadCalNet data set from the same day. The 30 min interval of RadCalNet TOA reflectance products was chosen to ensure that uncertainties due to temporal differences between the sensor and RadCalNet data would be much less than the total RadCalNet uncertainty. The RadCalNet goal is to provide consistent data at each 30 min interval, but certain portions of data are omitted from some days due to adverse weather conditions, surface moisture effects, or for other reasons based on the judgement of the RadCalNet site owner. The work here has opted for the conservative approach of defining an OLI-to-RadCalNet matchup as taking place when OLI images the corresponding RadCalNet locations on the same day and within 15 min of the nearest RadCalNet point in time.
The OLI data used here is the Collection 2 Level 1 precision terrain corrected imagery (L1TP) and has been obtained through the US Geological Survey (USGS) Earth Explorer portal [28]. OLI spectral bands span the VNIR to shortwave IR as described above; the results reported here focus only on the first five bands of OLI and omit the two SWIR bands. Concentrating on bands 1–5 allows data from all four RadCalNet sites to be used, including BCSN that currently only provides TOA reflectance data from 400 nm to 1000 nm.
The digital numbers (DN) from Landsat Level 1 data are converted to TOA spectral reflectance and corrected for the sun angle using the following equation:
where is the TOA planetary reflectance, is the local sun elevation angle, is the band-specific multiplicative rescaling factor, and is the band-specific additive rescaling factor provided in the metadata. , the pixel DN, is the quantized and calculated standard product pixel values which were extracted from the imagery.
After converting the DN of the OLI images to TOA reflectance, the pixels that cover the corresponding RadCalNet site are selected and averaged, yielding the TOA reflectance value for a given band. The sensor region of interest (ROI) is selected based on the specific location and size of each RadCalNet site. The 30 m spatial resolution of OLIs means that a 33 × 33-pixel ROI is used with the reported RVUS site location to determine the image-based TOA reflectance for RVUS. The ROIs are 2 × 2 pixels for GONA, 2 × 2 for LCFR, and 10 × 10 for BCSN, with all ROIs centered on the coordinates given above. The result is a single TOA image-based reflectance value for each OLI band for each image with RadCalNet matchup. The last step in the matchup process is to account for the OLI relative spectral responses (RSRs) by band averaging the RadCalNet TOA spectral reflectance across the OLI RSRs [26,29].
The results shown in Section 4 concentrate on the analysis of Landsat 9 OLI data from 2022. The reason for limiting the temporal range was to evaluate the early on-orbit behavior of the sensor to assess whether any changes in going to orbit or changes early in the mission lifetime were not corrected by the on-board calibrators. Table 2 shows the number of RadCalNet matchups that were located for each site for Landsat 8 and Landsat 9. It should be noted that that the maximum number of overpasses at each site for the 705 km orbits and 185 km swaths of Landsats 8 and 9 OLI is 23, or equivalently, 92 total possible matchups for all four RadCalNet sites for each OLI. The missing 57 and 68 matchups is the result of no suitable imagery (cloudy conditions or missed acquisition) or no RadCalNet TOA reflectance (cloud-contamination of reflectance and atmospheric collections, poor surface conditions leading to unacceptable uncertainties, anomalous atmospheric conditions, and equipment malfunctions).
Table 2.
Number of Landsat 8 and Landsat 9 matchups at the four RadCalNet test sites in one year (2022).
The long history of use of the Railroad Valley site with Landsat 5, 7, and 8, both with on-site personnel and with automated instrumentation, led to the plan to use the RVUS data to evaluate the early Landsat 9 data. The limited number of available matchups for the RVUS site was one of the motivations for the current work to consider the combination of the multiple RadCalNet sites in order to increase the available data for sensor calibration as well as for intercomparisons between both OLIs. The current work is unique in that it treats each data point from each site as an independent value, allowing it to be combined as part of an ensemble data set, as alluded to in Bouvet et al. [20]. Other works have included data from multiple sites but have kept the results separated according to test site when determining the temporal behavior of a sensor or evaluating an average radiometric calibration coefficient.
One compromise in this work is that the RadCalNet data are not used to determine the absolute radiometric calibration of OLIs but rather to evaluate the consistency of the OLI calibration. The reasons for doing so are a combination of simplicity and ease of presentation. The simplicity is that it allows the use of the Level 1 data products that include geolocation information and avoids the complications of working with raw imagery. The ease of presentation is that it allows data from the multiple bands and sensors to be more readily compared since the sensor gains for each band can differ widely in value, whereas a ratio comparison of TOA reflectance values does not vary by more than a few percent across all of the bands. Thus, the current work ratios the OLI TOA reflectance to the corresponding RadCalNet TOA reflectance to calculate the TOA reflectance ratio (), where a value of 1 indicates a perfect agreement of the instrument with the ground measurement results.
For a given day, the TOA reflectance ratio () is calculated based on the procedure described above. The uncertainty in the TOA reflectance ratio is calculated based on Equation (2):
where is the calculated TOA reflectance ratio, is as defined in (1), and is the TOA reflectance reported by a selected RadCalNet (RCN) site. The first term under the square root, , is the absolute radiometric reflectance uncertainty for the OLI sensors and is taken to have a value of 3% based on prelaunch and on-orbit radiometric calibrations [5]; is the band-averaged uncertainty in the TOA reflectance of the RadCalNet data set reported in the RadCalNet output file corresponding to the band-averaged TOA RCN reflectance, , of the same RadCalNet data set.
The data from all of the sites are combined for a given band and sensor using a weighted mean calculated based on Equation (3) [30]:
The weighted mean reflectance ratio uses and ; then, the mean ratio for a given band, λ, of a selected OLI sensor, j, and a RadCalNet site, RCNk is as follows:
This ensures that more weight is given to values with a lower uncertainty, as each point’s weight is inversely proportional to the square of its uncertainty.
The weighted mean uncertainty in the TOA reflectance ratio uncertainties is calculated based on error propagation of Equation (3) which results in the following [31,32]:
However, the weighted mean uncertainty is not an unbiased estimator because it will underestimate the uncertainty in the TOA reflectance ratios for those data sets with larger numbers of data points. That is, (5) is inversely proportional to the number of measurements. Assuming a set of N measurements with identical , then Equation (5) would suggest that the weighted mean uncertainty would be smaller by a factor of 1/ from the uncertainty in a single measurement. This would be true if the uncertainties being used in (4) and (5) were equivalent to the standard deviations of the means, as typically is the case for computing a relative uncertainty.
The goal in the current work is to assess the uncertainty in the SI-traceable, absolute radiometric calibration. That is, the TOA reflectance ratio uncertainties, are based on absolute radiometric uncertainties of the OLI instrument and the uncertainties of RadCalNet reflectance measurements with an equal confidence in every value regardless of site or date. Therefore, it is reasonable to use Equation (3) to calculate the weighted mean of the TOA reflectance ratio uncertainty, where the weight for every value is taken as unity, such that and . With a weight of 1, Equation (3) reduces to Equation (6), which is the arithmetic mean of the uncertainties.
One advantageous outcome from the methodology is that computed ratios coupled with the uncertainties described above provides a straightforward approach to assess whether the sensor data agree with RadCalNet results at a 95% confidence interval.
4. Results
The TOA reflectance ratio results from all matchups for all RadCalNet sites for all bands from 2022 are shown in Figure 3 for the Landsat 9 OLI. Along with the dashed 1:1 line, there is a distinct clustering of data sets according to site that corresponds to the characteristic surface properties of each site. For example, RVUS, which is a desert site in Nevada, is distinctly brighter with higher reflectance values than LCFR in southern France, which includes vegetated surfaces. While each site has its own unique characteristics that correspond to certain advantages and disadvantages in utilizing them for purposes of vicarious calibration that can be leveraged by the user community, this work provides a numerical methodology to combine them in assessing instrument performance relative to a common reference and its associated uncertainties. The fact that statistical evaluation of the data indicates that it does not differ statistically from the 1:1 line and that there is no clear visual indication of sensor non-linearity or signal-dependent correlative uncertainties gives additional confidence that combining the data sites is reasonable.
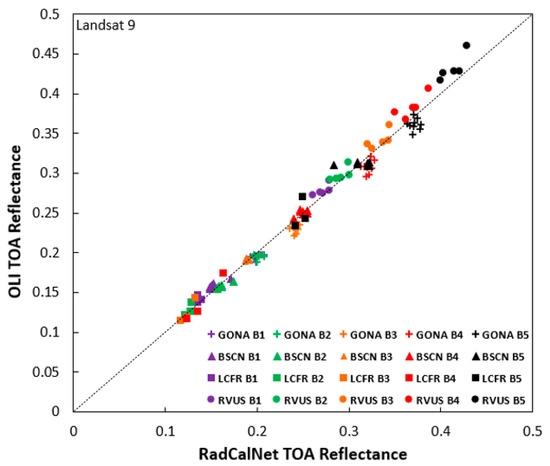
Figure 3.
Scatter plot of TOA reflectance and RadCalNet predicted TOA reflectance for Landsat 9 based on 2022 data set.
A similar plot for the Landsat 8 OLI is provided in Figure 4, but giving results for the entire mission of Landsat 8 and the breakdown by site have been omitted for visual simplicity. The RadCalNet website did not become operational until 2018, but the RVUS site has provided RadCalNet with historical data prior to that date, allowing for the full mission coverage of Landsat 8 but only for the RVUS site prior to 2018. It is clear from the figure that there is visual agreement with the 1:1 line (and statistical agreement as well), indicating that the Landsat 8 OLI has remained radiometrically consistent with the RadCalNet sites for the full lifetime of the mission. There is also a larger scatter amongst the 10-year data set than the one-year results of Figure 3, which is a result of periodic outliers in the RadCalNet results. These points of high discrepancy fall within the k = 2 limits of the combined RadCalNet and OLI uncertainties and are mitigated when averages of RadCalNet results are computed. The availability of two high quality sensors such as Landsat 8 and 9 OLIs gives confidence that determining a cause of such outliers becomes more feasible as more Landsat 9 data become available.
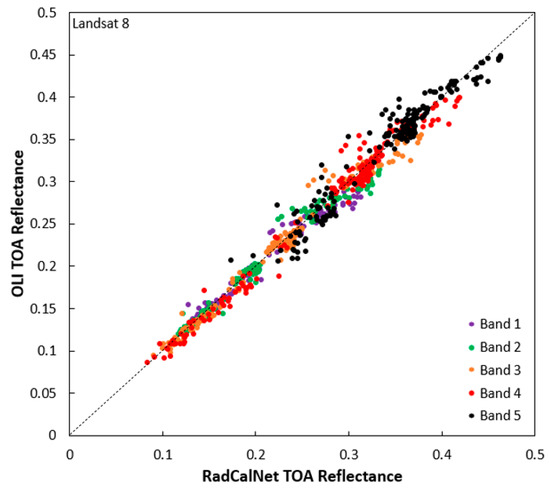
Figure 4.
Scatter plot of TOA reflectance and RadCalNet predicted TOA reflectance for Landsat 8 from 2013 to 2023.
The similar behavior of the OLI sensors shown in Figure 3 and Figure 4 gives confidence that the single year of Landsat 9 data can provide a confident evaluation of the OLI’s absolute radiometric calibration. Figure 5 shows the TOA reflectance ratio for band 4 of the Landsat 9 OLI for each of the 24 RadCalNet matchups. Similar plots for the other four spectral bands display a similar behavior and are omitted for brevity. The results for band 4 show no clear temporal trend in the data or other anomalous behavior that would negate the use of the averaging approach described in Section 3. A similar plot to Figure 5 is provided for the Landsat 8 OLI in Figure 6 for comparison to show that the two instruments are behaving in a similar fashion over the single year of Landsat 9 data provided. Figure 7 is provided to demonstrate that the results for Landsat 8 over the 2022 time frame behave in a similar fashion as the full lifetime. All three figures give confidence in the results drawn from 12 months of vicarious calibration data for the Landsat 9 OLI.
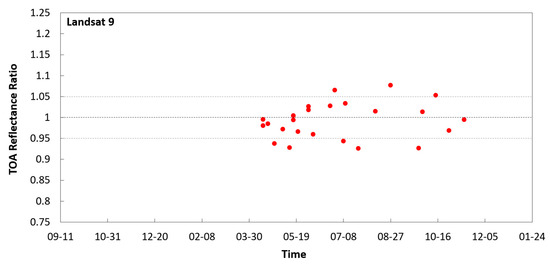
Figure 5.
TOA reflectance ratios for all sites for Landsat 9 OLI band 4 for all dates in 2022.
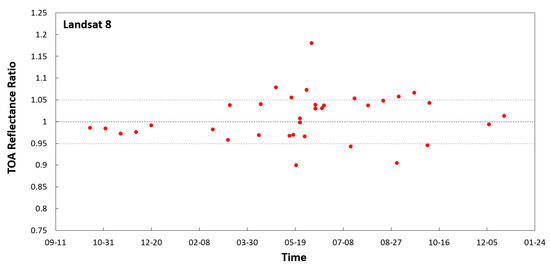
Figure 6.
TOA reflectance ratios for all sites for Landsat 8 OLI band 4 for all dates in 2022.
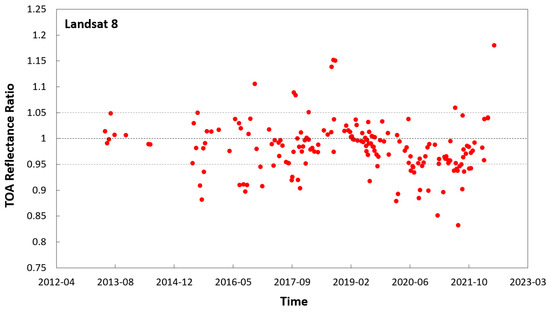
Figure 7.
TOA reflectance ratios for all sites for Landsat 8 OLI band 4 for all dates since 2013.
The average TOA reflectance ratio for all five bands of Landsat 9 is given in Table 3. The close agreement with unity for all five bands gives confidence that the prelaunch calibration, transfer to orbit, and on-board calibrators are providing an absolute radiometric calibration that is well within the mission requirements. Further confidence in the results is obtained when comparing the similar average from Landsat 8 where the mean ratios are within 1% of those from the similar band for Landsat 9. Furthermore, the full-mission results for Landsat 8 are within 1.9% of the 2022 values, indicating that the 2022 period is sufficient to draw conclusions related to the Landsat 9 radiometric quality.
Table 3.
Mean TOA reflectance ratios computed for Landsat 9 OLI for 2022 and for Landsat 8 for the entire mission as well as only 2022. Standard deviations of the average are also provided.
Table 3 also shows the standard deviation of the mean reflectance ratios. The agreement between the Landsat 8 and 9 values in the table implies a similar statistical behavior of the reflectance ratios between the two instruments. The similarity of the OLI builds as well as the other characterization results such as SNR and focal plane uniformity indicate that the two sensors are behaving at similar quality levels [33,34]. The additional conclusion is that the RadCalNet sites are also behaving in a similar fashion between the two sensors.
Table 4 compares the arithmetic mean uncertainty (), the uncertainty in the weighted mean (), and the standard deviation (STDEV) of the TOA reflectance ratios for the five OLI bands for Landsat 8 and 9. It can be seen that the uncertainty in the weighted mean is much smaller than the arithmetic mean uncertainty, which is the more appropriate representation of the uncertainty in the measurements. There is still value in computing the weighted mean and STDEV as indicators of repeatability of the data, but they will not provide an appropriate estimator for the uncertainty in the absolute radiometric calibrations used in the RadCalNet-based ratios.
Table 4.
Standard deviation (STDEV) of the TOA reflectance ratios, the arithmetic mean of the absolute uncertainties (), and the uncertainty in the weighted mean () of bands 1–5 of Landsat 8 and 9 instruments.
Figure 8 shows the mean ratio for Landsat 8 and Landsat 9 as shown in Table 3 and the uncertainty. The data points represent the weighted mean of the TOA reflectance ratios for a given band based on Equation (3). The error bars shown in the figure are based on the average of the absolute uncertainty in the reflectance ratios () calculated using (6). The dashed line represents the absolute uncertainty in the TOA reflectance ratio for an OLI instrument that agrees with the RadCalNet results, i.e., where . The dashed line presented in the plot is calculated from Equation (2) based on RadCalNet uncertainty values measured for one year (2022) and corresponds specifically to Landsat instruments based on the 3% OLI absolute radiometric uncertainty in reflectance. The results of bands one through five indicate that both Landsat 8 and 9 are within 5% of the RadCalNet reflectance as well as within the standard deviation of a given band. Figure 8 shows that the band-to-band results are within the absolute uncertainty in each sensor and that the sensor-to-sensor agreement for a given band is also within the absolute uncertainties, validating the output of the two OLI instruments with respect to a common SI-traceable reference.
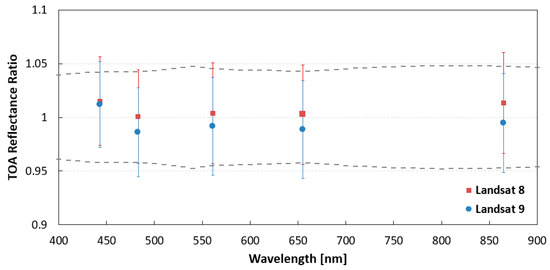
Figure 8.
TOA reflectance ratio as a function of wavelength for bands 1–5 of Landsat 8 and Landsat 9 instruments based on weighted mean of the four RadCalNet sites. The dashed line represents the expected RadCalNet intercalibration uncertainty for an ideal instrument where .
Table 5 highlights the calculated weighted mean reflectance ratios, as seen in Figure 5, with the corresponding average absolute uncertainty in percentage. The double ratio of the Landsat 8 and 9 means provides an estimate of the agreement of the two OLIs with reference to RadCalNet absolute calibration reference. Applying the double ratio values shown through multiplication of Landsat 9 imagery would result in even better agreement between the two data sets. Strictly speaking, such a correction would be viewed primarily as a cosmetic one since the uncertainties shown in Figure 5 indicate that it is not known which of the sensors is more accurately calibrated.
Table 5.
The weighted mean TOA reflectance ratio calculated based on Equation (4) and the arithmetic mean in percentage for the two sensors. The last column provides the ratio of the mean reflectance ratios shown in columns 2 and 3.
5. Discussion
The results shown here demonstrate that RadCalNet sites provide a powerful vicarious calibration method, allowing for the calibration of multiple sensors to a common SI-traceable reference. Examination of the full ensemble of the figures and tables provided in Section 3 provides an initial demonstration that a sensor’s absolute radiometric calibration can be determined from a combination of multiple RadCalNet sites. The uncertainties determined for each individual data point for each spectral band for each site allows the combination to be weighted by the absolute uncertainties. The combination of the sites allows the radiometric calibrations to be determined with greater statistical significance over shorter time periods. The results shown above make use of the high-quality OLI sensors on Landsats 8 and 9 to demonstrate that the independence of the RadCalNet data sets from the multiple sites is sufficient to allow for such an approach.
The quality of OLIs allows for further evaluation of the RadCalNet TOA reflectance. Figure 9 and Figure 10 show the absolute uncertainty in the TOA reflectance ratios as a function of the TOA reflectance ratio. Data for bands 1–5 from all sites and all matchups for the Landsat 8 and 9 instruments are shown. The horizontal spread of the data sets is an indicator of the standard deviations reported in Table 3 and Table 4, and the plots can provide guidance as to whether there is a correlation between the absolute uncertainty and the variation in TOA reflectance ratio. The known behavior of the Landsat 8 OLI and the comparison results shown here for Landsat 9 in Table 3 mean that the TOA reflectance ratios should be near unity. The uncertainties described here and provided with the RadCalNet products indicate that TOA reflectance ratios of more than 0.10 from unity can be viewed as statistically anomalous.
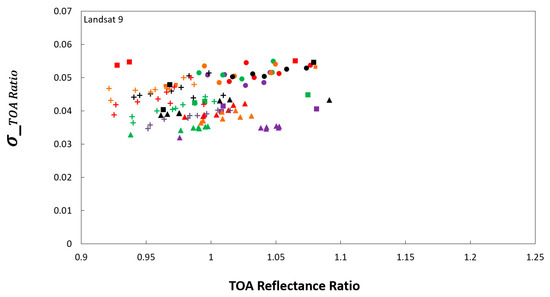
Figure 9.
Absolute uncertainties of TOA reflectance ratios as a function of TOA reflectance ratios for Landsat 9.
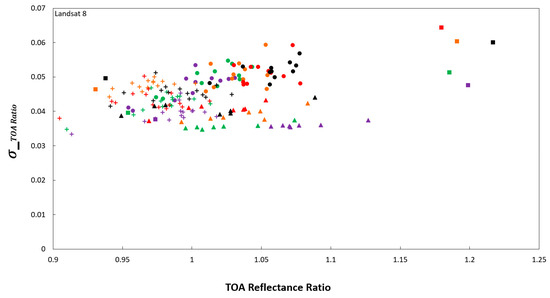
Figure 10.
Absolute uncertainties of TOA reflectance ratios as a function of TOA reflectance ratios for Landsat 8.
One item of note in the figures is that there appears to be a floor to the uncertainties with a value slightly larger than 0.03. This feature is more noticeable in the larger number of Landsat 8 data sets. The cause for this effect is that the TOA reflectance uncertainty is dominated by the uncertainty in the BOA reflectance retrieval for high reflectance test sites such as those currently used for RadCalNet. Atmospheric uncertainties can add to the uncertainty in the overall TOA reflectance but cannot lead to a reduction in the effects from the surface component. There is no obvious correlation between the ratio and uncertainty. A portion of this could be the result of the fact that the RadCalNet data from RVUS goes through a reasonably strict quality control, thus limiting both the high values of the ratio as well as some larger uncertainties.
Figure 9 and Figure 10 also demonstrate one well-known artifact of in situ-based calibration approaches such as those computed for RadCalNet, and that is that lower uncertainties do not always lead to ratios closer to unity. In fact, Figure 8 and Figure 10 show visually what is given in Table 4, where the standard deviation is similar in value to the absolute radiometric uncertainty. The importance of this is that while the variance in the data provides a useful metric in assessing instrument performance, it fails to consider the absolute uncertainties calculated based on Equation (2). Alternatively, the arithmetic mean () of the absolute uncertainties of the TOA reflectance ratios provides a more appropriate assessment of the absolute uncertainty in the measured TOA reflectance ratios, as seen in the error bars in Figure 8.
Such behavior is unique to the in situ methods. Most typical laboratory-grade absolute radiometric calibrations do not significantly lower uncertainties below the RadCalNet results shown here, but the ability to control the conditions under which the calibrations are performed allows the laboratory variance to be an order of magnitude lower than the absolute uncertainties. On-board calibrators have a similar relationship between variance and absolute uncertainty, except that the absolute uncertainty increases in time. The advantage of in situ is that the uncertainties remain stable with time and have been improving with time in many cases [1,35].
The importance of these concepts is that the results plotted in Figure 8 show that each OLI instrument is calibrated to the reference RadCalNet data set within a 5% confidence interval, indicated by the dotted line. Furthermore, the evaluation of the average absolute uncertainties of the TOA reflectance ratios highlights the fact that the two instruments are in radiometric agreement with one another. It should be noted that there is a noticeable difference between the two instruments, with Landsat 8 having higher TOA reflectance values with respect to the measured RadCalNet TOA reflectance, indicated by average ratio values above 1, and with Landsat 9 having average values below 1 for all bands. Results with lower variance would give greater confidence in computing a correction factor between the two sensors to help bring their data into agreement. However, with the available information, it is not possible to assess which one of the two OLI instruments provides the more accurate reference. Thus, RadCalNet can serve as an anchor to normalize the two instruments in calculating an independent correction factor for each instrument for data harmonization when needed, but a data set with both low variability and much higher accuracy would be needed to determine the best correction.
6. Conclusions
The Landsat legacy of data collection has been continued with the successful launch and commissioning of Landsat 9 in September 2021 [36]. Absolute radiometric calibration demonstrating that the Landsat 9 sensors agree with the Landsat 8 sensors is a first step in ensuring that the TOA reflectance data from both systems can be used in tandem by Landsat users. The results shown here also demonstrate that RadCalNet sites provide a powerful vicarious calibration method [37,38,39], allowing for the calibration of multiple sensors to a common SI-traceable reference. The sites were selected because of their spatial homogeneity and favorable atmospheric conditions. The quality control of the data provided by the test site operators and the peer-reviewed SI-traceable uncertainties [40,41] give RadCalNet users the confidence that imaging these sites will provide an absolute radiometric calibration with known uncertainties [42,43,44]. The fact that the data are available free of charge to the community is a testament to the international collaboration of the CEOS WGCV RadCalNet Working Group. Figure 9 and Figure 10 show the TOA reflectance ratios for bands 1–5 of Landsat 9 and 8, respectively, on the x-axis, and the corresponding absolute uncertainty in the TOA reflectance ratios on the y-axis.
One key to ensuring that the Landsat sensors RadCalNet, with its SI-traceable nature and known uncertainties, facilitates the direct comparison of Landsat 8 and Landsat 9 OLI sensors [45,46] with respect to a common reference is having multiple sites, increasing the availability of data in a fixed time and allowing for quick instrument intercalibration. However, in using data from multiple sites, it is important to have a consistent way of combining the data between users. Here, the data from the four sites were combined in intercomparison of the OLI instrument on board Landsat 8 and Landsat 9 based on measuring the weighted mean of the TOA reflectance ratio. The uncertainties of the measurements are calculated based on the arithmetic mean () of the absolute uncertainties of the reflectance ratios, presented as the error bars in Figure 8. As discussed above, the results of the TOA reflectance ratios are not statistically different, which allows for direct comparison of data from both instruments. Intercalibration of the two instruments ensures data continuity of the Landsat program [47,48,49] and verifies that the data can be combined for increased temporal resolution by the user community [50,51,52].
Author Contributions
Conceptualization, N.V., K.T. and B.N.W.; methodology, N.V. and K.T.; software, N.V.; validation, M.H.T. and M.Y.; formal analysis, N.V.; investigation, N.V.; data curation, N.V.; writing—original draft preparation, N.V.; writing—review and editing, K.T. and B.N.W.; visualization, N.V.; supervision, K.T. and B.N.W.; project administration, K.T. and B.N.W.; funding acquisition, K.T. All authors have read and agreed to the published version of the manuscript.
Funding
This research was funded by the National Aeronautics and Space Administration (NASA).
Data Availability Statement
The RadCalNet data are available through the RadCaNet portal at www.radcalnet.org (accessed on 18 January 2023) and the Collection 2 Level 1 Landsat 8 and 9 data presented in this work are available at 10.5066/P975CC9B (accessed on 18 January 2023).
Acknowledgments
Goddard Space Flight Center, Committee on Earth Observation Satellites.
Conflicts of Interest
Authors Norvik Voskanian, Brian Wenny, Mohammad Tahersima and Mehran Yarahmadi were employed by the company Science Systems & Applications and Kurt Thome was employed by NASA. The remaining authors declare that the research was conducted in the absence of any commercial or financial relationships that could be construed as a potential conflict of interest.
References
- Roy, D.P.; Wulder, M.A.; Loveland, T.R.; Woodcock, C.E.; Allen, R.G.; Anderson, M.C.; Helder, D.; Irons, J.R.; Johnson, D.M.; Kennedy, R. Landsat-8: Science and Product Vision for Terrestrial Global Change Research. Remote Sens. Environ. 2014, 145, 154–172. [Google Scholar] [CrossRef]
- Thorne, K.; Markharn, B.; Barker, P.S.; Biggar, S. Radiometric Calibration of Landsat. Photogramm. Eng. Remote Sens. 1997, 63, 853–858. [Google Scholar]
- Markham, B.L.; Arvidson, T.; Barsi, J.A.; Choate, M.; Kaita, E.; Levy, R.; Lubke, M.; Masek, J.G. Landsat Program. Compr. Remote Sens. 2018, 1, 27–90. [Google Scholar]
- Micijevic, E.; Haque, M.O.; Scaramuzza, P.; Storey, J.C.; Anderson, C.; Markham, B.L. Landsat 9 Pre-Launch Sensor Characterization and Comparison with Landsat 8 Results. Proc. Spie 2019. [Google Scholar] [CrossRef]
- Masek, J.G.; Wulder, M.A.; Markham, B.; McCorkel, J.; Crawford, C.J.; Storey, J.; Jenstrom, D.T. Landsat 9: Empowering Open Science and Applications through Continuity. Remote Sens. Environ. 2020, 248, 111968. [Google Scholar] [CrossRef]
- Barsi, J.A.; Markham, B.L. Early Radiometric Performance Assessment of the Landsat-8 Operational Land Imager (OLI). Proc. SPIE 2013. [Google Scholar] [CrossRef]
- Irons, J.R.; Dwyer, J.L.; Barsi, J.A. The next Landsat Satellite: The Landsat Data Continuity Mission. Remote Sens. Environ. 2012, 122, 11–21. [Google Scholar] [CrossRef]
- Tansock, J.; Bancroft, D.; Butler, J.; Cao, C.; Datla, R.; Hansen, S.; Helder, D.; Kacker, R.; Latvakoski, H.; Mylnczak, M. Guidelines for Radiometric Calibration of Electro-Optical Instruments for Remote Sensing; National Institute of Standards and Technology: Gaithersburg, MA, USA, 2015. [Google Scholar]
- Kabir, S.; Leigh, L.; Helder, D. Vicarious Methodologies to Assess and Improve the Quality of the Optical Remote Sensing Images: A Critical Review. Remote Sens. 2020, 12, 4029. [Google Scholar] [CrossRef]
- Vermote, E.; Saleous, N. Calibration of NOAA16 AVHRR over a Desert Site Using MODIS Data. Remote Sens. Environ. 2006, 105, 214–220. [Google Scholar] [CrossRef]
- Ardanuy, P.; Bergen, B.; Huang, A.; Kratz, G.; Puschell, J.; Schueler, C.; Walker, J. Simultaneous Overpass off Nadir (SOON): A Method for Unified Calibration/Validation across IEOS and GEOSS System of Systems; SPIE: Bellingham, WA, USA, 2006; Volume 6301, p. 630101. [Google Scholar]
- Heidinger, A.K.; Cao, C.; Sullivan, J.T. Using Moderate Resolution Imaging Spectrometer (MODIS) to Calibrate Advanced Very High Resolution Radiometer Reflectance Channels. J. Geophys. Res. Atmos. 2002, 107, AAC-11. [Google Scholar] [CrossRef]
- Wu, A.; Xiong, X.; Cao, C. Terra and Aqua MODIS Inter-comparison of Three Reflective Solar Bands Using AVHRR Onboard the NOAA-KLM Satellites. Int. J. Remote Sens. 2008, 29, 1997–2010. [Google Scholar] [CrossRef]
- Thome, K. In-Flight Intersensor Radiometric Calibration Using Vicarious Approaches. In Post-Launch Calibration of Satellite Sensors; CRC Press: Boca Raton, FL, USA, 2004; pp. 95–102. [Google Scholar]
- Kieffer, H.H.; Wildey, R.L. Establishing the Moon as a Spectral Radiance Standard. J. Atmos. Ocean. Technol. 1996, 13, 360–375. [Google Scholar] [CrossRef]
- Eplee, R.E.; Meister, G.; Patt, F.S.; Barnes, R.A.; Bailey, S.W.; Franz, B.A.; McClain, C.R. On-Orbit Calibration of SeaWiFS. Appl. Opt. 2012, 51, 8702–8730. [Google Scholar] [CrossRef]
- Barnes, R.A.; Eplee, R.E.; Patt, F.S.; McClain, C.R. Changes in the Radiometric Sensitivity of SeaWiFS Determined from Lunar and Solar-Based Measurements. Appl. Opt. 1999, 38, 4649–4664. [Google Scholar] [CrossRef] [PubMed]
- Micijevic, E.; Barsi, J.; Haque, M.O.; Levy, R.; Anderson, C.; Thome, K.; Czapla-Myers, J.; Helder, D. Radiometric Performance of the Landsat 9 Operational Land Imager over the First 8 Months on Orbit; SPIE: Bellingham, WA, USA, 2022; Volume 12232, pp. 250–257. [Google Scholar]
- Gross, G.; Helder, D.; Begeman, C.; Leigh, L.; Kaewmanee, M.; Shah, R. Initial Cross-Calibration of Landsat 8 and Landsat 9 Using the Simultaneous Underfly Event. Remote Sens. 2022, 14, 2418. [Google Scholar] [CrossRef]
- Bouvet, M.; Thome, K.; Berthelot, B.; Bialek, A.; Czapla-Myers, J.; Fox, N.P.; Goryl, P.; Henry, P.; Ma, L.; Marcq, S. RadCalNet: A Radiometric Calibration Network for Earth Observing Imagers Operating in the Visible to Shortwave Infrared Spectral Range. Remote Sens. 2019, 11, 2401. [Google Scholar] [CrossRef]
- Slater, P.; Biggar, S.; Holm, R.; Jackson, R.; Mao, Y.; Moran, M.; Palmer, J.; Yuan, B. Reflectance-and Radiance-Based Methods for the in-Flight Absolute Calibration of Multispectral Sensors. Remote Sens. Environ. 1987, 22, 11–37. [Google Scholar] [CrossRef]
- Thome, K.; Wenny, B.; Anderson, N.; McCorkel, J.; Czapla-Myers, J.; Biggar, S. Ultra-Portable Field Transfer Radiometer for Vicarious Calibration of Earth Imaging Sensors. Metrologia 2018, 55, S104. [Google Scholar] [CrossRef]
- Wenny, B.N.; Thome, K. Look-up Table Approach for Uncertainty Determination for Operational Vicarious Calibration of Earth Imaging Sensors. Appl. Opt. 2022, 61, 1357–1368. [Google Scholar] [CrossRef]
- RadCalNet Portal. Available online: www.radcalnet.org (accessed on 1 March 2023).
- RadCalNet Quick Start Guide. Available online: https://www.radcalnet.org/resources/RadCalNetQuickstartGuide_20180702.pdf (accessed on 1 July 2022).
- Jing, X.; Leigh, L.; Teixeira Pinto, C.; Helder, D. Evaluation of RadCalNet Output Data Using Landsat 7, Landsat 8, Sentinel 2A, and Sentinel 2B Sensors. Remote Sens. 2019, 11, 541. [Google Scholar] [CrossRef]
- Czapla-Myers, J.; McCorkel, J.; Anderson, N.; Thome, K.; Biggar, S.; Helder, D.; Aaron, D.; Leigh, L.; Mishra, N. The Ground-Based Absolute Radiometric Calibration of Landsat 8 OLI. Remote Sens. 2015, 7, 600–626. [Google Scholar] [CrossRef]
- USGS EarthExplorer Portal. Available online: https://earthexplorer.usgs.gov (accessed on 1 March 2023).
- Chander, G.; Mishra, N.; Helder, D.L.; Aaron, D.B.; Angal, A.; Choi, T.; Xiong, X.; Doelling, D.R. Applications of Spectral Band Adjustment Factors (SBAF) for Cross-Calibration. IEEE Trans. Geosci. Remote Sens. 2012, 51, 1267–1281. [Google Scholar] [CrossRef]
- Cox, M. The Evaluation of Key Comparison Data. Metrologia 2002, 39, 589. [Google Scholar] [CrossRef]
- Zhang, N.F. The Uncertainty Associated with the Weighted Mean of Measurement Data. Metrologia 2006, 43, 195. [Google Scholar] [CrossRef]
- Rukhin, A.L. Weighted Means Statistics in Interlaboratory Studies. Metrologia 2009, 46, 323. [Google Scholar] [CrossRef][Green Version]
- Kabir, S.; Pahlevan, N.; O’Shea, R.E.; Barnes, B.B. Leveraging Landsat-8/-9 Underfly Observations to Evaluate Consistency in Reflectance Products over Aquatic Environments. Remote Sens. Environ. 2023, 296, 113755. [Google Scholar] [CrossRef]
- Moghimi, A.; Sarmadian, A.; Mohammadzadeh, A.; Celik, T.; Amani, M.; Kusetogullari, H. Distortion Robust Relative Radiometric Normalization of Multitemporal and Multisensor Remote Sensing Images Using Image Features. IEEE Trans. Geosci. Remote Sens. 2022, 60, 5400820. [Google Scholar] [CrossRef]
- Yang, X.; Lo, C.P. Relative Radiometric Normalization Performance for Change Detection from Multi-Date Satellite Images. Photogramm. Eng. 2000, 66, 967–980. [Google Scholar]
- Slater, P.N.; Biggar, S.F.; Thome, K.J.; Gellman, D.I.; Spyak, P.R. Vicarious radiometric calibrations of EOS sensors. Am. Meteorol. Soc. 1996, 13, 349–359. [Google Scholar] [CrossRef]
- Schmechtig, C.; Santer, R.; Roger, J.C.; Meygret, A. Automatic ground-based station for vicarious calibration. In Proceedings of the Sensors, Systems, and Next-Generation Satellites, London, UK, 31 December 1997. [Google Scholar]
- Slater, P.N.; Biggar, S.F.; Palmer, J.M.; Thome, K.J. Unified approach to absolute radiometric calibration in the solar-reflective range. Remote Sens. Environ. 2001, 77, 293–303. [Google Scholar] [CrossRef]
- Newell, D.B.; Tiesinga, E. The International System of Units (SI); NIST Special Publication 330; National Institute of Standards and Technology: Gaithersburg, MD, USA, 2019. [Google Scholar]
- Joint Committee for Guides in Metrology. Evaluation of Measurement Data—Guide to the Expression of Uncertainty in Measurement; JCGM: Sèvres, France, 2008. [Google Scholar]
- Turpie, K.R.; Casey, K.A.; Crawford, C.J.; Guild, L.S.; Kieffer, H.H.; Lin, G.; Kokaly, R.F.; Shrestha, A.K.; Anderson, C.; Chandra, S.N.R.; et al. Calibration and Validation for the Surface Biology and Geology (SBG) Mission Concept: Recommendations for a Multi-Sensor System for Imaging Spectroscopy and Thermal Imagery. J. Geophys. Res. Biogeosciences 2023, 128. [Google Scholar] [CrossRef]
- Han, J.; Tao, Z.; Xie, Y.; Li, H.; Yi, H.; Guan, X. Validation of the TOA Products of the Baotou Sandy Site with Landsat8/OLI Considering BRDF Correction. IEEE Trans. Geosci. Remote Sens. 2023, 61, 1–11. [Google Scholar] [CrossRef]
- Byford, N.; Coburn, C.A. Temporal Variation in Surface Bidirectional Reflectance of the Railroad Valley Vicarious Calibration Test Site in Nevada. Can. J. Remote Sens. 2022, 48, 722–736. [Google Scholar] [CrossRef]
- Voskanian, N.; Wenny, B.N.; Tahersima, M.H.; Thome, K. Inter-calibration of Landsat 8 and 9 operational land imagers. In Proceedings of the SPIE Optical Engineering + Applications, San Diego, CA, USA, 21–26 August 2022; Volume 12232, pp. 270–274. [Google Scholar]
- Tahersima, M.H.; Wenny, B.N.; Voskanian, N.; Thome, K. Intercomparison of Landsat and Joint Polar Satellite System using RadCalNet. In Proceedings of the SPIE Optical Engineering + Applications, San Diego, CA, USA, 21–26 August 2022; Volume 12232, pp. 352–357. [Google Scholar]
- Wulder, M.A.; Roy, D.P.; Radeloff, V.C.; Loveland, T.R.; Anderson, M.C.; Johnson, D.M.; Healey, S.P.; Zhu, Z.; Scambos, T.A.; Pahlevan, N.; et al. Fifty Years of Landsat Science and Impacts. Remote Sens. Environ. 2022, 280, 113195. [Google Scholar] [CrossRef]
- Song, X.-P. The Future of Global Land Change Monitoring. Int. J. Digit. Earth 2023, 16, 2279–2300. [Google Scholar] [CrossRef]
- Zhu, Z.; Qiu, S.; Su, Y. Remote Sensing of Land Change: A Multifaceted Perspective. Remote Sens. Environ. 2022, 282, 113266. [Google Scholar] [CrossRef]
- Sivanpillai, R.; Congalton, R.G. Future Landsat Data Needs at the Local and State Levels: An AmericaView Perspective. Photogramm. Eng. Remote Sens. 2016, 82, 617–623. [Google Scholar] [CrossRef]
- Wu, Z.; Snyder, G.I.; Vadnais, C.M.; Arora, R.; Babcock, M.; Stensaas, G.L.; Doucette, P.; Newman, T.J. User Needs for Future Landsat Missions. Remote Sens. Environ. 2019, 231, 111214. [Google Scholar] [CrossRef]
- Leimgruber, P.; Christen, C.A.; Laborderie, A. The Impact of Landsat Satellite Monitoring on Conservation Biology. Environ. Monit. Assess. 2005, 106, 81–101. [Google Scholar] [CrossRef]
- Landgrebe, D.A. The Evolution of Landsat Data Analysis. Photogramm. Eng. Remote Sens. 1997, 63, 859–867. [Google Scholar]
Disclaimer/Publisher’s Note: The statements, opinions and data contained in all publications are solely those of the individual author(s) and contributor(s) and not of MDPI and/or the editor(s). MDPI and/or the editor(s) disclaim responsibility for any injury to people or property resulting from any ideas, methods, instructions or products referred to in the content. |
© 2023 by the authors. Licensee MDPI, Basel, Switzerland. This article is an open access article distributed under the terms and conditions of the Creative Commons Attribution (CC BY) license (https://creativecommons.org/licenses/by/4.0/).