Article

Surface Soil Moisture Determination of Irrigated and Drained Agricultural Lands with the OPTRAM Method and Sentinel-2 Observations

by
Tomasz Stańczyk
1,
Wiesława Kasperska-Wołowicz
2,*,
Jan Szatyłowicz
3,
Tomasz Gnatowski
3 and
Ewa Papierowska
4
1
Department of Hydrology, Meteorology and Water Management, Institute of Environmental Engineering, Warsaw University of Life Sciences—SGGW, Nowoursynowska 166, 02-787 Warsaw, Poland
2
Institute of Technology and Life Sciences—National Research Institute, Falenty, Hrabska 3, 05-090 Raszyn, Poland
3
Department of Environmental Development, Institute of Environmental Engineering, Warsaw University of Life Sciences—SGGW, Nowoursynowska 166, 02-787 Warsaw, Poland
4
Water Centre, Warsaw University of Life Sciences—SGGW, Jana Ciszewskiego 6, 02-766 Warsaw, Poland
*
Author to whom correspondence should be addressed.
Remote Sens. 2023, 15(23), 5576; https://doi.org/10.3390/rs15235576
Submission received: 5 October 2023 / Revised: 25 November 2023 / Accepted: 26 November 2023 / Published: 30 November 2023

Abstract

:
Surface soil moisture (SSM) is one of the factors affecting plant growth. Methods involving direct soil moisture measurement in the field or requiring laboratory tests are commonly used. These methods, however, are laborious and time-consuming and often give only point-by-point results. In contrast, SSM can vary across a field due to uneven precipitation, soil variability, etc. An alternative is using satellite data, for example, optical data from Sentinel-2 (S2). The main objective of this study was to assess the accuracy of SSM determination based on S2 data versus standard measurement techniques in three different agricultural areas (with irrigation and drainage systems). In the field, we measured SSM manually using non-destructive techniques. Based on S2 data, we estimated SSM using the optical trapezoid model (OPTRAM) and calculated eighteen vegetation indices. Using the OPTRAM model gave a high SSM estimating accuracy (R2 = 0.67, RMSE = 0.06). The use of soil porosity in the OPTRAM model significantly improved the results. Among the vegetation indices, at the NDVI ≤ 0.2, the highest value of R2 was obtained for the STR to OPTRAM index, while at the NDVI > 0.2, the shadow index had the highest R2 comparable with OPTRAM.

1. Introduction

Since 2015, Sentinel-2 (S2) has provided multi-spectral high-resolution optical data commonly used for environmental studies [1,2]. Currently, these data are successfully employed, i.e., for land use and land cover classification [3,4,5,6], forest classification and monitoring [7,8,9], wetlands monitoring [10,11], crop monitoring [12], and the estimation of crop production [13]. S2 is equipped with a multi-spectral instrument (MSI) with 13 spectral bands spanning from the visible and near-infrared to the short-wave infrared region of the spectrum [1].
Soil moisture content is one of the direct factors affecting plant growth [14], which plays an essential role in crop quality and yield [15]. Measurement techniques of soil water content can be divided into classical and modern methods and used both in the laboratory and directly in situ. Modern methods are based on soil dielectric properties (e.g., time domain reflectometry (TDR), frequency domain reflectometry), soil moisture potential (tensiometry techniques), infrared waves (in the near-infrared region), radioactive and optical techniques (e.g., polarised light technique, fiber optic sensor technique) [16]. Robinson et al. [17] divided these methods depending on the scale of the measurement area, i.e., measurements at a point with a range of in situ sensors and a large scale (continental) with remote sensing (RS). With the RS technique, the changes in soil moisture are inferred through the soil’s influence on potential electric, magnetic, and gravitational fields [17]. Conventional non-destructive methods, i.e., TDR (in point), are commonly used to validate the RS water content estimations [18]. These methods provide point information, so they do not accurately represent large fields [15]. Among point methods, TDR is one of the most popular in situ techniques [19]. Based on the properties of electromagnetic waves, the TDR method measures wave propagation time along a probe in the soil [20]. This method has many advantages, including high temporal resolution, rapid acquisition, and repeatability of measurements [16,21]. It is dependent on soil bulk density [22], texture [23], salt content, and temperature [24,25]. However, this method requires developing the calibration curves for different soils, which convert the dielectric constant into the soil moisture content. Despite the calibration issues in the field studies [19,21,26], the TDR method has remained one of the non-destructive methods convenient for soil moisture monitoring for a long time. The polynomial calibration curves proposed by Topp et al. [24] are widely used for mineral soils. Unfortunately, calibration curves are not universal since organic matter influences the calibration function [27].
El Hajj et al. [28] proposed an estimate of soil moisture based on the synergic use of radar and optical images from Sentinel-1 (S1) and S2 data. They estimated the soil moisture in a flat agricultural area (up to plot scale) and used the neural networks technique to analyze these data. Bousbih et al. [29] distinguish the following three approaches of soil moisture determination based on RS data: inversion of semi-empirical or physical models, statistical approaches, e.g., neural networks, and change detection algorithms. In their study, the inversion of S1 and S2 data, combined with the Water Cloud Model, was applied. According to Sadeghi et al. [30], the optical trapezoid model (OPTRAM) can be successfully applied to estimate soil moisture from S2 data because it does not require thermal RS data. This model introduced and described by Sadeghi et al. [31] is based on the thermal–optical trapezoid model (TOTRAM), but the short-wave infrared transformed reflectance replaces the land surface temperature. The OPTRAM model is a promising tool since the soil moisture results are close to in situ measurement values, and the model allows the detection of water stress conditions [32].
This study is a part of the INOMEL project (technological innovations and system of monitoring, forecasting, and planning of irrigation and drainage for precise water management on the scale of drainage/irrigation system), which has been introduced as a decision support system for water circulation management (control), including agro-hydro-meteorological monitoring in small agricultural river catchments [33,34]. It is based on conceptual models developed within the project duration to support irrigation and drainage decision-making (for instance, damming ditches’ height). Such a system aims to achieve satisfying and stable yields, optimal soil moisture (soil water content), and an effective and optimized use of local water resources (precipitation, groundwater, and surface water). For the system to be practically used by farmers and local water resources administrators in the future, its individual modules and components (evapotranspiration, soil moisture, and depth of groundwater) should be verified. Estimating the distribution of soil moisture on the field, both in space and time, using satellite imagery will help practitioners in making irrigation and drainage decisions. It will also enable precise water management at the facility scale. While soil moisture measurement in the deep root zone using the RS technique is operationally impossible [35], the measurement in the surface layer can be performed. Surface soil moisture (SSM) is essential for crop germination and in the initial phases of plant growth and development when the root system is not yet sufficiently developed [36].
The main objective of this study was to assess the accuracy of soil moisture determination based on S2 data versus standard measurement techniques in three different agricultural areas (with irrigation and drainage systems). For this purpose, we used the OPTRAM model to estimate SSM and compare these results with the in situ SSM measurement results. We also compared the values of soil moisture measured in the field with several satellite vegetation indices to choose the best method for soil moisture evaluation. As part of this study, we were also interested in verifying the influence of soil type and its porosity and crop condition (density and greenness, NDVI) on soil moisture determination based on S2 data.

2. Materials and Methods
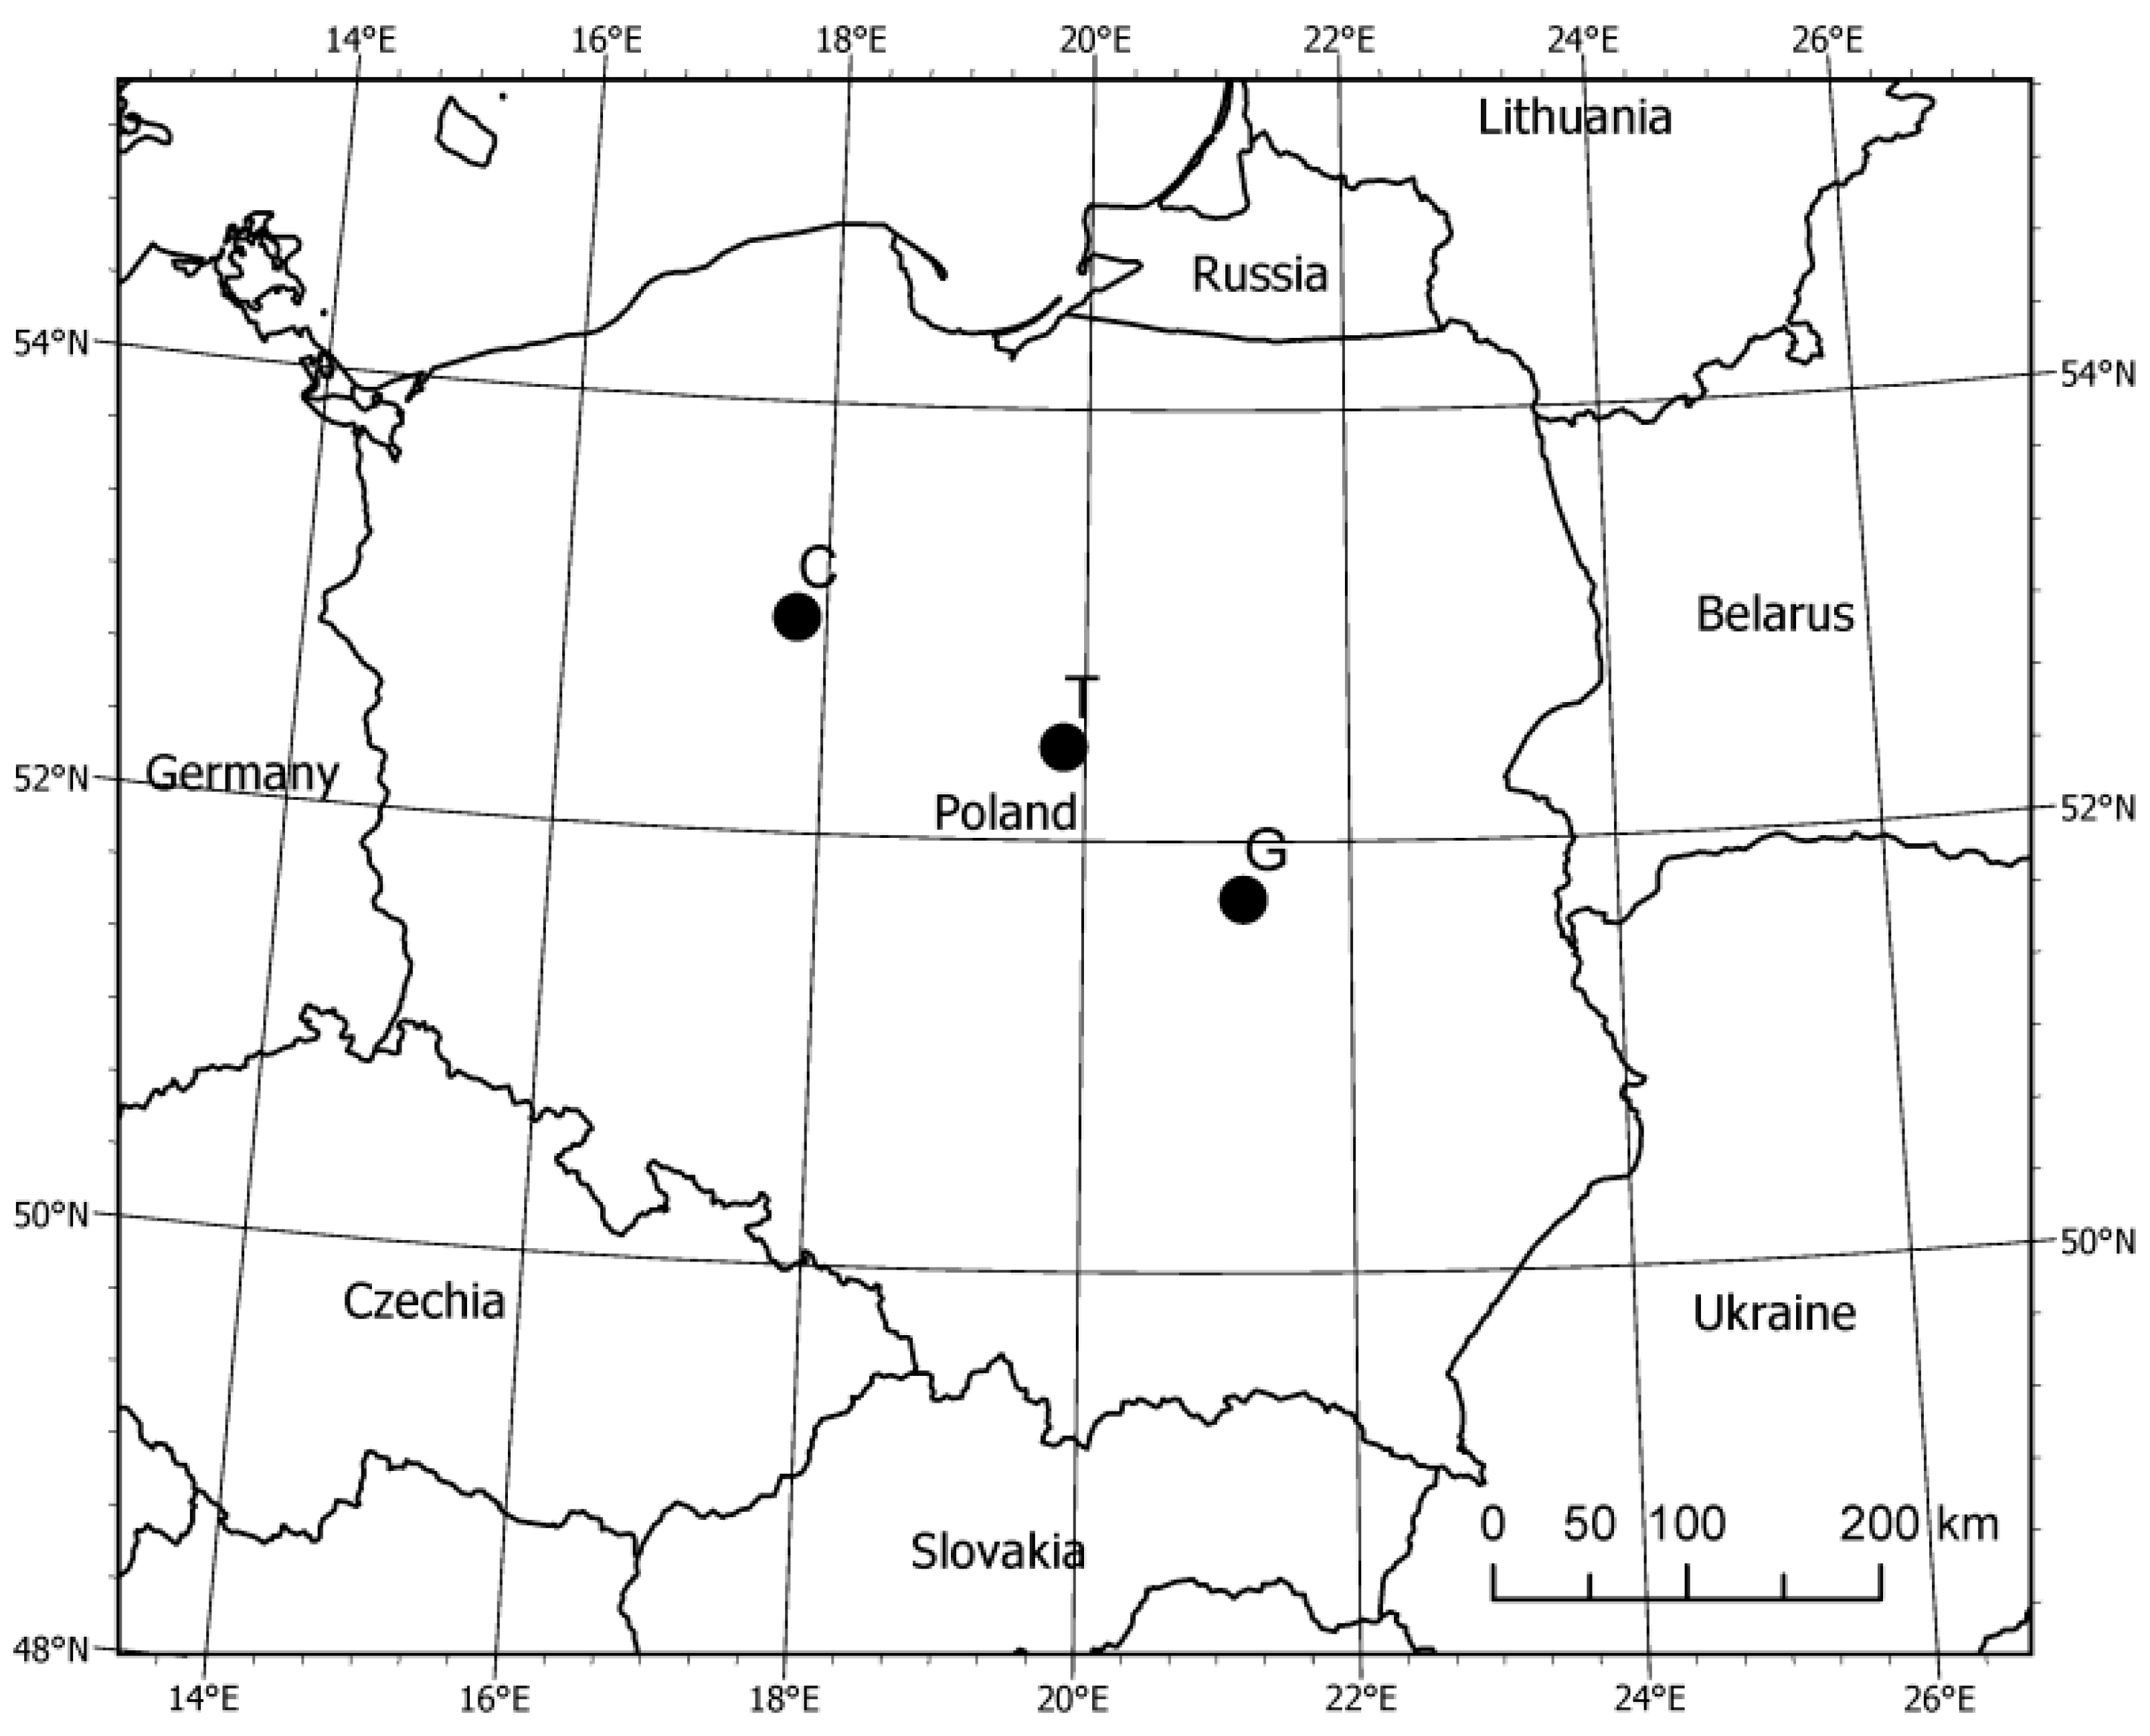
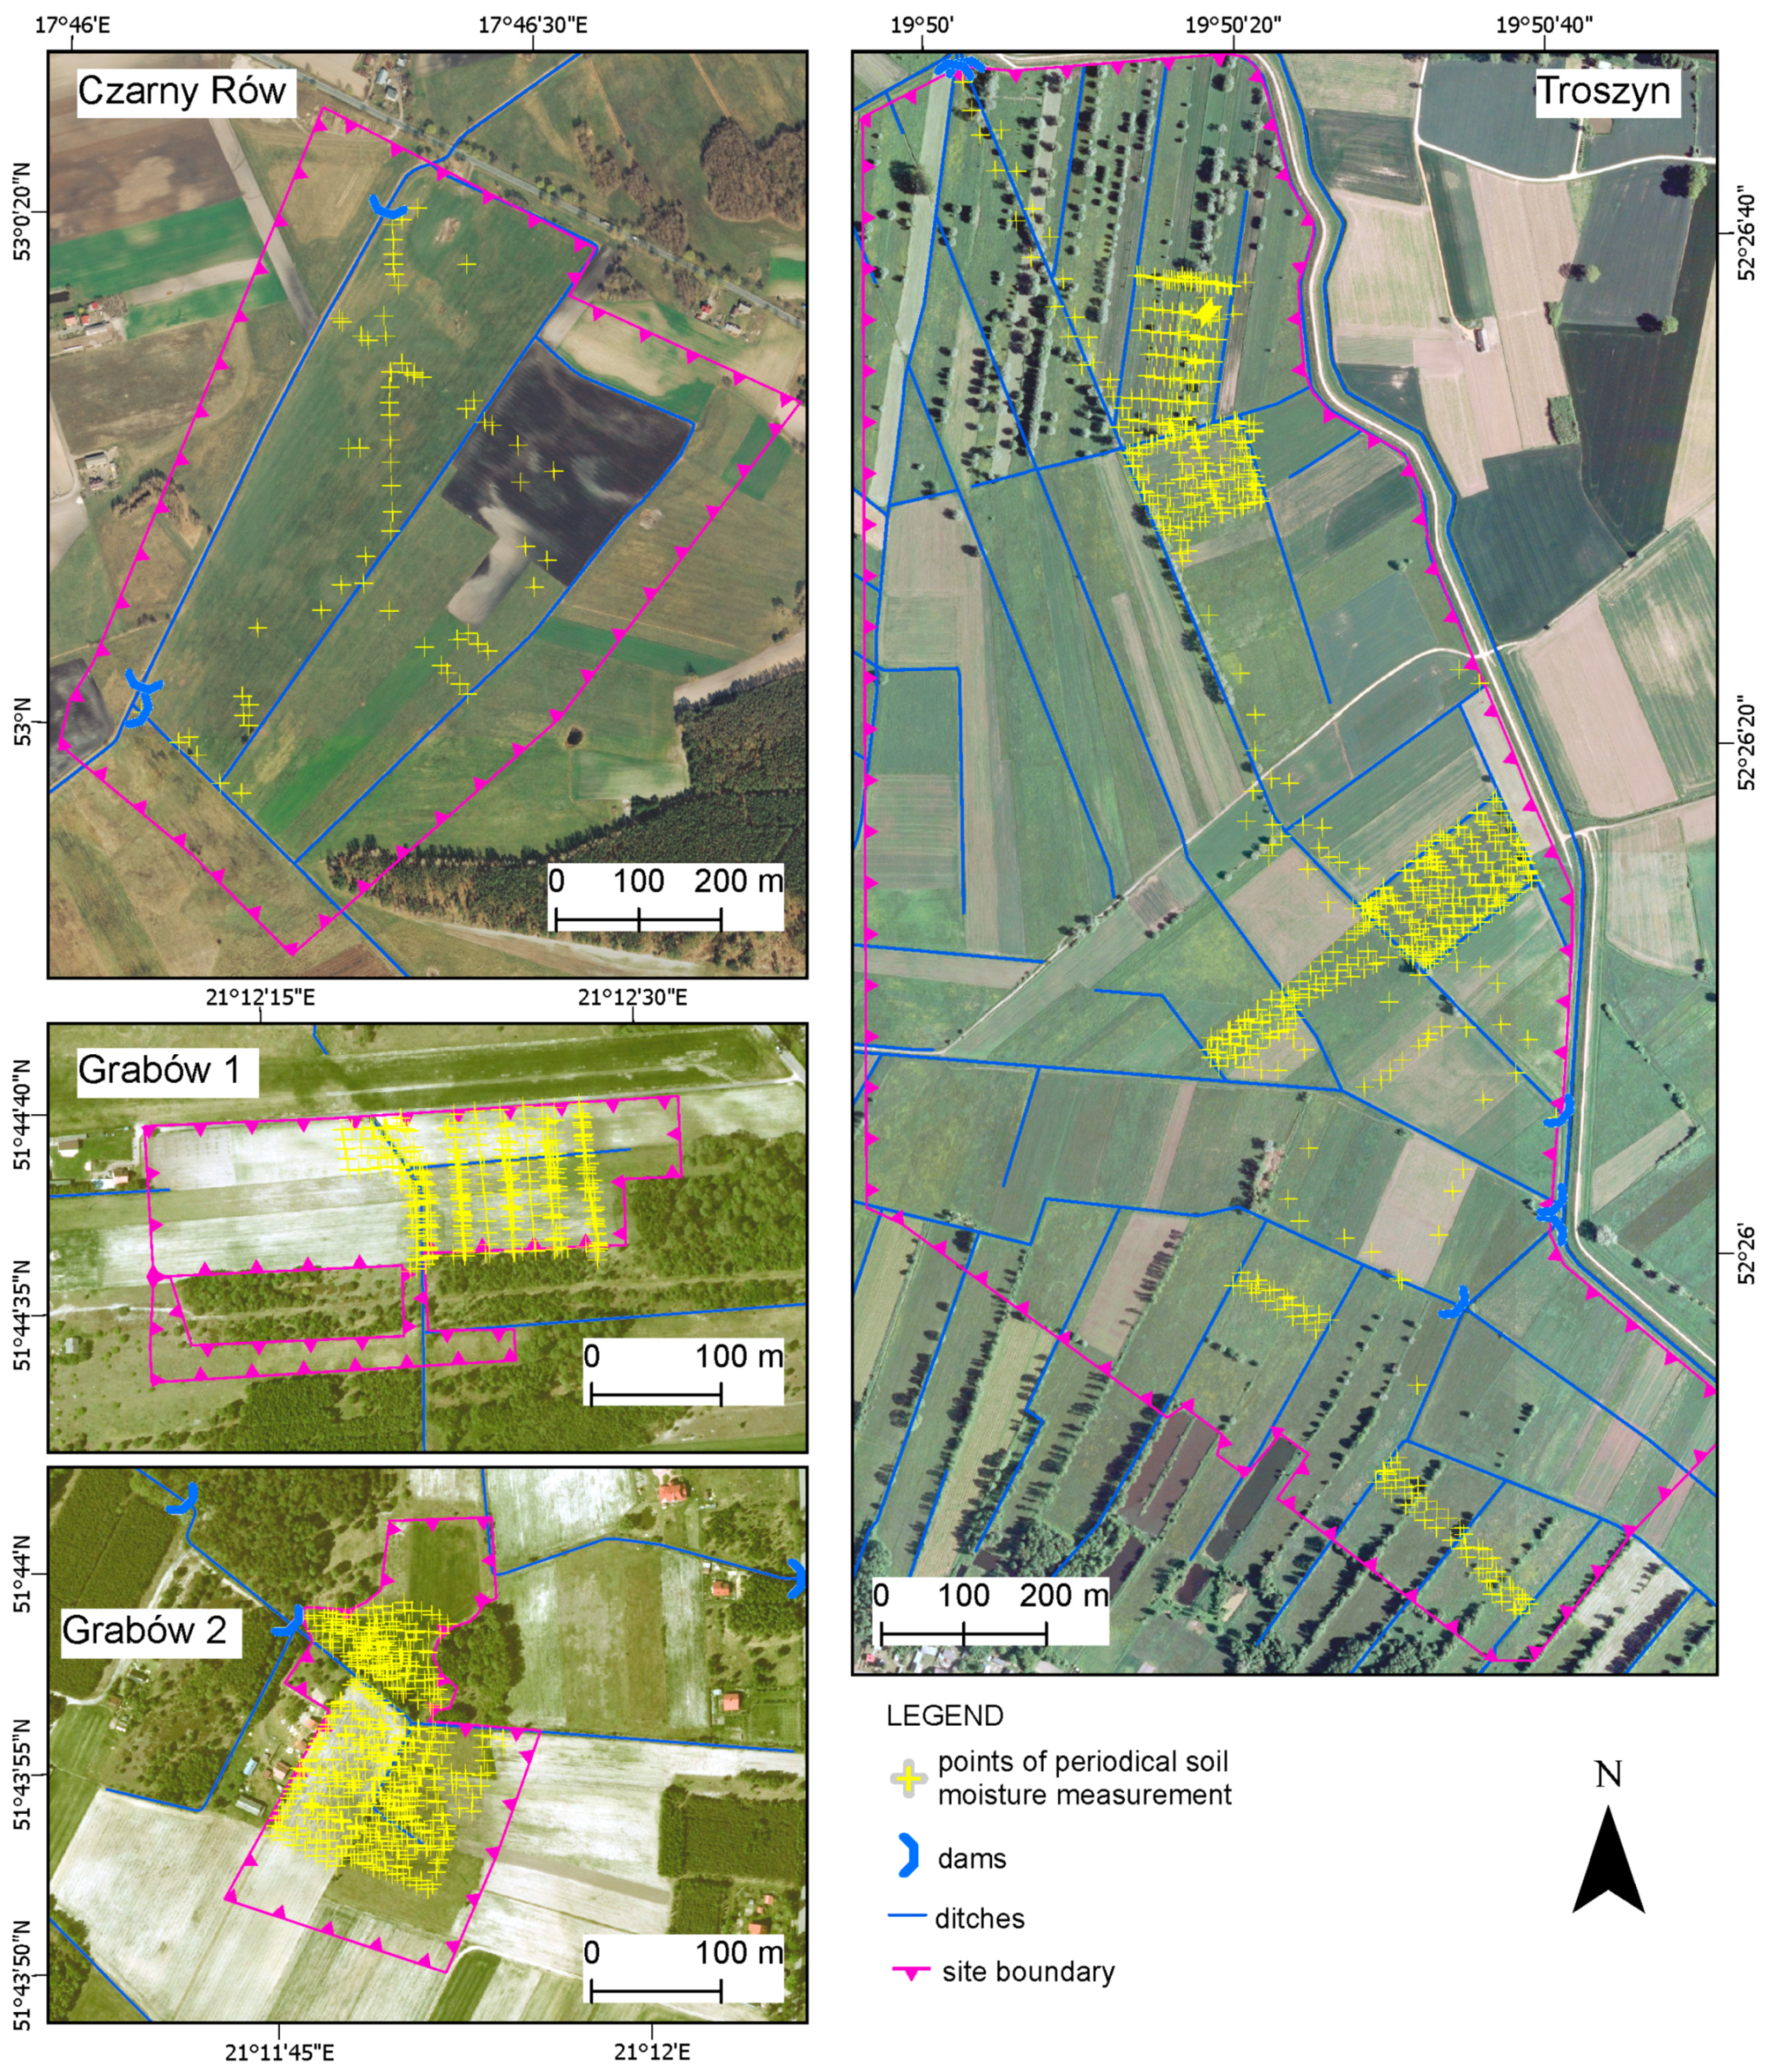
2.1. Study Areas

Three study sites in Poland have been investigated, i.e., Czarny Rów (C), Grabów (G), and Troszyn (T), and their locations are presented in Figure 1.
Czarny Rów site (53°00′N, 17°46′E) is located in north–central Poland, the Kuyavian-Pomeranian province (in Polish: Kujawsko-Pomorskie) in the Upper Noteć river catchment (Figure 2). It is fed with water from the Czarny Rów stream, a tributary of the Gąsawka river. This site is irrigated by a subsurface system with ditches connected to the main watercourse. Water flows are regulated using double and single damming valves (weirs—weir, dam). Part of the area was drained many years ago. The total area of this site is about 200 ha, and the experimental part concerning RS is 100 ha. The dominant soils are organic, with a predominance of peat–muck soils. Locally, mineral soil was inserted anthropogenically several years ago. Also, in the top layer of the edges, along the ditches, mineral soils were deposited due to ditch cleaning. This site is used as a harvested meadow twice or three times in the growing season. The amount and time of harvesting depend on seasonal hydro-meteorological conditions and the meadow owner’s decision. In the remaining area, winter cereals and maize are extensively grown. The Czarny Rów site is equipped with automatic sensors that continuously measure and record water levels in the mainstream and ditches, groundwater table depth, and soil water content. These sensors are installed on the object’s cross-section at points selected to represent the object. The groundwater depth varies from 35 cm in early spring and after intensive rainfalls to 80–100 cm in dry periods.
Grabów site (51°43′N 21°14′E) is located in the central part of Poland in Mazovia province (in Polish: Mazowieckie). It is situated over the Pilica River in Głowaczów commune, from which the Vistula River flows from the east. Two areas were analyzed at the Grabów site (Figure 2): 1—without flow regulation—natural conditions of water outflow from the object and 2—where the outflow is regulated—slow outflow conditions. In both sites, sandy soils prevail with a gravel layer, with a free groundwater table at an average depth of 1–1.2 m. Six piezometers were installed at Site 1 with an open ditch system. Additionally, two profile probes for soil moisture measurements were equipped. Site 2 presents open ditches with five valves for regulating the flow rate. A drained field covers part of this area. Seven piezometers were installed in the field. SSM was determined using TDR equipment. The main crops cultivated in this area are cereal crops.
The last study site, Troszyn (52°26′N 19°50′E), is located in east–central Poland (Mazovia province) in a marginal stream valley of the Vistula River, 3.3 km from the river bed. The area of the site is about 502 ha. Since 1971, this area has been a periodic equalizing reservoir for excess water from canals (Dobrzykowski, Słubicki) and the Gąbinianka River (Figure 2). The southern and partially western parts of the reservoir are located on the terrace embankments anti-flood from the north and east, the border of the reservoir. As a result of the Vistula flood waters influence, the post-bog soils are predominant. From the terrace side, organic soils are present; moreover, mineral soils occur on the Vistula side. The reservoir is equipped with a subsurface irrigation system with regulated changeable groundwater levels. The average ditch spacing is 100 m in mineral soils and increases up to 180 m in organic soils. The total length of ditches is 15.3 km. Apart from the ditches, nine gates and two weirs are present. Due to good soil quality, relatively intensive crop production is carried out here (grassland). In recent years, the use of these lands for the production of cereals has also been observed.

2.2. Meteorological Conditions

Considered areas, as a whole Poland, are located in a temperate and transitional climate zone, between Atlantic Ocean air masses from the west and continental air masses from the east. Based on meteorological data from the Institute of Meteorology and Water Management (IMGW—PIB) [37] and data from stations operated by the Institute of Technology and Life Sciences (ITP—PIB), it was found that in central Poland, the average temperature in the last thirty years (1991–2020) was 9.1 °C in the whole year and 15.6 °C in the growing season (April–September). The average precipitation totals equal 547 mm and 333 mm, respectively. The warmest month is July, and the coldest is January. Precipitation in the growing season is 61% of the year’s totals but is too low to cover cultivated plants’ water requirements. The climatic water balance, calculated as the difference between precipitation and the Penman–Monteith reference evapotranspiration, indicates average rainfall water deficits of 180–200 mm in the growing season [38]. In the areas examined in two analyzed years, the temperature was higher, and precipitation was lower than the long-term average (1991–2020). The 2018 growing season was warmer than 2019, whereas the second season was drier than in 2018 (Table 1). A feature of this climate is the variability in meteorological conditions and not equal distribution of rainfall in time, resulting in prolonged dry periods or heavy precipitation events. Using supplemental irrigation and drainage systems in agricultural areas may be necessary.
A gravity-fed sub-irrigation system with regulated changeable groundwater levels is used in all analyzed sites. Such systems consist of a network of ditches and control structures supplemented with a network of drain pipes in some irrigation units. Sub-irrigation is used in river valleys on permanent grasslands throughout the country, mainly in the lowland regions in northern and central Poland [39]. Since 2019, all study sites have been equipped with automatic weather stations (see results in Table 1).

2.3. In Situ Data

In situ, SSM measurements were carried out in the growing seasons (April–October) in 2018–2019. Field measurements in three study sites were performed on the same day (±one day) as data collection by satellite was completed concerning the appropriate growth and development stage of crops and weather conditions (especially cloudiness). The points for in situ field measurements were chosen in such a way (including expert knowledge and field observations) to represent different moisture conditions and different field cover: dense and sparse vegetation and bare soil. These points were chosen using a satellite-based global positioning system (GPS). Then, corresponding pixels from S2 images were extracted. Figure 2 presents the main points of these SSM measurements.
The measurements of SSM were performed at least once per month, and these were performed manually using the time domain reflectometry Easy test TDR probe [40] and impedance method with a fixed working frequency of 100 MHz with the Theta probe [41]. These sensors were used to measure volumetric soil water content within the surface layer of the soil (0–6 cm in the case of the Theta probe and 0–10 cm in the case of TDR, respectively). The Theta probe was used during one measurement date (n = 25) due to the temporary unavailability of the Easy test TDR probe. The consistency of the results of both probes was verified during synchronous field test measurements.
Soil porosity (ϕ) was calculated based on the particle density (ρp) and dry bulk density (ρb) values using the following equation [42]:
ϕ = 1 ρ b ρ p
Dry bulk density was measured using the oven-dry method [43], and the particle density was measured using the pycnometer method with ethanol as a liquid [42].

2.4. Remote Sensing Data

Satellite data were obtained from S2 images (https://apps.sentinel-hub.com/, accessed on 10 May 2021) with a pixel resolution of 10 m and the frequency of satellite flights every three days over a given area. The images, geometrically and atmospherically corrected, were collected for the examined areas in two years: 2018 and 2019. Each satellite image was manually checked in terms of air transparency. Then, the images for the decently cloudless days were chosen. A detailed scheme of methodology is presented in Figure 3.

2.5. OPTRAM Approach

The OPTRAM method, which was developed as a physical model by Sadeghi et al. [31], was used in this study to estimate surface soil moisture. This method is based on the distribution of pixels in the scatter plot of two variables. One variable is the vegetation index based on RS (e.g., Normalised Difference Vegetation Index NDVI). The second variable is the short-wave infrared transformed reflectance (STR). It is assumed that the scatter plots of the NDVI-STR dependencies form a trapezoidal shape. In the case of OPTRAM, the pixels corresponding to wet soil are located on the upper edge of the trapezoid (wet edge), and the pixels corresponding to dry soil are located on the lower edge of the trapezoid (dry edge). Visual inspection is the recommended method for identifying wet and dry edges [30]. In the OPTRAM approach, soil moisture content (W) is normalized using the local minimum dry and maximum wet soil moisture content, as presented in Equation (2). According to Sadeghi et al. [31], there is a linear relationship between surface moisture content and STR (Equation (2)). STR is defined as SWIR-transformed reflectance (Equation (3)).
W = θ θ d θ w θ d = S T R S T R d S T R w S T R d
where: θ—surface soil moisture; θd—local minimum dry soil moisture content, θw—local maximum wet soil moisture content; STR—transformed SWIR reflection coefficient; STRd—transformed reflectance of dry soil, STRw—transformed reflectance of wet soil.
S T R = ( 1 S W I R ) 2 2 S W I R
where: SWIR—short-wave infrared reflectance.
The dry and wet edges are formed into theoretical trapezoids between the STR and normalized difference vegetation index spaces, and they are defined as:
STRd = id + SdNDVI
STRw = iw + SwNDVI
where: id and Sd are the intercept and slope of the dry edge; iw and Sw are the intercept and slope of the wet edge; NDVI—is the normalized difference vegetation index.
The soil moisture for each pixel can be calculated from a linear relationship (Equation (6)). The saturation degree W can be expressed as (cm3 cm−3) when multiplied by the soil porosity [44].
W o p t r a m _ l i n = i d + S d N D V I S T R i d i w + ( S d S w ) N D V I ϕ
where: ϕ—soil porosity [cm3·cm−3].
To better capture the relationships between NDVI and STR, Ambrosone et al. [32] proposed replacing the linear equation with the following exponential equation (Equation (7)).
W o p t r a m _ e x p = i d exp S d N D V I S T R i d exp S d N D V I i w e x p ( S w N D V I ) ϕ
In our study, we investigated the OPTRAM based on the pixel distribution within the STR-NDVI space, similar to Sadeghi et al. [30] and Ambrosone et al. [32]. We analyzed all three examined sites, i.e., irrigation/drainage objects together. We examined two scenarios: linear (Equation (6)) and exponential (Equation (7)) OPTRAM models. For each scenario, we considered models taking into account porosity (OPTRAM_lin_p; OPTRAM_exp_p) and without taking into account porosity (OPTRAM_lin_np; OPTRAM_exp_np).

2.6. Vegetation Indices
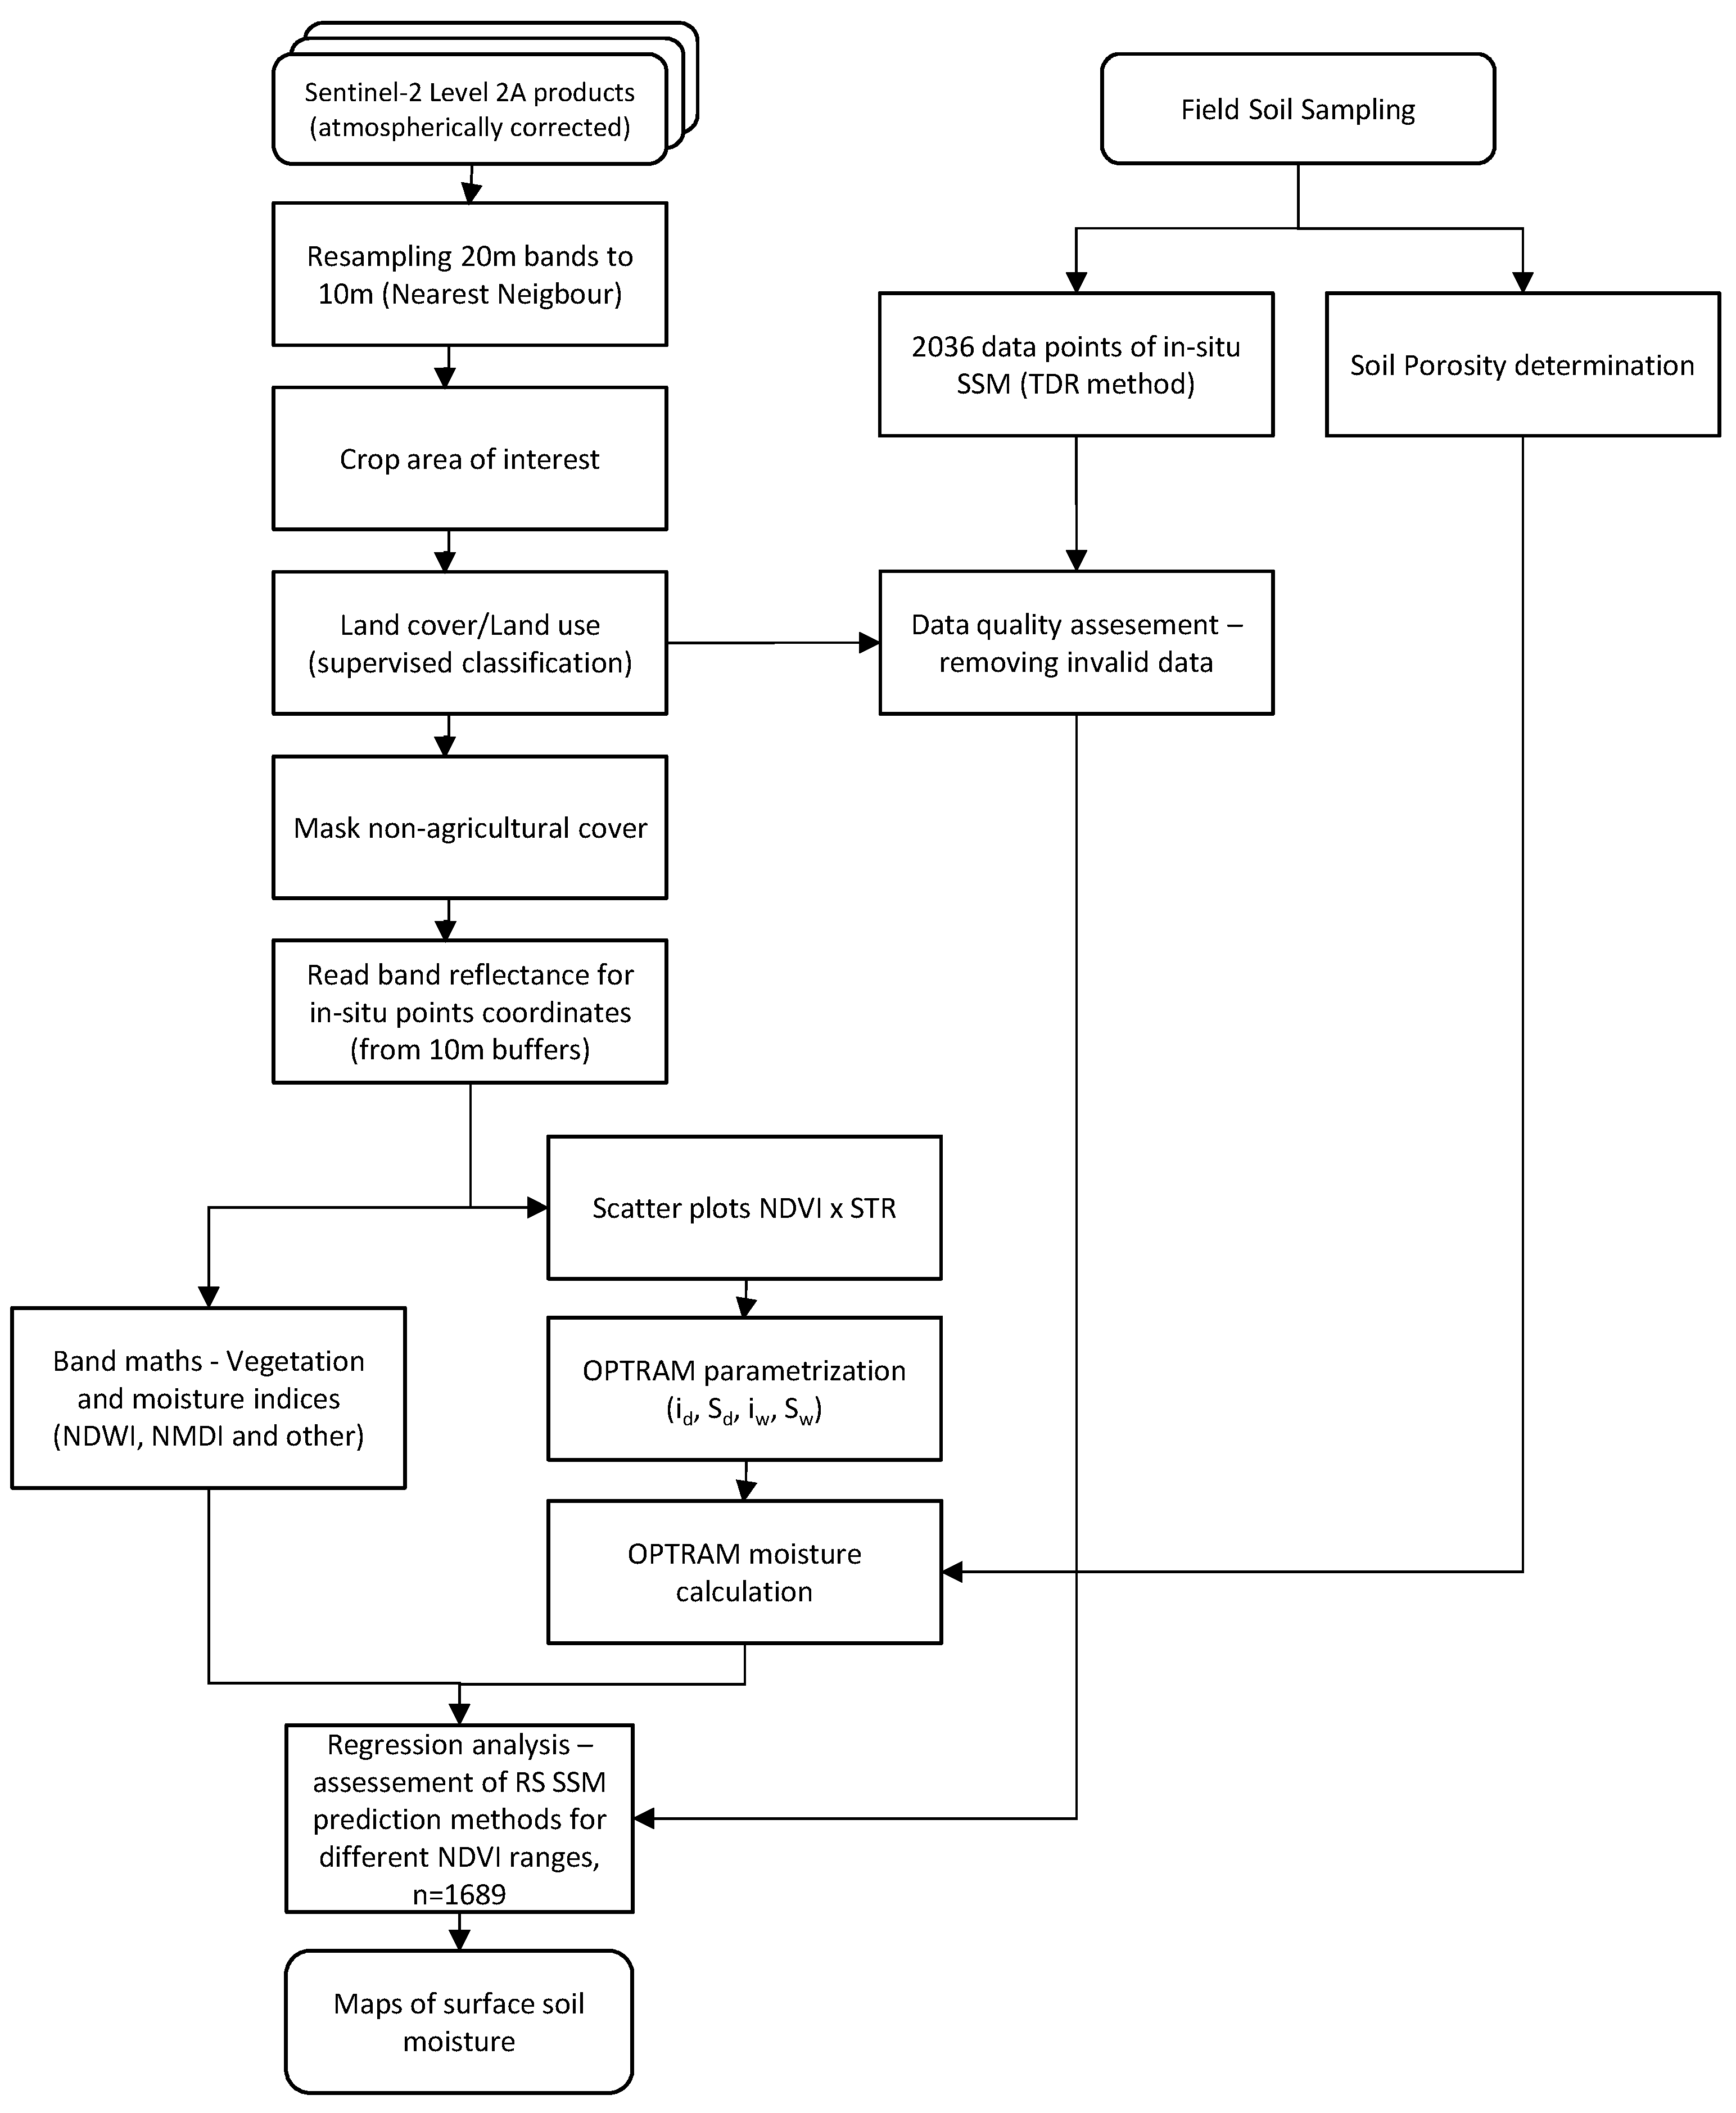
We analyzed eighteen vegetation indices based on satellite data/images (S2) toward the relationship with SSM measured in situ in all analyzed sites. We also compared soil moisture estimated with the OPTRAM method and vegetation indices to choose the best method for soil moisture evaluation. The list of considered indices with the formula and source is compiled in Table A1 of Appendix A.

2.7. Data Analysis

The processing of the satellite scenes was carried out using ArcGIS Pro 3.5 software (ESRI). In order to unify the spatial resolution of all bands, interpolation (resampling) of bands obtained at a resolution of 20 m to a resolution of 10 m was carried out using the nearest neighbor method.
The scenes were then cropped to areas of interest to facilitate further analysis. Supervised land cover/land use (LULC) classification was performed for all areas. The results of this classification were used to mask non-agricultural areas (e.g., roads, surface waters) and remove moisture measurement points made in places of hay in meadows or straw in fields, as well as points in areas covered by clouds or their shadows on satellite scenes from complementary dates.
Around the coordinates of ground measurement points, 10 m buffers were set, for which the average reflectance values of individual bands were read. These results were used to calculate the values of vegetation and moisture indices at the measurement points and to create a scatterplot in the NDVI—STR space following the OPTRAM methodology. This plot was used to visually determine the wet and dry edges, for which the values of the OPTRAM parameters (id, Sd, iw, and Sw) were read from the plot. These parameters, together with the results of soil porosity analyses, allowed for the calculation of soil moisture for individual pixels of satellite scenes according to Equations (6) and (7).
Calculated values of RS indices and SSM values from in situ measurements for validated points (n = 1689) were subjected to regression analysis using the Scikit-learn library in the Python environment. Regression was performed for groups divided according to NDVI values with a step of 0.2 to improve the clarity of the analysis. The coefficient of determination R2 and RMSE were calculated as fit quality measures. A randomly selected group of test points representing 10% of the above points was used to validate the regression results. Then, the quality of matching the values measured and estimated by RS for various ranges of NDVI values, expressing the degree of soil cover with vegetation, was analyzed. In addition, for the results obtained with the OPTRAM method, maps of the estimated SSM values were prepared for sample dates of acquisition of satellite scenes.

3. Results

3.1. In Situ Measurements

The distribution of SSM at Troszyn, Grabów, and Czarny Rów is shown on the box-and-whisker plots (Figure 4). The lower part of the box presents SSM, which, together with lower values, was observed at a frequency of 25% (first quartile). The upper part of the box shows the third quartile (75%). The line inside the box presents the median (second quartile). Whiskers at the bottom and upper parts of the graph are, respectively, the values at 10% and 90% frequency. The points above the top whisker present the values that occurred at a frequency above 90%. They were rejected because they represent the state of moisture during the precipitation or immediately after rainfall. The soils in Grabów were the driest from the end of April 2018 till the end of October 2019. The median value of SSM in Grabów was equal to 10% vol. and was almost three times lower than the median for Troszyn (30% vol.) and Czarny Rów (28% vol.). The interquartile range indicates that the highest soil moisture variability was observed at the Czarny Rów site, the lowest at Grabów. In the last one, mineral soils occur, whereas in Czarny Rów and Troszyn, organic peat–muck soils prevail. SSM measurements were carried out with a wide range of NDVI values (Figure 4b), calculated based on satellite scenes acquired on dates close to the days of in situ measurement. High NDVI values are associated with the photosynthetic plant’s activity. The highest median value of NDVI was observed in Czarny Rów (about 0.7) and the lowest in Troszyn (about 0.53). The interquartile range indicates that the highest variability of NDVI was observed at the Grabów site and the lowest at Troszyn.
The calculated (Equation (1)) soil porosity of samples collected in the fields was in the following ranges: Grabów from 40 to 50%, on average 45%, Troszyn from 60% to 68%, on average 64%, and Czarny Rów 65–80%, on average 72%.

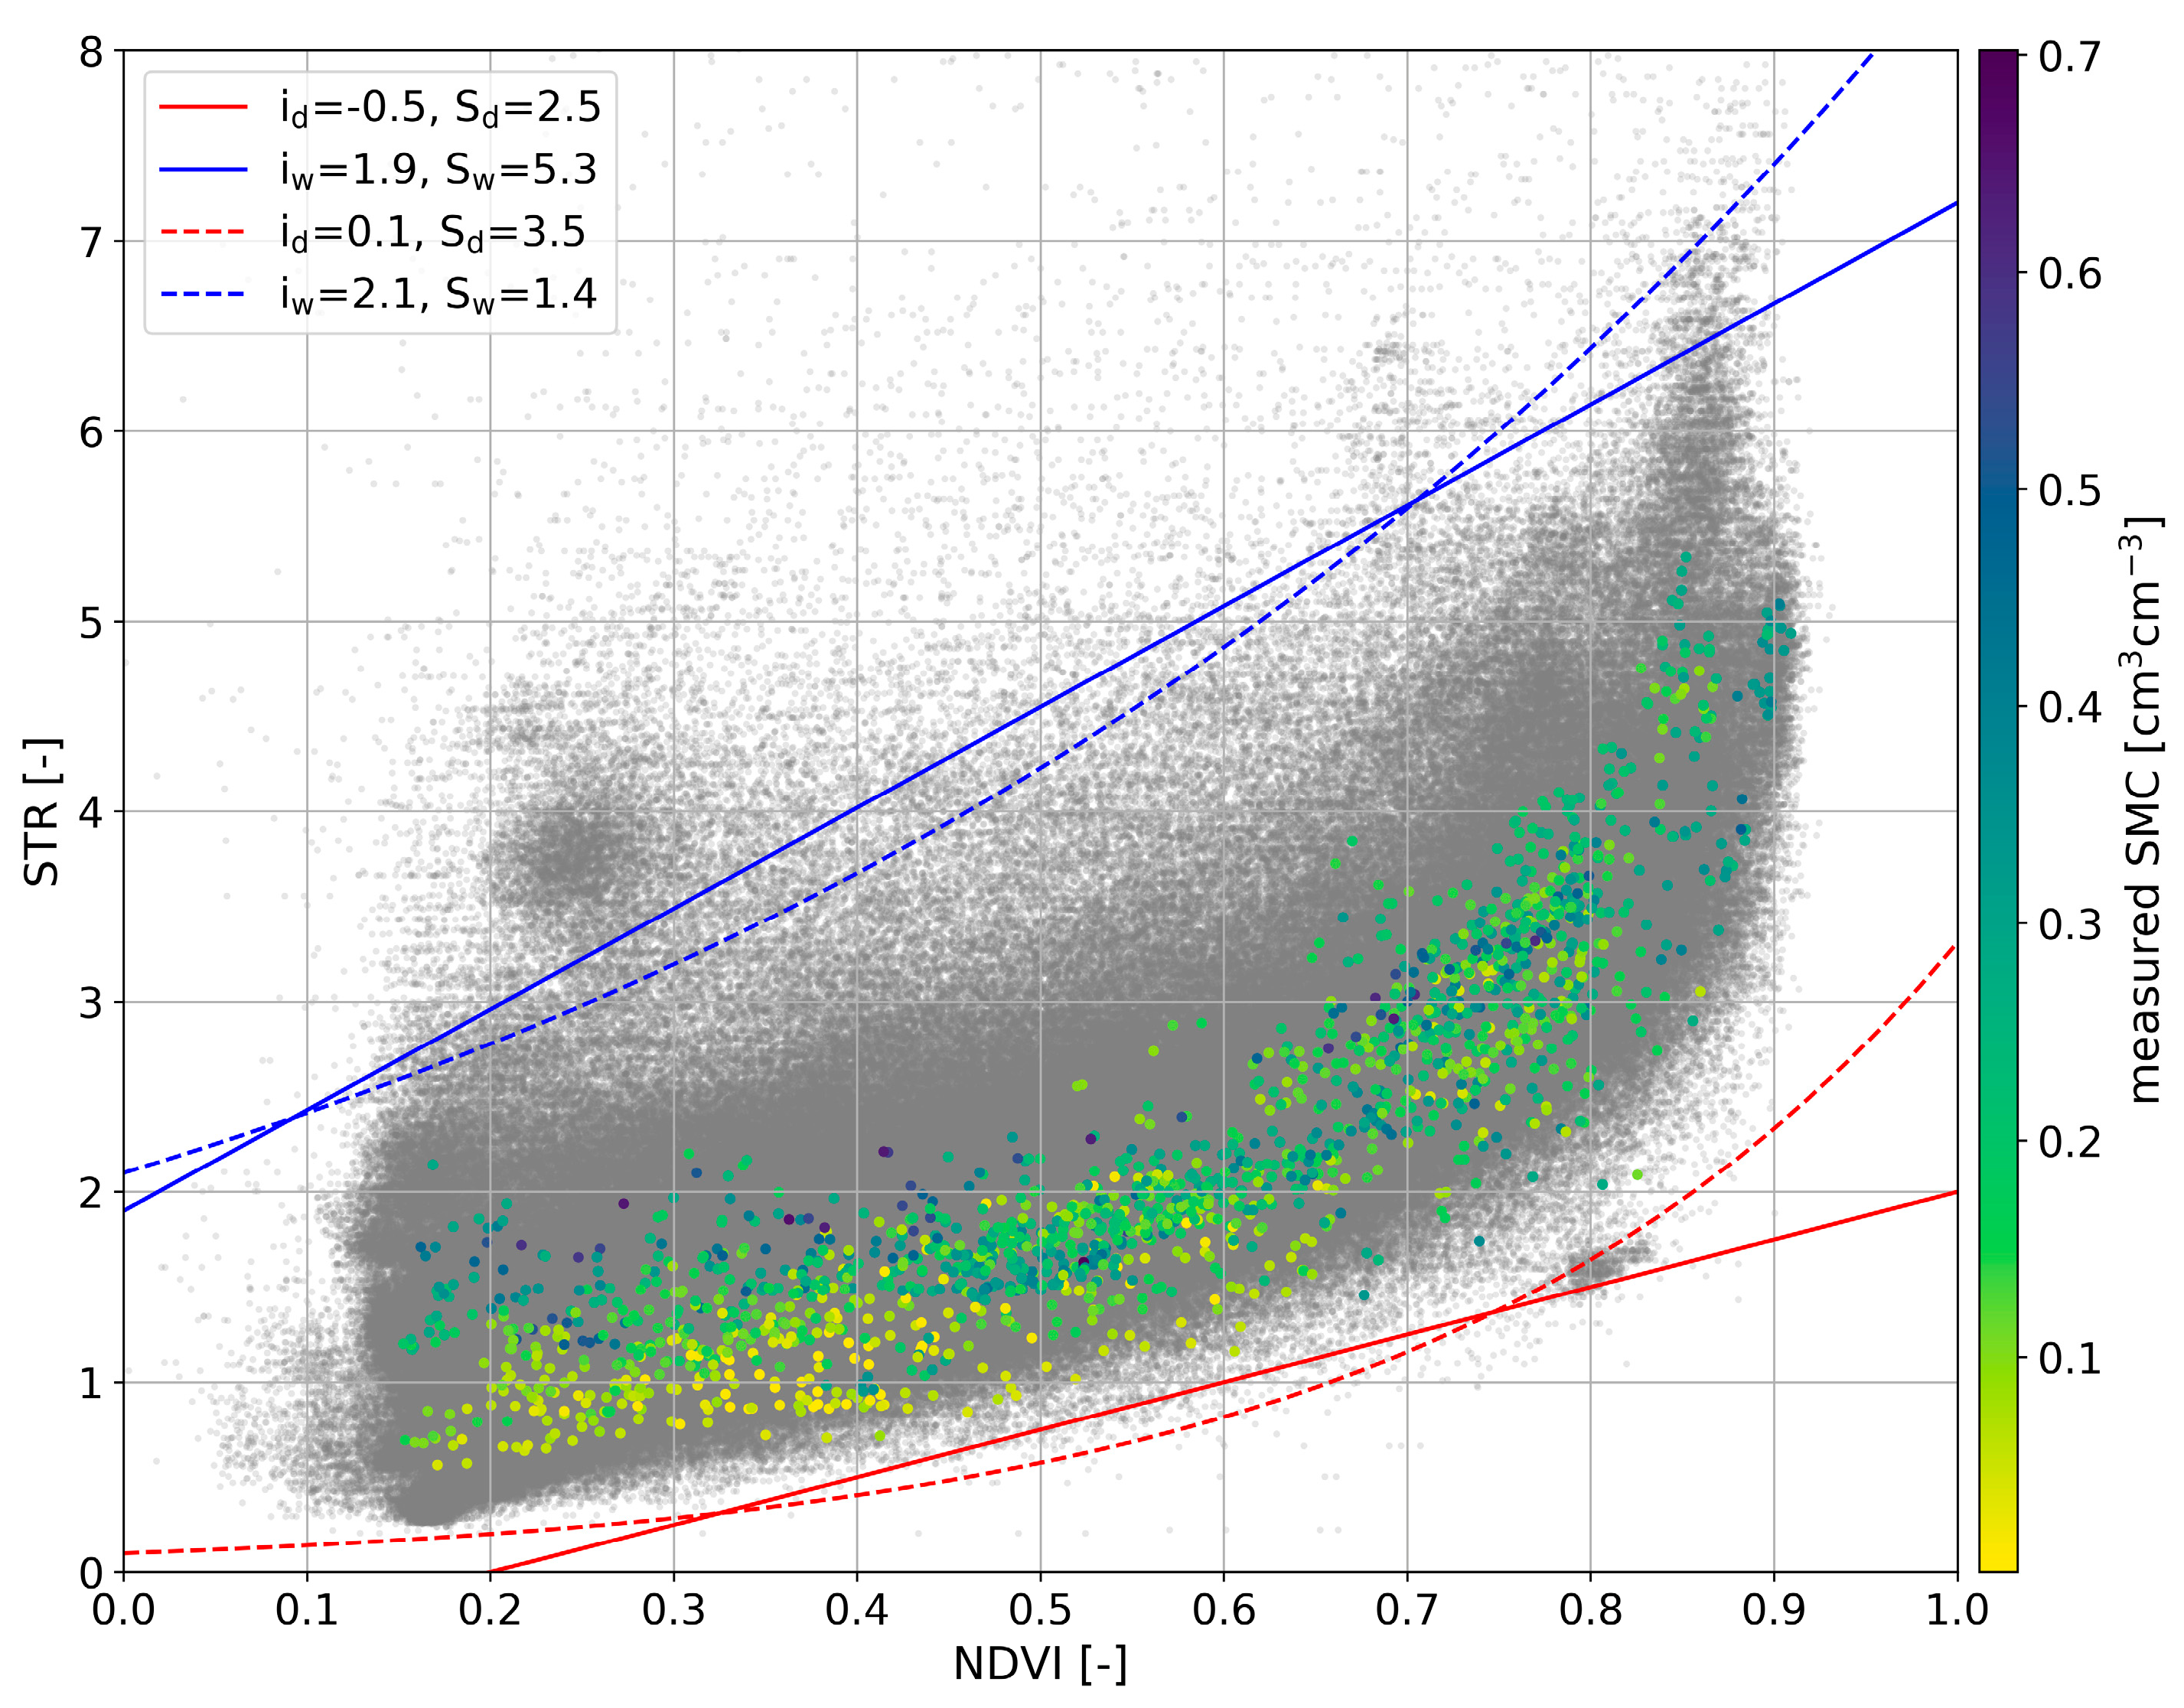
3.2. OPTRAM Parameters Calibration

The pixel distribution within the STR-NDVI space of the investigated sites Czarny Rów, Grabów, and Troszyn is presented in Figure 5. Grey points represent the pixels obtained for arable and grassland areas without forests and water. Images from cloudless days were selected for future analysis. For those pixels, the STR and NDVI values were calculated. The colored points represent the soil moisture values measured in situ. The soil moisture measurement scale is on the graph’s right side. The soil moisture measurement points are located precisely in the same location as the pixels for which the STR and NDVI values were calculated with the exact dates of measurement. Based on these pixel distributions, the dry and wet edges were selected using linear and exponential fit. All study sites were considered together when selecting these edges.

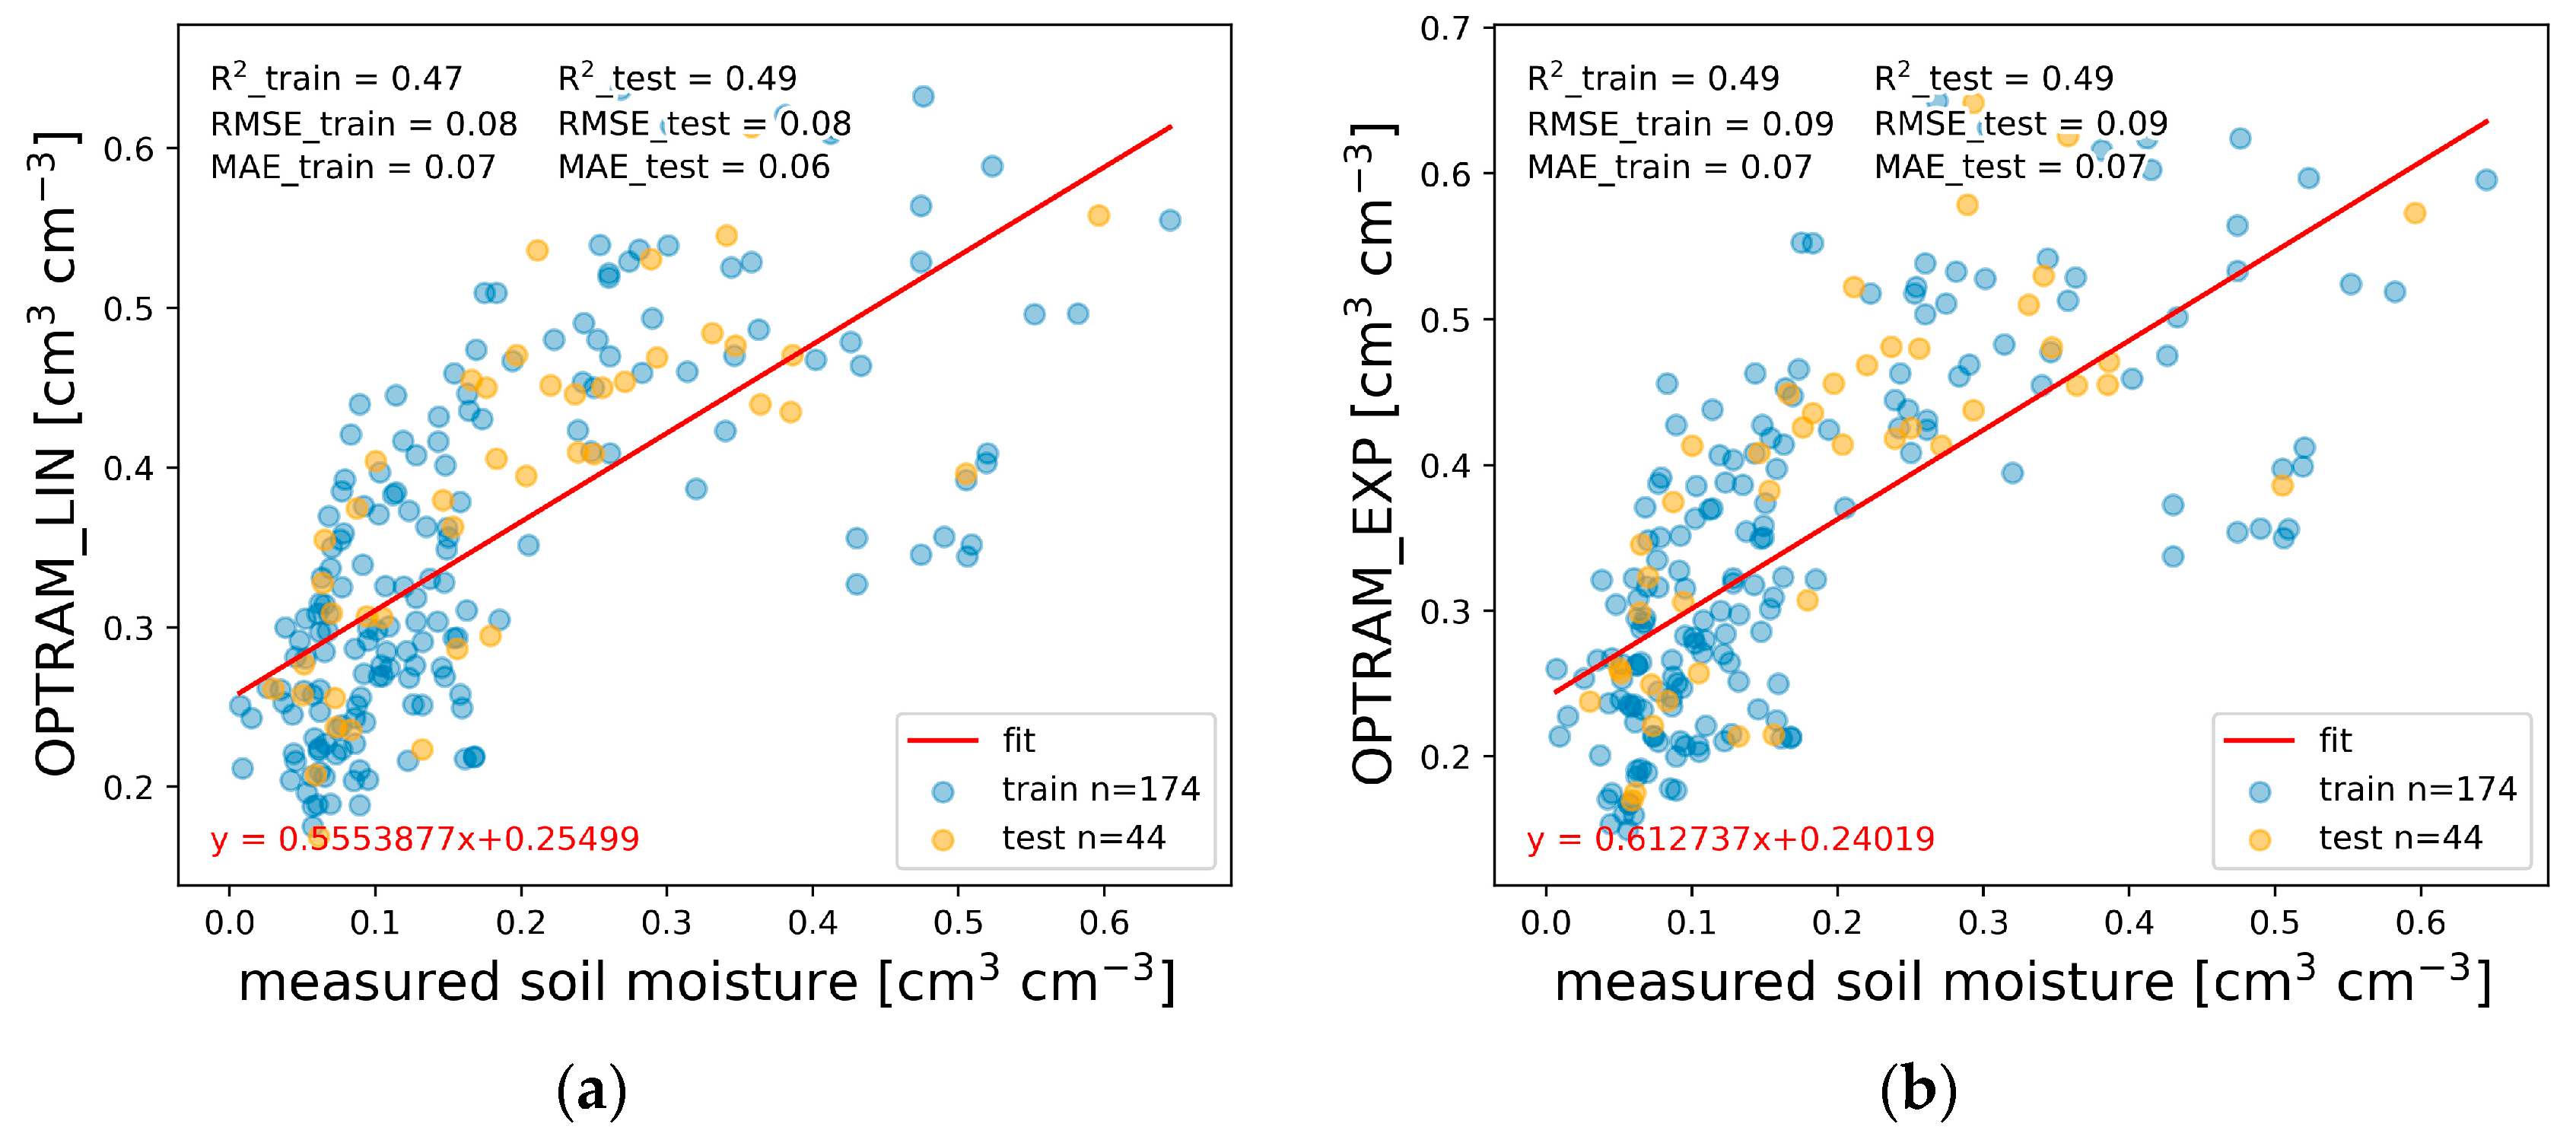
3.3. OPTRAM Model Results

The examples of relationships between soil moisture measured in situ and soil moisture calculated using the OPTRAM model with the inclusion of soil porosity are presented in Figure 6a (linear equation) and Figure 6b (exponential one). The same relationships but without soil porosity are presented in Figure 7a,b. The 174 samples were randomly selected for model calibration, and 44 samples were used for validation. The root-mean-square error (RMSE) for the linear and exponential equations with soil porosity is equal to 0.06 cm3 cm−3, and for the linear and exponential equations without soil porosity is equal to 0.08 cm3 cm−3 and 0.09 cm3 cm−3, respectively. For validation samples, the RMSE of the linear equation is equal to 0.06 cm3 cm−3 with soil porosity and 0.08 cm3 cm−3 without soil porosity, and for the exponential equation, it is equal to 0.07 cm3 cm−3 and 0.09 cm3 cm−3, respectively. The mean absolute error (MAE) for the linear equation is equal to 0.04 cm3 cm−3 with soil porosity and 0.06 cm3 cm−3 without soil porosity. The exponential equation is equal to 0.04 cm3 cm−3 and 0.06 cm3 cm−3, respectively. For validation samples, the MAE of the linear and exponential equations equals 0.05 cm3 cm−3 with soil porosity and without soil porosity: 0.06 cm3 cm−3 and 0.07 cm3 cm−3, respectively. The value of the coefficient of determination (R2) for the linear equation is equal to 0.66 with soil porosity and 0.47 without soil porosity. In contrast, for the exponential equation, it is equal to 0.67 and 0.49, respectively. For validation samples, the coefficient of determination for linear and exponential equations equals 0.60 with soil porosity and 0.49 without soil porosity.
The coefficients of determination (R2) indicate how well the SSM results estimated with the OPTRAM method fit the in situ measurement results. The coefficient of determination value was higher with lower NDVI values (Figure 8). Higher values of R2 were found for exponential equations (dashed lines) than for linear ones (solid lines). For instance, at the NDVI of 0.5 and 0.6, this difference was about 0.05. Higher values of the coefficient of determination were obtained when taking into account porosity (bold lines) both for linear and exponential functions. Including soil porosity improved the estimation of SSM, and the values of the coefficient of determination were higher than in the case of estimation without soil porosity. The differences amounted to 0.2 at the NDVI of 0.5 and 0.6.
Maps of estimated SSM using the OPTRAM exponential method, including soil porosity, developed for selected dates in April 2019 for three study sites are presented in Figure 9. Based on the modeled SSM values, the driest study site was Grabów 1, followed by Grabów 2, and the wettest was Czarny Rów, where the meadow site dominates.

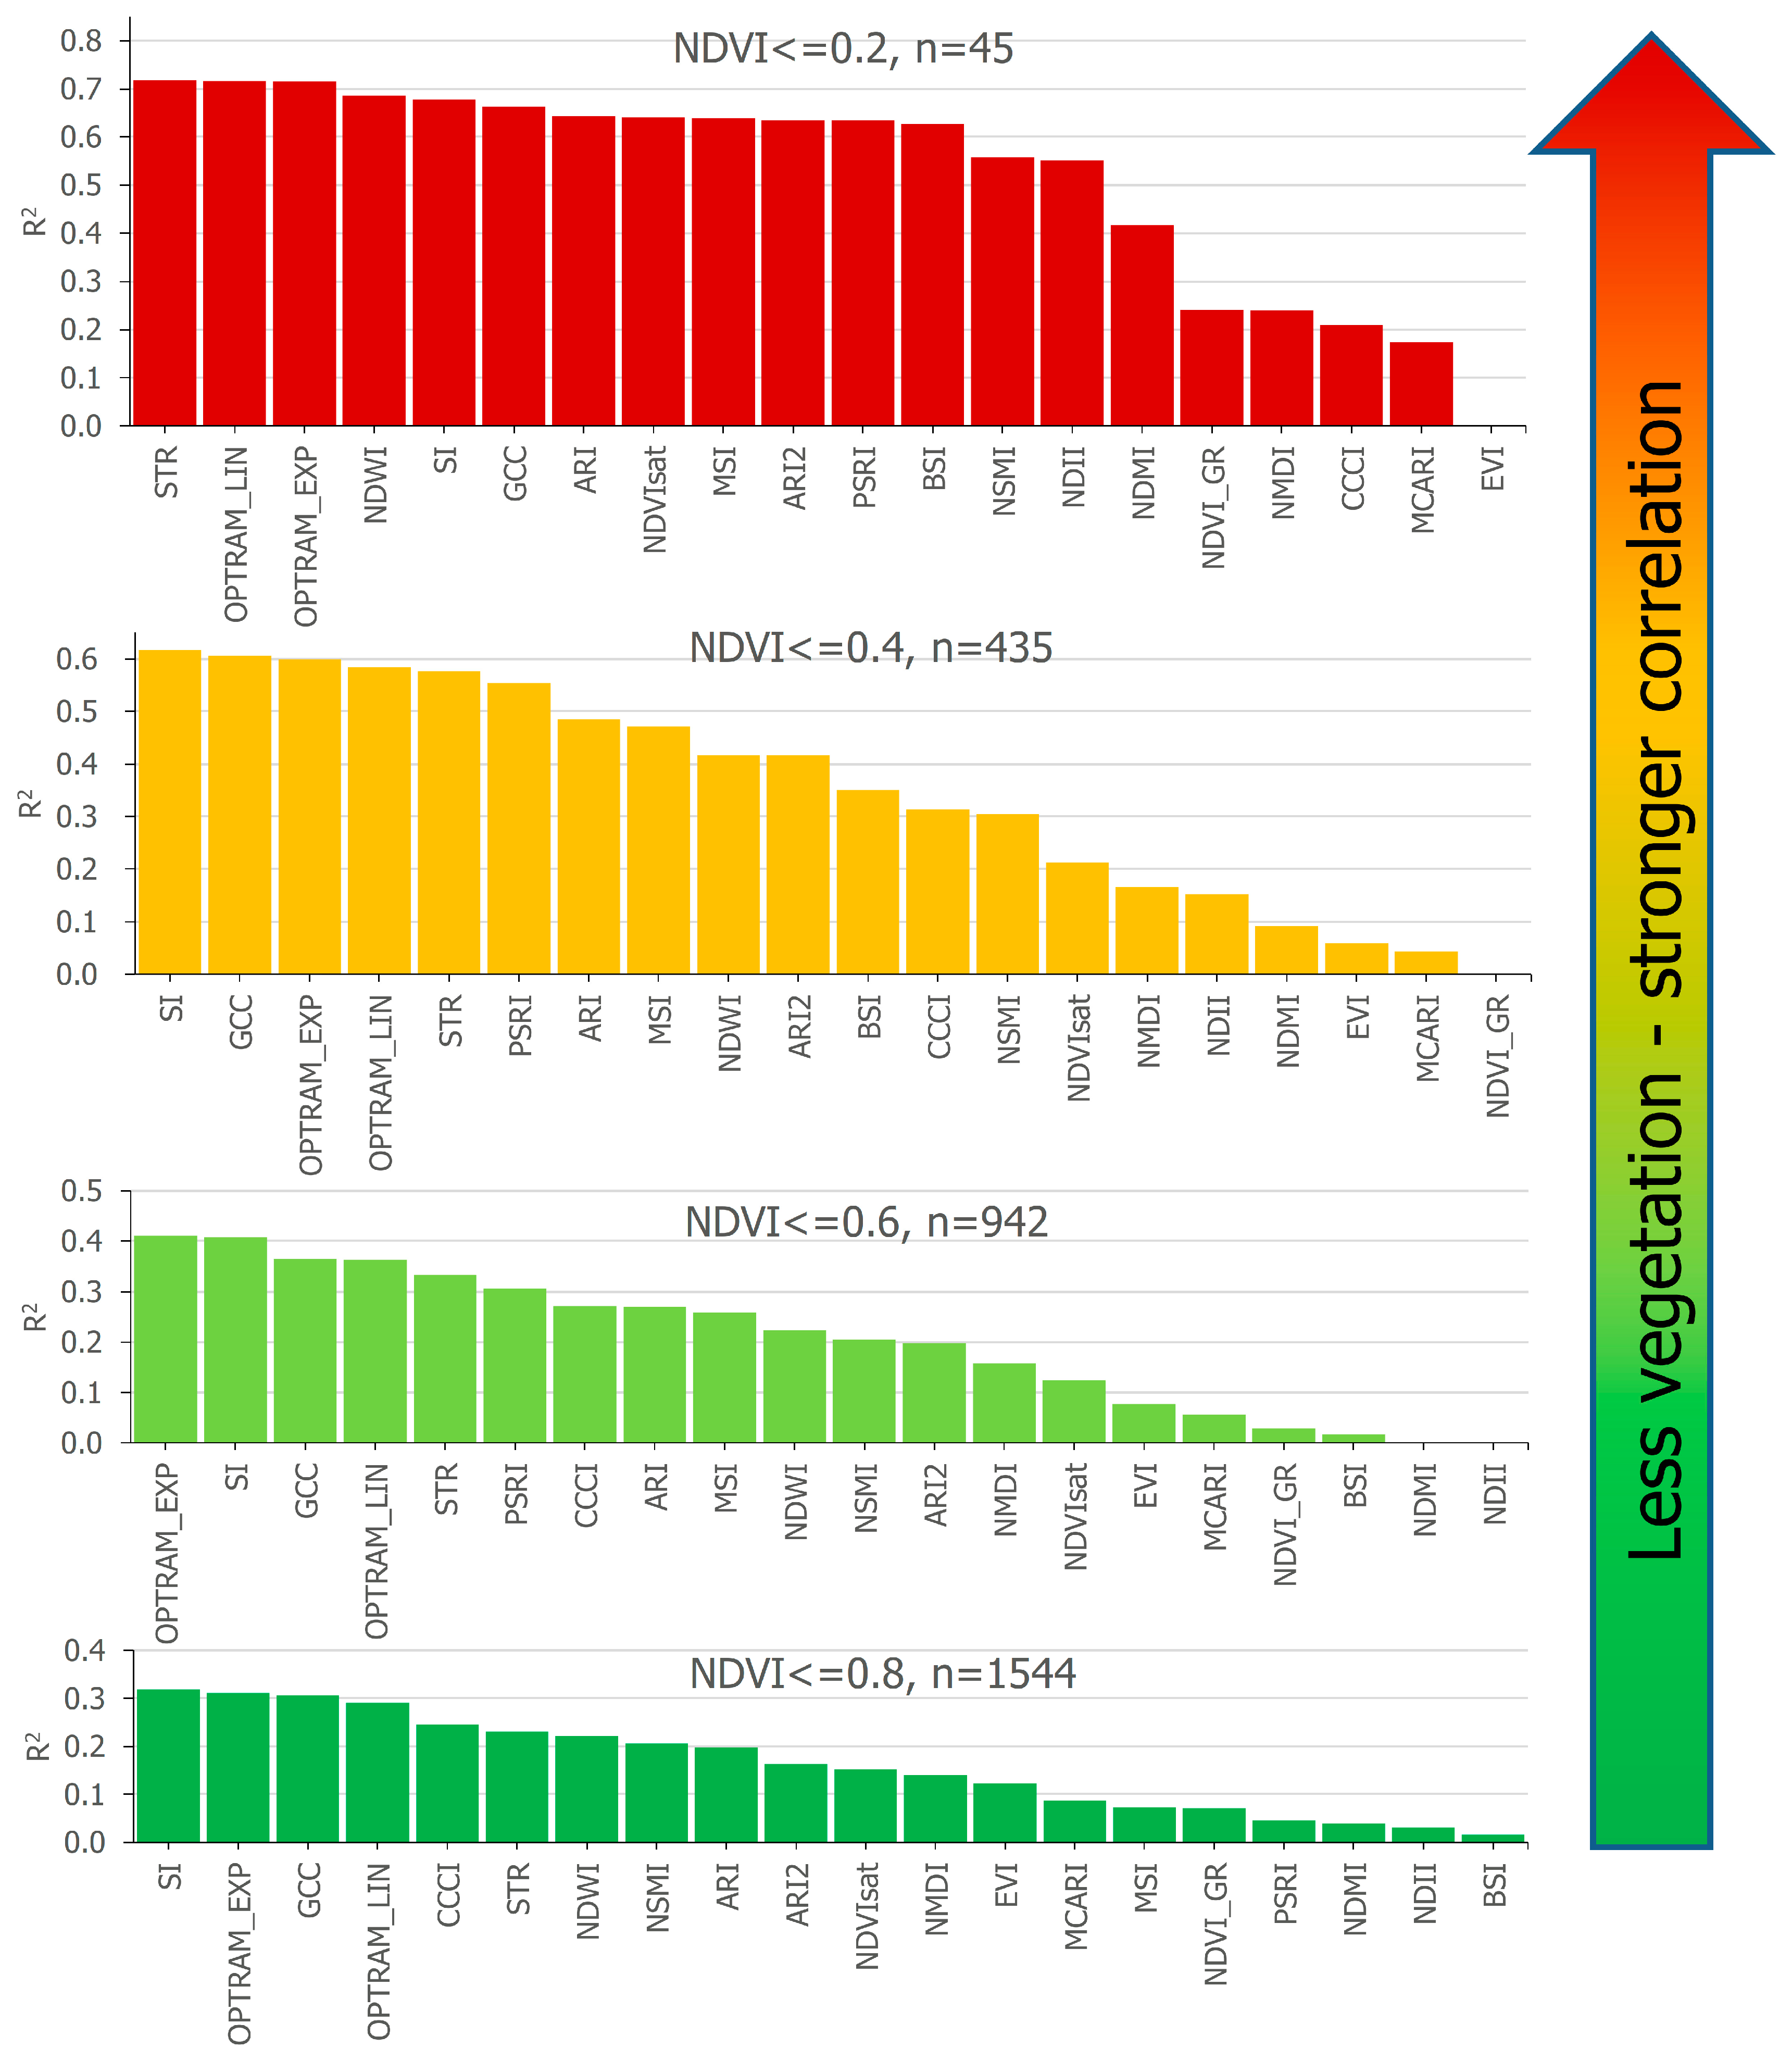
3.4. Vegetation Indices Results

The coefficients of determination value obtained for the eighteen considered vegetation indices and OPTRAM are presented in Figure 10. Higher values of R2 were obtained with low values of NDVI. For NDVI ≤ 0.2, R2 values range from 0.002 to 0.72, while for NDVI ≤ 0.8, the values of R2 range from 0.02 to 0.32.
At the NDVI value less than or equal to 0.2, the highest value of R2 was obtained for the STR to OPTRAM (R2 = 0.72), which was the same as for the exponential OPTRAM equation and linear OPTRAM equation. A slightly lower R2 value of 0.69 was obtained for the Normalised Difference Water Index (NDWI). For NDVI less and equal to 0.4, 0.6, and 0.8, the highest value of R2 was obtained for the shadow index (SI), and its values were close to the value of R2 obtained for the exponential OPTRAM equation. In conditions of green and dense vegetation (NDVI > 0.4), the GCC (Green Chromatic Coordinate Index) fit to the measured soil moisture values was located at the third position, after OPTRAM and shadow index.

4. Discussion

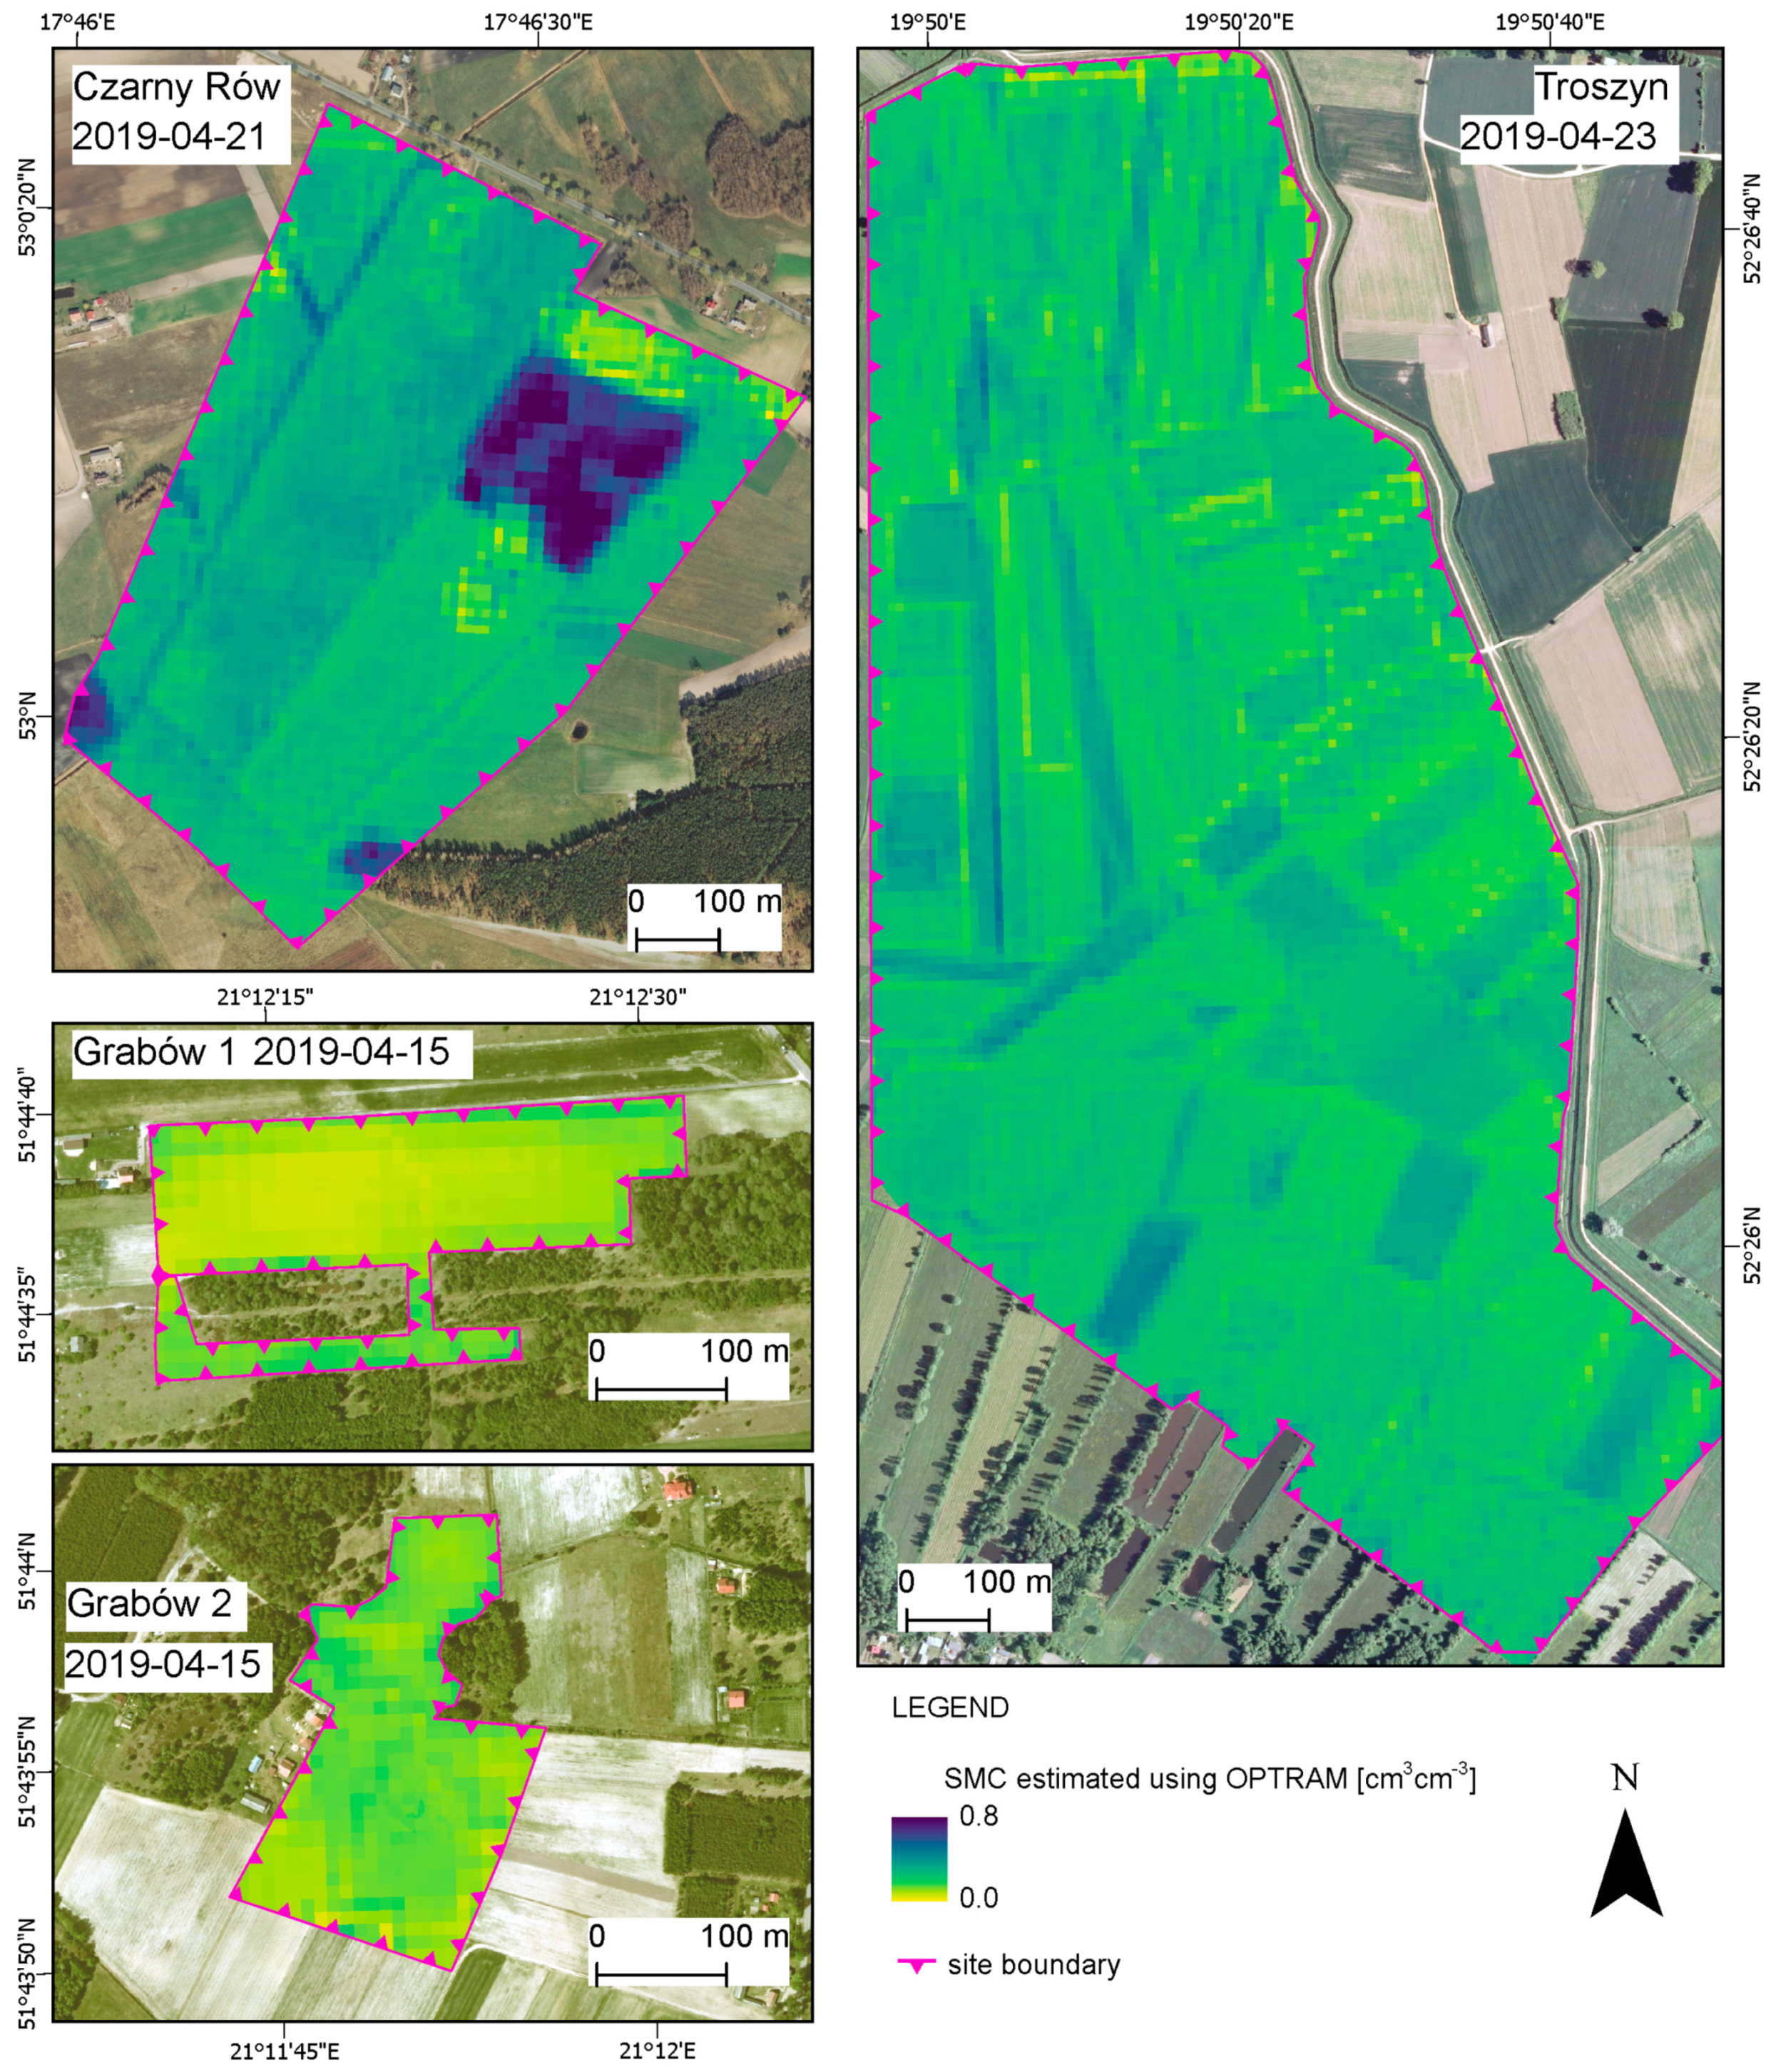
4.1. OPTRAM Model Application

The OPTRAM model was mainly used to estimate soil moisture and has been used in various climatic conditions (e.g., United States [30,44], Italy [32], China [45], Hungary [46], Iran [47], Ethiopia [48], etc.). OPTRAM has also been used successfully in other applications, i.e., for estimating actual evapotranspiration [49], for water table depth monitoring in bogs [50], or for estimation of dust emission probability in the lake basin [51]. In this study, the optical trapezoidal model method was used as a new method, which has not been used so far in Poland for determining SSM in three different agricultural areas with irrigation and drainage systems. The good relationship between SSM (cm3 cm−3) measured in situ with soil moisture obtained from OPTRAM shows that this soil moisture estimation method can be satisfactorily applied in mathematical models of operational planning of irrigation and drainage in agricultural areas. Since OPTRAM makes it possible to estimate SSM in large areas, it significantly reduces the determination of SSM using manual methods in the field, which are time-consuming. Another advantage of this method is that satellite data based on which OPTRAM estimates surface soil moisture are available for free. However, the quality of each satellite image (of low and medium resolution) should be checked regarding air clarity. It is essential in climate zones with a relatively high cloudy day. As we can see in Figure 8, the presence of plants masks the actual soil moisture; therefore, the best SSM estimation results are obtained with low NDVI index values (see Figure 10). The OPTRAM model requires the determination and fit of wet and dry edges of the model, which is most often conducted arbitrarily through visual inspection [30,32,46], which could affect accuracy.

4.2. OPTRAM Model Accuracy

Our results show a good relationship between SSM (cm3 cm−3) measured in situ and soil moisture obtained from OPTRAM, regardless of whether we used linear or exponential equations to select the dry and wet edges. Similar results were presented by Ambrosone et al. [32]. They obtained a good correlation between measured and estimated soil water content (soil moisture). For instance, in one of these sites (irrigated maize in Tuscany), the correlation coefficient (r) was equal to 0.73 for the linear model and 0.83 for the non-linear model (R2, of 0.54 and 0.69, respectively). In our study for linear OPTRAM models, we obtained R2 = 0.47 (square root r = 0.69) without soil porosity and better agreement, including soil porosity, R2 = 0.66 (r = 0.81). In turn, for exponential OPTRAM models, we obtained R2 = 0.49 (r = 0.70) without soil porosity and R2 = 0.67 (r = 0.82) with soil porosity. Our validation results were R2 = 0.6 with soil porosity and R2 = 0.49 without soil porosity in both linear and exponential models, corresponding to r = 0.77 and 0.70, respectively. Sadeghi et al.’s [30] results of OPTRAM parameterization, comparing in situ measurements with S2 data, were different for two locations. They obtained better relationships for sites where grass and cropland dominate than for sites with shrubs dominance. For the first site, the values of statistical measures for scenario (parameterization) based on visual inspection indicated slightly better results than in the case of our and Ambrosone et al. [32] studies (R2 = 0.82, RMSE = 0.04 cm3 cm−3 and MAE = 0.03 cm3 cm−3). The results of the scenario used for validation were close to ours (R2 = 0.60, RMSE = 0.06 cm3 cm−3 and MAE = 0.05 cm3 cm−3). Babaeian et al. [44] evaluated the OPTRAM based on long-term MODIS observations for four watersheds in the United States with diverse climates, soil types, and land covers. Their results indicate that OPTRAM-based soil moisture estimates provide an overall RMSE between 0.050 and 0.085 cm3 cm−3 and r between 0.10 and 0.70 (R2 from 0.01 to 0.56) for all investigated sites. Additionally, Chen et al. [45] evaluated the OPTRAM model based on MODIS data in Northeast China and obtained OPTRAM-based soil moisture estimates with RMSE from 0.05 to 0.13 cm3 cm−3 and R2 from 0.10 to 0.50. Acharya et al. [52] obtained a weak relationship between OPTRAM soil moisture and in situ measurements with Landsat data with regression values less than 0.2. In our study of the equations without soil porosity, we observed a weak relationship between OPTRAM soil moisture and in situ measurements when the NDVI was above 0.5 (see Figure 8). The plants at this stage are large enough to cover the soil. The values of the determination coefficient showed that in the case of NDVI = 0.6, which corresponds to dense and green vegetation and taking soil porosity into account, above 40% of the soil moisture values estimated using the mentioned methods were consistent with the values measured in situ.

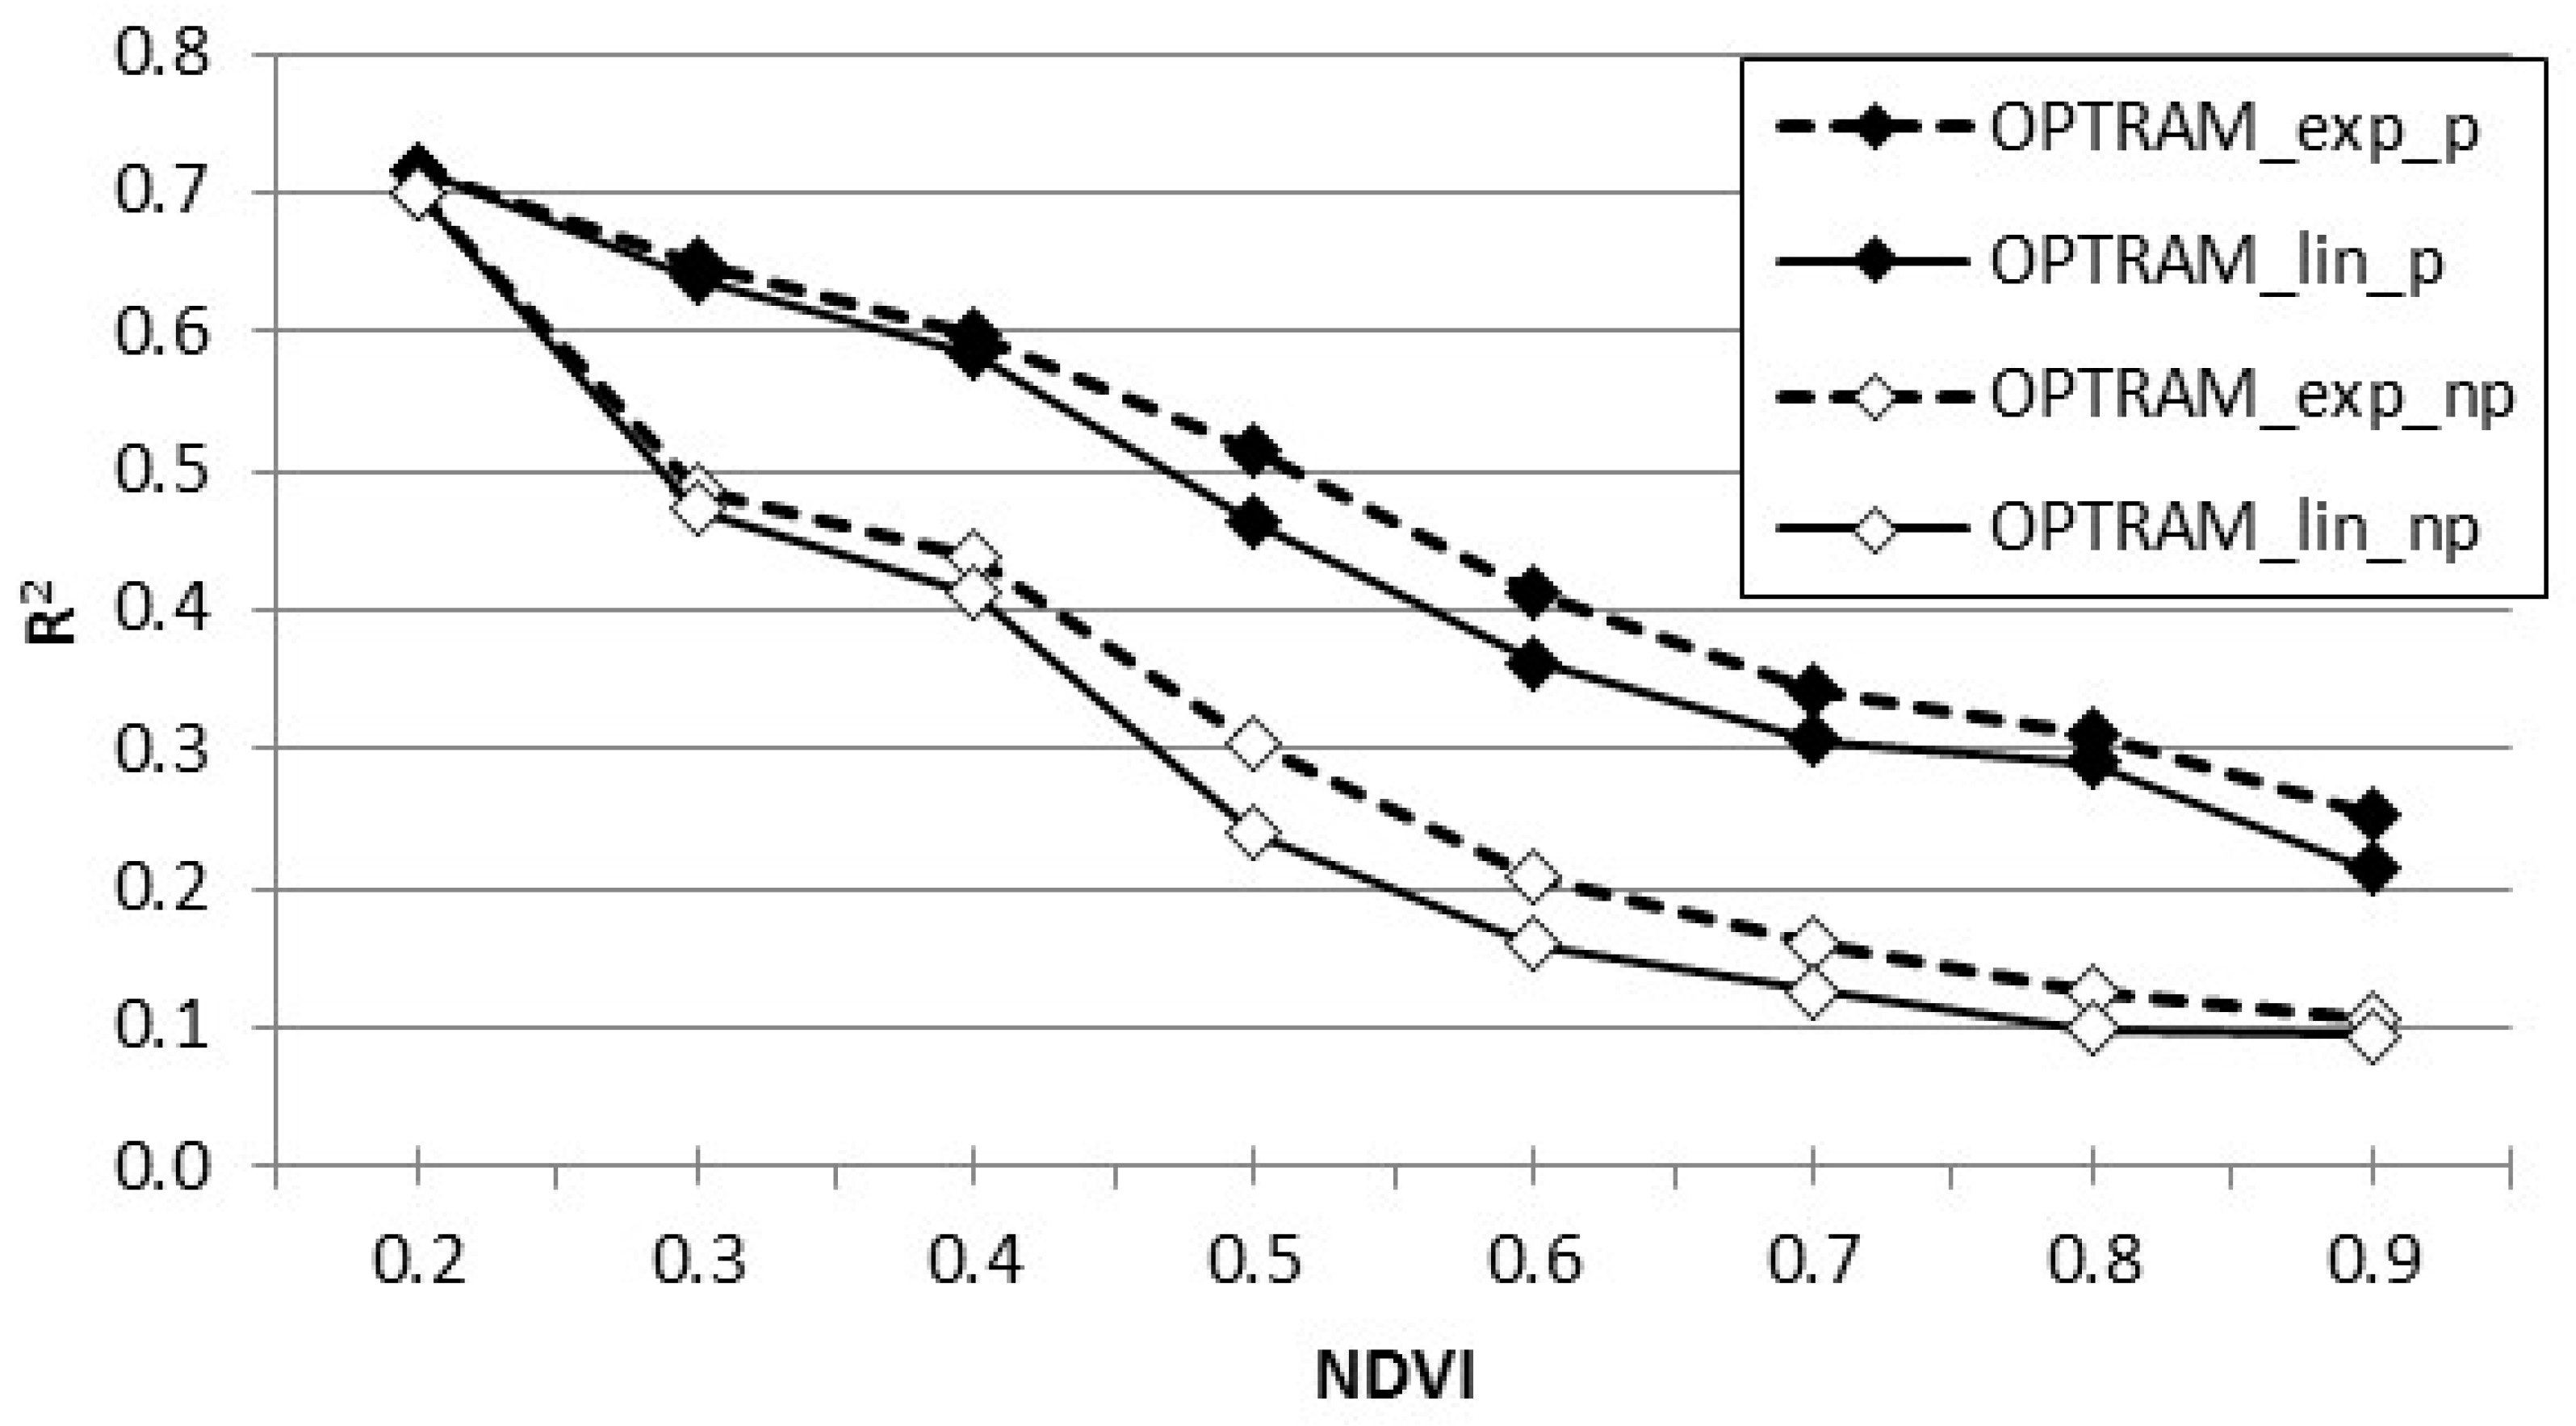
4.3. OPTRAM Model Parameters

Concerning OPTRAM model parameters for areas with grass and cropland in the USA and based on S2 satellite data, Sadeghi et al. [30] used a linear equation. They obtained for dry edge id = 0.00 and sd = 1.10 in the first scenario for wet edge iw = 0.00 and sw = 7.30, whereas in the second scenario for wet edge iw = 1.05 and sw = 4.73. Our approach used a visual inspection to fit the model’s edges [30,32]. In addition, we estimated the OPTRAM model parameters using linear and non-linear (exponential) equations. The parameters for the linear function are: for dry edge id = 0.50 and sd = 2.50, and wet edge iw = 1.90 and sw = 5.30. The results of the exponential function are: for dry edge id = 0.10 and sd = 3.50, and wet edge iw = 2.10 and sw = 1.40. These results show that further investigations are needed to search for the best values of dry and wet edge parameters and estimate the range of the values best fitted to SSM evaluation in similar agricultural areas located in different climate zones.

4.4. Vegetation Indices Accuracy

The primary statistical analysis (coefficient of determination R2) showed that the estimation of SSM using the OPTRAM method with an exponential function gives good results among all the analyzed methods when NDVI was ≥0.4 (Figure 10). With the crop growth development stage and condition of the vegetation corresponding to NDVI = 0.4, more than 60% of the values calculated with the model are consistent with the measured values. With the NDVI values ≤ 0.2, the best results among all the analyzed methods gave the STR to OPTRAM index and the OPTRAM method with a linear and exponential function (R2 = 0.72), then NDWI (R2 = 0.69) and SI (Shadow Index) (R2 = 0.68). Acharya et al. [52] obtained a weak relationship between soil moisture and vegetation indices (NDVI, NDMI, NDWI, EVI, ARVI, SIPI) with R2 ranging from 2 × 10⁻⁶ to 0.072. Sun et al. [53] obtained the best performance among the thirteen optical soil moisture indices as compared with aircraft and in situ observed soil moisture for the visible and short-wave infrared drought index VSDI, which was comparable with the OPTRAM result. Further research is required to validate the OPTRAM model and to check the accuracy of the vegetation indices.

5. Conclusions

In this study, the OPTRAM was used as a new method, which has not been used so far in Poland for determining SSM in different agricultural areas with irrigation and drainage systems. A good relationship was obtained between SSM (cm3 cm−3) measured in situ and soil moisture estimated with OPTRAM. We observed that when estimating soil moisture using the OPTRAM method, higher values of the coefficient of determination R2 were obtained with (i) lower NDVI values, (ii) taking into account the porosity of the soil on which RS monitoring was carried out, (iii) using the exponential equation. The OPTRAM method can be satisfactorily applied in mathematical models of operational planning of irrigation and drainage in agricultural areas. We emphasize that the weaknesses of the OPTRAM method are: (i) the quality of each satellite image (of low and medium resolution) should be checked in terms of air clarity, and (ii) visual inspection is needed when determining the dry and wet edge. It is essential in climate zones with a relatively high number of cloudy days.
Satellite image data deliver a broad spectrum of SSM values and corresponding NDVI. A large amount of in situ measurement data collected makes it possible to compare the values estimated using the OPTRAM method and vegetation indices and evaluate the practical use of satellite-based methods. Satisfactory results of SSM, both at low and high NDVI values, were also obtained using vegetation indices such as SI, GCC, and STR. Further research is required to validate the OPTRAM model and check the accuracy of the vegetation indices.

Author Contributions

Conceptualization, T.S. and W.K.-W.; methodology, T.S. and W.K.-W.; software and data curation, T.S.; validation, T.S.; conducted field data collection T.S., W.K.-W., E.P., J.S. and T.G., laboratory analyses of soil physical properties T.S.; writing—original draft preparation, E.P., W.K.-W. and T.S.; writing—review and editing E.P., W.K.-W., T.S., J.S. and T.G. All authors have read and agreed to the published version of the manuscript.

Funding

This research was funded by the Polish National Centre for Research and Development, grant number BIO-STRATEG3/347837/11/NCBR/2017.

Data Availability Statement

The data presented in this study are available on request from the authors.

Acknowledgments

This study was conducted within the project “Technological innovations and system of monitoring, forecasting, and planning of irrigation and drainage for precise water management on the scale of drainage/irrigation system (INOMEL)” under the BIOSTRATEG3 program, funded by the Polish National Centre for Research and Development. Contract number BIOSTRATEG3/347837/11/NCBR/2017. We also would like to thank our colleagues from ITP-PIB, Renata Wiśniewska, and Jan Meller, for their support in field investigations in the Kuyavian-Pomeranian province.

Conflicts of Interest

The authors declare no conflict of interest.

Appendix A

Table A1. Selected vegetation indices.
NoIndex NameAbbreviationEquation (with S2 Bands)Reference
1Normalized Multi-band Drought Index NMDI B 8 A ( B 11 B 12 ) B 8 A + ( B 11 B 12 ) [54]
2Normalized Difference Water IndexNDWI B 03 B 08 B 03 + B 08 [55]
3Normalized Difference Vegetation IndexNDVI B 08 B 04 B 08 + B 04 [55]
4Normalized Difference Vegetation Index—Green/Red RatioNDVI_GR B 08 ( B 03 + B 04 ) B 08 + B 03 + B 04 [56]
5STR to OPTRAMSTR 1 B 12 10000 2 2 · B 12 10000 [30]
6Bare Soil IndexBSI B 11 + B 04 ( B 08 + B 02 ) B 11 + B 04 + B 08 + B 02 [57]
7Green Chromatic Coordinate IndexGCC B 03 B 02 + B 03 + B 04 [58]
8Anthocyanin Reflectance IndexARI 1 B 03 1 B 05 [59]
9Modified Anthocyanin Reflectance IndexARI2 1 B 03 1 B 05 · B 07 [59]
10Enhanced Vegetation IndexEVI 2.5 · B 08 B 04 B 08 + 6.0 · B 04 7.5 · B 02 ) + 1.0 [60]
11Moisture Stress Index MSI B 11 B 08 [61]
12Modified Chlorophyll Absorption in Reflectance IndexMCARI ( ( B 05 B 04 ) 0.2 · ( B 05 B 03 ) ) · B 05 B 04 [62]
13NDII water content of plant canopiesNDII B 08 B 11 B 08 + B 11 [63]
14Canopy Chlorophyll Content IndexCCCI B 08 B 05 B 08 + B 05 : B 08 B 04 B 08 + B 04 [64]
15Plant Senescence Reflectance IndexPSRI B 04 B 02 B 05 [65]
16Shadow Index SI 1 B 02 10000 · 1 B 03 10000 · 1 B 04 10000 1 3 [66]
17Normalized Soil Moisture Index NSMI B 11 B 12 B 11 + B 12 [67]
18Normalized Difference Moisture Index NDMI B 8 A B 11 B 8 A + B 11 [68]

References

  1. Drusch, M.; Del Bello, U.; Carlier, S.; Colin, O.; Fernandez, V.; Gascon, F.; Hoersch, B.; Isola, C.; Laberinti, P.; Martimort, P.; et al. Sentinel-2: ESA’s Optical High-Resolution Mission for GMES Operational Services. Remote Sens. Environ. 2012, 120, 25–36. [Google Scholar] [CrossRef]
  2. Wolanin, A.; Camps-Valls, G.; Gómez-Chova, L.; Mateo-García, G.; van der Tol, C.; Zhang, Y.; Guanter, L. Estimating Crop Primary Productivity with Sentinel-2 and Landsat 8 Using Machine Learning Methods Trained with Radiative Transfer Simulations. Remote Sens. Environ. 2019, 225, 441–457. [Google Scholar] [CrossRef]
  3. Priyadarshini, K.N.; Kumar, M.; Rahaman, S.A.; Nitheshnirmal, S. A Comparative Study of Advanced Land Use/Land Cover Classification Algorithms Using Sentinel-2 Data. Int. Arch. Photogramm. Remote Sens. Spat. Inf. Sci. 2018, XLII–5, 665–670. [Google Scholar] [CrossRef]
  4. Abdi, A.M. Land Cover and Land Use Classification Performance of Machine Learning Algorithms in a Boreal Landscape Using Sentinel-2 Data. GIScience Remote Sens. 2020, 57, 1–20. [Google Scholar] [CrossRef]
  5. Thanh Noi, P.; Kappas, M. Comparison of Random Forest, k-Nearest Neighbor, and Support Vector Machine Classifiers for Land Cover Classification Using Sentinel-2 Imagery. Sensors 2017, 18, 18. [Google Scholar] [CrossRef] [PubMed]
  6. Topaloğlu, R.H.; Sertel, E.; Musaoğlu, N. Assessment of Classification Accuracies of Sentinel-2 and Landsat-8 Data for Land Cover/Use Mapping. Int. Arch. Photogramm. Remote Sens. Spat. Inf. Sci. 2016, XLI-B8, 1055–1059. [Google Scholar] [CrossRef]
  7. Puletti, N.; Chianucci, F.; Castaldi, C. Use of Sentinel-2 for Forest Classification in Mediterranean Environments. Ann. Silvic. Res. 2018, 42, 32–38. [Google Scholar]
  8. Vaglio Laurin, G.; Puletti, N.; Hawthorne, W.; Liesenberg, V.; Corona, P.; Papale, D.; Chen, Q.; Valentini, R. Discrimination of Tropical Forest Types, Dominant Species, and Mapping of Functional Guilds by Hyperspectral and Simulated Multispectral Sentinel-2 Data. Remote Sens. Environ. 2016, 176, 163–176. [Google Scholar] [CrossRef]
  9. Liu, Y.; Gong, W.; Xing, Y.; Hu, X.; Gong, J. Estimation of the Forest Stand Mean Height and Aboveground Biomass in Northeast China Using SAR Sentinel-1B, Multispectral Sentinel-2A, and DEM Imagery. ISPRS J. Photogramm. Remote Sens. 2019, 151, 277–289. [Google Scholar] [CrossRef]
  10. Kaplan, G.; Avdan, U. Mapping and Monitoring Wetlands Using Sentinel-2 Satellite Imagery. ISPRS Ann. Photogramm. Remote Sens. Spat. Inf. Sci. 2017, IV-4/W4, 271–277. [Google Scholar] [CrossRef]
  11. Araya-López, R.A.; Lopatin, J.; Fassnacht, F.E.; Hernández, H.J. Monitoring Andean High Altitude Wetlands in Central Chile with Seasonal Optical Data: A Comparison between Worldview-2 and Sentinel-2 Imagery. ISPRS J. Photogramm. Remote Sens. 2018, 145, 213–224. [Google Scholar] [CrossRef]
  12. Ignar, S.; Szporak-Wasilewska, S.; Gregorczyk, M. Spatial Mapping of the Leaf Area Index Using Remote Sensing and Ground Measurements—The Biebrza National Park Case Study. Sci. Rev. Eng. Env. Sci. 2023, 32, 175–185. [Google Scholar] [CrossRef]
  13. Veloso, A.; Mermoz, S.; Bouvet, A.; Le Toan, T.; Planells, M.; Dejoux, J.-F.; Ceschia, E. Understanding the Temporal Behavior of Crops Using Sentinel-1 and Sentinel-2-like Data for Agricultural Applications. Remote Sens. Environ. 2017, 199, 415–426. [Google Scholar] [CrossRef]
  14. Letey, J. Relationship between Soil Physical Properties and Crop Production. In Advances in Soil Science; Stewart, B.A., Ed.; Advances in Soil Science; Springer New York: New York, NY, USA, 1958; Volume 1, pp. 277–294. ISBN 978-1-4612-9539-6. [Google Scholar]
  15. Virnodkar, S.S.; Pachghare, V.K.; Patil, V.C.; Jha, S.K. Remote Sensing and Machine Learning for Crop Water Stress Determination in Various Crops: A Critical Review. Precis. Agric. 2020, 21, 1121–1155. [Google Scholar] [CrossRef]
  16. Lekshmi, S.U.S.; Singh, D.N.; Baghini, M.S. A Critical Review of Soil Moisture Measurement. Measurement 2014, 54, 92–105. [Google Scholar]
  17. Robinson, D.A.; Campbell, C.S.; Hopmans, J.W.; Hornbuckle, B.K.; Jones, S.B.; Knight, R.; Ogden, F.; Selker, J.; Wendroth, O. Soil Moisture Measurement for Ecological and Hydrological Watershed-Scale Observatories: A Review. Vadose Zone J. 2008, 7, 358–389. [Google Scholar] [CrossRef]
  18. Bircher, S.; Andreasen, M.; Vuollet, J.; Vehviläinen, J.; Rautiainen, K.; Jonard, F.; Weihermüller, L.; Zakharova, E.; Wigneron, J.-P.; Kerr, Y.H. Soil Moisture Sensor Calibration for Organic Soil Surface Layers. Geosci. Instrum. Method. Data Syst. 2016, 5, 109–125. [Google Scholar] [CrossRef]
  19. Gnatowski, T.; Szatyłowicz, J.; Pawluśkiewicz, B.; Oleszczuk, R.; Janicka, M.; Papierowska, E.; Szejba, D. Field Calibration of TDR to Assess the Soil Moisture of Drained Peatland Surface Layers. Water 2018, 10, 1842. [Google Scholar] [CrossRef]
  20. Ledieu, J.; De Ridder, P.; De Clerck, P.; Dautrebande, S. A Method of Measuring Soil Moisture by Time-Domain Reflectometry. J. Hydrol. 1986, 88, 319–328. [Google Scholar] [CrossRef]
  21. Dirksen, C.; Dasberg, S. Improved Calibration of Time Domain Reflectometry Soil Water Content Measurements. Soil Sci. Soc. Am. J. 1993, 57, 660–667. [Google Scholar] [CrossRef]
  22. Malicki, M.A.; Plagge, R.; Roth, C.H. Improving the Calibration of Dielectric TDR Soil Moisture Determination Taking into Account the Solid Soil. Eur. J. Soil Sci. 1996, 47, 357–366. [Google Scholar] [CrossRef]
  23. Szypłowska, A.; Lewandowski, A.; Yagihara, S.; Saito, H.; Furuhata, K.; Szerement, J.; Kafarski, M.; Wilczek, A.; Majcher, J.; Woszczyk, A.; et al. Dielectric Models for Moisture Determination of Soils with Variable Organic Matter Content. Geoderma 2021, 401, 115288. [Google Scholar] [CrossRef]
  24. Topp, G.C.; Davis, J.L.; Annan, A.P. Electromagnetic Determination of Soil Water Content: Measurements in Coaxial Transmission Lines. Water Resour. Res. 1980, 16, 574–582. [Google Scholar] [CrossRef]
  25. Szypłowska, A.; Lewandowski, A.; Kafarski, M.; Szerement, J.; Wilczek, A.; Budzeń, M.; Majcher, J.; Skierucha, W. Influence of Temperature on Soil Dielectric Spectra in the 20 MHz–3 GHz Frequency Range. IEEE Trans. Geosci. Remote Sens. 2023, 61, 1–10. [Google Scholar] [CrossRef]
  26. Roth, C.H.; Malicki, M.A.; Plagge, R. Empirical Evaluation of the Relationship between Soil Dielectric Constant and Volumetric Water Content as the Basis for Calibrating Soil Moisture Measurements by TDR. J. Soil Sci. 1992, 43, 1–13. [Google Scholar] [CrossRef]
  27. Yu, C.; Warrick, A.W.; Conklin, M.H.; Young, M.H.; Zreda, M. Two- and Three-Parameter Calibrations of Time Domain Reflectometry for Soil Moisture Measurement. Water Resour. Res. 1997, 33, 2417–2421. [Google Scholar] [CrossRef]
  28. El Hajj, M.; Baghdadi, N.; Zribi, M.; Bazzi, H. Synergic Use of Sentinel-1 and Sentinel-2 Images for Operational Soil Moisture Mapping at High Spatial Resolution over Agricultural Areas. Remote Sens. 2017, 9, 1292. [Google Scholar] [CrossRef]
  29. Bousbih, S.; Zribi, M.; El Hajj, M.; Baghdadi, N.; Lili-Chabaane, Z.; Gao, Q.; Fanise, P. Soil Moisture and Irrigation Mapping in A Semi-Arid Region, Based on the Synergetic Use of Sentinel-1 and Sentinel-2 Data. Remote Sens. 2018, 10, 1953. [Google Scholar] [CrossRef]
  30. Sadeghi, M.; Babaeian, E.; Tuller, M.; Jones, S.B. The Optical Trapezoid Model: A Novel Approach to Remote Sensing of Soil Moisture Applied to Sentinel-2 and Landsat-8 Observations. Remote Sens. Environ. 2017, 198, 52–68. [Google Scholar] [CrossRef]
  31. Sadeghi, M.; Jones, S.B.; Philpot, W.D. A Linear Physically-Based Model for Remote Sensing of Soil Moisture Using Short Wave Infrared Bands. Remote Sens. Environ. 2015, 164, 66–76. [Google Scholar] [CrossRef]
  32. Ambrosone, M.; Matese, A.; Di Gennaro, S.F.; Gioli, B.; Tudoroiu, M.; Genesio, L.; Miglietta, F.; Baronti, S.; Maienza, A.; Ungaro, F.; et al. Retrieving Soil Moisture in Rainfed and Irrigated Fields Using Sentinel-2 Observations and a Modified OPTRAM Approach. Int. J. Appl. Earth Obs. Geoinf. 2020, 89, 102113. [Google Scholar] [CrossRef]
  33. Kanecka-Geszke, E.; Bąk, B.; Bolewski, T.; Kaca, E. Concept and Implementation of the Polish Innovative Agro-Hydro-Meteorological Monitoring (AgHMM) in INOMEL Project. J. Water Land Dev. 2021, 51, 256–264. [Google Scholar] [CrossRef]
  34. Kaca, E.; Kubrak, J.; Bus, A.; Gnatowski, T.; Oleszczuk, R.; Brandyk, A.; Papierowska, E.; Stańczyk, T.; Szatyłowicz, J.; Szejba, D.; et al. Operacyjne Sterowanie Procesem Nawodnień Podsiąkowych i Odwodnień—Komputerowy System Wspomagania Decyzji Wraz z Przykładami Zastosowania; Kaca, E., Ed.; Bogucki Wydawnictwo Naukowe: Poznań, Poland, 2020; ISBN 978-83-7986-335-8. [Google Scholar]
  35. Bastiaanssen, W.G.M.; Molden, D.J.; Makin, I.W. Remote Sensing for Irrigated Agriculture: Examples from Research and Possible Applications. Agric. Water Manag. 2000, 46, 137–155. [Google Scholar] [CrossRef]
  36. Hillel, D. Soil Moisture and Seed Germination. In Water Deficits and Plant Growth; Kozlowski, T.T., Ed.; Academic Press: New York, NY, USA; London, UK, 1972; Volume 3, pp. 65–89. [Google Scholar]
  37. Institute of Meteorology and Water Management (IMGW—PIB). Available online: https://danepubliczne.imgw.pl (accessed on 7 July 2019).
  38. Kasperska-Wołowicz, W.; Łabędzki, L. Climatic and Agricultural Water Balance for Grasslands in Poland Using the Penman-Monteith Method. Ann. Wars. Agric. Univ. Land Reclam. 2006, 37, 93–100. [Google Scholar]
  39. Łabędzki, L. Irrigation in Poland–Current Status after Reforms in Agriculture and Future Development. J. Water Land Dev. 2007, 11, 3–16. [Google Scholar] [CrossRef]
  40. Skierucha, W.; Wilczek, A.; Szypłowska, A.; Sławiński, C.; Lamorski, K. A TDR-Based Soil Moisture Monitoring System with Simultaneous Measurement of Soil Temperature and Electrical Conductivity. Sensors 2012, 12, 13545–13566. [Google Scholar] [CrossRef] [PubMed]
  41. Delta-T Devices. ThetaProbe Soil Moisture Sensor, Type ML2x, User Manual, ML2x-UM-1.21; Delta-T Devices: Cambridge, UK, 1999. [Google Scholar]
  42. Flint, A.L.; Flint, L.E. Particle Density. In Methods of Soil Analysis: Part 4 Physical Methods; Wiley Online Library: Hoboken, NJ, USA, 2002; Volume 5, pp. 229–240. [Google Scholar]
  43. Grossman, R.B.; Reinsch, T.G. 2.1 Bulk Density and Linear Extensibility. In SSSA Book Series; Dane, J.H., Clarke Topp, G., Eds.; Soil Science Society of America: Madison, WI, USA, 2018; pp. 201–228. ISBN 978-0-89118-893-3. [Google Scholar]
  44. Babaeian, E.; Sadeghi, M.; Franz, T.E.; Jones, S.; Tuller, M. Mapping Soil Moisture with the OPtical TRApezoid Model (OPTRAM) Based on Long-Term MODIS Observations. Remote Sens. Environ. 2018, 211, 425–440. [Google Scholar] [CrossRef]
  45. Chen, M.; Zhang, Y.; Yao, Y.; Lu, J.; Pu, X.; Hu, T.; Wang, P. Evaluation of the OPTRAM Model to Retrieve Soil Moisture in the Sanjiang Plain of Northeast China. Earth Space Sci. 2020, 7, e2020EA001108. [Google Scholar] [CrossRef]
  46. Wojtaszek, M.V.; Abdurahmanov, I. Crop Water Condition Mapping by Optical Remote Sensing. Int. J. Geoinform. 2021, 17, 11–17. [Google Scholar] [CrossRef]
  47. Hassanpour, R.; Zarehaghi, D.; Neyshabouri, M.R.; Feizizadeh, B.; Rahmati, M. Modification on Optical Trapezoid Model for Accurate Estimation of Soil Moisture Content in a Maize Growing Field. J. Appl. Rem. Sens. 2020, 14, 034519. [Google Scholar] [CrossRef]
  48. Sinshaw, B.G.; Moges, M.A.; Tilahun, S.A.; Dokou, Z.; Moges, S.; Anagnostou, E.; Eshete, D.G.; Kindie, A.T.; Bekele, E.; Asese, M. Integration of SWAT and Remote Sensing Techniques to Simulate Soil Moisture in Data Scarce Micro-Watersheds: A Case of Awramba Micro-Watershed in the Upper Blue Nile Basin, Ethiopia. In Advances of Science and Technology, Proceedings of the 7th EAI International Conference, ICAST 2019, Bahir Dar, Ethiopia, 2–4 August 2019; Proceedings 7; Springer: Berlin/Heidelberg, Germany, 2020; pp. 294–314. [Google Scholar]
  49. Mokhtari, A. OPTRAM-ET: A Novel Approach to Remote Sensing of Actual Evapotranspiration Applied to Sentinel-2 and Landsat-8 Observations. Remote Sens. Environ. 2023, 286, 113443. [Google Scholar] [CrossRef]
  50. Burdun, I.; Bechtold, M.; Sagris, V.; Komisarenko, V.; De Lannoy, G.; Mander, Ü. A Comparison of Three Trapezoid Models Using Optical and Thermal Satellite Imagery for Water Table Depth Monitoring in Estonian Bogs. Remote Sens. 2020, 12, 1980. [Google Scholar] [CrossRef]
  51. Effati, M.; Bahrami, H.-A.; Gohardoust, M.; Babaeian, E.; Tuller, M. Application of Satellite Remote Sensing for Estimation of Dust Emission Probability in the Urmia Lake Basin in Iran. Soil Sci. Soc. Am. J. 2019, 83, 993–1002. [Google Scholar] [CrossRef]
  52. Acharya, U.; Daigh, A.L.M.; Oduor, P.G. Soil Moisture Mapping with Moisture-Related Indices, OPTRAM, and an Integrated Random Forest-OPTRAM Algorithm from Landsat 8 Images. Remote Sens. 2022, 14, 3801. [Google Scholar] [CrossRef]
  53. Sun, H.; Liu, H.; Ma, Y.; Xia, Q. Optical Remote Sensing Indexes of Soil Moisture: Evaluation and Improvement Based on Aircraft Experiment Observations. Remote Sens. 2021, 13, 4638. [Google Scholar] [CrossRef]
  54. Wang, L.; Qu, J.J. NMDI: A Normalized Multi-Band Drought Index for Monitoring Soil and Vegetation Moisture with Satellite Remote Sensing. Geophys. Res. Lett. 2007, 34, L20405. [Google Scholar] [CrossRef]
  55. McFeeters, S.K. The Use of the Normalized Difference Water Index (NDWI) in the Delineation of Open Water Features. Int. J. Remote Sens. 1996, 17, 1425–1432. [Google Scholar] [CrossRef]
  56. Gitelson, A.A.; Kaufman, Y.J.; Merzlyak, M.N. Use of a Green Channel in Remote Sensing of Global Vegetation from EOS-MODIS. Remote Sens. Environ. 1996, 58, 289–298. [Google Scholar] [CrossRef]
  57. Rikimaru, A.; Roy, P.S.; Miyatake, S. Tropical Forest Cover Density Mapping. Trop. Ecol. 2002, 43, 39–47. [Google Scholar]
  58. Gómez-Giráldez, P.J.; Pérez-Palazón, M.J.; Polo, M.J.; González-Dugo, M.P. Monitoring Grass Phenology and Hydrological Dynamics of an Oak–Grass Savanna Ecosystem Using Sentinel-2 and Terrestrial Photography. Remote Sens. 2020, 12, 600. [Google Scholar] [CrossRef]
  59. Gitelson, A.A.; Chivkunova, O.B.; Merzlyak, M.N. Nondestructive Estimation of Anthocyanins and Chlorophylls in Anthocyanic Leaves. Am. J. Bot. 2009, 96, 1861–1868. [Google Scholar] [CrossRef] [PubMed]
  60. Somvanshi, S.S.; Kumari, M. Comparative Analysis of Different Vegetation Indices with Respect to Atmospheric Particulate Pollution Using Sentinel Data. Appl. Comput. Geosci. 2020, 7, 100032. [Google Scholar] [CrossRef]
  61. Dotzler, S.; Hill, J.; Buddenbaum, H.; Stoffels, J. The Potential of EnMAP and Sentinel-2 Data for Detecting Drought Stress Phenomena in Deciduous Forest Communities. Remote Sens. 2015, 7, 14227–14258. [Google Scholar] [CrossRef]
  62. Wu, C.; Niu, Z.; Tang, Q.; Huang, W. Estimating Chlorophyll Content from Hyperspectral Vegetation Indices: Modeling and Validation. J. Agric. Meteorol. 2008, 148, 1230–1241. [Google Scholar] [CrossRef]
  63. Yilmaz, M.T.; Hunt, E.R.; Jackson, T.J. Remote Sensing of Vegetation Water Content from Equivalent Water Thickness Using Satellite Imagery. Remote Sens. Environ. 2008, 112, 2514–2522. [Google Scholar] [CrossRef]
  64. Fitzgerald, G.; Rodriguez, D.; O’Leary, G. Measuring and Predicting Canopy Nitrogen Nutrition in Wheat Using a Spectral Index—The Canopy Chlorophyll Content Index (CCCI). Field Crop. Res. 2010, 116, 318–324. [Google Scholar] [CrossRef]
  65. Sims, D.A.; Gamon, J.A. Relationships between Leaf Pigment Content and Spectral Reflectance across a Wide Range of Species, Leaf Structures and Developmental Stages. Remote Sens. Environ. 2002, 81, 337–354. [Google Scholar] [CrossRef]
  66. Yang, X.; Qin, Q.; Grussenmeyer, P.; Koehl, M. Urban Surface Water Body Detection with Suppressed Built-up Noise Based on Water Indices from Sentinel-2 MSI Imagery. Remote Sens. Environ. 2018, 219, 259–270. [Google Scholar] [CrossRef]
  67. Haubrock, S.-N.; Chabrillat, S.; Lemmnitz, C.; Kaufmann, H. Surface Soil Moisture Quantification Models from Reflectance Data under Field Conditions. Int. J. Remote Sens. 2008, 29, 3–29. [Google Scholar] [CrossRef]
  68. Gao, B.-C. NDWI—A Normalized Difference Water Index for Remote Sensing of Vegetation Liquid Water from Space. Remote Sens. Environ. 1996, 58, 257–266. [Google Scholar] [CrossRef]
Figure 1. Location of examined irrigation and drainage sites in Poland: C—Czarny Rów, T—Troszyn, G—Grabów.
Remotesensing 15 05576 g001
Figure 2. Detailed maps of three study sites with an indication of the in situ measurement points.
Remotesensing 15 05576 g002
Figure 3. The scheme of methodology used in this study.
Remotesensing 15 05576 g003
Figure 4. Box-and-whisker plots of (a) SSM distribution at the examined three sites in the days of manual measurement in situ and (b) NDVI values distribution at the examined sites calculated based on satellite scenes acquired on dates close to the days of in situ measurement (♦—outlier cases); in the period from April 2018 till the end of October in 2019.
Remotesensing 15 05576 g004
Figure 5. Soil moisture scatter plot with lines of best-fit parameters of the linear and exponential equations of the dry (red lines) and wet (blue lines) margins using the OPTRAM method—colored points: ground measurements; grey points: values for pixels from S2 scenes.
Remotesensing 15 05576 g005
Figure 6. An example of relationships between surface soil moisture (cm3 cm−3) measured in situ and calculated using OPTRAM method; (a) linear and (b) exponential, soil porosity included, NDVI ≤ 0.3, n = 218.
Remotesensing 15 05576 g006
Figure 7. An example of relationships between surface soil moisture (cm3 cm−3) measured in situ and calculated using the OPTRAM method: (a) linear and (b) exponential. These do not include soil porosity, NDVI ≤ 0.3, n = 218.
Remotesensing 15 05576 g007
Figure 8. Relationships between NDVI and coefficient of determination for estimation of SSM by linear (OPTRAM_lin) and exponential (OPTRAM_exp) equations with porosity (p) and without porosity (np).
Remotesensing 15 05576 g008
Figure 9. Maps of estimated SSM using the OPTRAM_exp_p model, developed for selected dates in April 2019.
Remotesensing 15 05576 g009
Figure 10. The R2 values for SSM estimation by vegetation indices and OPTRAM (with soil porosity) results for different ranges of NDVI.
Remotesensing 15 05576 g010
Table 1. Mean values of air temperature and precipitation totals at the agro-meteorological stations situated at the examined sites in the growing season (April–September).
Parameter, Unit1991–2020 12019
BydgoszczWarsawCzarny RówGrabówTroszyn
Air temperature, °C15.815.716.116.516.9
Precipitation, mm317348236306212
1 Long-term mean values from the stations representing the analyzed sites (Bydgoszcz for Czarny Rów and Warsaw-Okęcie for Grabów and Troszyn).
Disclaimer/Publisher’s Note: The statements, opinions and data contained in all publications are solely those of the individual author(s) and contributor(s) and not of MDPI and/or the editor(s). MDPI and/or the editor(s) disclaim responsibility for any injury to people or property resulting from any ideas, methods, instructions or products referred to in the content.

