Article

Changes in Qinghai Lake Area and Their Interactions with Climatic Factors

1
School of Environment and Spatial Informatics, China University of Mining and Technology, Xuzhou 221000, China
2
Jiangsu Key Laboratory of Coal-Based Greenhouse Gas Control and Utilization, China University of Mining and Technology, Xuzhou 221008, China
*
Author to whom correspondence should be addressed.
Remote Sens. 2024, 16(1), 129; https://doi.org/10.3390/rs16010129
Submission received: 24 November 2023 / Revised: 20 December 2023 / Accepted: 25 December 2023 / Published: 28 December 2023

Abstract

:
Lakes play a crucial role in the global water cycle and significantly contribute to enhancing regional ecological environments and simulating economic growth. In this study, based on the data from the Landsat TM 4-5, Landsat 7 ETM SLC-off, and Landsat 8-9 OLI/TIRS C2 L2 satellites, the surface area of Qinghai Lake is obtained by using the Normalized Difference Water Index (NDWI) method. Additionally, leveraging the European Centre for Medium-Range Weather Forecasts (ECMWF) fifth-generation land surface reanalysis dataset (ERA5-Land), we analyzed the interplay between lake area and related climate factors by using the Noise Assisted–Multivariate Empirical Mode Decomposition (NA-MEMD) and wavelet coherence analysis method. The surface area of Qinghai Lake showed an overall expansion trend from 1986 to 2022, with an expansion rate of 2.89 km2/a. Precipitation, temperature, and evapotranspiration (ET) also showed an increasing trend, with the largest increasing trend in autumn, summer, and summer, respectively. The area of Qinghai Lake did not demonstrate distinct periodic patterns from 1986 to 2022, in contrast to the marked 8–16 month oscillations observed in precipitation, temperature, and ET. In the phase of lake area expansion between 2008 and 2016, changes in the lake’s surface area were observed to trail behind variations in precipitation and temperature by approximately three months. Furthermore, the shift in ET was found to lag behind alterations in the lake area, displaying a delay of 3–6 months.

1. Introduction

The role of lakes in the world’s water systems is profound. Covering approximately 1.8% of Earth’s land surface, totaling around 2.7 million square kilometers, they stand as a crucial component of the water cycle, second only to glaciers [1]. The fluctuations in lake sizes serve as valuable indicators of regional and global climate variations, ecological shifts, and geological dynamics [2,3]. By scrutinizing these changes, we gain insights into the regional water balance and comprehend how external elements—whether natural or human-induced—impact these critical ecosystem [4]. Such studies hold immense significance for sustainable development, the judicious use of resources, and the preservation of lakes, fostering a better understanding of their scientific and ecological importance [5,6,7].
The Tibetan Plateau (TP), distinguished by its high average elevation, is among the world’s regions most densely populated with lakes [8,9]. The dynamics of this area, particularly changes in the surface areas and numbers of lakes, are heavily influenced by precipitation and the melting of glaciers [10,11,12,13,14,15]. Characterized by dry air and intense evaporation, TP exhibits a rapid transfer of lake water to the atmosphere following precipitation events. Consequently, there exists a significant relationship between the surface area and number of lakes on the TP and the process of evapotranspiration (ET). ET plays a crucial role in the water cycle of this high-altitude region, directly impacting the hydrological balance and, subsequently, the size and number of lakes.
Remote sensing technology has demonstrated clear benefits in monitoring surface resources owing to its ability to cover large regions, capture data over extended periods, and provide real-time information [16]. Numerous studies have already leveraged diverse remote sensing data sources to investigate alterations in lake surface areas across various geographic locations [17,18,19,20]. In specific research endeavors, a methodology for identifying water bodies based on their spectral properties has been proposed. Some approaches utilize the reflectance properties from Moderate Resolution Imaging Spectroradiometer (MODIS) data to analyze water body spectra, which provides a swift and uncomplicated means for monitoring the quality of lake water [21,22,23]. By combining remote sensing data of lake areas with bathymetric data, researchers can estimate water volumes, vital for water resource management [24]. Normalized Difference Water Index (NDWI) and Modified NDWI were developed by utilizing the green and near-infrared (NIR) bands of satellite imagery to enhance the presence of water bodies, while suppressing land and cloud features [25]. Synthetic Aperture Radar (SAR) can be particularly useful for mapping water bodies under all weather conditions and during nighttime [26]. Furthermore, algorithms like random forest, support vector machines, or neural networks are trained to classify pixels as water or non-water based on their spectral properties [27].
Ma et al. [28] analyzed the trends in the surface area of Ruoqiang Lake in Xinjiang Province from 1970 to 2006 based on a combination of early remote sensing data, along with data acquired from the China–Pakistan Resources Satellite (CPRS). The results revealed a significant increase in the lake’s surface area beginning in 2002, which may have been related to a variety of environment factors, including glacier melting, precipitation increases, and ecological water transfer. Based on the normalized vegetation index (NDVI), combined with the established method of spectral characterization of distinct features, Li et al. [22] observed a recurring pattern in the water body of Dongting Lake during the year 2005, and the lake exhibited a characteristic of being smaller in size during the winter and spring seasons, while its surface area expanded notably during the summer and autumn months. By analyzing the changes in the area of Selincuo Lake from 1999 to 2008, Bian et al. found that Selincuo Lake expanded outward at an inter-annual rate of 20% [29]. EI-Asmar et al. monitored the dynamics of several water body areas in the Nile Delta using the Normalized Difference Water Index (NDWI) and the Modified NDWI (MNDWI), and the results showed that human activities are the main cause of lake shrinkage [30,31].
Many studies have found that the main influencing factors of lake area are anthropogenic and natural factors, of which the natural factors are mainly precipitation and ET [32,33,34]. The lakes on TP also basically follow this pattern, where increased precipitation and decreased ET cause the expansion of the lake area and water volume [35,36]. On the other hand, ET is also a process in the water cycle and an important cause of water loss in lakes. Lake ET is influenced by many factors, such as lake area, water depth, water quality, water purity, and water color, as well as solar radiation, temperature, humidity, pressure, wind speed, and precipitation [10,37].
In this study, the area of Qinghai Lake was meticulously extracted from multi-source remote sensing imagery data, covering the years from 1986 to 2022. By integrating satellite observation data with meteorological elements, the analysis was conducted across various time scales, which might deepen the understanding of interactions between lakes and meteorology. A detailed analysis was conducted to explore the relationship between the lake area and associated meteorological elements, with the aim of unraveling the intricate mechanisms driving the interactions between climate change and human activities affecting Qinghai Lake. The findings of this study are not only pivotal for the protection, sustainable development, and judicious utilization of Qinghai Lake’s ecological environment, but also provide a robust scientific foundation for the assessment of water resources and the formulation of ecological protection strategies.

2. Materials and Methods
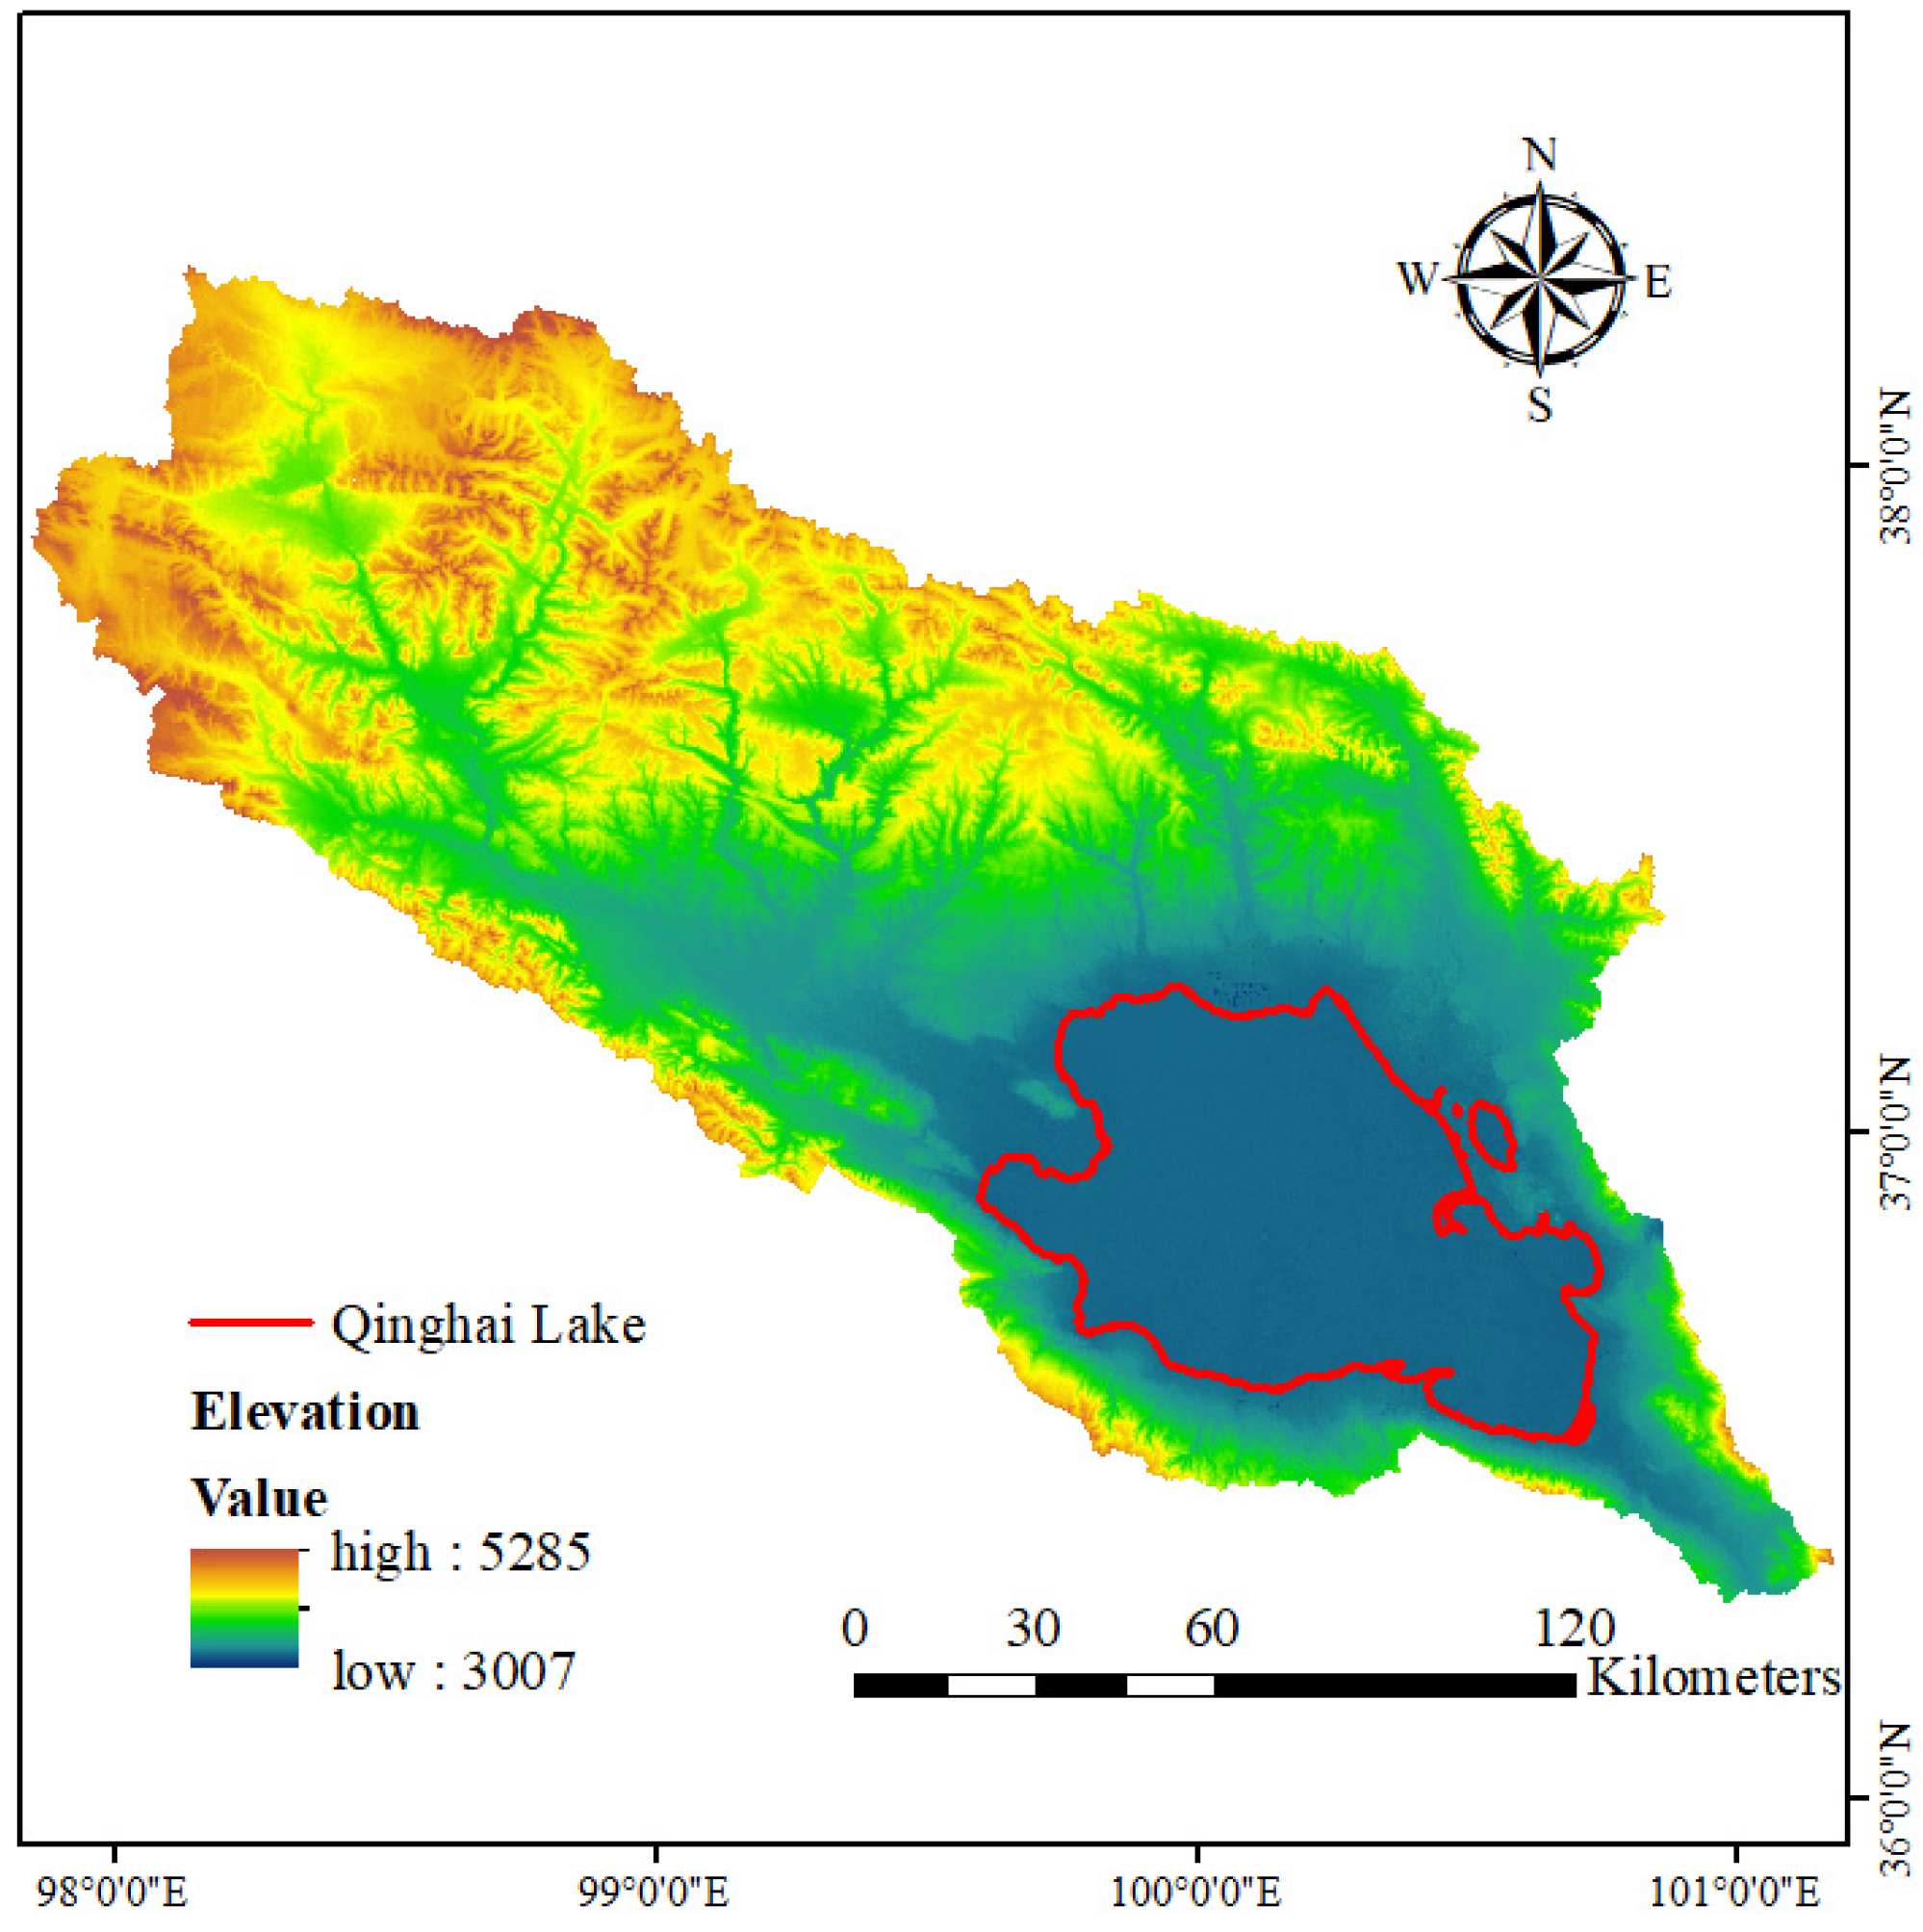
2.1. Study Region

Qinghai Lake, situated in the northeastern Tibetan Plateau, stands as China’s largest inland saltwater lake. Spanning 105 km in length and 63 km in width, it rests at an elevation of 3196 m above sea level, covering an expansive area of 4572.69 km2. The lake boasts an average water depth of 21 m and a water storage capacity of 105 billion m3 [38]. Positioned between latitudes 36.47° to 37.28° and longitudes 99.7° to 100.9°, Qinghai Lake is a prominent feature within the region.
Figure 1 illustrates the Qinghai Lake Basin, showcasing its elevation distribution. The elevation data originated from the Advanced Spaceborne Thermal Emission and Reflection Radiometer Global Digital Elevation Model (ASTER GDEM version 1). This dataset was derived from optical imagery captured by the METI ASTER imaging device aboard NASA’s Terra satellite. Released in June 2009, the dataset, projected as WGS84, possesses a resolution of 30 m.
Qinghai Lake’s elevation hovers around 3200 m above sea level, establishing it among the largest and highest saltwater lakes globally. The surrounding Kunlun and Qilian Mountains significantly contribute to the region’s hydrology and elevation gradients, featuring peaks that surpass 5000 m above sea level in the northwest of the lake.

2.2. Data

2.2.1. Remote Sensing Data

The image data of the lake utilized in this study spanning from 1986 to 2022 were sourced from multiple satellites: Landsat TM 4-5, Landsat 7 ETM SLC-off, and Landsat 8-9 OLI/TIRS C2 L2, all acquired from the United States Geological Survey (USGS). The Landsat satellite series operates on a revisit cycle of approximately 16 days. Specifically, datasets with a resolution of 30 m and less than 15% cloud coverage for each month were obtained.
Detailed information regarding the bands and corresponding parameters for each satellite can be found in Table 1. This data collection process ensured the acquisition of high-quality imagery for the specified time frame, enabling comprehensive analysis and study of the lake dynamics and changes over the years.

2.2.2. Observational Hydrological and Meteorological Data

The validation data used in this study were sourced from the Qinghai Provincial Institute of Comprehensive Survey and Monitoring of Natural Resources. These validation data consisted of lake boundary information, manually derived by experts based on their knowledge, expertise, and available information. These manually interpreted boundaries served as the reference data to evaluate the accuracy of automatically extracted lake boundaries obtained from remote sensing imagery.
The hydrological and meteorological dataset concerning Qinghai Lake spanning from 1956 to 2020 were acquired from Lake-Watershed Science SubCenter, National Earth System Science Data Center, National Science & Technology Infrastructure of China (http://www.geodata.cn/data/datadetails.html?dataguid=34628698652201&docid=2887, accessed on 10 October 2023) [39]. This comprehensive dataset encompasses various parameters, such as the lake surface temperature (LSWT) recorded at the Xiashe Station from 1967 to 2020, lake ice thickness and freezing period data from the Xiashe Station available from 1994 to 2020, watershed runoff data from the Buha Station spanning 1956 to 2020, water level records from the Xiashe Station from 1956 to 2020, historical lake area data from 1956 to 2020, temperature records from the Gangcha Station between 1958 and 2019, and precipitation data from the Gangcha Station covering the period from 1958 to 2019. This comprehensive dataset forms the basis for conducting analyses and assessments related to Qinghai Lake’s hydrology and meteorology over an extensive time frame.

2.2.3. Climate Factors

The precipitation and temperature data utilized in this study were obtained from the National Earth System Science Data Center, National Science & Technology Infrastructure of China (accessible via http://www.geodata.cn/data/datadetails.html?dataguid=164304785536614&docId=732 and http://www.geodata.cn/data/datadetails.html?dataguid=192891852410344&docId=518 accessed on 6 May 2023) [40,41,42]. These datasets were derived from the 30′ Climatic Research Unit (CRU) time series dataset in conjunction with the WorldClim climatology dataset, utilizing delta spatial downscaling techniques. Evaluation and validation of this dataset were performed using observations collected from 1951 to 2016 through 496 weather stations across China. The dataset offers a spatial resolution of 0.5′ (approximately 1 km) and a monthly temporal resolution, covering China from 1901 to 2022. This dataset is recognized for its reliability and utility in examining climate change phenomena across China [43,44,45].
The ET data employed in this study originated from the European Centre for Medium-Range Weather Forecasts (ECMWF) fifth-generation land surface reanalysis dataset [46] (ERA5-Land). This dataset provides an extensive record of land surface variables and their characteristics over several decades at a higher resolution compared to the ERA5 reanalysis dataset. ERA5-Land incorporates physical principles and merges model data with global observations to create a comprehensive dataset. It offers detailed records from 1950 onwards with a temporal resolution of 1 h and a spatial resolution of 9 km, represented on a simplified Gaussian grid (TCo1279), which has been transformed from the CDS into a regular latitude/longitude grid of 0.1° × 0.1°.
In the process of analysis, all monthly data were standardized to cover the period from 1986 to 2022. However, it is important to note that the observational data from weather stations were recorded on an annual basis, and the latest available data were up until the year 2020. Consequently, when analyzing data from these observation stations, the time frame considered was from 1986 to 2020.

2.3. Methodology

2.3.1. Linear Trend Analysis

Linear trend analysis is a statistical technique utilized to assess and uncover patterns or trends within a dataset over a specified time frame. This method involves fitting a straight line to the dataset to ascertain the direction and extent of changes in variables over time.
Formula (1) was employed in this paper to compute the trend of climate elements, such as precipitation, temperature, and ET, across different time periods (1986–2022, 1986–2004, 2004–2022).
Y i = b t + a   ( i = 1,2 , , n )
The regression coefficient of ‘b’ represents the tendency rate of the climate element of ‘Y’ concerning time of ‘t’. A positive ‘b’ indicates an increasing trend of the climate element with time, while a negative ‘b’ indicates a decreasing trend. The coefficient of ‘b’ was obtained using the least squares method, which worked by minimizing the sum of the squared differences between the observed values and the fitted line (or curve) to determine the best coefficient values.

2.3.2. Noise Assisted–Multivariate Empirical Mode Decomposition (NA-MEMD)

The Empirical Mode Decomposition (EMD) technique, proposed by Huang et al. [47], stands as a data-driven adaptive method extensively applied in earth system analyses. To mitigate pattern aliasing issues inherent in EMD, Wu and Huang [48] devised the Ensemble Empirical Mode Decomposition (EEMD), which incorporates the statistical properties of white noise featuring a uniform frequency distribution.
Expanding on these advancements, Rehman et al. [49,50] introduced Multivariate EMD (MEMD) and Noise Assisted–Multivariate Empirical Mode Decomposition (NA-MEMD). These methods were designed to enable the analysis of multi-channel data, allowing for more comprehensive assessments and interpretations. For a more comprehensive understanding of NA-MEMD, detailed information can be found in the work by Rehman et al. [49].

2.3.3. Wavelet Coherence Analysis Method

Wavelet analysis serves as a valuable tool for scrutinizing the correlation structure between ecological signals over time, particularly in systems demonstrating non-stationary behavior [51]. In this study, three primary techniques, namely, the wavelet transform (WT), wavelet coherence (WTC), and cross-wavelet transform (XWT), were employed to analyze the characteristics of Qinghai Lakes’ surface area and related climatic factors [33,35,52,53,54].
The formula for the WT is represented as follows:
W T ( α , τ ) = 1 α f t ψ ( t τ α ) d t
where f t represents the signal to be analyzed, and the independent variable t is a time domain signal, which serves as the input for the wavelet transform. ψ ( t τ α ) represents the transformed form of the mother wavelet function after scaling and shifting. The result of the wavelet transform is denoted as W T ( α , τ ) , which consists of two parameters, α and τ, representing the scale factor and the translation factor used to adjust the scale and position of the wavelet function, respectively.
WTC discerns time–frequency regions where two time series exhibit joint variations. It dissects the overall correlation between the variables into scale- and location-specific correlations, unveiling relationships at distinct scales and locations. On the other hand, the XWT identifies time–frequency regions where the periodicity intensity remains consistent across the time series [55]. These methods provide insights into how the variables of interest interact across different scales and time intervals.

2.4. Extraction of Lake Surface Area

The NDWI is a remote sensing index used to detect the presence of water bodies or monitor changes in water content within an area. The NDWI is calculated from satellite or aerial imagery by leveraging the differences in how water and other materials reflect light in certain spectral bands. The formula for NDWI involves the near-infrared (NIR) and green or blue spectral bands, which were used to extract the surface of water bodies [25,56] of Qinghai Lake from 1986 to 2022. The principle is that a water body has higher reflectivity than the rest of the material, thus highlighting the water body information. The formula is as follows:
N D W I = ρ G r e e n ρ N I R ρ G r e e n + ρ N I R
The process of extracting water body information from Landsat satellite imagery involved specific bands for different satellite generations:
  • Landsat TM 4-5: Employed the green, near-infrared (NIR), and shortwave infrared (SWIR) bands.
  • Landsat 7 ETM SLC-off: Utilized Band2, Band4, and Band7.
  • Landsat 8-9 OLI/TIRS C2 L2: Utilized Band3, Band5, and Band7.
The steps for extracting the water body area from the imagery were as follows:
(i)
Importing the original remote sensing image of the water bodies into ArcGIS. Utilizing the raster calculator within map algebra, the Normalized Difference Water Index (NDWI) was computed, generating NDWI data spanning from 1986 to 2022.
(ii)
Reclassifying the NDWI data obtained in the previous step. Setting the category as 2 with a breakpoint value of 0.1, assigning values of 0–1 to 1, and marking other values as Nodata. Subsequently, handling any missing data by converting it to Nodata. The reclassified results were projected onto the surface, allowing for visualization and assessment. The attribute table of the resulting file was reviewed to select the regions of interest, enabling the determination of each lake’s area for the corresponding year. The date and area were recorded in square kilometers, with precision to 0.01.
It is important to note that during NDWI calculation, remote sensing images might display additional features, like tributaries or small surrounding water bodies. Therefore, in this study, the NDWI-processed image results were cropped according to the actual value images to obtain the final accurate outcome.

3. Results and Discussions

3.1. Evaluation of Satellite-Derived Lake Area Data

The validation of satellite-derived lake area measurements against station-observed lake area data and water levels yielded compelling results (as showed in Figure 2). The comparative analysis revealed a notably high level of linear correlation between the two datasets. Specifically, the linear correlation coefficient between the satellite-derived lake area data and the observed lake area data was determined to be 0.99. This exceptionally high correlation coefficient underscores the accuracy and reliability of the satellite-derived lake area estimations.
Furthermore, when validating against water level measurements, a strong linear correlation was also established, with a correlation coefficient of 0.93. This indicates a robust relationship between satellite-derived lake area and water levels recorded by ground-based stations. The slightly lower but still significant correlation coefficient reinforces the satellite-derived data’s capability to capture fluctuations in the lake area accurately.

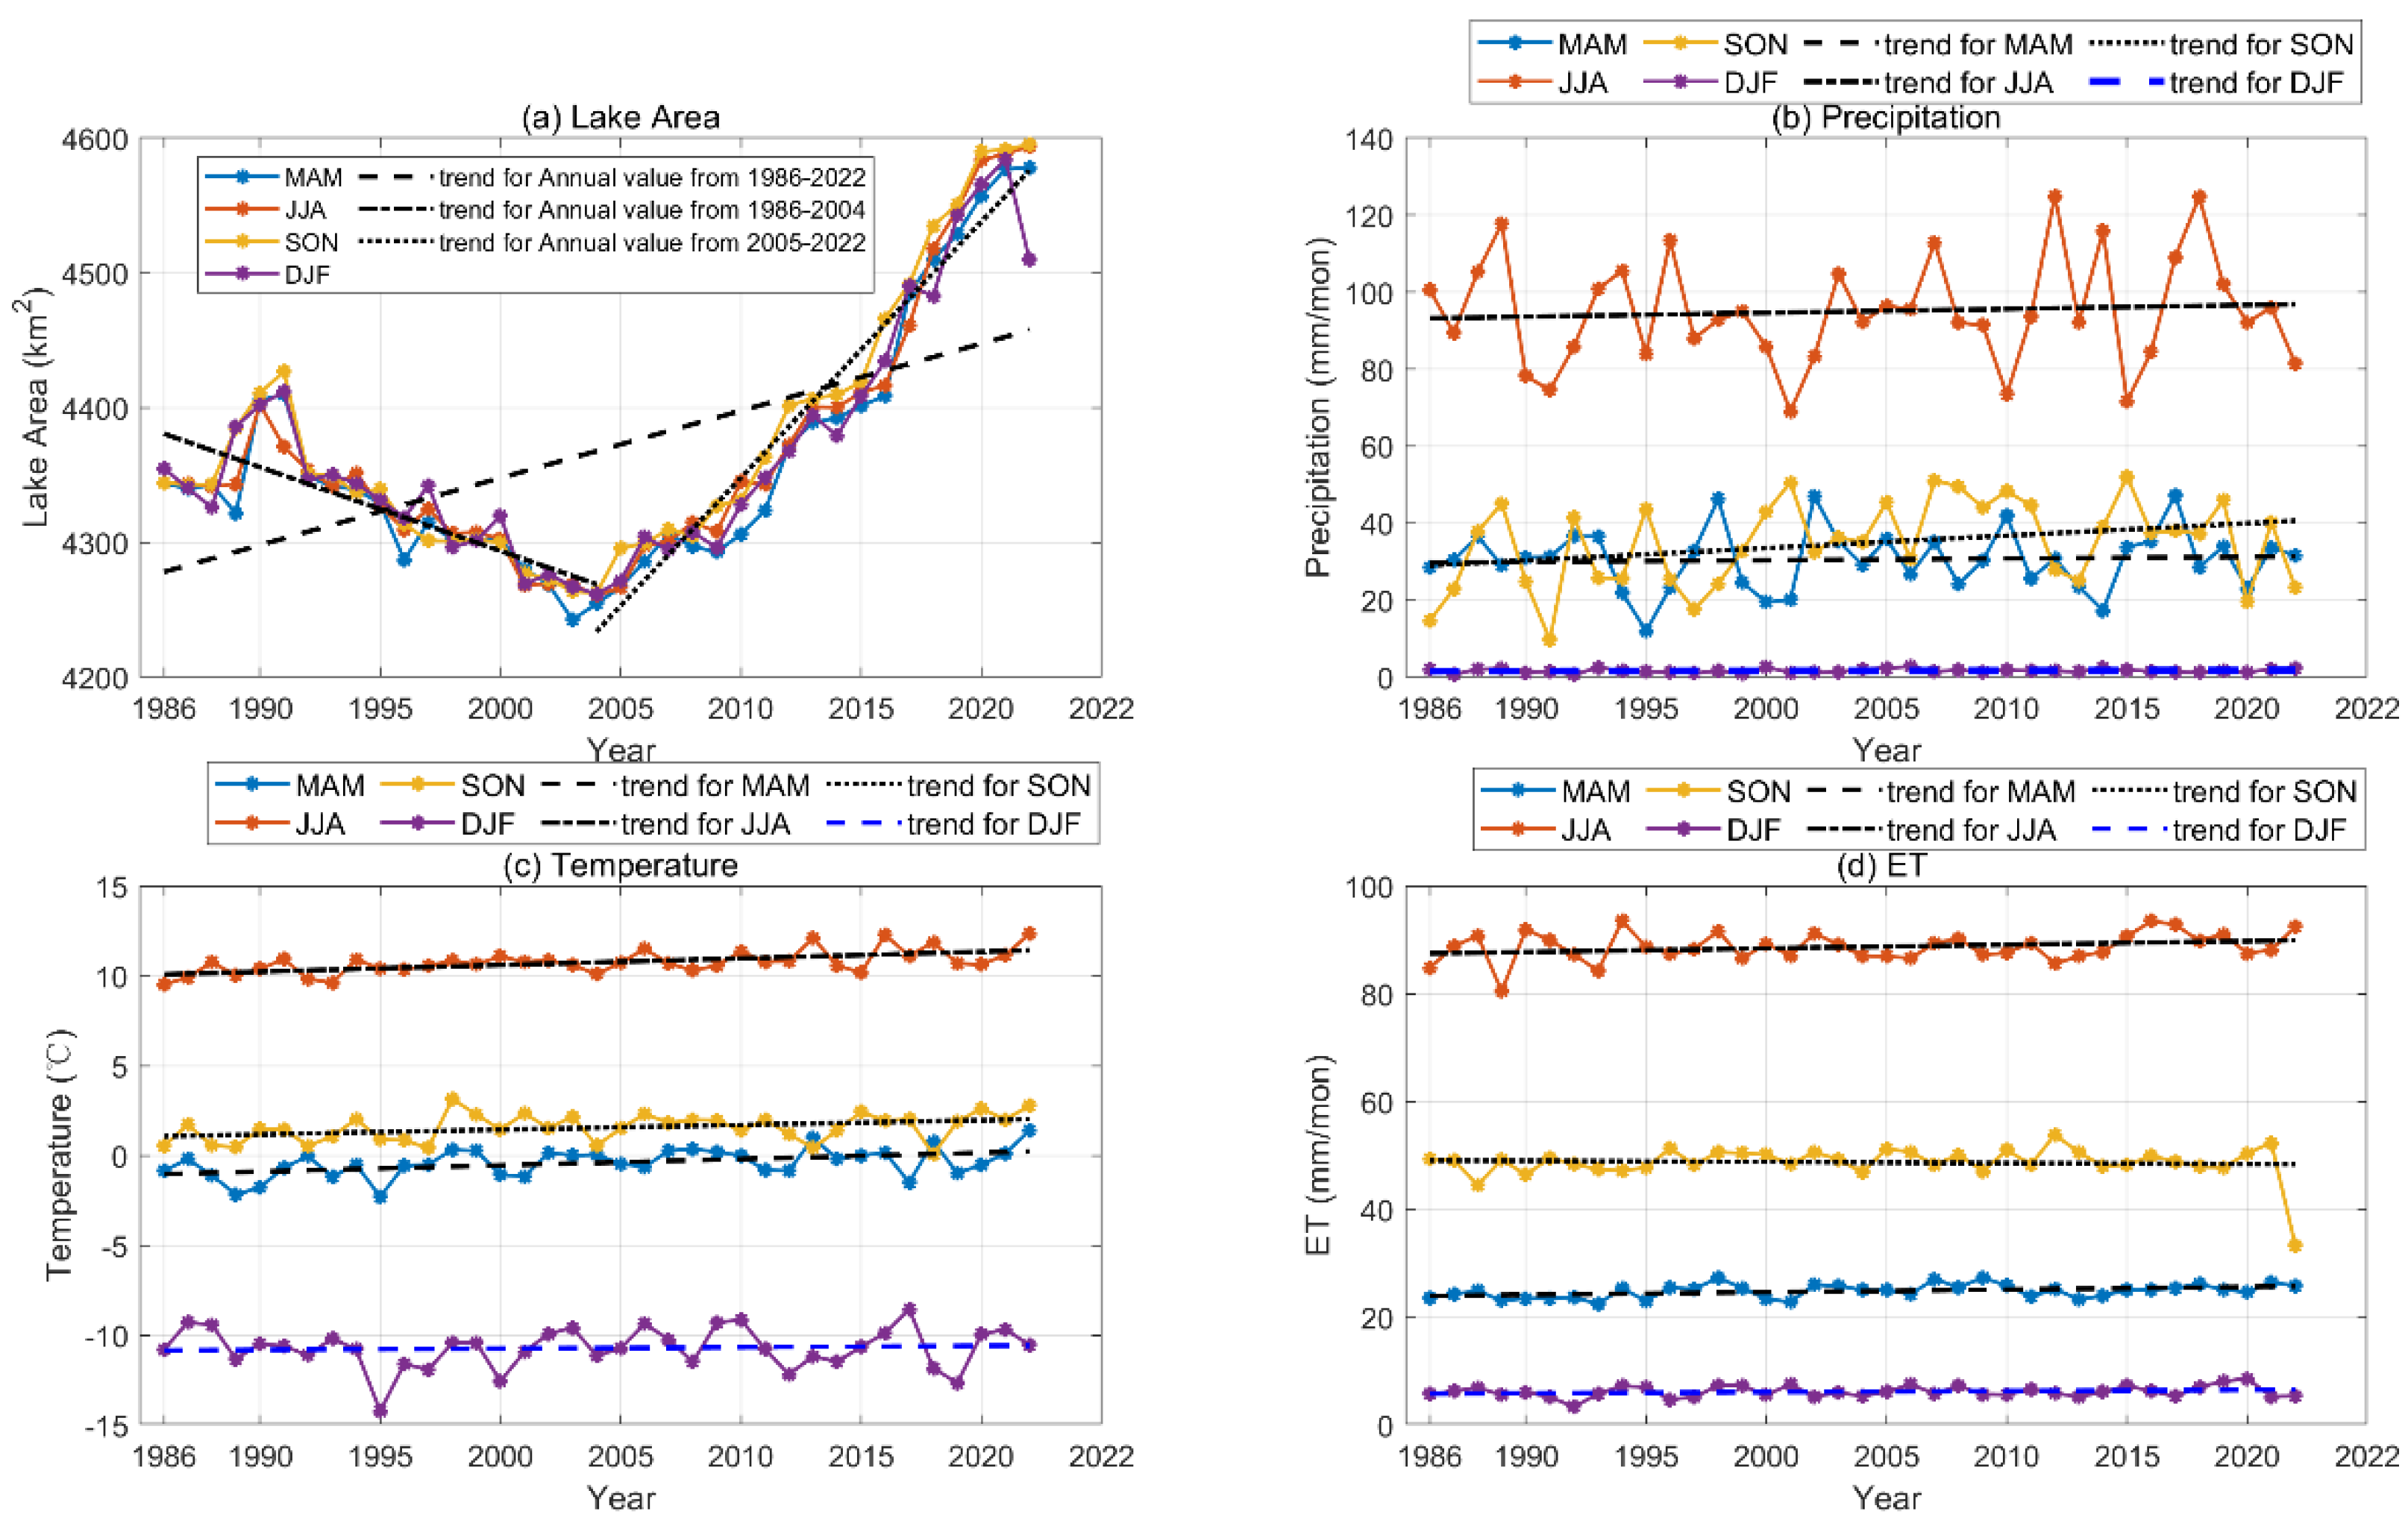
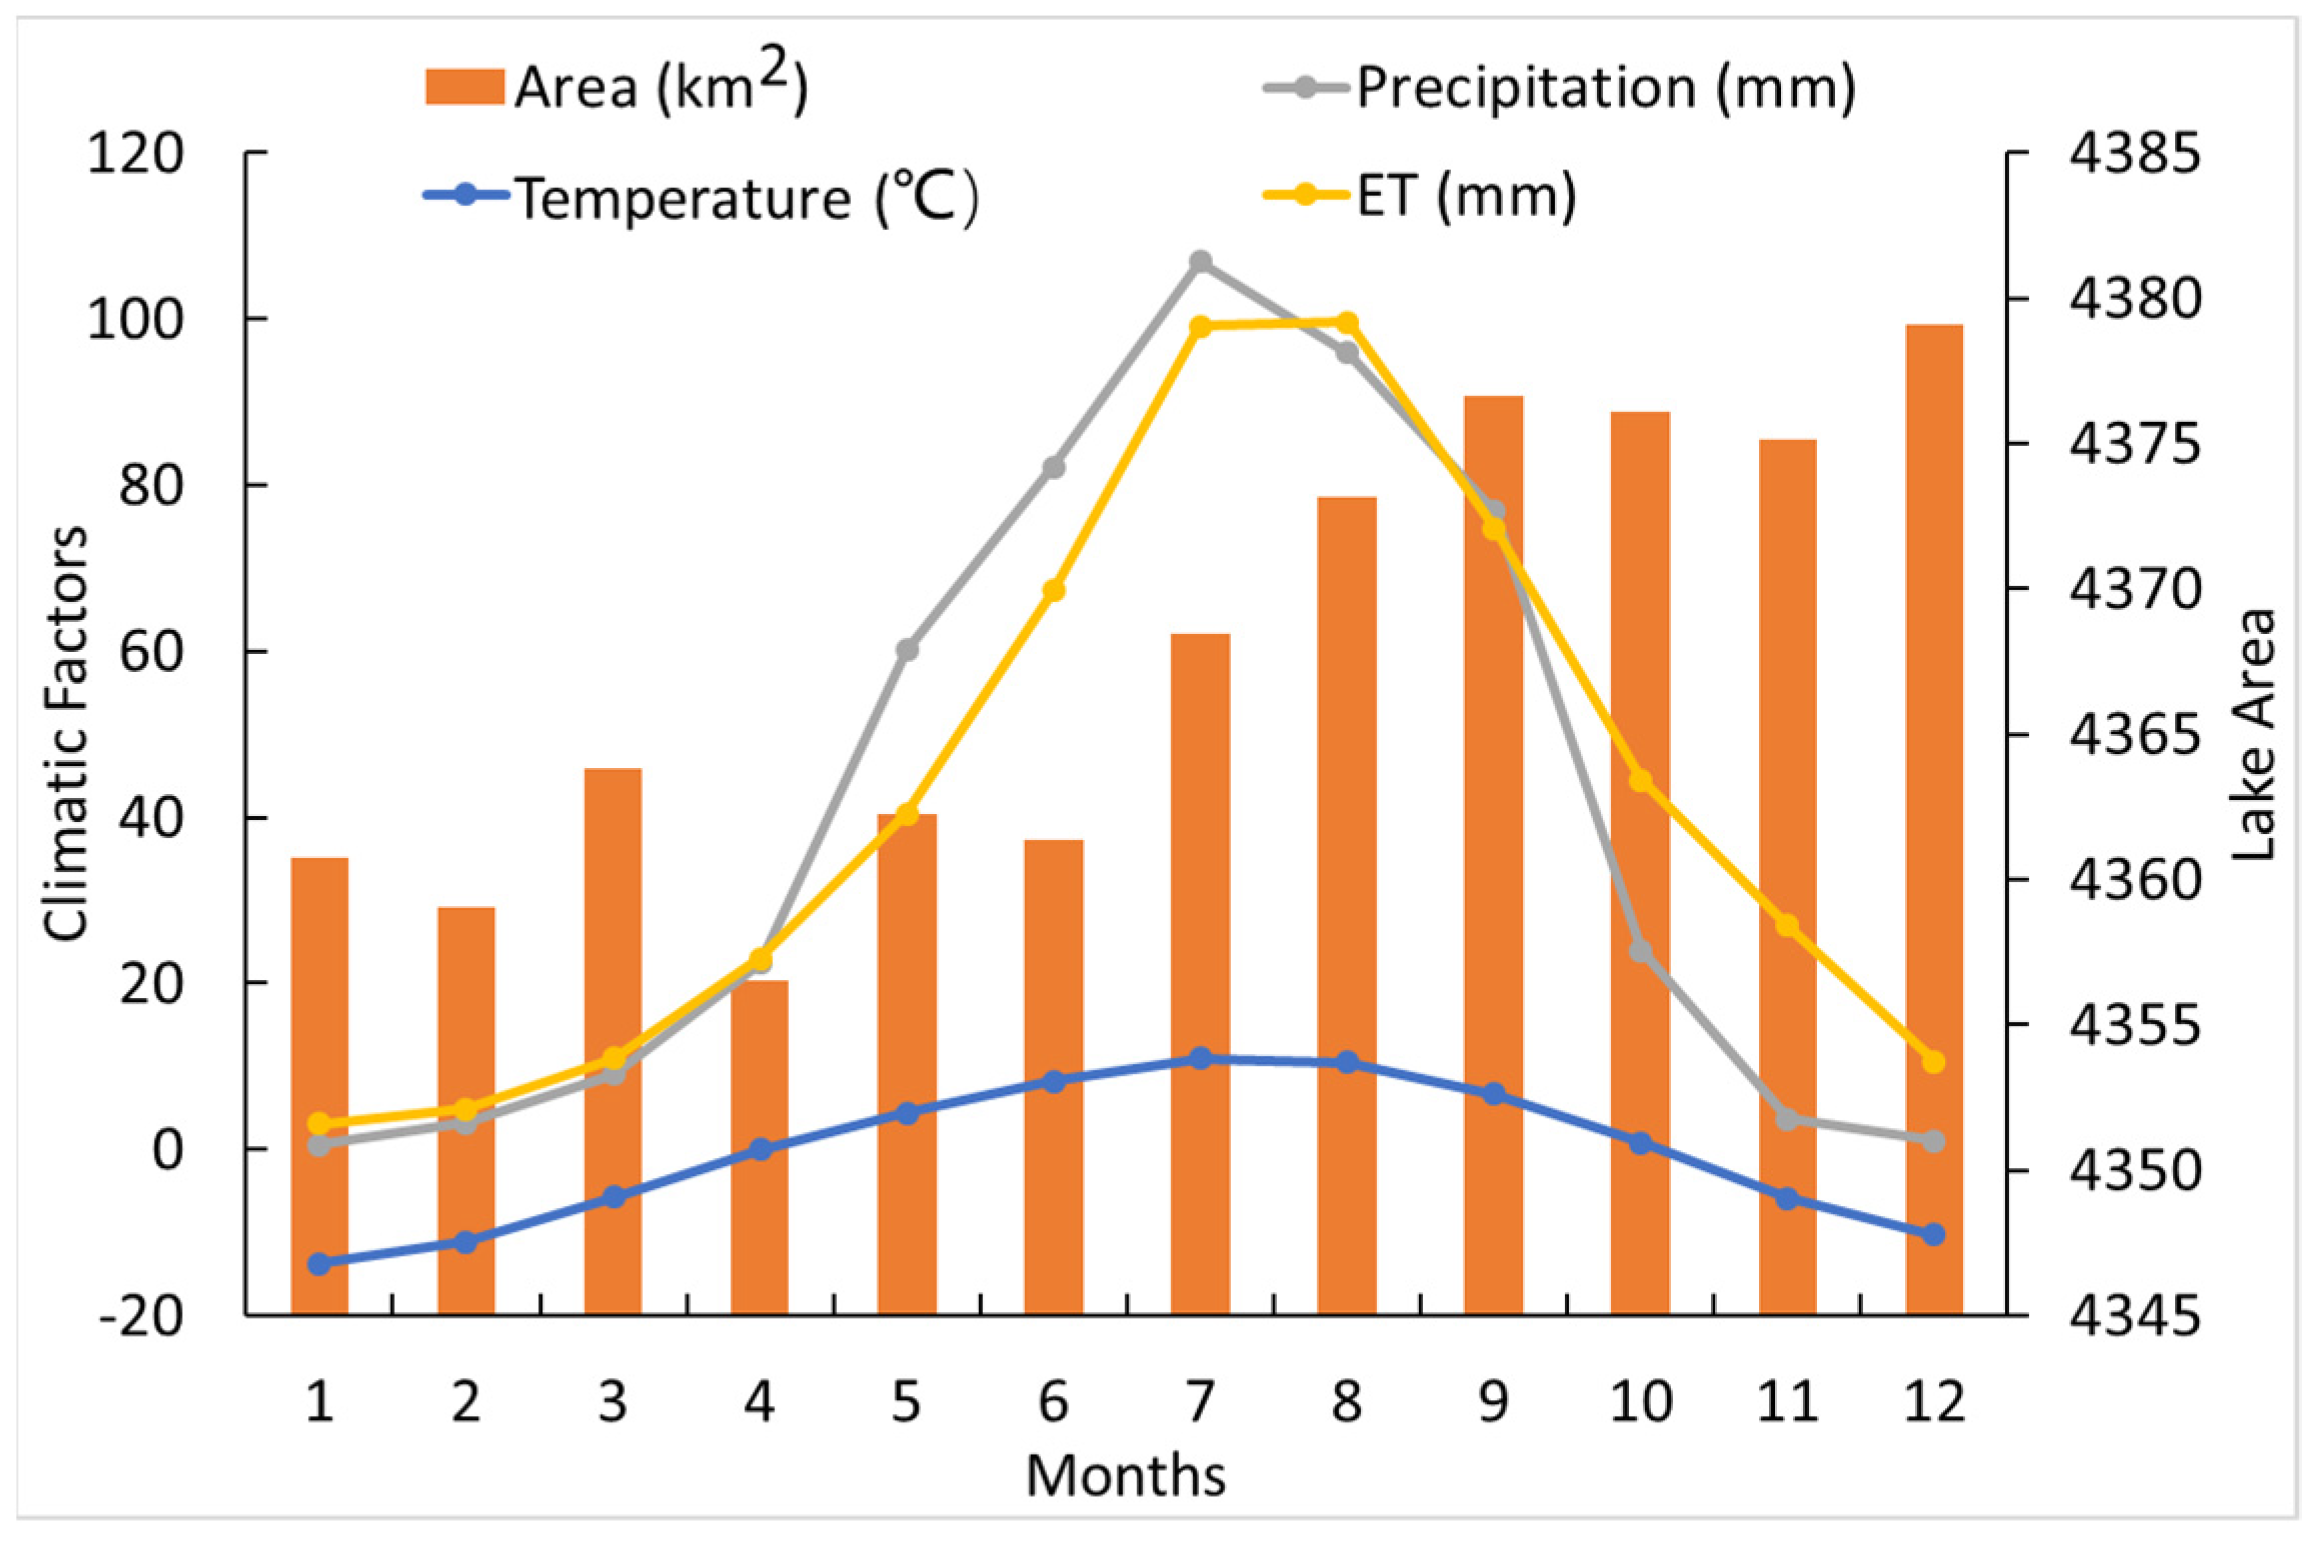
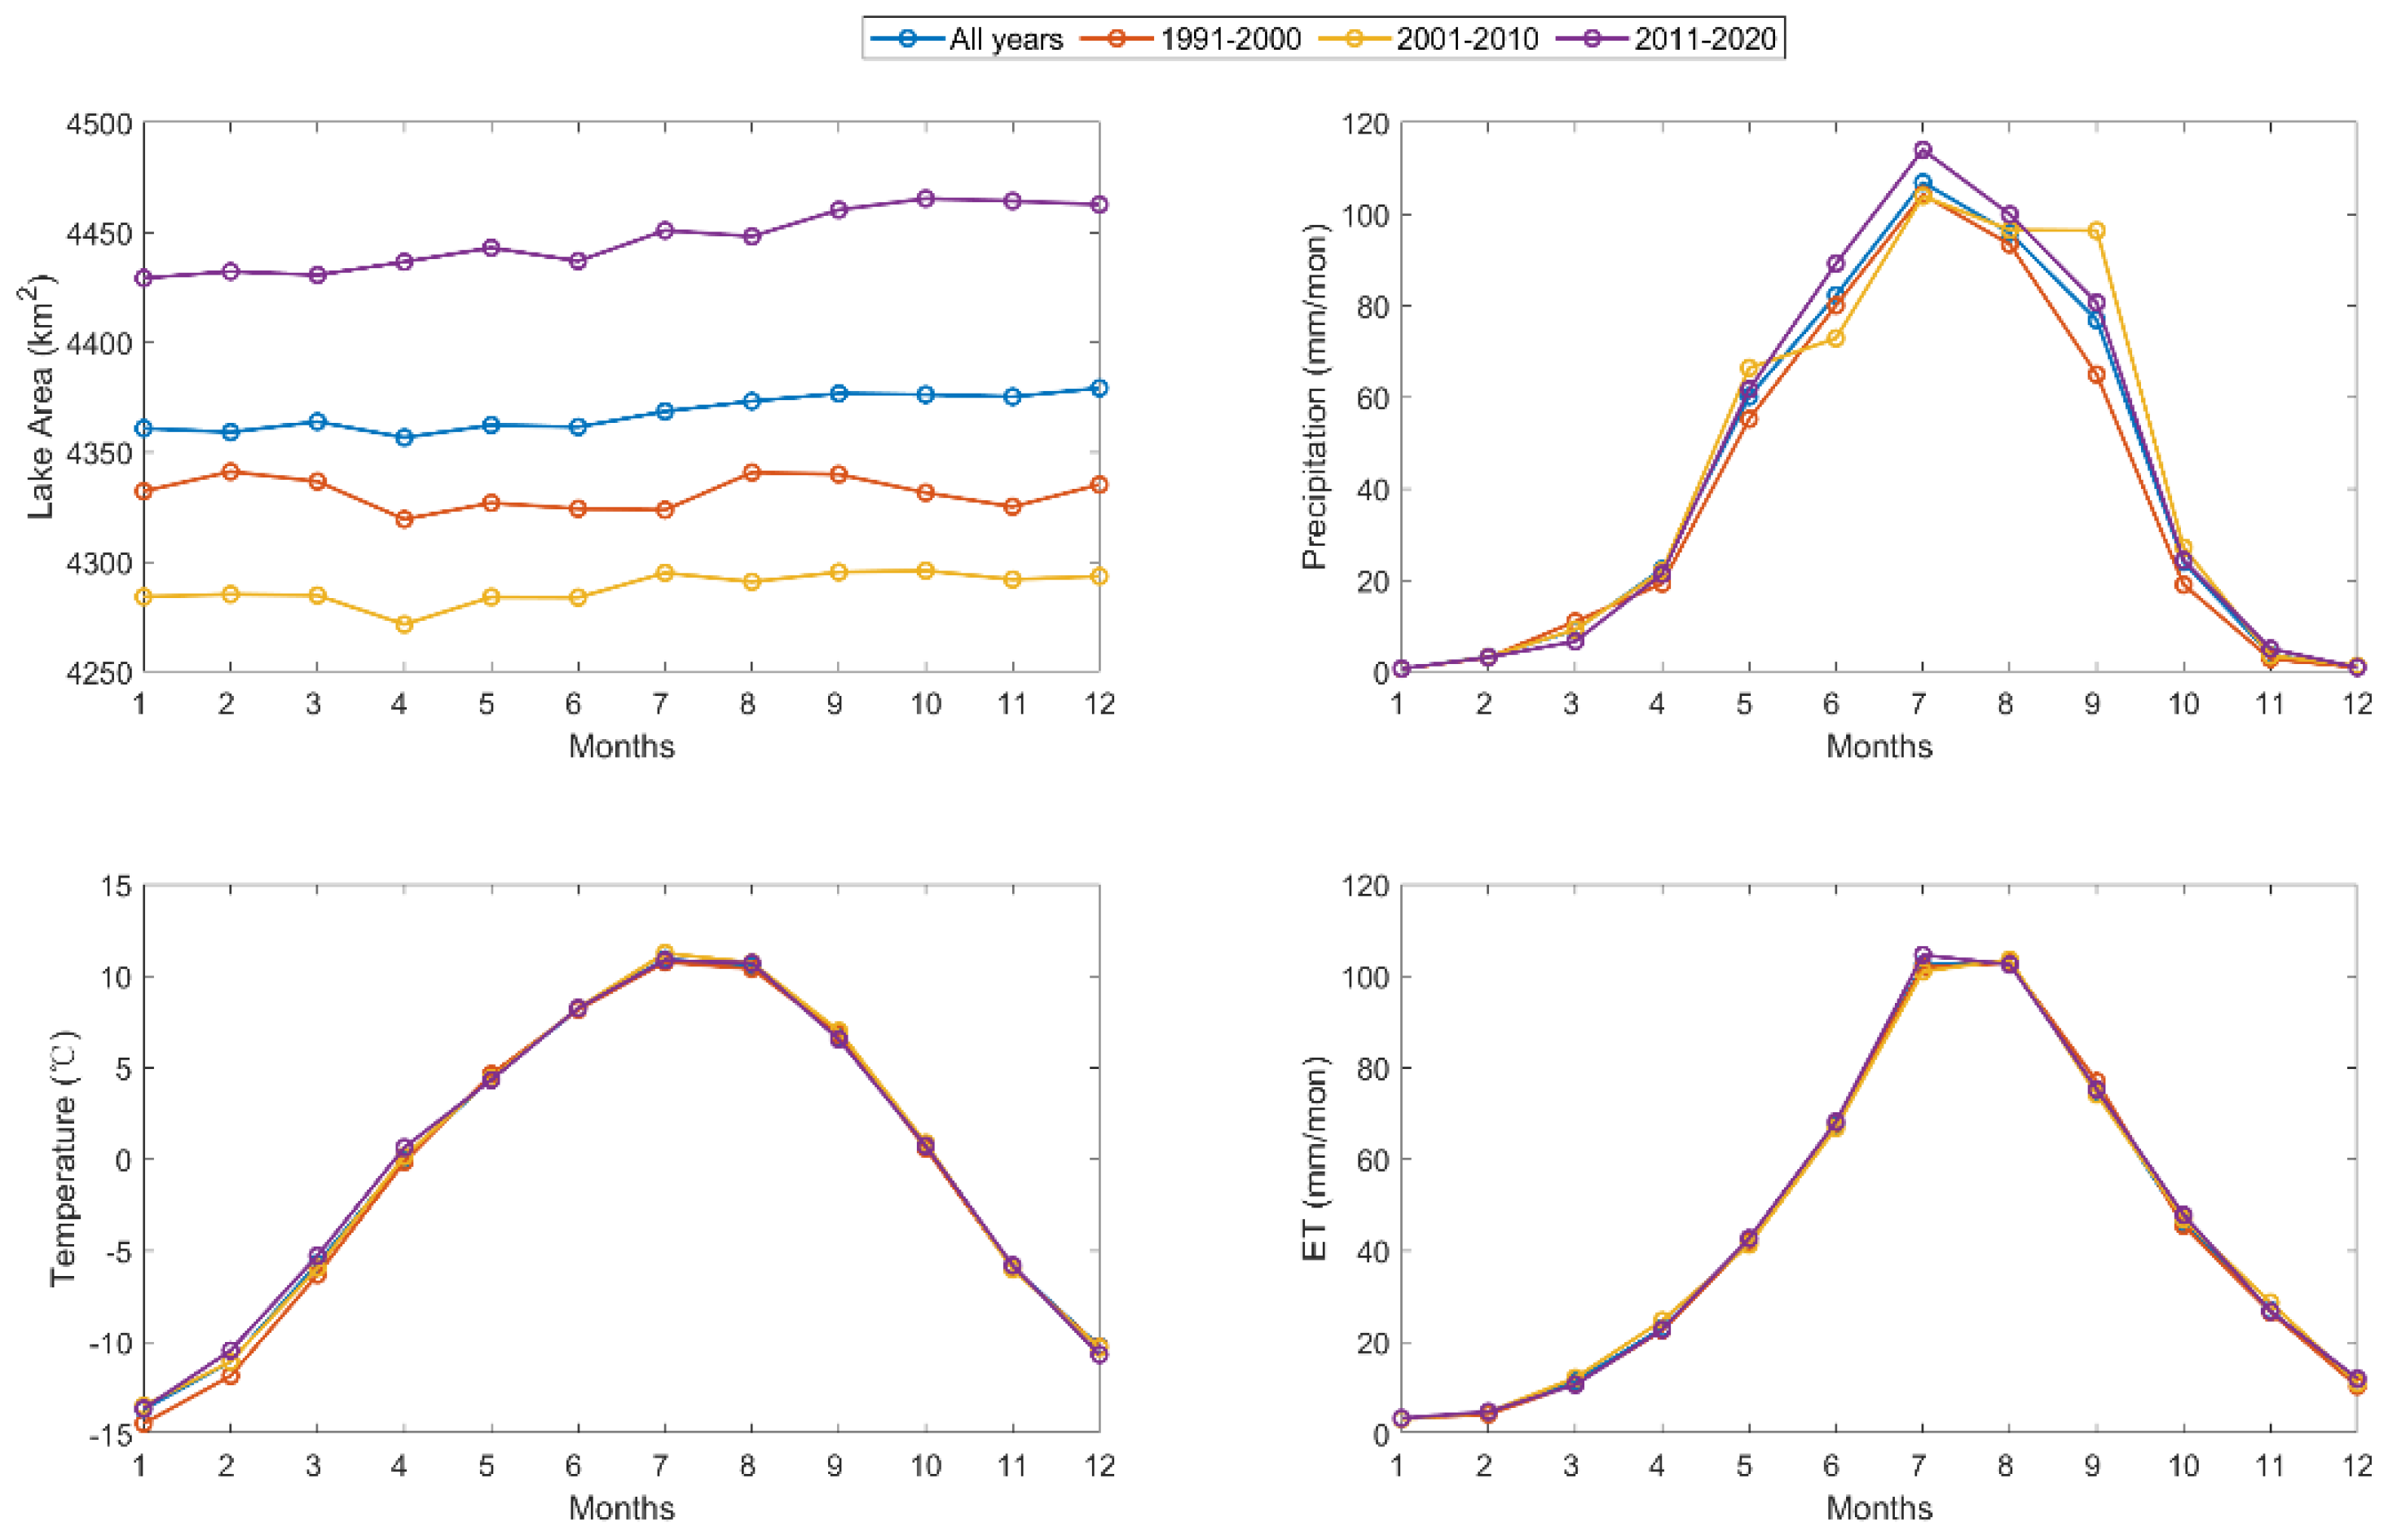
3.2. Seasonal Variation in Lake Area and Meteorological Elements

Qinghai Lake, a representative inland saltwater lake, has exhibited significant changes in its area since 1986 (Figure 3a). In 1986, the lake covered an area of 4346.89 km2, reaching its minimum extent in 2004, with an annual shrinkage rate of −6.21 km2 (Table 2). By 2022, the area of Qinghai Lake expanded to 222.32 km2 larger than that in 1986 and 309.40 km2 larger than the 2004 minimum, with a yearly increase rate of 4.98 km2 and 19.01 km2, respectively (Table 2).
The Qinghai Lake area demonstrated an overall trend of expansion since 1986, with the most rapid growth observed in autumn, followed by summer, and the slowest expansion occurring in spring and winter. Between 1986 and 2004, the lake underwent a decreasing phase, with the most significant reduction observed in autumn, followed by spring and winter, and the least reduction in summer.
Following 2004, Qinghai Lake entered a sustained period of growth, aligning with findings from earlier studies. The growth rate remained highest in autumn, followed by spring and winter, while summer exhibited the lowest growth rate.
From 1986 to 2022, the average annual precipitation exhibited a gradual upward trend, with the most abundant precipitation occurring in summer, followed by spring and autumn, and the least in winter (Figure 3b). However, the notable increasing in precipitation was primarily observed during autumn, followed by summer. Spring and winter did not show significant increasing trends (Table 2).
Temperature and ET displayed relatively consistent trends, ranked from highest to lowest as follows: summer > autumn > spring > winter. Across all seasons, the highest values were observed in summer, followed by spring, and the lowest in autumn and winter (Figure 3c,d). Notably, there was a slight declining trend observed in winter temperatures during both the periods of 1986–2004 and 2004–2022.
Figure 4 shows the difference integral of (a) lake area, (b) precipitation, (c) temperature, and (d) ET from 1986 to 2022. From 1986, the accumulated change in lake area gradually deviated from the average, showing a consistent decrease, indicating a continual reduction in the lake’s size during this period. However, around 2011, data displayed a shift in the trend, revealing an upward trajectory in the accumulated change in lake area. This suggests a potential expansion or recovery of Qinghai Lake’s area. Such fluctuations could be influenced by various factors, including climate variations, hydrological characteristics, human activities, and other environmental factors in the region.
From the perspective of precipitation, there has not been much change in winter rainfall. However, in the summer and autumn seasons, after a decrease in 1986, there was an increase in 1987, followed by a continuous decline starting from 1989. By 1999, the precipitation reached its maximum deviation, then started to increase again. This pattern of precipitation change resembles the variation in lake area and seems to exhibit a similar trend, albeit with a lead time of approximately five and two years in autumn and summer, respectively. While the trends are similar, the changes in precipitation appear to precede those in the lake area by around 2–5 years. This might imply a lag in the response of the lake area to precipitation changes or could be indicative of other complex environmental factors influencing these trends.
The trend of temperature changes aligns with that of precipitation, except for winter temperatures. Since 1986, the spring, summer, and autumn temperatures have all exhibited a fluctuating pattern of initial decline followed by subsequent rise, reaching their lowest points at different times: 2001 for spring, 2004–2005 for both summer and autumn. Winter temperatures differ from other seasons. Starting from 1986, winter temperatures increased relative to the average and remained fluctuating at around 2 °C higher until 1994. However, after 1994, the difference in winter temperatures began to steadily decrease, reaching its minimum in 2001 before fluctuating upward.
The difference in ET between autumn and summer shows an opposite trend, which also applies to spring and winter. The complete opposite trend between summer and autumn ET disappeared in 2000. Subsequently, autumn ET exhibited positive difference values, while summer ET showed negative differences. The maximum and minimum differences occurred in 2014/2021 (autumn) and 2014 (summer), respectively.

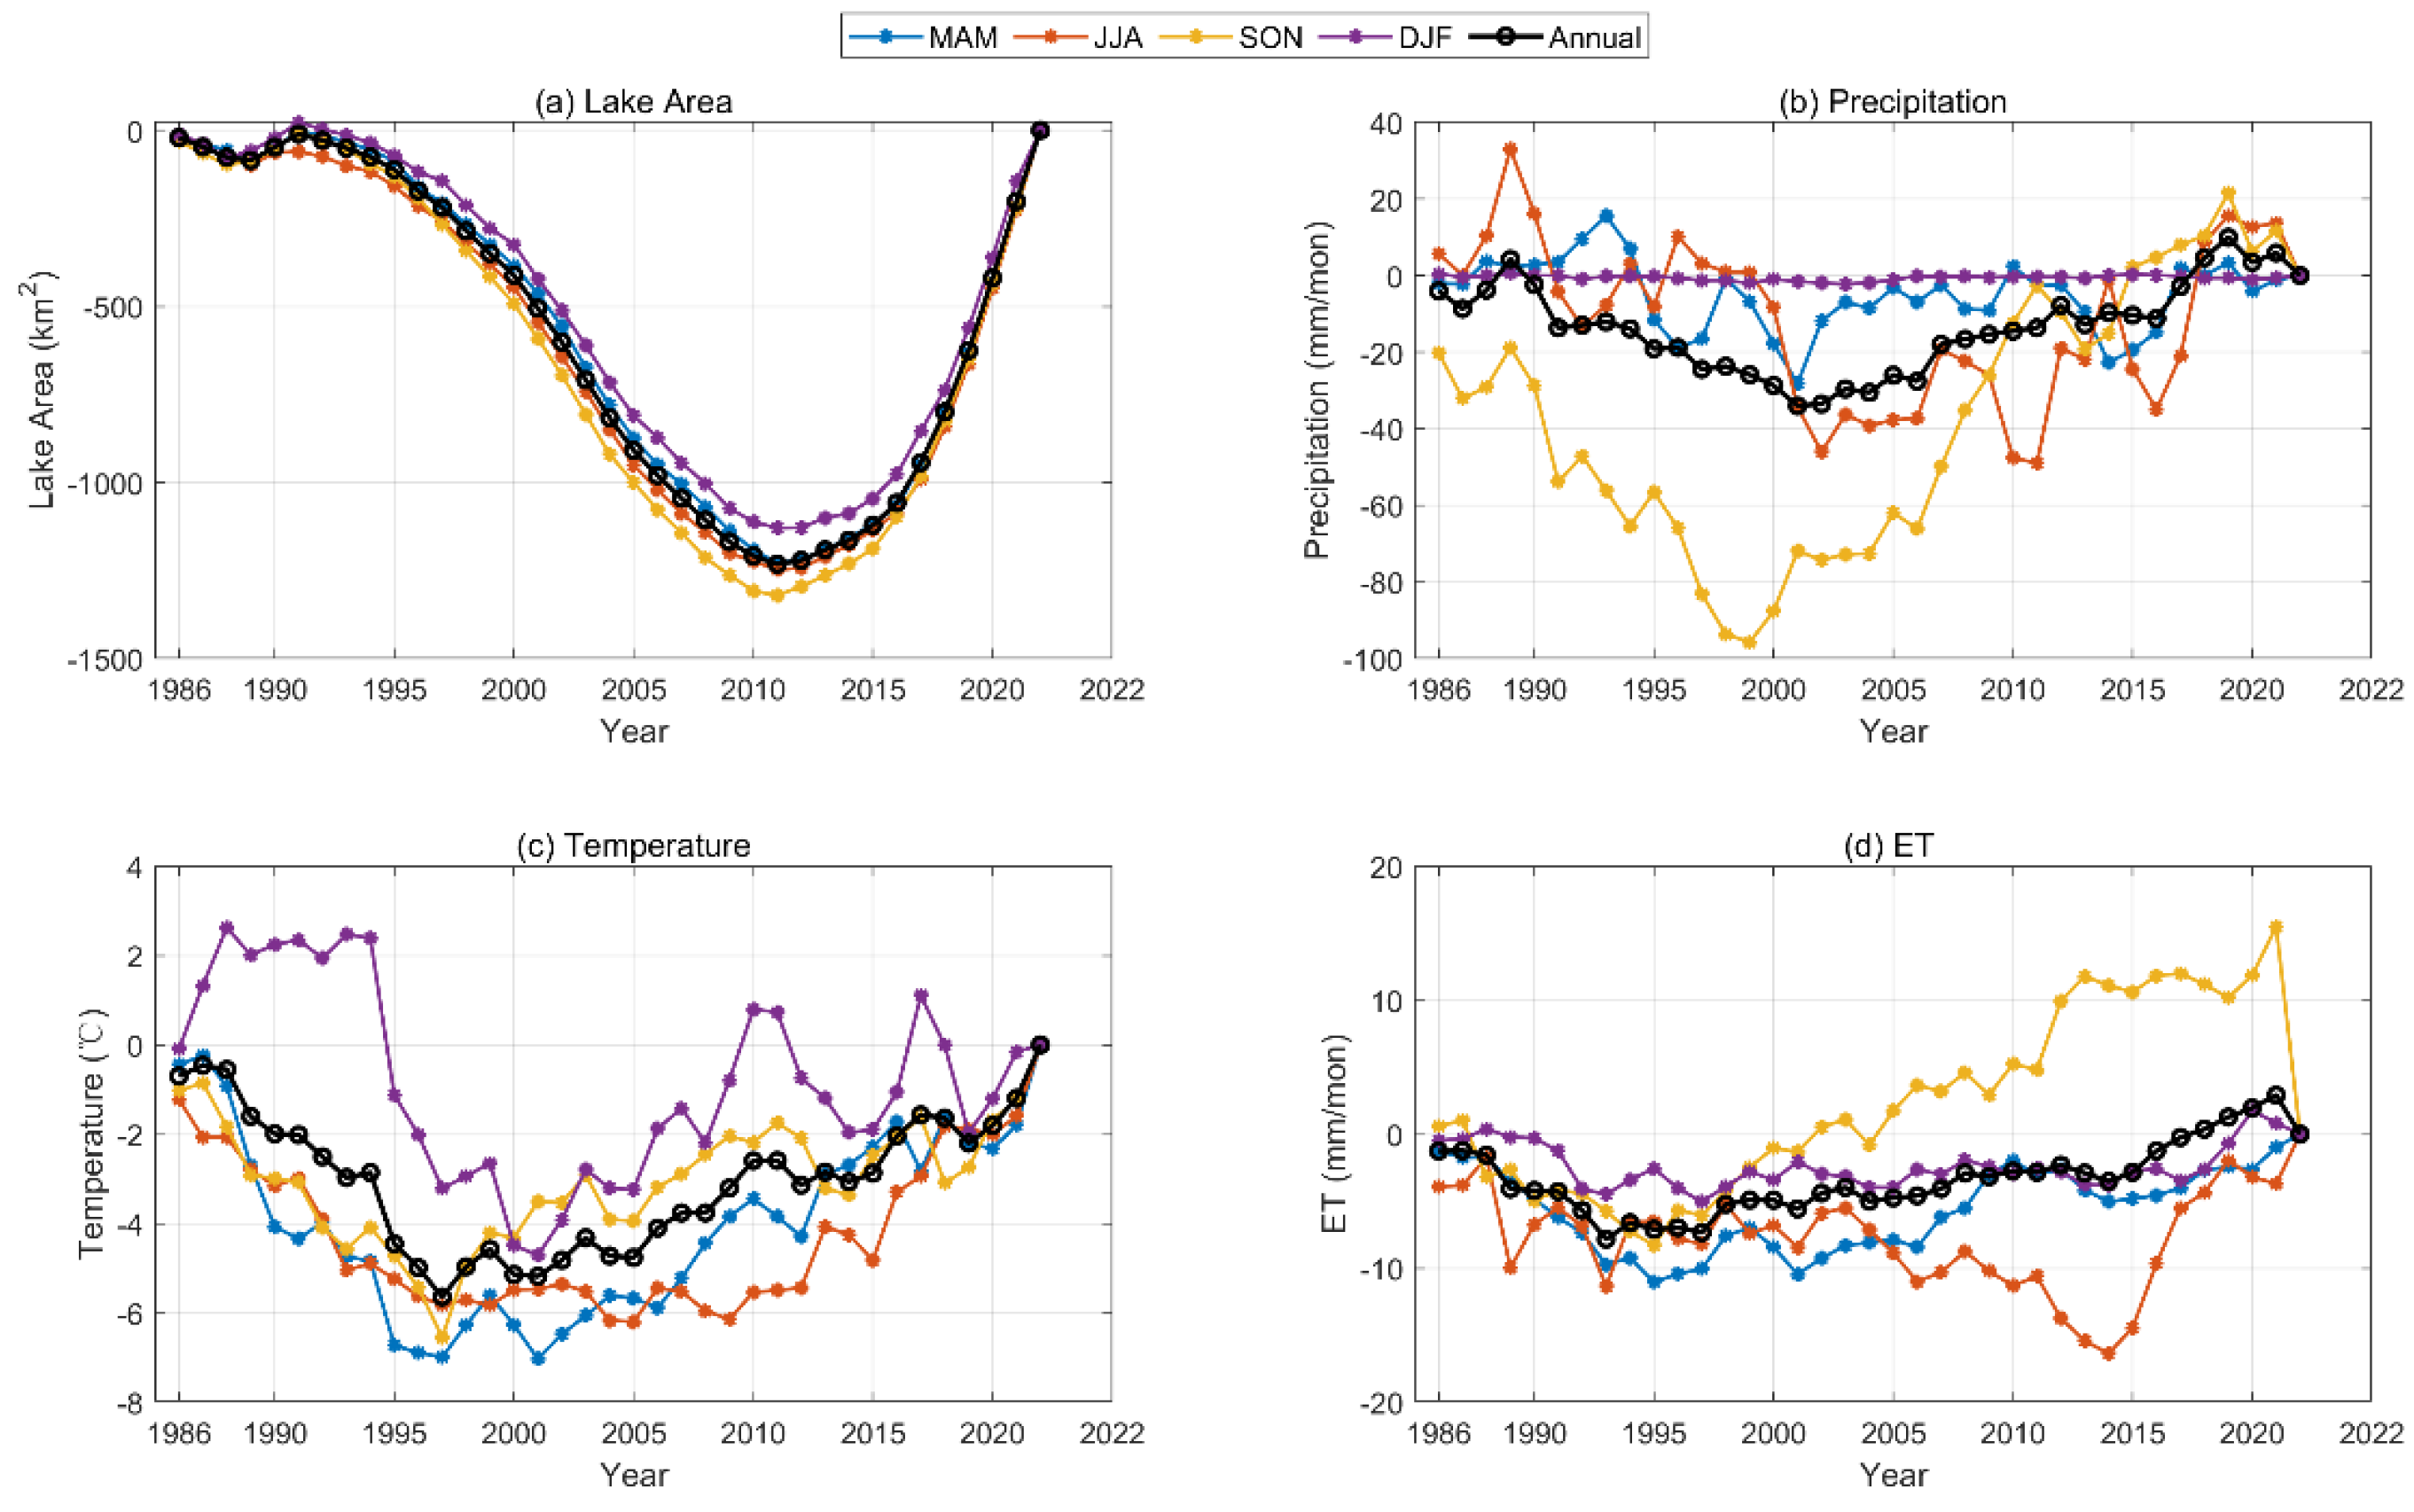
3.3. Anomalies in Lake Area and Meteorological Elements

In the field of earth system science, a period of 30 years is often considered a climate mean state. For this paper covering the years 1986 to 2022, the time frame of 1991–2020 was chosen as the climate mean state for calculating anomalies. Figure 5 illustrates the evolution of anomalies in lake area, precipitation, temperature, LWST, ET, and runoff over time.
The anomaly in lake area transitioned from positive to negative in 1987, briefly becoming positive between 1989 and 1991. Subsequently, it gradually shifted back to negative, reaching its lowest value in 2004. From 2012 onwards, it started transitioning from negative to positive and steadily increased.
The evolution of anomalies in precipitation and runoff mirrored the trends observed in the lake area, being negative from around 1989 to 2012, then becoming positive. Surface temperature and ET shared consistent characteristics, but discrepancies appeared in 1994, 2003, and 2014. This could be attributed to ET encompassing not only surface evaporation, but also vegetation transpiration.
The variability in LSWT exhibited lower fluctuations compared to surface air temperature, which could more accurately depict the influence of lake evaporation to some extent.

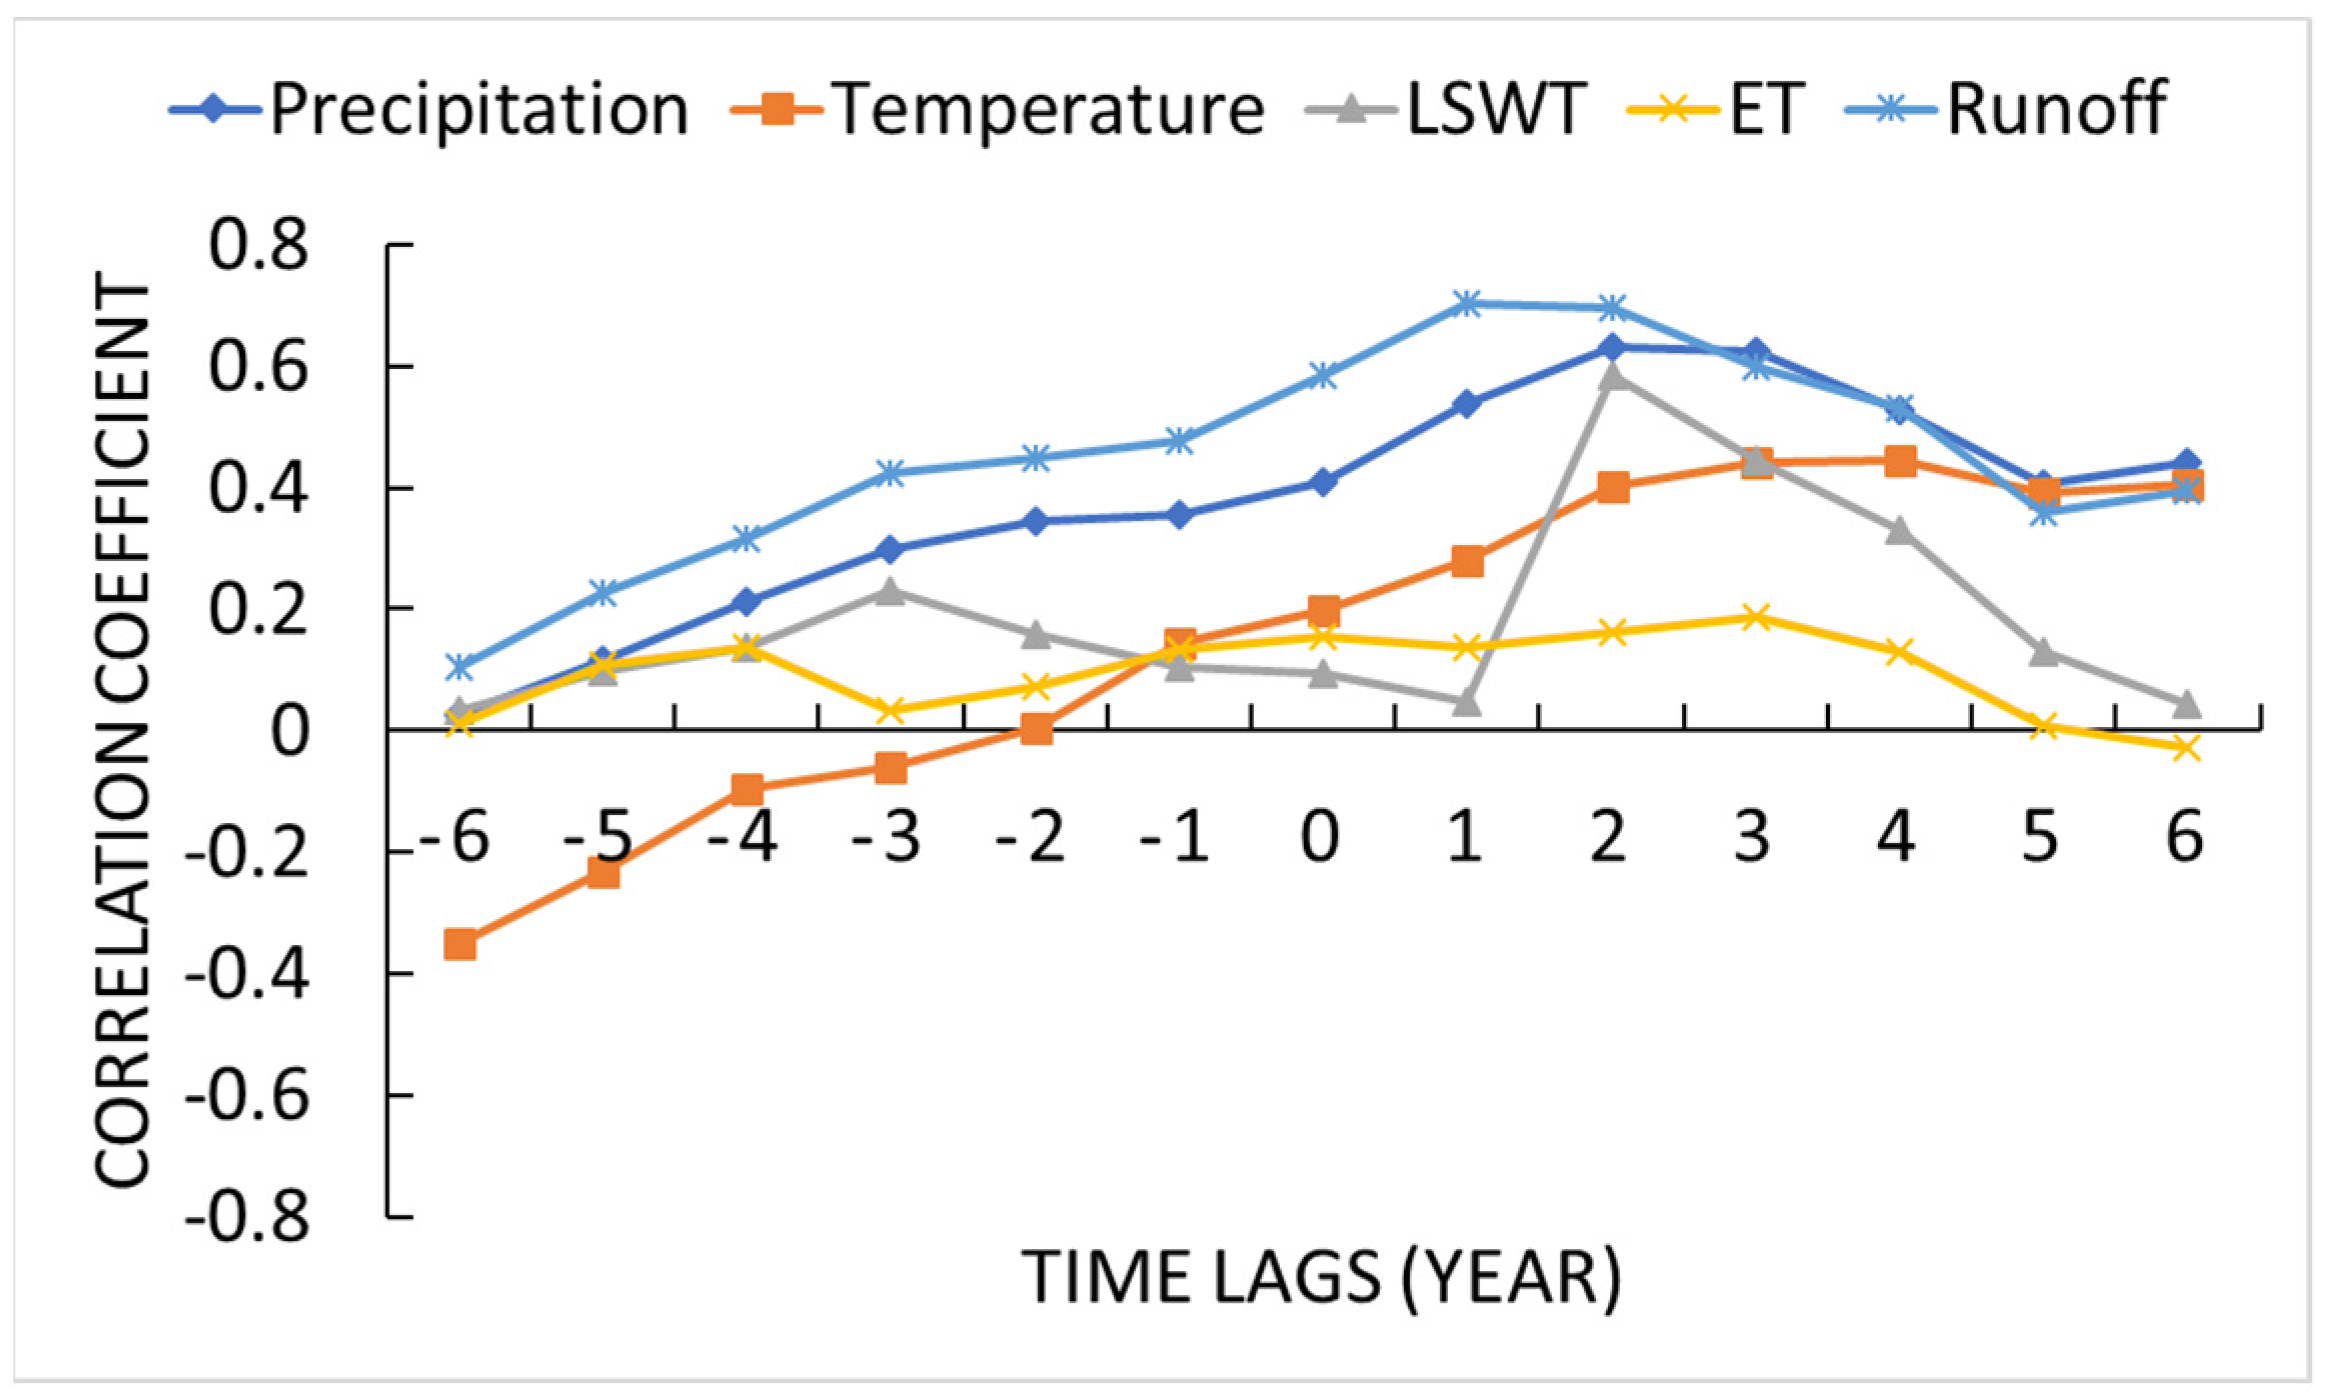
3.4. Relationship between Lake Area and Meteorological Elements

Table 3 represents the correlation coefficients between the Qinghai Lake area and various meteorological elements. The correlation coefficient between the lake area and precipitation is 0.41, while it is 0.58 between the lake area and runoff. Both correlations have passed significance tests at 95% and 99% confidence levels, respectively. This suggests a moderate positive relationship between the lake area and both precipitation and runoff. A correlation of 0.41 for precipitation indicates a positive but relatively weaker connection compared to the correlation of 0.58 with runoff. The higher correlation with runoff might suggest a more direct influence of runoff, indicating that changes in the lake area are more significantly influenced by the runoff rather than just precipitation.
There exists a moderate positive correlation between precipitation and temperature (0.41) and runoff (0.59), while displaying a stronger negative correlation with ice depth (−0.55) and freezing period (−0.68). This suggests that changes in precipitation may have some level of association with temperature and runoff, but exhibit a stronger inverse relationship with ice depth and freezing period.
There is a moderate positive correlation between temperature and lake surface temperature (0.39), indicating a degree of synchronization in their variations. The higher correlation with ET suggests that temperature fluctuations may significantly impact the water vapor transfer from the lake surface to the atmosphere. Moreover, the notable negative correlations with ice depth and freezing period (−0.58 and −0.74, respectively) suggest that as temperature rises, there is a tendency for reductions in ice depth and the duration of freezing. This relationship implies that higher temperatures may contribute to decreased ice depth and shorter periods of freezing, which could impact the lake’s hydrological characteristics.
These correlation coefficients indicate negative relationships between runoff and both ice depth and freezing period. An increase in runoff might be associated with a reduction in ice depth and a shorter freezing period. Furthermore, the negative correlation between ice depth and freezing period implies that a decrease in ice depth might accompany a shorter freezing duration.
Figure 6 exhibits the lag correlation coefficient between the Qinghai Lake area and its associated meteorological elements. A negative sign implies the lake area leads the meteorological elements, while a positive sign indicates the opposite, with the value denoting the duration in years. Generally, meteorological factors leading the lake area showed higher correlation coefficients than vice versa, indicating that the lake area is primarily influenced by meteorological conditions.
The correlation coefficients of runoff and precipitation consistently changed, displaying the largest correlations when precipitation and runoff led by 1–2 years, reaching maximum correlation coefficients of 0.63 and 0.70, respectively. These substantial values suggest that precipitation and runoff in a given year may have a more considerable impact on the lake area after 1 or 2 years.
The correlation between ET and lake area was not distinctly evident. In contrast, the correlation coefficient between temperature and lake area exhibited an initial negative trend, followed by a positive trend. This suggests that the lake area of the current year might influence the temperature after 6 years, and a larger lake area might correlate with lower temperatures. Moreover, the correlation coefficient of the temperature leading by 3–4 years reached 0.45, indicating that the temperature of a current year may influence the lake area after 3–4 years.

3.5. Intra-Year Variability of Lake Area and Meteorological Elements

Figure 7 illustrates the intra-year variability of the Qinghai Lake area and related meteorological elements during 1986–2022. In terms of the intra-annual distribution, the lake area was the smallest in April and the largest in September, considering the non-freezing period. Correspondingly, precipitation, temperature, and ET displayed a unimodal distribution, with maximum values occurring in July, July–August, and July–August, respectively.
During April, the lake area was the smallest, accompanied by lower precipitation, temperature, and ET. Despite the highest precipitation occurring in July, the lake area did not reach its maximum during this month due to the simultaneous high temperatures and high ET. The largest lake area of the year was observed in September, accompanied by relatively high precipitation and low temperatures and ET. This suggests that the area of Qinghai Lake is influenced by a combination of precipitation and ET, with September representing a period where these factors contribute to the lake’s maximum size.
Figure 8 delineates the intra-year variability in lake area and associated meteorological elements across different decades. The findings reveal that the lake area was at its smallest during 2001–2010, followed by 1991–2000, and peaked in 2011–2020. This trend mirrors the seasonal precipitation distribution. Across all decades, the lake area consistently hit its minimum in April and reached its maximum in September. The years marked by substantial fluctuations in precipitation coincided with significant changes in the lake area.
Precipitation, temperature, and ET exhibited a unimodal distribution, with their respective peaks in July, July–August, and July–August, across all decades. Despite the apparent correlation between the lake area and snowmelt, the average temperature in the Qinghai Lake area remained below 0 °C in April and prior to April, aligning with a smaller lake area. A similar trend persisted from November to December.

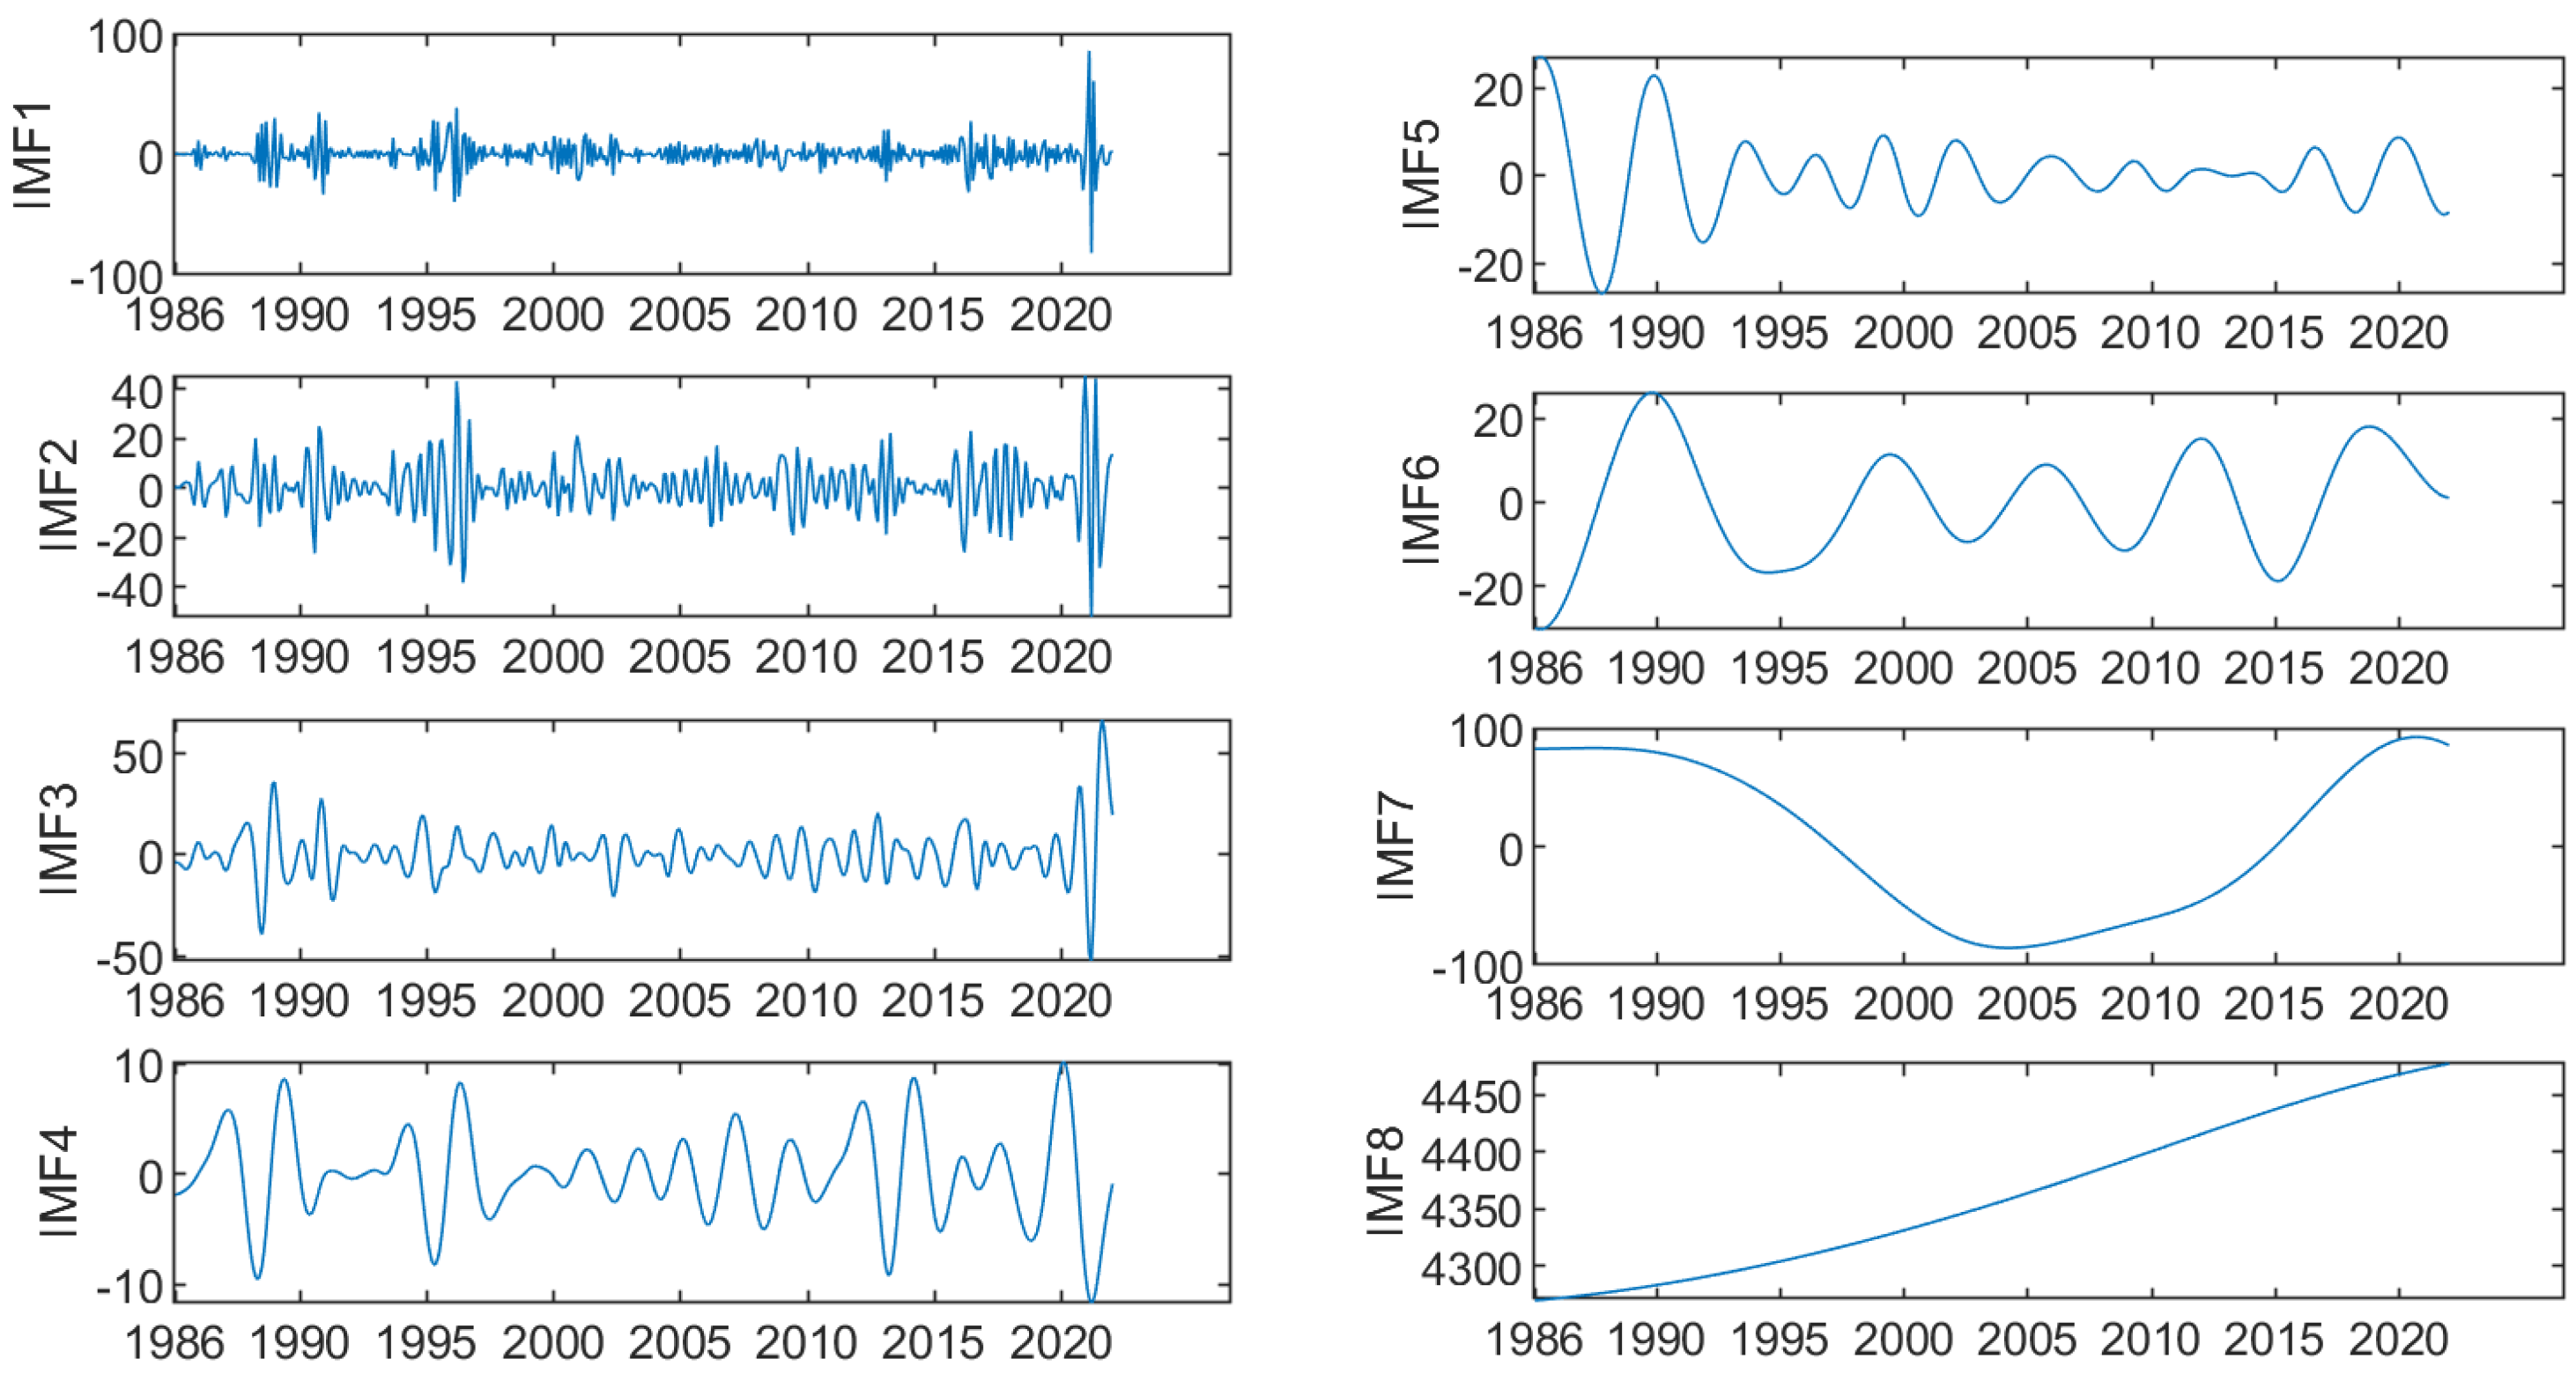
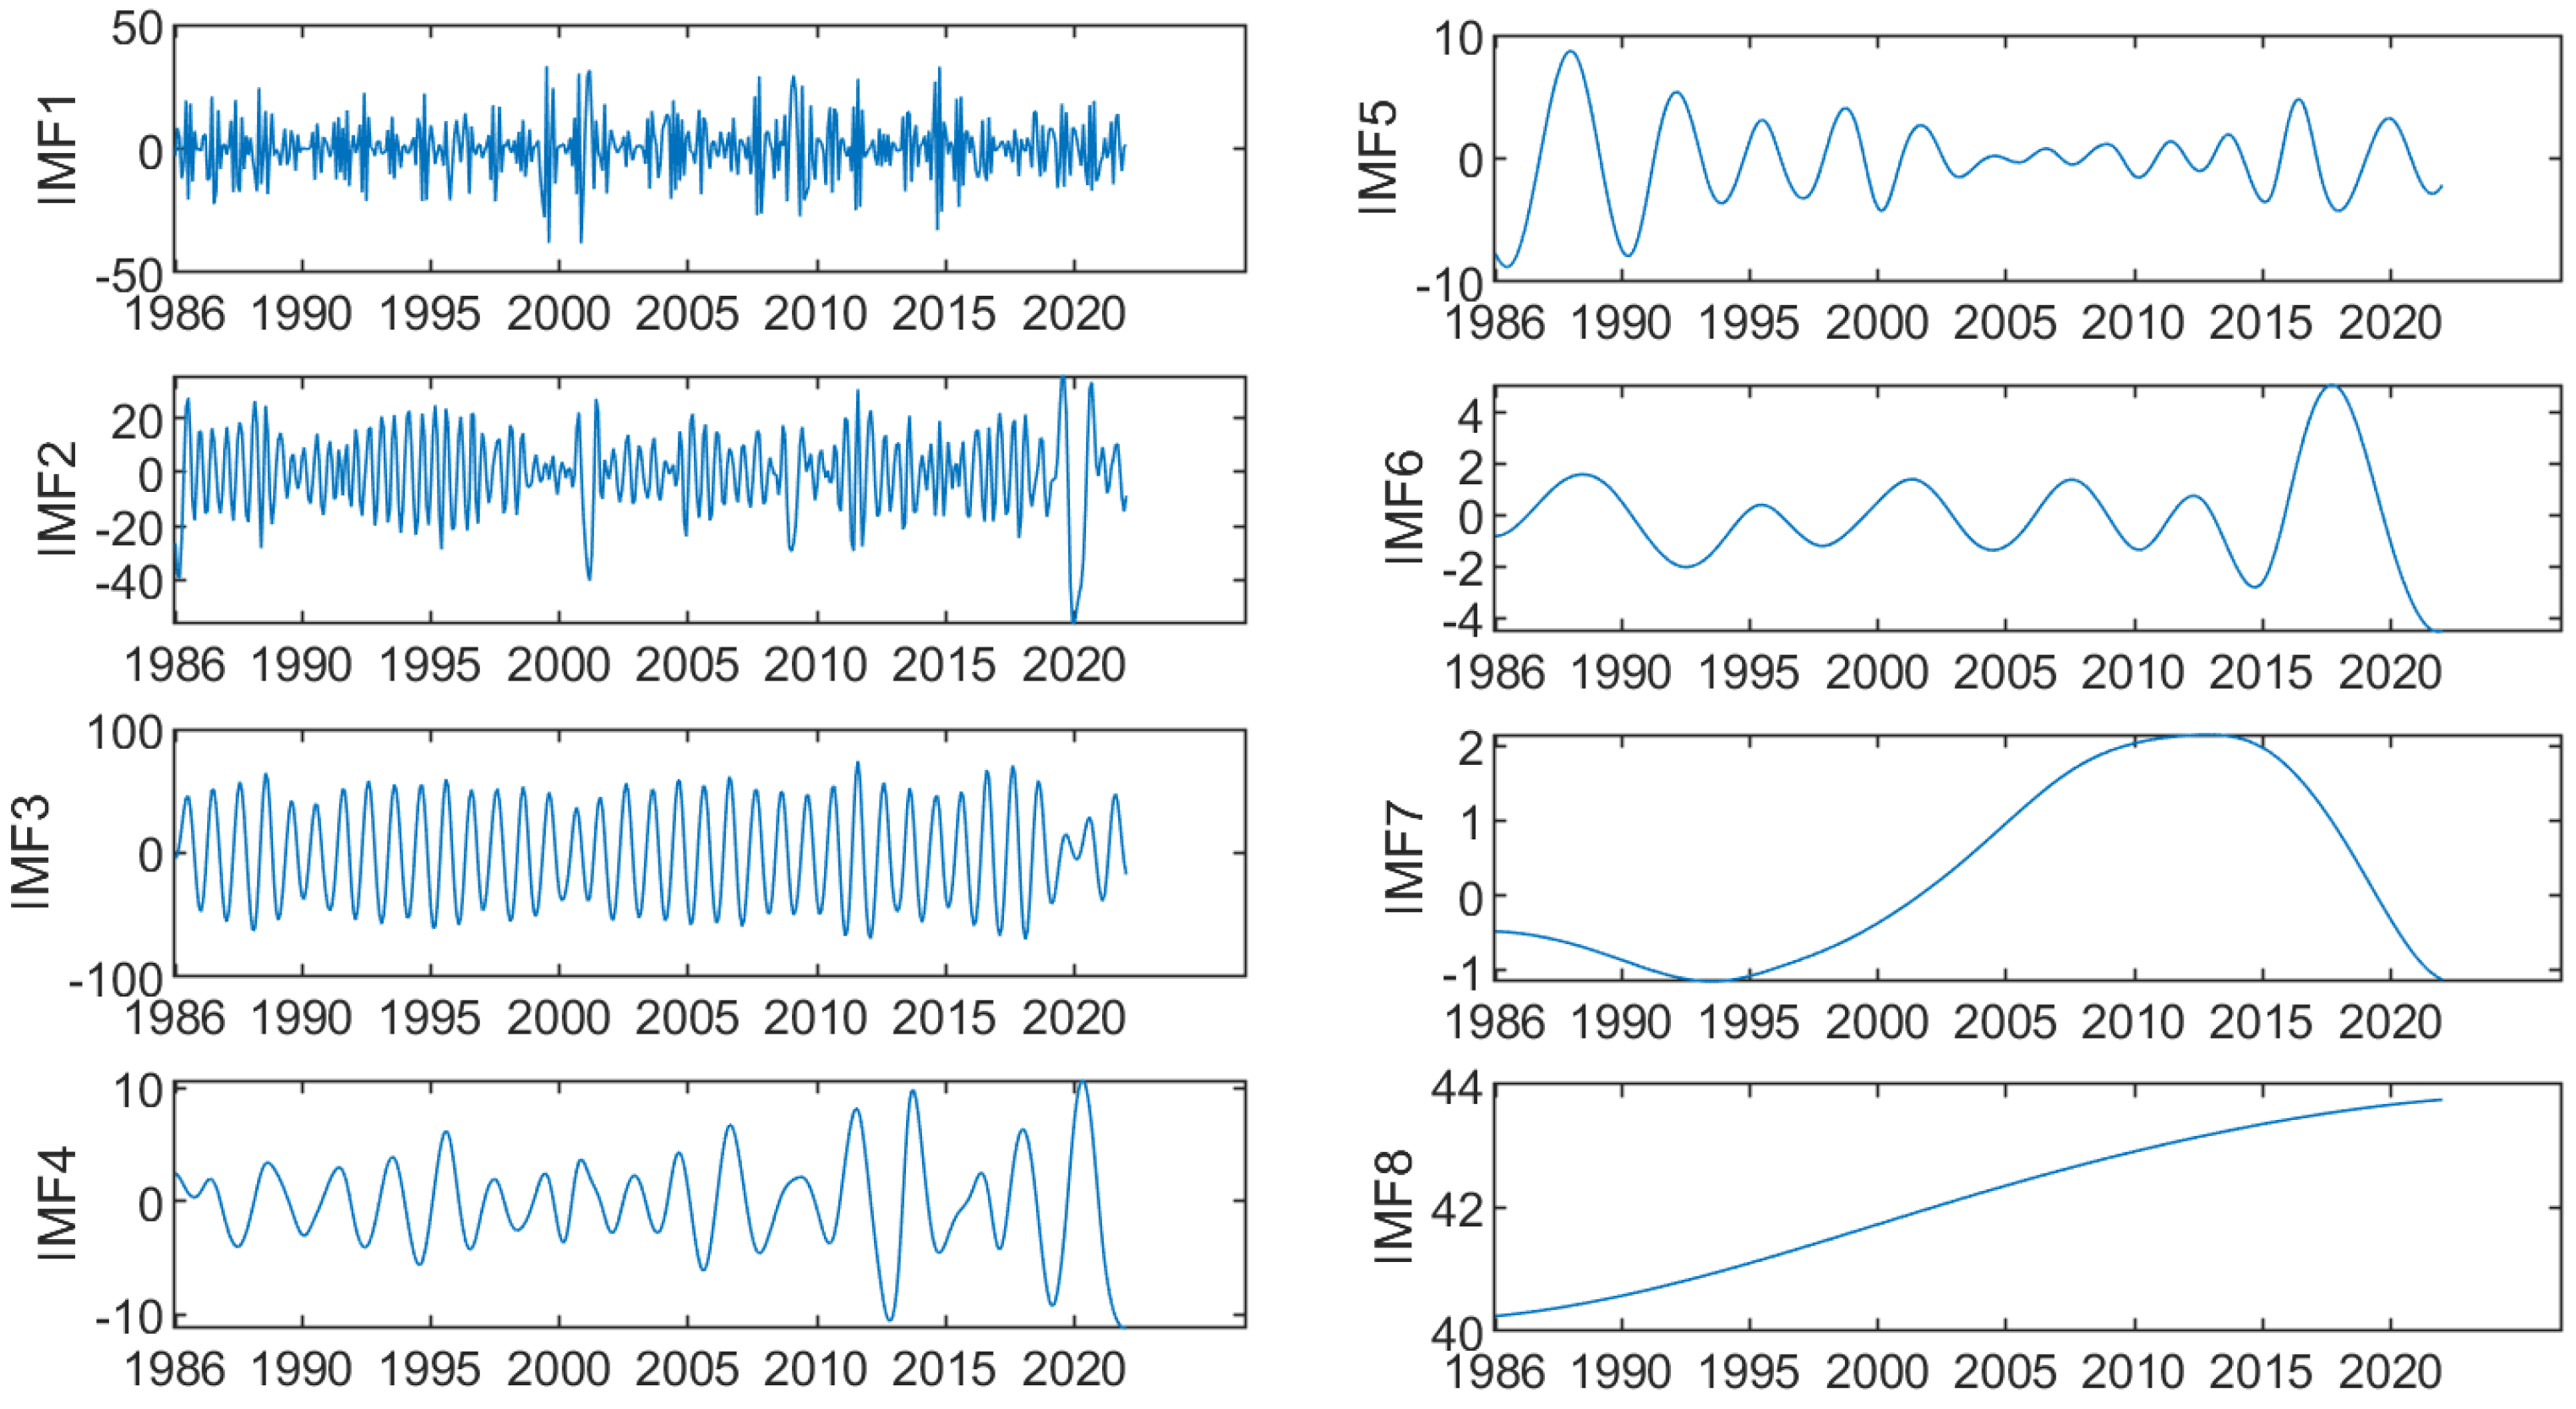
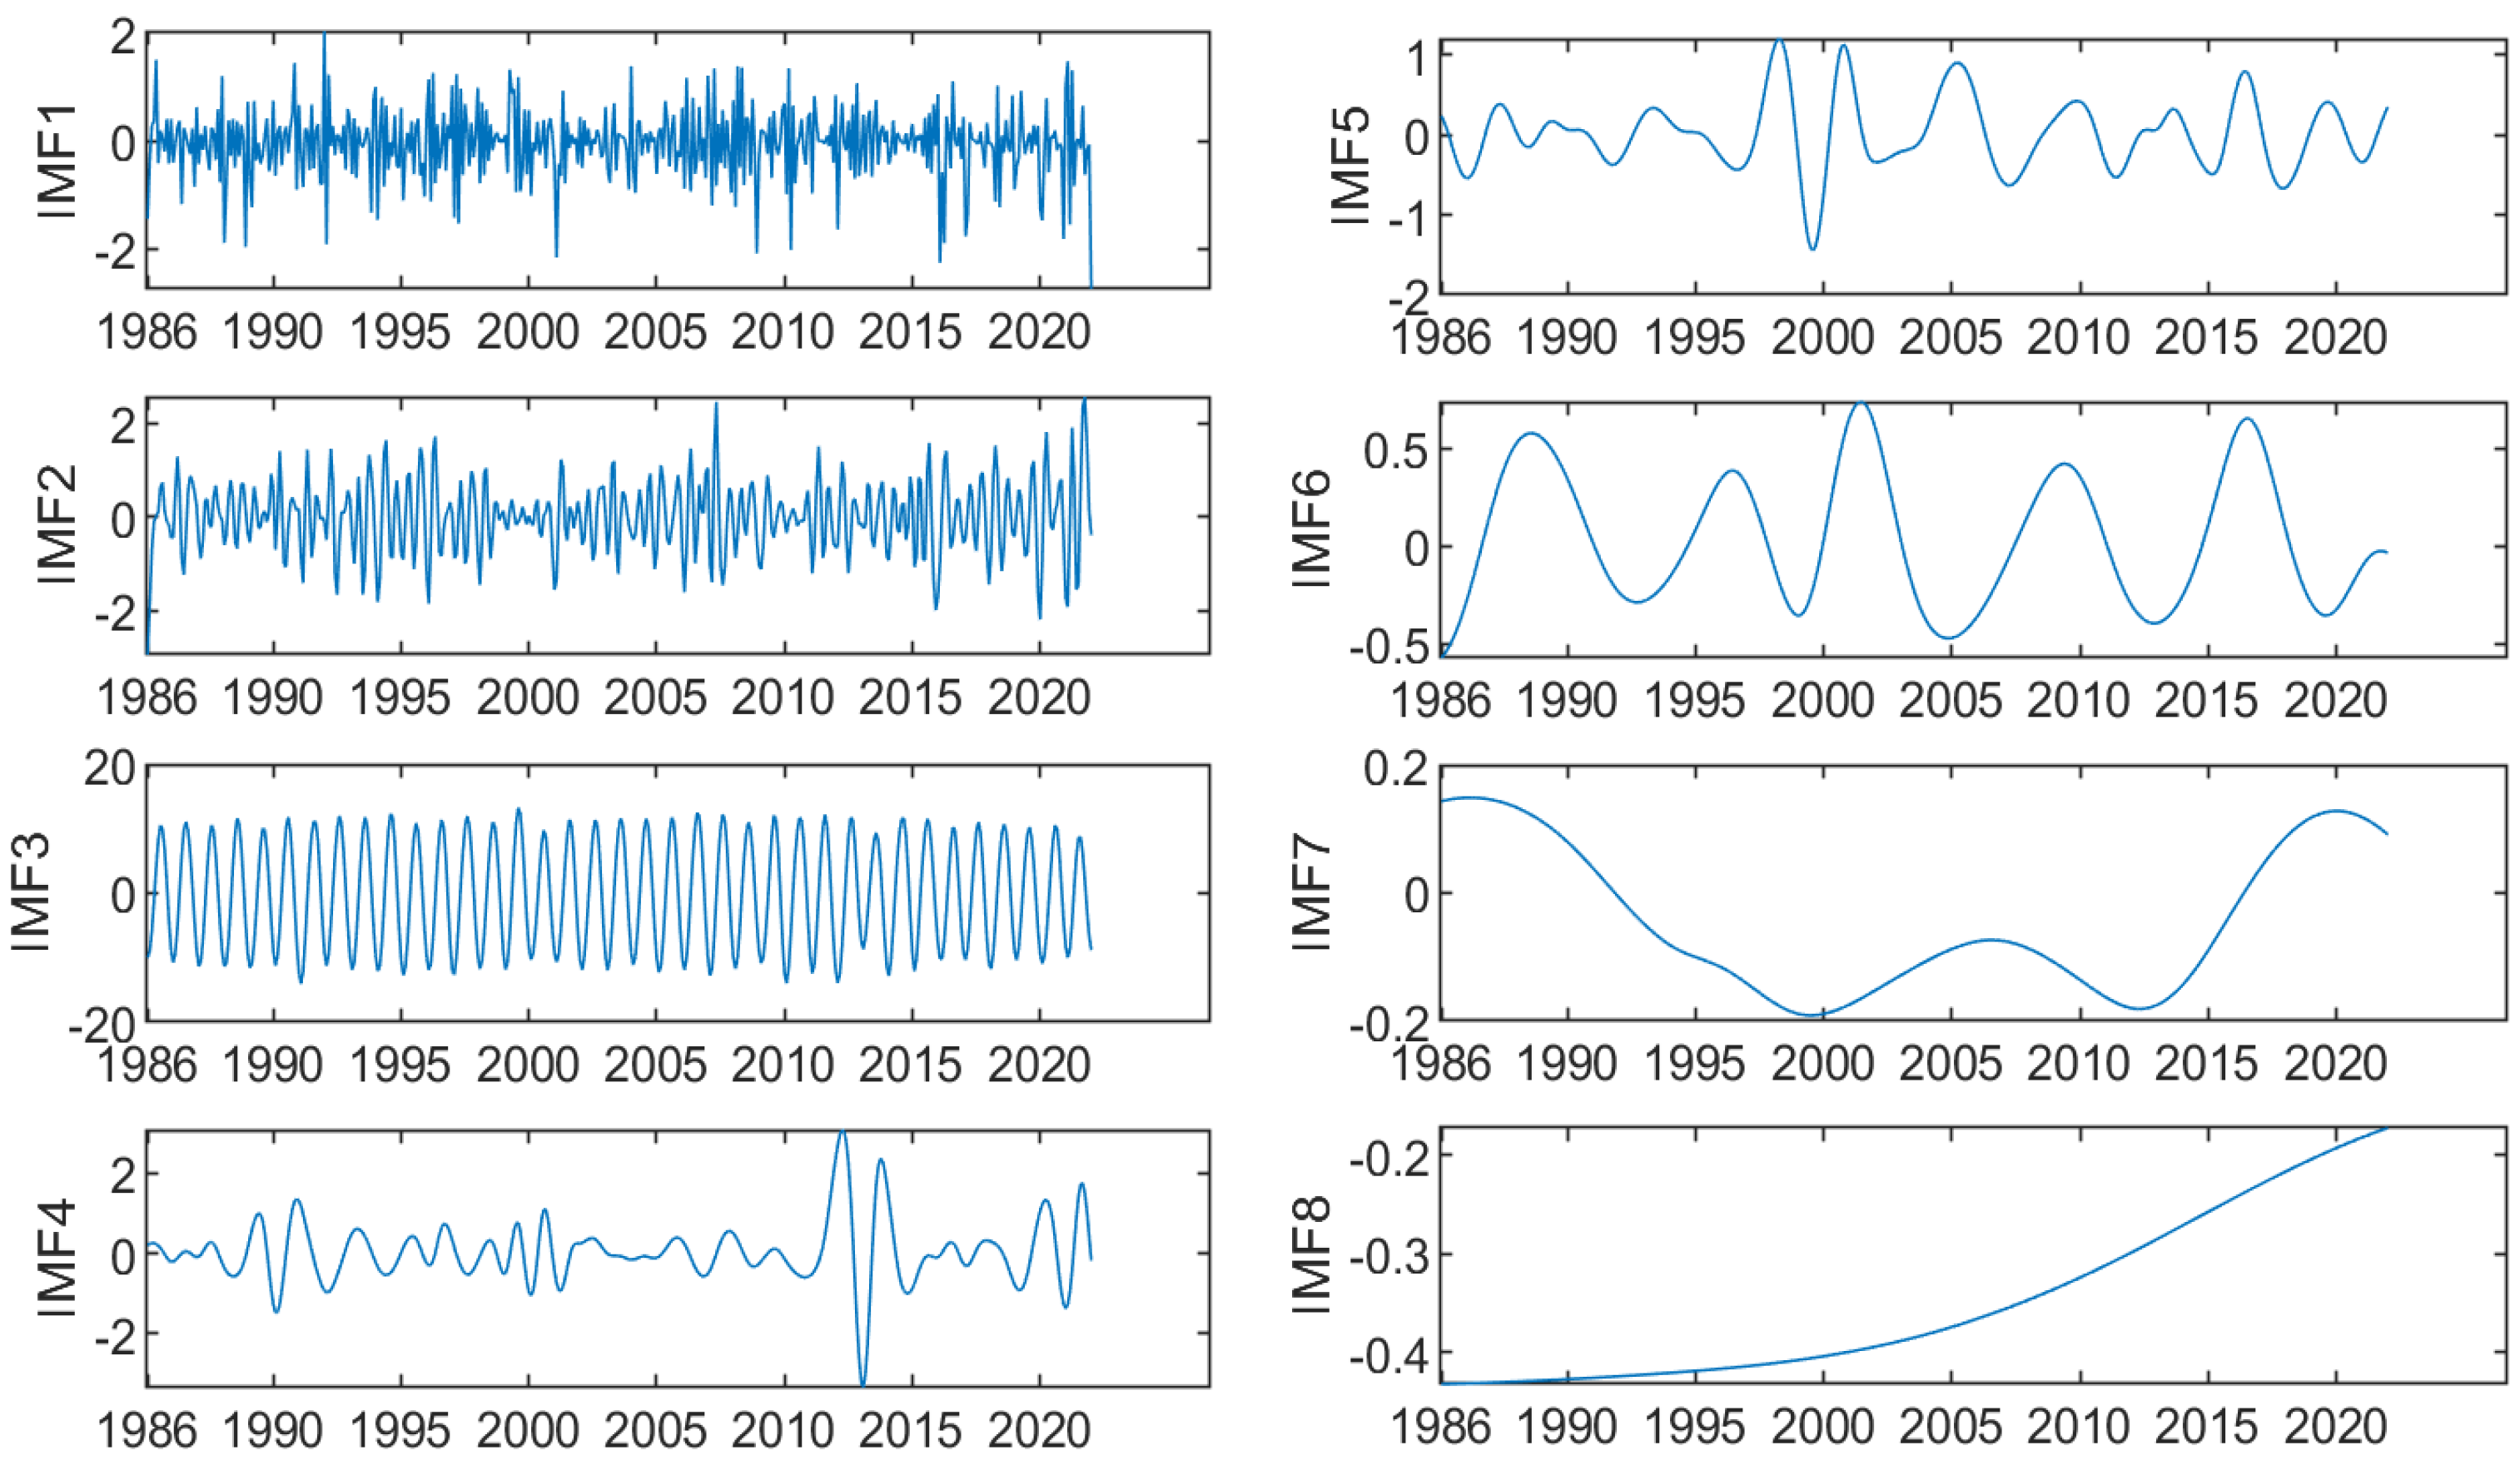
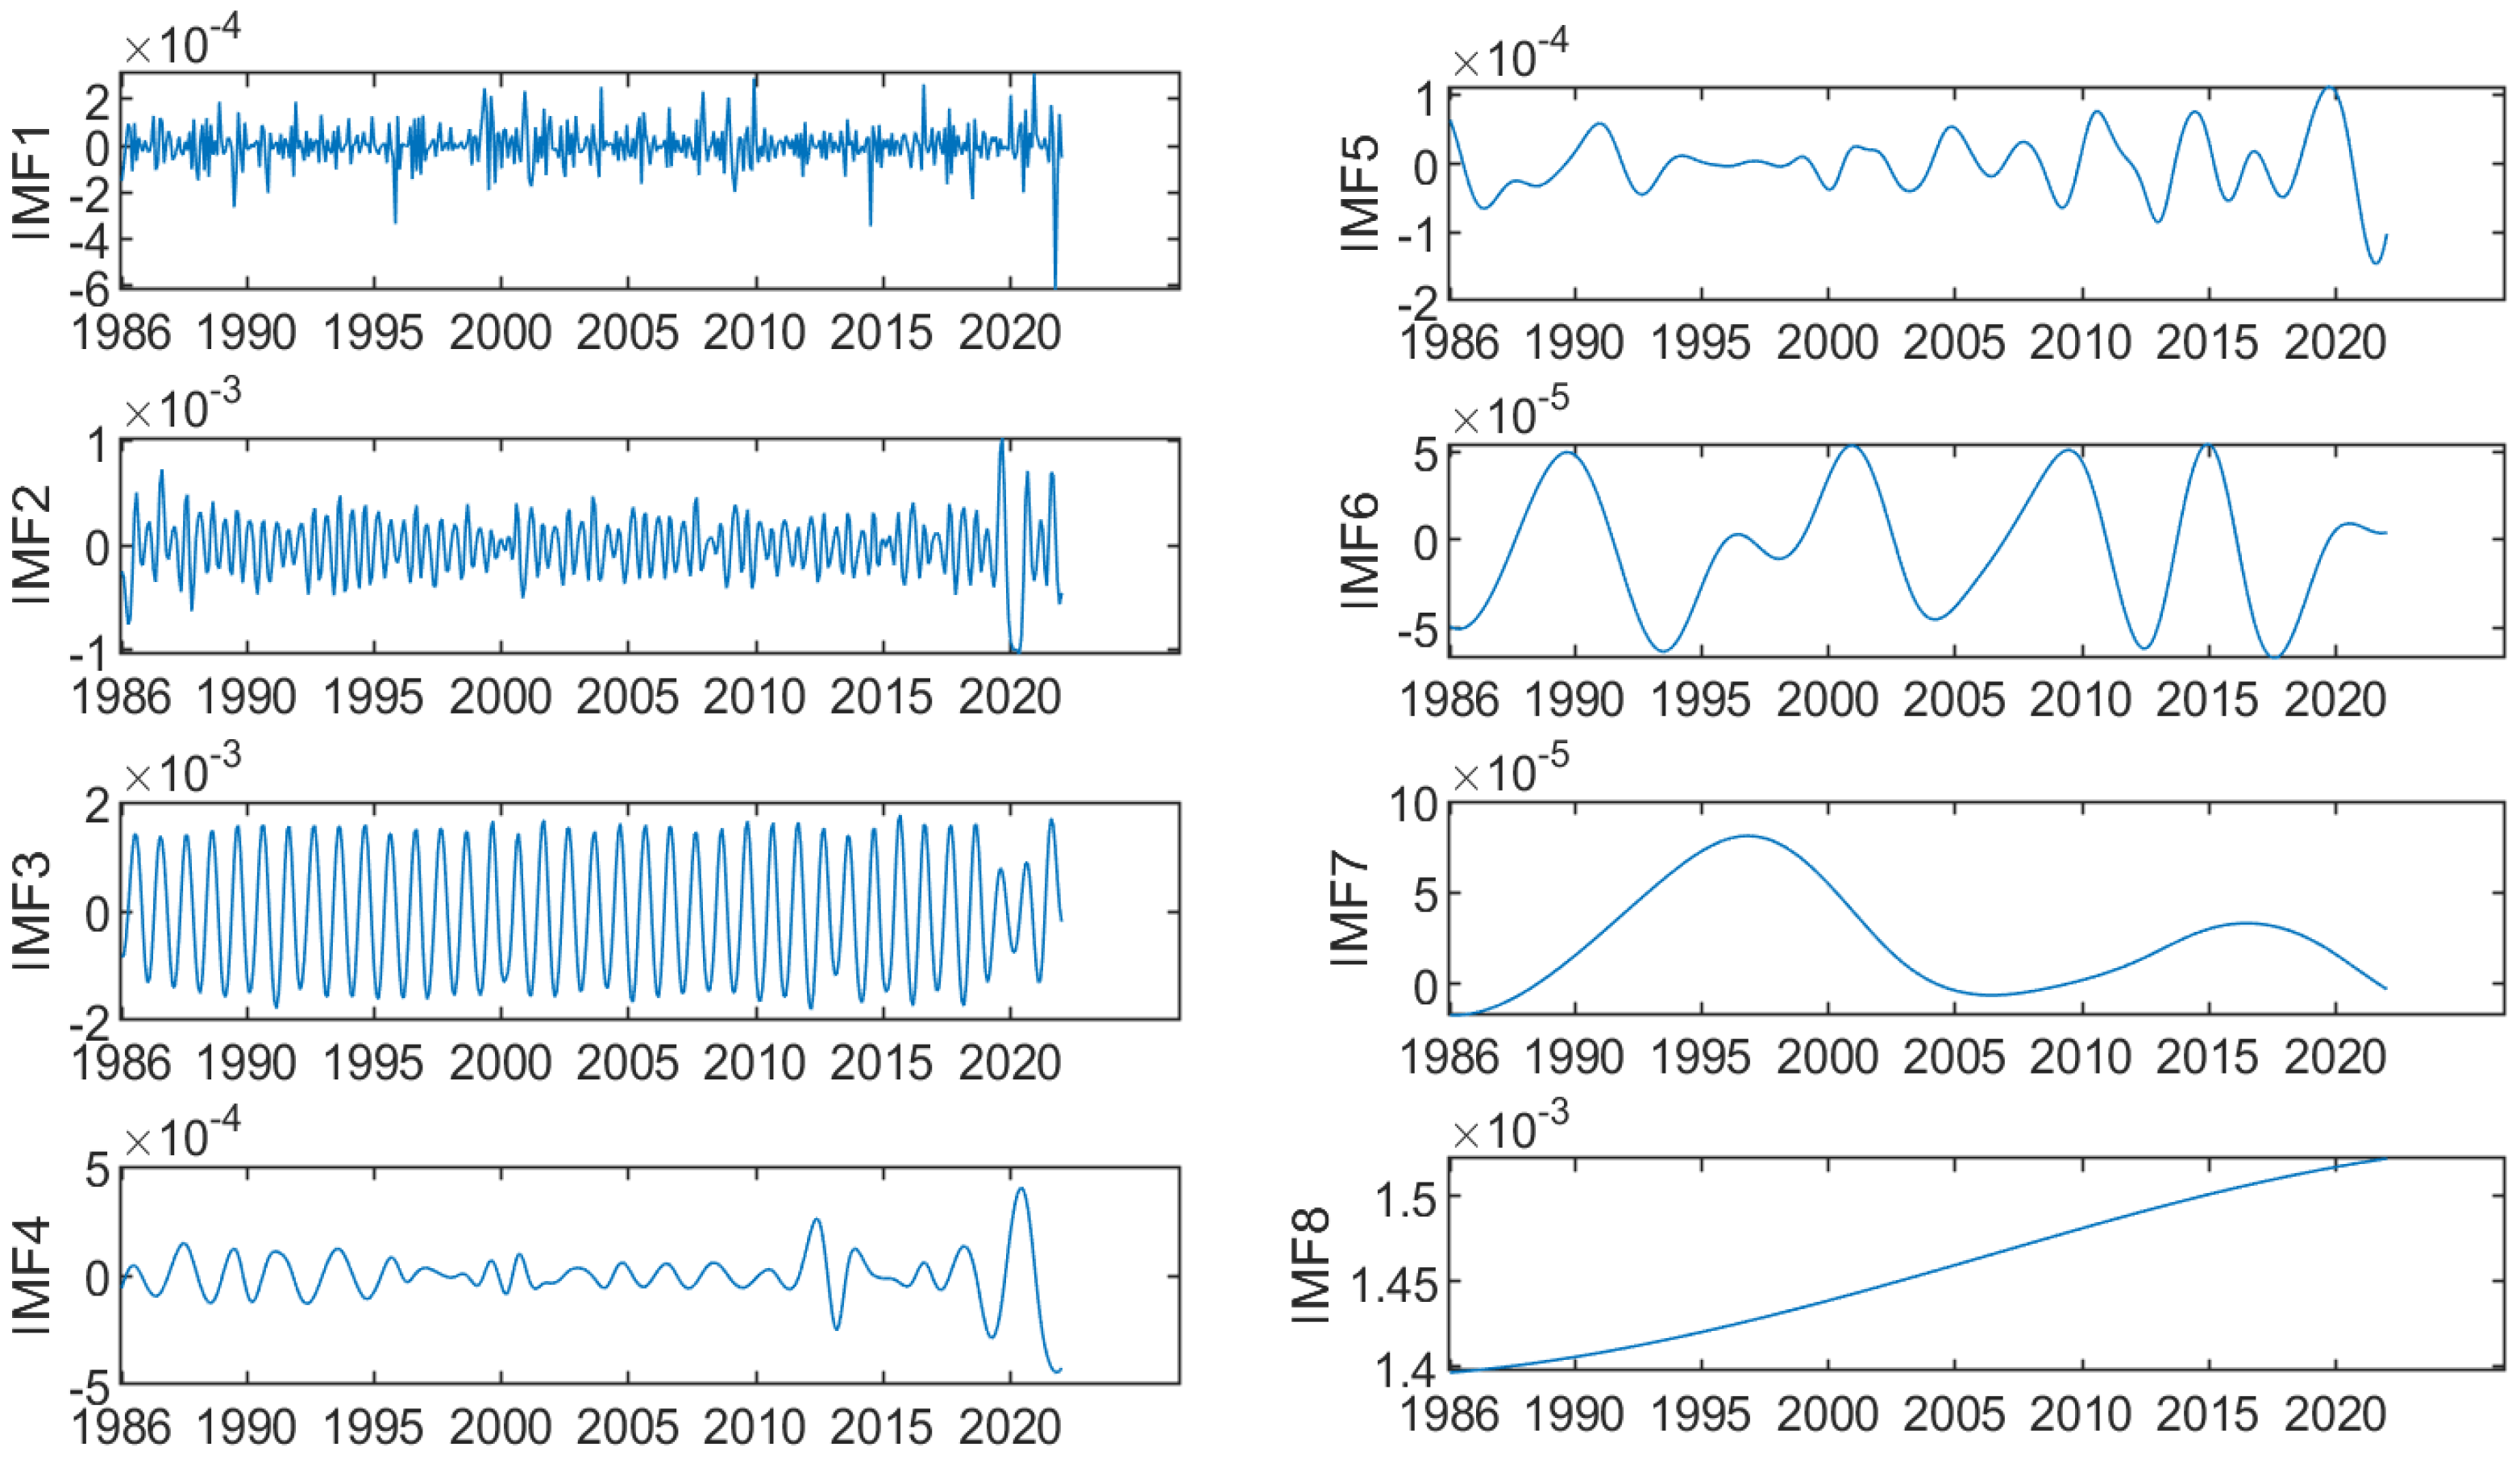
3.6. NA-MEMD Result of Monthly Lake Area and Related Meteorological Elements

Figure 9, Figure 10, Figure 11 and Figure 12 illustrate the outcomes of NA-MEMD applied to the monthly time series of lake area, precipitation, temperature, and ET spanning 1986 to 2022. Each variable undergoes decomposition into seven components (IMF1~7), along with a residual term (IMF8). The residual term encapsulates the overall change trend encompassed with the sequence. IMF1 to IMF7 delineate characteristics such as amplitude changes and varying periods within the variable’s behavior, elucidating fluctuations ranging from seasonal to interdecadal scales.
IMF1–IMF3 within the lake area data can be regarded as representing high-frequency oscillations, characterized by fluctuation periods ranging from 4 months to 12 months (Figure 9). The amplitudes of these fluctuations peaked notably in 1990, 1996, 2015, and 2020. IMF4 exhibited a period of approximately 2.5 years, while IMF5 showed a period of around 3.3 years, reaching maximum amplitudes in 1990, 1996, and 2020.
On the other hand, the average period observed for the low-frequency oscillation scale (IMF7) was approximately 16 years. This component depicted a pattern of initially decreasing, followed by increasing, trends (Figure 9). From 1986 to 2004, the lake area exhibited a gradual decline. Subsequently, it displayed a marked change, characterized by a rapid increase. Analyzing IMF8 reveals an overall ascending trend in the lake area from 1986 to 2022. There was minimal growth observed between 1986 and 1995, followed by a substantial and accelerated growth trend from 2000 to 2020.
The NA-MEMD analysis of monthly precipitation in the Qinghai Lake area from 1986 to 2022 yielded seven components and a residual term (Figure 10). Generally, as the time scale increased, the oscillation frequency, amplitude, and variation period exhibited a decreasing trend. Examining the trend terms (IMF8), precipitation showcased an ascending trend from 1986 to 2022, delineated into three distinct stages: inconspicuous growth, substantial growth, and gradual growth.
During the periods of 1986–1995 and 2010–2022, there was a negligible increase in precipitation. Conversely, from 1995 to 2010, a noticeable upward trend in precipitation was observed. The high-frequency oscillation of precipitation sustained a consistent 12-month period and remained within a relatively stable amplitude range. However, the IMF3 component displayed its lowest values in 1989 and 1996, experiencing a rapid amplitude increase post-2011.
The low-frequency oscillation period spanned approximately 3 to 5 years, while IMF6 exhibited an oscillation period of about 6 years, signifying an interdecadal oscillation. Notably, the smallest oscillation amplitude appeared during the period of 1992–1998.
The NA-MEMD analysis of monthly temperature in the Qinghai Lake area from 1986 to 2022 revealed a rising trend over the period (Figure 11). Initially, there was a slow increase from 1986 to 1995, followed by a rapid surge leading up to 2022. Temperature exhibited consistency with precipitation, displaying an oscillation period of about 12 months, with a relatively stable amplitude. Notably, larger amplitudes were observed in 1990, 2014, and 2020.
The low-frequency oscillation spanned approximately 3 to 5 years. Furthermore, IMF7 showcased an oscillation period of about 10 years, indicating an interdecadal oscillation. Interestingly, the period from 2000 to 2012, characterized by high temperature values, coincided with the phase displaying the minimum oscillation amplitude.
The NA-MEMD analysis of monthly ET in the Qinghai Lake area from 1986 to 2022 displayed a gradual upward trend over this period (Figure 12). Initially, ET experienced fluctuations within a span of 4 months to 12 months, with its highest amplitudes observed in 2014 and 2020, occurring at approximately 1.8-year intervals.
The oscillation periods in IMF6 and IMF5 were around 6 years and 3.3 years, respectively, exhibiting maximum amplitudes in 1990, 2010, 2015, and 2020. The low-frequency oscillation scale, represented by IMF7, had an average period of about 16 years, showcasing a pattern of increase, followed by a decrease, where the reduction in amplitude was less pronounced than the increase. From 1986 to 2004, ET displayed a noteworthy upward trend characterized by rapid changes.

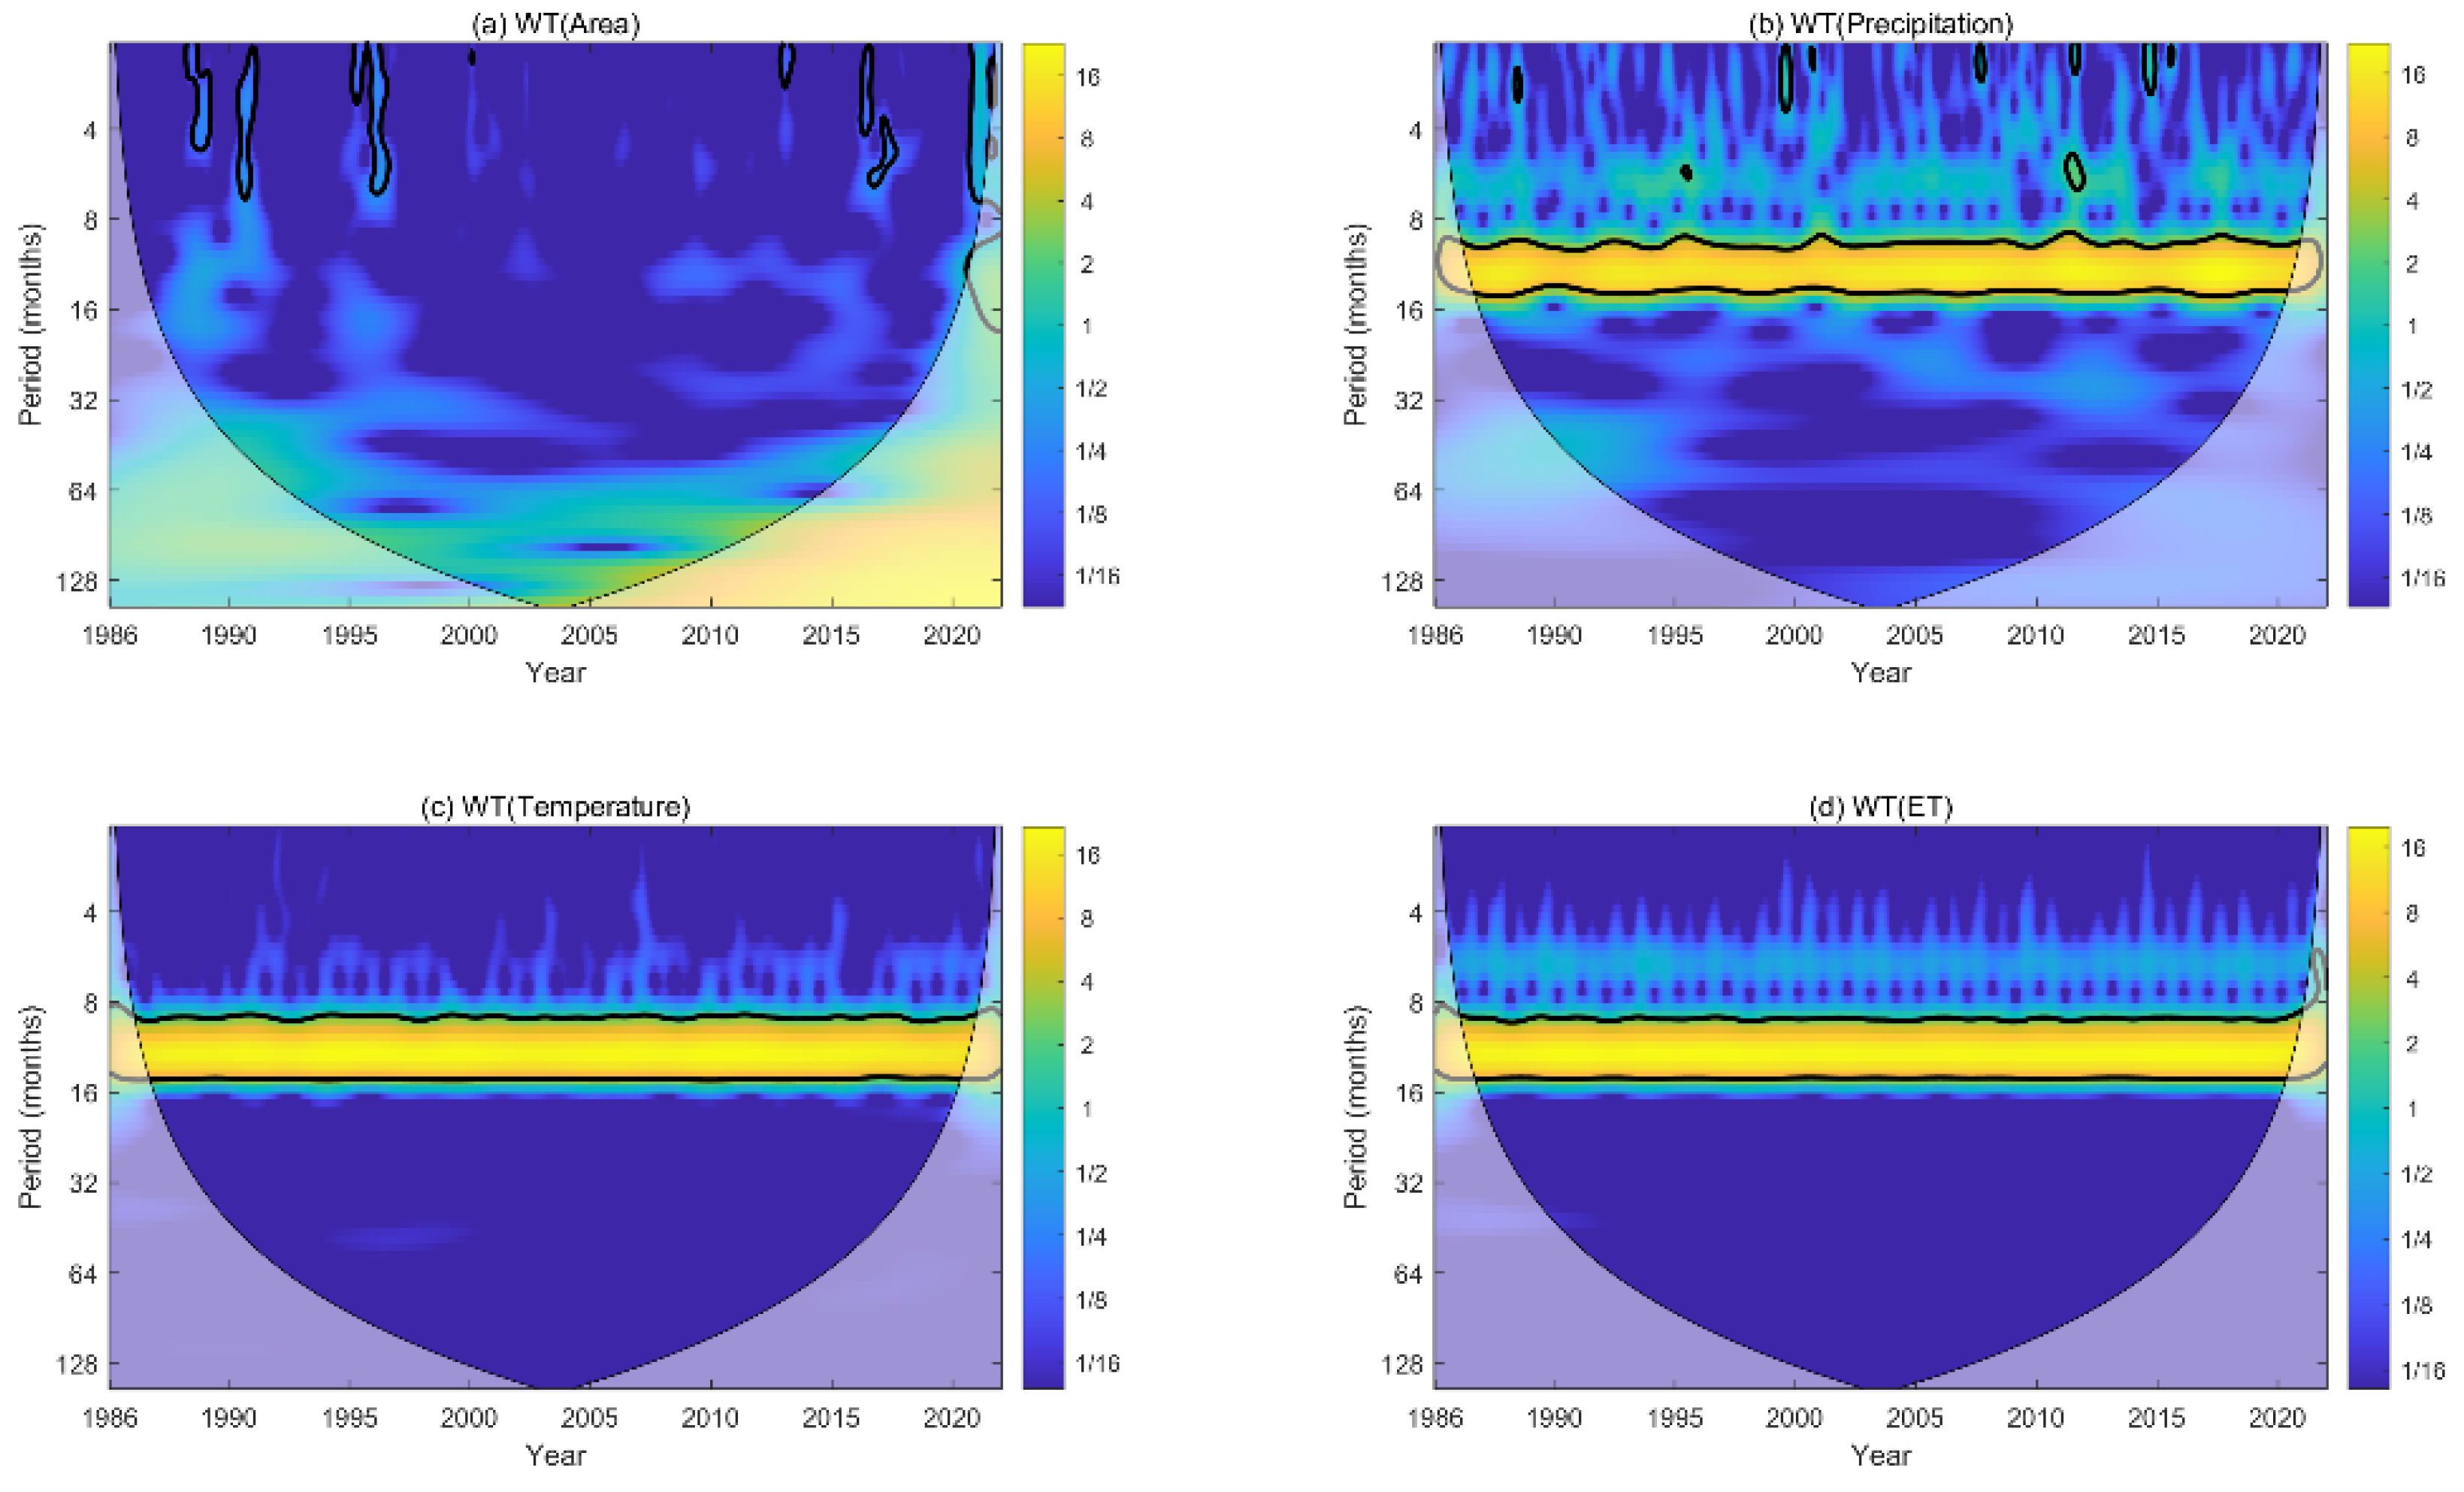
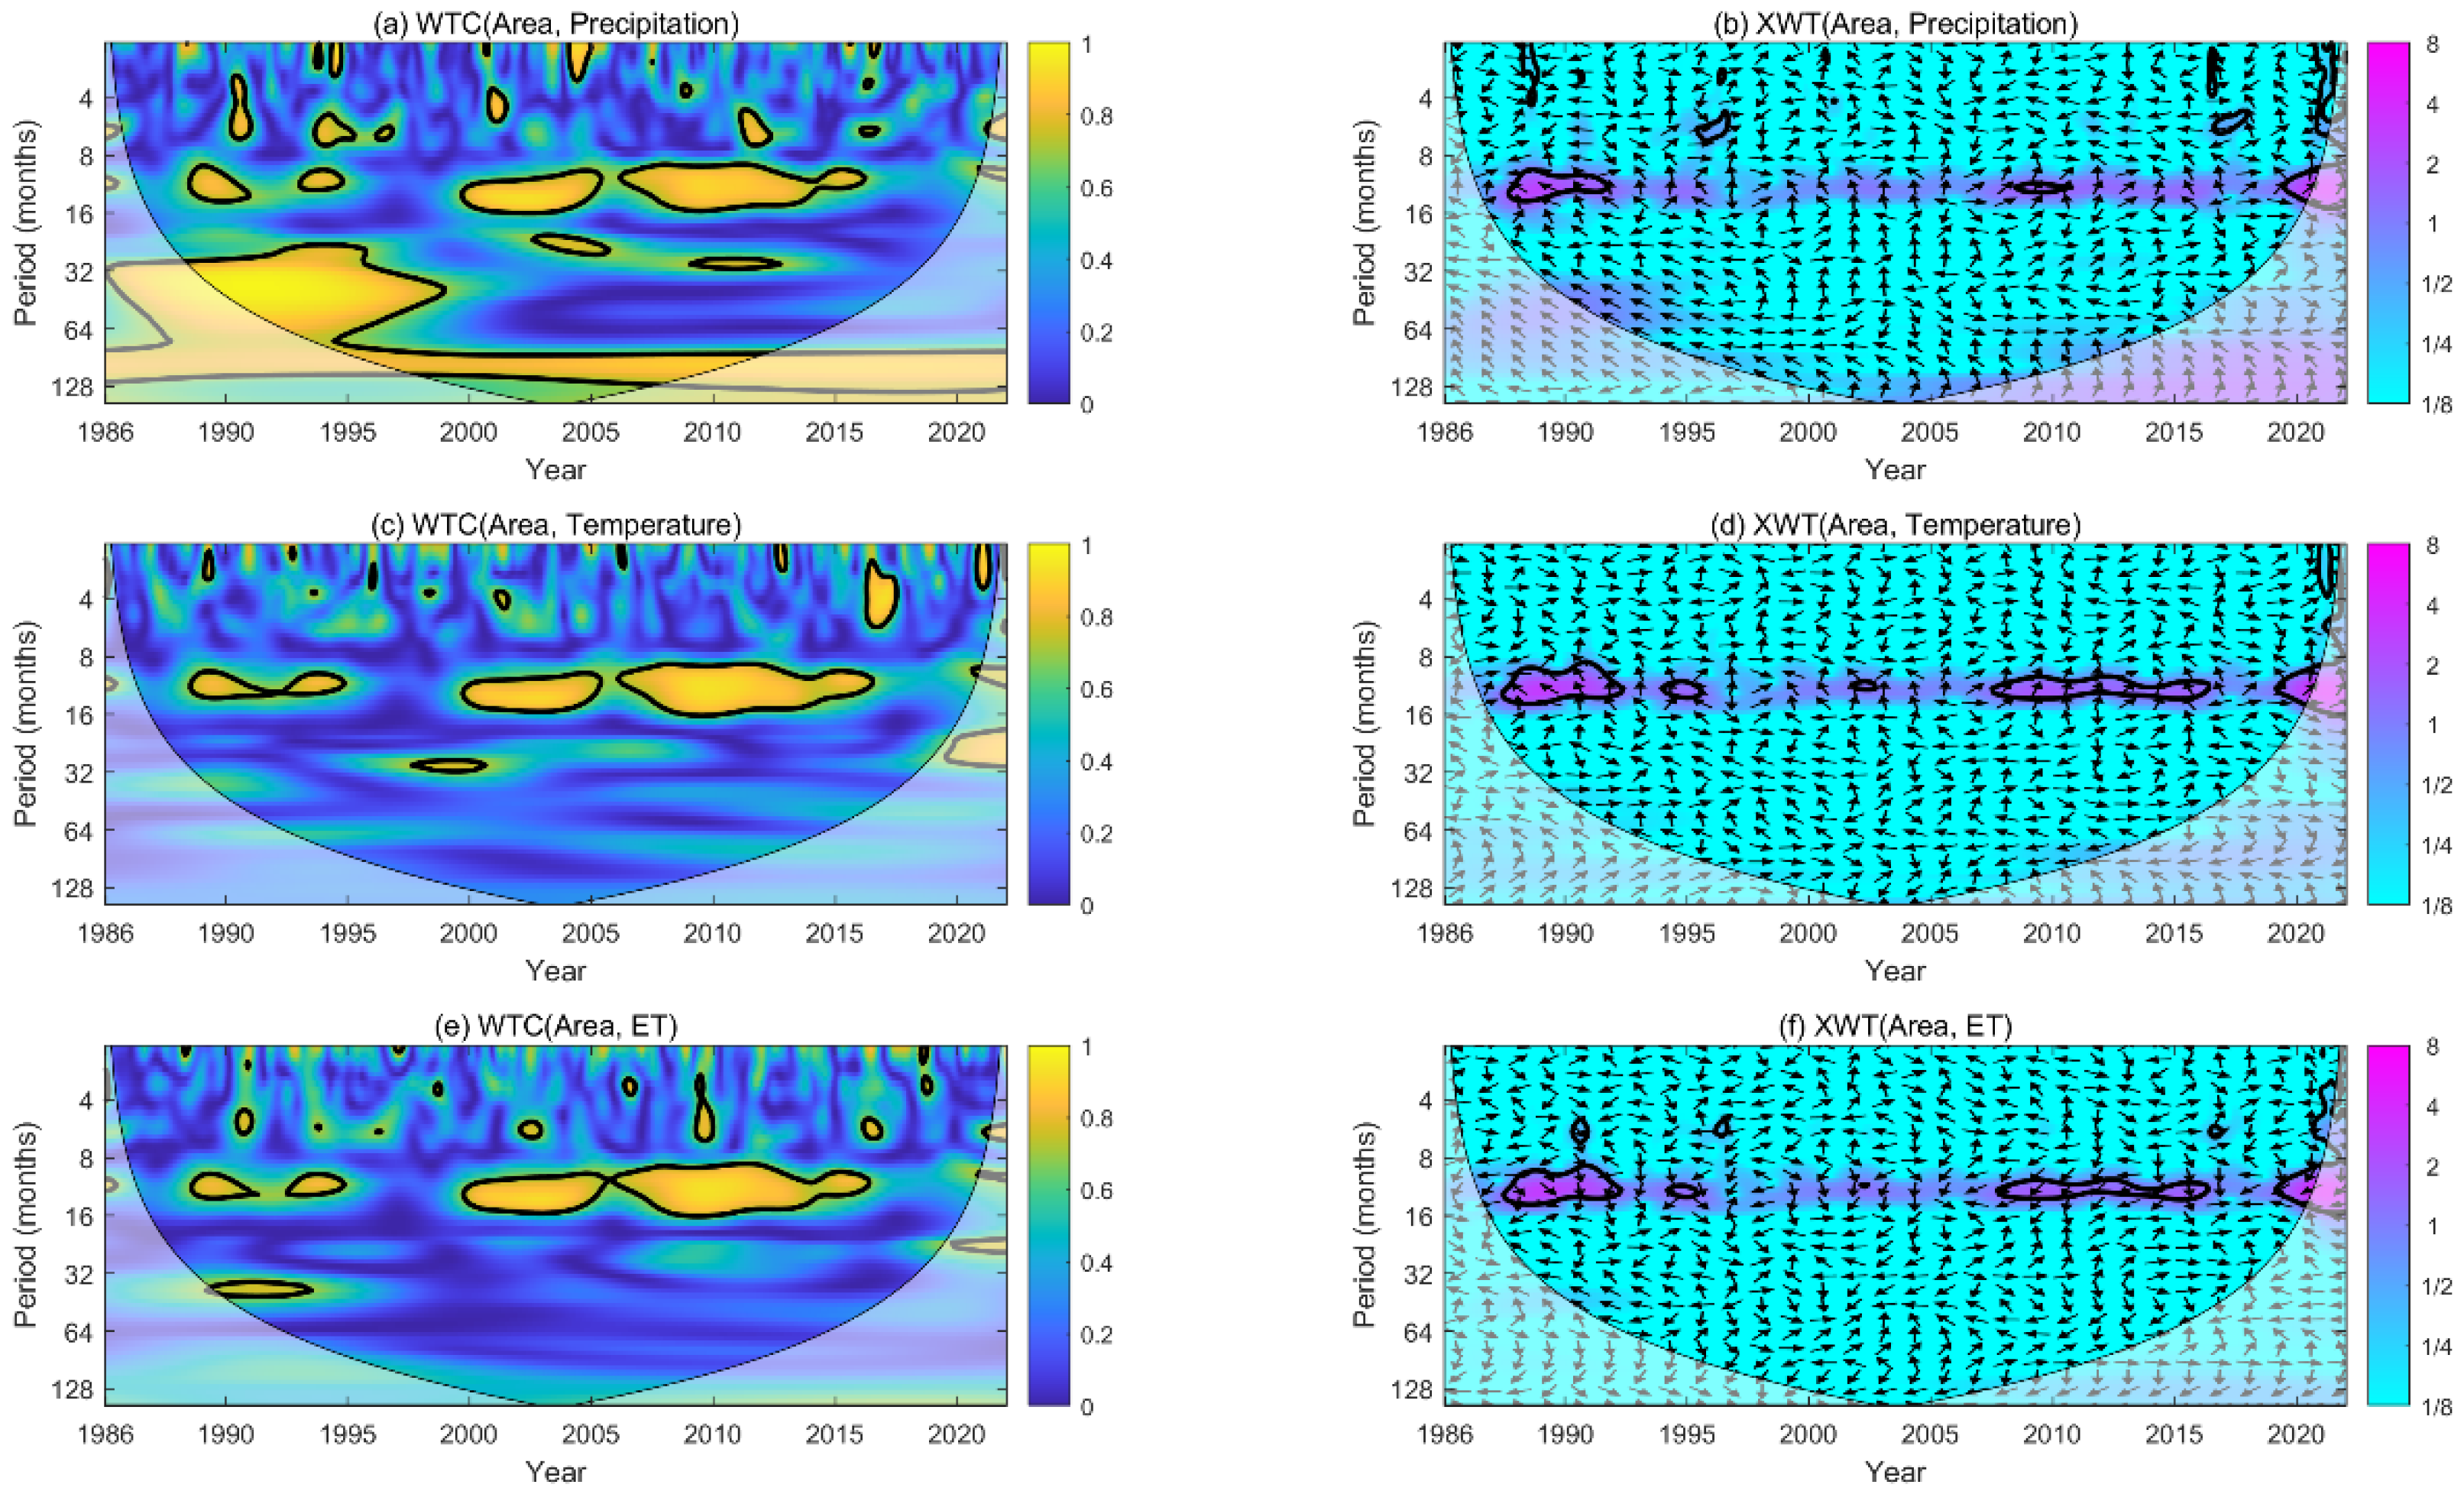
3.7. Wavelet Analysis

The relationships between the lake area and meteorological elements exhibit diverse patterns across various time scales. Simple linear correlation analysis offers insights into the overall linkage between these elements throughout the research period. However, it falls short in effectively dissecting the correlation at different temporal and spatial scales. Hence, this section employs wavelet correlation analysis to explore the oscillation characteristics of the lake area, precipitation, air temperature, and ET across periodic and localized time scales. This method allows for a more nuanced examination of their interdependencies across different temporal dimensions.
Figure 13 and Figure 14 showcase the WT, WTX, and XWT analysis between the lake area and precipitation, temperature, and ET. The horizontal axis signifies time, the vertical axis denotes the period, and the legend exhibits the correlation coefficients. The solid thick black line indicates a correlation passing the 95% significance test, while the thin black line cone delineates the wavelet influence cone, limiting interference beyond its bounds due to boundary effects. Arrow directions convey the phase relationship between the lake area and respective variables: right denotes a positive or concurrent relationship, left signifies a negative or inverse correlation, downward indicates the lake area’s fluctuation a quarter cycle earlier than the correlated variable, and upward suggests this fluctuation a quarter cycle later.
The Qinghai Lake area between 1986 and 2022 did not present clear periodic patterns overall (Figure 13a). However, it did display weaker periodic features in specific years—such as 1988, 1991, 1995 to 1996, 2015, and 2020—spanning periods of 0–8 months. Meanwhile, precipitation, temperature, and ET showcased robust oscillations over 8 to 16 months, although precipitation showed weaker fluctuations in certain years, around 0–4 months in 1999, 2008, and 2015 (Figure 13b–d).
The results from the WTC analysis reveal specific periods of resonance in 1988–1992 and 1993–1995, showing prominent alignment among the lake surface area, precipitation, temperature, and ET within a span of about 9–12 months (Figure 14a,c,e). Similarly, during 1999–2016, there was another phase of resonance, oscillating around 8–16 months. These main resonance periods displayed a coherence exceeding 0.8, indicating a substantial correlation. Moreover, there were additional peaks of high coherence in precipitation, temperature, and ET, occurring at time scales of 0–7 months and 20–40 months.
The results from the XWT analysis demonstrates a significant positive phase connection between the lake area, precipitation, temperature, and ET over an 8–16-month time scale. Specifically, during the period of 1987 to 1992, the lake area, temperature, and precipitation exhibited a leftward arrow, while from 2008 to 2016, they displayed an upward and rightward arrow (as showed in Figure 14b,d), indicating opposing and then synchronized phases, respectively.
In the phase of increasing lake area (2008–2016), changes in the lake area trailed the alterations in precipitation and temperature by a time lag of less than 1/4 of a cycle, approximately around 3 months. Conversely, the relationship between the lake surface area and ET demonstrates an inverse pattern. From 1987 to 1992, it displayed an incomplete horizontal rightward arrow, while from 2007 to 2016 and 2018 to 2022, it indicated a leftward arrow (Figure 14e). This signifies a noticeable delay between the lake area and ET during these periods, with ET lagging behind changes in the lake area, at a time lag of around 3–6 months.

4. Conclusions

This study delves into the correlation between the Qinghai Lake surface area and associated climatic factors. Utilizing remote sensing imagery data sourced from the Landsat TM 4-5 satellite, Landsat 7 ETM SLC-off satellite, and Landsat 8-9 OLI/TIRS C2 L2 satellites, the Qinghai Lake surface area from 1986 to 2022 is calculated using the NDWI method. The investigation further scrutinizes the interplay between the lake area and various meteorological elements.
  • From 1986 to 2004, a decline in the surface area of Qinghai Lake was observed, followed by an expansion trend leading up to 2022, marked by shrinkage at a rate of −6.21 km2/a and subsequent growth at a rate of 19.52 km2/a. Coinciding with this trend, there has been a consistent increase in precipitation, temperature, and ET over the same period.
  • There is a moderate positive correlation between the lake area and both precipitation and runoff, with a stronger link to runoff. Precipitation shows a moderate positive correlation with temperature and runoff, but a strong negative correlation with ice depth and the freezing period. An increase in temperature is closely related to an increase in ET, and is likely to lead to reduced ice depth and shorter freezing periods.
  • The highest correlation coefficients are observed when runoff and precipitation are leading by 1–2 years. This indicates that precipitation and runoff experiences in a given year may have their most significant impact on the lake’s area in the subsequent 1 or 2 years. The correlation coefficient between temperature and lake area shows a varied pattern—initially negative, followed by a positive trend. This pattern suggests a two-way influence over different time spans: the lake area in a given year may influence the temperature approximately 6 years later, and the temperature in a given year may have an impact on the lake area after a lag of 2–3 years.
  • Qinghai Lake reaches its largest size in September and its smallest in April. Correspondingly, the precipitation, temperature, and ET peak in July, July–August, and July–August, respectively.
  • The lake’s surface area exhibited inconsistent periodic characteristics, particularly during certain years (1988, 1991, 1995–1996, 2015, and 2020), with short-term oscillations ranging from 0 to 8 months. There was a pronounced 8–16 month oscillation in meteorological factors like precipitation, temperature, and ET. Notably, changes in the lake’s area exhibited a 3-month delay in response to variations in precipitation and temperature, and a 3–6 month delay in influencing ET.
Due to the constraints posed by satellite data periodicity and cloud cover, which affect the consistency of remote sensing imagery across different months and years, this variability in data acquisition can potentially impact the accuracy and reliability of the results. Additionally, the focus of the study is predominantly on the influence of meteorological factors on the lake area, while other significant influences, such as human activities, are not thoroughly examined. Future research could aim to address these gaps by incorporating a more diverse range of factors, including human impacts, for a more comprehensive understanding of the changes in lake area.

Author Contributions

Formal analysis and investigation, X.L. and Z.T.; conceptualization, X.L.; methodology, X.L. and J.G.; writing—original draft preparation, X.L., J.G. and Z.T.; writing—review and editing, X.L., C.L. and W.L. All authors have read and agreed to the published version of the manuscript.

Funding

This work was jointly funded by the National Natural Science of China (Grant No. 42075114, 41705101), Priority Academic Program Development of Jiangsu Higher Education Institutions (140119001), and General Project of Modern Agriculture from the Primary R&D Program of Xuzhou (KC21132).

Data Availability Statement

The hydrological and meteorological data of Qinghai Lake (1956–2020) were downloaded from Lake-Watershed Science SubCenter, National Earth System Science Data Center, National Science & Technology Infrastructure of China (http://gre.geodata.cn, accessed on 10 October 2023). The precipitation and temperature data utilized in this study were obtained from the National Earth System Science Data Center, National Science & Technology Infrastructure of China (accessible via http://www.geodata.cn, accessed on 6 May 2023). The European Centre for Medium-Range Weather Forecasts (ECMWF) fifth-generation land surface reanalysis dataset (ERA5-Land) was downloaded from https://cds.climate.copernicus.eu/ (accessed on 10 October 2023).

Acknowledgments

We would like to thank the editor and the anonymous reviewers for exceptionally thoughtful reviews and suggestions that greatly improved this paper. Acknowledgement for the data support from “National Earth System Science Data Center, National Science & Technology Infrastructure of China” (http://www.geodata.cn, accessed on 6 May 2023).

Conflicts of Interest

The authors declare no conflicts of interest.

Correction Statement

This article has been republished with a minor correction to the Funding. "National Science Foundation of China" should be "National Natural Science of China". This change does not affect the scientific content of the article.

References

  1. Nasiri, A.; Khosravian, M.; Zandi, R.; Entezari, A.; Baaghide, M. Analysis of physical changes in Fars province water zones related to climatic parameters using remote sensing, Bakhtegan, Tashk, Iran. Egypt. J. Remote Sens. 2023, 26, 851–861. [Google Scholar] [CrossRef]
  2. Wang, L.M.; Wang, J.X.; Wang, L.C.; Zhu, L.P.; Li, X.G. Lake Evaporation and Its Effects on Basin Evapotranspiration and Lake Water Storage on the Inner Tibetan Plateau. Water Resour. Res. 2023, 59, e2022WR034030. [Google Scholar] [CrossRef]
  3. Qu, L.L.; Liu, Y.S.; Li, Y.R.; Wang, J.Y.; Yang, F.; Wang, Y.S. Sustainable use of gully agricultural land and water resources for sustainable development goals: A case study in the Loess Plateau of China. Land Degrad. Dev. 2023, 34, 4935–4949. [Google Scholar] [CrossRef]
  4. Wang, Y.H.; Yang, K.; Jia, T.F.; Luo, Y. Influence of natural factors and land use change on changes in the main lake area in China over the past 30 years. Ecol. Indic. 2023, 155, 111005. [Google Scholar] [CrossRef]
  5. Wu, Z.H.; Feng, J.X.; Qiao, F.L.; Tan, Z.M. Fast multidimensional ensemble empirical mode decomposition for the analysis of big spatio-temporal datasets. Philos. Trans. R. Soc. A 2016, 374, 20150197. [Google Scholar] [CrossRef] [PubMed]
  6. Xu, J.Y.; Wang, Y.X.; Teng, M.J.; Wang, P.C.; Yan, Z.G.; Wang, H. Ecosystem services of lake-wetlands exhibit significant spatiotemporal heterogeneity and scale effects in a multi-lake megacity. Ecol. Indic. 2023, 154, 110843. [Google Scholar] [CrossRef]
  7. Ma, Y.J.; Li, X.Y.; Liu, L.; Yang, X.F.; Wu, X.C.; Wang, P.; Lin, H.; Zhang, G.H.; Miao, C.Y. Evapotranspiration and its dominant controls along an elevation gradient in the Qinghai Lake watershed, northeast Qinghai-Tibet Plateau. J. Hydrol. 2019, 575, 257–268. [Google Scholar] [CrossRef]
  8. Liu, C.; Zhu, L.P.; Wang, J.B.; Ju, J.T.; Ma, Q.F.; Kou, Q.Q. The decrease of salinity in lakes on the Tibetan Plateau between 2000 and 2019 based on remote sensing model inversions. Int. J. Digit. Earth 2023, 16, 2644–2659. [Google Scholar] [CrossRef]
  9. Pang, S.Y.; Zhu, L.P.; Yang, R.M. Interannual Variation in the Area and Water Volume of Lakes in Different Regions of the Tibet Plateau and Their Responses to Climate Change. Front. Earth Sci. 2021, 9, 738018. [Google Scholar] [CrossRef]
  10. Paul, M.J.; Coffey, R.; Stamp, J.; Johnson, T. A Review of Water Quality Responses to Air Temperature and Precipitation Changes 1: Flow, Water Temperature, Saltwater Intrusion. J. Am. Water Resour. Assoc. 2019, 55, 824–843. [Google Scholar] [CrossRef]
  11. Wang, W.S.; Sun, M.P.; Che, Y.J.; Yao, X.J.; Zhang, M.J.; Niu, S.T. Micrometeorological Analysis and Glacier Ablation Simulation in East Kunlun. Water 2023, 15, 3517. [Google Scholar] [CrossRef]
  12. Li, H.; Luo, Z.L.; Xu, Y.; Zhu, S.Y.; Chen, X.; Geng, X.Z.; Xiao, L.; Wan, W.; Cui, Y.K. A remote sensing-based area dataset for approximately 40 years that reveals the hydrological asynchrony of Lake Chad based on Google Earth Engine. J. Hydrol. 2021, 603, 126934. [Google Scholar] [CrossRef]
  13. Ren, L.; Xiang, X.Y.; Ni, J.J. Research of the relationship between the water area and water level of Poyang Lake based on remote sensing image. Iahs-Aish Publ. 2011, 350, 660–665. [Google Scholar]
  14. Palmer, S.C.J.; Kutser, T.; Hunter, P.D. Remote sensing of inland waters: Challenges, progress and future directions. Remote Sens. Environ. 2015, 157, 1–8. [Google Scholar] [CrossRef]
  15. Liu, T.Y.; Dai, J.J.; Zhao, Y.Y.; Tian, S.F.; Nie, Z.; Ye, C.Y. Using remote sensing technology to monitor salt lake changes caused by climate change and melting glaciers: Insights from Zabuye Salt Lake in Xizang. J. Oceanol. Limnol. 2023, 41, 1258–1276. [Google Scholar] [CrossRef]
  16. Wulder, M.A.; Coops, N.C. Satellites: Make Earth observations open access. Nature 2014, 513, 30–31. [Google Scholar] [CrossRef]
  17. Gao, H.L. Satellite remote sensing of large lakes and reservoirs: From elevation and area to storage. Wiley Interdiscip. Rev.-Water 2015, 2, 147–157. [Google Scholar] [CrossRef]
  18. Liang, Y.T.; Wen, X.F.; Liu, K.Q.; Tan, D.B.; Cao, B. Dynamics Change of Water Surface Area and its Driving Force Analysis for Honghu Lake in Recent 40 Years Based on Remote Sensing Technique. In Proceedings of the 2013 Fifth International Conference on Measuring Technology and Mechatronics Automation, Hong Kong, China, 16–17 January 2013; pp. 500–506. [Google Scholar] [CrossRef]
  19. Liu, X.L.; Shi, Z.T.; Huang, G.C.; Bo, Y.C.; Chen, G.J. Time Series Remote Sensing Data-Based Identification of the Dominant Factor for Inland Lake Surface Area Change: Anthropogenic Activities or Natural Events? Remote Sens. 2020, 12, 612. [Google Scholar] [CrossRef]
  20. Zhang, G.; Xie, H.; Kang, S.; Yi, D.; Ackley, S.F. Monitoring lake level changes on the Tibetan Plateau using ICESat altimetry data (2003–2009). Remote Sens. Environ. 2014, 150, 82–95. [Google Scholar] [CrossRef]
  21. Kameyama, S.; Zhang, J.; Wang, Q.; Xu, K.; Katoh, T.; Watanabe, M. An approach to Estimate the Water Level and Volume of Dongting Lake Using Terra/MODIS Data. ACTA Geogr. Sin. 2004, 59, 88–94. [Google Scholar]
  22. Li, J.; Li, J.; Huang, S.; Zuo, C. Application of Terr/MODIS Time Series Dat in Dynamic Monitoring of Lke Water Area Variations. J. Nat. Resour. 2009, 24, 923–933. [Google Scholar]
  23. Wu, M.; Zhang, W.; Wang, X.J.; Luo, D.G. Application of MODIS satellite data in monitoring water quality parameters of Chaohu Lake in China. Environ. Monit. Assess. 2009, 148, 255–264. [Google Scholar] [CrossRef] [PubMed]
  24. Crétaux, J.F.; Abarca-del-Río, R.; Berge-Nguyen, M.; Arsen, A.; Drolon, V.; Clos, G.; Maisongrande, P. Lake volume monitoring from space. Surv. Geophys. 2016, 37, 269–305. [Google Scholar] [CrossRef]
  25. McFeeters, S.K. The use of the Normalized Difference Water Index (NDWI) in the delineation of open water features. Int. J. Remote Sens. 1996, 17, 1425–1432. [Google Scholar] [CrossRef]
  26. Neelmeijer, J.; Motagh, M.; Wetzel, H.-U. Estimating Spatial and Temporal Variability in Surface Kinematics of the Inylchek Glacier, Central Asia, using TerraSAR–X Data. Remote Sens. 2014, 6, 9239–9259. [Google Scholar] [CrossRef]
  27. Cai, X.; Gan, W.; Wei, J.; Zhao, X.; Wang, X.; Chen, X. Optimizing remote sensing-based level-area modeling of large lake wetlands: Case study of poyang lake. IEEE J. Sel. Top. Appl. Earth Obs. Remote Sens. 2015, 8, 471–479. [Google Scholar] [CrossRef]
  28. Ma, M.; Wang, X.; Veroustraete, F.; Dong, L. Change in area of Ebinur Lake during the 1998–2005 period. Int. J. Remote Sens. 2007, 28, 5523–5533. [Google Scholar] [CrossRef]
  29. Bian, D.; Bian, B.; La, B.; Wang, C.Y.; Chen, T. The Response of Water Level of Selin Co to Climate Change during 1975–2008. ACTA Geogr. Sin. 2010, 65, 313–319. [Google Scholar]
  30. El-Asmar, H.M.; Hereher, M.E. Change detection of the coastal zone east of the Nile Delta using remote sensing. Environ. Earth Sci. 2011, 62, 769–777. [Google Scholar] [CrossRef]
  31. Jiang, Z.Y.; Wang, J.R.; Cai, X.B.; Zhao, J.L.; Zhang, H.W.; Zhang, Y.; Wang, C.S. Hydrological Characteristics Change of Hala Lake and Its Response to Climate Change, 1987–2018. Remote Sens. 2022, 14, 2886. [Google Scholar] [CrossRef]
  32. Aznarez, C.; Jimeno-Sáez, P.; López-Ballesteros, A.; Pacheco, J.P.; Senent-Aparicio, J. Analysing the Impact of Climate Change on Hydrological Ecosystem Services in Laguna del Sauce (Uruguay) Using the SWAT Model and Remote Sensing Data. Remote Sens. 2021, 13, 2014. [Google Scholar] [CrossRef]
  33. Koebsch, F.; Jurasinski, G.; Koch, M.; Hofmann, J.; Glatzel, S. Controls for multi-scale temporal variation in ecosystem methane exchange during the growing season of a permanently inundated fen. Agric. For. Meteorol. 2015, 204, 94–105. [Google Scholar] [CrossRef]
  34. Lane, R.R.; Day, J.W.; Shaffer, G.P.; Hunter, R.G.; Day, J.N.; Wood, W.B.; Settoon, P. Hydrology and water budget analysis of the East Joyce wetlands: Past history and prospects for the future. Ecol. Eng. 2016, 87, 34–44. [Google Scholar] [CrossRef]
  35. de Sousa, A.M.L.; Castro, N.M.R.; Canales, F.A.; Louzada, J.A.S.; Vitorino, M.I.; de Souza, E.B. Multiscale variability of the evapotranspiration in eastern Amazonia. Atmos. Sci. Lett. 2010, 11, 192–198. [Google Scholar] [CrossRef]
  36. Pan, X.; Liu, S.Y.; Tansey, K.; Fan, X.W.; Yang, Z.; Yuan, J.; Wang, Z.C.; Yang, Y.B.; Liu, Y.B. Spatio-temporal variation of evapotranspiration and its linkage with environmental factors in the largest freshwater lake wetland in China. J. Hydrol.-Reg. Stud. 2023, 47, 101424. [Google Scholar] [CrossRef]
  37. Torres-Batlló, J.; Martí-Cardona, B.; Pillco-Zolá, R. Mapping Evapotranspiration, Vegetation and Precipitation Trends in the Catchment of the Shrinking Lake Poopo. Remote Sens. 2020, 12, 73. [Google Scholar] [CrossRef]
  38. Yue, H.; Liu, Y.; Wang, H.R.; Zhang, W. Dynamic Analysis of Water Level and Area of Typical Lakes in Qinghai-Tibet Plateau. In Proceedings of the 2016 IEEE International Geoscience and Remote Sensing Symposium (IGARSS), Beijing, China, 10–15 July 2016; pp. 6807–6810. [Google Scholar] [CrossRef]
  39. Available online: http://www.geodata.cn/data/datadetails.html?dataguid=34628698652201&docid=2887 (accessed on 10 October 2023).
  40. Peng, S.Z.; Ding, Y.X.; Liu, W.Z.; Li, Z. 1 km monthly temperature and precipitation dataset for China from 1901 to 2017. Earth Syst. Sci. Data 2019, 11, 1931–1946. [Google Scholar] [CrossRef]
  41. Available online: http://www.geodata.cn/data/datadetails.html?dataguid=164304785536614&docId=732 (accessed on 6 May 2023).
  42. Available online: http://www.geodata.cn/data/datadetails.html?dataguid=192891852410344&docId=518 (accessed on 6 May 2023).
  43. Ge, W.Y.; Han, J.Q.; Zhang, D.J.; Wang, F. Divergent impacts of droughts on vegetation phenology and productivity in the Yungui Plateau, southwest China. Ecol. Indic. 2021, 127, 107743. [Google Scholar] [CrossRef]
  44. Niu, L.; Zhang, Z.F.; Peng, Z.; Liang, Y.Z.; Liu, M.; Jiang, Y.Z.; Wei, J.; Tang, R.L. Identifying Surface Urban Heat Island Drivers and Their Spatial Heterogeneity in China’s 281 Cities: An Empirical Study Based on Multiscale Geographically Weighted Regression. Remote Sens. 2021, 13, 4428. [Google Scholar] [CrossRef]
  45. Yu, Z.; Ciais, P.; Piao, S.L.; Houghton, R.A.; Lu, C.Q.; Tian, H.Q.; Agathokleous, E.; Kattel, G.R.; Sitch, S.; Goll, D.; et al. Forest expansion dominates China’s land carbon sink since 1980. Nat. Commun. 2022, 13, 5374. [Google Scholar] [CrossRef]
  46. Available online: https://cds.climate.copernicus.eu/cdsapp#!/dataset/reanalysis-era5-land-monthly-means?tab=overview (accessed on 8 April 2023).
  47. Huang, N.E.; Shen, Z.; Long, S.R.; Wu, M.C.; Shih, E.H.; Zheng, Q.; Tung, C.C.; Liu, H.H. The empirical mode decomposition and the Hilbert spectrum for nonlinear and nonstationary time series analysis. Proc. R. Soc. Lond. 1998, 454, 903–995. [Google Scholar] [CrossRef]
  48. Wu, Z.; Huang, N.E. Ensemble Empirical Mode Decomposition: A noise-assisted data analysis method. Adv. Adapt. Data Anal. 2009, 1, 1–41. [Google Scholar] [CrossRef]
  49. Rehman, N.U.; Mandic, D.P. Filter Bank Property of Multivariate Empirical Mode Decomposition. IEEE Trans. Signal Process. 2011, 59, 2421–2426. [Google Scholar] [CrossRef]
  50. Rehman, N.; Mandic, D.P. Multivariate empirical mode decomposition. Phys. Eng. Sci. 2010, 466, 1291–1302. [Google Scholar] [CrossRef]
  51. Liu, Q.; Hao, Y.H.; Stebler, E.; Tanaka, N.; Zou, C.B. Impact of Plant Functional Types on Coherence Between Precipitation and Soil Moisture: A Wavelet Analysis. Geophys. Res. Lett. 2017, 44, 12197–12207. [Google Scholar] [CrossRef]
  52. Gao, H.; Jin, J.X. Analysis of Water Yield Changes from 1981 to 2018 Using an Improved Mann-Kendall Test. Remote Sens. 2022, 14, 2009. [Google Scholar] [CrossRef]
  53. Yu, W.Z.; Fu, A.D.; Shao, L.; Liu, H.T.; Yao, X.; Chen, T.L.; Zhang, H.X.Y. Characteristics of Climate Change in the Lake Basin Area of Gangcha County. Cmc-Comput. Mater. Contin. 2022, 73, 363–379. [Google Scholar] [CrossRef]
  54. Zhu, D.T.; Cheng, X.J.; Li, W.H.; Niu, F.J.; Wen, J.H. Characteristic of water quality indicators and its response to climate conditions in the middle and lower reaches of Lijiang River, China. Environ. Monit. Assess. 2023, 195, 396. [Google Scholar] [CrossRef]
  55. Grinsted, A.; Moore, J.C.; Jevrejeva, S. Application of the cross wavelet transform and wavelet coherence to geophysical time series. Nonlinear Process. Geophys. 2004, 11, 561–566. [Google Scholar] [CrossRef]
  56. Xu, H. A Study on Information Extraction of Water Body with the Modified Normalized Difference Water Index (MNDWI). J. Remote Sens. 2005, 9, 589–595. [Google Scholar]
Figure 1. Location of Qinghai Lake basin and its elevation distribution.
Remotesensing 16 00129 g001
Figure 2. Evaluation of remotely sensed lake area by using the (a) lake area from observation and (b) lake level.
Remotesensing 16 00129 g002
Figure 3. Evolution and trends of (a) Qinghai Lake Area, (b) Precipitation, (c) Temperature, and (d) ET changes for different seasons from 1986 to 2022. MAM, JJA, SON, and DJF are referred to as spring, summer, autumn, and winter, respectively.
Remotesensing 16 00129 g003
Figure 4. Difference integral of (a) lake area, (b) precipitation, (c) temperature, and (d) ET from 1986 to 2022.
Remotesensing 16 00129 g004
Figure 5. The evolution of the anomaly for (a) lake area, (b) precipitation, (c) temperature, (d) lake surface water temperature, (e) ET, and (f) runoff over time. The red color in the chart indicates negative anomalies, while blue represents positive anomalies.
Remotesensing 16 00129 g005
Figure 6. Lag correlation coefficients between Qinghai Lake area and its associated meteorological elements.
Remotesensing 16 00129 g006
Figure 7. Intra-year variability of Qinghai Lake area and related meteorological elements during 1986–2022.
Remotesensing 16 00129 g007
Figure 8. Intra-year variability of Qinghai Lake area and related meteorological elements during different time periods.
Remotesensing 16 00129 g008
Figure 9. The NA-MEMD result of monthly lake area time series from 1986 to 2022.
Remotesensing 16 00129 g009
Figure 10. The NA-MEMD result of monthly precipitation time series from 1986 to 2022.
Remotesensing 16 00129 g010
Figure 11. The NA-MEMD result of monthly temperature time series from 1986 to 2022.
Remotesensing 16 00129 g011
Figure 12. The NA-MEMD result of monthly ET time series from 1986 to 2022.
Remotesensing 16 00129 g012
Figure 13. Wavelet analysis for (a) Qinghai Lake Area, (b) Precipitation, (c) Temperature, and (d) ET.
Remotesensing 16 00129 g013
Figure 14. The interaction between lake area and meteorological factors varies at different time scales.
Remotesensing 16 00129 g014
Table 1. Bands and corresponding parameters for Landsat TM 4-5, Landsat 7, and Landsat 8-9 OLI/TIRS.
Landsat TM 4-5Landsat 7Landsat 8-9
BandsWavelength
(μm)
BandsWavelength (μm)BandsWavelength (μm)
Band1-Blue0.45–0.52Band1-Blue0.45–0.52Band1-Coastal aerosol0.43–0.45
Band2-Green0.52–0.60Band2-Green0.52–0.60Band2-Blue0.45–0.51
Band3-Red0.63–0.69Band3-Red0.63–0.69Band3-Green0.53–0.59
Band4-NIR0.76–0.90Band4-NIR0.77–0.90Band4-Red0.64–0.67
Band5-SWIR11.55–1.75Band5-SWIR11.55–1.75Band5-NIR0.85–0.88
Band6-LWIR10.40–12.50Band6-TIRS10.40–12.50Band6-SWIR11.57–1.65
Band7-SWIR22.08–2.35Band7-SWIR22.08–2.35Band7-SWIR22.11–2.29
Band8-Panchromatic0.52–0.90Band8-Panchromatic0.50–0.68
Band9-Cirrus1.36–1.38
Band10-TIRS110.60–11.19
Band11-TIRS211.50–12.51
Table 2. Trends of lake area changes and climatic factors since 1986.
PERIODSAREA (km2/Year)Monthly Precipitation (mm/Year)Temperature (°C/Year)Monthly ET (mm/Year)
1986–20221986–20042004–20221986–20221986–20042004–20221986–20221986–20042004–20221986–20221986–20042004–2022
ANNUAL4.984−6.21319.0100.1180.053−0.1290.0260.0300.0230.0290.0740.002
MAM4.862−6.21219.2050.0440.0050.0780.0350.0600.0140.0490.0970.006
JJA5.242−5.74719.4080.101−0.4860.0400.0370.0400.0510.0680.0950.205
SON5.426−6.72419.6070.3220.702−0.6130.0260.0530.035−0.0200.090−0.231
DJF4.405−6.16917.8220.005−0.007−0.0210.007−0.032−0.0080.0210.0150.026
Table 3. The correlation coefficients between the Qinghai Lake area and various meteorological elements. Values marked with * and ** indicate that the correlation coefficients have passed significance tests at 95% and 99% confidence levels, respectively.
All YearsLake AreaPrecipitationTemperatureLSWTETRUNOFFIce DepthFreezing Period
Lake Area1.00 0.41 *0.20 0.00 0.12 0.58 **−0.37 −0.38
Precipitation 1.00 0.41 *0.27 0.17 0.59 **−0.55 *−0.68 **
Temperature 1.000.39 *0.62 **0.39 *−0.58 *−0.74 **
LSWT 1.000.160.33−0.31 −0.36
ET 1.000.23−0.29 −0.16
RUNOFF 1.00−0.50 *−0.63 *
Ice Depth 1.00 −0.42 *
Freezing Period 1.00
Disclaimer/Publisher’s Note: The statements, opinions and data contained in all publications are solely those of the individual author(s) and contributor(s) and not of MDPI and/or the editor(s). MDPI and/or the editor(s) disclaim responsibility for any injury to people or property resulting from any ideas, methods, instructions or products referred to in the content.

