


Intelligent Segmentation and Change Detection of Dams Based on UAV Remote Sensing Images


Abstract
:
1. Introduction
- (1)
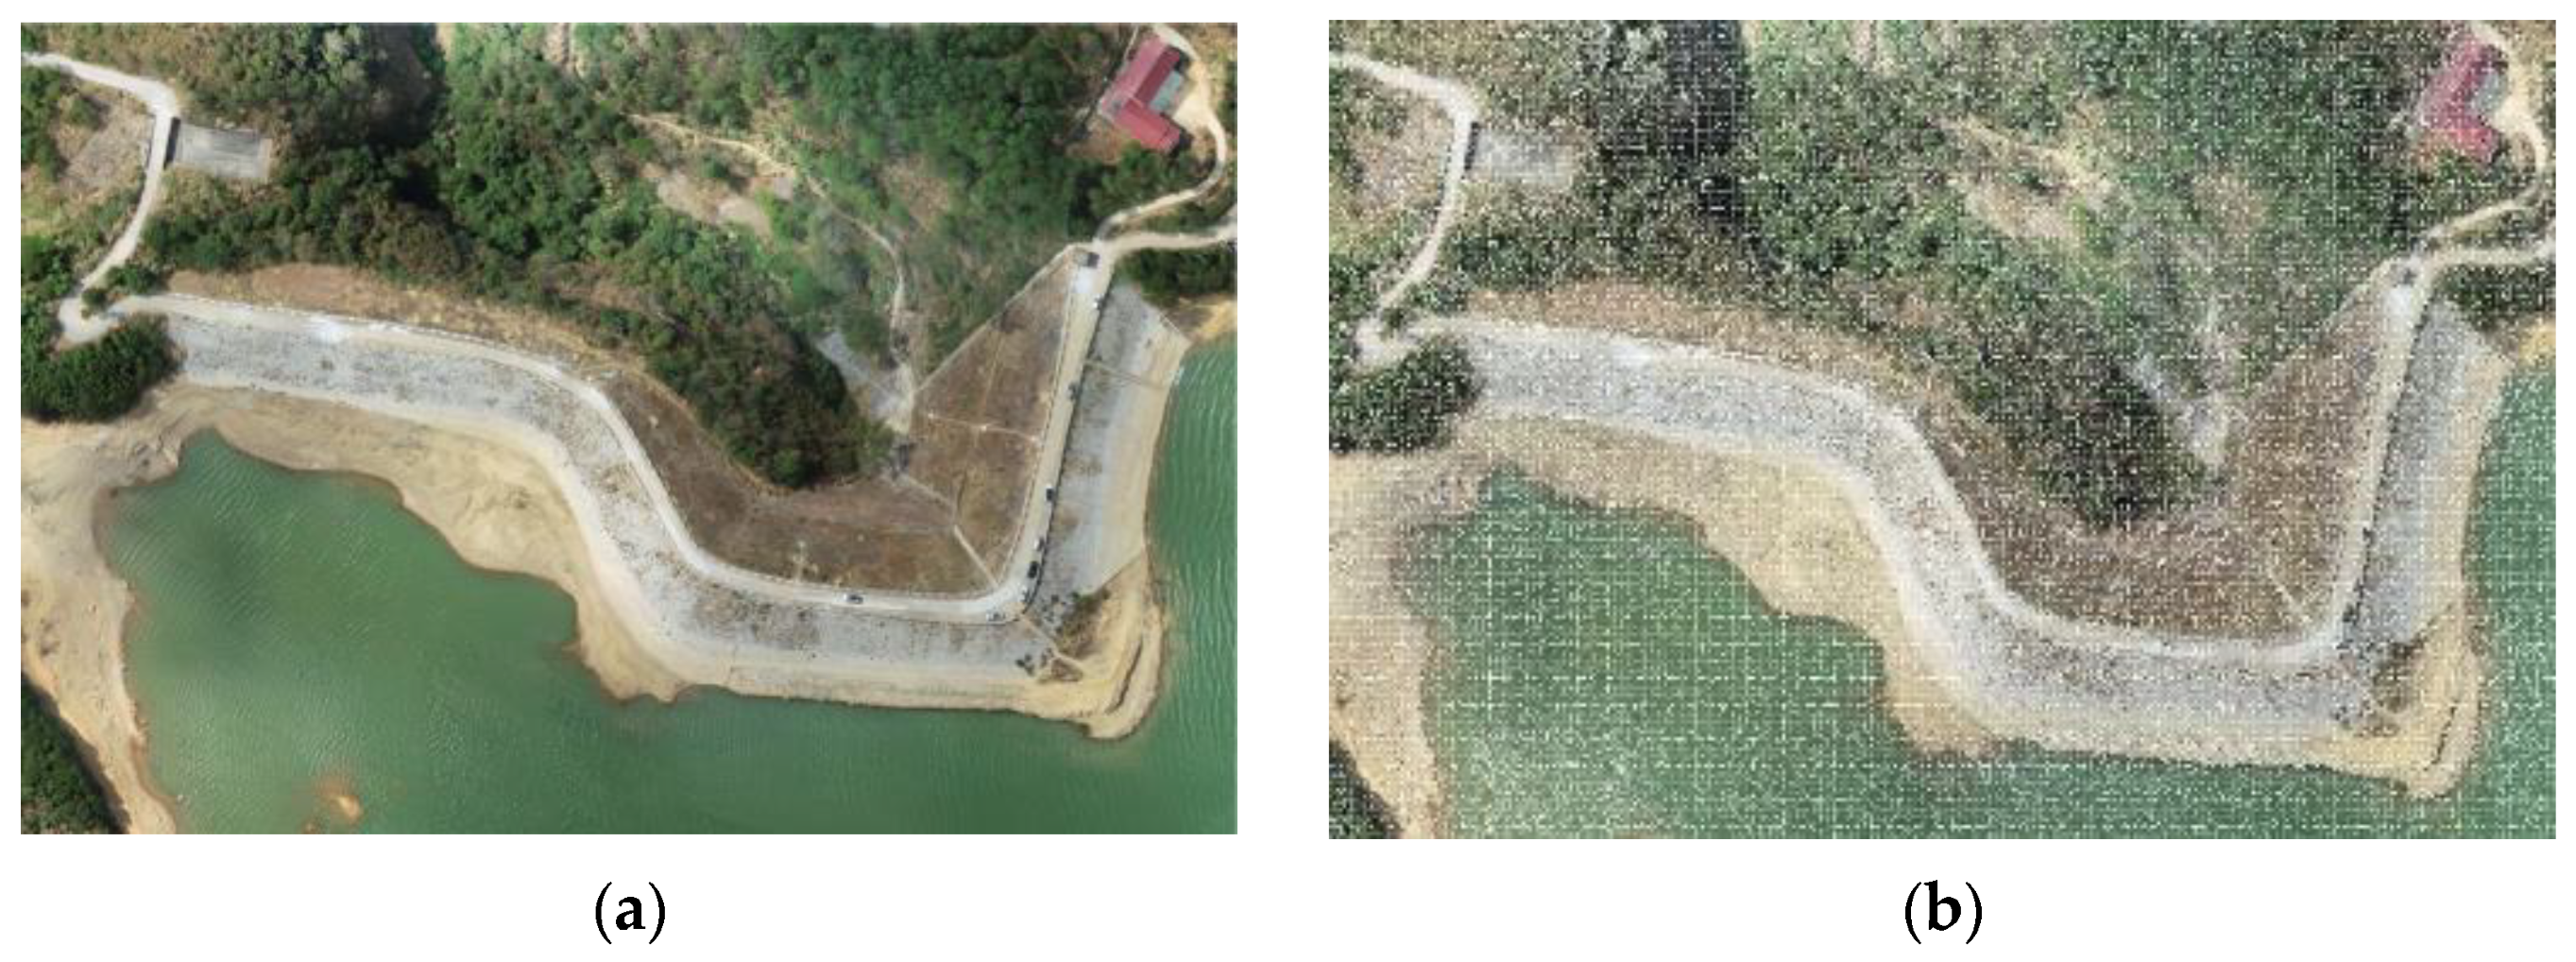
- The acquisition and image preprocessing of high-resolution UAV remote sensing data. Through the actual survey of multiple reservoirs in Guilin, the remote sensing data of two typical reservoir dams were collected by using high-resolution UAV. The data are unique and diverse.
- (2)
- An enhanced GrabCut that fuse with the LSC superpixel mapping matrix and the Sobel edge operator is proposed to extract the features of reservoir dams. The edge operator is introduced into GrabCut to redefine the new energy function’s smooth item, which makes the segmentation results of enhanced GrabCut more robust and accurate. Then, through image registration, the multitemporal dam extraction results are unified to the same coordinate system to complete the difference operation, and finally, the dam remote sensing image change results are obtained.
- (3)
- A precision analysis and evaluation of the experimental results.
2. Related Work
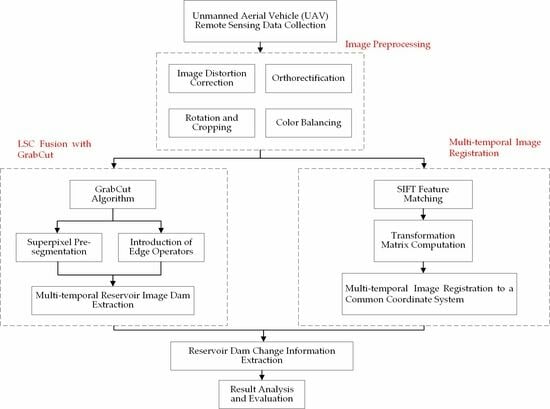
3. Methods
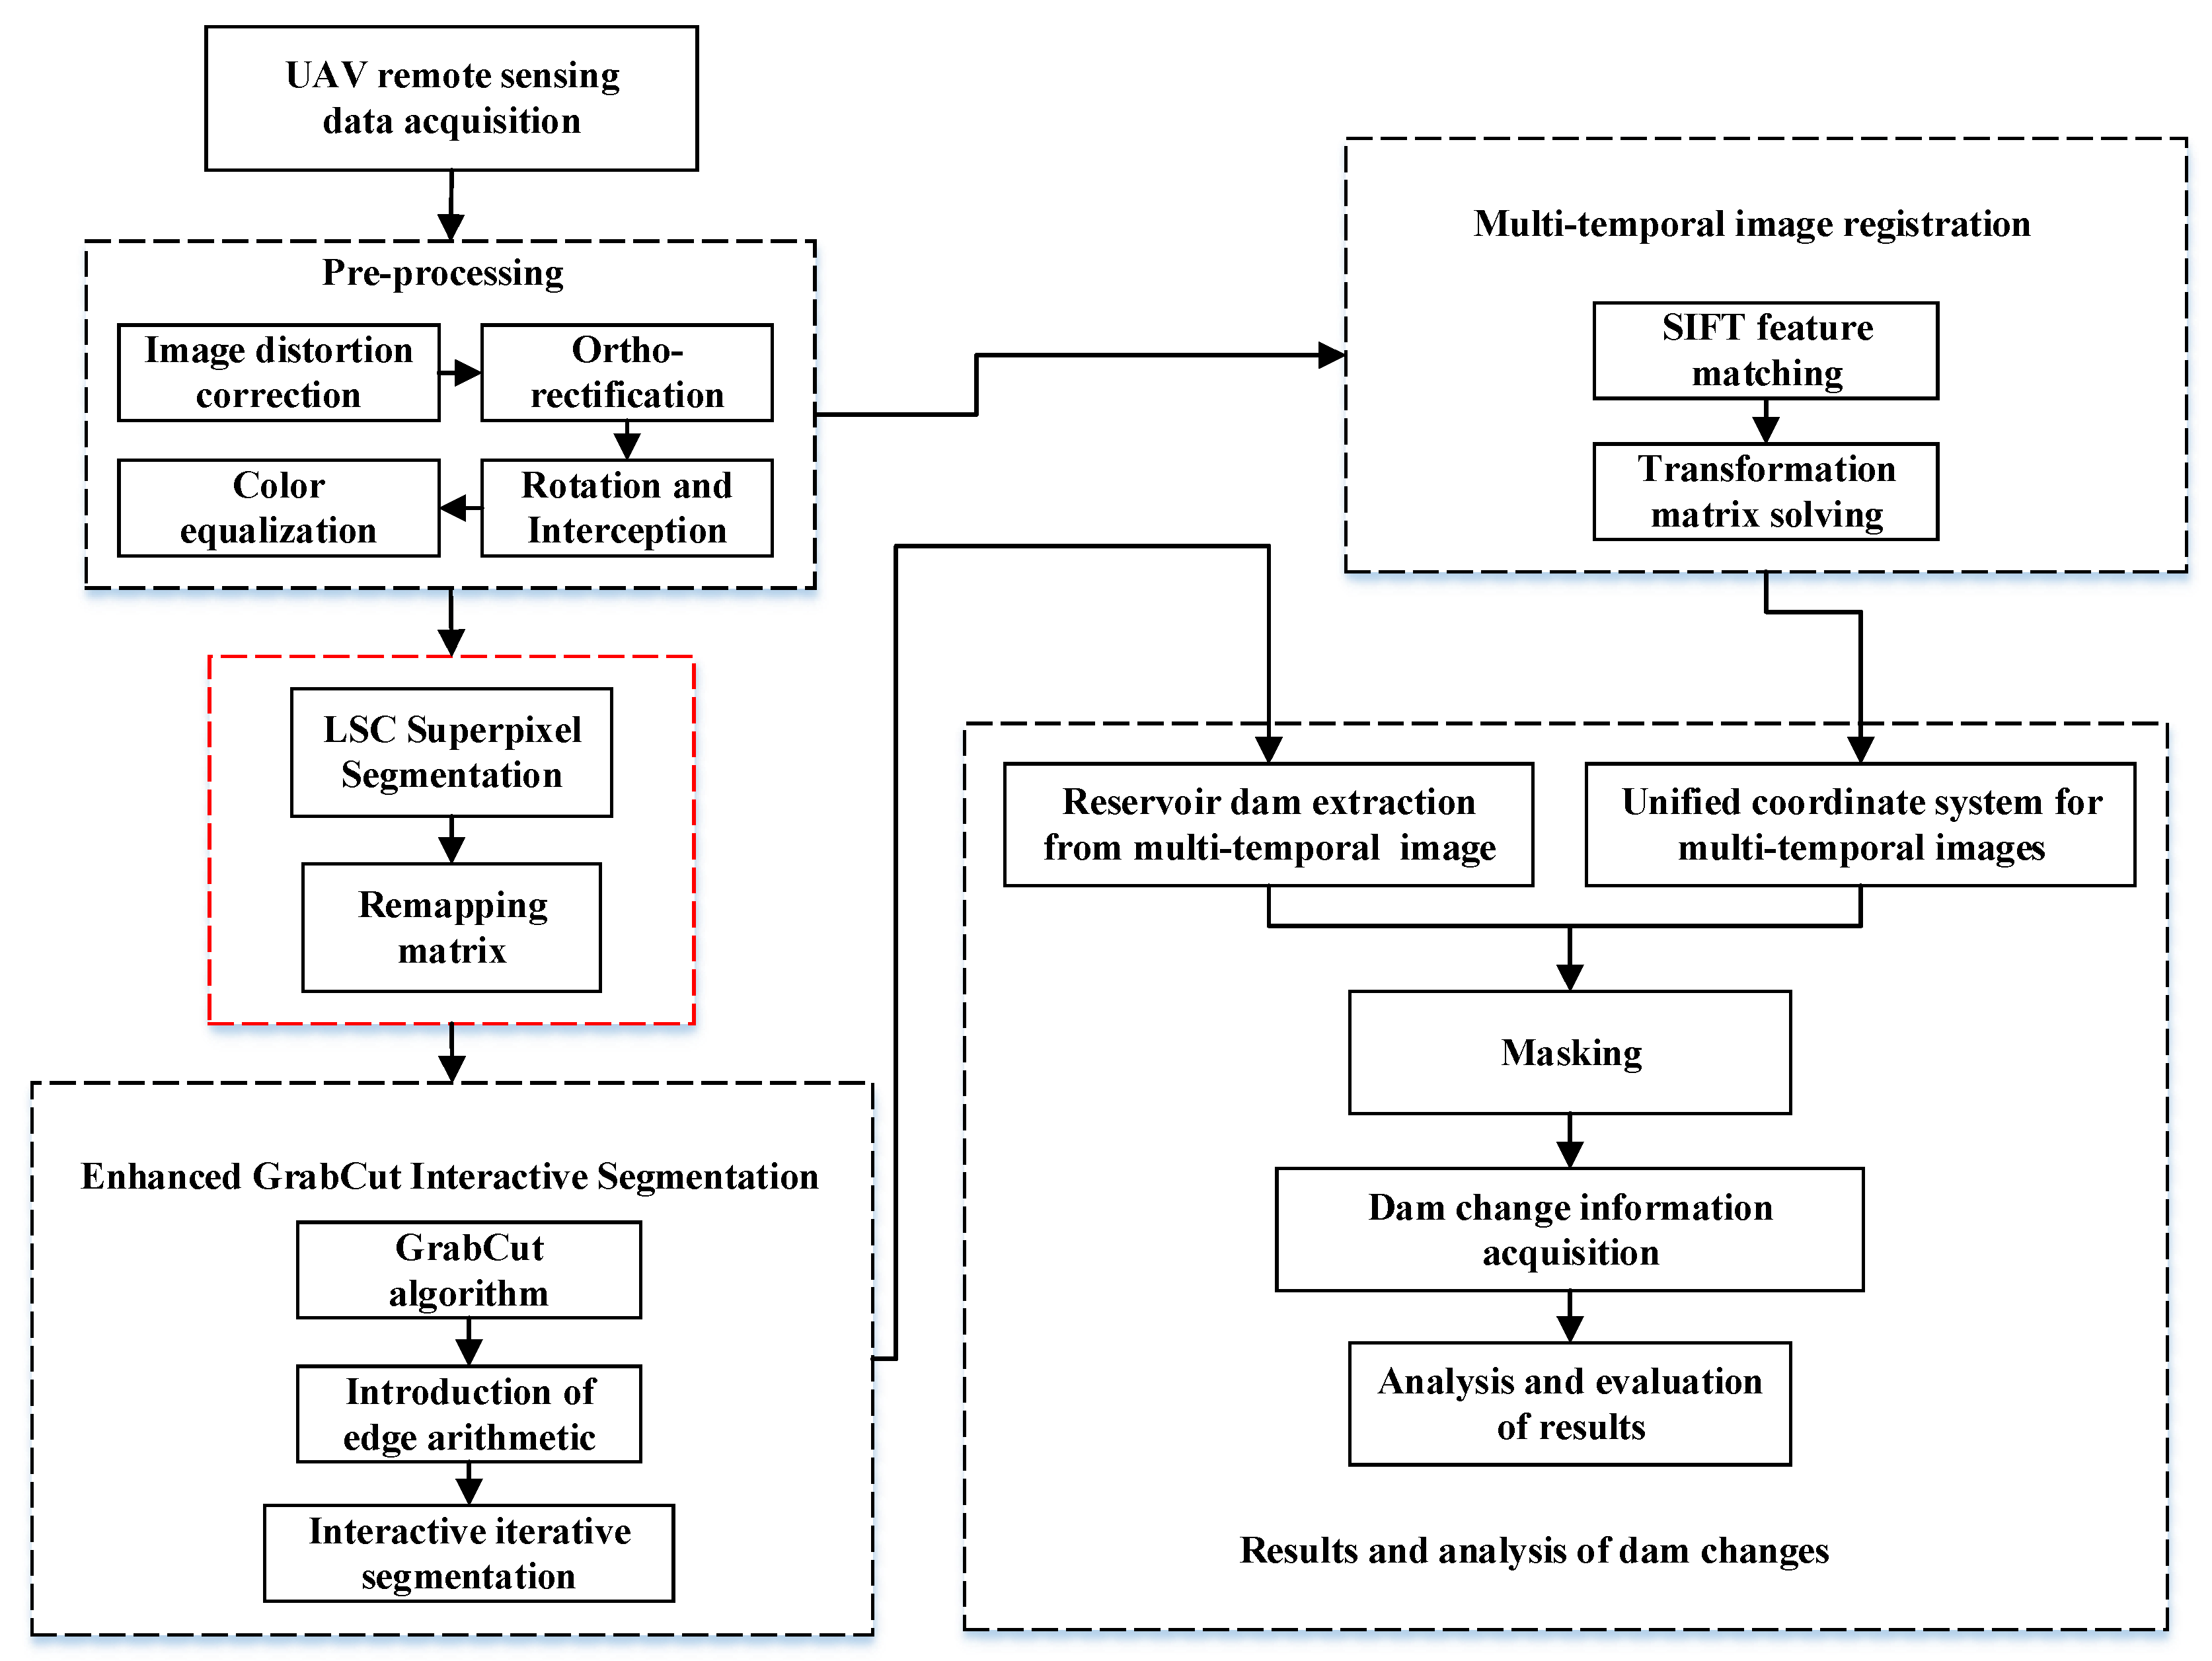
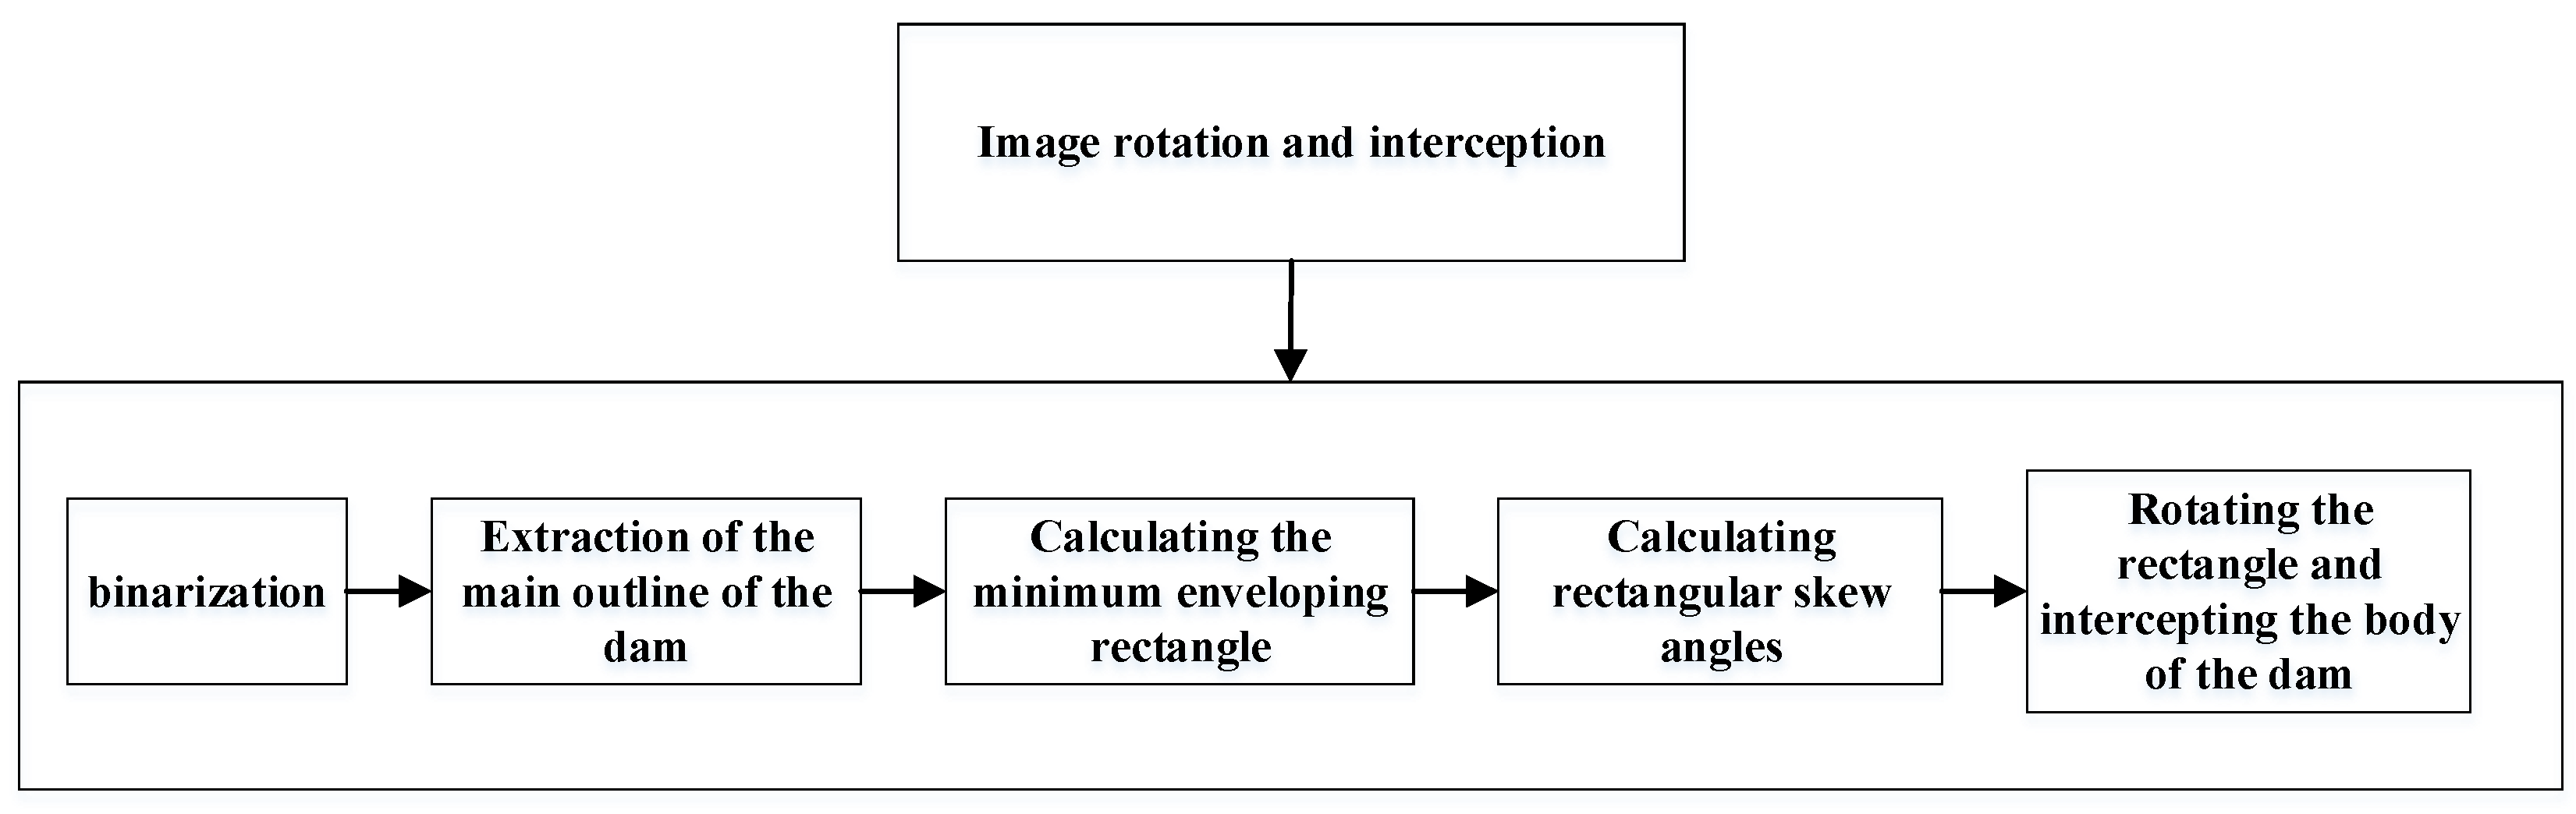
3.1. Image Preprocessing
3.2. The Fusion of Sobel Edge Operator and Enhanced GrabCut
- Input the image for processing;
- Perform a superpixel segmentation;
- Label each pixel block in the superpixel segmentation result, mark the subpixels it contains and generate a new mapping matrix by arranging the pixels according to the arrangement rules in the superpixel segmentation result;
- Input the image into enhanced GrabCut for the interactive segmentation;
- Obtain the segmentation result, then refill the image based on the subpixels indexed in the superpixel blocks of the superpixel result to restore the resolution;
- Output the result.
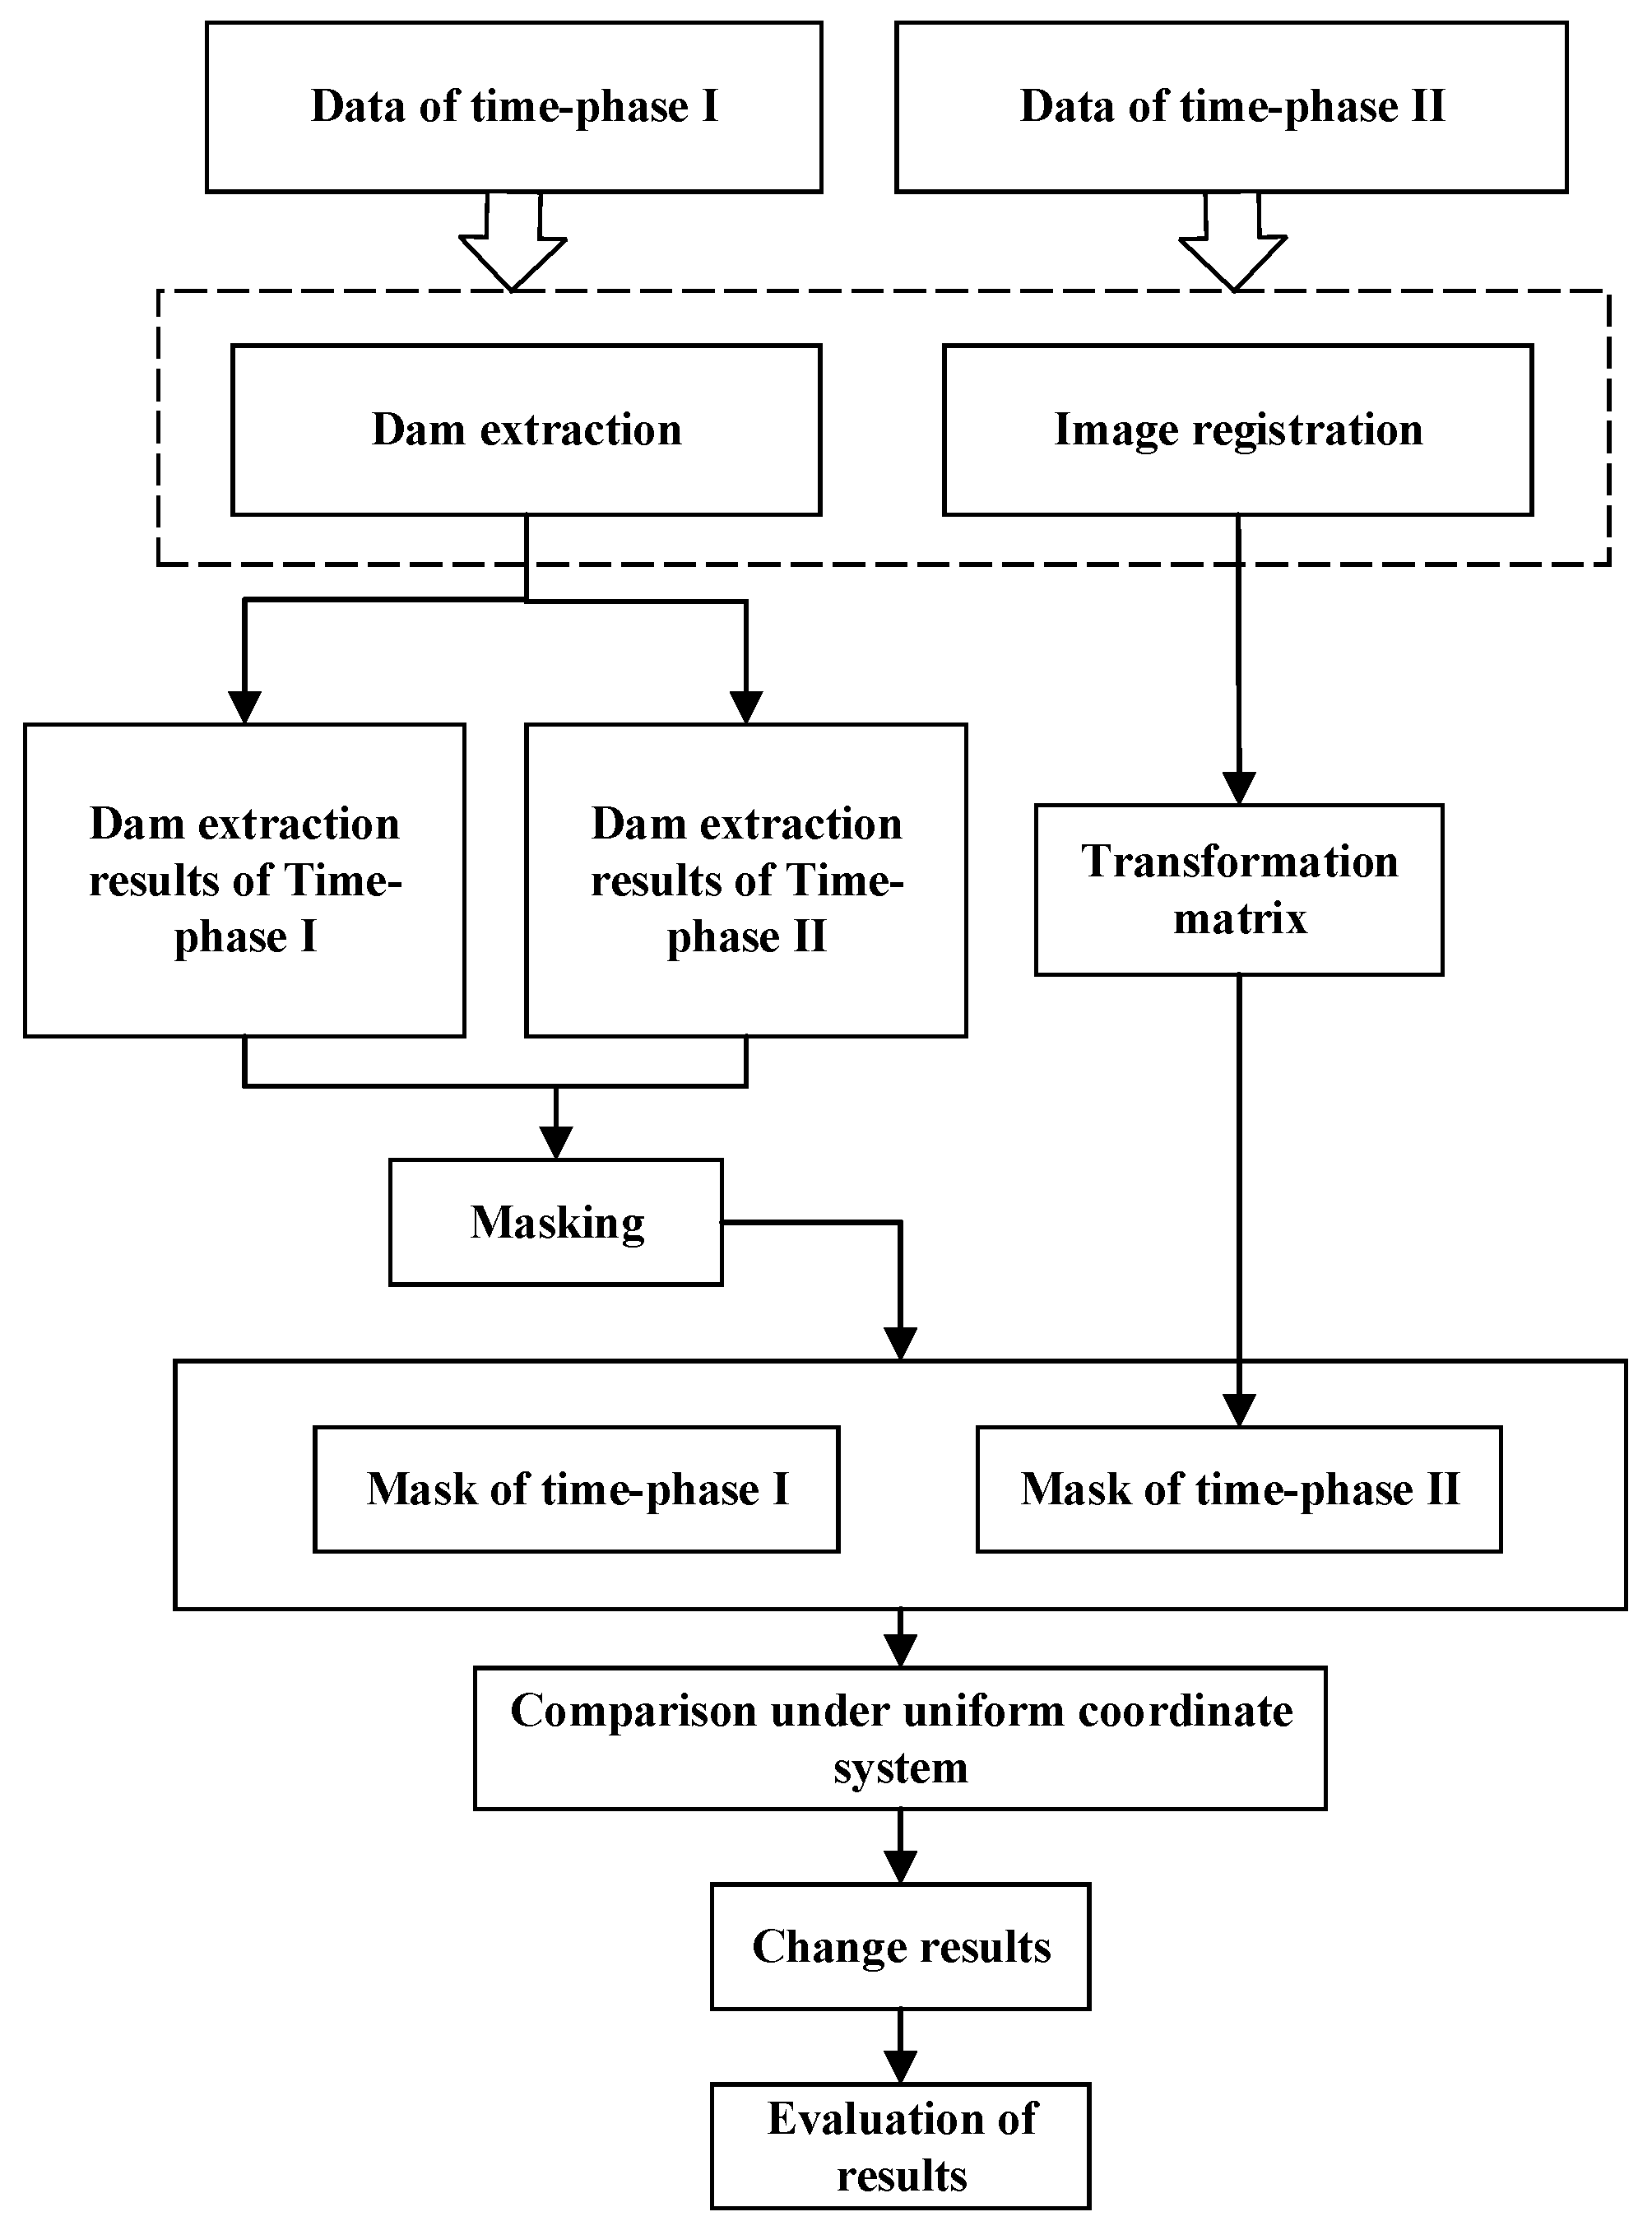
3.3. Image Registration and Change Detection
4. Experiments
4.1. Dataset
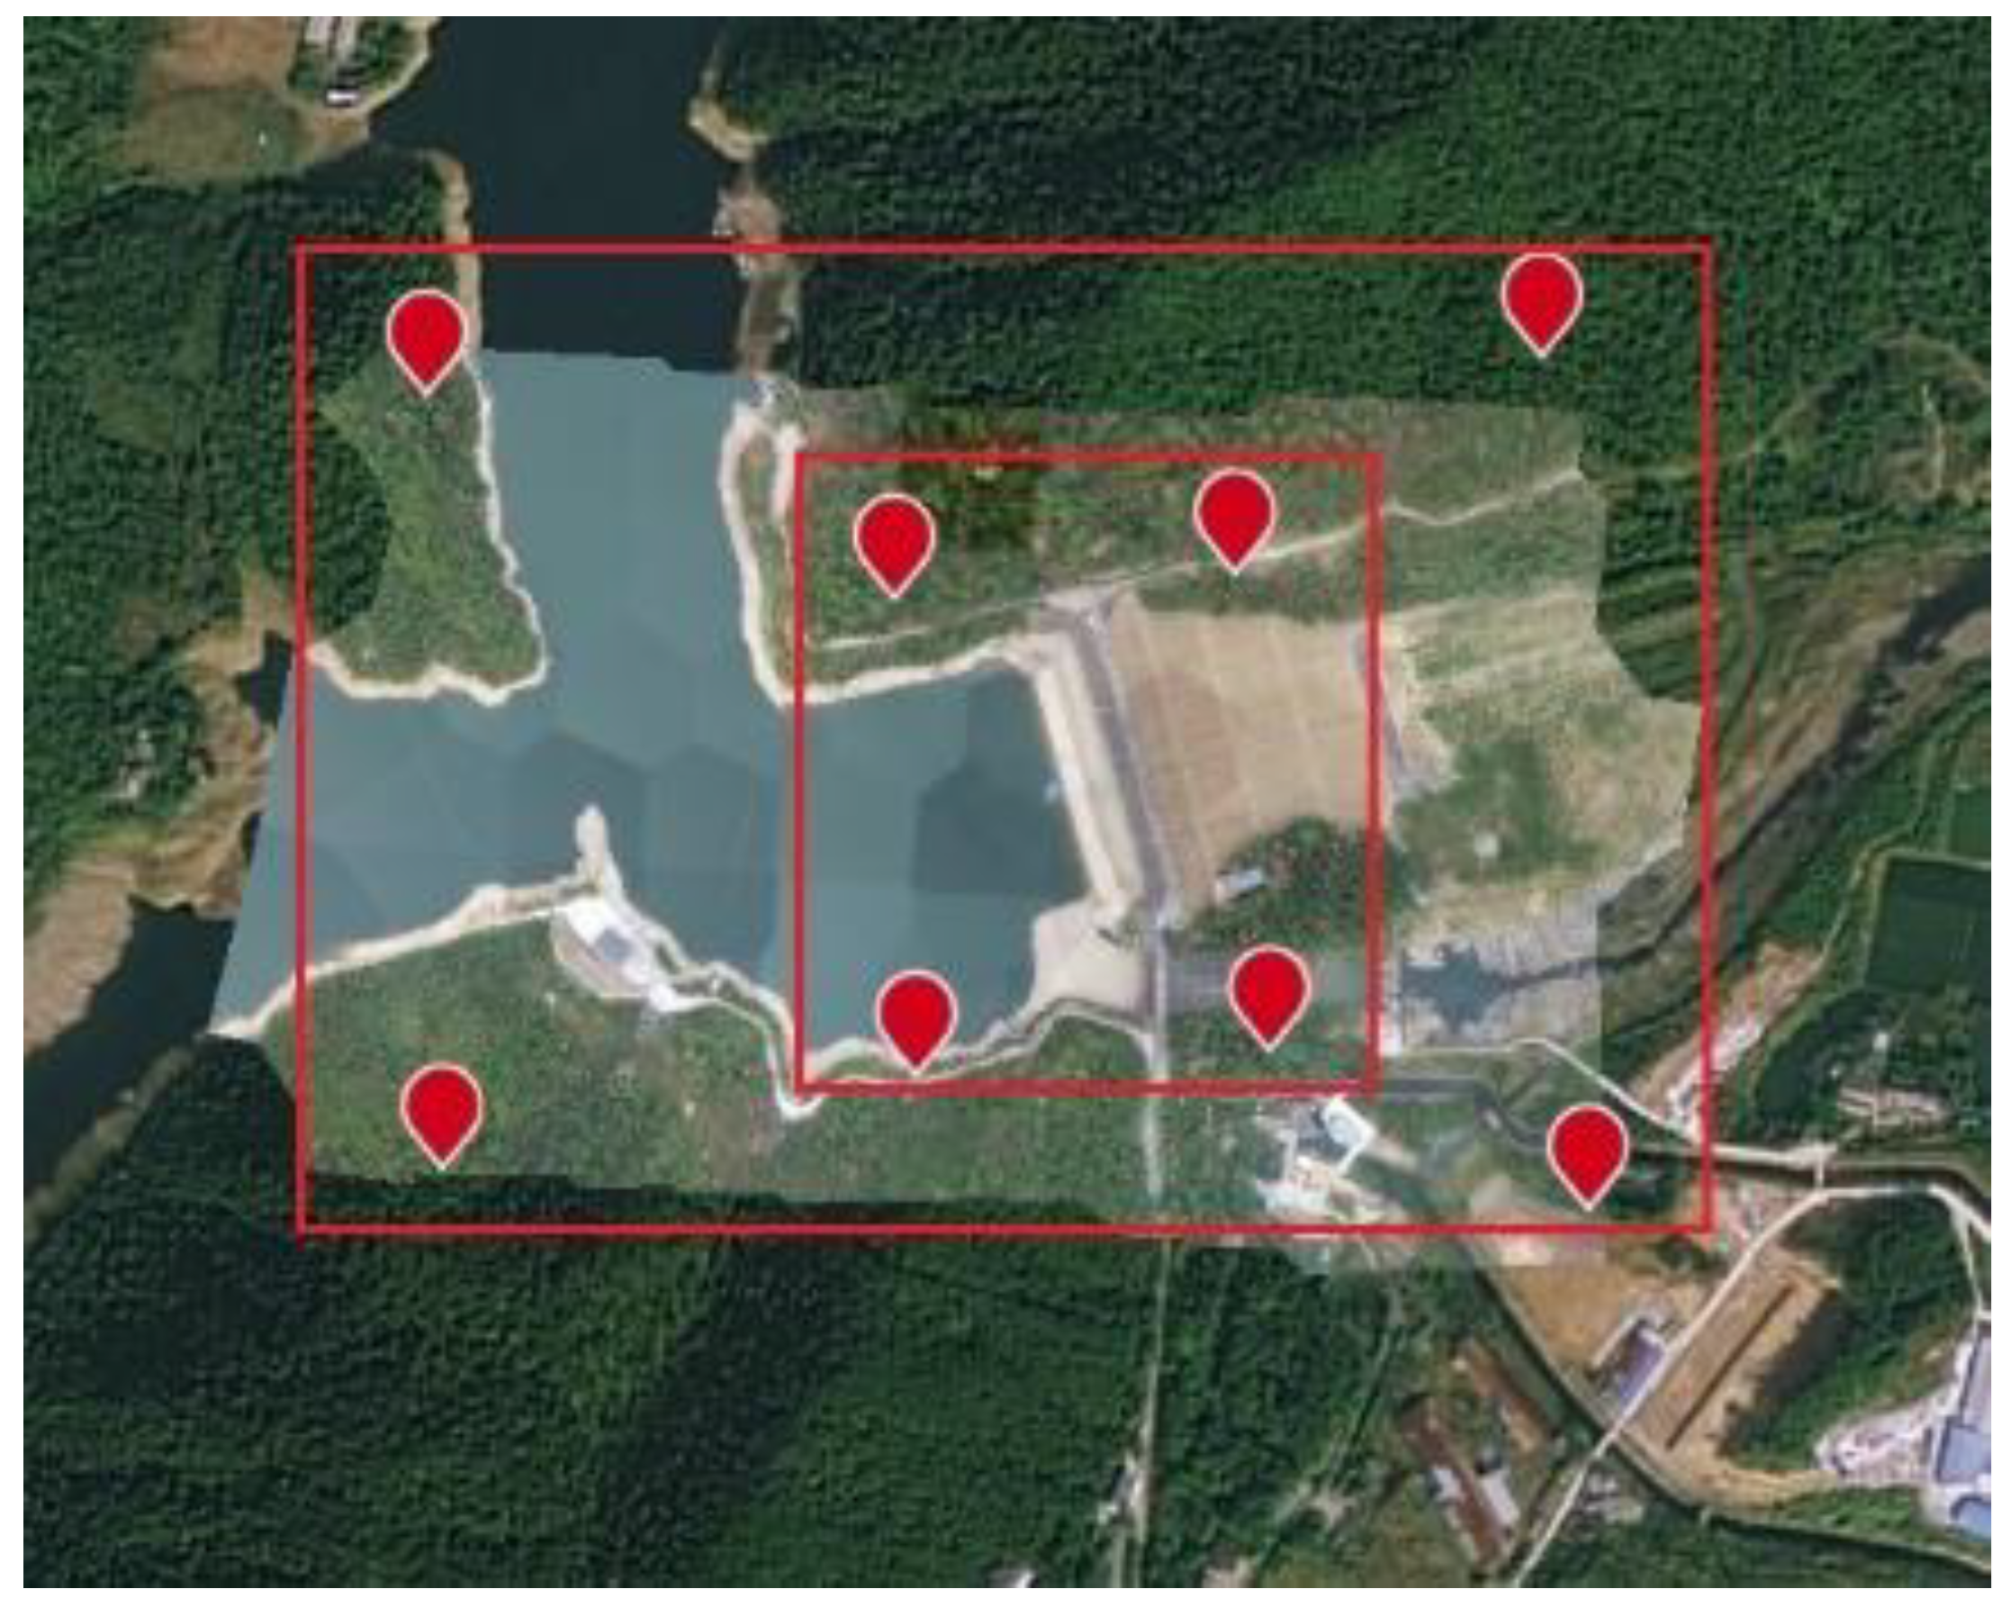
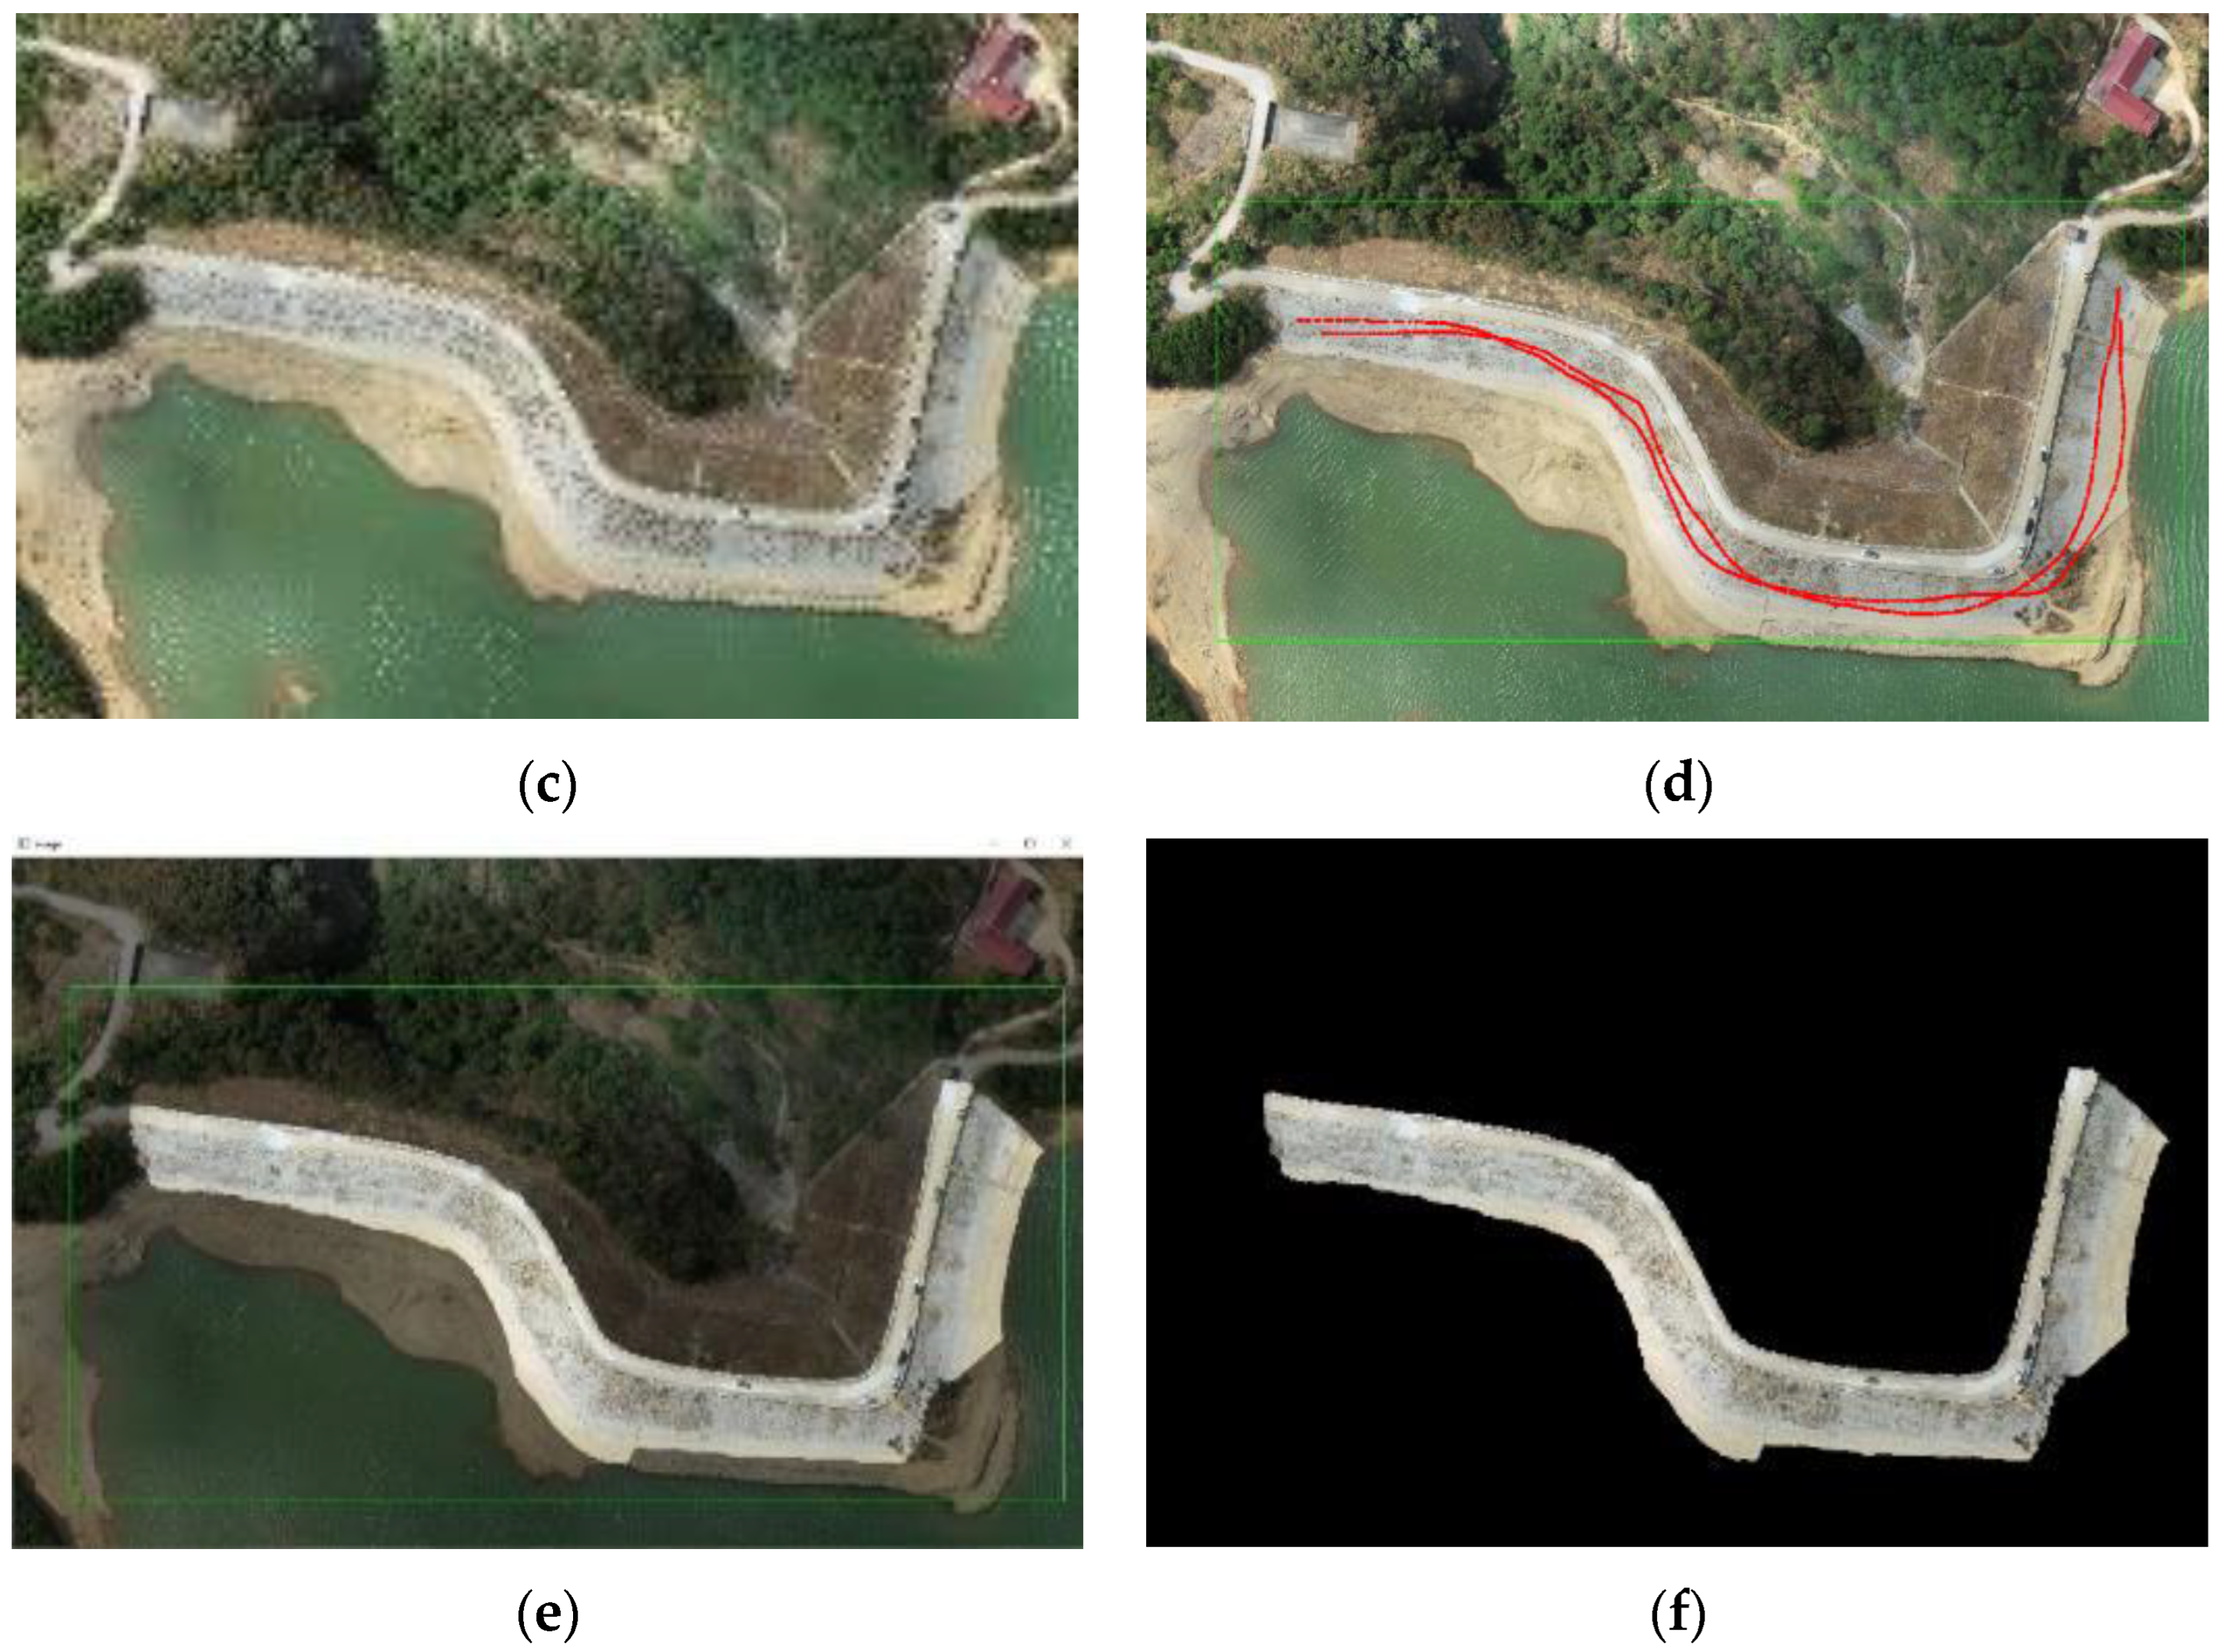
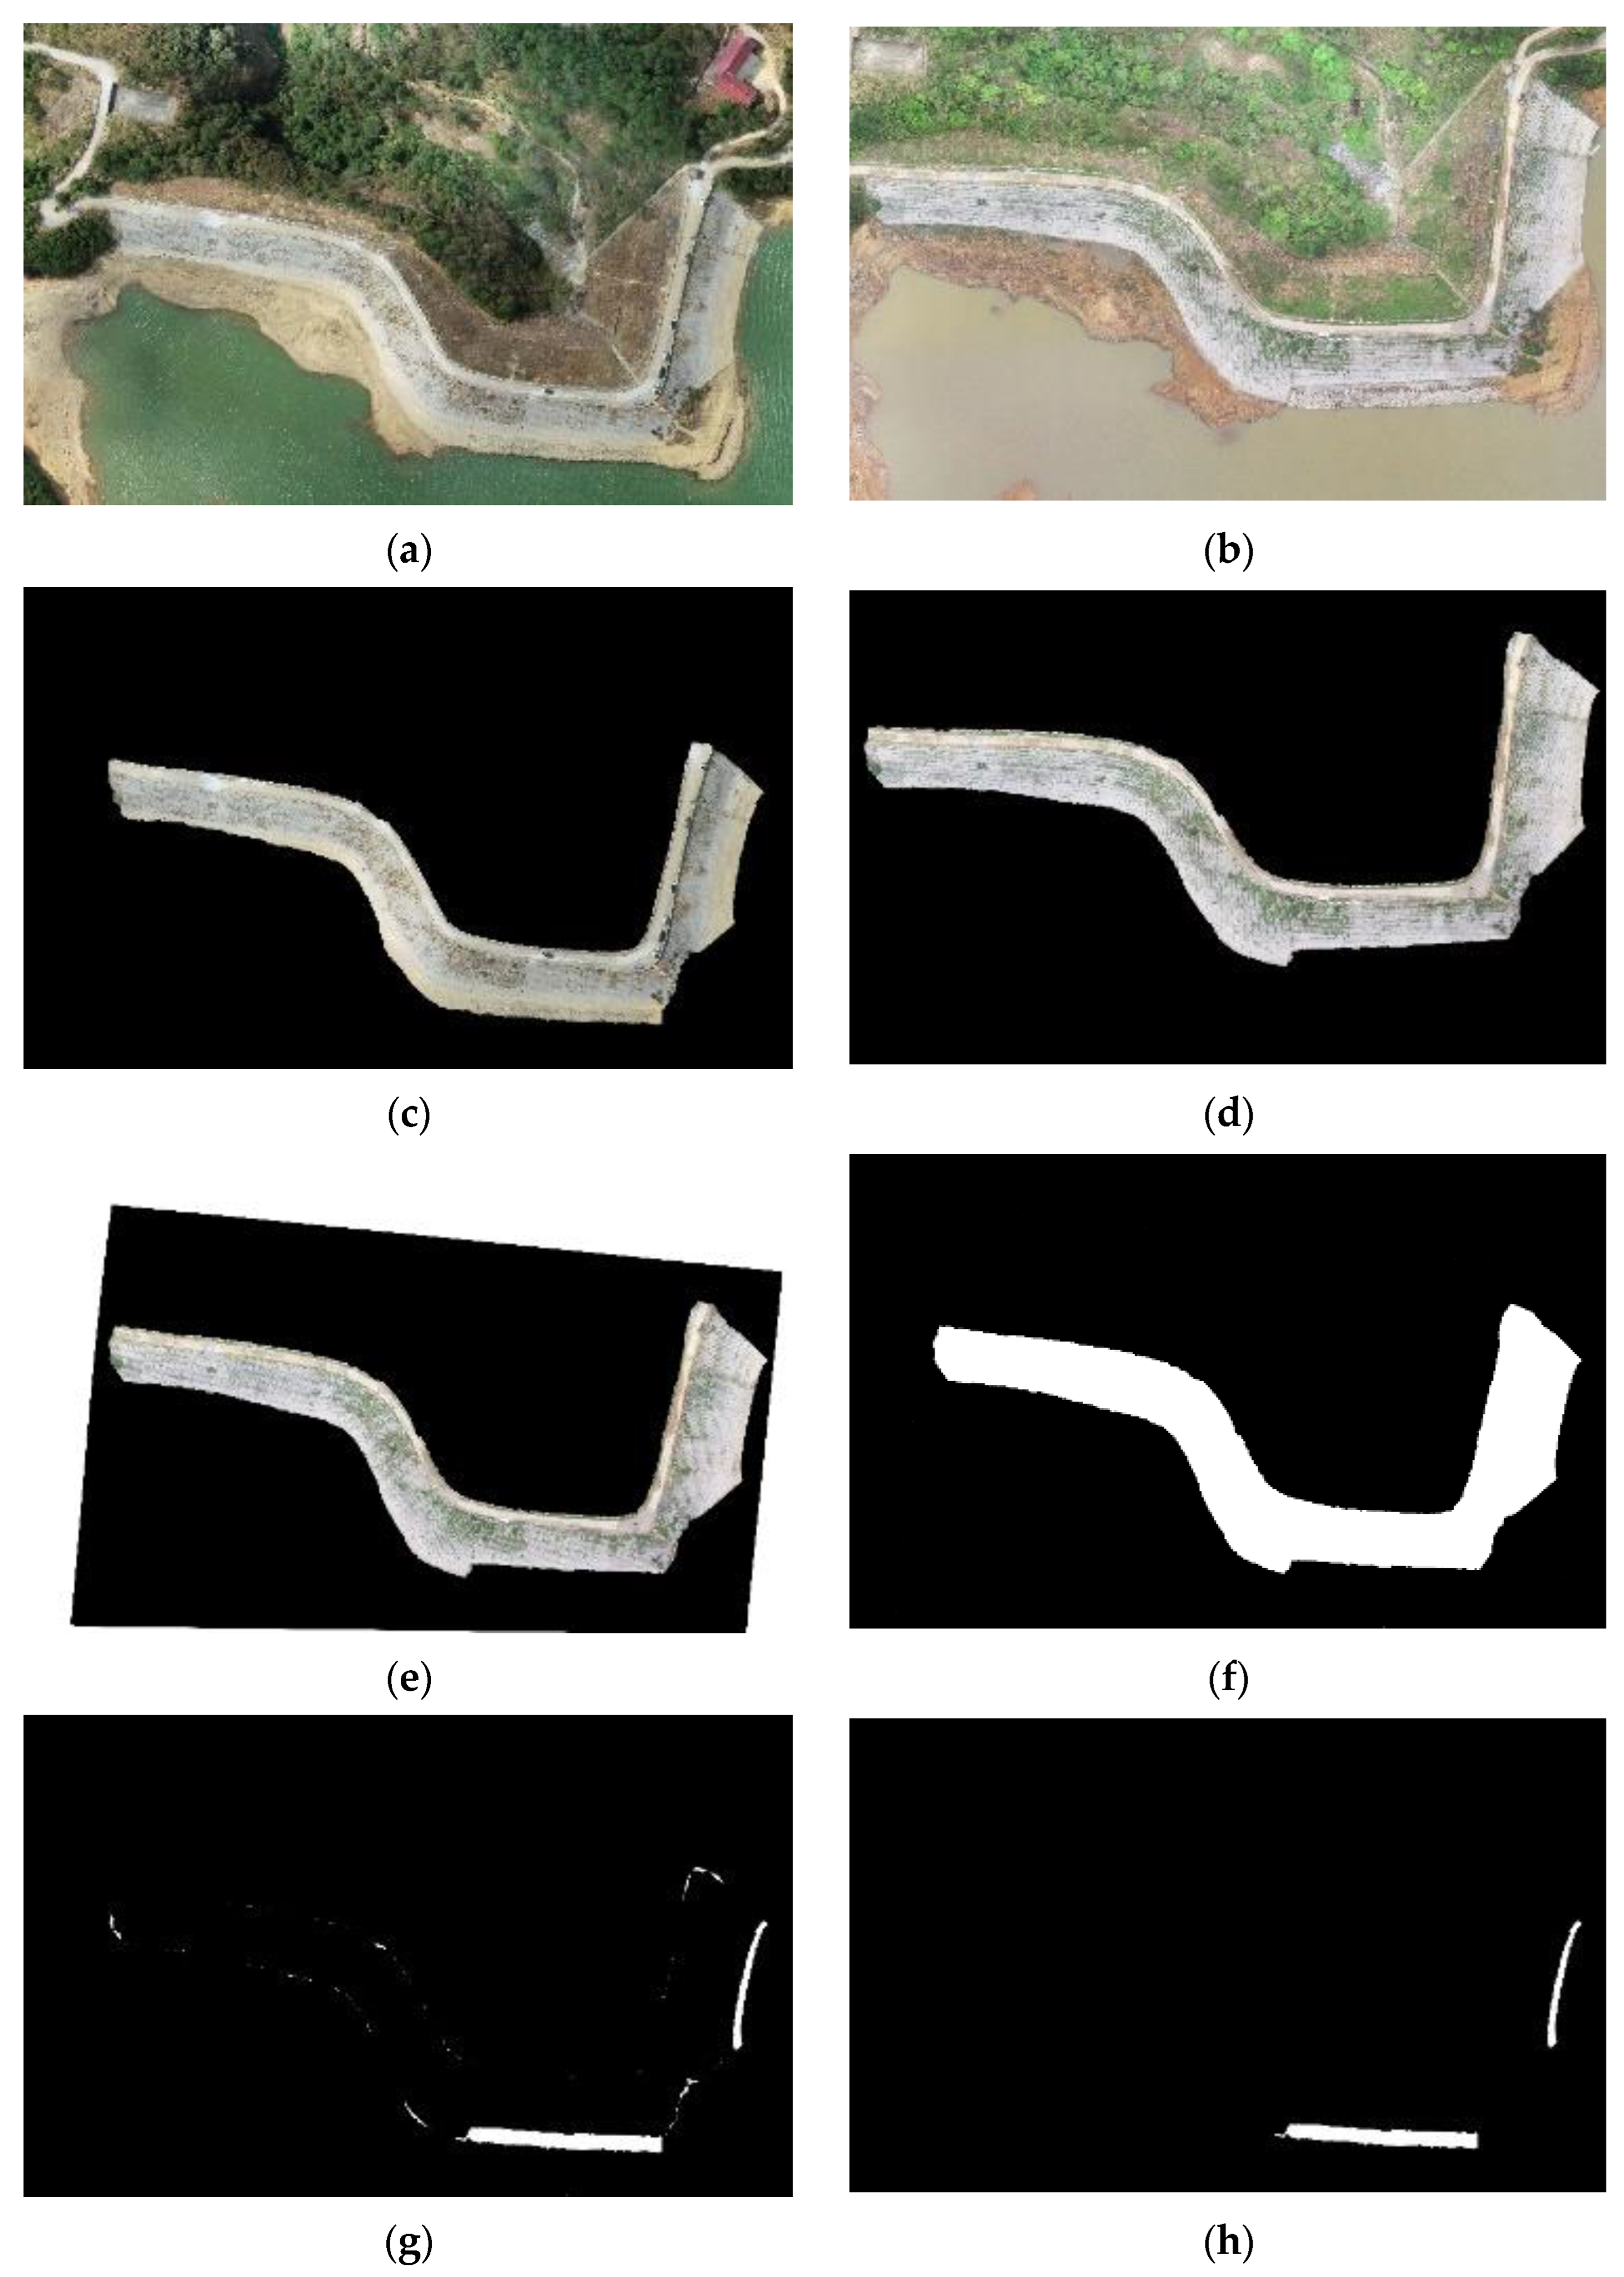
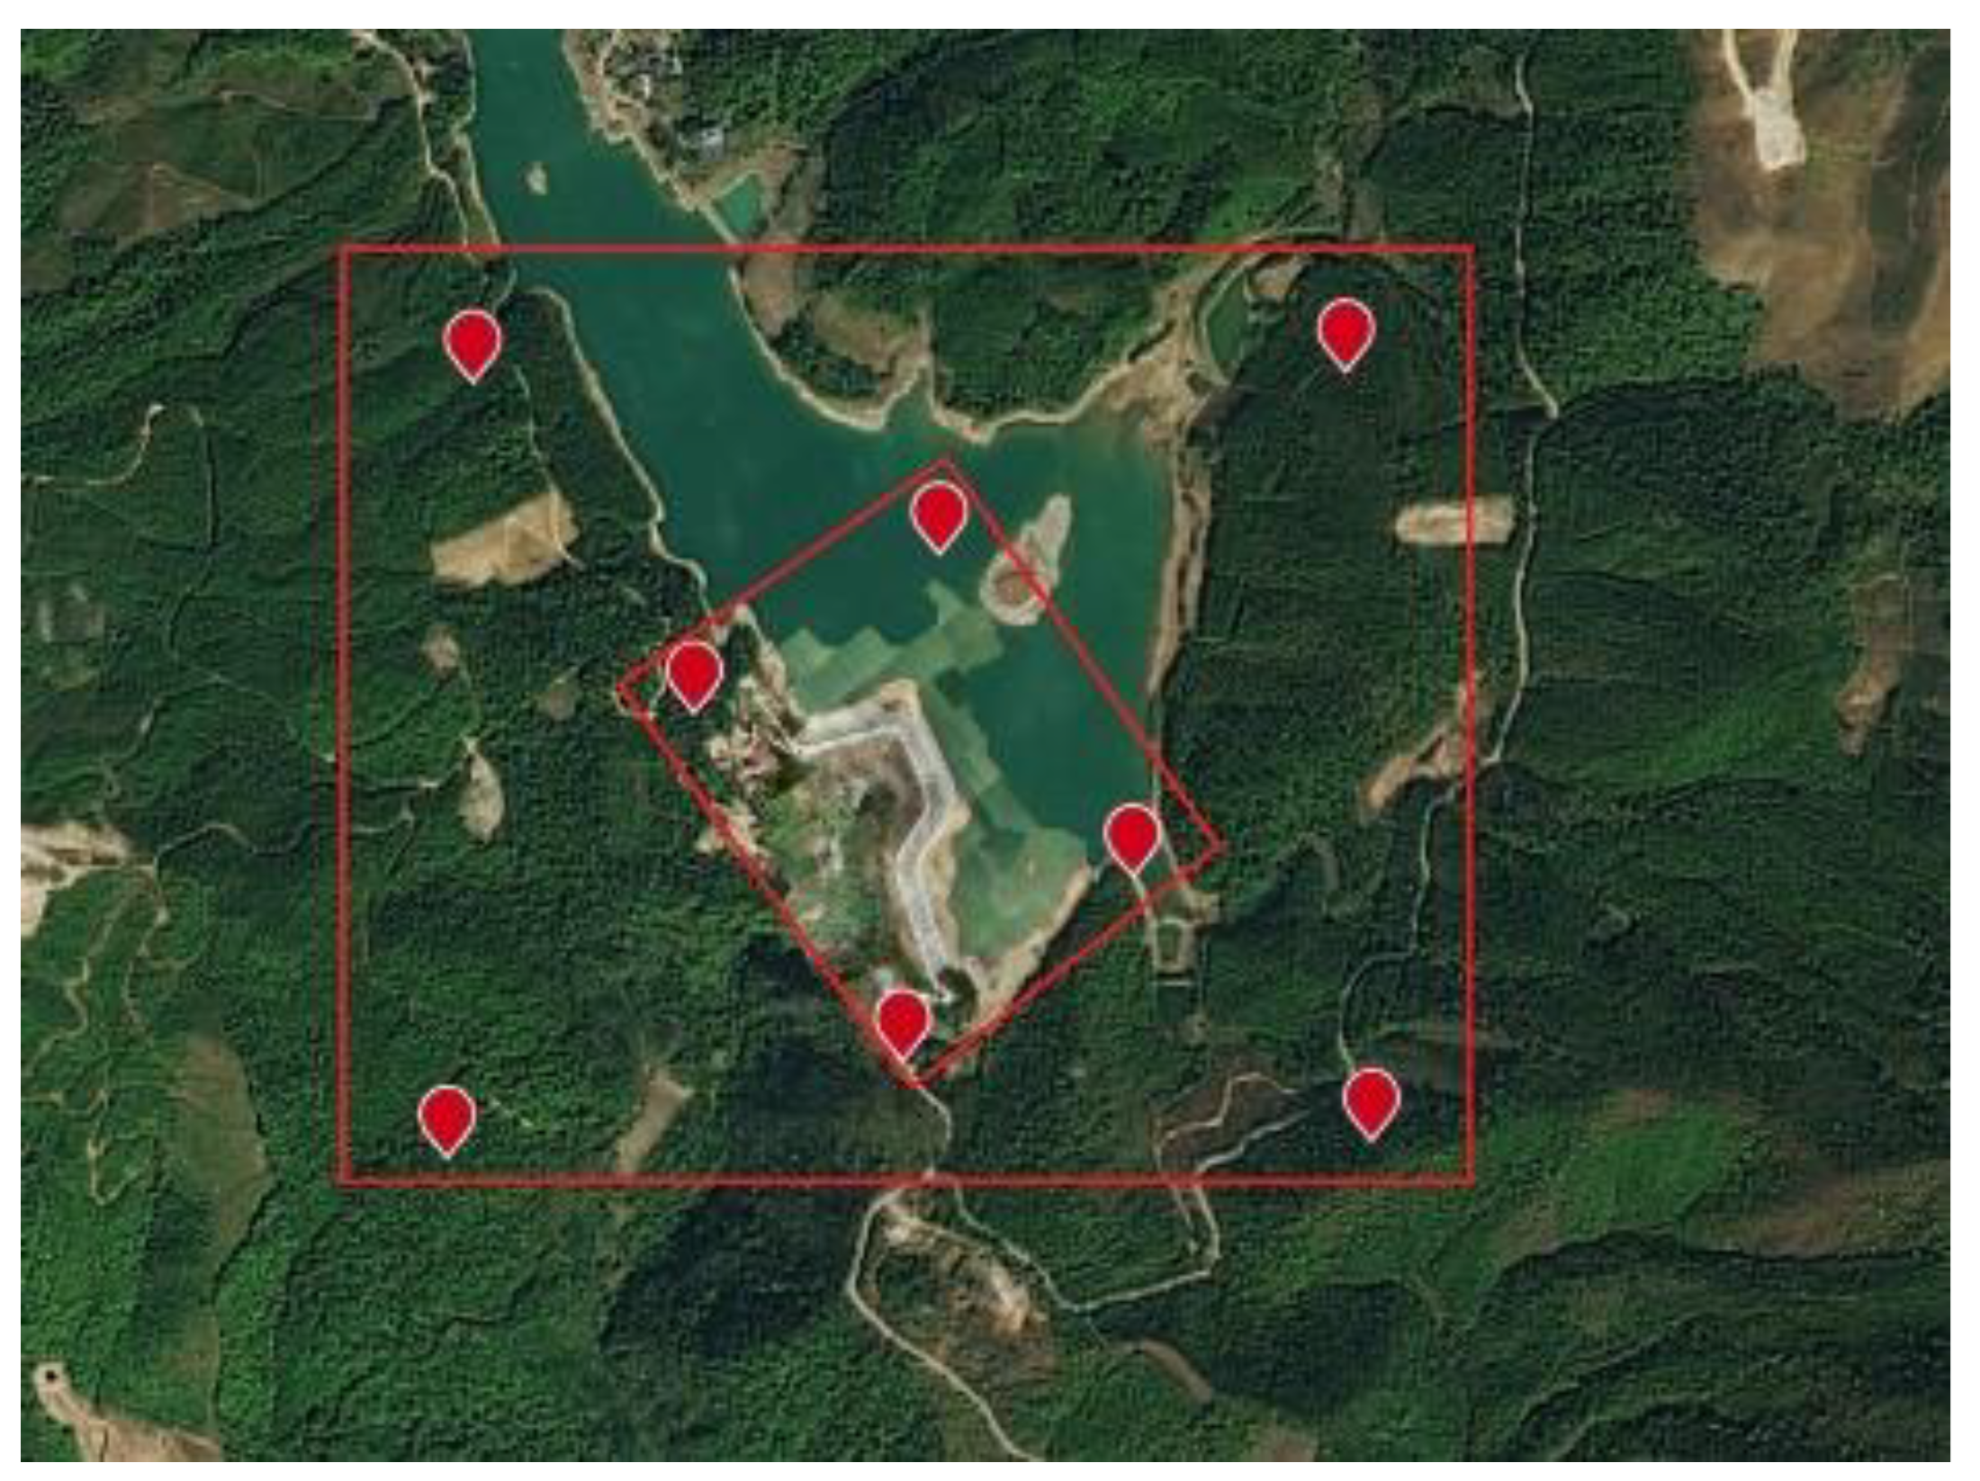
4.1.1. Data of Dalingtou Reservoir Dam
4.1.2. Data of Qingshitan Reservoir
4.2. Implementation Details
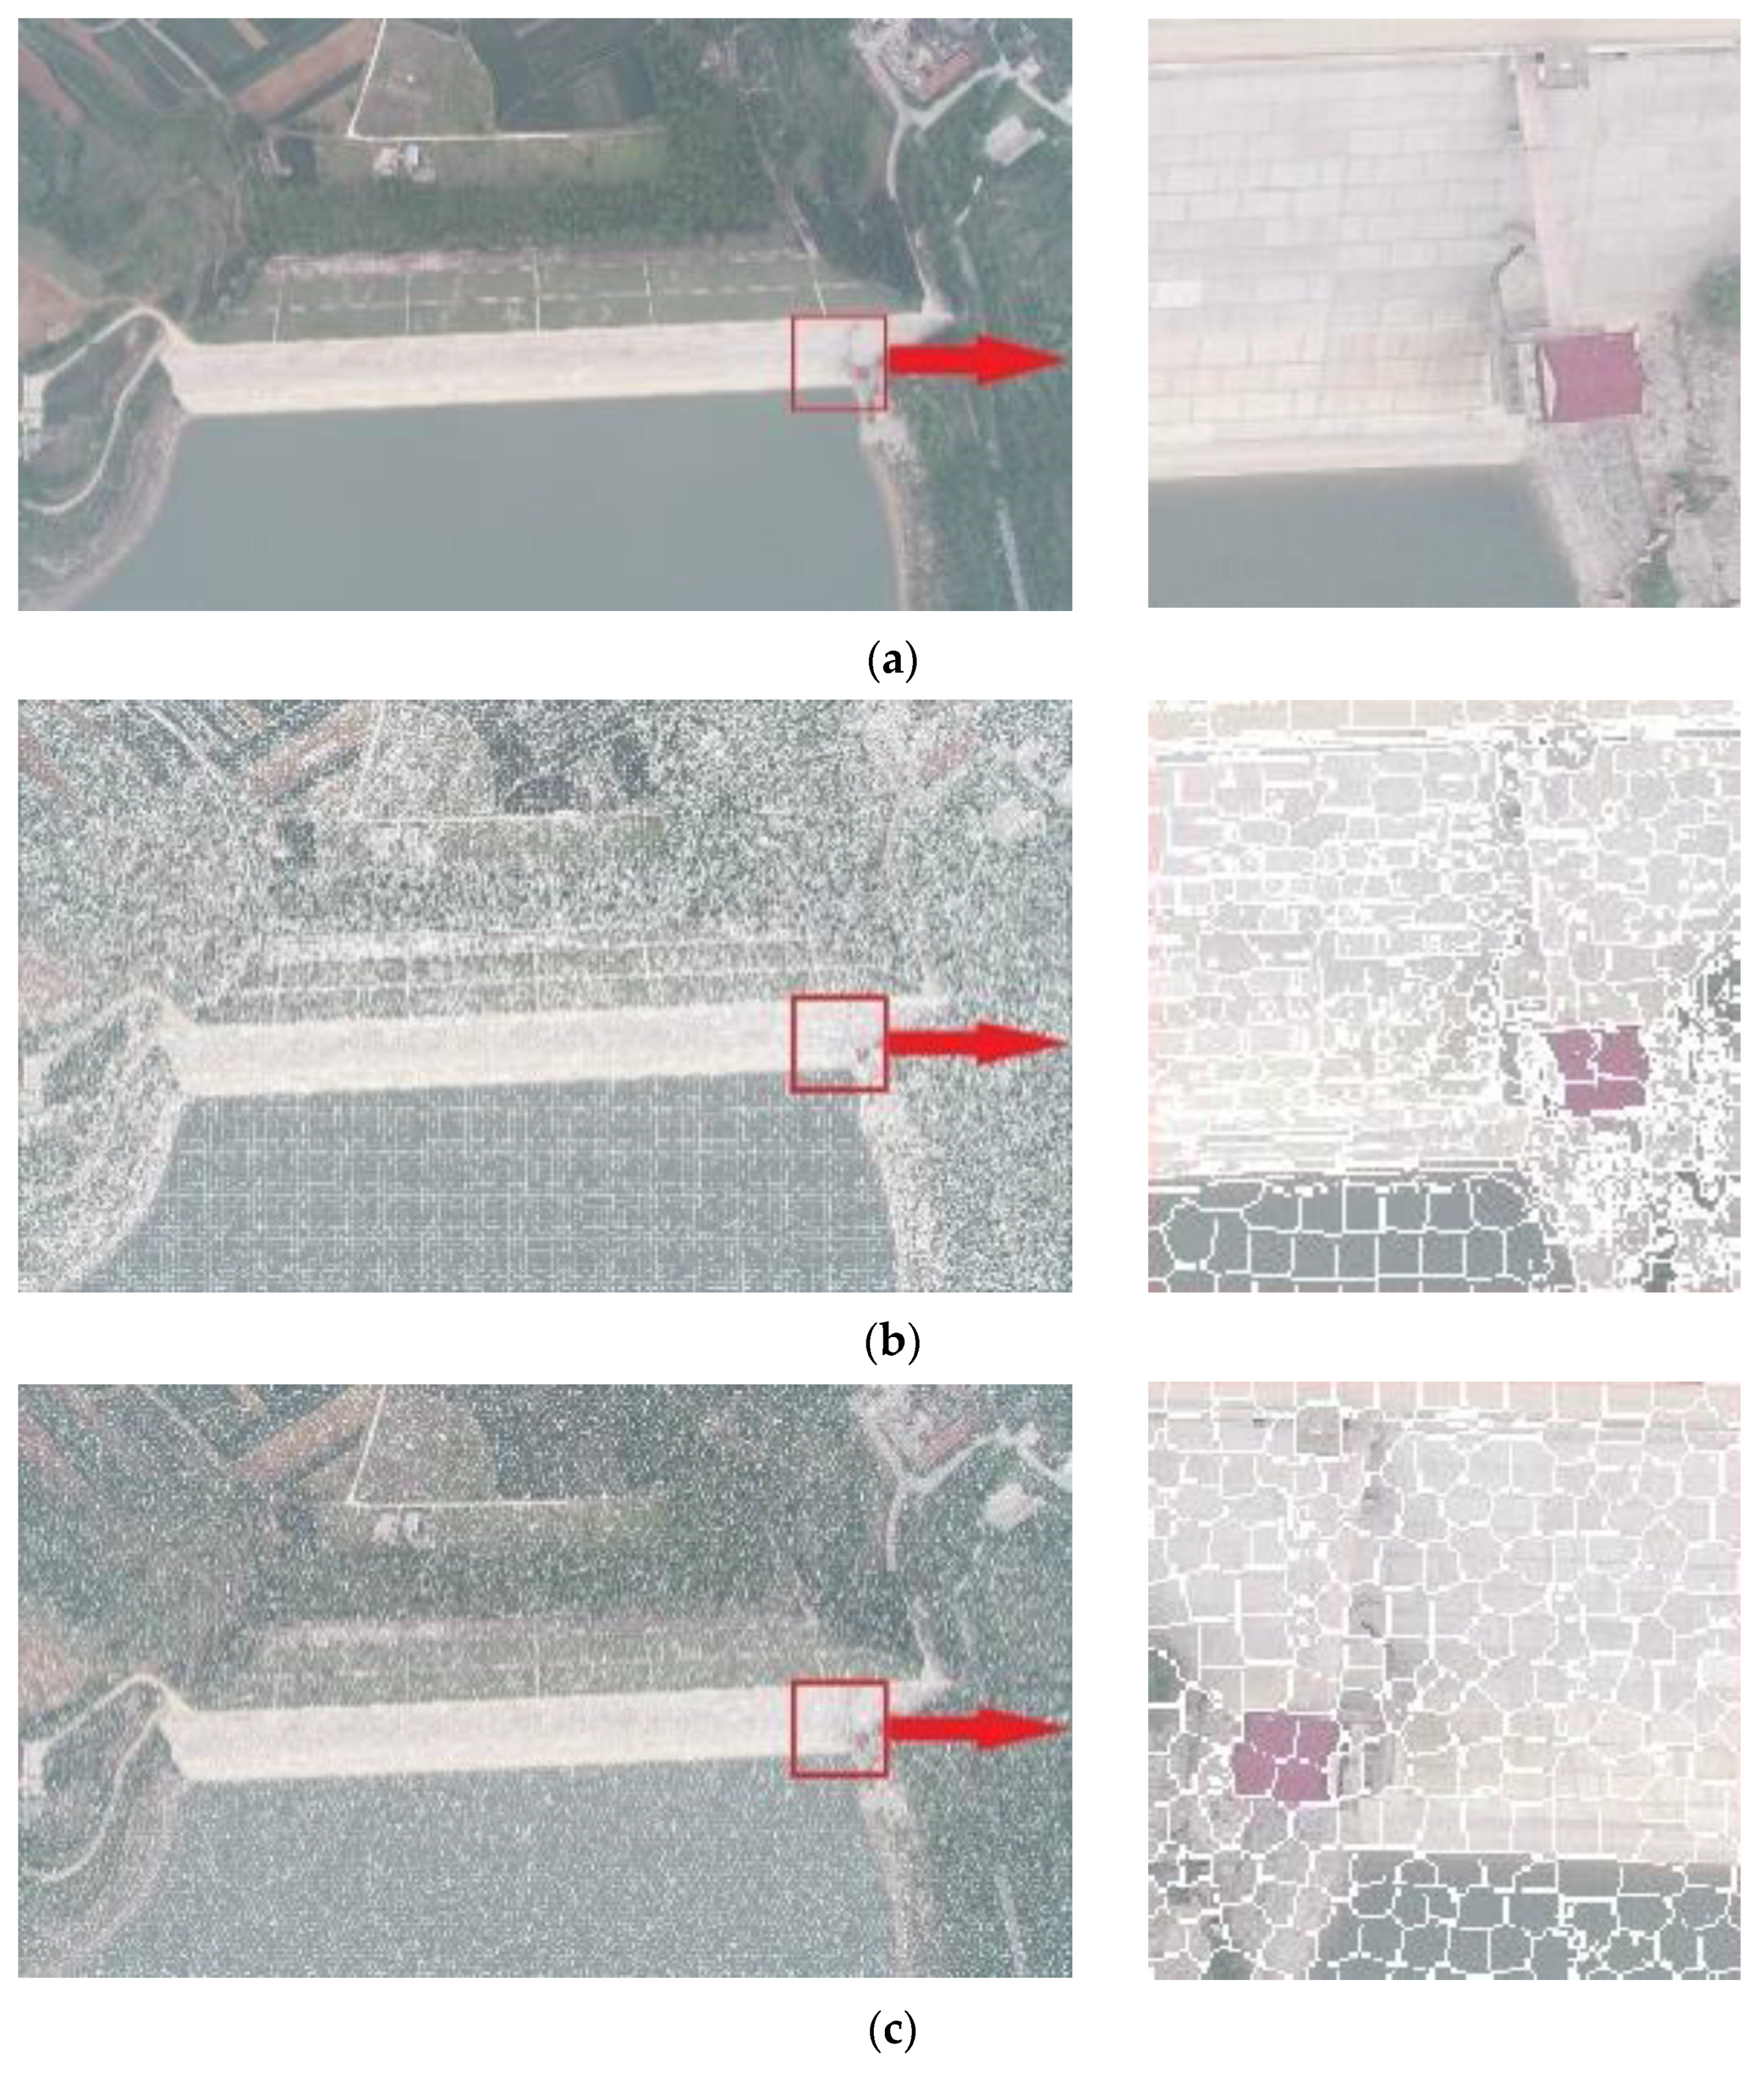
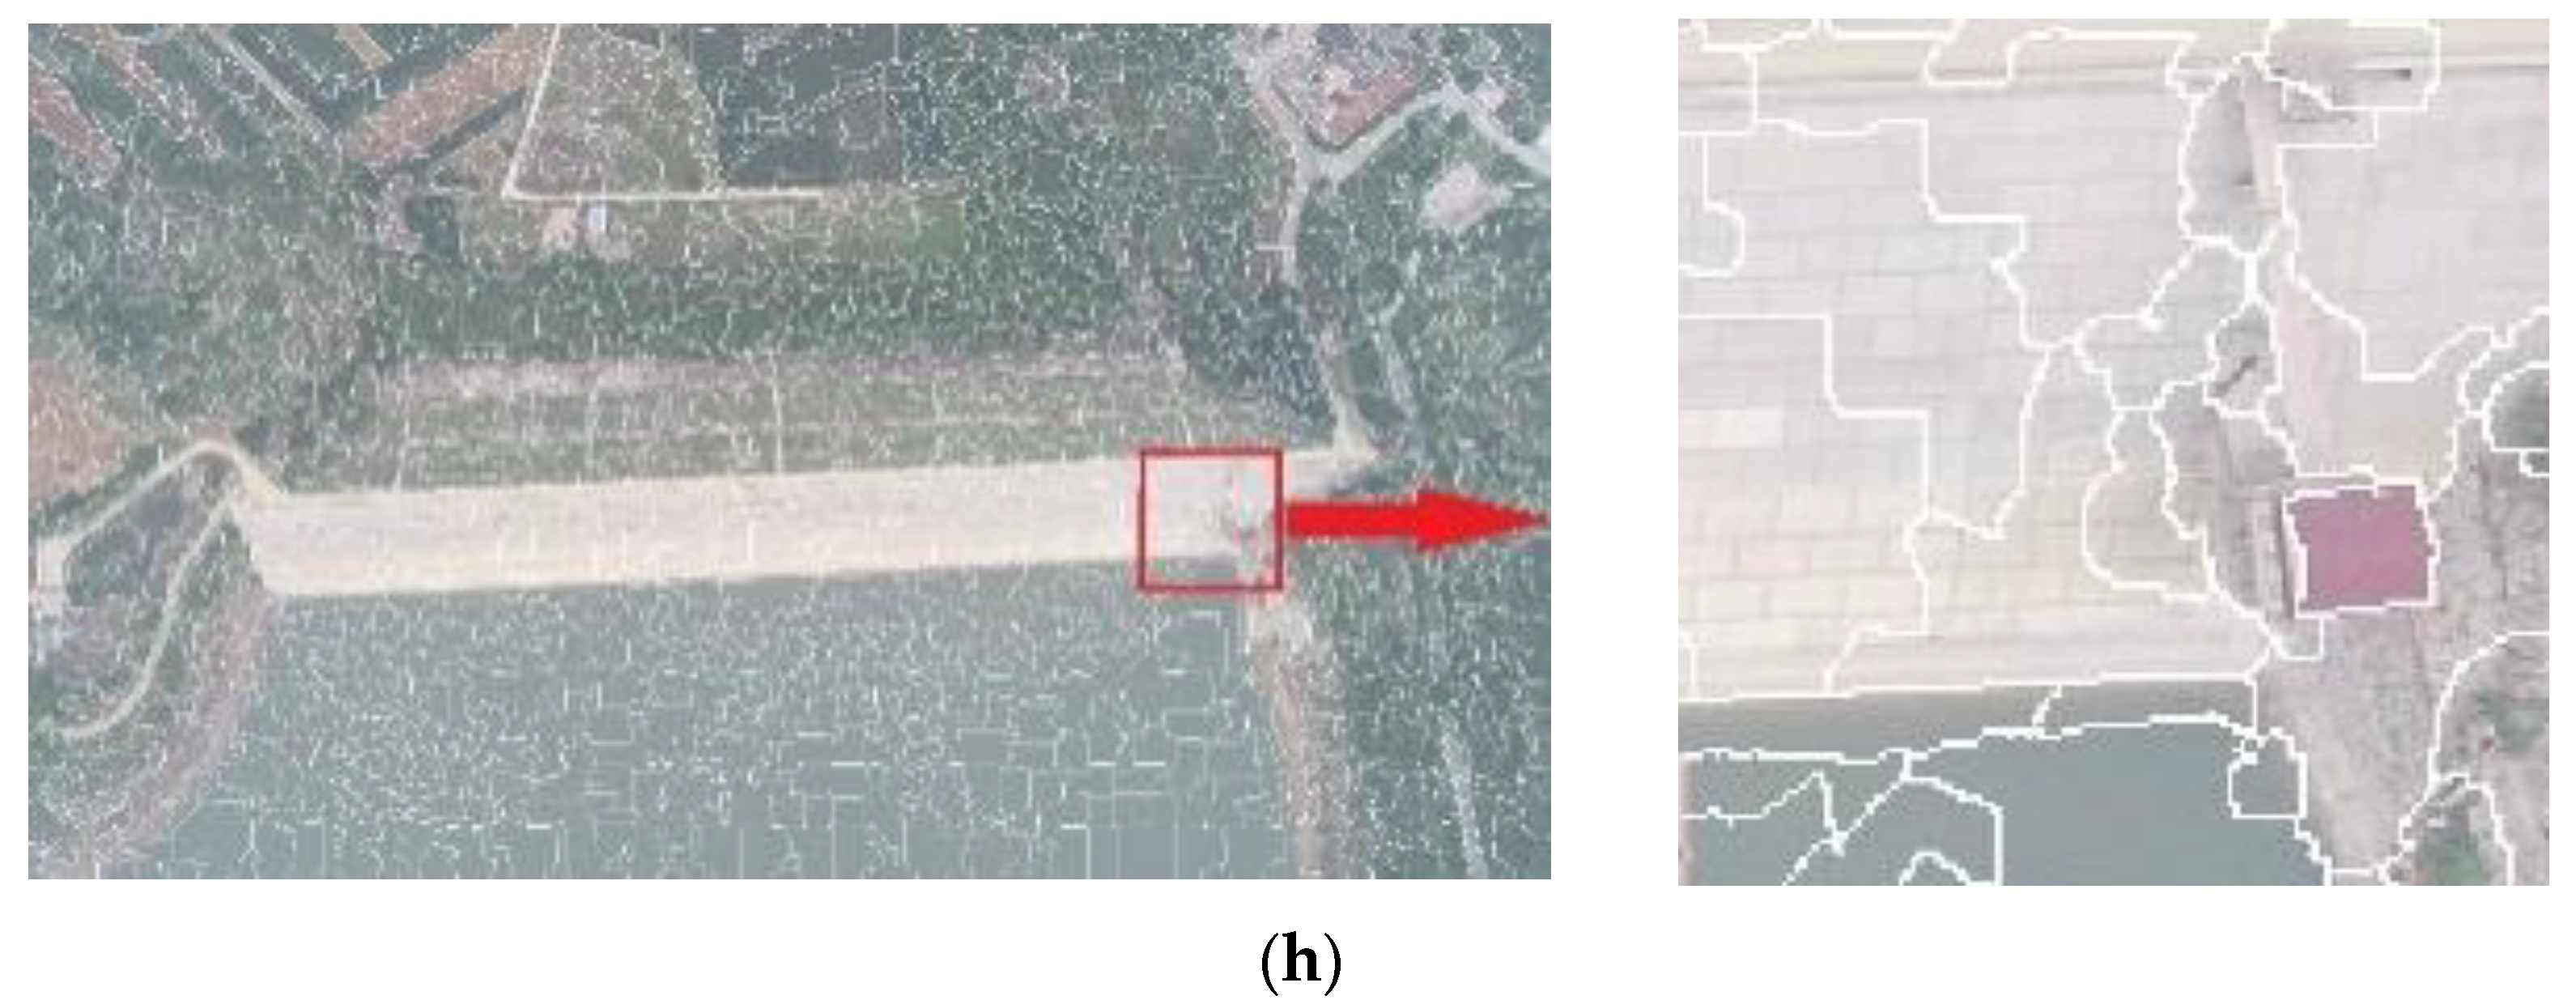
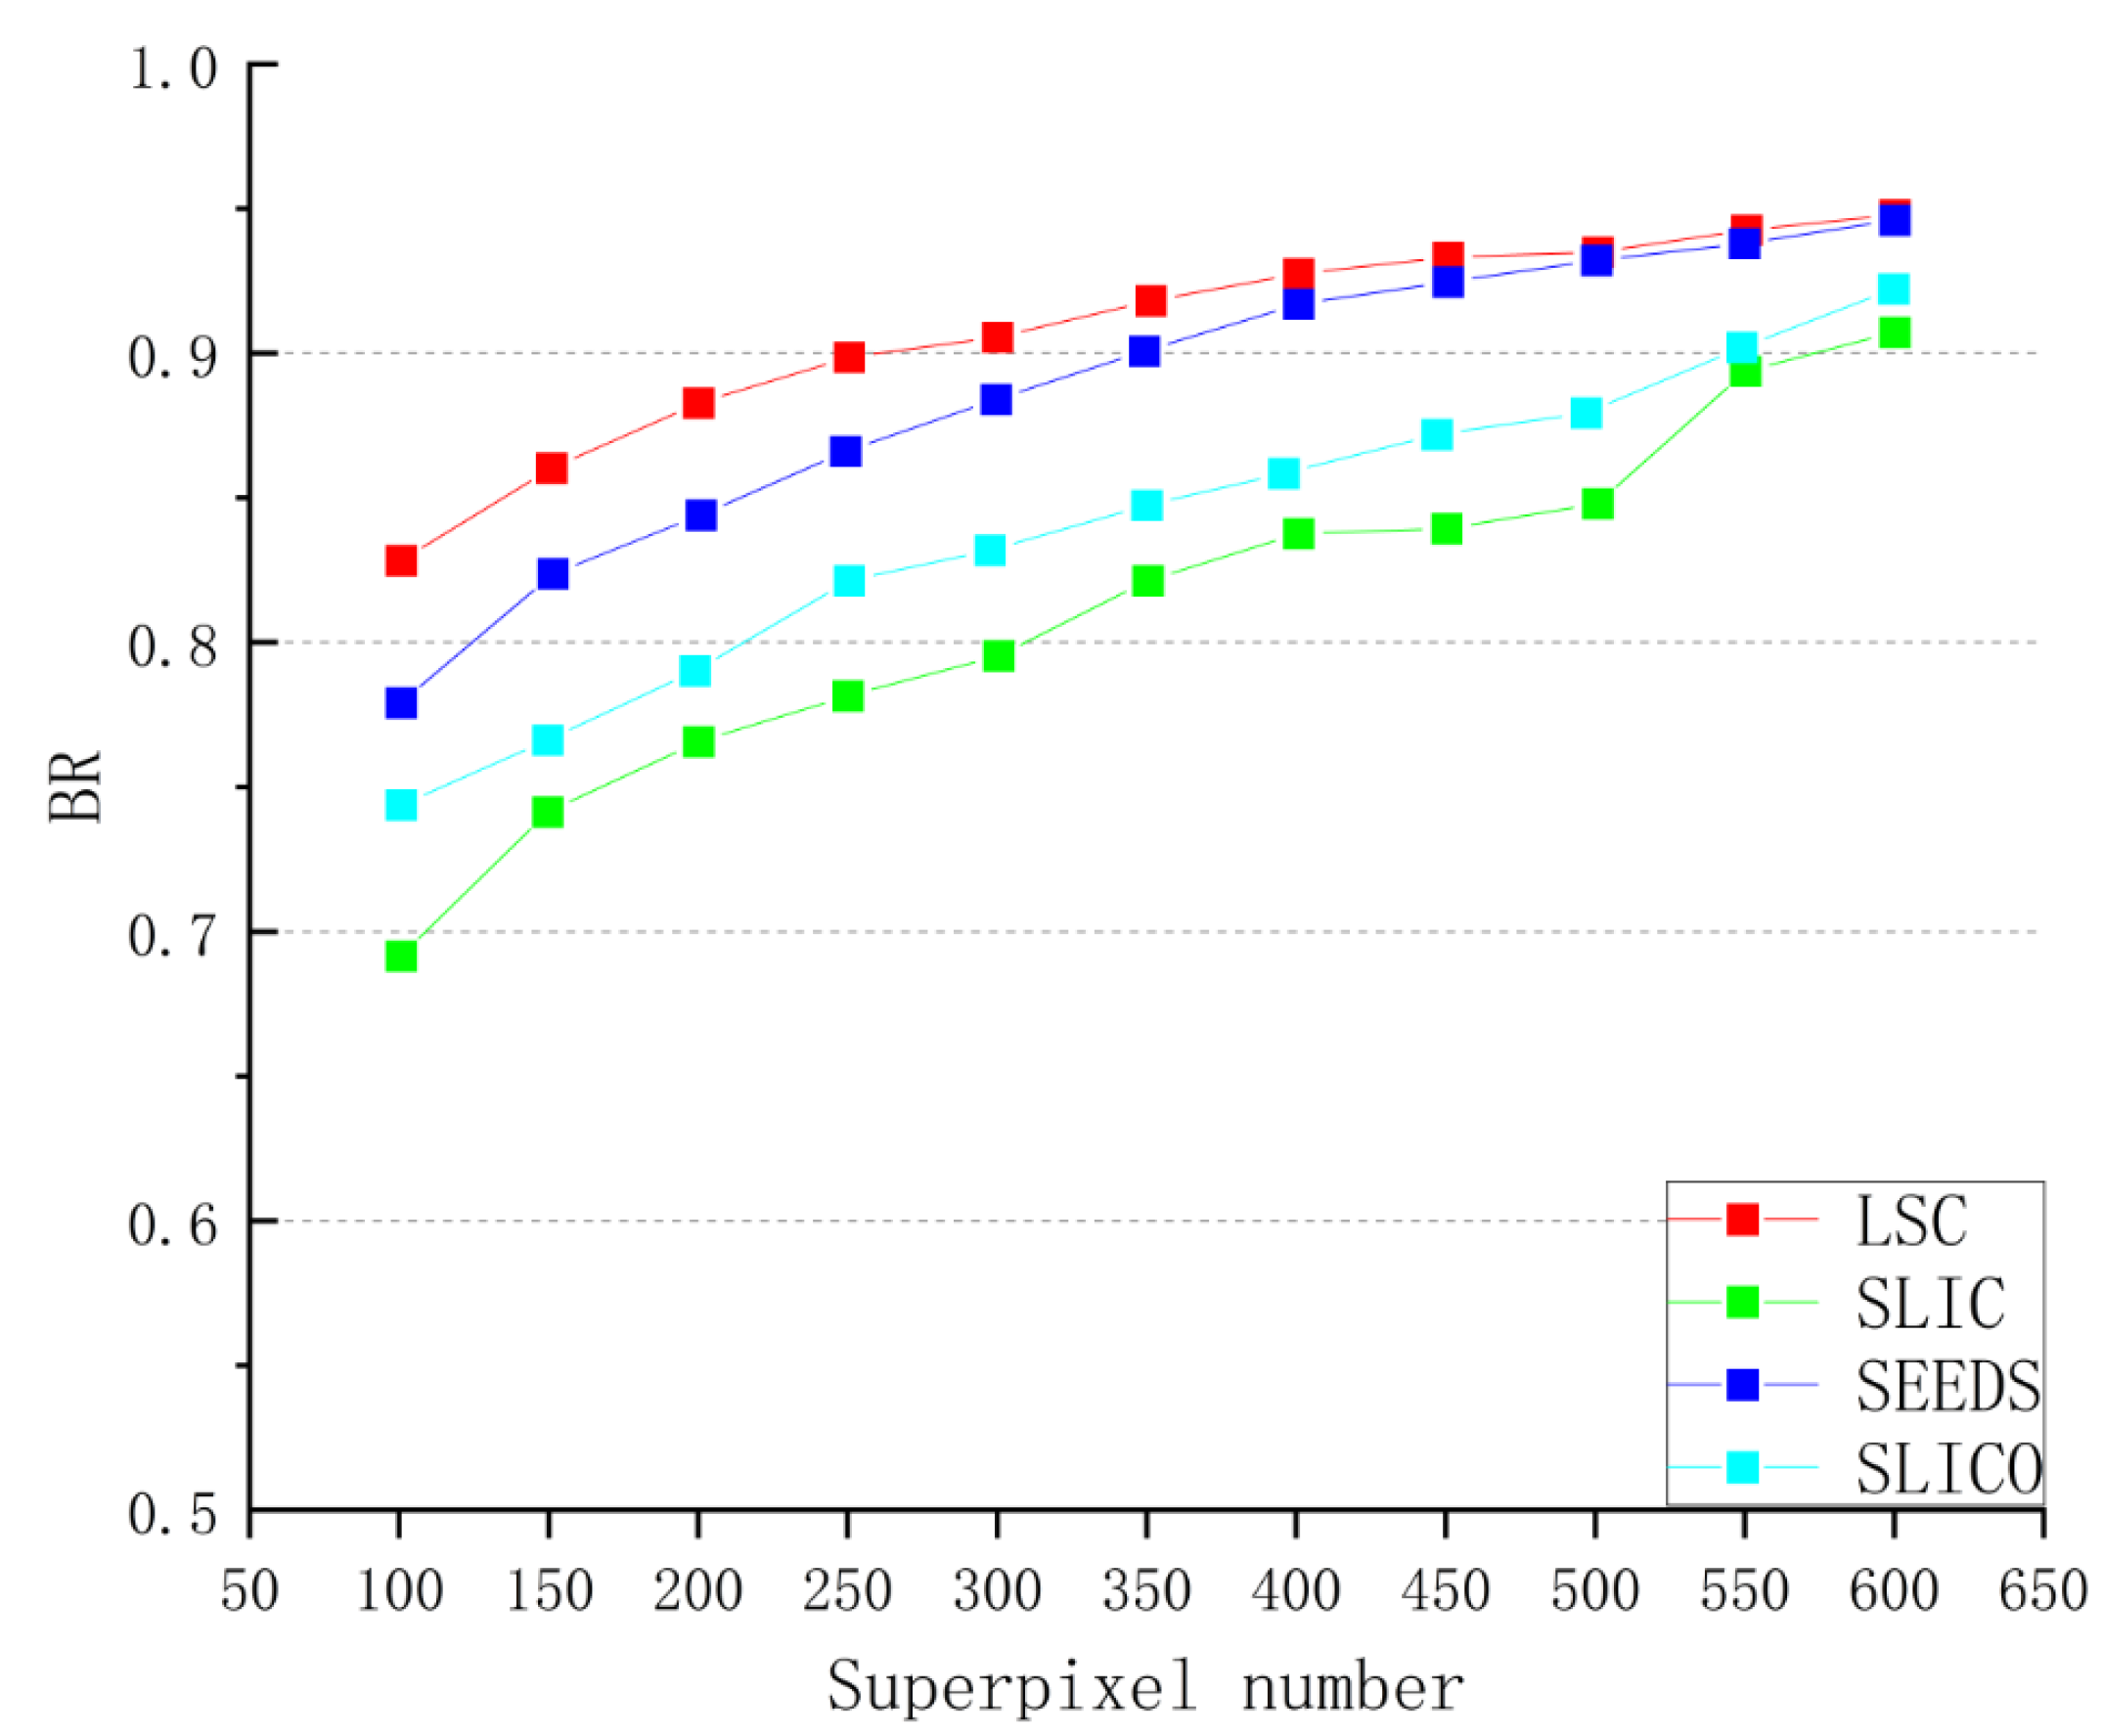
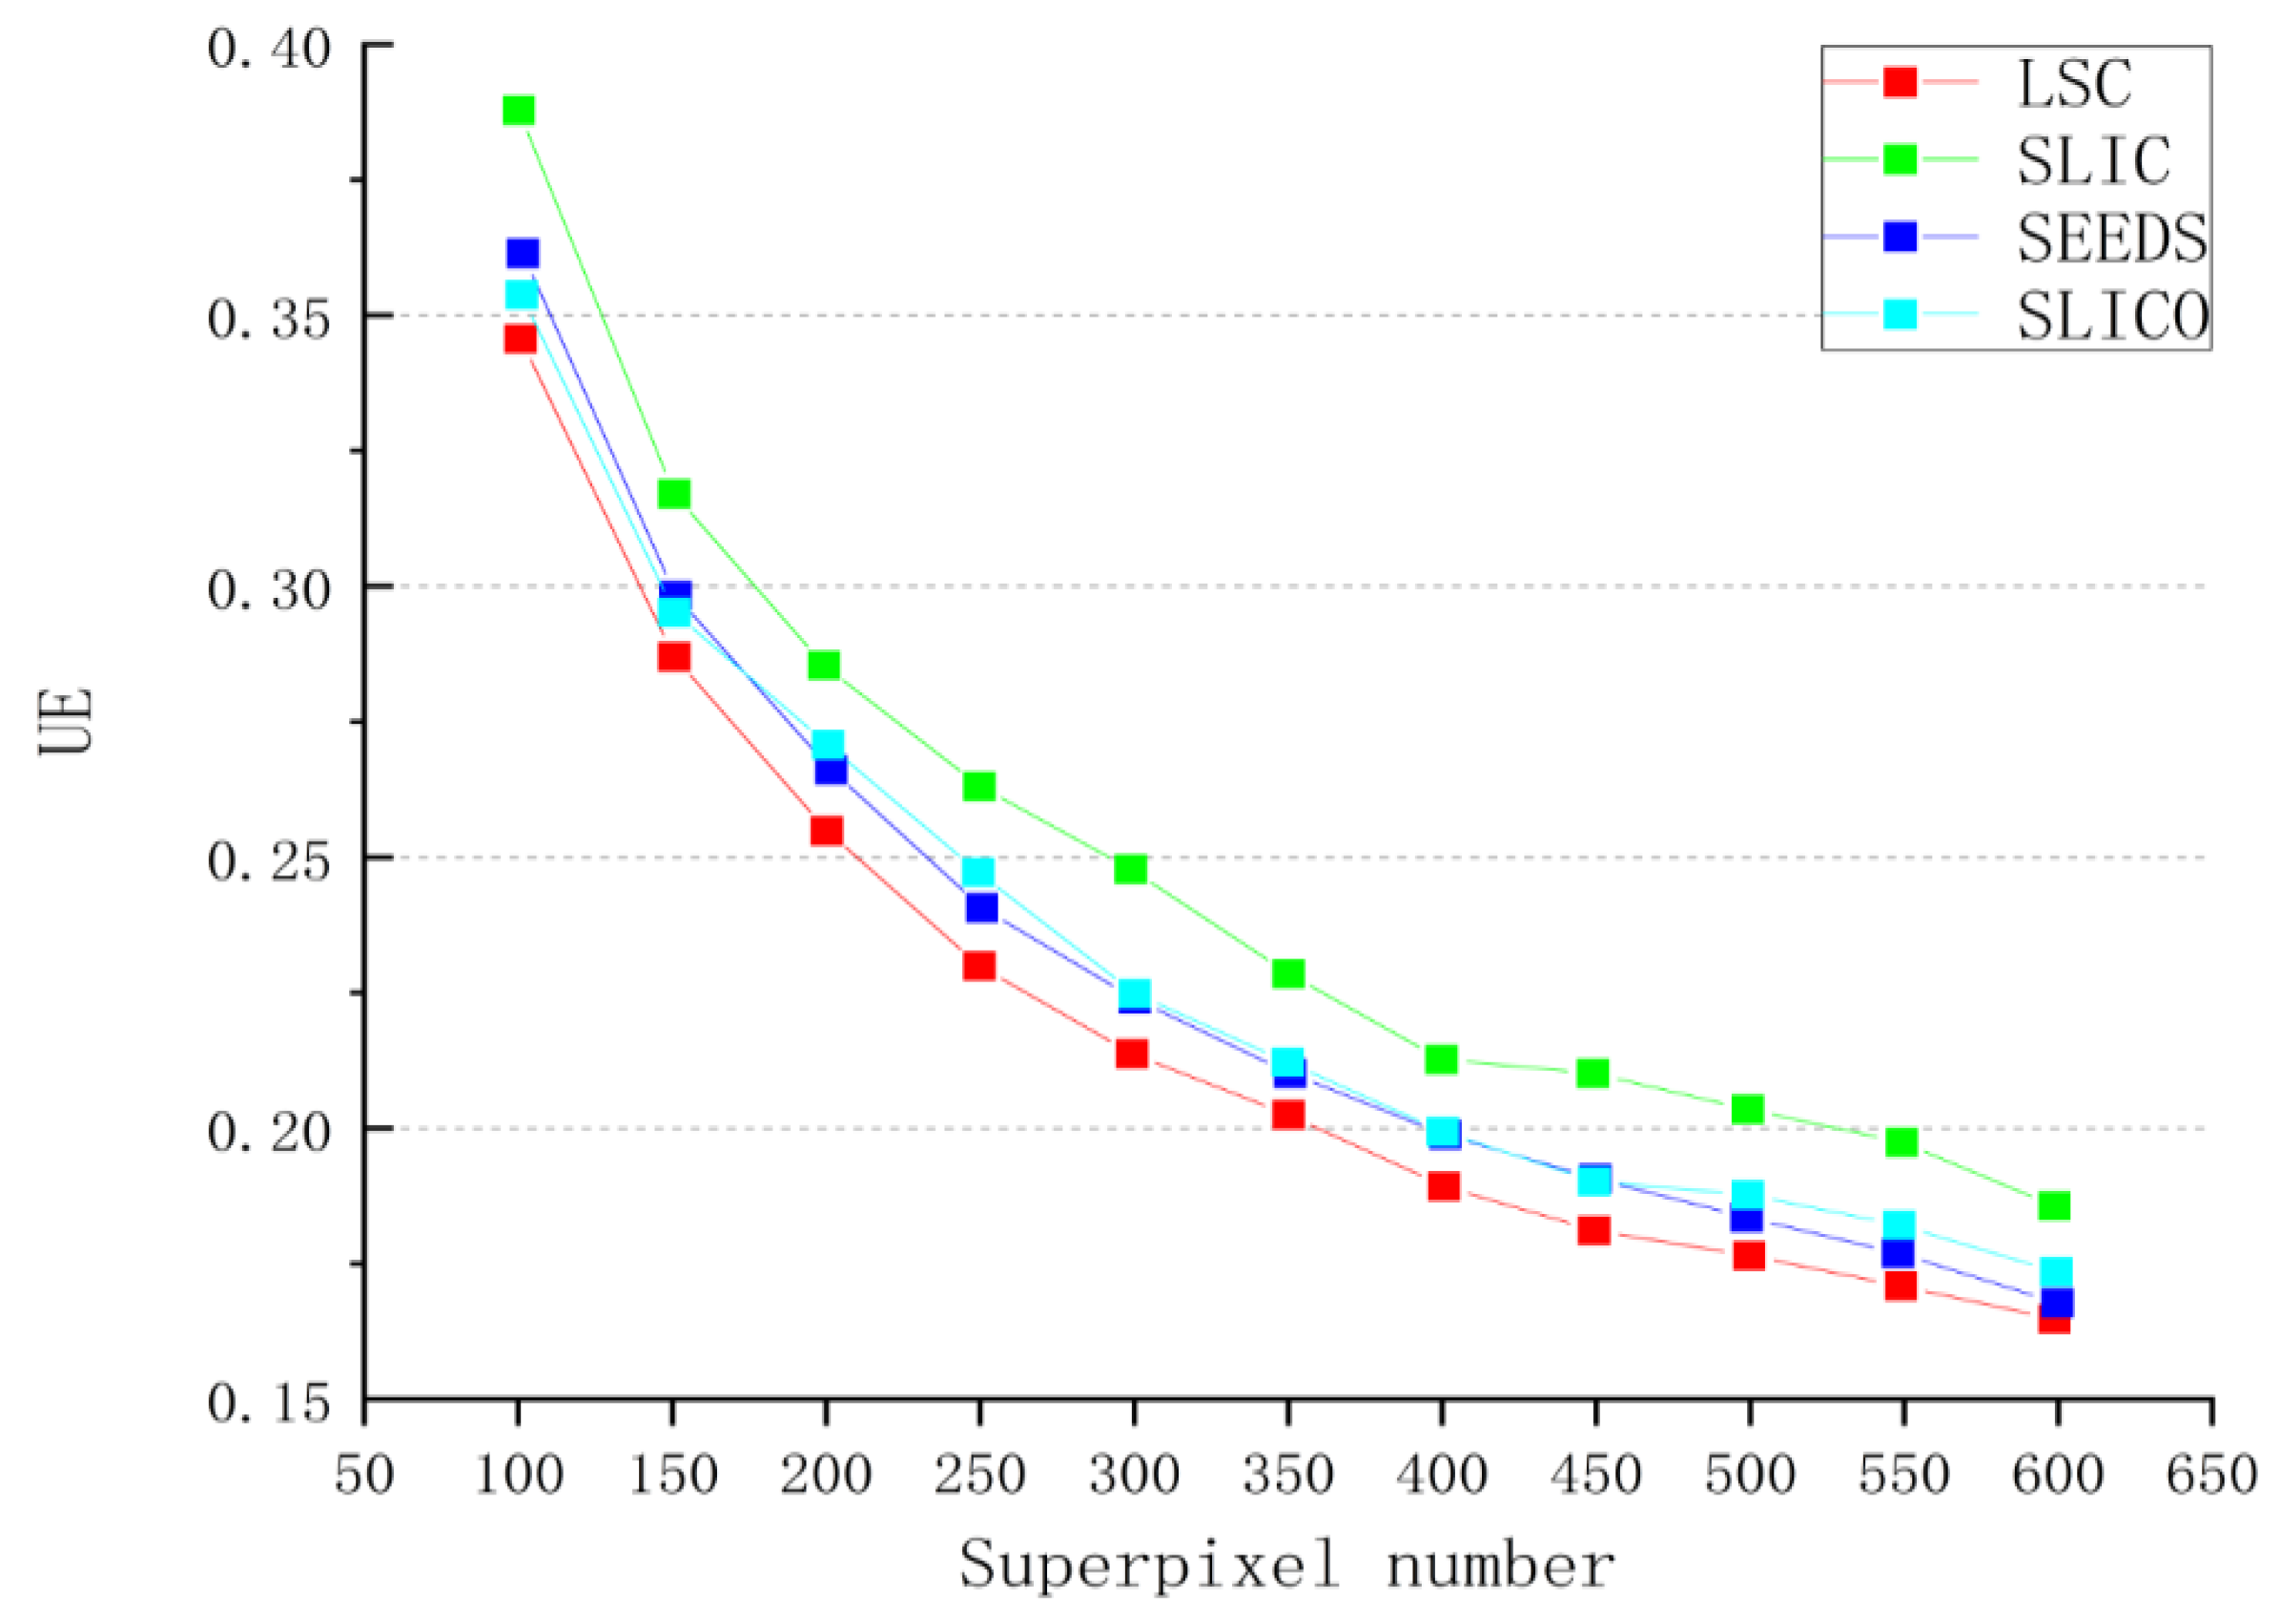
4.2.1. Comparison of Superpixel Segmentation Effects
4.2.2. Results of LSC Fused with Enhanced GrabCut Segmentation
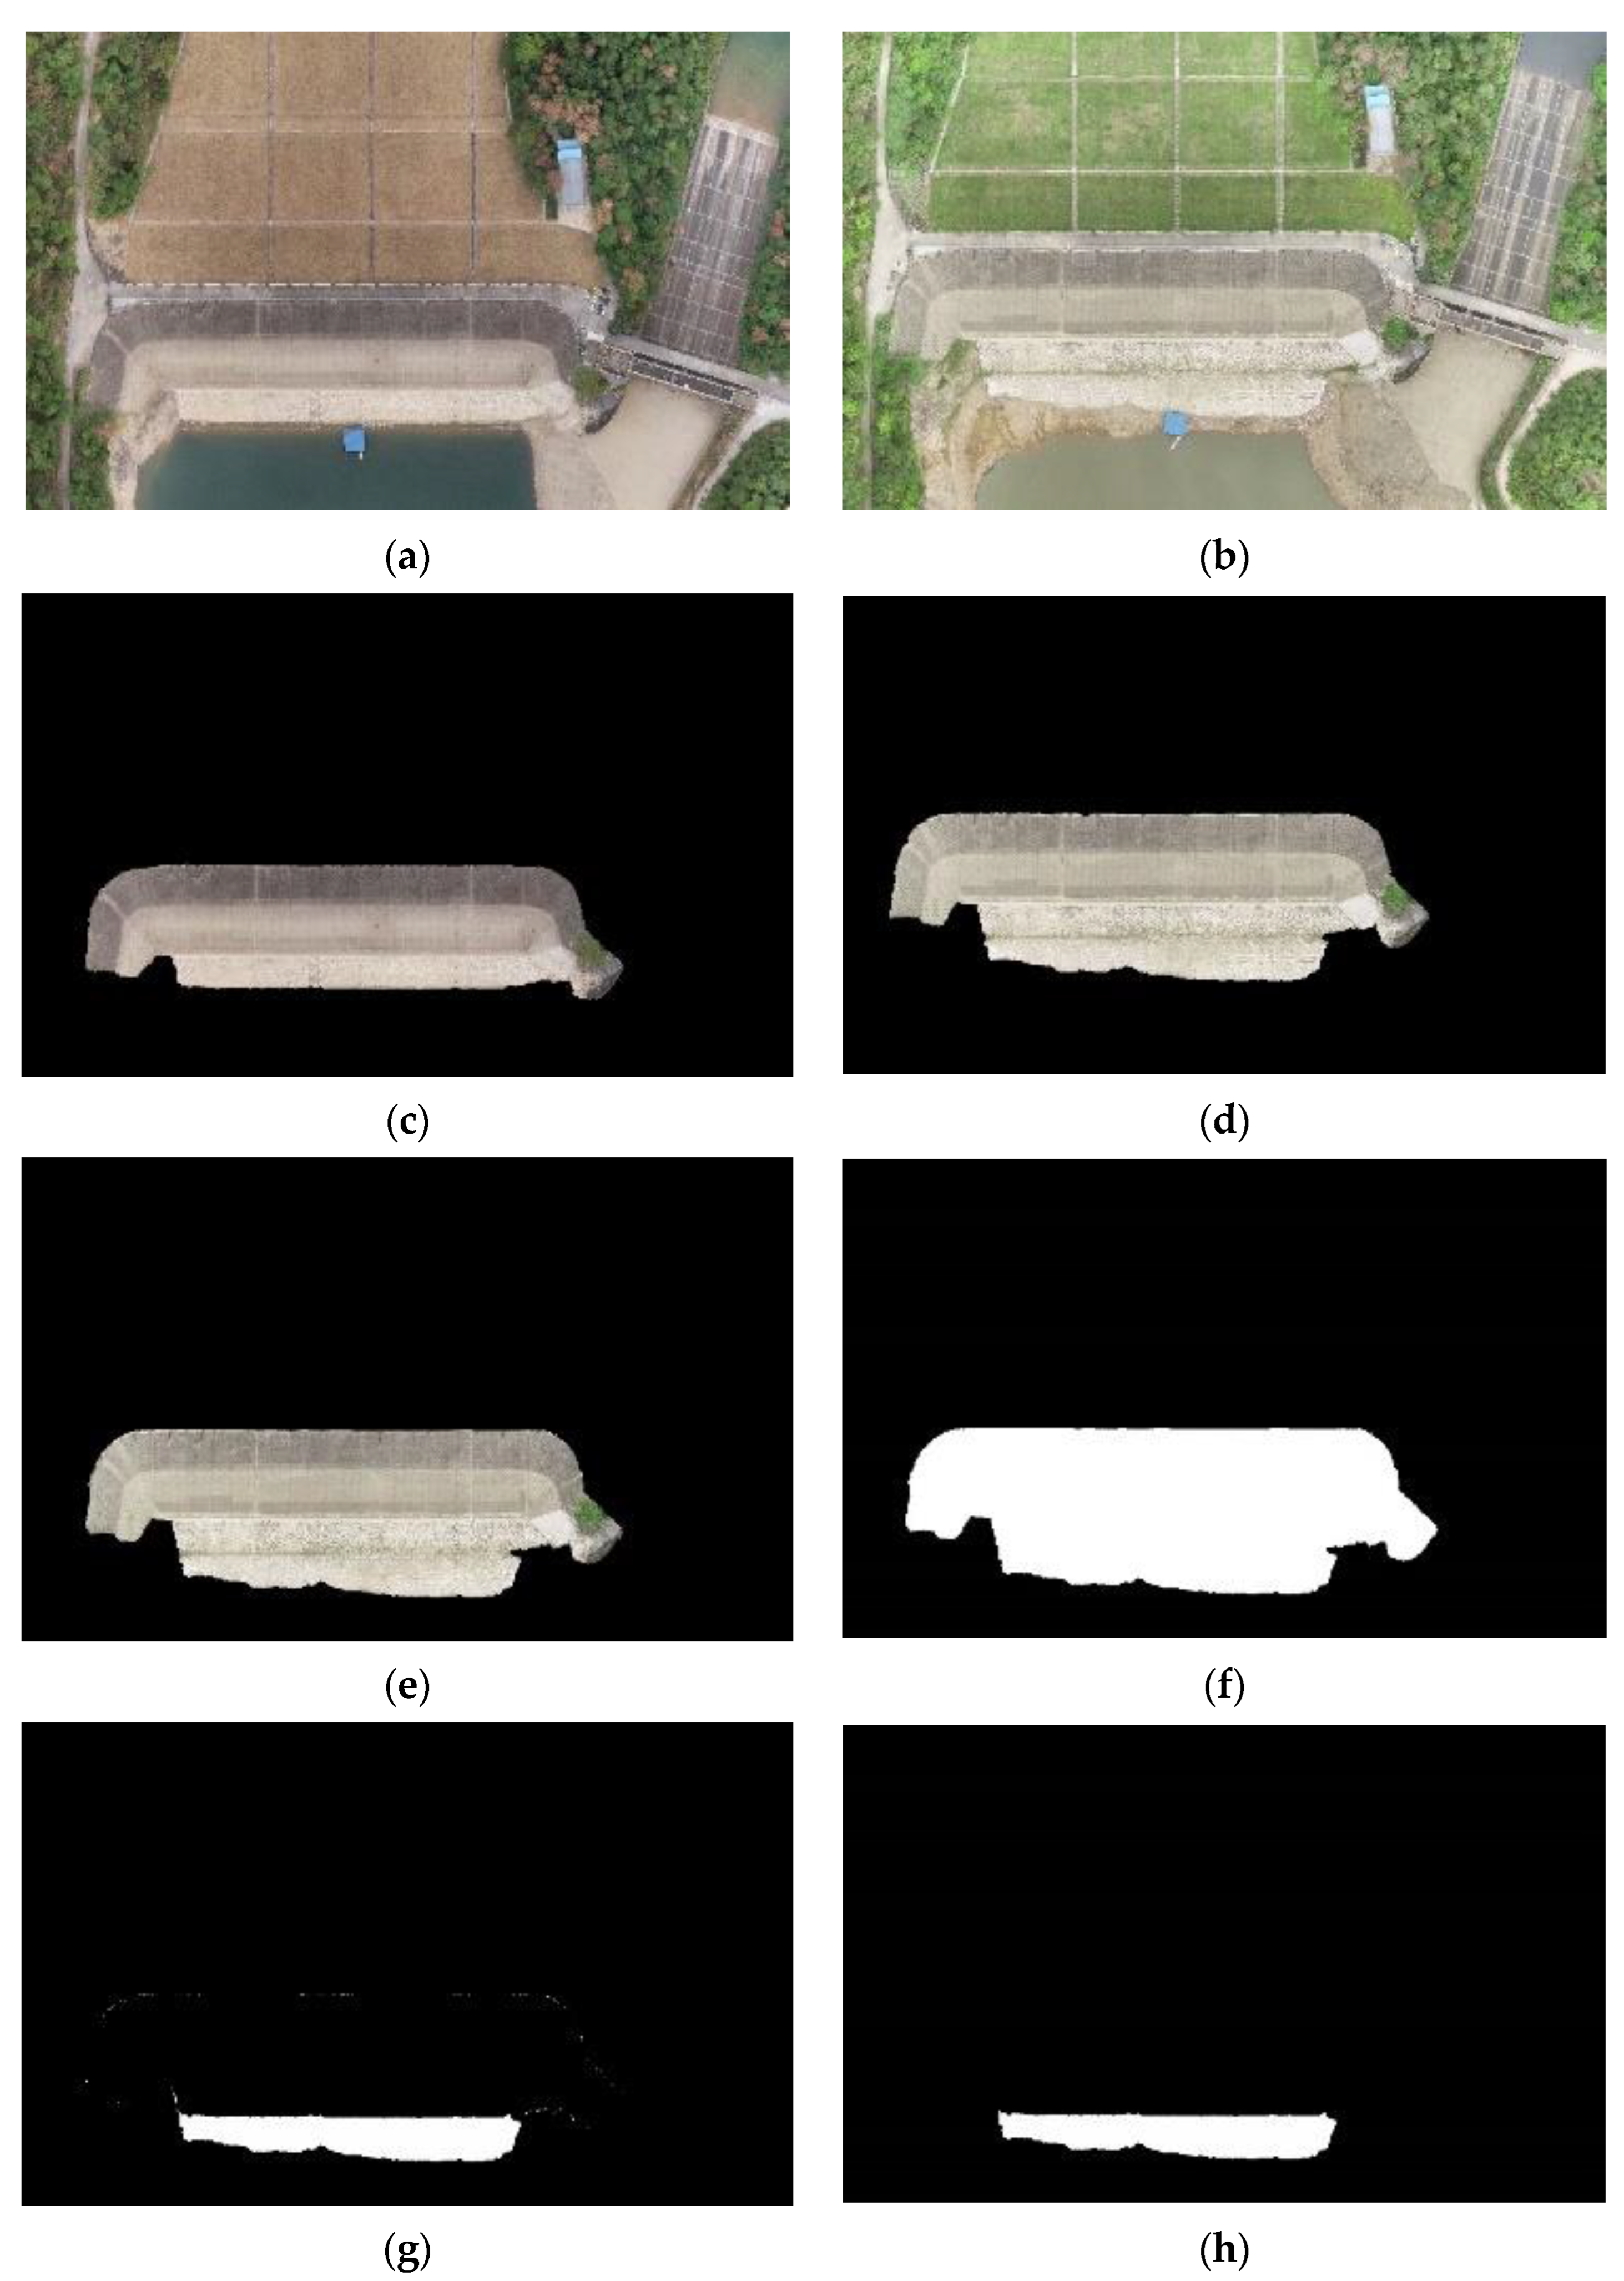
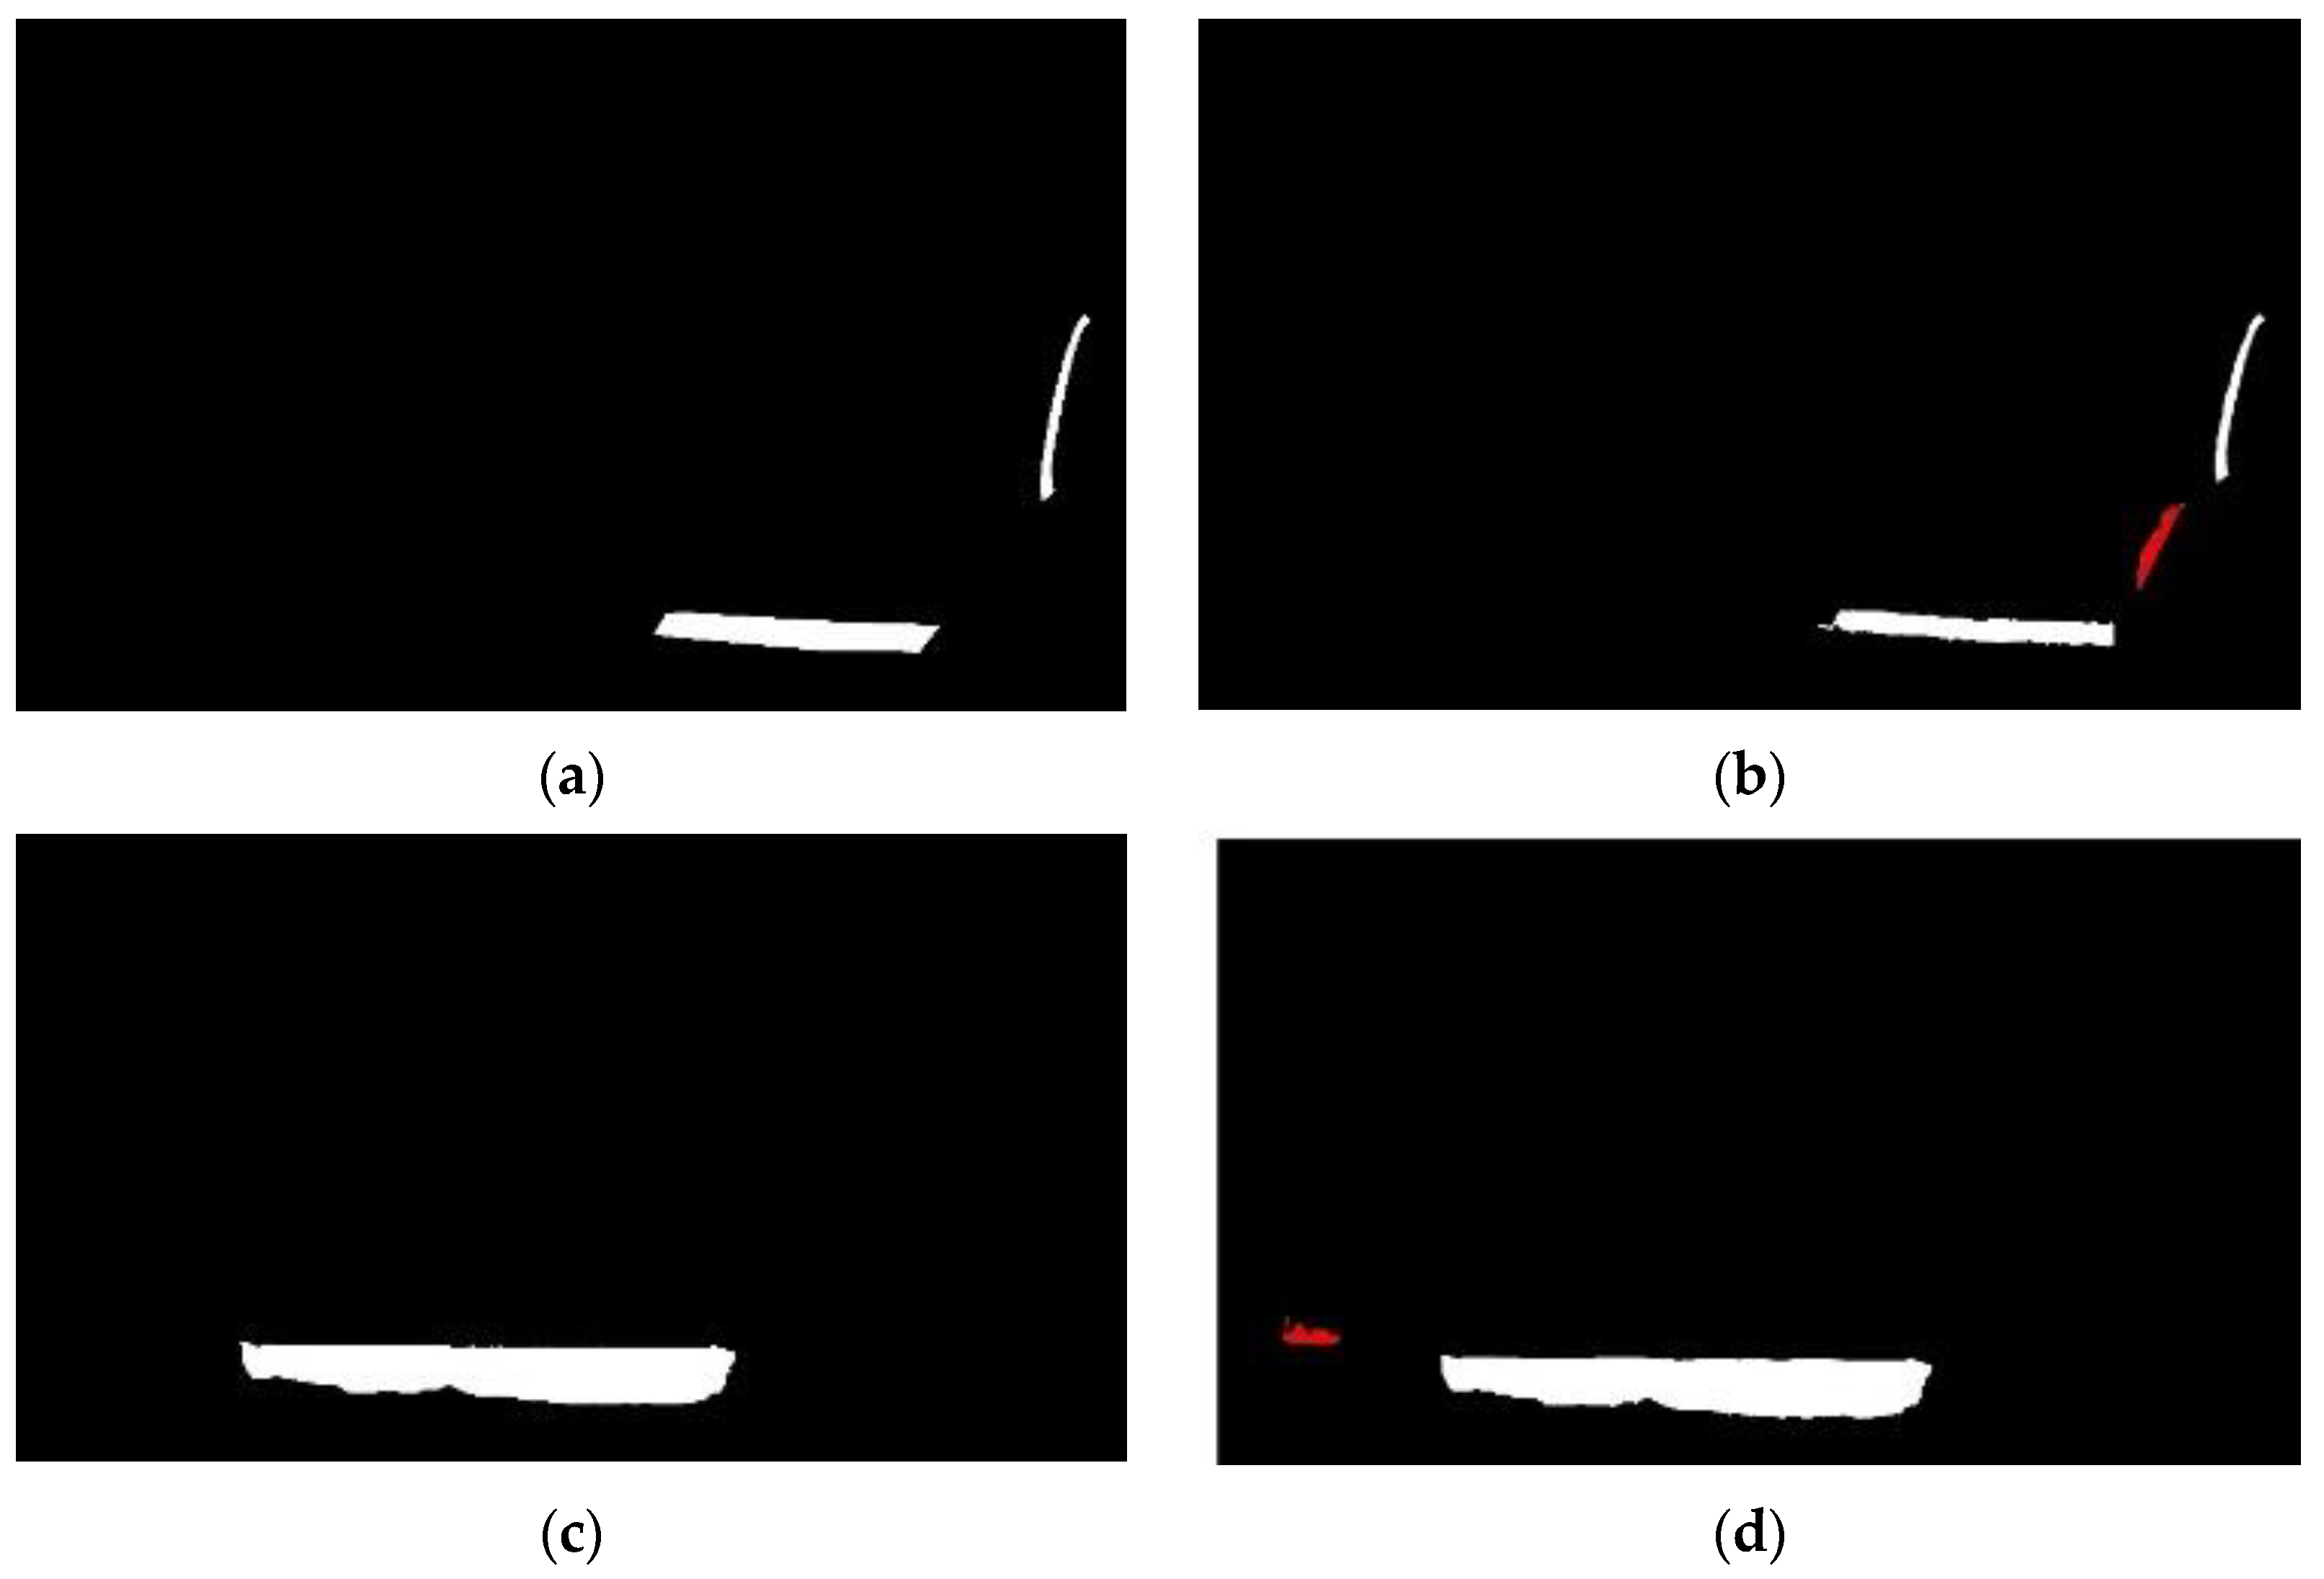
4.2.3. Detection Results of Dam Changes
5. Discussion
5.1. Comparison and Analysis of Different Superpixel Segmentation Methods
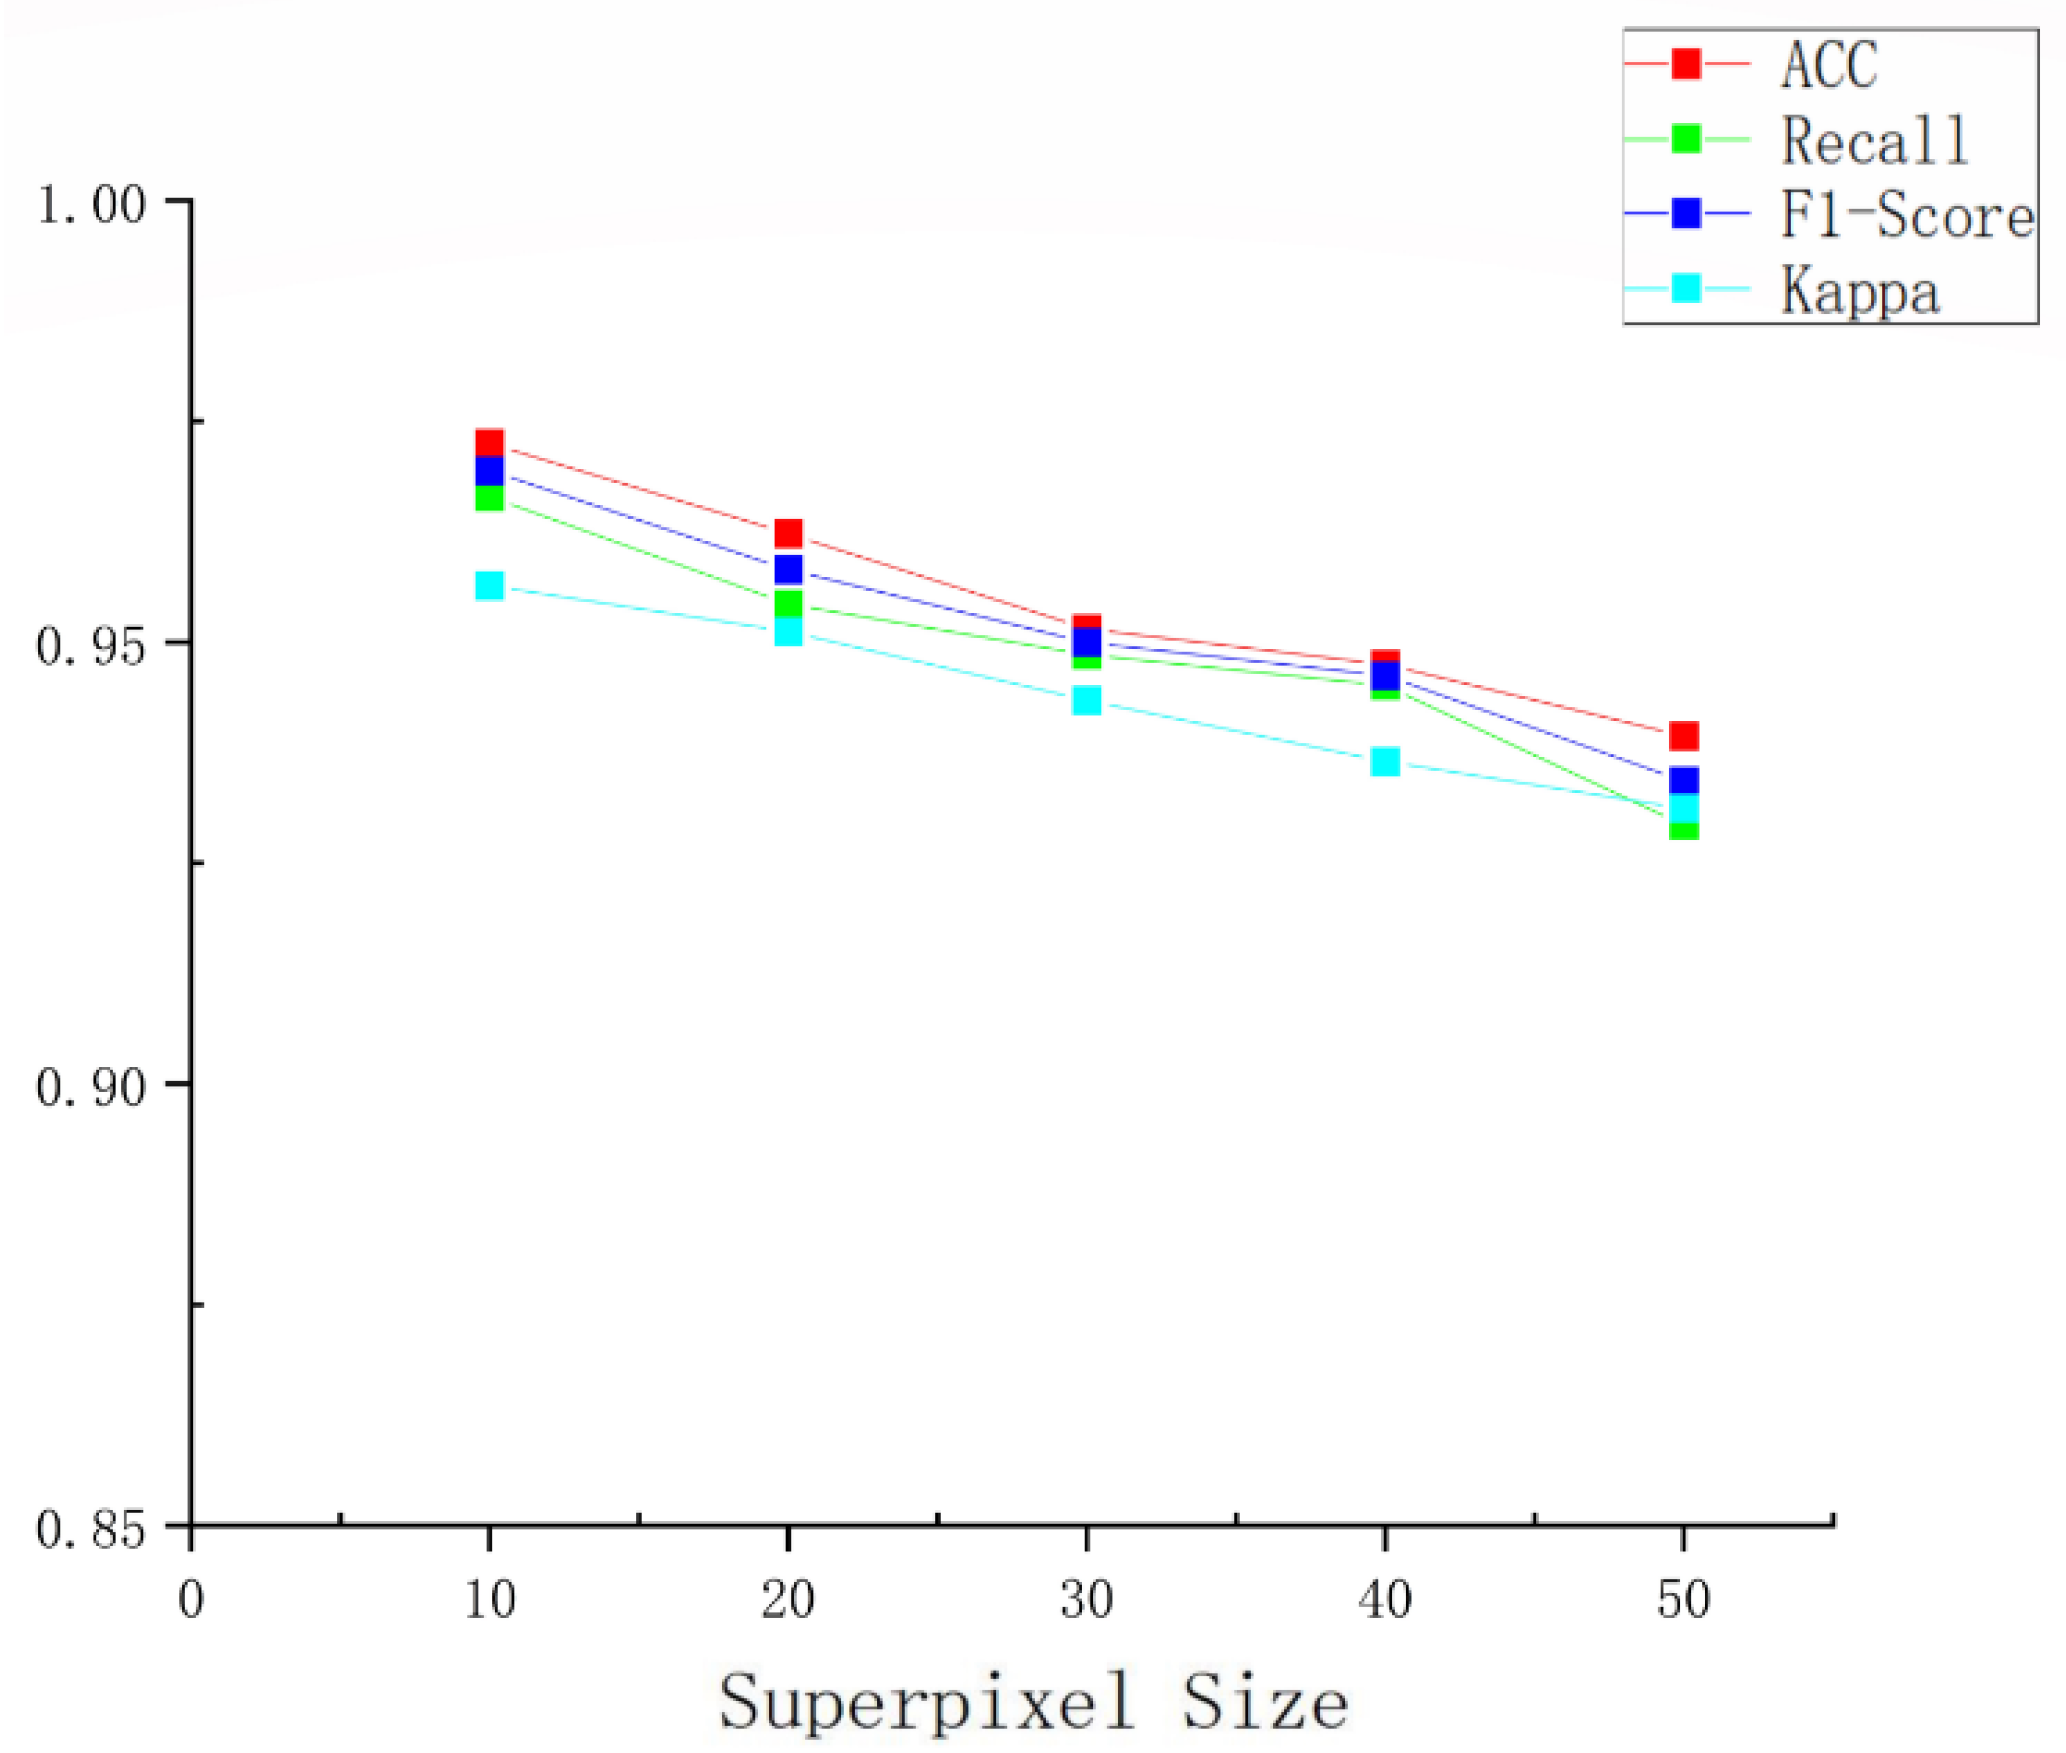
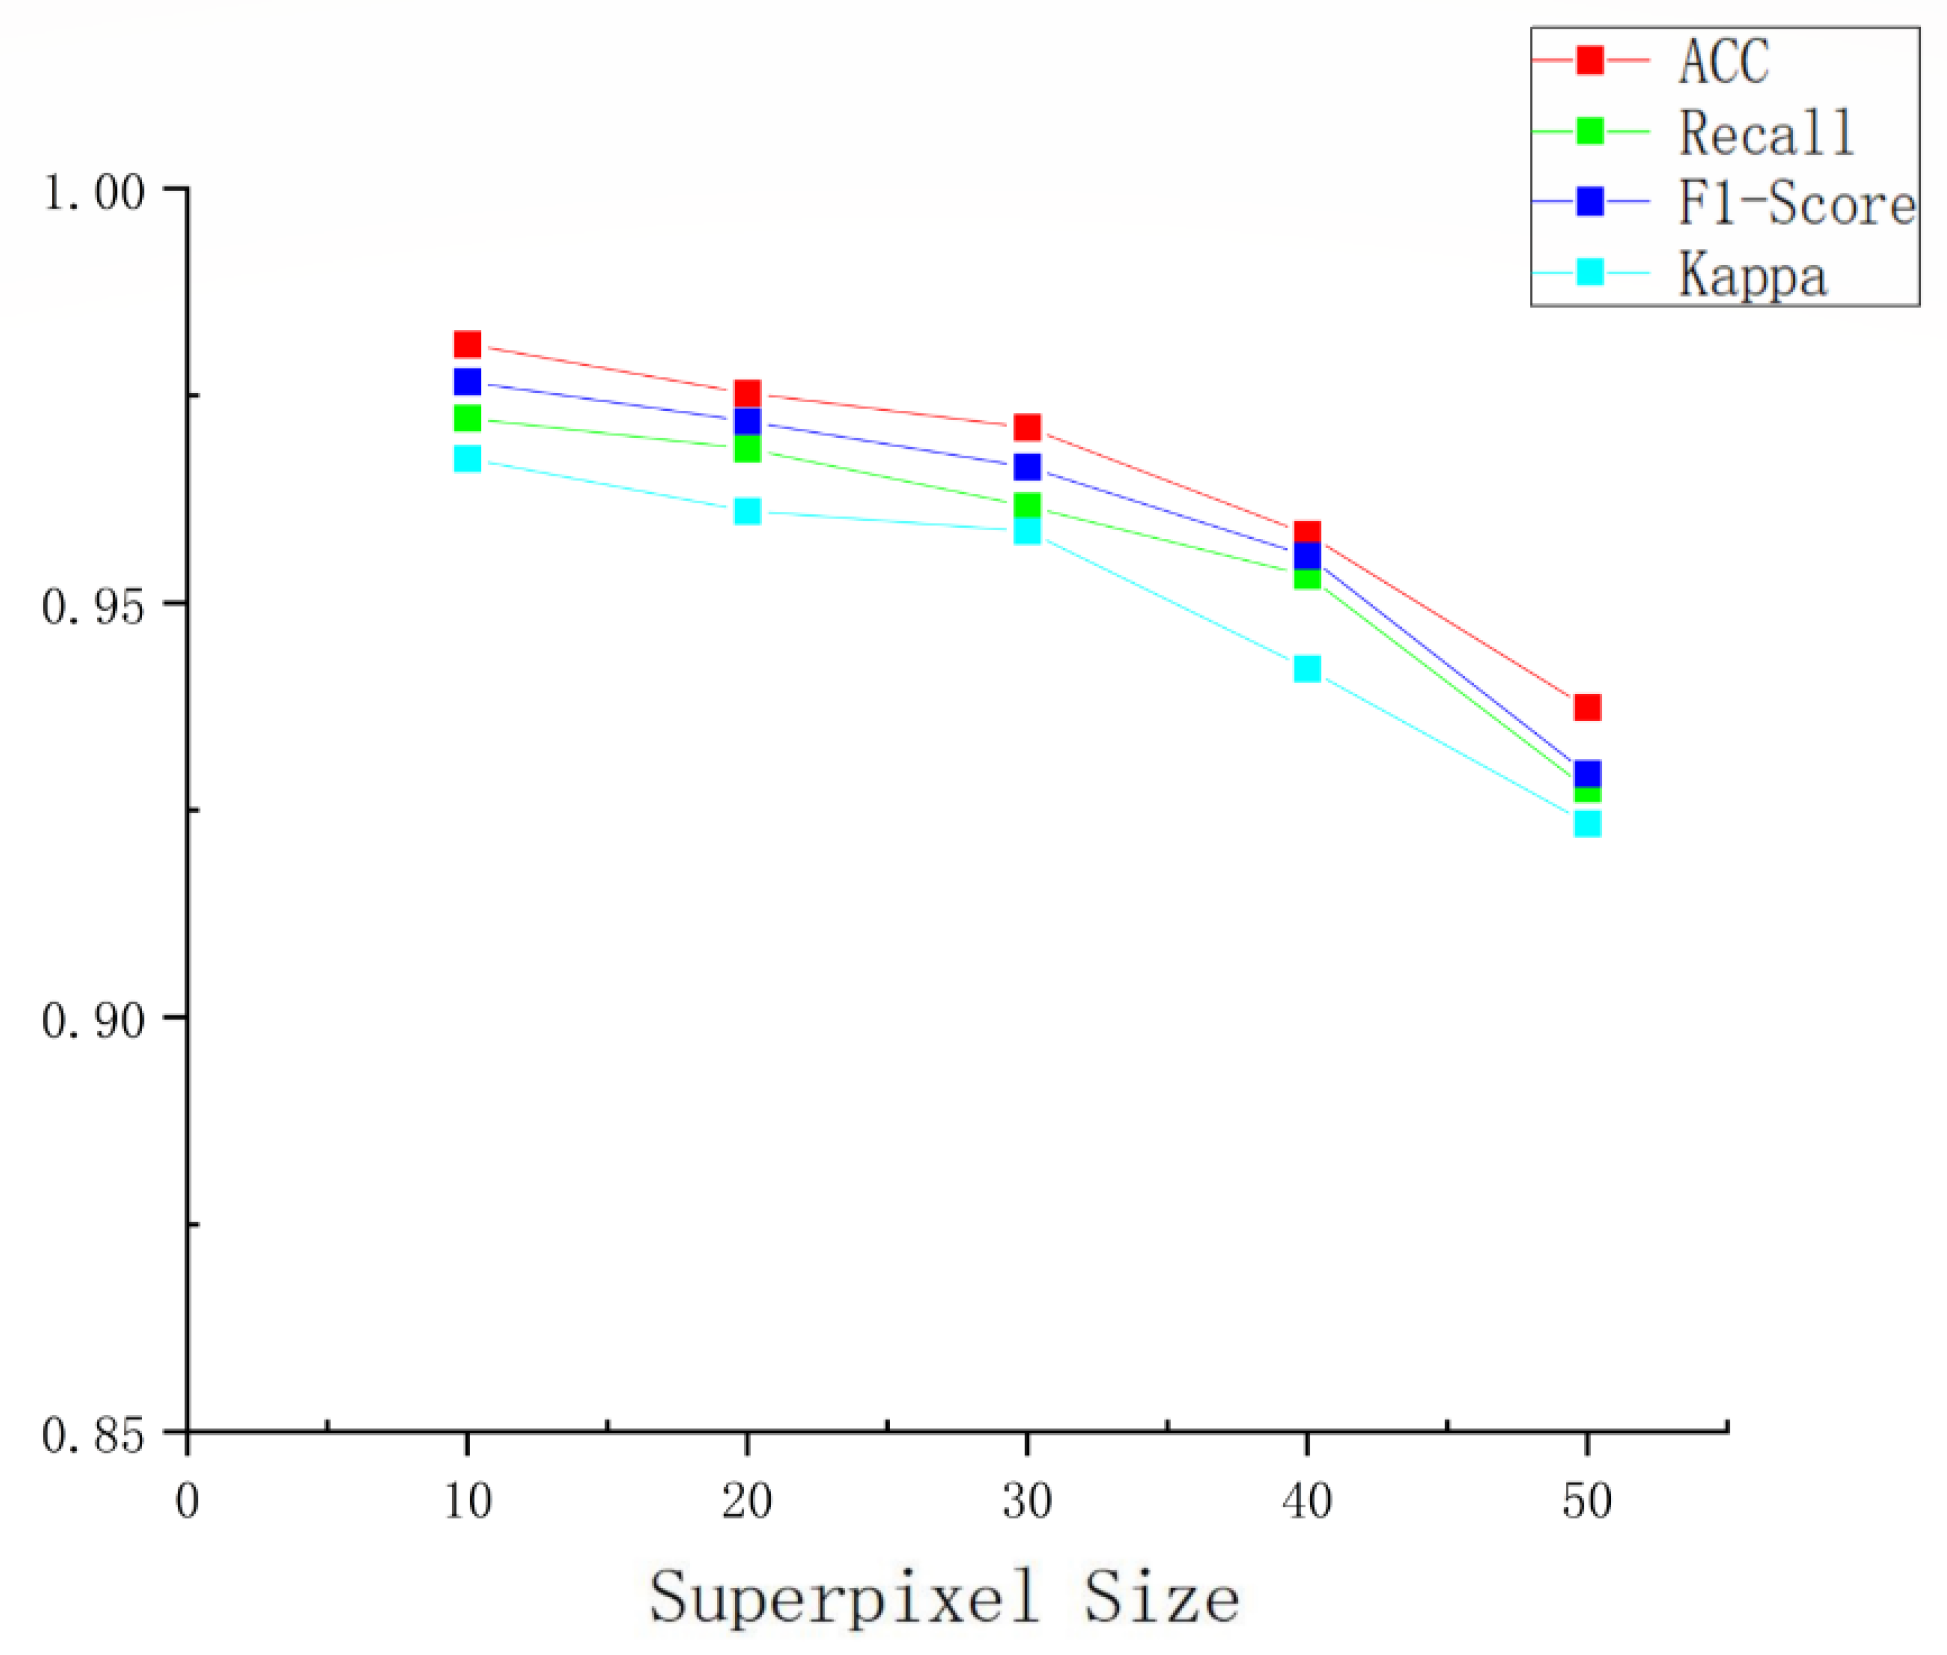
5.2. Analysis of the Influence of Superpixel Size Setting on the Detection Accuracy of Dam Changes
5.3. Comparison with Other Mainstream Methods
- (1)
- Change detection method based on PCA and K-means [20,21]: The proposed method involves the division of difference images into nonoverlapping blocks. It utilizes PCA to extract orthogonal feature vectors and create a vector space from these features. Each pixel is projected onto this space utilizing S-dimensional feature vectors. Subsequently, the application of K-means clustering aims to partition the feature vector space into two clusters. Based on the minimum Euclidean distance, pixels are then assigned to one of these clusters. This process achieves unsupervised detection of both changed and unchanged regions. On the Dalingtou Reservoir image, this method yielded results similar to our research approach. However, its recall was still lower than our method, resulting in more false positives and false negatives. In the case of the Qingshitan Reservoir image, there were a significant number of false negatives, indicating limited model performance.
- (2)
- DLMRL [22,23]: The deep learning model based on reconstruction loss is trained using unlabeled, single-time, single-image data and attempts to perform change detection during inference by reconstructing one of the input images. The reconstruction-loss-based deep learning model achieved a lower accuracy on the Dalingtou Reservoir image, but the recall, F1-score and Kappa coefficient were higher. However, the recall, F1-score and Kappa coefficient were worse, and the accuracy was higher on the Qingshitan Reservoir image. The results of different images were more biased, as there were more missed areas. The robustness of their models was not strong, and the results were all poorer compared to the methods in this study.
- (3)
- OTSU image difference method [24]: This method is based on the OTSU thresholding technique and performs change detection by computing the global threshold for an image’s gray levels and then subtracting one time phase of remote sensing images from another. It is a classic threshold-based image change detection method. Experimental results indicated that compared to our method in this paper, it performs poorly in the context of change detection in reservoir images, which is a complex scene. The recognition results between the two images showed significant discrepancies, indicating that the model lacked robustness. It was not sensitive to subtle changes in the area and tended to have a higher number of missed detection areas.
- (4)
- Robust change vector analysis detection method [25,26,27]: This method is used to extract change vectors and perform change detection. The RCVA demonstrated moderate performance. Compared to our research method, it had a higher query accuracy, but the other three indicators such as the F1 score were lower. In the context of reservoir change detection in our study, this method did not provide a comprehensive coverage of change areas and had a relatively high rate of missed detections. Its effectiveness was limited in this specific scenario.
- (5)
- Differential principal component analysis [28]: This method first calculates the difference between multiband images from two different time periods, resulting in difference images. Subsequently, it performs a principal component analysis on these difference images to extract the top principal components, which represent the primary differential information in the images and are considered important features representing change information. In comparison to our research method, this approach exhibited higher rates of false positives and false negatives, and its overall evaluation metrics were lower. It did not perform well in detecting changes in reservoir images.
6. Conclusions
Author Contributions
Funding
Data Availability Statement
Acknowledgments
Conflicts of Interest
References
- Wei, G. Research on Rapid Discovery Technology of Suspicious Changing Features Based on UAV Images. Master’s Thesis, Southeast University, Nanjing, China, 2018. [Google Scholar]
- Dong, Y. Research on the Change Detection Method of Geological Relics Based on UAV Images. Master’s Thesis, Harbin Institute of Technology, Harbin, China, 2020. [Google Scholar]
- Lu, K. Building Change Detection in Urban Areas Based on Single UAV Image. Master’s Thesis, China University of Mining and Technology, Xuzhou, China, 2022. [Google Scholar]
- Zhong, Y. A Two-Three-Dimensional Feature Change Detection Method Based on UAV Images. Master’s Thesis, Wuhan University, Wuhan, China, 2021. [Google Scholar]
- Yin, S.; Wu, C.; Wang, Q.; Ma, W.; Zhu, L.; Yao, Y.; Wang, X.; Wu, D. A review of research progress on multi-temporal remote sensing image change detection methods. Spectrosc. Spectr. Anal. 2013, 33, 3339–3342. [Google Scholar]
- Xu, Y.J. Research and Development of New Urban Construction Land Change Detection Based on High-Definition Imagery. Master’s Thesis, Chongqing Jiaotong University, Chongqing, China, 2021. [Google Scholar]
- Xu, B. Research on Urban Land Use Change Detection Method by Fusing Remote Sensing Imagery and Multisource Geographic Data. Master’s Thesis, Shandong Normal University, Ji’nan, China, 2021. [Google Scholar]
- Tang, H. Research on Remote Sensing Image Land Use/Cover Change Detection in Karst Region Based on Deep Learning. Master’s Thesis, Guizhou University, Guiyang, China, 2022. [Google Scholar]
- Lei, M. Research on Urban Land Use Change Detection Based on High-Definition Remote Sensing Imagery. Master’s Thesis, Huazhong Normal University, Wuhan, China, 2019. [Google Scholar]
- Miao, L. Detection of Vegetation Cover Changes in Mining Areas Based on Spatio-Temporal Fusion Data. Master’s Thesis, China University of Geosciences (Beijing), Beijing, China, 2019. [Google Scholar]
- Liu, Y. Research on Forest Cover Change Detection Method Based on High Resolution Network. Master’s Thesis, Ningxia University, Yinchuan, China, 2021. [Google Scholar]
- Washaya, P. Coherent Change Detection Technique Using Sentinel-1 for Natural and Man-Made Disaster Monitoring in Urban Areas. Master’s Thesis, Wuhan University, Wuhan, China, 2018. [Google Scholar]
- Zhang, S. Research on Landslide Extraction Method Combining Change Detection and Object-Oriented with High-Resolution Remote Sensing Images. Master’s Thesis, Southwest Jiaotong University, Chengdu, China, 2017. [Google Scholar]
- Koller, R.; Samimi, C. Deforestation in the Miombo woodlands: A pixel-based semiautomated change detection method. Int. J. Remote Sens. 2011, 32, 7631–7649. [Google Scholar] [CrossRef]
- Kim, Y.; Lee, M.-J. Rapid Change Detection of Flood Affected Area after Collapse of the Laos Xe-Pian Xe-Namnoy Dam Using Sentinel-1 GRD Data. Remote Sens. 2020, 12, 1978. [Google Scholar] [CrossRef]
- Adediji, A.; Ajibade, L.T. The change detection of major dams in Osun State, Nigeria using remote sensing (RS) and GIS techniques. J. Geogr. Reg. Plan. 2008, 1, 110. [Google Scholar]
- Al-Obaidi, M.A.; Al-Timimi, Y.K. Change detection in Mosul dam lake, north of Iraq using remote sensing and GIS techniques. Iraqi J. Agric. Sci. 2022, 53, 38–47. [Google Scholar] [CrossRef]
- Codegoni, A.; Lombardi, G.; Ferrari, A. TINYCD: A (not so) deep learning model for change detection. Neural Comput. Appl. 2023, 35, 8471–8486. [Google Scholar] [CrossRef]
- Peng, D.G.H. Unsupervised change detection method based on saliency analysis and convolutional neural network. J. Appl. Remote Sens. 2019, 13, 024512. [Google Scholar] [CrossRef]
- Bovolo, F.; Camps-Vails, G.; Bruzzone, L. A support vector domain method for change detection in multitemporal images. Pattern Recognit. Lett. 2010, 31, 1148–1154. [Google Scholar] [CrossRef]
- Dharani, M.; Sreenivasulu, G. Land use and land cover change detection by using principal component analysis and morphological operations in remote sensing applications. Int. J. Comput. Appl. 2021, 43, 462–471. [Google Scholar] [CrossRef]
- Li, D. Anomaly Detection with Generative Adversarial Networks for Multivariate Time Series. 2018. Available online: http://https://arxiv.org/abs/1809.04758 (accessed on 4 September 2023).
- Noh, H.; Ju, J.; Seo, M.; Park, J.; Choi, D.-G. Unsupervised Change Detection Based on Image Reconstruction Loss. In Proceedings of the IEEE/CVF Conference on Computer Vision and Pattern Recognition, New Orleans, LA, USA, 18–24 June 2022; pp. 1352–1361. [Google Scholar]
- Xu, S.; Liao, Y.; Yan, X.; Zhang, G. Change detection in SAR images based on iterative Otsu. Eur. J. Remote Sens. 2020, 53, 331–339. [Google Scholar] [CrossRef]
- Thonfeld, F.; Feilhauer, H.; Braun, M.; Menz, G. Robust Change Vector Analysis (RCVA) for multi-sensor very high resolution optical satellite data. Int. J. Appl. Earth Obs. Geoinf. 2016, 50, 131–140. [Google Scholar] [CrossRef]
- Thonfeld, F.; Steinbach, S.; Muro, J.; Kirimi, F. Long-Term Land Use/Land Cover Change Assessment of the Kilombero Catchment in Tanzania Using Random Forest Classification and Robust Change Vector Analysis. Remote Sens. 2020, 12, 1057. [Google Scholar] [CrossRef]
- Shen, Y.; Wang, C.; Hu, J. An improved CVA change detection method combining spatial and spectral information. Remote Sens. Technol. Appl. 2019, 34, 799–806. [Google Scholar]
- Cakir, H.I.; Khorram, S.; Nelson, S.A.C. Correspondence analysis for detecting land cover change. Remote Sens. Environ. 2006, 102, 306–317. [Google Scholar] [CrossRef]
- Wang, C.; Lin, X.; Chen, C. Gravel Image Auto-Segmentation Based on an Improved Normalized Cuts Algorithm. J. Appl. Math. Phys. 2019, 7, 603–610. [Google Scholar] [CrossRef]
- Li, L.; Xiong, Z.; Dai, Q.; Zha, Y.; Zhang, Y.; Dan, J. A novel graph-based clustering method using noise cutting. Inf. Syst. 2020, 91, 101504. [Google Scholar] [CrossRef]
- Zheng, Q.; Chen, J. Superpixel Segmentation using Linear Spectral Clustering. In Proceedings of the IEEE Conference on Computer Vision and Pattern Recognition (CVPR), Boston, MA, USA, 7–12 June 2015. [Google Scholar]
- Levinshtein, A.; Stere, A.; Kutulakos, K.N.; Fleet, D.J. Turbo Pixels: Fast Superpixels Using Geometric Flows. IEEE Trans. Pattern Anal. Mach. Intell. 2009, 31, 2290–2297. [Google Scholar] [CrossRef] [PubMed]
- Wang, Y.; Qi, Q.; Shen, X. Image Segmentation of Brain MRI Based on LTriDP and superpixels of Improved SLIC. Brain Sci. 2020, 10, 116. [Google Scholar] [CrossRef] [PubMed]
- Van den Bergh, M.; Boix, X.; Roig, G.; Van Gool, L. Seeds: Superpixels extracted via energy-driven sampling. Int. J. Comput. Vis. 2015, 111, 298–314. [Google Scholar] [CrossRef]
- Boykov, Y.; Jolly, M.-P. Interactive graph cuts for optimal boundary and region segmentation of objects in N-D images. In Proceedings of the Eighth IEEE International Conference on Computer Vision, CD–ROM, Kauai, HI, USA, 8–14 December 2001. [Google Scholar]
- Rother, C.; Kolmogorov, V.; Blake, A. Interactive Foreground Extraction with Iterated Graph Cuts. ACM Trans. Graph. 2004, 23, 309–314. [Google Scholar] [CrossRef]


| Parameter | Flight Height\m | Ground Spatial Resolution\(m/pixel) | Number of Changed Pixels | Change Area\m2 |
|---|---|---|---|---|
| Dalingtou Reservoir | 100 | 0.0299 | 965,524 | 863.192 |
| Qingshitan Reservoir | 55 | 0.0164 | 1,950,977 | 524.73 |
| Method | ACC | Recall |
|---|---|---|
| Dalingtou reservoir | 0.9674 | 0.9623 |
| Qingshitan reservoir | 0.9812 | 0.9723 |
| Method | Research Area | ACC | Recall | F1-Score | Kappa |
|---|---|---|---|---|---|
| Ours | Dalingtou Reservoir | 0.9674 | 0.9623 | 0.9648 | 0.9525 |
| Qingshitan Reservoir | 0.9812 | 0.9723 | 0.9767 | 0.9674 | |
| PCA + K-means | Dalingtou Reservoir | 0.9922 | 0.8402 | 0.3226 | 0.3202 |
| Qingshitan Reservoir | 0.9454 | 0.4227 | 0.5122 | 0.4846 | |
| DLMRL | Dalingtou Reservoir | 0.9045 | 0.1458 | 0.1738 | 0.1249 |
| Qingshitan Reservoir | 0.9739 | 0.0748 | 0.1019 | 0.0905 | |
| OTSU image difference | Dalingtou Reservoir | 0.9413 | 0.0619 | 0.1119 | 0.1015 |
| Qingshitan Reservoir | 0.9277 | 0.2433 | 0.2697 | 0.2321 | |
| RCVA | Dalingtou Reservoir | 0.9942 | 0.7121 | 0.2916 | 0.2898 |
| Qingshitan Reservoir | 0.9491 | 0.4471 | 0.5292 | 0.5033 | |
| DPCA | Dalingtou Reservoir | 0.9201 | 0.0711 | 0.1324 | 0.1219 |
| Qingshitan Reservoir | 0.8018 | 0.1283 | 0.2115 | 0.1497 |
Disclaimer/Publisher’s Note: The statements, opinions and data contained in all publications are solely those of the individual author(s) and contributor(s) and not of MDPI and/or the editor(s). MDPI and/or the editor(s) disclaim responsibility for any injury to people or property resulting from any ideas, methods, instructions or products referred to in the content. |
© 2023 by the authors. Licensee MDPI, Basel, Switzerland. This article is an open access article distributed under the terms and conditions of the Creative Commons Attribution (CC BY) license (https://creativecommons.org/licenses/by/4.0/).
Share and Cite
Zhao, H.; Yin, X.; Li, A.; Zhang, H.; Pan, D.; Pan, J.; Zhu, J.; Wang, M.; Sun, S.; Wang, Q. Intelligent Segmentation and Change Detection of Dams Based on UAV Remote Sensing Images. Remote Sens. 2023, 15, 5526. https://doi.org/10.3390/rs15235526
Zhao H, Yin X, Li A, Zhang H, Pan D, Pan J, Zhu J, Wang M, Sun S, Wang Q. Intelligent Segmentation and Change Detection of Dams Based on UAV Remote Sensing Images. Remote Sensing. 2023; 15(23):5526. https://doi.org/10.3390/rs15235526
Chicago/Turabian StyleZhao, Haimeng, Xiaojian Yin, Anran Li, Huimin Zhang, Danqing Pan, Jinjin Pan, Jianfang Zhu, Mingchun Wang, Shanlin Sun, and Qiang Wang. 2023. "Intelligent Segmentation and Change Detection of Dams Based on UAV Remote Sensing Images" Remote Sensing 15, no. 23: 5526. https://doi.org/10.3390/rs15235526
APA StyleZhao, H., Yin, X., Li, A., Zhang, H., Pan, D., Pan, J., Zhu, J., Wang, M., Sun, S., & Wang, Q. (2023). Intelligent Segmentation and Change Detection of Dams Based on UAV Remote Sensing Images. Remote Sensing, 15(23), 5526. https://doi.org/10.3390/rs15235526