Article

Efficient Detection of Forest Fire Smoke in UAV Aerial Imagery Based on an Improved Yolov5 Model and Transfer Learning

1
School of Automation, Nanjing University of Science and Technology, Nanjing 210094, China
2
Department of Computer Science and Software Engineering, Monmouth University, West Long Branch, NJ 07728, USA
*
Author to whom correspondence should be addressed.
Remote Sens. 2023, 15(23), 5527; https://doi.org/10.3390/rs15235527
Submission received: 3 September 2023 / Revised: 9 November 2023 / Accepted: 24 November 2023 / Published: 27 November 2023
(This article belongs to the Special Issue Novel Applications of UAV Imagery for Forest Science)

Abstract

:
Forest fires pose severe challenges to forest management because of their unpredictability, extensive harm, broad impact, and rescue complexities. Early smoke detection is pivotal for prompt intervention and damage mitigation. Combining deep learning techniques with UAV imagery holds potential in advancing forest fire smoke recognition. However, issues arise when using UAV-derived images, especially in detecting miniature smoke patches, complicating effective feature discernment. Common deep learning approaches for forest fire detection also grapple with limitations due to sparse datasets. To counter these challenges, we introduce a refined UAV-centric forest fire smoke detection approach utilizing YOLOv5. We first enhance anchor box clustering through K-means++ to boost the classification precision and then augment the YOLOv5 architecture by integrating a novel partial convolution (PConv) to trim down model parameters and elevate processing speed. A unique detection head is also incorporated to the model to better detect diminutive smoke traces. A coordinate attention module is embedded within YOLOv5, enabling precise smoke target location and fine-grained feature extraction amidst complex settings. Given the scarcity of forest fire smoke datasets, we employ transfer learning for model training. The experimental results demonstrate that our proposed method achieves 96% AP50 and 57.3% AP50:95 on a customized dataset, outperforming other state-of-the-art one-stage object detectors while maintaining real-time performance.

1. Introduction

In recent years, forest fires have been listed among the most devastating and prevalent natural disasters worldwide, characterized by their abruptness, immense destructiveness, extensive scope of harm, and challenges in emergency rescue operations [1,2]. From a macroscopic perspective, forest fires have the potential to cause substantial economic and societal losses. In the event of a major forest fire comparable to the 2020 Australian forest fires, the economic losses are projected to surpass billions of US dollars, not to mention the loss of lives of firefighters and civilians and the detriment to the development prospects and values of the affected areas [3]. From a microscopic standpoint, forest fires pose a threat to the habitat of numerous wildlife species and plants, resulting in the endangerment of additional species. Furthermore, the primary components of smoke emitted by forest fires include water and carbon dioxide. The substantial release of carbon dioxide not only threatens the crucial forest carbon sink [4], but also elevates global warming [5]. Consequently, the prevention of forest fires holds tremendous significance.
Given the rapid spread of forest fires in areas with abundant oxygen and swift airflow, early detection plays a critical role. Traditional manual inspection techniques for forest fire detection have proven to be inefficient and costly, prompting a shift towards sensor-based methods and satellite remote sensing. Smoke, gas, temperature, humidity, and integrated sensors are commonly employed to detect fires by measuring environmental parameters [6,7,8]. However, in order to analyze these parameters, sensors must directly sample combustion byproducts, necessitating their close proximity to potential fire sources. While sensor-based detection systems are well-suited for identifying fires within confined indoor spaces, they may not be suitable for vast areas or open spaces like forests due to installation costs, maintenance requirements, and power limitations. On the other hand, satellite remote sensing is effective in detecting large-scale forest fires but is constrained in identifying initial small fires due to weather conditions and cloud cover [9].
Cameras are ubiquitous and widely utilized for object detection and target tracking [10]. Numerous approaches have been proposed for detecting fire or smoke using conventional video surveillance cameras. When mounted on UAVs, such cameras can also detect forest fires in remote areas [11,12,13]. Extensive research has been conducted on vision-based fire detection.
The identification of forest fires primarily encompasses smoke identification and flame identification. Smoke generally propagates more rapidly than the flames [14]. Smoke-based method relies on examining specific characteristics associated with forest fires smoke. Smoke serves as both a precursor and a byproduct of forest fire. This phenomenon is particularly evident and pronounced during the initial stages of a forest fire. During the early stages of forest fires, smoke often rises above the forest and disperses over a wide area. This phenomenon makes it more feasible to detect such forest fires using UAVs [15]. Moreover, the smoke plume generated by a forest fire propagates over long distances and lingers in the atmosphere for extended periods, exhibiting limited dispersion. Smoke is an important sign for early fire detection because it spreads faster than flames and moves over a wide area [16].
Monitoring smoke enables the early detection of forest fires and provides information for predicting their developmental trends. Mounting cameras on drones for forest fire detection has emerged as the most promising technology, integrating remote sensing and various deep learning-based computer vision technologies [17,18]. Traditional video-based forest fire identification does not predict early fires with ease due to the challenging forest environment and constrained circuit ranges and difficulties in camera deployment. Moreover, the coverage of a single camera is limited. Fire detection in large-scale forest environments would necessitate substantial investments in financial, material, and human resources. At present, technology falls short of providing comprehensive camera coverage across entire forests. Fortunately, the development of UAVs has attained a more mature stage, while video, image, and image processing technologies continue to advance [19,20]. UAV-based image analysis for forest fire smoke detection systems can effectively conduct inspections of mountains and forests [21,22,23]. The UAV’s camera captures images or videos of the mountains and forests, eliminating the cumbersome process of camera deployment and reducing the allocation of manpower, material resources, and financial resources. Real-time monitoring in the early stages of forest fire smoke becomes feasible, enabling the timely conveyance of valuable information to relevant authorities [24,25]. The framework of a fully automated UAV-based forest fire smoke detection system is depicted in Figure 1.
A UAV takes off and lands via a UAV Mobile Airport or a UAV Automated Field Airport. Initially, the UAV conducts inspections of the forest following predetermined routes, collecting image and video data of the mountainous terrain. Subsequently, the UAV transmits the data to the Forest fire Analysis Platform, maintaining a continuous interaction with the Cloud Control System Ground Station throughout the entire process. Ground station personnel can monitor real-time images of the mountains and forests via the onboard camera and issue control instructions to the UAV. The Forest fire Analysis Platform then processes and analyzes the captured images. If smoke is detected, the Forest fire Analysis Platform sends an alert to the Fire Department. Additionally, ground station personnel can promptly provide fire-related information to the Fire Department as needed.
In recent years, deep learning-based smoke detection algorithms have been proposed, each showcasing promising outcomes. The prevailing smoke detection algorithms for forest fires heavily rely on convolutional neural networks (CNNs). Examples include Faster-RCNN [26], SSD [27], R-CNN [28], and the YOLO (You Only Look Once) series [29,30,31,32]. However, there are still some notable challenges that remain: (1) The variable flying altitudes of UAVs pose significant alterations in the scale of the captured objects. (2) The movement of the UAV across mountainous and forested areas causes a complex background of images, in which the presence of trees, fluctuations in weather conditions, illumination disparities, and the interference of clouds, fog, and other smoke particles make it worse. (3) Ensuring detection accuracy often necessitates augmenting the number of network layers, parameters, and calculations in extant models, but such augmentation inevitably affects the detection system’s real-time performance. (4) Collecting authentic forest fire smoke samples is also a challenge. The majority of the current samples are synthetically generated, and issues pertaining to inadequate sample size and imbalanced datasets persist.
To meet these challenges, we propose a novel system for forest fire smoke detection and notification that leverages an enhanced YOLOv5s model [33] and UAV imagery. Initially, the network structure is optimized, and pre-trained weights are obtained through the employment of transfer learning. Subsequently, after employing our enhanced model to the actual datasets, accurate identification of smoke emanating from forest fires can be achieved. The performance of the conventional YOLOv5s network is bolstered to facilitate swift and accurate detection of forest fire smoke, and the findings are substantiated through laboratory testing. The contributions of this study are summarized as follows:
  • We formulate the framework of a fully automated system for forest fire smoke detection, which is based on UAV images and deep learning network;
  • We use the K-mean++ method to improve the clustering of anchor boxes, substantially diminishing the categorization error;
  • We enhance the YOLOv5s model by introducing an extra prediction head tailored for small-scale smoke target detection, swapping out the original backbone with a novel partial convolution (PConv) to improve computational efficiency, and by incorporating Coordinate Attention, which enables the model to pinpoint regions of interest in wide-ranging images, effectively filtering out clouds and similar distractors;
  • We employ data augmentation and transfer learning strategy to refine the model construction and speed up the convergence of model training.

2. Related Works

Forest fires are a significant environmental threat, causing loss of biodiversity, alteration of ecosystems, and impacting human lives and properties. Early detection is critical for effective firefighting and minimizing damages. Smoke detection plays an indispensable role in the early monitoring of forest fires. Its rapid dispersion, visibility, and integration with contemporary sensor technologies render it not only an effective complement but also a potential substitute for flame monitoring. In this context, various forest fire smoke detection methods and systems have been developed. These methods include satellite-based smoke detection, ground-based sensors for smoke detection, and UAV-based detection, each with its unique approach, advantages, and limitations. Moreover, image processing technology occupies a crucial position in the detection of forest fire smoke.

2.1. Comprehensive Approaches for Forest Fire Smoke Detection

Satellite-based smoke detection refers to the use of satellites to detect and monitor smoke plumes resulting from forest fires. These systems typically employ remote sensing technologies, utilizing sensors that can capture data in various spectrums, including optical [34] and thermal [35]. By leveraging space-based technologies, these systems provide a unique vantage point for detecting and monitoring smoke from forest fires on a global scale. These satellite-based smoke detection systems offer invaluable benefits in forest fire management, especially in terms of wide-area coverage and the potential for early detection. However, they are not without limitations, such as susceptibility to atmospheric conditions and resolution constraints. The ongoing advancements in technology, particularly in AI and machine learning, are set to mitigate these limitations and further enhance the effectiveness of these systems.
Ground-based sensors designed for smoke detection consist of various sensor types strategically deployed in forest areas. These networks primarily focus on detecting smoke particles, a critical early indicator of forest fires. Optical smoke detectors, which operate on light-scattering principles, and ionization detectors for detecting ion concentration changes due to smoke, are commonly used [36,37]. Additionally, sensors for particulate matter, carbon monoxide, and carbon dioxide are incorporated for enhanced detection accuracy [38]. Kadir et al. [39] integrated commonly used sensors for fire detection, such as temperature, smoke, haze, and carbon dioxide, to determine the location and intensity of fire hotspots. This multi-sensor approach yields more accurate results than using a single sensor. Ground-based sensor networks are typically wired systems with fixed sites, making their deployment and connection relatively complex. Building upon this, some scholars have researched wireless sensor networks (WSNs), which operate through interconnected wireless communication nodes, thereby offering greater flexibility in terms of deployment and coverage area. Wireless sensor networks (WSNs) consisting of interconnected sensors capable of detecting temperature, smoke, and changes in humidity have been increasingly used for early forest fire smoke detection. Benzekri et al. [40] proposed an early forest fire detection system based on wireless sensor networks (WSNs), which collects environmental data from sensors distributed within the forest and employs artificial intelligence models to predict the occurrence of a forest fire. These sensors and networks offer continuous monitoring and can provide valuable data for fire prediction models. Nonetheless, maintenance and energy consumption are challenging aspects of ground-based sensors.
Over the past decade, UAVs have seen an increase in their utilization due to their advantages, such as flexibility, high resolution, and the quality of data acquired. UAVs equipped with sensors and cameras offer a promising approach for forest fire detection. These UAVs, outfitted with cameras, are adept at obtaining visual evidence of smoke and flames in treacherous terrains. Yuan et al. [41] proposed a method for automatically detecting forest fires in infrared images using UAVs. This algorithm employs brightness and motion cues, combining image processing techniques based on histogram segmentation and the optical flow method for flame pixel detection. Complementing this, the integration of specialized gas sensors [42,43], such as those for detecting carbon dioxide or carbon monoxide, enhances UAVs’ capability to discern and scrutinize the constituents of smoke. These systems offer real-time data and high-resolution imagery and can access remote areas. However, UAVs, characterized by their high-speed mobility and varying distances of capture, often pose challenges for existing algorithms, such as difficulties in recognizing small target smoke and distinguishing between target and background.
To achieve faster and more accurate forest fire smoke detection, some scholars have proposed the integration of multiple technologies to form comprehensive systems. Integrated systems combining various technologies, such as satellite imagery, UAVs, sensor networks, and image processing algorithms, are being explored to create comprehensive fire detection systems. Peruzzi et al. [44] proposed an integrated fire detection system based on audio and visual sensors, utilizing two embedded machine learning (ML) algorithms running on low-power devices to identify and transmit the presence of forest fires. Muid et al. [45] employed ground-based sensors and UAVs for forest fire detection and monitoring, successfully collecting images and weather-related parameters from forests and plains through an integrated system, thus playing a role in monitoring. These methods are effective but can face delays in data processing and transmission. Also, outdoor sensors may need regular maintenance and could have durability issues.
The amalgamation of UAV technology with cutting-edge image processing methods has emerged as a current trend of significant interest. This integration capitalizes on the UAVs’ capability to swiftly reach remote or otherwise inaccessible areas, while simultaneously employing advanced and superior image processing techniques to achieve the real-time and precise detection of forest fire smoke. However, the challenges of detecting small targets amidst complex backgrounds in smoke detection tasks impose stringent demands on the performance of image processing algorithms employed in UAV-based smoke detection. Additionally, distinguishing actual smoke from objects that resemble smoke presents a significant hurdle. Therefore, image processing algorithms applied in UAV-based smoke detection are of paramount importance.

2.2. Image Processing Approaches for Smoke Detection

The development of image processing algorithms has enabled the detection of forest fires through cameras and other visual data sources. Techniques such as color analysis, motion detection, and smoke pattern recognition are employed. However, these methods can be prone to false alarms due to environmental factors, like fog or dust. In response to this, numerous experts have conducted various studies. Smoke detection methods based on image processing primarily fall into two categories: traditional image processing techniques and deep learning-based image processing approaches.

2.2.1. Conventional Image Processing Approaches

Conventional image processing for smoke detection methods primarily rely on the spectral characteristics of smoke. These methods include visual interpretation, multi-threshold techniques, pattern recognition algorithms, and other similar methods. Visual interpretation employs three spectral bands of a satellite sensor, representing red, green, and blue channels, to generate true-color or false-color composite images, enabling manual visual discrimination of smoke. For instance, the true-color RGB imagery synthesized from MODIS bands 1, 4, and 3 has been used in conjunction with the false-color imagery composed of bands 7, 5, and 6 [46]. For seasoned individuals, visual interpretation serves as an effective technique for identifying smoke. However, this method has a significant drawback in that it cannot automatically process vast amounts of data. The multi-threshold method retrieves the localized optimal thresholds of reflectance or brightness temperature (BT) from established spectral bands based on historical data. These thresholds are subsequently amalgamated to eliminate cloud classes and certain ground objects, ultimately enabling the identification of smoke. For example, Li et al. [47] proposed a targeted identification approach using Himawari-8 satellite data, incorporating a connectivity domain distance weight based on multi-threshold discrimination to detect fog beneath clouds. This method exhibits high accuracy in the detection of sea and land fogs and, with limited error introduction, can effectively discern some instances of fog beneath clouds. While this approach can be effective in local areas, it poses challenges in determining the optimal threshold due to the variability of spatio-temporal information. As a result, small smoke ranges are prone to being overlooked, leading to a decrease in the promptness of fire alarms. In addition, Jang et al. [48] analyzed the variations in light scattering distributions of different colored smokes, assessing the color classification methods of smoke particles entering the smoke detectors to extract color information from the smoke, enabling the detection of fire smoke. Nevertheless, this approach overlooks the fact that certain smoke colors (such as black or gray) resemble the background environment (e.g., clouds and dust). The smoke detection method that uses a pattern recognition algorithm is an image processing technique that leverages the spectral features of smoke and typical ground objects to categorize smoke images and identify smoke pixels. Asiri et al. [49] developed a new feature space to represent visual descriptors extracted from video frames in an unsupervised manner. This mapping aims to provide better differentiation between smoke-free images and those depicting smoke patterns. This method employed training samples from a few classes, such as cloud and water, in addition to smoke. Despite its utility, the effectiveness and applicability of these smoke detection methods may be diminished when applied to diverse and intricate categories found in UAV imagery. This limitation becomes particularly evident in areas such as mountains and forests, where only a limited number of standard ground object categories are taken into account.
Most conventional image-based smoke detection algorithms utilize a pattern identification process that involves manual feature extraction and classification, where features are manually extracted and recognizers are designed. Following the extraction of candidate regions, static and dynamic smoke features are employed for smoke identification. Extracting the most crucial smoke features is challenging, and the detection process is relatively sluggish.

2.2.2. Deep Learning-Based Image Processing Approaches

In recent years, the domain of deep learning has witnessed notable advancements owing to progress in hardware capabilities, the capacity to handle extensive datasets, and substantial enhancements in network architectures and training methodologies. Deep learning-based smoke detection algorithms can be classified into two-stage methods and one-stage methods. Two-stage methods include well-known representatives, such as R-CNN [28] and Faster R-CNN [26]. On the other hand, one-stage methods are exemplified by algorithms like SSD [27] and the YOLO series [29,30,31,32]. The development of these deep learning technologies has provided a solid foundation and technical support for UAV-based forest fire smoke detection.

2.2.3. Deep Learning-Based Approaches for UAV-Based Smoke Detection

Numerous deep learning-based techniques have been utilized to discern smoke in UAV-based scenarios. Alexandrov et al. [50] employed two one-stage detectors (SSD and YOLOv2) as well as a two-stage detector (Faster R-CNN) for smoke detection purposes. YOLOv2 outperformed Faster R-CNN, SSD, and traditional hand-crafted methods when evaluated against a large dataset of genuine and simulated images. Ghali et al. [51] introduced a novel approach based on model ensemble, combining EfficientNet and DenseNet for accurately identifying and classifying forest fire smoke with UAV-based imagery. Mukhiddinov et al. [52] proposed an early detection system for forest fire smoke using UAV imagery, employing an enhanced variant of YOLOv5. Additionally, several methods for small target detection in UAV-based settings have been proposed. Zhou et al. [53] devised a small-object detector tailored specifically for UAV-based imagery, where the YOLOv4 backbone was modified to accommodate the characteristics of small-object detection. This adaptation, combined with adjustments made to the positioning loss function, yielded improved performance in small-object localization. Jiao et al. [54] proposed a UAV aerial image forest fire detection algorithm based on YOLOv3. Initially, a UAV platform for forest fire detection was developed; subsequently, leveraging the available computational power of the onboard hardware, a scaled-down Convolutional Neural Network (CNN) was implemented utilizing YOLOv3. While these approaches demonstrate promising outcomes in object detection, they have yet to integrate real-time capabilities with high accuracy in the realm of forest fire smoke detection. Xiao et al. [55] introduced FL-YOLOv7, a lightweight model for small-target forest fire detection. By designing lightweight modules and incorporating Adaptive Spatial Feature Fusion (ASFF), they enhanced the model’s capability to detect targets of various scales and its real-time performance. However, this method did not specifically target improvements for small-scale objects but rather improved the overall accuracy of evaluation results through feature fusion. Additionally, the evaluation metrics presented in their study were limited, lacking differentiated assessment indicators for targets of varying scales.

3. Proposed Forest Fire Smoke Detection Model and Algorithm

3.1. Proposed Forest Fire Smoke Detection Model

This section discusses the proposed deep learning-based forest fire smoke detection model. Through our model, small target smoke in mountains and forests can be identified more accurately and quickly, so as to detect and prevent forest fires as early as possible.
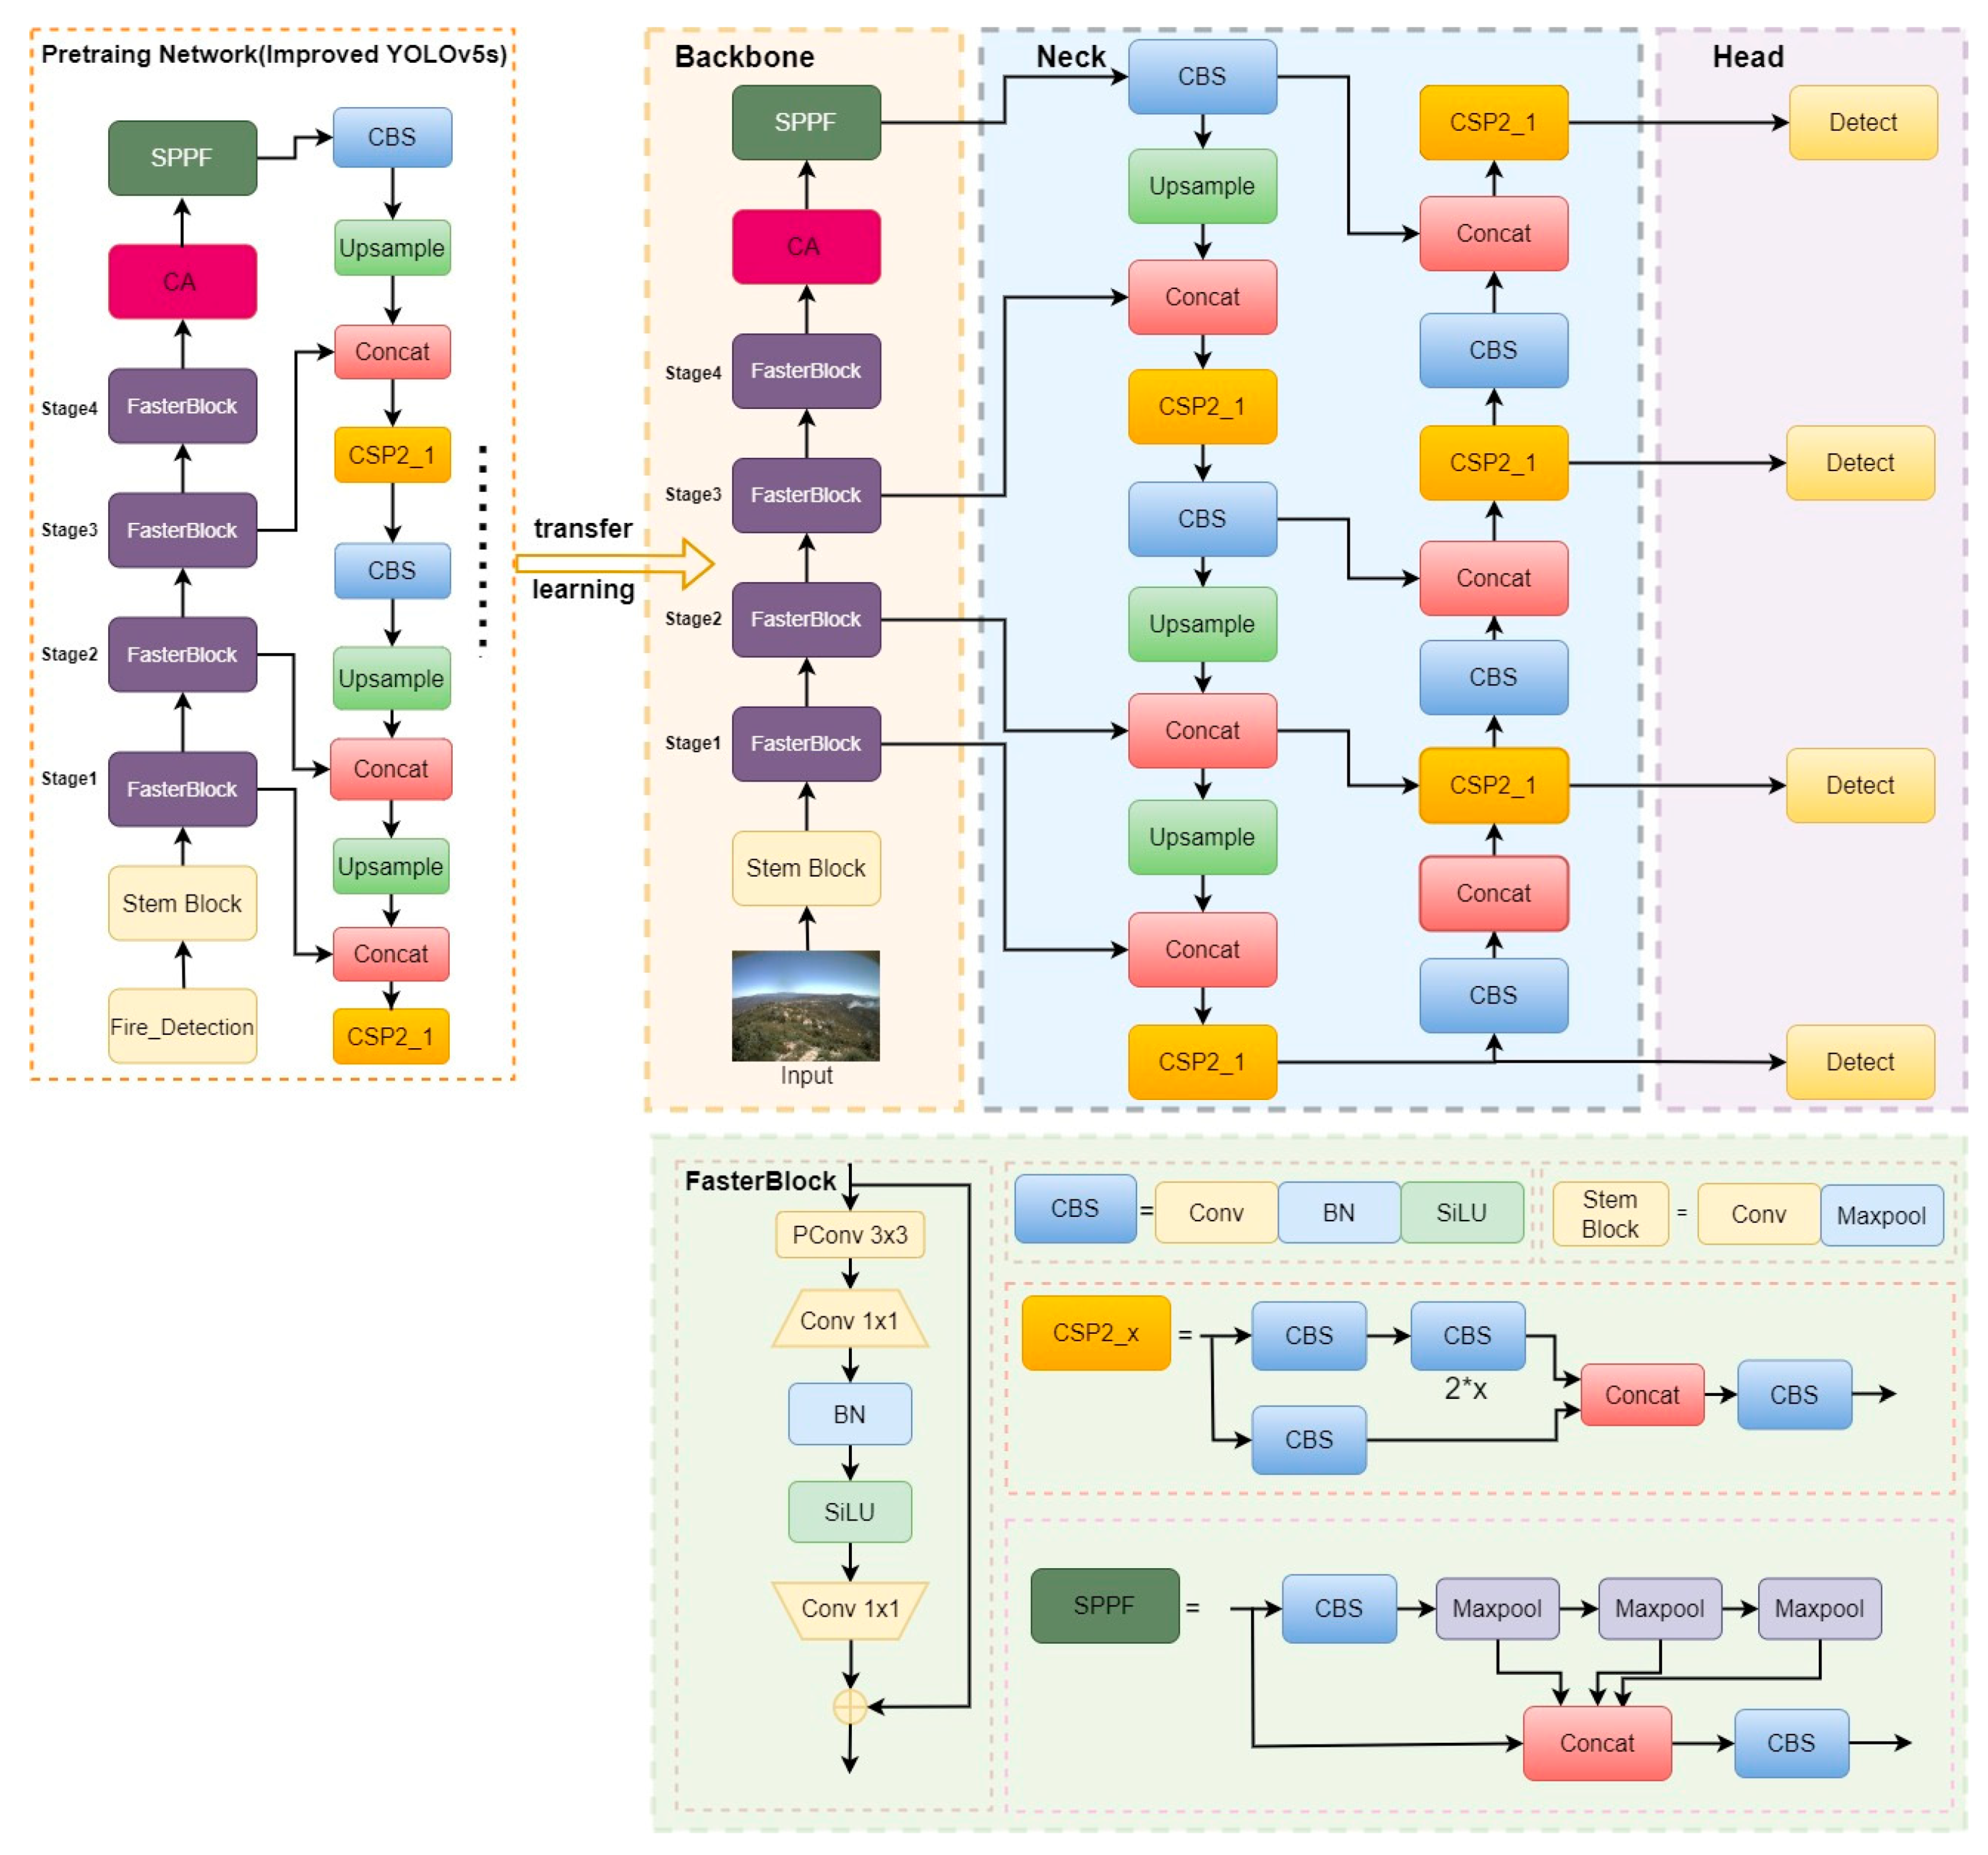
The improved YOLOv5s architecture we propose is illustrated in Figure 2, and the changes are framed by the solid green line. It comprises three primary components: the backbone, the neck, and the prediction heads. The backbone network consists of FasterBlock modules, designed based on partial convolution (PConv) that offers rapid memory access capabilities. Additionally, we integrated a CA module at the end of the backbone, effectively focusing the model’s attention on the foreground smoke targets and distinguishing them from the background to further enhance feature extraction. Lastly, the model utilizes four prediction heads, incorporating an additional small object detection head and a large feature map to reinforce feature extraction for small-scale targets. This integration enables the model to establish long-range dependencies and capture global contextual information within the input image, allowing for an improved understanding of the semantic and spatial relationships of objects, thus providing powerful foreground-background distinction and small-scale smoke recognition capabilities.
To more clearly demonstrate the distinctions between the method proposed in this paper and the original YOLOv5s, we also included a comparative table of modules from different methods, as shown in Table 1.

3.1.1. Original YOLOv5

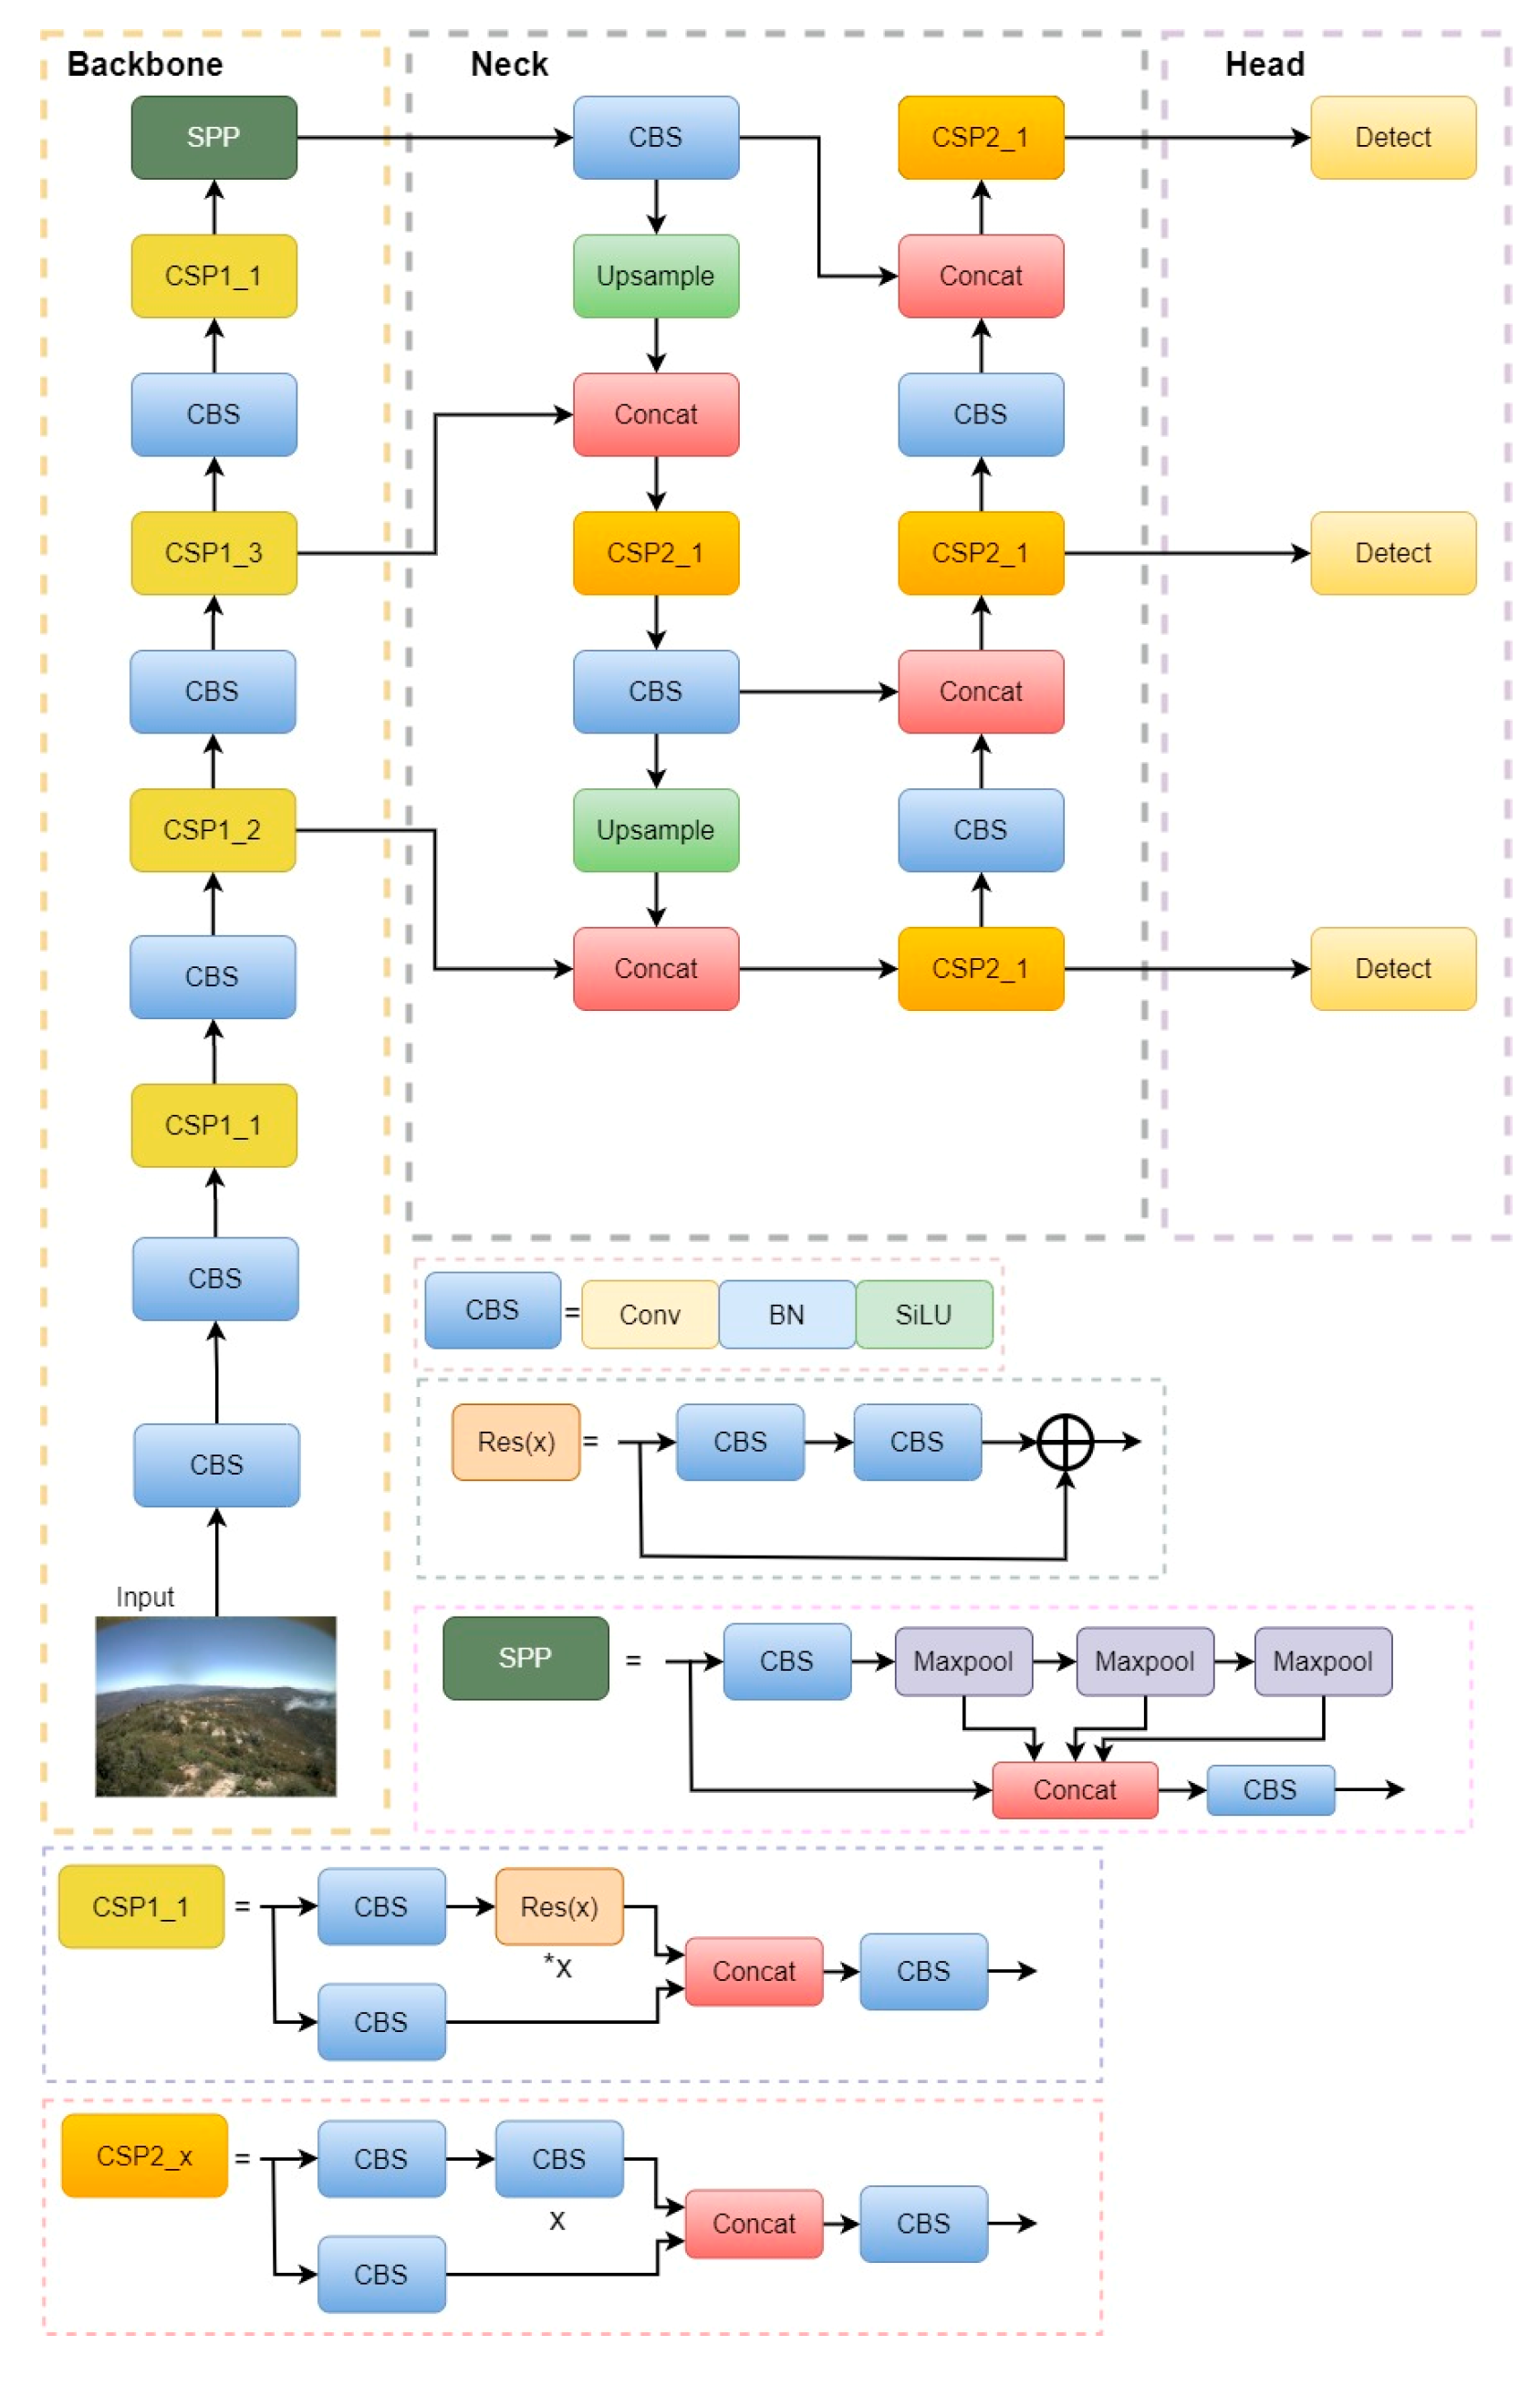
Our proposed methodology builds upon the YOLOv5s model, a widely-utilized framework for object detection. Figure 3 provides an overview of the YOLOv5 architecture, which can be delineated into three primary components: the backbone network for extracting features, the neck network for fusing features, and the head network for detecting the class and location of the target through regression. The YOLOv5 architecture is characterized by its straightforwardness and efficiency.
The YOLOv5 model incorporates adaptive image scaling and batch normalization of input image size to enhance its performance. The initial size of the anchor frame is automatically determined by the model, and the preprocessing of the image data is conducted. During training, K-means clustering is employed to ascertain the optimal size of the anchor frame based on annotated samples.
The backbone network of YOLOv5 comprises Conv and CBS modules, along with an SPP structure. The CBS module facilitates the extraction of feature information from the images through convolutional operations. To tackle the issue of non-uniform image sizes, an SPP layer is introduced to the backbone network.
The neck of YOLOv5 consists of a bottom-up Feature Pyramid Network (FPN) and a top-down Path Aggregation Network (PAN) structure. The fusion of multi-scale features from FPN and PAN empowers the feature map to encompass semantic and feature-based information, thereby ensuring the precise identification of targets of varying sizes.

3.1.2. K-Means++ Methodology

YOLOv5s incorporates the utilization of anchor boxes into the procedure of detecting objects. Anchor boxes are predefined bounding boxes with fixed sizes and aspect ratios. In the training stage, initial anchor boxes are adjusted to align with those actual boundary boxes, which enables models to undergo effective training and generate more precise predictions. Consequently, the anchor parameters within the original YOLOv5s model necessitate adaptation in accordance with the specific training requirements of diverse datasets. Based on the distinctive attributes of the YOLOv5s model, it becomes imperative to establish the width and height of nine clustering centers, which are subsequently employed as the values for the anchor parameters within the network configuration file. K-means clustering, renowned for its simplicity and efficiency, has been extensively employed in the realm of clustering. Within the framework of YOLOv5s, the K-means methodology is employed for obtaining a primary set of k anchor boxes. However, the K-means method suffers from requiring predetermined initial clustering centers, making it arduous to determine these values. To overcome this limitation, the K-means++ method, characterized by its enhanced selection of initial points, is employed to acquire the initial primary anchor boxes, which substantially mitigates the classification error rate, thereby facilitating the attainment of an anchor box that is appropriate for the detection of small-scale smoke.
The procedure for selecting an anchor box utilizing K-means++ method is as follows:
(1) Randomly select a central coordinate to be the primary center from the given dataset X .
(2) Calculate the Euclidean distance and closest center between each sample. The probability of samples being chosen as the subsequent center P x is determined using Equation (1):
P x = E ( x ) 2 x X       E ( x ) 2
where E ( x ) represents the Euclidean distance and x X with probability P x .
(3) Determine the subsequent clustering center by employing random turntable selection according to the probability.
(4) Repeat steps (1)–(3) until k clustering centers are confirmed. The value of k can be defined.

3.1.3. The Design of Backbone

In the original YOLOv5’s backbone network, the utilization of conventional convolutional CBS modules leads to a considerable redundancy in the intermediate feature map computation, resulting in increased computational costs. To address this, we introduced the FasterBlock module, drawing inspiration from the concept of FasterNet [56], to serve as the backbone network for extracting features from UAV images. We employed the innovative technique of partial convolution (PConv), which enables a more efficient extraction of spatial features by reducing redundant computations and memory access simultaneously.
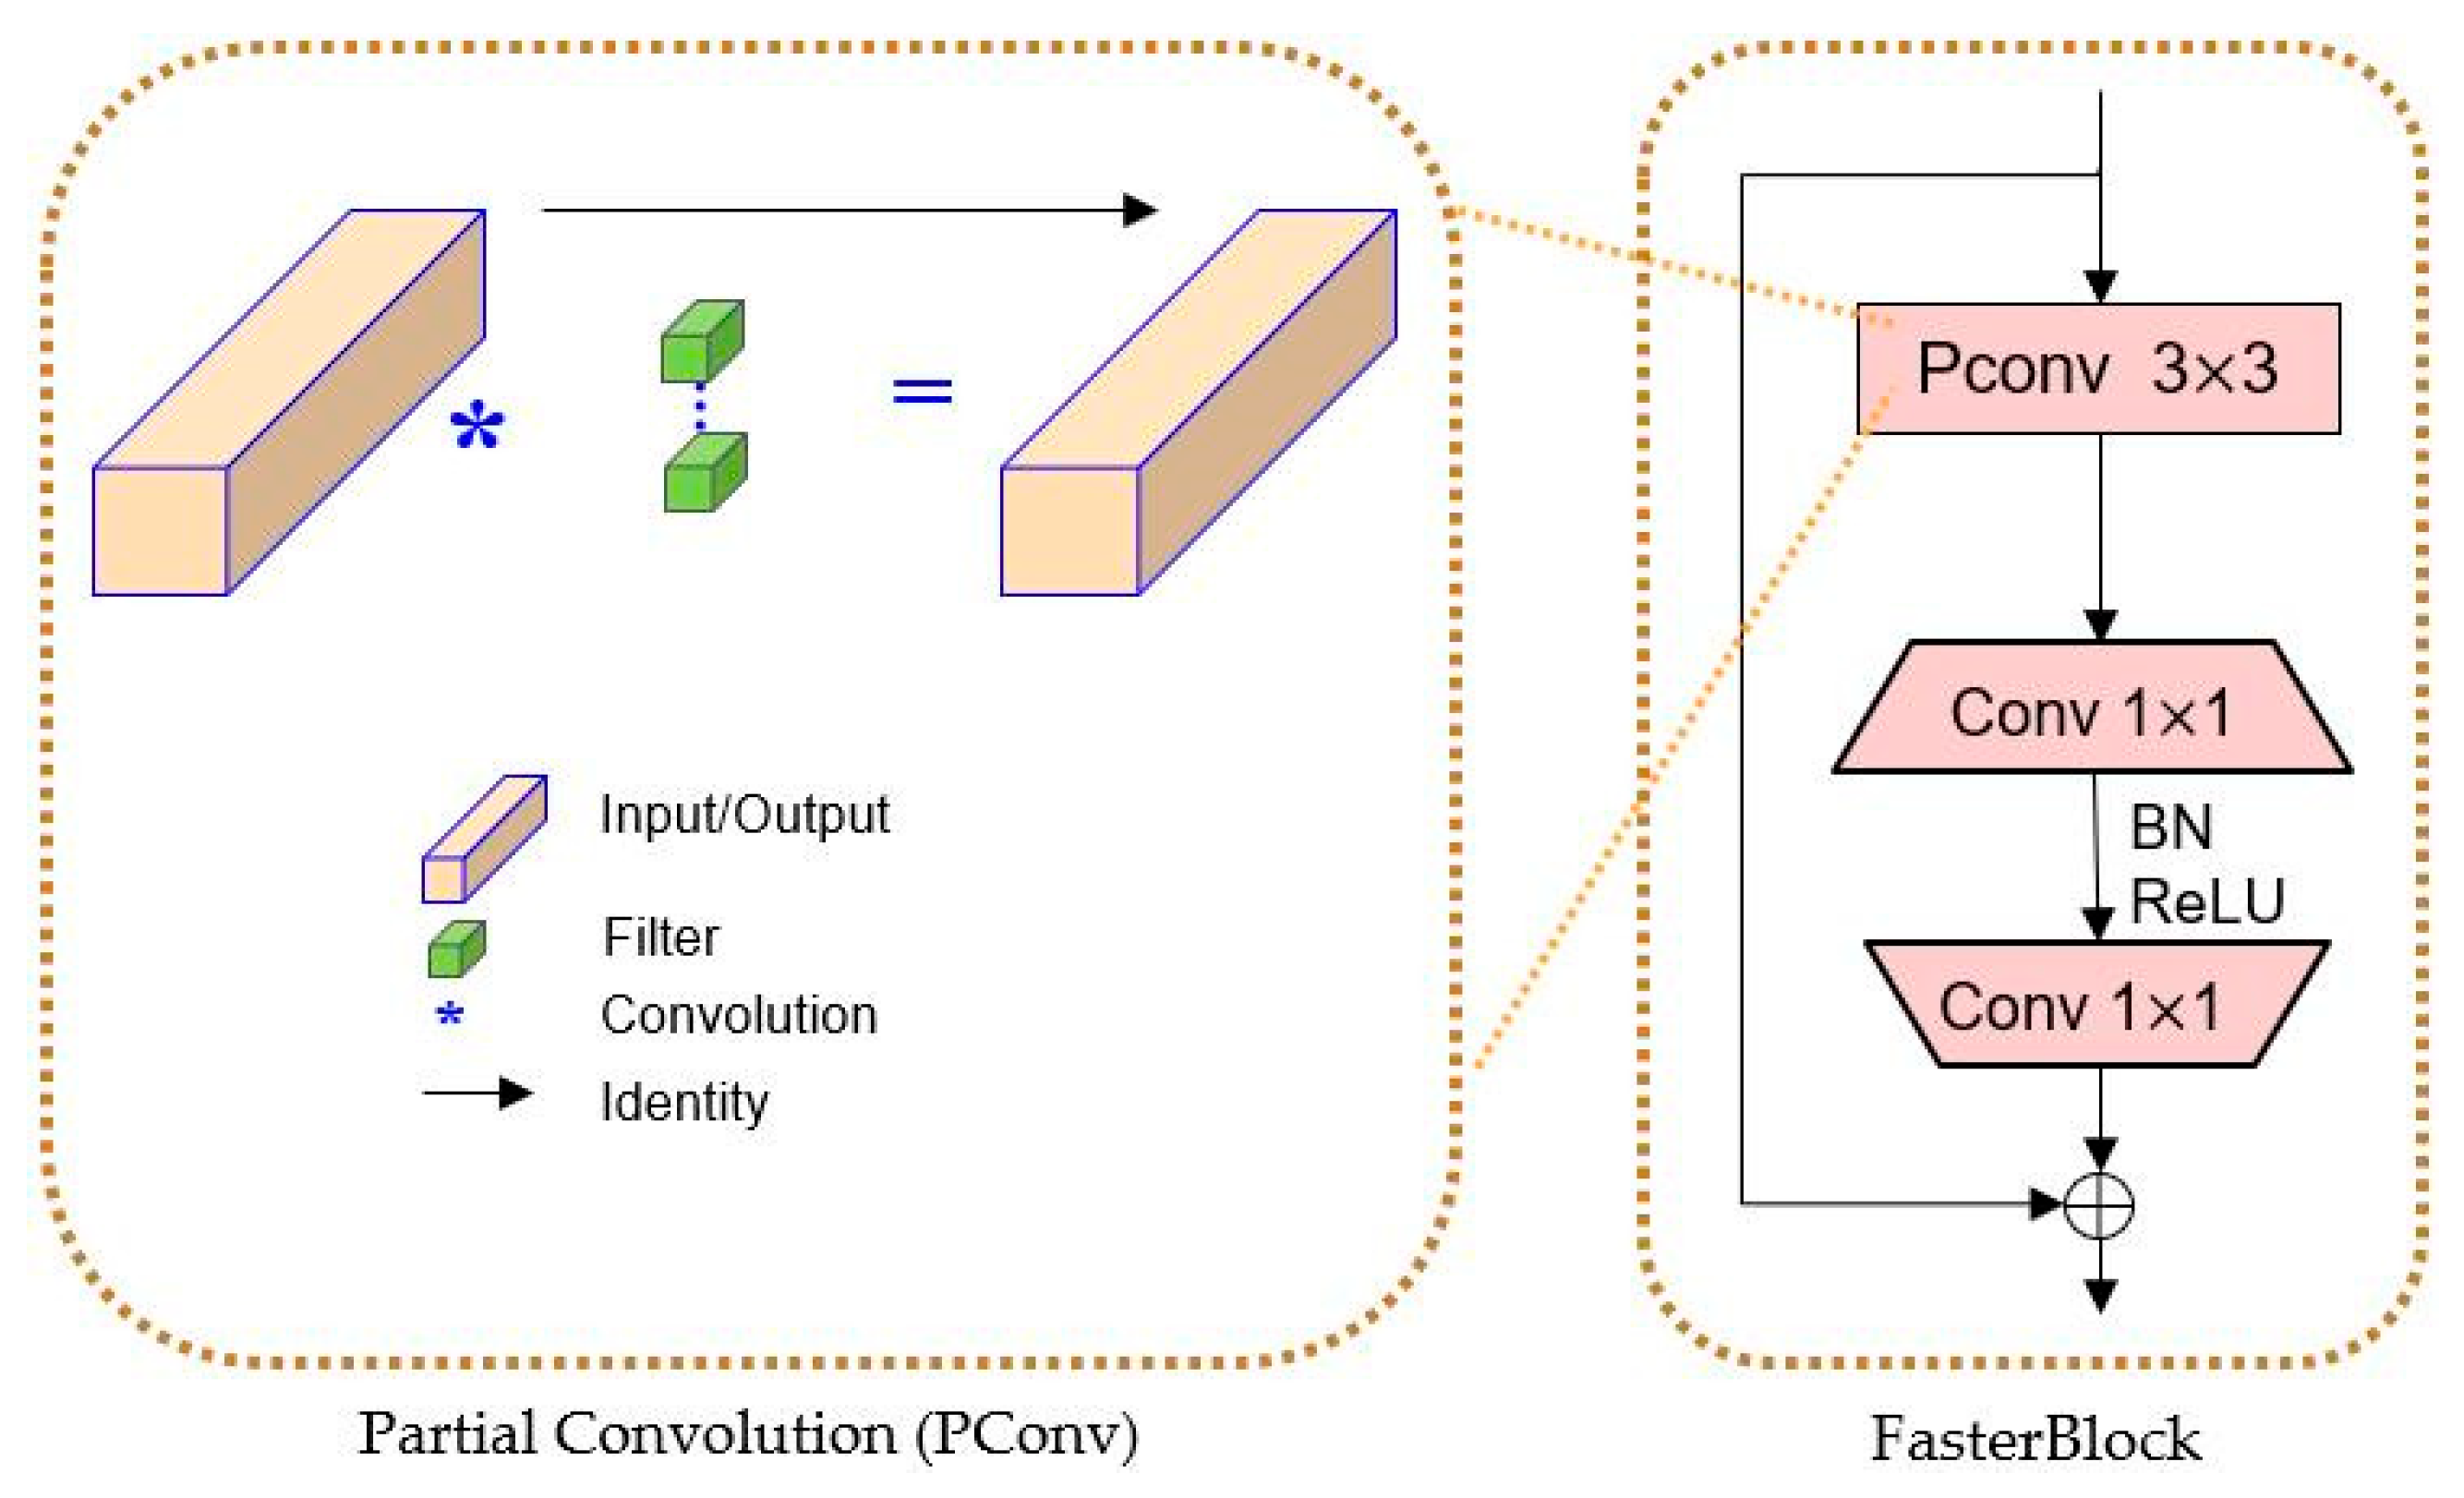
The PConv technique offers a computationally efficient solution by applying filters exclusively to a limited set of input channels, while leaving the remaining channels untouched. Compared to standard convolution, PConv achieves lower floating-point operations (FLOPs), yet surpasses depthwise/group convolution in terms of FLOPS. The design of PConv is depicted in Figure 4, which leverages redundancy within the feature maps and selectively applies regular convolution (Conv) solely on a subset of input channels. It exclusively applies regular Convolution to a segment of the input channels for spatial feature extraction, leaving the remaining channels unaffected. For contiguous or regular memory access, PConv treats the first or last continuous “ c p ” channels as representatives of the entire feature maps for computation. Without loss of generality, we assumed that the input and output feature maps possess an equal number of channels. PConv exhibits superior computational efficiency compared to regular convolution, albeit being more computationally intensive than Depthwise convolution/Group convolution (DWConv/GConv). Essentially, PConv maximizes the computational capacity of the device it operates on. Therefore, the FLOPs of a PConv are only:
F L O P s P C o n v = h × w × k 2 × c p 2
where h and w are the width and height of the feature map, respectively; k is the size of the convolution kernel; and c p is the number of channels operated by conventional convolution. So, the FLOPs of PConv is only 1 16 of a regular convolution with a typical partial ratio r = c p c = 1 4 .
Additionally, PConv has a smaller amount of memory access:
M e m o r y A c c e s s P C o n v = h × w × 2 c p + k 2 × c p 2 h × w × 2 c p
which is only 1 4 of a regular convolution for a typical partial ratio r = c p c = 1 4 . And the remaining (c- c p ) channels are not involved in the calculation; thus, there is no need to access the memory.
Furthermore, we employed a 3 × 3 convolution kernel. Two 3 × 3 kernels and one 5 × 5 kernel possess an equivalent receptive field, while three 3 × 3 kernels and one 7 × 7 kernel share the same receptive field. In situations where the receptive field remains constant, utilizing three 3 × 3 convolution kernels necessitates fewer parameters compared to employing a single 7 × 7 convolution kernel. This reduction in parameters undoubtedly diminishes model complexity and accelerates training. Despite having an identical receptive field, the 3 × 3 convolution exhibits greater nonlinearity and enables the representation of more intricate functions.
Consequently, we devised the FasterBlock module by leveraging PConv. Figure 5 illustrates the structure of FasterBlock, where PConv is employed to reduce computational redundancy and memory access. The functioning of FasterBlock is demonstrated in Figure 5 as well. We used a BN layer and a ReLU layer between the Convolutions. The benefit of BN is that it can be incorporated into adjacent Conv layers by means of structural reparameterization for faster inference. By incorporating FasterBlock into the YOLOv5 backbone, we replaced certain CSP modules while preserving the original YOLOv5 architecture.

3.1.4. Detection Head for Small Smoke Objects

Owing to the abundant quantity of diminutive entities present within the dataset of forest fire smoke, the efficacy of the YOLOv5 detection layer in discerning these minute targets is deemed inadequate. Consequently, several optimizations were implemented. The K-means++ clustering algorithm was employed to form clusters of anchor boxes, yielding six object boxes for each anchor box type. Additionally, a reduced anchor preselector and a novel detection layer were incorporated into the head module, aimed at identifying shallow feature maps that encompass relatively comprehensive feature information. The parameters for the reduced anchor preselector are [5,6,8,11,14,15], which indicate the sizes of the anchor boxes used: 5 × 6, 8 × 14, and 15 × 11. These modifications guarantee a diminished receptive field and an enhanced aptitude for recognizing small targets. These alterations fortify the model’s capability to detect diminutive objects, while simultaneously upholding the accuracy in identifying general objects.

3.1.5. Coordinate Attention Mechanism

It has been demonstrated that the incorporation of the channel attention mechanism yields significant performance enhancements to YOLOv5 [33]. However, the utilization of such a mechanism can lead to the issue of neglecting spatial location information within high-level feature maps. Prominent attention mechanisms in this context include SE (Squeeze and Excitation) [57] and CBAM (Convolutional Block Attention Module) [58]. Among these, SE solely focuses on reassessing the significance of each channel by modeling channel relationships, thus overlooking the significance of location message and spatial structure, which are essential for generating spatially selective attention maps. On the other hand, CBAM encodes global spatial information through channel-wise global pooling, thereby compressing the global spatial information into a single channel descriptor. Consequently, this approach has difficulties in preserving the spatial location message of smoke within those channels. Consequently, preserving the spatial location information of objects within the channel becomes challenging.
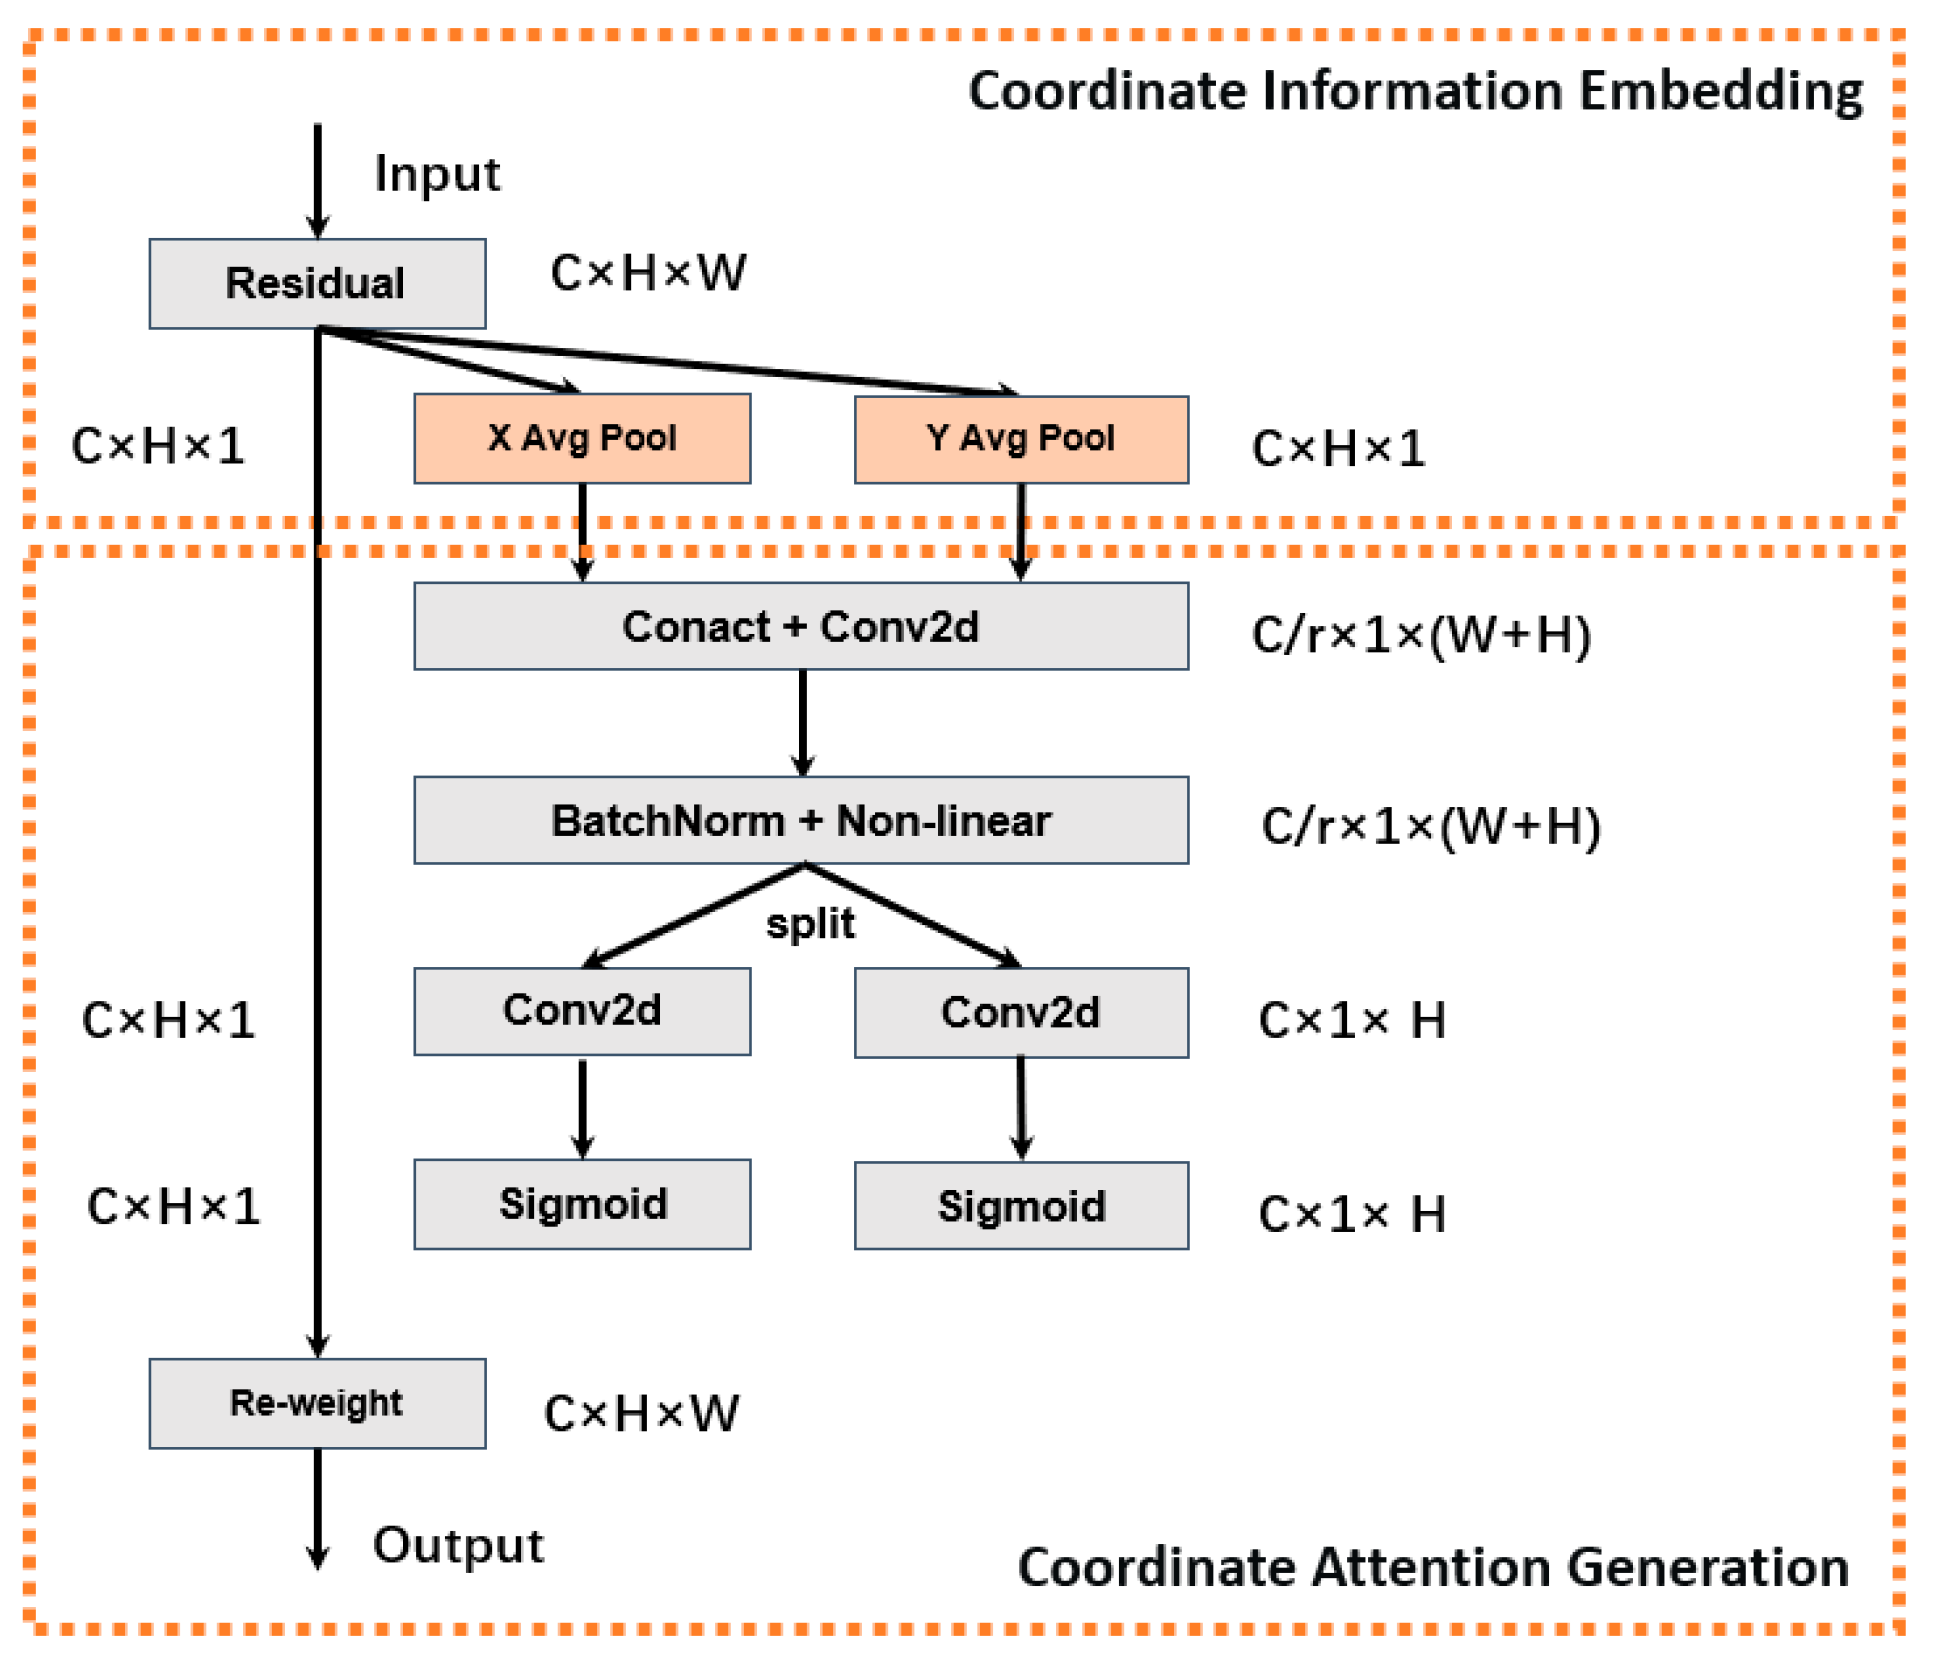
The CA (Coordinate Attention) [59] module considers both channel relationships and location information within the feature space. Its essence lies in encoding channel relationships and long-term dependencies through precise location information. The CA module decomposes attention into the X-direction and Y-direction, employing one-dimensional feature encoding to establish long-range point-space location relationships, thus acquiring more accurate location information. Consequently, direction-sensitive and location-sensitive feature maps are formed via feature encoding, which enhances the representation of the target of interest by incorporating features with precise location information. Figure 6 illustrates the process, which can be divided into two steps.
(1) Coordinate information embedding
The typical method of encoding the spatial location of smoke images through channel attention involves global pooling. This involves pooling low-level features with abundant spatial location information to acquire high-level semantic features. However, this approach is often unable to retain global spatial location information. To address this limitation, we used two one-dimensional feature encodings to decompose the global pooling. This enables greater interaction between distant points and better preserves spatial location information.
The pooling operation is conducted separately in the horizontal and vertical directions, namely, average pooling along the x-axis and average pooling along the y-axis.
Denote H as the height of the input feature map X and W as its width. Coordinate attention encoding is applied to each channel (denoted by c) of X in both the x-axis and y-axis directions:
Z c = 1 H × W i = 1 H   j = 1 W   x c ( i , j )
where x c is the feature map of the c-th channel.
Then, the output of the c-th channel with height h in the horizontal direction (x-axis direction) after pooling is characterized by:
z c h ( h ) = 1 W 0 < i < W       x c ( h , i )
Similarly, the output of the c-th channel with the weight ω in the vertical direction (y-axis direction) can be written as:
z c ω ( ω ) = 1 H 0 < j < H       x c ( j , ω )
The two pooling methods mentioned above operate along different directions of the same dimensional features, and the resulting aggregated features have some sensitivity to all values in both the x-axis and y-axis directions of the feature map. The two transformations were employed to ensure that the attention module captures the long-range dependencies of the features along one spatial dimension while retaining the exact location message of the features in the other spatial dimension. This approach helps the network to more accurately identify the relevant information.
(2) Coordinate attention generation
The method described in Section 1 is used to decompose and pool the feature map from two dimensions, resulting in pooled features with a larger perceptual field that fully utilizes the information near the foreground target of the smoke image. This pooling method allows distant points on the same dimensional features to maintain their mutual relationships. To integrate these transformed features into the neural network, final features with weights need to be generated.
After embedding the information, the information generation process consists of information fusion and convolutional transformation. Information fusion involves combining all the information from different regional features, followed by convolution, batch normalization, nonlinear activation, and other operations, as shown in Equation (7):
f = δ F 1 ( [ z h , z ω ] )
where z h , z ω is the stitching and fusion of two feature maps of different orientations along the spatial dimension; F 1 denotes the convolution; δ is the nonlinear activation function; and f R C r × ( H + W ) is the intermediate feature map where spatial information is encoded in the horizontal and vertical directions, where r is the reduction rate of the regulatory dimension, and to reduce the dimensionality of the feature vector and improve the efficiency of network training, an appropriate ratio r is chosen to reduce the number of channels. The intermediate feature maps f along the x-axis and y-axis directions are decomposed into f h and f w , which correspond to the two dimensions of the horizontal and vertical directions of the feature map, respectively. The convolutional transform and nonlinear activation are performed on the two tensors, as shown in Equations (8) and (9), respectively:
g h = σ F h ( f h )
g w = σ F w ( f w )
where F h and F w are the 1*1 convolutional change operations, σ is the Sigmoid activation function, and the outputs g h and g w are the attention weights of the horizontal and vertical directions (x-axis and y-axis directions) of the input X, respectively.
Ultimately, the output of the feature x c ( i , j ) , which represents the height and width of input X on the c-th channel is i and j , after the coordinate attention module, can be expressed as Equation (10).
y c ( i , j ) = x c ( i , j ) × g c h ( i ) × g c w ( j )
By multiplying the input feature map X with the attention weights g h and g w along the x-axis and y-axis directions, respectively, we can generate the output feature map with attention weights across the width and height dimensions.
We added a CA module to the YOLOv5 model to increase its capability to capture smoke features from complex backgrounds and improve the attention to the small-scale smoke.

3.2. Transfer Learning and Overview of the Algorithm Flow

The utilization of a deep neural network model necessitates a substantial volume of data to achieve commendable performance. Nevertheless, the limited sample size of the initial fire dataset may render direct model training from scratch ineffective in producing satisfactory detection outcomes.
To address this concern, we employed transfer learning as a means to capitalize on acquired knowledge from a known domain and apply it to the target domain. Fine-tuning, a technique within the realm of transfer learning, entails retraining a pre-trained network on a recognized dataset using the target dataset, with the pre-trained model serving as the initialized model. The resultant model is subsequently fine-tuned on the target dataset to enhance its performance.
In the context of this investigation, we employed transfer learning to train a model tailored to detect small-scale forest fire smoke, with the objective of refining detection accuracy. Specifically, we trained a model for forest fire smoke detection using the original dataset and subsequently employed it to fine-tune a reduced-scale forest fire smoke training set. This process yielded a small-scale forest fire smoke detection model exhibiting improved performance.
To commence, we employed a pre-trained deep learning model based on the publicly accessible Fire_Detection dataset [60] to construct an innovative transfer learning model. Subsequently, we established suitable hyperparameters for the model and defined the training cost function as a weighted summation of the training loss, validation loss, and deep feature distance between the training and validation sets. Lastly, the optimal transfer learning model was ascertained through layer-by-layer training and validation.
We amalgamated the backbone design, the detection head specialized for small-scale smoke, and the CA module into the YOLOv5s model, thus creating an enhanced version known as the improved YOLOv5s. The whole process of forest fire smoke detection, namely, the improved YOLOv5 model, through the utilization of transfer learning, is visually depicted in Figure 7.

4. Dataset and Model Evaluation

4.1. Dataset

4.1.1. Data Acquisition

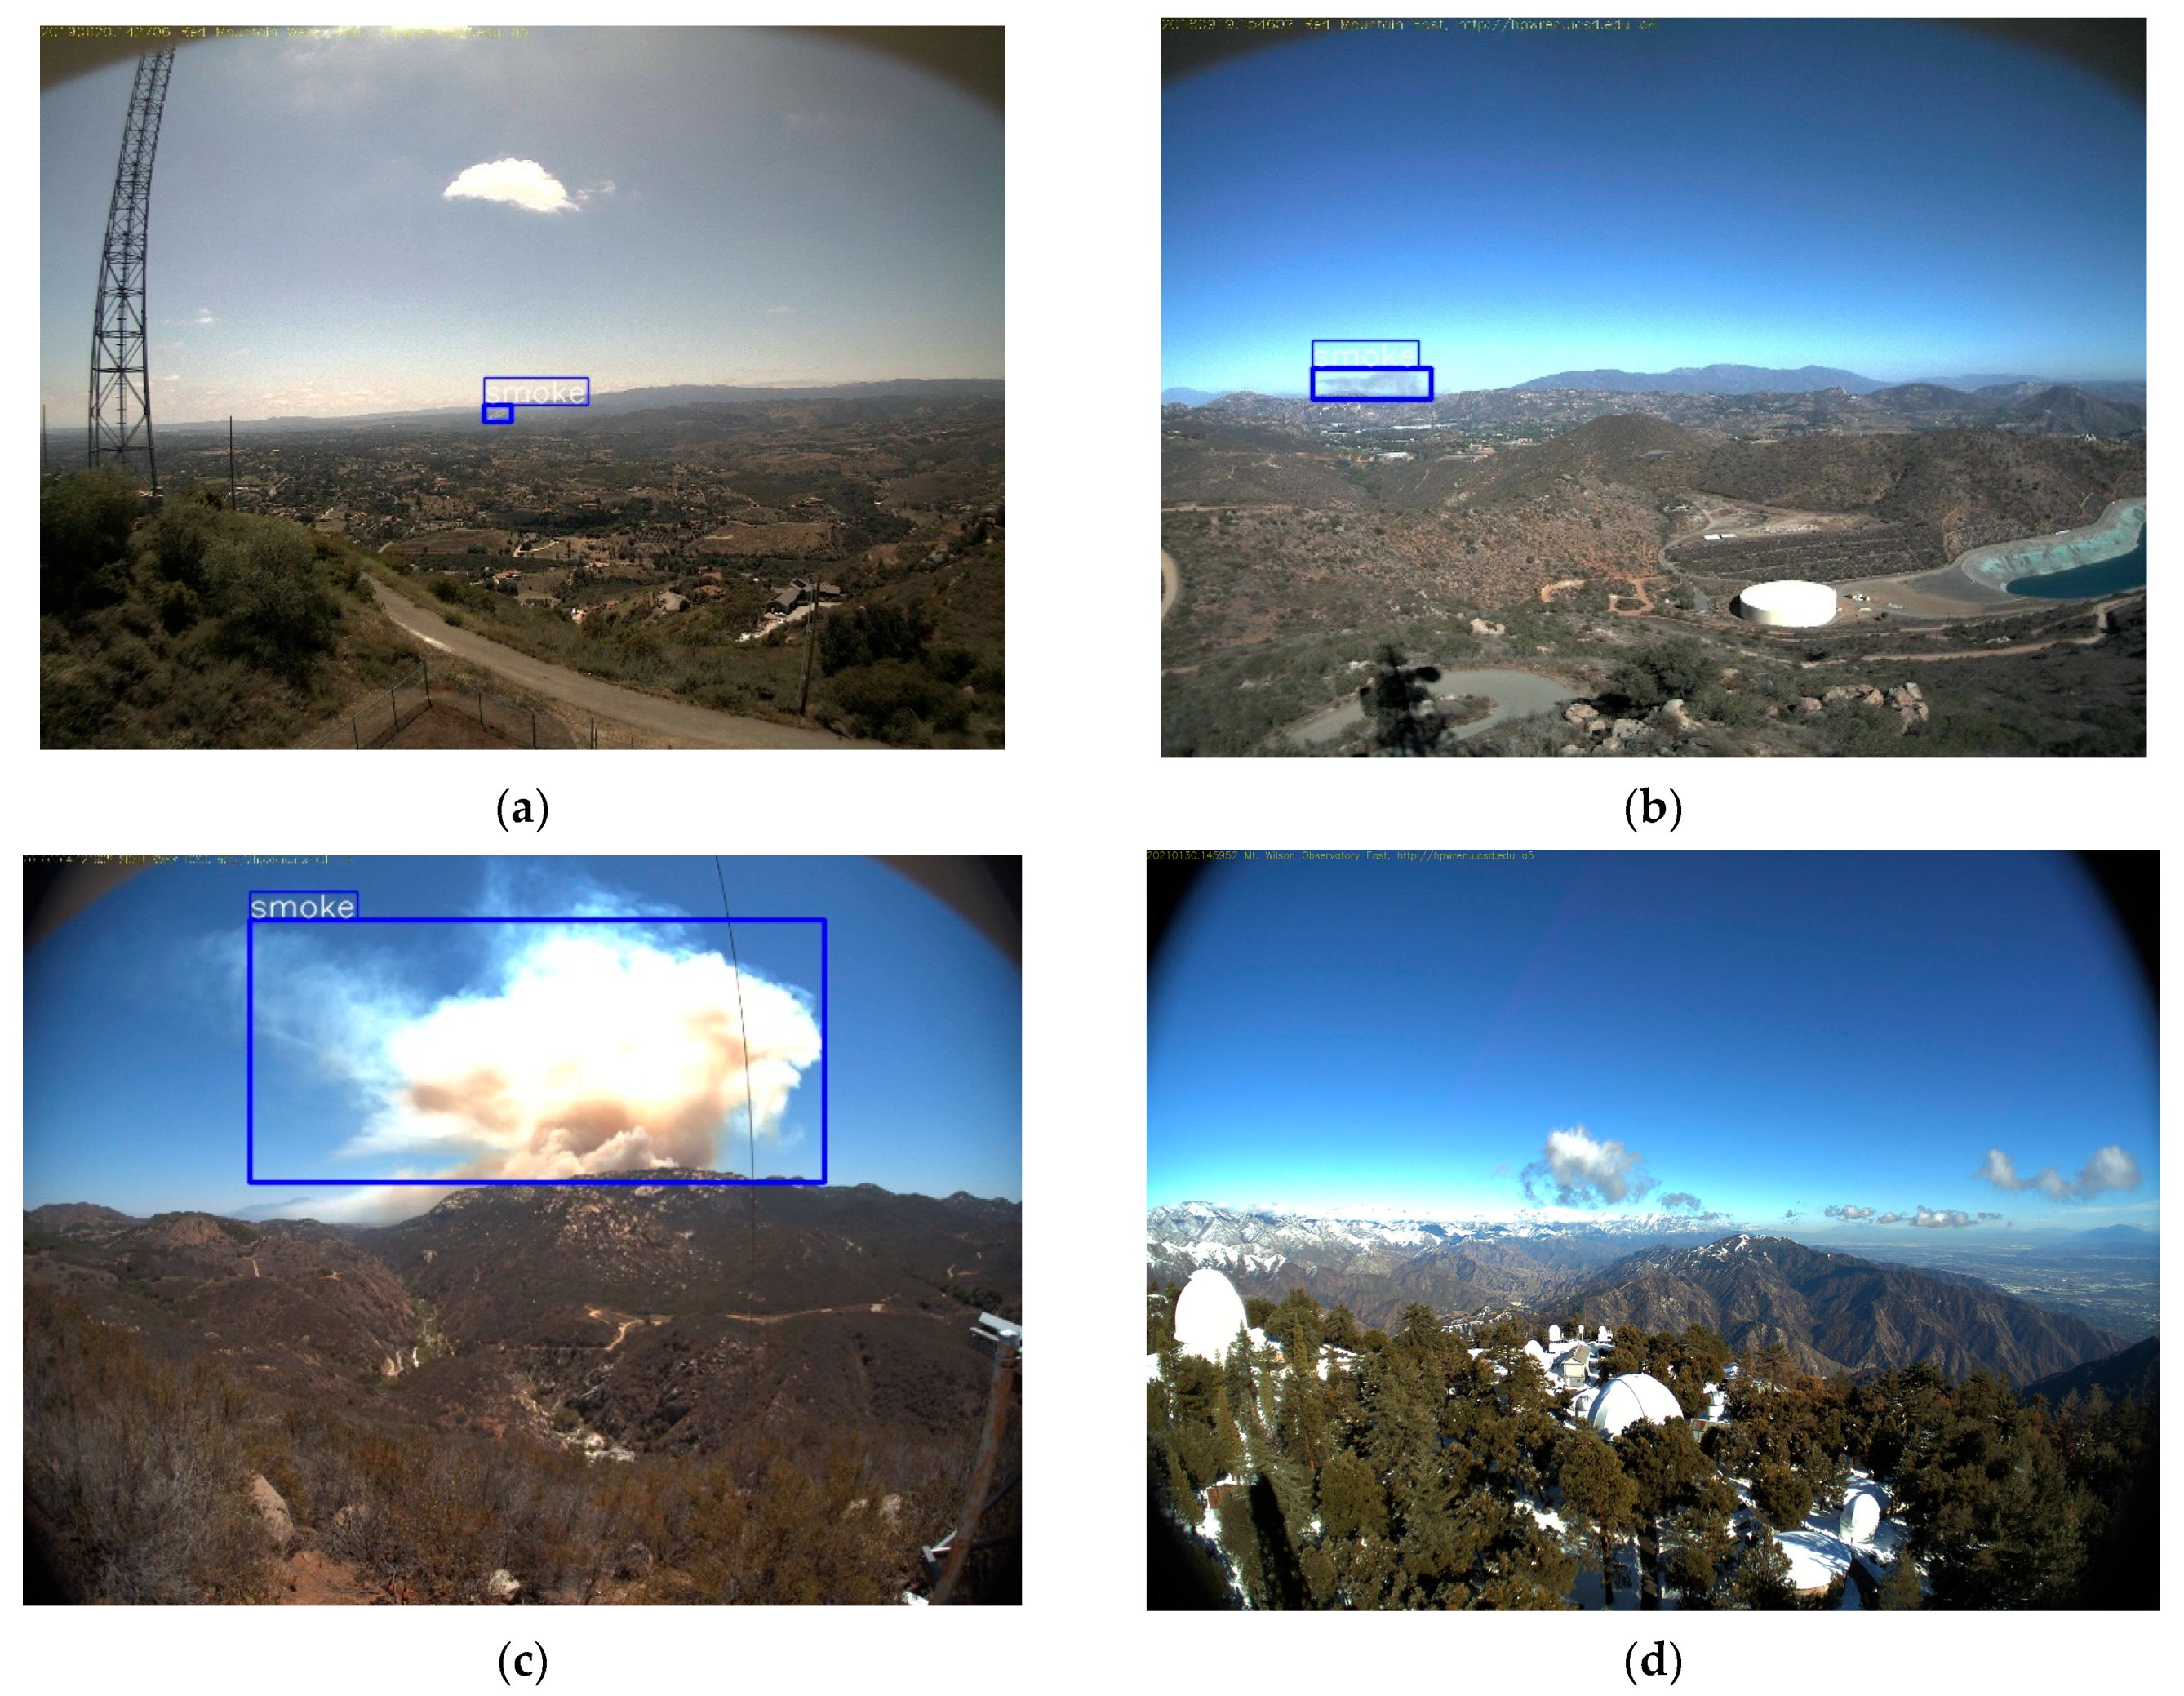
In comparison to well-established image identification tasks, such as face recognition, the availability of datasets for smoke detection is currently limited. The existing public datasets for smoke primarily consist of the fire dataset established by the University of Salerno in 2012 and the dataset published on the official website of Keimyung University in South Korea. As there is a scarcity of datasets specifically designed for forest fire smoke detection, we undertook the collection and creation of a genuine forest fire smoke dataset. However, acquiring authentic forest fire smoke images proves challenging, even in densely forested regions. Therefore, we primarily utilized the existing camera-based forest fire smoke dataset [61], supplemented by forest fire smoke images captured from aerial perspectives using web crawlers. Our dataset comprises 1474 instances of forest fire smoke photos and 1080 instances of non-forest fire smoke photos. In non-forest fire smoke images, a significant number of smoke-like objects, such as clouds and snow, are present. Following comprehensive training, the model possesses an exceptional screening capability to exclude interference from clouds and snow, thereby enhancing its ability to detect smoke accurately. We resized these photos to a resolution of 640 × 640 to serve as input into the network. Figure 8 showcases a selection of sample images from our dataset. The blue box represents the ground truth for the target smoke, which is the annotation bounding box.

4.1.2. Data Augmentation

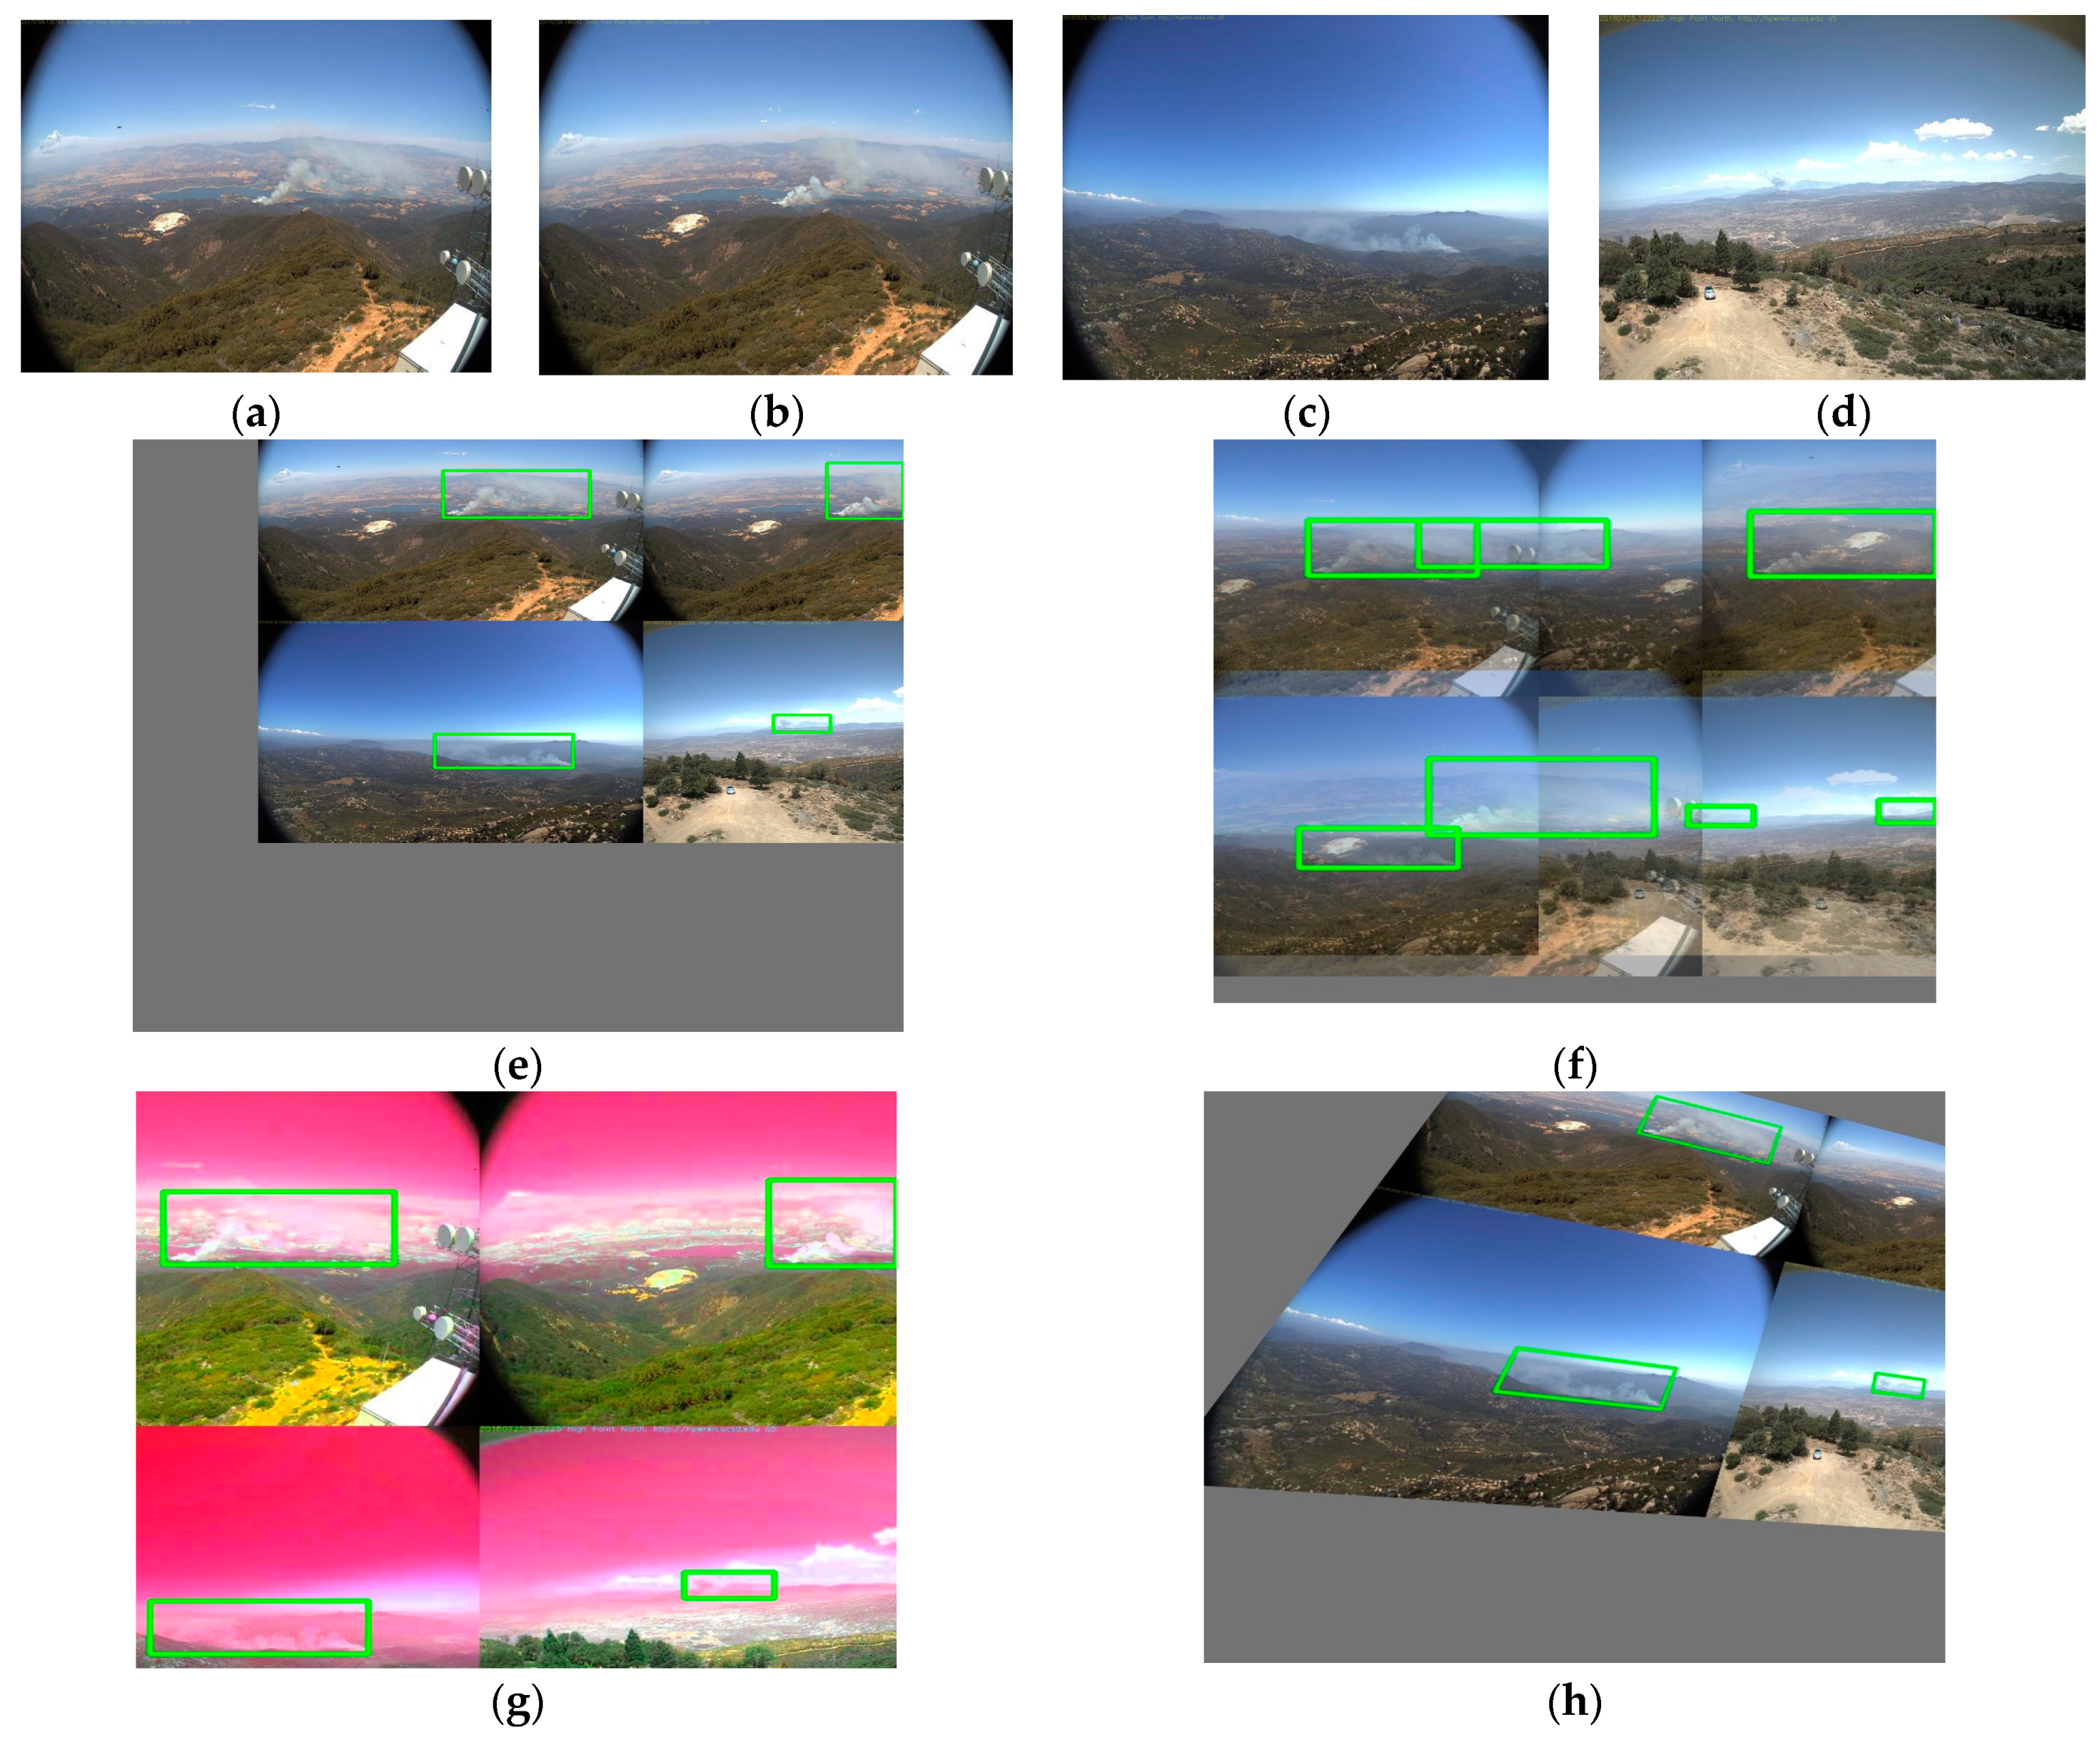
The primary aim of data augmentation is to expand the dataset and bolster the model’s robustness to images stemming from various settings. Researchers have utilized both photometric distortions and geometric transformations for this purpose. To address photometric distortion, we manipulated the hue, saturation, and value of the images. Geometric distortion was handled through the introduction of random scaling, cropping, translation, shearing, and rotation. Additionally, there exist several distinctive techniques for data augmentation. For example, MixUp [62], CutMix [63], and Mosaic [32] have been proposed, employing multiple images for data augmentation. MixUp selects two training samples at random and performs a weighted summation on them, while ensuring that the labels are correspondingly adjusted. CutMix utilizes a segment of another image to cover the occluded region, instead of employing a zero-pixel “black cloth” for occlusion. Mosaic combines four images, thereby introducing significant diversity in the object’s background. Batch normalization estimates the activation statistics of four different images at each layer.
In our method, we employed a combination of MixUp, Mosaic, HSV, and traditional techniques, such as rotation, displacement, scaling, cropping, and flipping for data augmentation.
To demonstrate the data augmentation effect, selected examples are provided as shown in Figure 9.

4.2. Model Evaluation Metrics

Based on previous studies [10,13,52], the performance of the model was assessed utilizing the evaluation criterion of PASCAL VOC in this study, which is extensively employed in target detection tasks. The evaluation metric employed by PASCAL VOC is the mean average precision (mAP). To compute mAP, precision and recall are computed. The precision of a classifier can be determined based on the frequency at which it successfully detects a smoke target. On the other hand, recall represents the proportion of correct predictions in relation to the total number of ground truths, thereby quantifying the model’s capability to recognize significant instances. The following formula is utilized for calculation [10,13,52]:
Precision   = T P / ( T P + F P ) Recall   = T P / ( T P + F N ) A P = 0 1   P ( r ) d r m A P = i = 1 C   A P i / C
In the aforementioned equations, TP denotes the quantity of accurately identified smoke regions, while FP denotes the count of false positives that arose while non-smoke areas were erroneously identified as smoke. FN, on the other hand, signifies the count of false negatives that happens while genuine smoke regions were erroneously classified as non-smoke regions. AP denotes the area enclosed by the precision and recall curve. The mean average precision (mAP) denotes the average value of the AP scores across all categories. The C in the aforementioned mAP formula represents the number of categories in the object detection task. Given that this study focuses exclusively on a single category, namely, forest fire smoke, C = 1, making mAP equivalent to AP.
Furthermore, we employed the widely utilized Microsoft COCO metrics in object detection tasks to evaluate the detection performance of forest fire smoke across various scales. A comprehensive analysis of the results was conducted.
Finally, the evaluation metrics of this paper are presented in Table 2.

5. Experimental Results and Discussion

5.1. Model Training Environment

All experiments were run in our lab using an Intel(R) Core(TM) i7-10750H CPU (2.60 GHz CPU, 16 GB RAM) and an NVIDIA GeForce RTX 2070 (8 G video memory). Model training and testing were conducted in the PyTorch framework. Both model training and testing were performed using GPUs to accelerate the computation.
The experimental settings in this study are shown in Table 3. Table 4 shows the training parameters for the forest fire smoke detection model. The forest fire smoke dataset was divided into three sets with a ratio of 8:1:1. This means that 80% of the data was used for training the model, 10% was used for validating and fine-tuning the model during training, and the remaining 10% was reserved for evaluating the final performance of the trained model. In addition, the dataset was enhanced with data for the training set, validation set, and test set, after the allocation was completed. Details of the forest fire smoke dataset are shown in Table 5.

5.2. Qualitative Visualization of the Detection Results

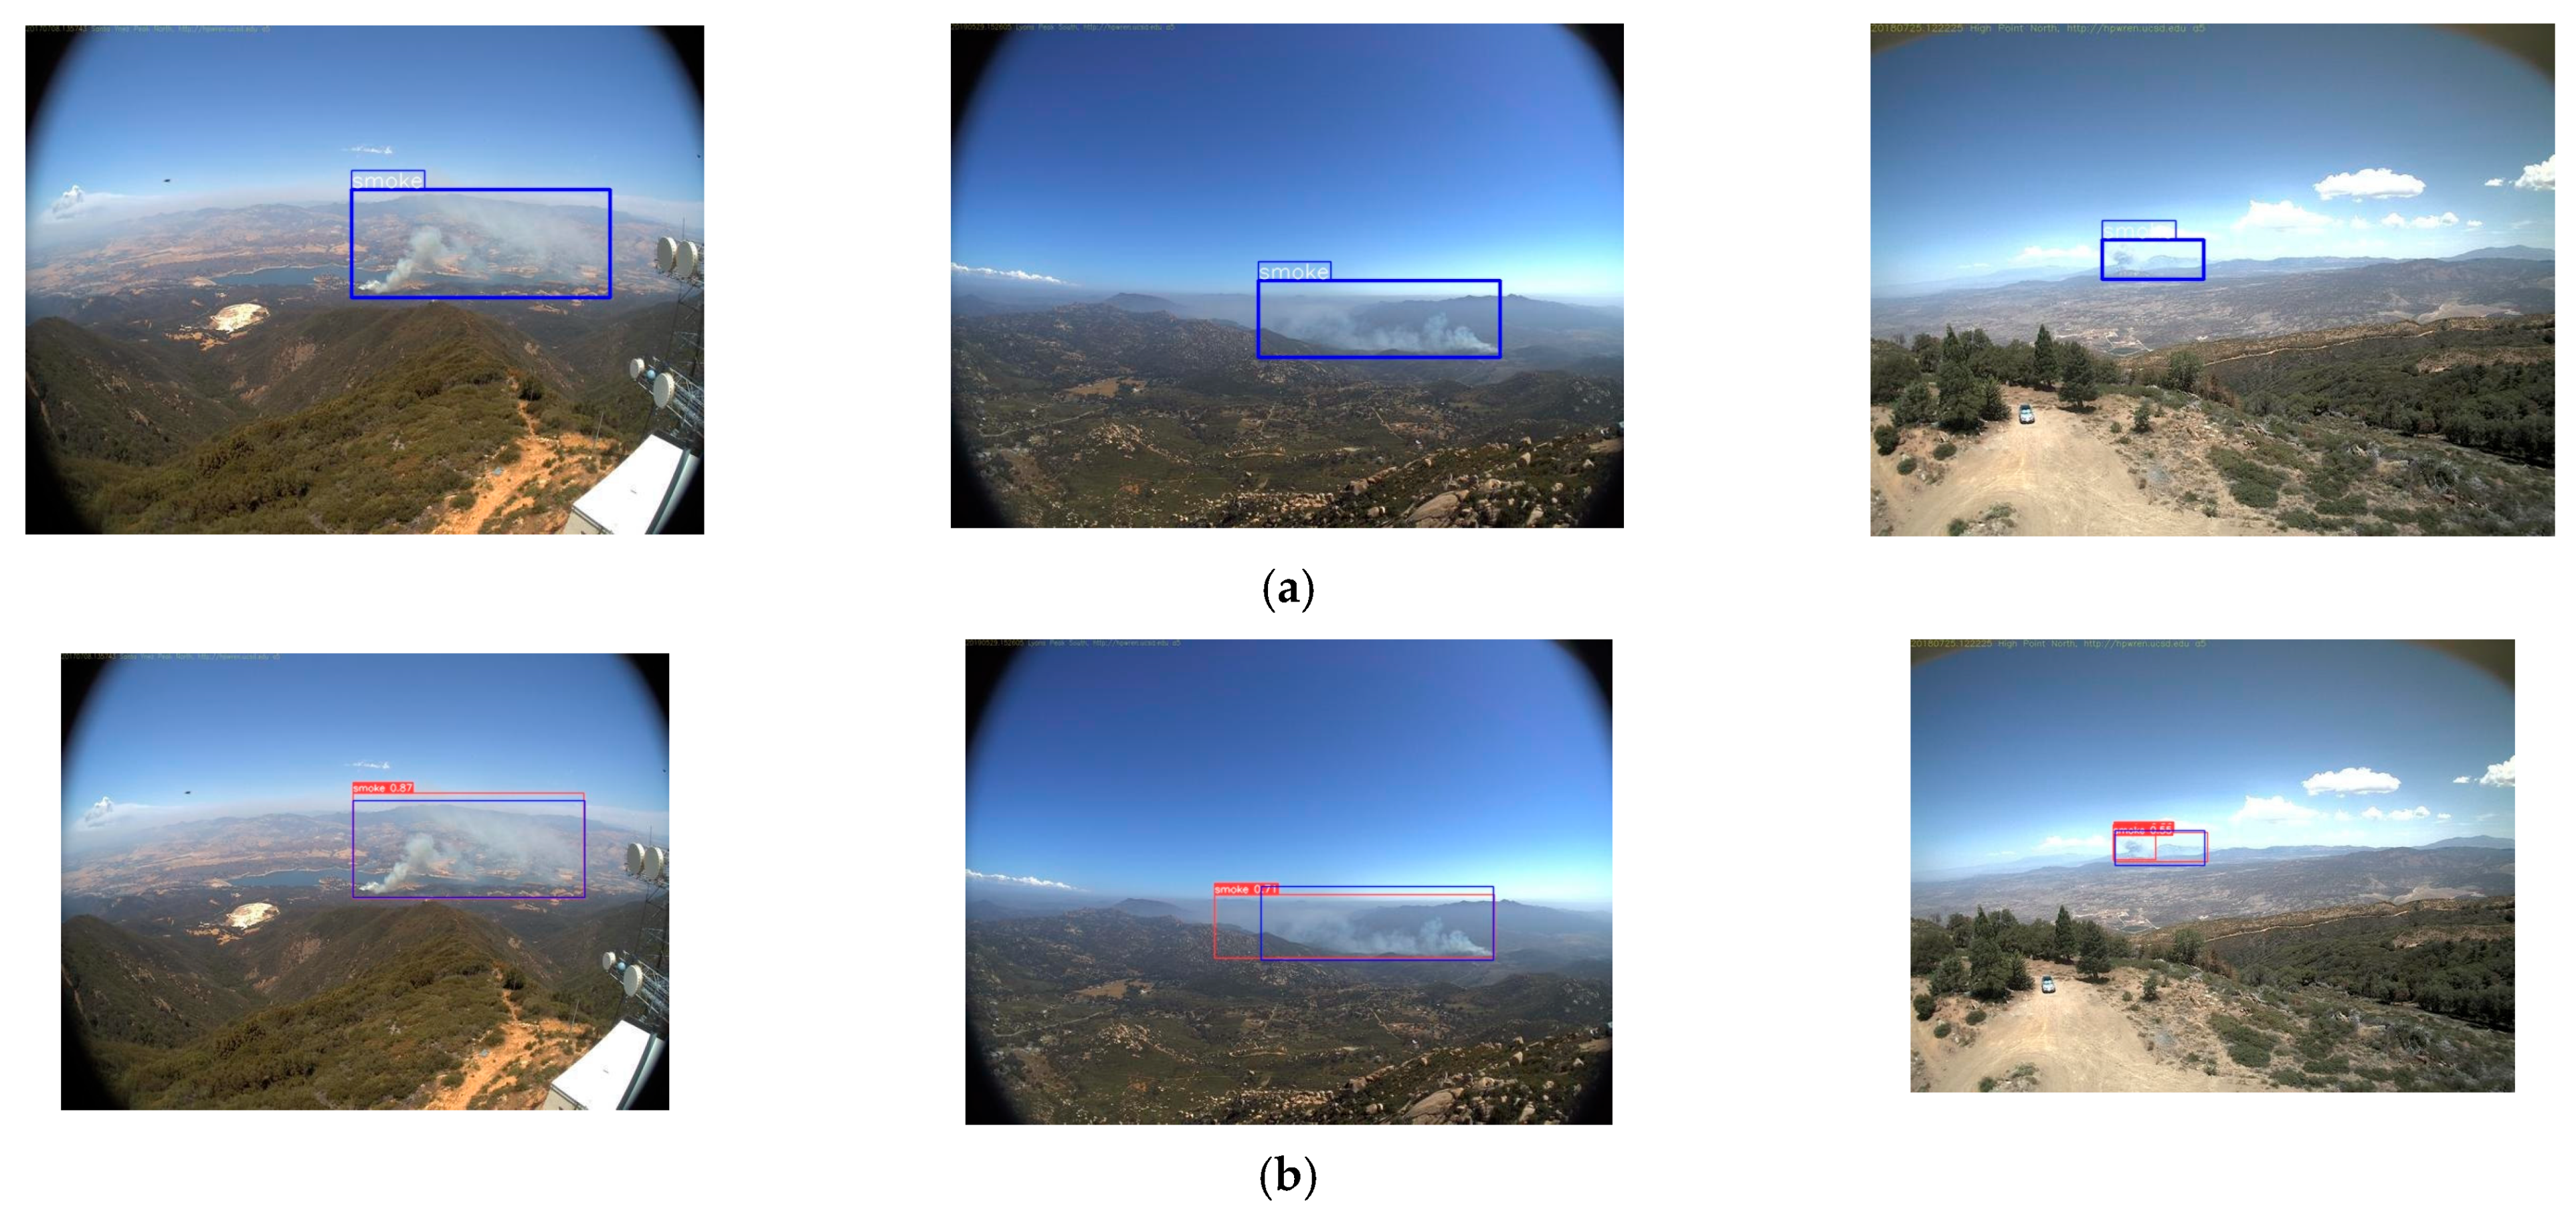
To begin with, we qualitatively visualized the application of the proposed method in the detection of fire smoke. Within the test set of the forest smoke dataset, we randomly selected four images for medium- and large-sized smoke detection, and four images for small-sized smoke detection. These eight images included forest fire smoke blown from different directions in various scenes and also contained a significant amount of smoke-like distractors, such as clouds and snow. The improved YOLOv5s model yielded similarly high-quality results for both medium- and large-sized (a) and small-sized (b) smoke images, as shown in Figure 10.
Figure 10 demonstrates the effectiveness of the proposed forest fire smoke detection method, capable of performing smoke detection in wide-ranging forest scenes. In these qualitative experiments, we used smoke of various scales for comprehensive detection and achieved commendable results, showing our algorithm’s proficiency in detecting smoke of different sizes. Moreover, the test images included numerous distractors, such as clouds and snow, and the detection outcomes indicate that our method can effectively filter out interference from such smoke-like objects. Overall, our proposed method for forest fire smoke detection proves that it is capable of accurately identifying relatively smaller regions of fire smoke in complex environments with the presence of interfering elements.

5.3. Comparative Experiments

5.3.1. Comparative Experiments on Attention Mechanisms

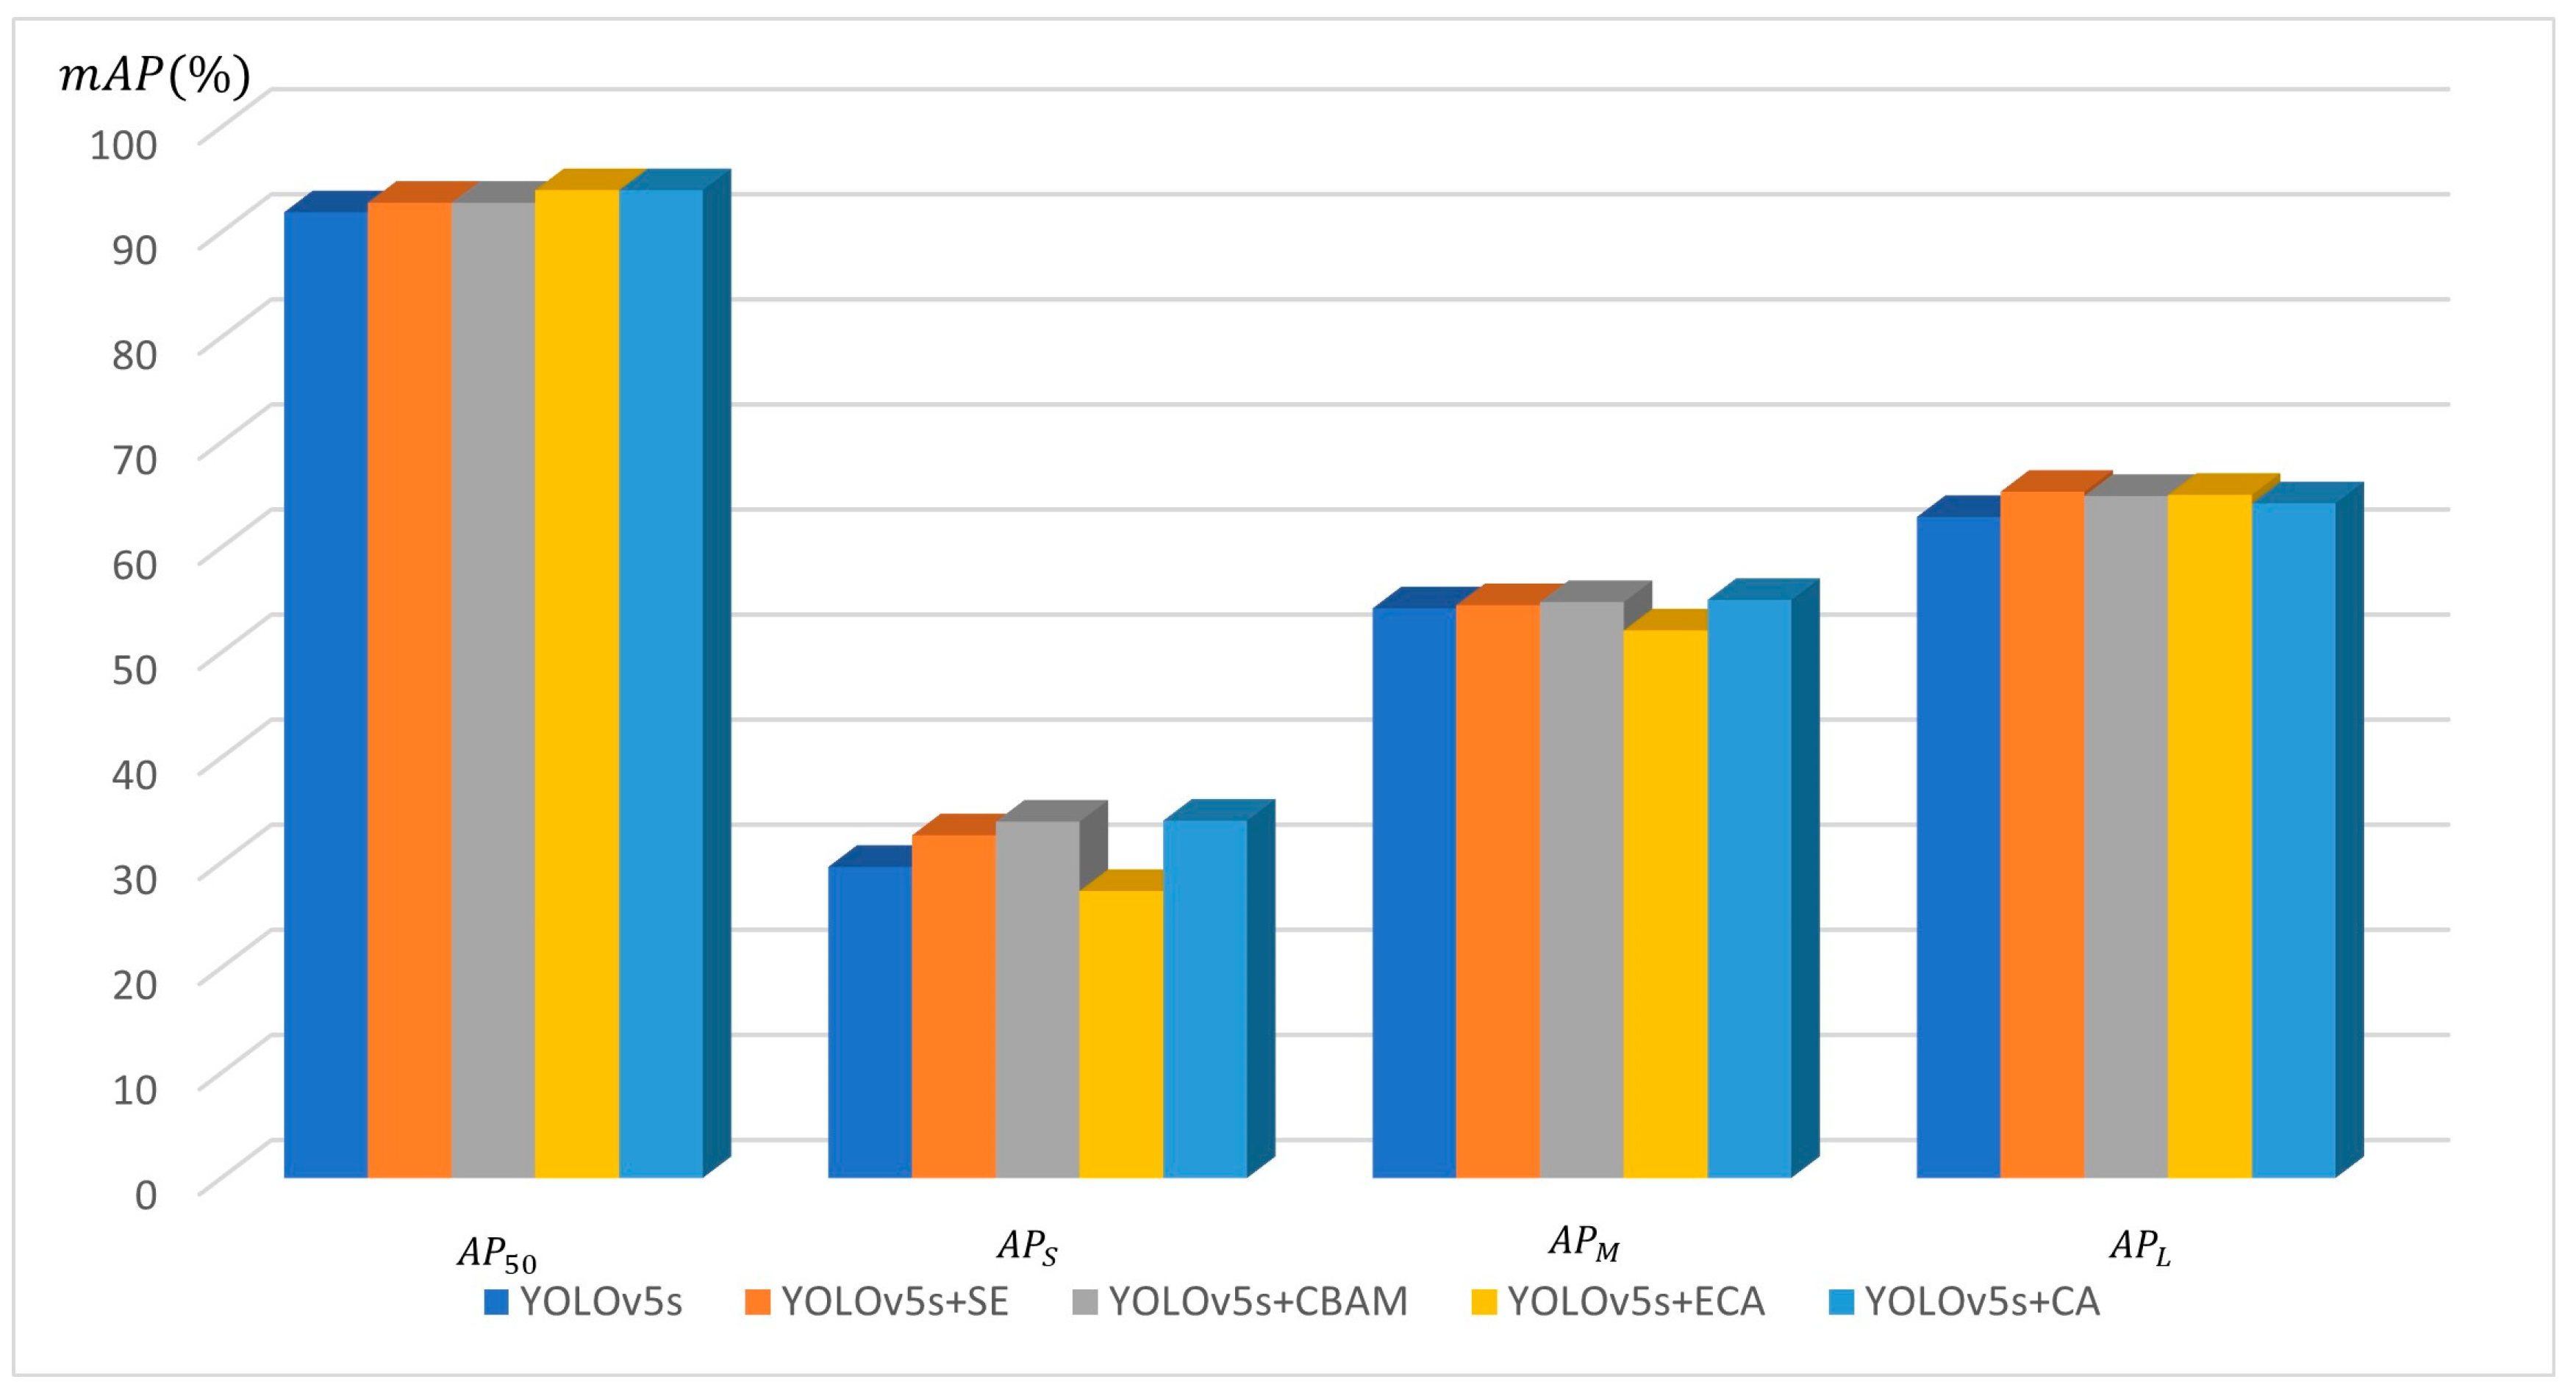
In this manuscript, we undertook a comparative analysis of the three prevalent attention mechanisms, namely, SE, CBAM, and ECA (Efficient Channel Attention) [64], with the CA module we proposed, in the context of identification missions. The outcomes of this investigation were tabulated in Table 6 and Figure 11. It is worth noting that the aforementioned three attention mechanisms align with the CA module in terms of their strategic integration within the YOLOv5s. Compared with the original YOLOv5s model, the A P 50 of SE, CBAM, ECA, and CA modules were increased by 0.9, 0.9, 2.1, and 2.1 points, respectively. ECA and CA modules achieved the same A P 50 value of 94%, but ECA was much weaker than CA in detecting small target smoke. The A P 50 , A P S , and A P M indicators of CA module were the highest in this attention mechanism experiment, and A P L was also improved by 1.3 points compared to the original model. From the results shown in Table 6 and Figure 11, we see that the effect of CA is the most significant and comprehensive.
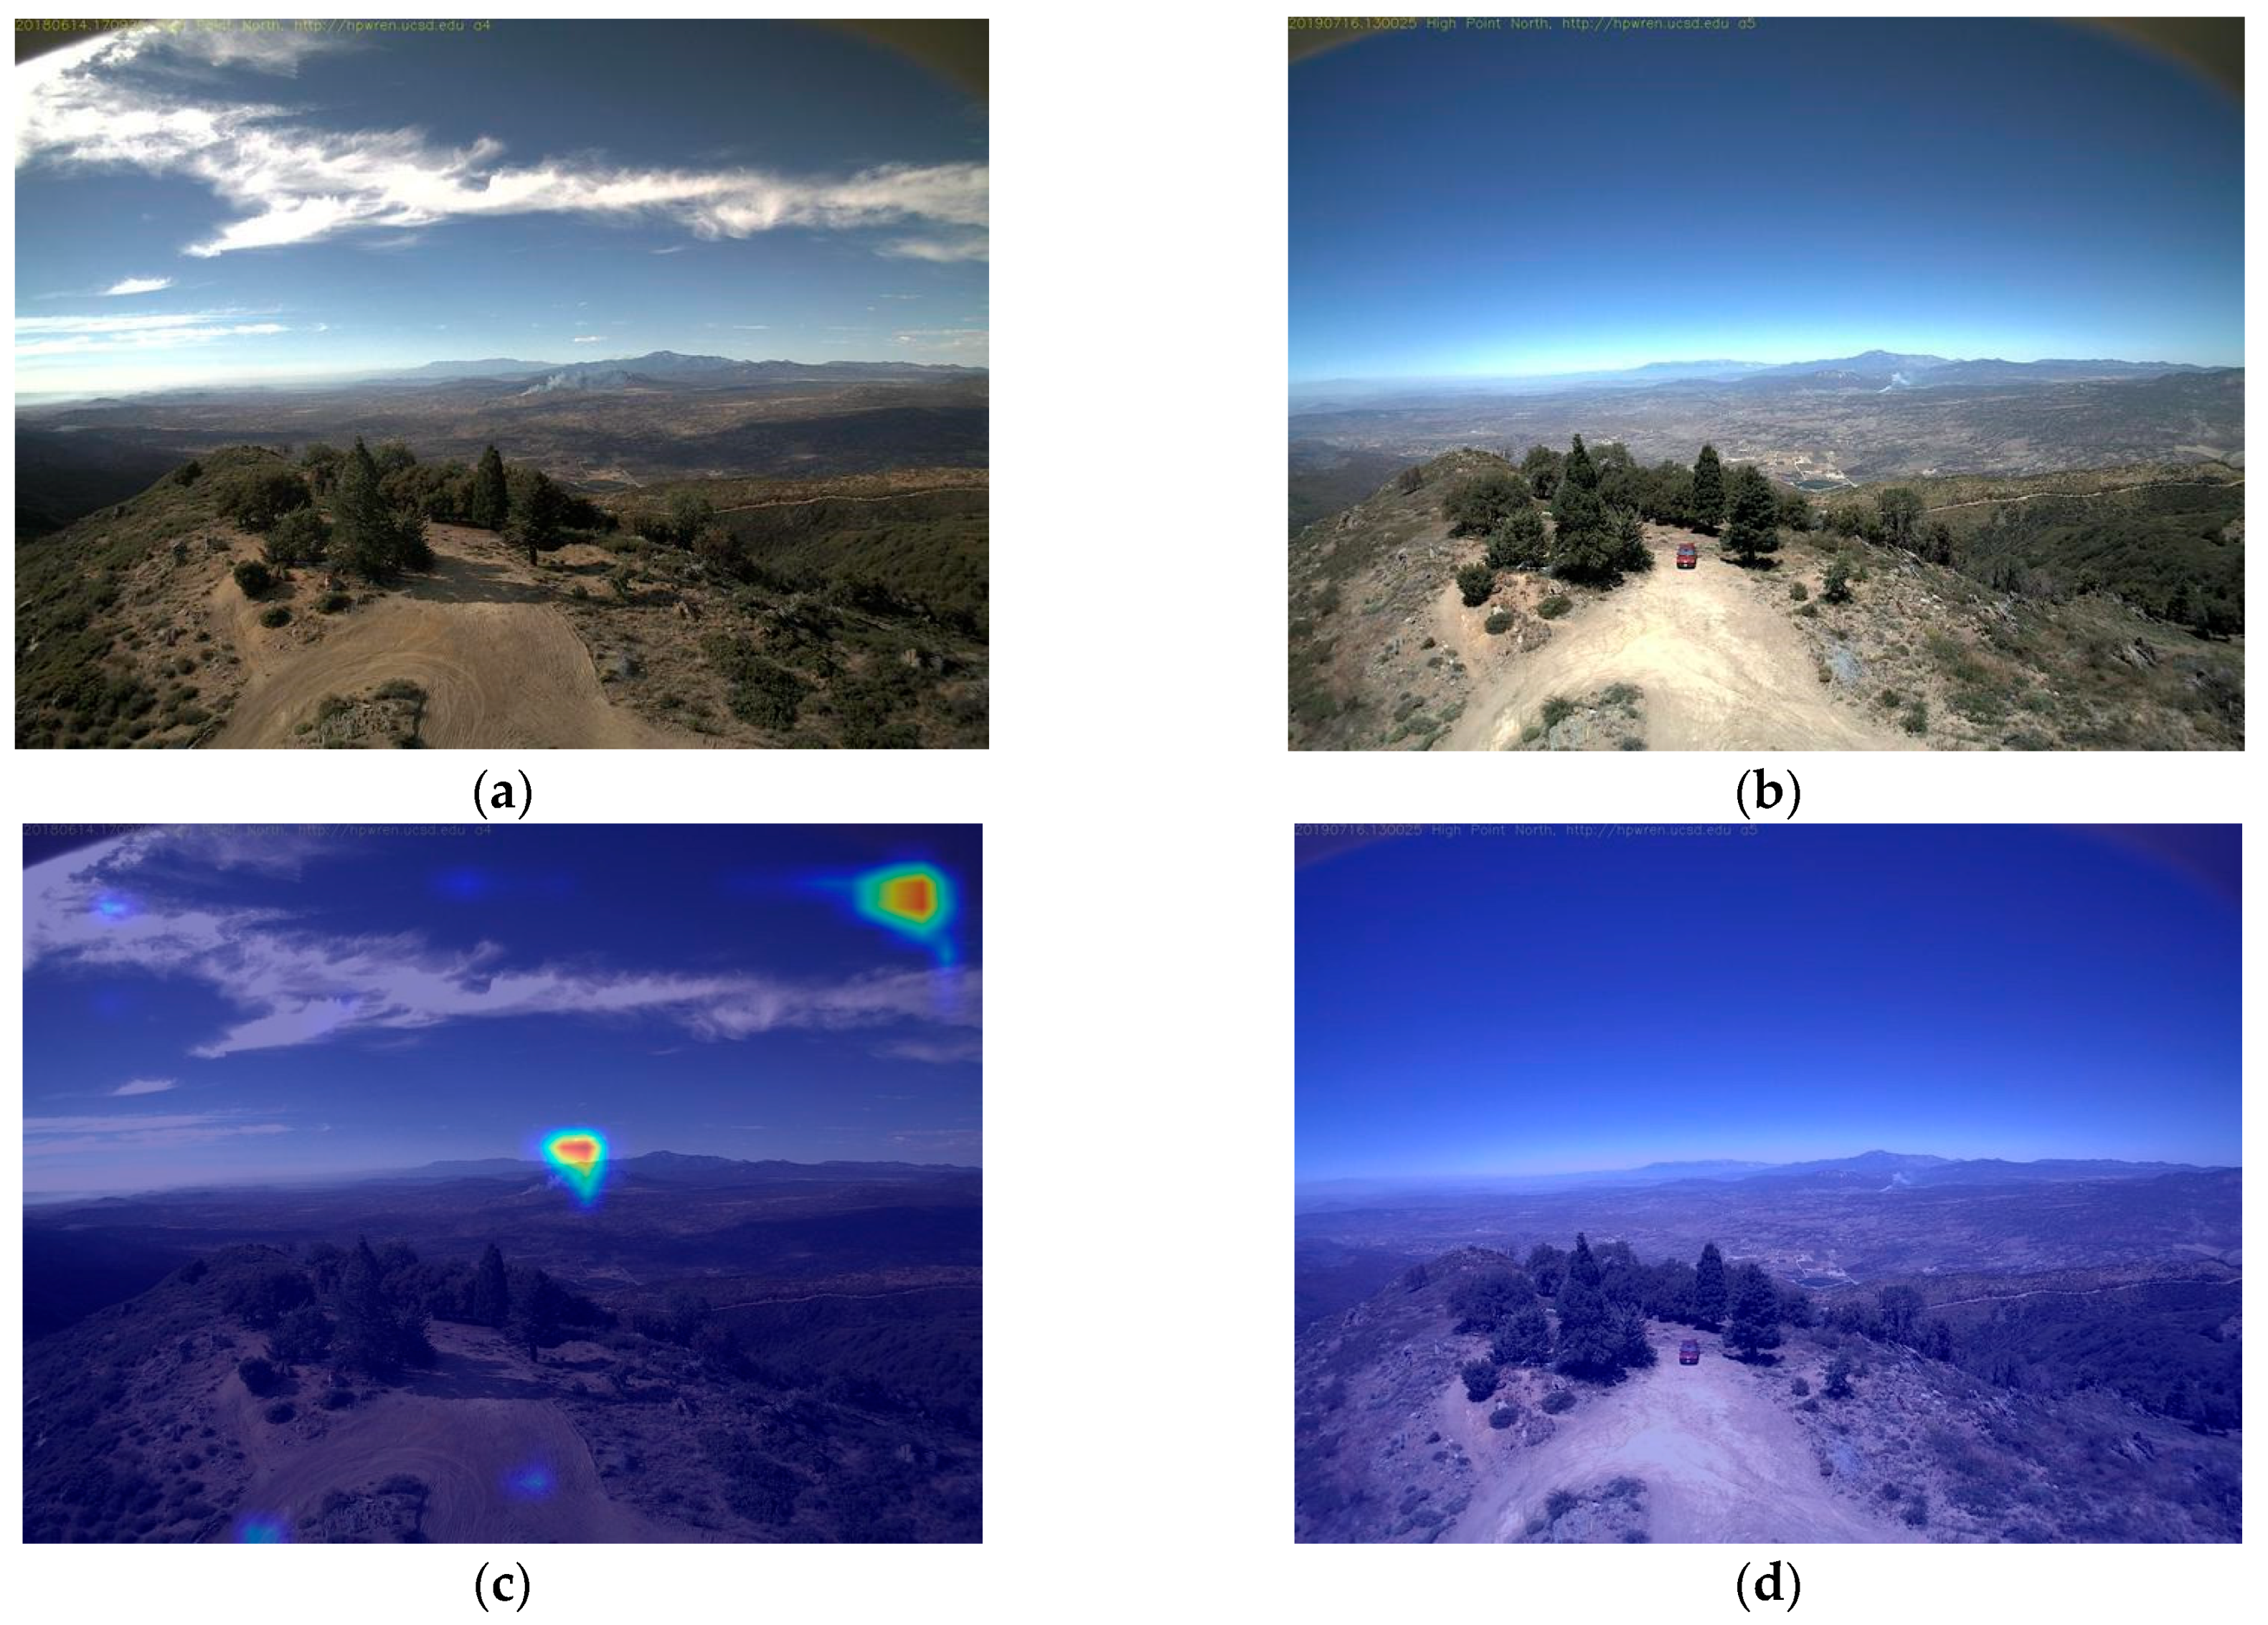
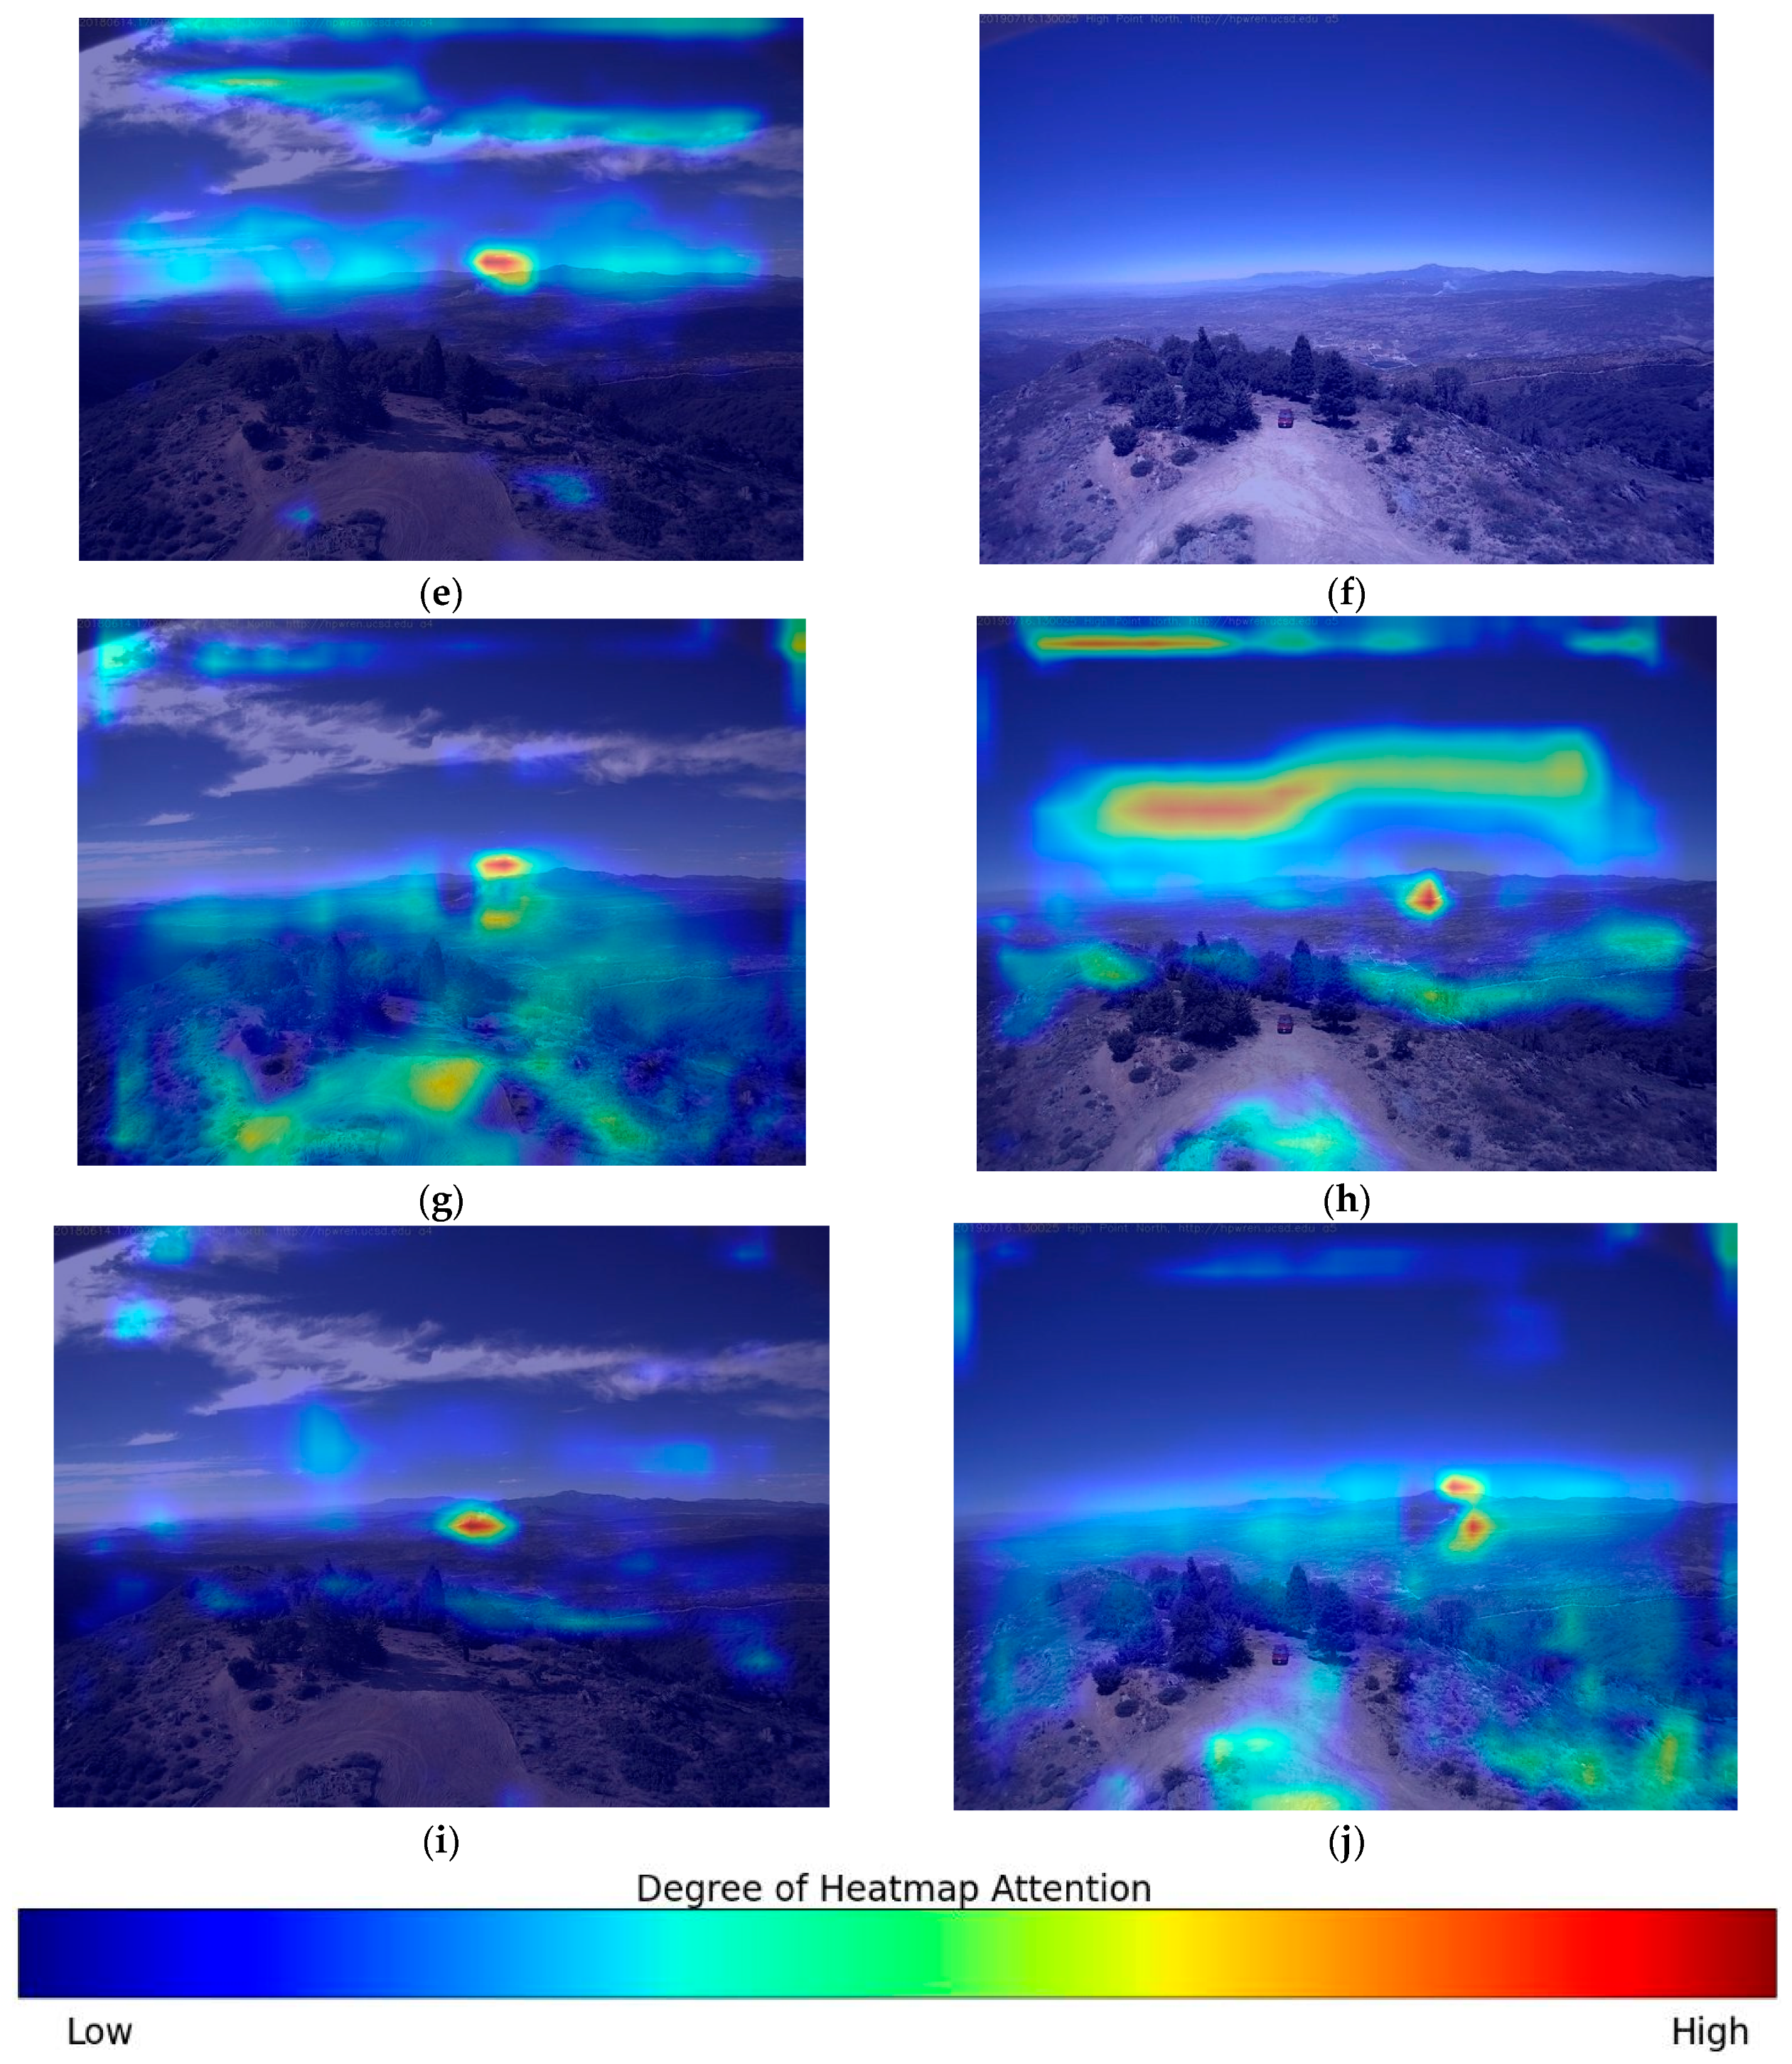
We used heat maps to visualize the output feature maps for adding different attention mechanisms, as shown in Figure 12. For images with complex environment and interference of smoke-like objects, SE and CBAM sometimes fail to focus on small target smoke from the cluttered background. Although ECA module can pay attention to small target smoke, its ability to exclude external interference is not as good as that of the CA module, and the focus is too messy. Based on the presented heat map results, the network module employing the Channel Attention (CA) mechanism demonstrates superior accuracy in detecting the crucial components of forest fire smoke in comparison to the other three mechanisms.

5.3.2. Comparative Experiments on Backbone Design

In order to verify the improvement of model training speed and performance by our proposed backbone design, we conducted an experimental comparison of the YOLOv5 models using different backbones, and the results are shown in Table 7. When using the backbone we designed, the parameters of the model dropped from 6.11 to 6.02, the GFLOPS dropped from 15.8 to 12.8, the image detection time dropped from 12.7 ms to 12.3 ms, and the FPS increased from 78.7 to 81.3. By effectively reducing the network’s dimensions and parameter count, the model successfully improves the speed of detection and FPS. This ensures that the model meets the real-time requirements of the actual detection process. Compared to the original YOLOv5s, the A P 50 , A P S , A P M , and A P L of the model are increased by 0.9, 3.6, 1.5, and 1.2 points, respectively. The result shows that using our backbone can not only improve AP metrics, but also reduce model size and improve model speed.

5.3.3. Comparative Experiments of Different Models

In order to comprehensively investigate the performance of the improved YOLOv5s method we proposed in Section 3.2, we conducted a comparative analysis with several prominent single-stage object detection methods, namely, SSD, YOLOv3, YOLOv4, YOLOv5, YOLOv7, and YOLOv8s. We employed an identical set of training and testing images from our customized dataset. The detection outcomes are presented in Table 8 and Figure 13. Among all models evaluated, our proposed model achieved the highest scores of 96% in A P 50 and 57.3% in A P 50 : 95 , with a small size of 11.1 M parameters, the fewest floating-point operations at 13.3 GFLOPs, and a reduced average detection time (Speed GPU) of 13 ms. In terms of detection accuracy, our model demonstrated superior performance, even surpassing the currently popular YOLOv7 and YOLOv8. The speed of our model is much better than that of SSD, YOLOv3, YOLOv4, YOLOv7, and YOLOv8s, and it is basically the same as the original YOLOv5s. FPS is also on par with YOLOv5s, substantially improving average precision for forest fire smoke with little loss in speed. The YOLOv5s model boasts the smallest size and the shortest detection time, yet its overall accuracy lags behind. Our method outperformed the other methods.
This is due to the small size of many forest fire smoke targets, some of which are easily confused with clouds and other smoke-like objects due to color and morphology, making it difficult for general object detection methods to detect them. Consequently, conventional object detection methods encounter challenges in detecting such targets. In contrast, our proposed approach adeptly handles detection tasks encompassing considerable disparities in object sizes. Upon the incorporation of the CA mechanism and the novel small target detection head, the identification accuracy for smoke of varying sizes is significantly augmented, thereby underscoring the effectiveness of these modules in enhancing the network’s detection precision. Simultaneously, the design of the backbone enhances the model’s speed performance. In comparison to the YOLO series algorithms, SSD manifests limitations in detecting small-sized smoke. Conversely, our proposed algorithm accurately discerns smoke of all sizes, particularly the diminutive instances. Moreover, in comparison to other algorithms, it demonstrates a noteworthy enhancement in target identification confidence.
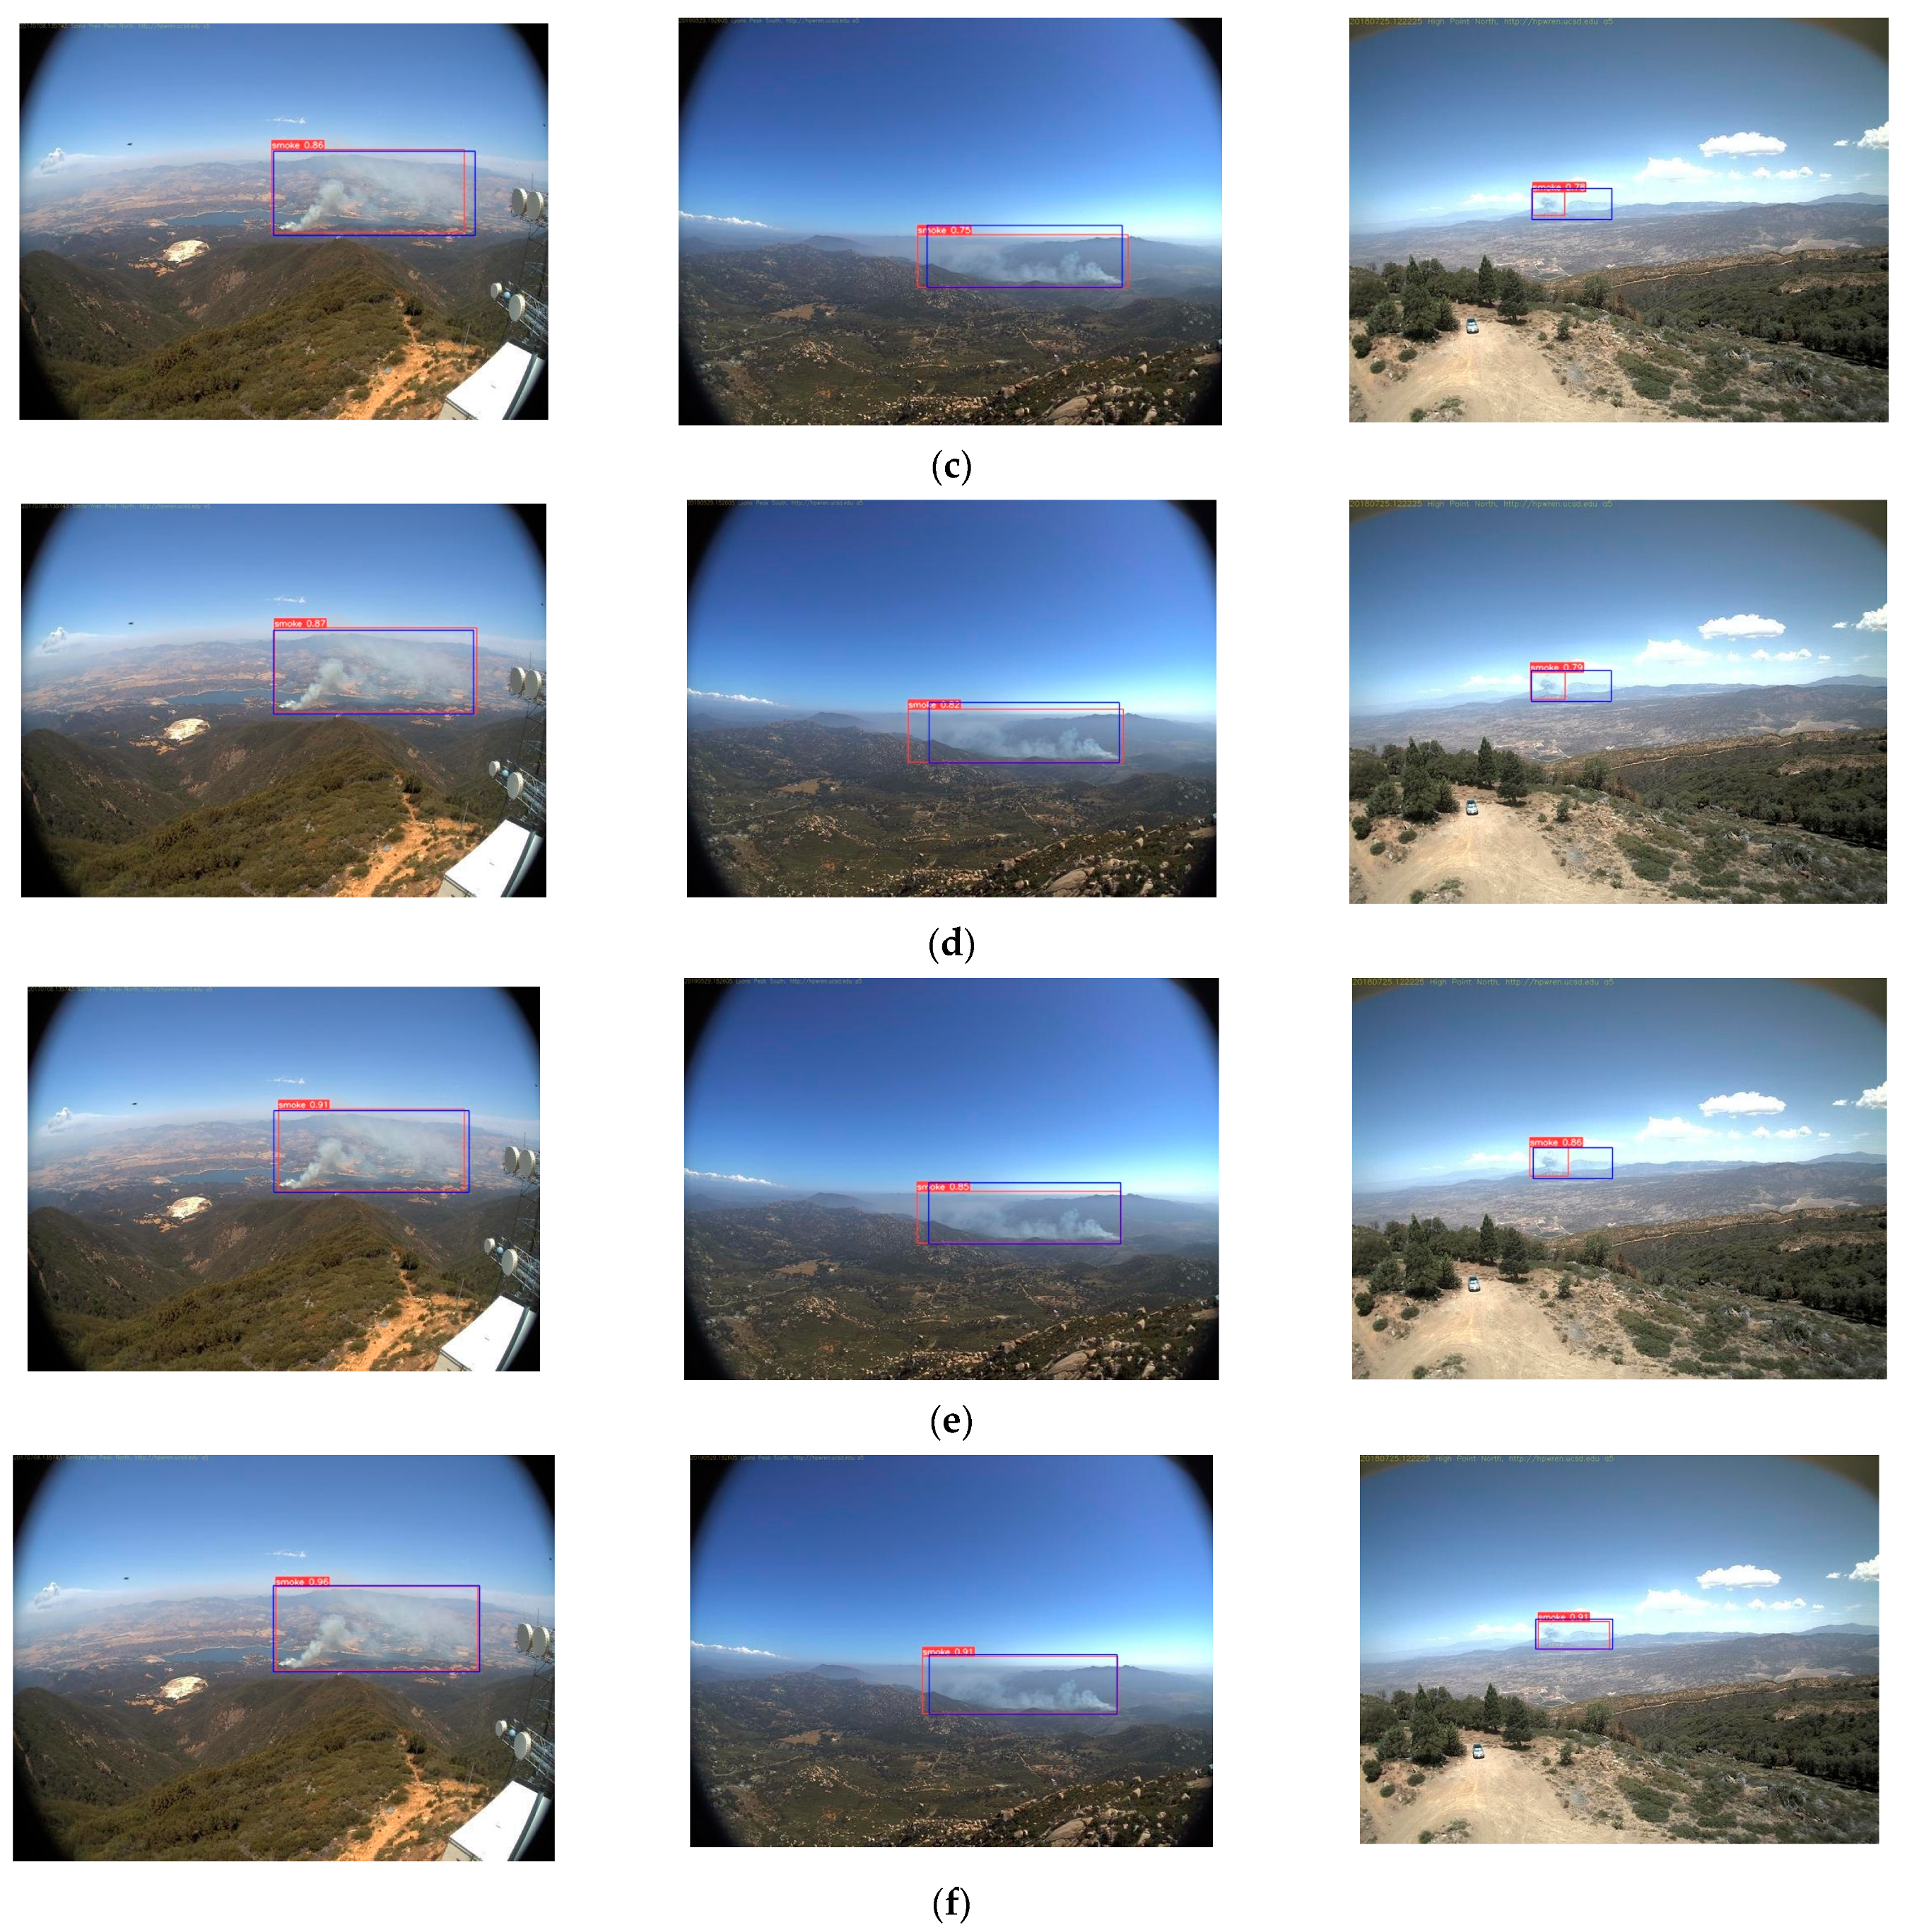
We choose three small-scale smoke images for experimental detection using the improved YOLOv5s algorithm we proposed and other mainstream algorithms. Figure 14 illustrates a visual representation of the test results for each method employed in the evaluation. From the third column images, it can be seen that the SSD, YOLOv3, YOLOv4, and original YOLOv5 models are not accurate enough for the location of small target smoke with low confidence, and their detection ability for small target smoke is weak. Our model achieves a good localization and detection for smoke of different sizes and directions in UAV images and has the highest confidence among all models. Based on empirical investigations, the proposed approach demonstrated its efficacy in mitigating erroneous detections, facilitating timely suppression, and enabling prompt response durations, irrespective of the dimensions, orientation, or configuration of forest fire smoke.

5.4. Ablation Experiments

To assess the impact of the design of the backbone proposed in Section 3.1.3 the small-scale smoke detection head proposed in Section 3.1.4, and the CA module proposed in Section 3.1.5 on the precision and velocity of the YOLOv5s, ablation experiments were conducted to validate their efficacy. To enhance readability, we introduced abbreviations for the method presented in Section 3.2. Specifically, “BD” represents “Backbone Design”, “SDH” stands for “Small-scale Detection Head”, and “CA” signifies “Coordinate Attention”.
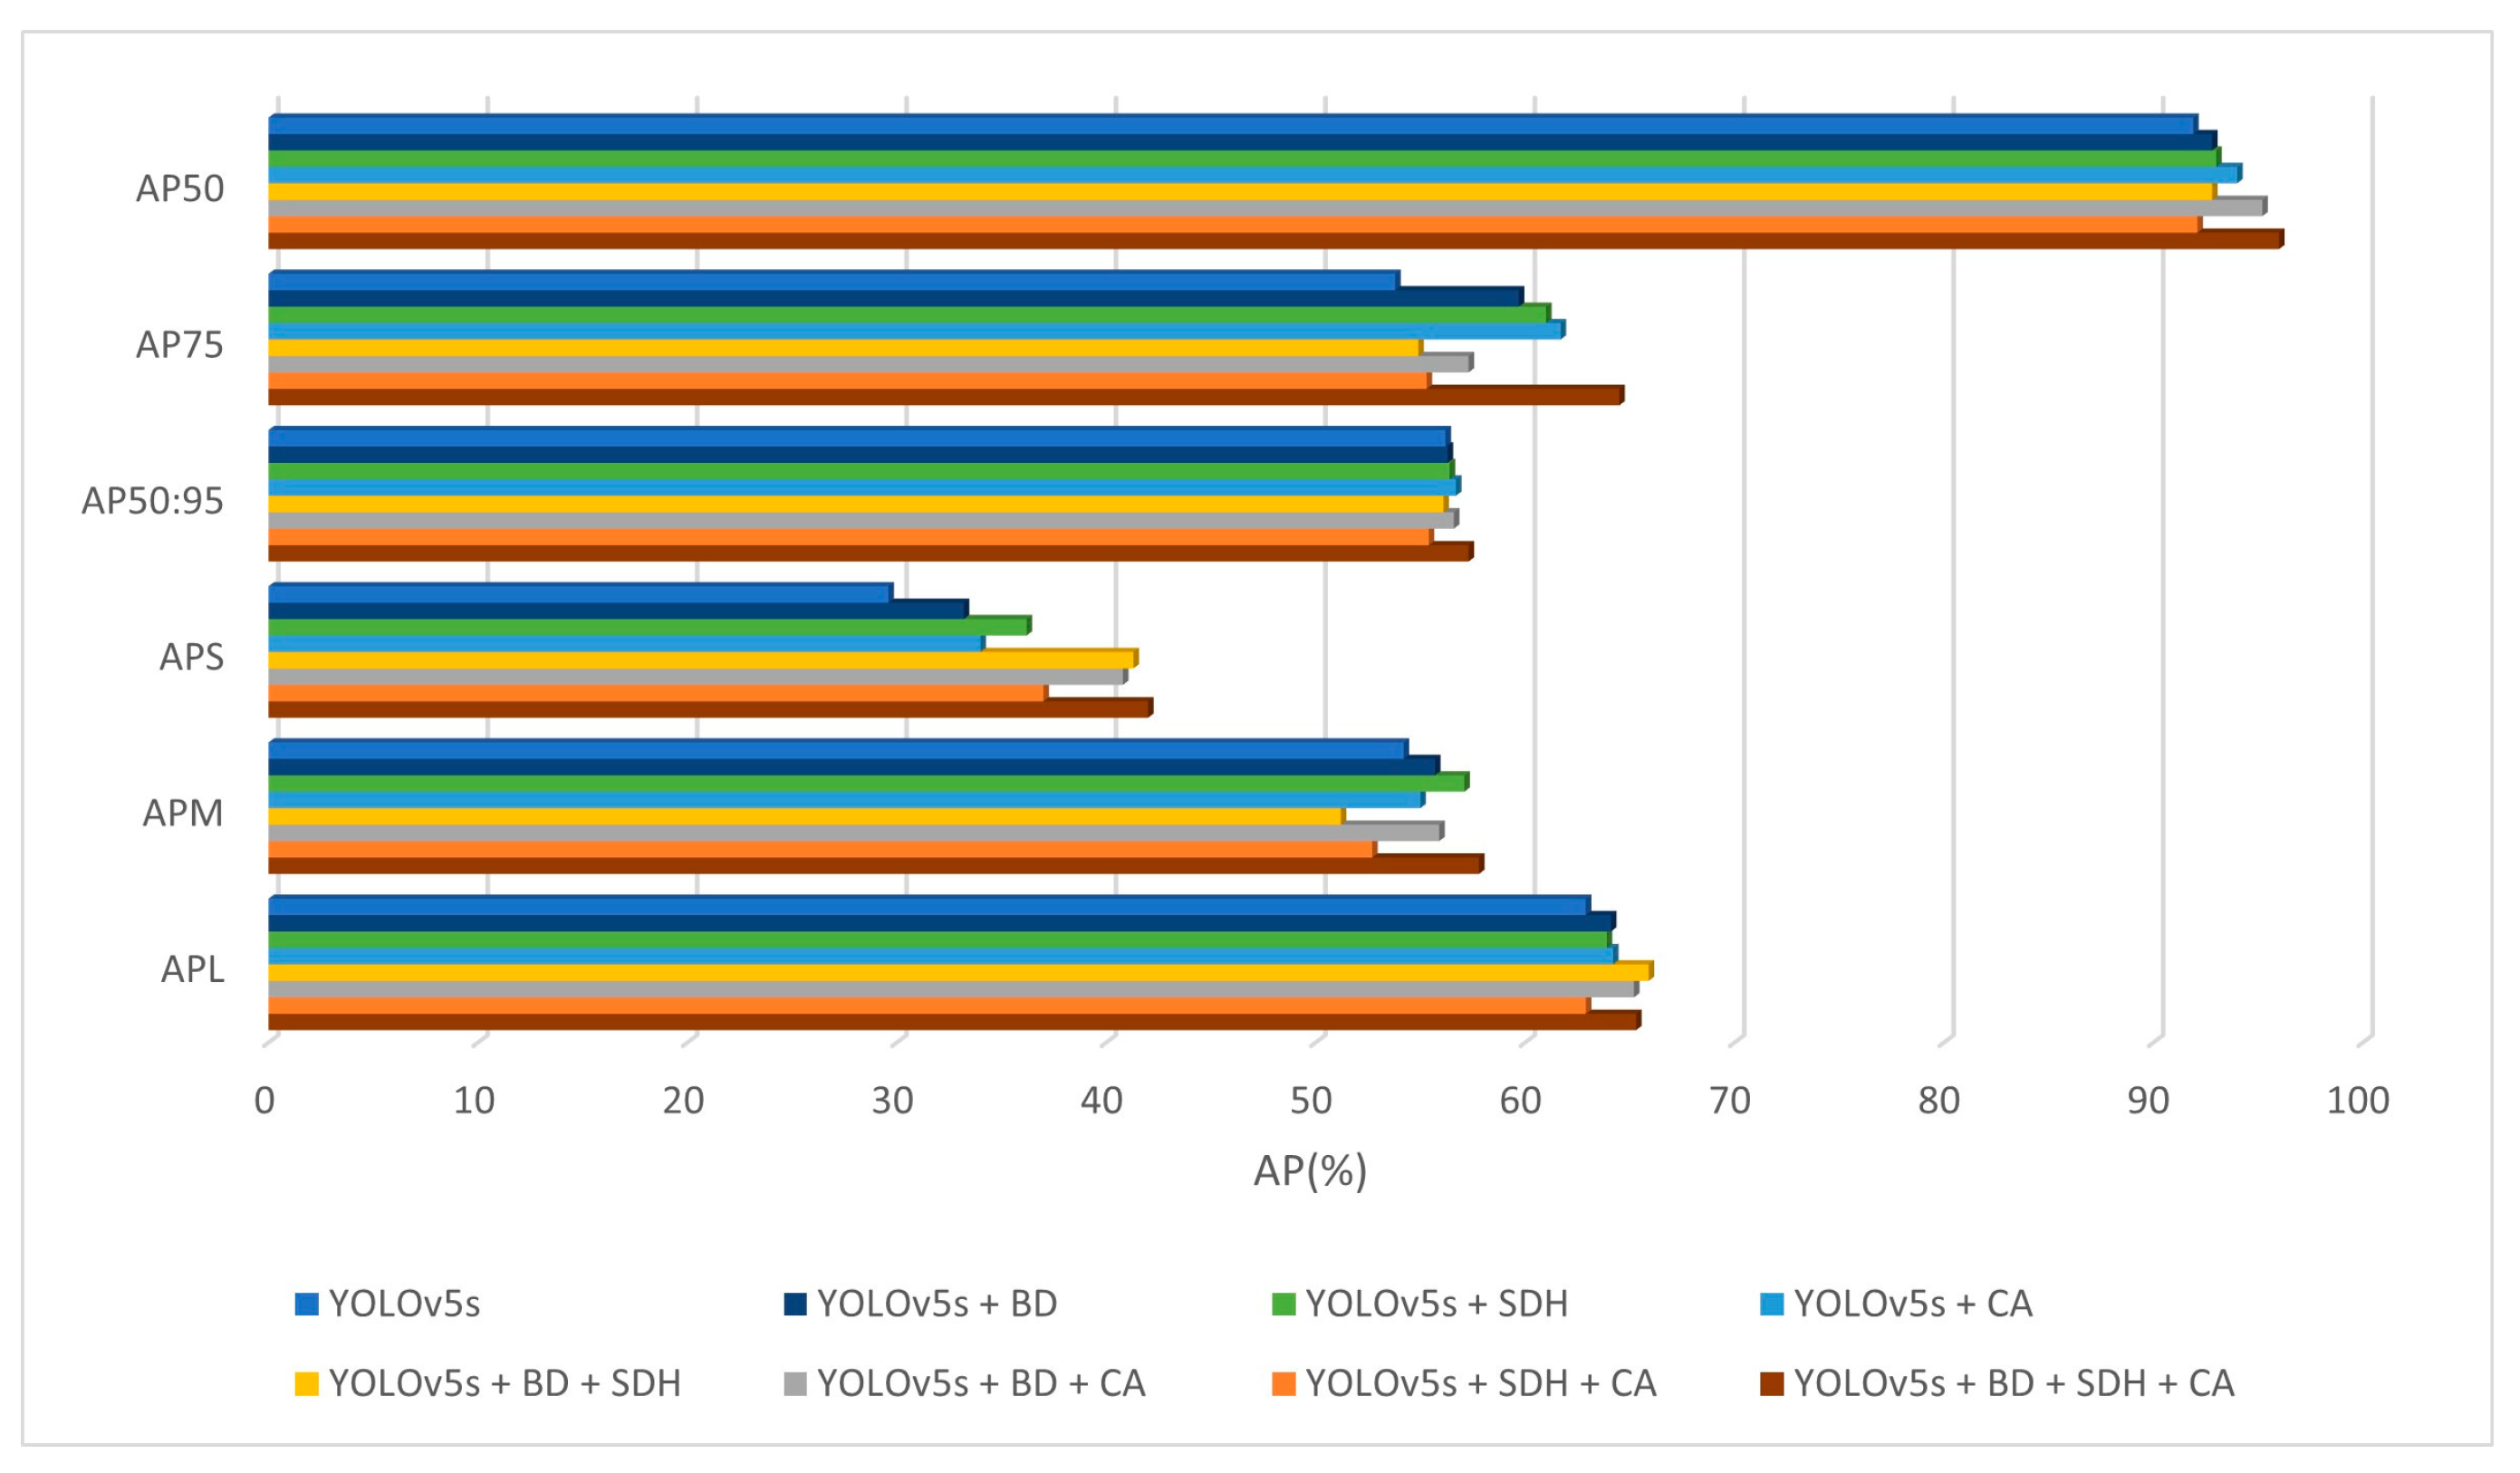
Eight ablation experiments were performed, namely, YOLOv5s, YOLOv5s + backbone design (YOLOv5s + BD), YOLOv5s + small-scale detection head (YOLOv5s + SDH), YOLOv5s + CA, YOLOv5s + backbone design + small-scale detection head (YOLOv5s + BD + SDH), YOLOv5s + backbone design + CA (YOLOv5s + BD + CA), YOLOv5s + small-scale detection head + CA (YOLOv5s + SDH + CA), and YOLOv5s + backbone design + small-scale detection head + CA (YOLOv5s + BD + SDH + CA), referred to as Experiments 1–8, respectively. Experiment 1 exclusively trained the original YOLOv5s model. Experiments 2–4 involved training the model with a single improvement added to the original YOLOv5s. Experiments 5–7 entailed training the YOLOv5s model with a combination of two improvements. In the final experiment, all improvements, including the backbone design, small-scale smoke detection head, and CA module, were incorporated into the model. Table 9 and Figure 15 presents the comparative results of the ablation experiments.
The experimental results show that replacing the backbone of YOLOv5s, adding the detection head for small-scale smoke and adding CA module to the model improve the performance of the model. Experiments 4, 6, 7, and 8 (all experiments containing the addition of the CA module) show that the CA module can improve the A P 50 , A P 75 , and A P 50 : 95 of the model. Experiments 3, 5, 7, and 8 (all experiments including adding the detection head for small-scale smoke) show that the new small target smoke detection head can improve the A P S of the model, that is, improve the ability of the model to identify small-size smoke.

5.5. Extended Experiments

In order to demonstrate the superiority of the model proposed in this paper for small object detection tasks, extended experiments were conducted on the DOTA dataset [65]. The DOTA dataset consists of 2806 aerial images from various sensors and platforms, containing small objects of various scales, orientations, and shapes. The training set contains 1411 images, the validation set contains 458 images, and the test set includes 937 images, with a total of 15 categories, namely, planes, ships, storage tanks, baseball diamonds, tennis courts, basketball courts, sports fields, harbors, bridges, large vehicles, small vehicles, helicopters, roundabouts, soccer fields, and swimming pools. Given the abundance of small-scale objects within the DOTA dataset, the CA module and the enhanced small object detection head we proposed in this article significantly improve the model’s detection capabilities. The CA module, by concentrating on salient feature channels, aids the model in focusing on the most informative attributes for classification. Concurrently, the specially designed small object detection head, with its optimized feature extraction capabilities for small-scale objects, further amplifies the model’s accuracy in identifying these targets.
The official annotation format of the original DOTA dataset is in the form of rotated bounding boxes. These were converted into horizontal bounding boxes, and the annotations were transformed into the YOLO format. To address the issue of the overly large aspect ratio of remote sensing images, a preprocessing step was performed, cropping the remote sensing images to a size of 800 × 800 pixels.
The comparative analysis of our improved YOLOv5s approach on the horizontally annotated DOTA dataset against a set baseline group substantiates the efficacy of the improved model. Table 10 delineates the performance juxtaposition of the refined YOLOv5 with several archetypal object detection frameworks, such as RetinaNet, the original YOLOv5s, YOLOv5m, and the YOLOX. The results, as exhibited in Table 10, attest to the superior detection outcomes of the improved YOLOv5 model on the horizontally annotated remote sensing images of the DOTA dataset. Although the algorithm presented in this paper is primarily tailored for forest fire smoke detection tasks, its applicability and effectiveness extend to other small object detection endeavors, evidencing its versatility.
The partial detection outcomes of our methodology on the DOTA dataset are illustrated in Figure 16.

5.6. Discussion

The primary objective of this study was to enable the timely detection of wildfires. Therefore, our focus was to effectively identify and recognize the crucial wildfire signal, which is smoke [14]. The detection results and evaluated visualizations of the smoke dataset demonstrate that our improved YOLOv5s model achieves a higher accuracy in recognizing forest fire smoke compared to the state-of-the-art models. To enable forest fire smoke detection using UAV cameras and deep learning, we gathered a substantial number of images containing forest fire smoke and smog-like objects. This addressed the challenge of the limited availability of forest fire smoke-related datasets. Additionally, the proposed improved YOLOv5s model incorporated a novel design of backbone, integrated the Coordinate Attention module [59], and introduced a small target detection head to effectively extract features from smoke of varying sizes.
To comprehensively evaluate the effectiveness of our proposed method, we conducted a series of control experiments and ablation experiments in Section 4. Firstly, by integrating the CA attention mechanism, our model demonstrated an enhanced ability to distinguish between background and foreground. The CA attention focuses the model’s attention on the smoke target in the foreground while disregarding interference from the background. This improvement is evident in Table 6 and Figure 11. Additionally, compared to other mainstream attention modules [57,58,64], our CA module exhibited superior capability in focusing on relevant smoke features. This is supported by the attention heat map presented in Figure 12. Moreover, our proposed model adopted a novel backbone design. In contrast to previous studies [26,29,30,31,32], the improved YOLOv5s model introduced in our study addressed issues such as redundant calculations and excessive memory access during network training. Furthermore, the utilization of the new convolution PConv [56] enhanced the operational speed of the network. The outcomes presented in Table 7 demonstrate that the new backbone design reduces the number of parameters while improving the model’s speed. Following a series of enhancements, our proposed improved YOLOv5s model outperformed all existing mainstream models [27,31,32,33] in terms of forest fire smoke detection, as evidenced by the results in Table 8.
By utilizing the dataset and model presented in this study, it becomes feasible to achieve accurate identification of wildfire smoke using UAVs. Moreover, the findings and methodologies outlined in this paper hold valuable implications for researchers and practitioners involved in the field of wildfire detection and firefighting.

6. Conclusions and Future Work

Most forest fires originate from small fires. Detecting and identifying smoke in the early stages of forest fires is crucial for early detection and prevention. The utilization of unmanned aerial vehicles (UAVs) equipped with visual cameras, coupled with advancements in UAV technology and computer vision techniques such as deep learning, has yielded promising results in the detection of forest fire smoke. However, the detection of forest fire smoke still faces significant challenges, including the scarcity and uneven distribution of forest fire smoke datasets, the complex mountain and forest environments, and variations in the size of smoke plumes captured by UAV aerial photos due to differences in altitude.
To tackle these issues, this paper proposed a method for forest fire smoke detection based on an improved YOLOv5s and UAV-based imagery. Firstly, we employed K-means++ to optimize anchor box clustering and minimize classification errors. Next, we incorporated a novel partial convolution (PConv) technique to enhance the YOLOv5s backbone network, reducing the number of model parameters and increasing the training speed. Additionally, we introduced a smaller anchor preselector and a new detection layer into the YOLOv5s to enhance the detection of small-scale targets. Furthermore, we integrated a coordinate attention module into YOLOv5s to achieve precise localization and feature extraction of smoke targets within complex backgrounds. Lastly, to address the limited sample size of the forest fire smoke dataset, we employed transfer learning to train the model.
In this study, we evaluated the impact of the improved modules within the improved YOLOv5s model and its performance in the task of forest fire smoke detection through various experiments. These experiments included ablation experiments and three controlled experiments on different attention mechanisms modules, different backbone architectures, and different state-of-the-art models. The conclusions are as follows:
(1)
The results of the controlled experiments on different attention mechanisms modules show that the model with CA performed the best in almost all the evaluation metrics, with a A P 50 , A P S , and A P M reaching 0.94, 0.34, and 0.55, respectively. A P L was also improved by 1.3 points compared to the original model. Additionally, heatmap experiments with various attention mechanisms indicated that the CA module possesses superior foreground-background differentiation capabilities and heightened accuracy in the detection of forest fire smoke.
(2)
The results of the controlled experiments on different backbone architectures show that, by employing our custom-designed backbone, the model’s parameters were reduced from 6.11 M to 6.02 M, GFLOPS decreased from 15.8 to 12.8, and the image detection time was diminished from 12.7 ms to 12.3 ms, with the FPS increasing from 78.7 to 81.3. Moreover, relative to the CSPDarknet53 of the original YOLOv5s, our backbone network model achieved enhancements of 0.9, 3.6, 1.5, and 1.2 percentage points in the evaluation metrics A P 50 , A P S , A P M , and A P L , respectively. Our designed backbone not only elevated the AP metrics, but also compacted the model size and expedited processing speed.
(3)
The results of the controlled experiments on different state-of-the-art models show that our model, with a total of 11.1 M parameters, is marginally larger than the fastest YOLOv5s, which has 6.11 M parameters. However, thanks to the backbone designed for more efficient memory access, our model secured a notable advantage in terms of laudable inference speed (13 ms) and the minimal quantity of floating-point operations (13.3 GFLOPS), marking an improvement over SSD, YOLOv3, YOLOv4, YOLOv5, YOLOv7, and YOLOv8s. Moreover, our model achieved exhilarating accuracy results, leading the pack with the highest recorded 96% in A P 50 and 57.3% in A P 50 : 95 . While the proposed approach may not surpass YOLOv5s in terms of model parameters and inference speed, it successfully achieved a favorable balance between speed of inference and accuracy of detection. From the detection experiments conducted on three actual instances of forest fire smoke, it is evident that our model possesses the highest accuracy for small target smoke detection, along with the greatest confidence. Our model stands superior to the current leading detection frameworks, including YOLOv7 and YOLOv8.
(4)
The ablation study results indicate that the inclusion of a backbone design, CA module, and small target detection head module enhanced the accuracy of the original YOLOv5s model. Among these, the YOLOv5s + BD + SDH + CA (the model we proposed in this paper) exhibited the most significant improvements, increasing A P 50 by 4.1%, A P 50 : 95 by 1.1%, A P S by 12.4%, A P M by 3.6%, and A P L by 2.4%.
(5)
In conclusion, the experimental results demonstrate a significant improvement in the performance of our model compared to YOLOv5s and other commonly used models, highlighting the potential of our approach for forest fire smoke detection. Additionally, the results of extended experiments indicate that our approach also possesses certain universality and superiority in other small object detection tasks.
While our proposed method has made commendable contributions and shows promise in the detection of forest fire smoke, it still has its shortcomings. The performance of our detection algorithm falters under low-light conditions or at night. Furthermore, the complex background of forest landscapes, replete with numerous disturbances, necessitates the further enhancement in our algorithm’s robustness and its ability to resist interference.
Our future work will focus on distinguishing between forest fire smoke and similar smoke-like objects, such as clouds and haze. We propose the integration of both infrared and visible cameras on the UAV to capture diverse types of smoke imagery. By extracting features from infrared photos, we aim to achieve more accurate discrimination between different types of smoke and other smoke-like objects. Additionally, we plan to test the practical application of the forest fire smoke detection module proposed in this paper.

Author Contributions

H.Y. designed the project, devised the programs, and drafted the initial manuscript. J.W. (Jiacun Wang) and J.W. (Jun Wang) revised the manuscript. All authors have read and agreed to the published version of the manuscript.

Funding

This work was supported in part by the Defense Science and Technology Foundation of China under Grant No. 173 (2021-JCJQ-JJ-0883).

Data Availability Statement

Data available within the article.

Conflicts of Interest

The authors declare no conflict of interest.

References

  1. Adachi, J.K.; Li, L. The impact of wildfire on property prices: An analysis of the 2015 Sampson Flat Bushfire in South Australia. Cities 2023, 136, 104255. [Google Scholar] [CrossRef]
  2. Fantina, T.; Vittorio, L. The Dilemma of Wildfire Definition: What It Reveals and What It Implies. Front. For. Glob. Change 2020, 3, 553116. [Google Scholar]
  3. Tang, C.Y.; Zhang, H.W.; Liu, S.Z.; Zhu, G.L.; Sun, M.H.; Wu, Y.S.; Gan, Y.D. Research on the Setting of Australian Mountain Fire Emergency Center Based on -Means Algorithm. Math. Probl. Eng. 2021, 2021, 5783713. [Google Scholar] [CrossRef]
  4. Saffre, F.; Hildmann, H.; Karvonen, H.; Lind, T. Monitoring and Cordoning Wildfires with an Autonomous Swarm of Unmanned Aerial Vehicles. Drones 2022, 6, 301. [Google Scholar] [CrossRef]
  5. Kantarcioglu, O.; Kocaman, S.; Schindler, K. Artificial neural networks for assessing forest fire susceptibility in Türkiye. Ecol. Inform. 2023, 75, 102034. [Google Scholar] [CrossRef]
  6. Lertsinsrubtavee, A.; Kanabkaew, T.; Raksakietisak, S. Detection of forest fires and pollutant plume dispersion using IoT air quality sensors. Environ. Pollut. 2023, 338, 122701. [Google Scholar] [CrossRef] [PubMed]
  7. Javadi, S.H.; Mohammadi, A. Fire detection by fusing correlated measurements. J. Ambient Intell. Hum. Comput. 2019, 10, 1443–1451. [Google Scholar] [CrossRef]
  8. Ertugrul, M.; Varol, T.; Ozel, H.B.; Mehmet, C.; Hakan, S. Influence of climatic factor of changes in forest fire danger and fire season length in Turkey. Environ. Monit. Assess. 2021, 193, 28. [Google Scholar] [CrossRef]
  9. Jiao, Q.; Fan, M.; Tao, J.; Wang, W.; Liu, D.; Wang, P. Forest Fire Patterns and Lightning-Caused Forest Fire Detection in Heilongjiang Province of China Using Satellite Data. Fire 2023, 6, 166. [Google Scholar] [CrossRef]
  10. Xue, Z.; Lin, H.; Wang, F. A Small Target Forest Fire Detection Model Based on YOLOv5 Improvement. Forests 2022, 13, 1332. [Google Scholar] [CrossRef]
  11. Wang, K.; Yuan, Y.; Chen, M.; Lou, Z.; Zhu, Z.; Li, R. A Study of Fire Drone Extinguishing System in High-Rise Buildings. Fire 2022, 5, 75. [Google Scholar] [CrossRef]
  12. Zhang, L.; Wang, M.; Ding, Y.; Bu, X. MS-FRCNN: A Multi-Scale Faster RCNN Model for Small Target Forest Fire Detection. Forests 2023, 14, 616. [Google Scholar] [CrossRef]
  13. Al-Smadi, Y.; Alauthman, M.; Al-Qerem, A.; Aldweesh, A.; Quaddoura, R.; Aburub, F.; Mansour, K.; Alhmiedat, T. Early Wildfire Smoke Detection Using Different YOLO Models. Machines 2023, 11, 246. [Google Scholar] [CrossRef]
  14. Zhao, L.; Liu, J.; Peters, S.; Li, J.; Oliver, S.; Mueller, N. Investigating the Impact of Using IR Bands on Early Fire Smoke Detection from Landsat Imagery with a Lightweight CNN Model. Remote Sens. 2022, 14, 3047. [Google Scholar] [CrossRef]
  15. Lu, K.; Xu, R.; Li, J.; Lv, Y.; Lin, H.; Liu, Y. A Vision-Based Detection and Spatial Localization Scheme for Forest Fire Inspection from UAV. Forests 2022, 13, 383. [Google Scholar] [CrossRef]
  16. Kim, S.-Y.; Muminov, A. Forest Fire Smoke Detection Based on Deep Learning Approaches and Unmanned Aerial Vehicle Images. Sensors 2023, 23, 5702. [Google Scholar] [CrossRef] [PubMed]
  17. Zhao, Y.; Ma, J.; Li, X.; Zhang, J. Saliency Detection and Deep Learning-Based Wildfire Identification in UAV Imagery. Sensors 2018, 18, 712. [Google Scholar] [CrossRef] [PubMed]
  18. Li, T.; Zhao, E.; Zhang, J.; Hu, C. Detection of Wildfire Smoke Images Based on a Densely Dilated Convolutional Network. Electronics 2019, 8, 1131. [Google Scholar] [CrossRef]
  19. Zhou, P.; Liu, G.; Wang, J.; Weng, Q.; Zhang, K.; Zhou, Z. Lightweight unmanned aerial vehicle video object detection based on spatial-temporal correlation. Int. J. Commun. Syst. 2022, 35, 5334. [Google Scholar] [CrossRef]
  20. Hu, B.; Wang, J. Deep learning based hand gesture recognition and UAV flight controls. Int. J. Autom. Comput. 2020, 17, 17–29. [Google Scholar] [CrossRef]
  21. Almeida, J.S.; Jagatheesaperumal, S.K.; Nogueira, F.G.; de Albuquerque, V.H.C. EdgeFireSmoke++: A novel lightweight algorithm for real-time forest fire detection and visualization using internet of things-human machine interface. Expert Syst. Appl. 2023, 221, 119747. [Google Scholar] [CrossRef]
  22. Zhang, Y.; Chen, S.; Wang, W.; Zhang, W.; Zhang, L. Pyramid Attention Based Early Forest Fire Detection Using UAV Imagery. J. Phys. Conf. Ser. 2022, 2363, 012021. [Google Scholar] [CrossRef]
  23. Lee, S.J.; Lee, Y.W. Detection of Wildfire-Damaged Areas Using Kompsat-3 Image: A Case of the 2019 Unbong Mountain Fire in Busan, South Korea. Korean J. Remote Sens. 2020, 36, 29–39. [Google Scholar]
  24. Imran; Ahmad, S.; Kim, D.H. A task orchestration approach for efficient mountain fire detection based on microservice and predictive analysis in IoT environment. J. Intell. Fuzzy Syst. 2021, 40, 5681–5696. [Google Scholar] [CrossRef]
  25. Yang, X.; Wang, Y.; Liu, X.; Liu, Y. High-Precision Real-Time Forest Fire Video Detection Using One-Class Model. Forests 2022, 13, 1826. [Google Scholar] [CrossRef]
  26. Xu, Y.; Yu, G.; Wang, Y.; Wu, X.; Ma, Y. Car Detection from Low-Altitude UAV Imagery with the Faster R-CNN. J. Adv. Transp. 2017, 2017, 2823617. [Google Scholar] [CrossRef]
  27. Liu, W.; Anguelov, D.; Erhan, D.; Szegedy, C.; Reed, S.; Fu, C.Y.; Berg, A.C. Ssd: Single shot multibox detector. In Proceedings of the European Conference on Computer Vsion (ECCV 2016), Amsterdam, The Netherlands, 8–16 October 2016; pp. 21–37. [Google Scholar]
  28. Xie, X.; Cheng, G.; Wang, J.; Yao, X.; Han, J. Oriented R-CNN for object detection. In Proceedings of the IEEE/CVF International Conference on Computer Vision, Montreal, BC, Canada, 11–17 October 2021; pp. 3520–3529. [Google Scholar]
  29. Redmon, J.; Divvala, S.; Girshick, R.; Farhadi, A. You only look once: Unified, real-time object detection. In Proceedings of the IEEE Conference on Computer Vision and Pattern Recognition (CVPR 2016), Las Vegas, NV, USA, 26 June–1 July 2016; pp. 779–788. [Google Scholar]
  30. Redmon, J.; Farhadi, A. YOLO9000: Better, faster, stronger. In Proceedings of the IEEE Conference on Computer Vision and Pattern Recognition (CVPR 2017), Honolulu, HI, USA, 21–26 July 2017; pp. 7263–7271. [Google Scholar]
  31. Redmon, J.; Farhadi, A. Yolov3: An incremental improvement. arXiv 2018, arXiv:1804.02767. [Google Scholar]
  32. Bochkovskiy, A.; Wang, C.Y.; Liao, H.Y.M. YOLOv4: Optimal Speed and Accuracy of Object Detection. arXiv 2020, arXiv:2004.10934. [Google Scholar]
  33. Jocher, G. YOLOv5. Ultralytics: Github. 2023. Available online: https://github.com/ultralytics/yolov5 (accessed on 12 May 2023).
  34. Marsha, A.L.; Larkin, N.K. Evaluating Satellite Fire Detection Products and an Ensemble Approach for Estimating Burned Area in the United States. Fire 2022, 5, 147. [Google Scholar] [CrossRef]
  35. Singh, N.; Chatterjee, R.S.; Kumar, D.; Panigrahi, D.C. Spatio-temporal variation and propagation direction of coal fire in Jharia Coalfield, India by satellite-based multi-temporal night-time land surface temperature imaging. Int. J. Min. Sci. Technol. 2021, 31, 765–778. [Google Scholar] [CrossRef]
  36. Zheng, R.; Zhang, D.; Lu, S.; Yang, S.L. Discrimination Between Fire Smokes and Nuisance Aerosols Using Asymmetry Ratio and Two Wavelengths. Fire Technol. 2019, 55, 1753–1770. [Google Scholar] [CrossRef]
  37. Tu, R.; Zeng, Y.; Fang, J.; Zhang, Y.M. Influence ofhigh altitude on the burning behaviour of typical combustibles and the related responses of smoke detectors in compartments. R. Soc. Open Sci. 2018, 5, 180188. [Google Scholar] [CrossRef] [PubMed]
  38. Reddy, P.R.; Kalyanasundaram, P. Novel Detection of Forest Fire Using Temperature and Carbon Dioxide Sensors with Improved Accuracy in Comparison between Two Different Zones. In Proceedings of the International Conference on Intelligent Engineering and Management (ICIEM 2022), London, UK, 27–29 April 2022; pp. 524–527. [Google Scholar]
  39. Kadir, E.A.; Rahim, S.K.A.; Rosa, S.L. Multi-sensor system for land and forest fire detection application in Peatland Area. Indones. J. Electr. Eng. Inform. (IJEEI) 2019, 7, 789–799. [Google Scholar]
  40. Benzekri, W.; Moussati, A.E.; Moussaoui, O.; Berrajaa, M. Early Forest Fire Detection System using Wireless Sensor Network and Deep Learning. Int. J. Adv. Comput. Sci. Appl. 2020, 11, 5. [Google Scholar] [CrossRef]
  41. Yuan, C.; Liu, Z.; Zhang, Y. Fire Detection Using Infrared Images for UAV-Based Forest Fire Surveillance. In Proceedings of the International Conference on Unmanned Aircraft Systems (ICUAS), Miami, FL, USA, 13–16 June 2017; pp. 567–572. [Google Scholar]
  42. Yuan, H.W.; Xiao, C.S.; Wang, Y.F.; Peng, X.; Wen, Y.Q.; Li, Q.L. Maritime vessel emission monitoring by an UAV gas sensor system. Ocean Eng. 2020, 218, 108206. [Google Scholar] [CrossRef]
  43. Yuan, H.; Xiao, C.; Zhan, W.; Wang, Y.F.; Shi, C.; Ye, H.X.; Jiang, K.; Ye, Z.Y.; Zhou, C.H.; Wen, Y.Q.; et al. Target Detection, Positioning and Tracking Using New UAV Gas Sensor Systems: Simulation and Analysis. J. Intell. Robot. Syst. 2019, 94, 871–882. [Google Scholar] [CrossRef]
  44. Peruzzi, G.; Pozzebon, A.; Van Der Meer, M. Fight Fire with Fire: Detecting Forest Fires with Embedded Machine Learning Models Dealing with Audio and Images on Low Power IoT Devices. Sensors 2023, 23, 783. [Google Scholar] [CrossRef]
  45. Muid, A.; Kane, H.; Sarasawita, I.K.A.; Evita, M.; Aminah, N.S.; Budiman, M.; Djamal, M. Potential of UAV Application for Forest Fire Detection. J. Phys. Conf. Ser. 2022, 2243, 012041. [Google Scholar] [CrossRef]
  46. Ba, R.; Song, W.; Li, X.; Xie, Z.; Lo, S. Integration of Multiple Spectral Indices and a Neural Network for Burned Area Mapping Based on MODIS Data. Remote Sens. 2019, 11, 326. [Google Scholar] [CrossRef]
  47. Li, B.; Lu, S.Q.; Wang, F.; Sun, X.L.; Zhang, Y.J. Fog Detection by Multi-threshold and DistanceWeights of Connected Component. Remote Sens. Inf. 2022, 37, 41–47. [Google Scholar]
  48. Jang, H.-Y.; Hwang, C.-H. Preliminary Study for Smoke Color Classification of Combustibles Using the Distribution of Light Scattering by Smoke Particles. Appl. Sci. 2023, 13, 669. [Google Scholar] [CrossRef]
  49. Asiri, N.; Bchir, O.; Ismail, M.M.B.; Zakariah, M.; Alotaibi, Y.A. Image-based smoke detection using feature mapping and discrimination. Soft Comput. 2021, 25, 3665–3674. [Google Scholar] [CrossRef]
  50. Alexandrov, D.; Pertseva, E.; Berman, I.; Pantiukhin, I.; Kapitonov, A. Analysis of Machine Learning Methods for Wildfire Security Monitoring with an Unmanned Aerial Vehicles. Proceedings of 2019 24th Conference of Open Innovations Association (FRUCT), Moscow, Russia, 8–12 April 2019; pp. 3–9. [Google Scholar]
  51. Ghali, R.; Akhloufi, M.A.; Mseddi, W.S. Deep Learning and Transformer Approaches for UAV-Based Wildfire Detection and Segmentation. Sensors 2022, 22, 1977. [Google Scholar] [CrossRef]
  52. Mukhiddinov, M.; Abdusalomov, A.B.; Cho, J. A Wildfire Smoke Detection System Using Unmanned Aerial Vehicle Images Based on the Optimized YOLOv5. Sensors 2022, 22, 9384. [Google Scholar] [CrossRef] [PubMed]
  53. Zhou, H.; Ma, A.; Niu, Y.; Ma, Z. Small-Object Detection for UAV-Based Images Using a Distance Metric Method. Drones 2022, 6, 308. [Google Scholar] [CrossRef]
  54. Jiao, Z.T.; Zhang, Y.M.; Xin, J.; Mu, L.X.; Yi, Y.M.; Liu, H.; Liu, D. A Deep Learning Based Forest Fire Detection Approach Using UAV and YOLOv3. In Proceedings of the International Conference on Industrial Artificial Intelligence (IAI), Shenyang, China, 23–27 July 2019; pp. 1–5. [Google Scholar]
  55. Xiao, Z.; Wan, F.; Lei, G.; Xiong, Y.; Xu, L.; Ye, Z.; Liu, W.; Zhou, W.; Xu, C. FL-YOLOv7: A Lightweight Small Object Detection Algorithm in Forest Fire Detection. Forests 2023, 14, 1812. [Google Scholar] [CrossRef]
  56. Chen, J.; Kao, S.; He, H.; Zhou, W.; Lee, C.H.; Chan, S.G. Run, Don’t Walk: Chasing Higher FLOPS for Faster Neural Networks. arXiv 2023, arXiv:2303.03667. [Google Scholar]
  57. Hu, J.; Shen, L.; Sun, J. Squeeze-and-excitation networks. In Proceedings of the IEEE Conference on Computer Vision and Pattern Recognition, Salt Lake City, UT, USA, 18–22 June 2018; pp. 7132–7141. [Google Scholar]
  58. Zhang, Z.; Wang, M. Convolutional Neural Network with Convolutional Block Attention Module for Finger Vein Identification. arXiv 2022, arXiv:2202.06673. [Google Scholar]
  59. Hou, Q.; Zhou, D.; Feng, J. Coordinate attention for efficient mobile network design. In Proceedings of the IEEE/CVF Conference on Computer Vision and Pattern Recognition, Kuala Lumpur, Malaysia, 18–20 December 2021; pp. 13713–13722. [Google Scholar]
  60. Fire_Detection Dataset. Available online: https://aistudio.baidu.com/aistudio/datasetdetail/90352/0 (accessed on 12 May 2023).
  61. High Performance Wireless Research and Education Network (HPWREN). Education Network University of California San Diego. HPWREN Dataset. 2020. Available online: http://hpwren.ucsd.edu/HPWREN-FIgLib/ (accessed on 12 May 2023).
  62. Zhang, H.; Cisse, M.; Dauphin, Y.N.; Lopez-Paz, D. mixup: Beyond empirical risk minimization. arXiv 2017, arXiv:1710.09412. [Google Scholar]
  63. Yun, S.; Han, D.; Oh, S.J.; Chun, S.; Choe, J.; Yoo, Y. Cutmix: Regularization strategy to train strong classifiers with localizable features. In Proceedings of the IEEE/CVF International Conference on Computer Vision, Seoul, Republic of Korea, 27 October–2 November 2019; pp. 6023–6032. [Google Scholar]
  64. Wang, Q.; Wu, B.; Zhu, P.; Li, P.; Zuo, W.; Hu, Q. ECA-Net: Efficient Channel Attention for Deep Convolutional Neural Networks. In Proceedings of the IEEE/CVF Conference on Computer Vision and Pattern Recognition, Seattle, WA, USA, 16–18 June 2020; pp. 11534–11542. [Google Scholar]
  65. Xia, G.-S.; Bai, X.; Ding, J.; Zhu, Z.; Belongie, S.; Luo, J.; Datcu, M.; Pelillo, M.; Zhang, L. DOTA: A Large-Scale Dataset for Object Detection in Aerial Images. In Proceedings of the IEEE Conference on Computer Vision and Pattern Recognition, Salt Lake City, UT, USA, 18–22 June 2018; pp. 3974–3983. [Google Scholar]
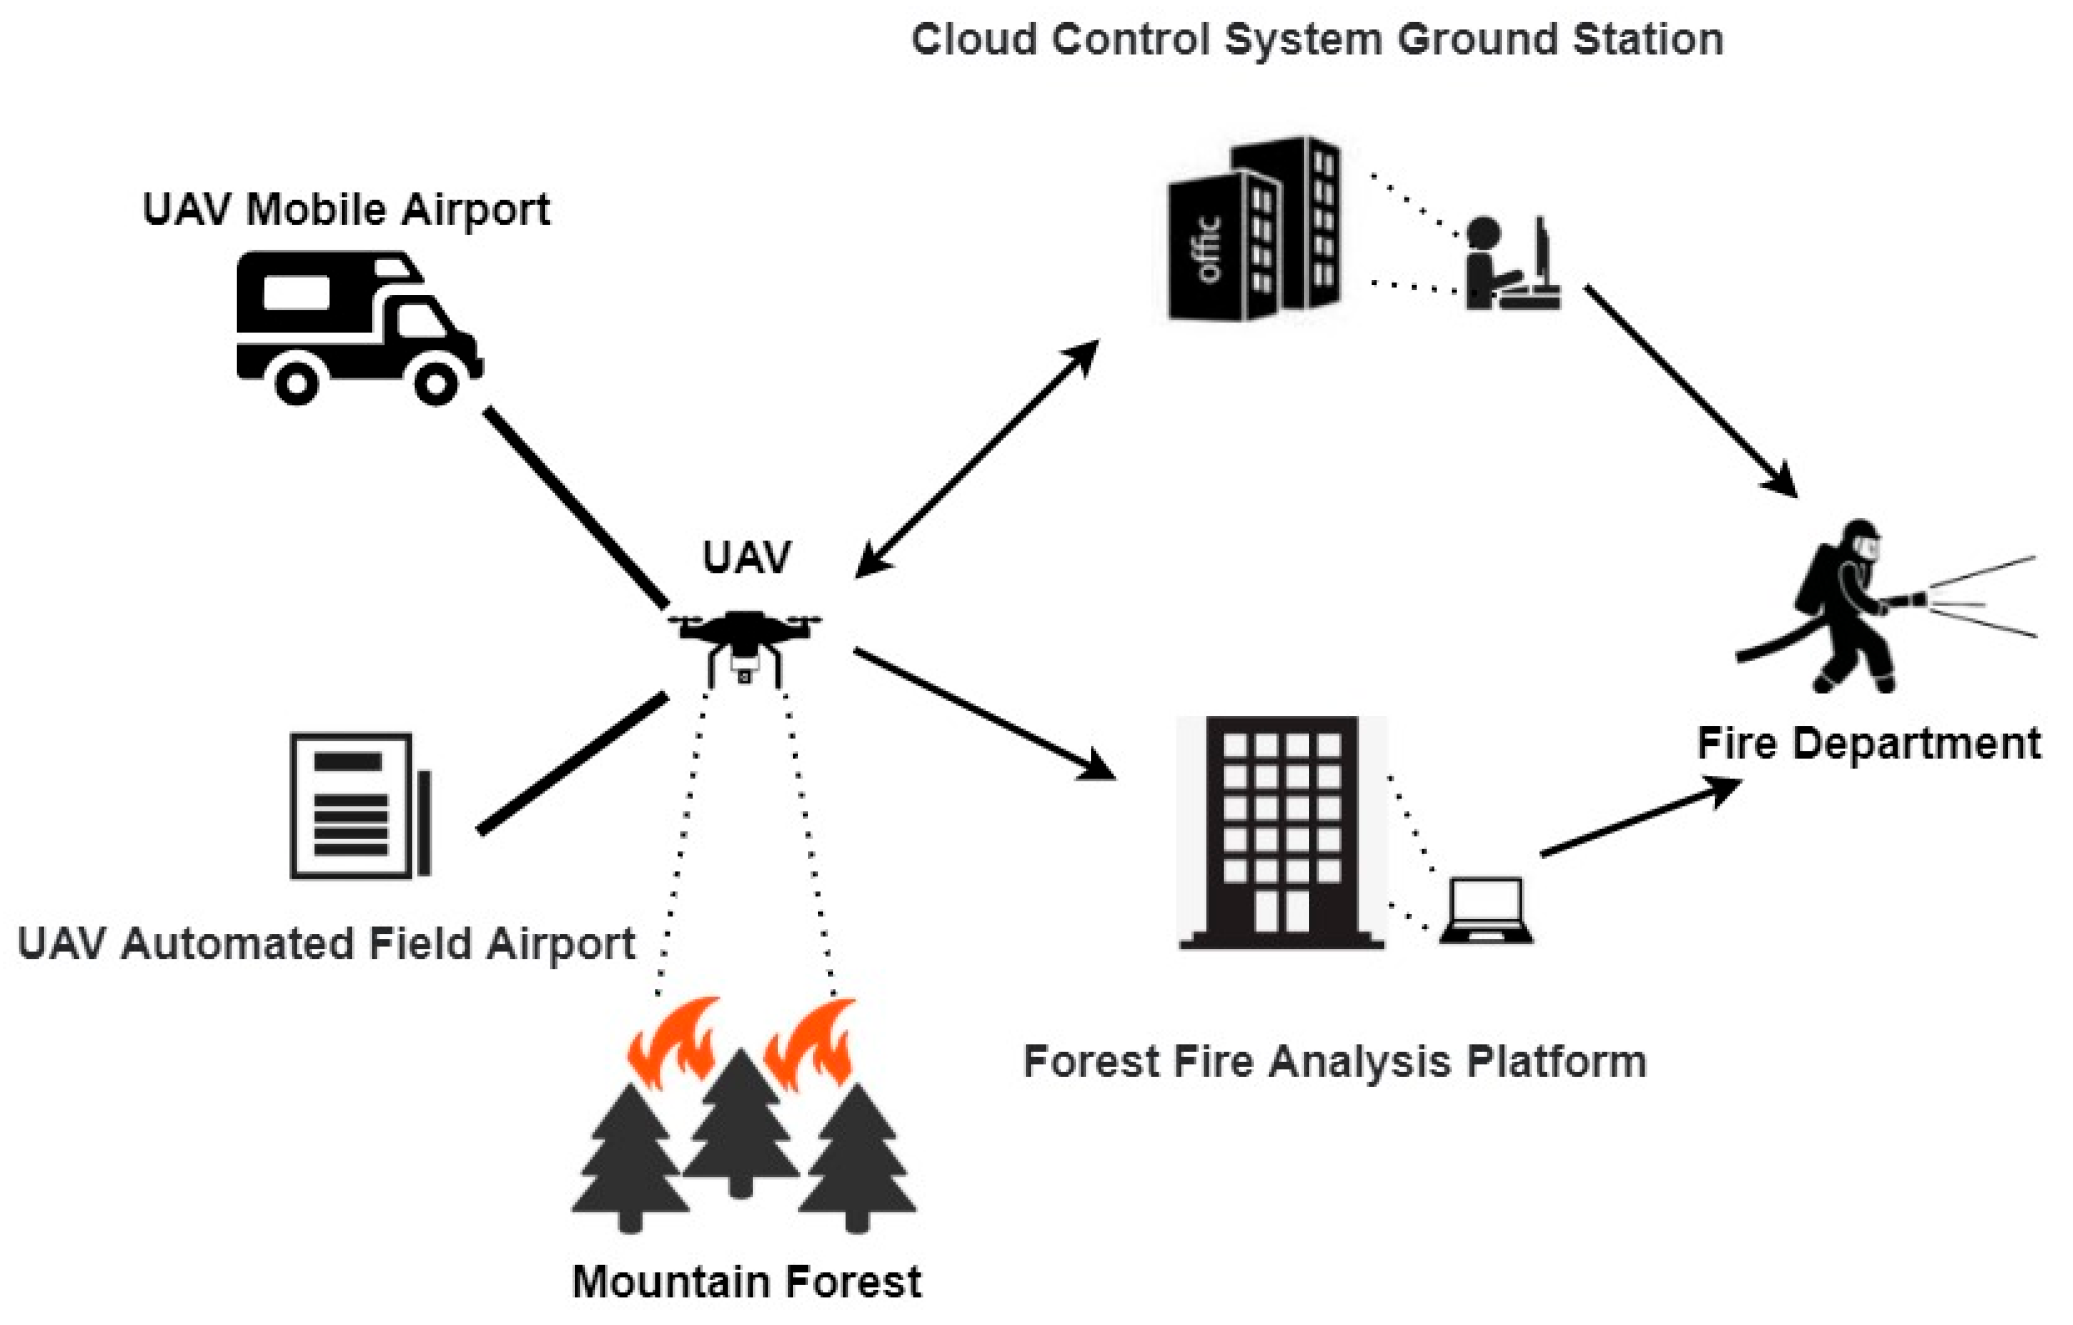
Figure 1. Overview of the UAV-based forest fire smoke detection procedure.
Remotesensing 15 05527 g001
Figure 2. Structure diagram of the proposed improved YOLOv5s model. The changes are framed by the solid green line.
Remotesensing 15 05527 g002
Figure 3. Structure diagram of the original YOLOv5 model. In the diagram, the notation “*x” signifies that the network comprises x Rex (X) modules.
Remotesensing 15 05527 g003
Figure 4. Diagram of different convolutions. (a) Convolution; (b) depthwise/group convolution; and (c) partial convolution (PConv).
Remotesensing 15 05527 g004
Figure 5. Diagram of FasterBlock. In the diagram, the notation “*” signifies Convolution modules.
Remotesensing 15 05527 g005
Figure 6. Diagram of the CA module.
Remotesensing 15 05527 g006
Figure 7. Structure diagram of the improved YOLOv5 model, using transfer learning strategy. In the diagram, the notation “2*x” signifies that the network comprises 2×x CBS modules.
Remotesensing 15 05527 g007
Figure 8. Sample images of a forest fire smoke dataset. The blue box represents the ground truth for the target smoke, which is the annotation bounding box. (a) Small-sized smoke; (b) medium-sized smoke; (c) large-sized smoke; and (d) only clouds and no smoke.
Remotesensing 15 05527 g008
Figure 9. Augmented data. (ad) Original images; (e) Mosaic; (f) MixUp; (g) HSV; and (h) traditional techniques, including rotation, displacement, scaling, cropping, and flipping. The green boxes represent the ground truth for the target smoke, which are the annotation bounding boxes.
Remotesensing 15 05527 g009
Figure 10. Visualization results of the proposed forest fire smoke detection method for different forest environments: (a) medium- and-large-sized smoke images; and (b) small-sized smoke images.
Remotesensing 15 05527 g010aRemotesensing 15 05527 g010b
Figure 11. Bar chart of AP metrics for various attention mechanisms.
Remotesensing 15 05527 g011
Figure 12. Heat maps for the different attention modules: (a,b) original image; (c,d) SE; (e,f) CBAM; (g,h) ECA; and (i,j) CA. The red area in the image represents the region of attention focus when the network model predicts the image type. The intensity of the color indicates the degree of attention gathered, with darker shades indicating a higher level of attention.
Remotesensing 15 05527 g012aRemotesensing 15 05527 g012b
Figure 13. Line graph of FPS metrics and AP metrics for various algorithms. The blue line represents A P 50 , while the orange line indicates FPS.
Remotesensing 15 05527 g013
Figure 14. Prediction results on the test dataset. (a) Original images; (b) SSD; (c) YOLOv3; (d) YOLOv4; (e) YOLOv5s; and (f) our proposed method (Improved YOLOv5s). The red labeled boxes in all figures indicate the smoke targets identified by various smoke detection algorithms. The blue boxes represent the ground truth annotations for each smoke instance. The data provided within these labeled boxes represents the confidence levels assigned to each smoke target by the respective detection algorithms.
Remotesensing 15 05527 g014aRemotesensing 15 05527 g014b
Figure 15. Bar chart of AP metrics for the different ablation study groups.
Remotesensing 15 05527 g015
Figure 16. Visualized detection results of the proposed improved YOLOv5s method on the DOTA dataset. The numbers on the detection boxes in the diagram represent the labels of different types of targets.
Remotesensing 15 05527 g016aRemotesensing 15 05527 g016b
Table 1. Modules added in our proposed method compared to the original YOLOv5s.
ModelSPPFPANFPNLightweight Backbone DesignCoordinate AttentionSmall-Scale Detection Head
YOLOv5s
Ours
Note that the presence of the “√” indicates that the model includes the respective modules listed.
Table 2. Microsoft COCO criteria—commonly used in object detection task for evaluating the model precision and recall across multiple scales. Area is represented by the number of pixels.
MetricsDetails
PrecisionTP/(TP+FP)
TP/(TP+FN)
Recall
A P 50 AP at IoU = 0.5
A P 75 AP at IoU = 0.75
A P 50 : 95 AP mean values for different IoU thresholds between 0.5 and 0.95
A P S A P 50 for small objects: area <   32 2
A P M A P 50 for medium objects: 32 2 < area <   96 2
A P L A P 50 for large objects: area > 96 2
Table 3. Experimental conditions.
Experimental EnvironmentDetails
Operating systemWindows 10
Pycharm 2022.1.3
Compiler
Programming languagePython 3.6
Deep Learning FrameworkPytorch 1.5.1
GPU modelNVIDIA GeForce RTX2070 8 GB
CUDA version 12.0
Central Processing UnitIntel(R) Core(TM) i7-10750H CPU
Table 4. Training parameters of the forest fire smoke detection model.
Training ParametersDetails
Epochs300
8
Batch size
Image size640 × 640
OptimizerSGD
Number of workers0
Table 5. Details of the dataset.
DatasetNumber of Images
TrainValTest
Forest fire Smoke1180147147
Non-Smoke864108108
Table 6. Effects of different attention mechanisms on network performance.
ModelSECBAMECACAPrecisionRecall A P 50 A P S A P M A P L
YOLOv5s 88.290.591.929.654.262.9
89.390.592.832.654.565.3
64.9
89.69392.833.954.8
93.793.29427.352.165
94.592.694345564.2
Note that Precision, Recall, A P 50 , A P S , A P M , and A P L are all shown as percentages. The best figure of each metric is highlighted in bold. The presence of the “√” indicates that the model includes the respective modules listed.
Table 7. Effects of different backbones on the YOLOv5 network performance.
BaselineBackboneParam/MGFLOPsSpeed GPU (ms)FPS A P 50 A P S A P M A P L
YOLOv5sCSPDarknet-536.1115.812.778.791.929.654.262.9
Ours6.0212.812.381.392.833.255.764.1
Note that A P 50 , A P S , A P M , and A P L are all shown as percentages. The best figure of each metric is highlighted in bold.
Table 8. Detection results for some mainstream object detection networks.
Model A P 50 A P 50 : 95 Param/MGFLOPsSpeed GPU (ms)FPS
SSD86.252.426.15294.82441.7
YOLOv390.254.461.5154.541.823.9
YOLOv491.156.664.36148.244.522.5
YOLOv5s91.956.26.1115.812.778.7
YOLOv795.157.137.2105.128.435.2
YOLOv8s94.25711.228.313.872.4
Ours9657.311.113.31376.9
Note that A P 50 , A P 75 , A P 50 : 95 , A P S , A P M , and A P L are all shown as percentages. The figures of our model are highlighted in bold.
Table 9. Comparison results of the ablation experiments.
Experiment NumberModel A P 50 A P 75 A P 50 : 95 A P S A P M A P L
1YOLOv5s91.953.856.229.654.262.9
2YOLOv5s + BD92.859.756.333.255.764.1
3YOLOv5s + SDH936156.436.257.163.9
4YOLOv5s + CA9461.756.7345564.2
5YOLOv5s + BD + SDH92.854.956.141.351.265.9
6YOLOv5s + BD + CA95.257.356.640.855.965.2
7YOLOv5s + SDH + CA92.155.355.43752.762.9
8YOLOv5s + BD + SDH + CA9664.557.34257.865.3
Note that A P 50 , A P 75 , A P 50 : 95 , A P S , A P M , and A P L are all shown as percentages. The best figure of each metric is highlighted in bold.
Table 10. Detection results on DOTA for some mainstream object detection models.
ModelmAPParam/M
RetinaNet65.637.8
YOLOv5s65.87.4
YOLOv5m66.322.3
YOLOX69.625.8
Ours71.411.5
Note that m A P is shown as a percentage. The figures of our model are highlighted in bold.
Disclaimer/Publisher’s Note: The statements, opinions and data contained in all publications are solely those of the individual author(s) and contributor(s) and not of MDPI and/or the editor(s). MDPI and/or the editor(s) disclaim responsibility for any injury to people or property resulting from any ideas, methods, instructions or products referred to in the content.