Article

Effects of Strong Geomagnetic Storms on the Ionosphere and Degradation of Precise Point Positioning Accuracy during the 25th Solar Cycle Rising Phase: A Case Study

1
Joint Laboratory of Power Remote Sensing Technology, Electric Power Research Institute, Yunnan Power Grid Company Ltd., Kunming 650217, China
2
State Key Laboratory of Geodesy and Earth’s Dynamics, Innovation Academy for Precision Measurement Science and Technology, Chinese Academy of Sciences, Wuhan 430077, China
3
University of Chinese Academy of Sciences, Beijing 100049, China
*
Author to whom correspondence should be addressed.
Remote Sens. 2023, 15(23), 5512; https://doi.org/10.3390/rs15235512
Submission received: 25 October 2023 / Revised: 19 November 2023 / Accepted: 24 November 2023 / Published: 27 November 2023

Abstract

:
Approaching the peak year of the 25th solar activity cycle, the frequency of strong geomagnetic storms is gradually increasing, which seriously affects the navigation and positioning performance of GNSS. Based on the globally distributed GNSS station data and FORMOSAT-7/COSMIC-2 occultation data, this paper explores for the first time the effects of the G4-class geomagnetic storm that occurred on 23–24 April 2023 on the global ionosphere, especially the ionospheric equatorial anomalies and F-layer perturbations. It reveals the precise point positioning (PPP) accuracy degradation during a geomagnetic storm. The results show that the ionospheric rate of total electron content index (ROTI) and near high latitude GNSS phase scintillations index have varying levels of perturbation during geomagnetic storms, with the maximum ROTI and phase scintillations index exceeding 0.5 TECU/min and 0.8, respectively. The equatorial ionization anomaly (EIA) shows an enhanced state (positive ionospheric storms) during geomagnetic storms, and the cause of this phenomenon is most likely the equatorward neutral wind. The variation of the S4 index of the FORMOSAT-7/COSMIC-2 satellite reveals the uplift of the F-layer during geomagnetic storms. During geomagnetic storms, the PPP accuracy degrades most seriously at high latitudes, the maximum MAE exceeds 2.3 m, and the RMS in the three-dimensional (3D) direction exceeds 2.0 m. These investigations can provide case support for space weather and GNSS studies of the impact of geomagnetic storms during peak solar activity years.

1. Introduction

The ionosphere is an important part of the solar–terrestrial space environment and is a highly variable ionized region. For the global navigation satellite system (GNSS), ionospheric delays caused by somewhat regular spatial and temporal variations in the ionosphere can be better solved by numerical simulations or ionosphere-free combination methods [1,2,3,4]. However, the ionosphere does not exist alone in the upper atmosphere; for example, solar wind–magnetosphere–ionosphere coupling and lithosphere–atmosphere–ionosphere coupling increase the difficulty of the investigation of the ionosphere. Among these challenges, geomagnetic storms triggered by strong solar activity are a global magnetospheric disturbance phenomenon, which is the most important link in the solar–terrestrial energy coupling chain [5]. Along with the injection of magnetospheric energy, the ionosphere is significantly perturbed, forming ionospheric storms [6]. Ionospheric delay errors caused by ionospheric storms are very difficult to correct through modeling, and the resulting degradation of the positioning performance of the GNSS is exceptionally strong [7,8,9].
Investigations of the ionospheric response to strong geomagnetic storms are mostly developed with case studies [10,11,12,13,14]. In particular, the two geomagnetic storms of the 24th solar active cycle (on March 2015 and September 2017) are the most typical. The geomagnetic storm of March 2015, also known as the St. Patrick’s Day Storm, was classified as G4 by the National Oceanic and Atmospheric Administration’s (NOAA’s) space weather classification system. Different scholars have studied the relationship between this geomagnetic storm and the ionosphere or its influences on GNSS positioning from different perspectives. Cherniak and Zakharenkova [15] found a high correlation between high-latitude ionospheric irregularities caused by geomagnetic storms and auroral activity based on data from more than 2500 GPS stations. Nava et al. [16] investigated the status of ionospheric variations in four sectors (Asia, Africa, the Americas, and the Pacific) at low and middle latitudes during the storms and provided explanations for various types of phenomena. Jacobsen and Andalsvik [17] observed ionospheric disturbances in northern Norway (based on the national real-time kinematic (RTK) positioning network) that may be related to ionospheric polar cap plasma patches and particle precipitation caused by magnetic reconnection. They also analyzed the performance metrics of RTK and precise point positioning (PPP) during the storm. Combining GPS and Swarm satellite data, Zakharenkova et al. [18] observed large-scale ionospheric plasma irregularities in Russia and highly structured auroral ionospheric regions extending over 850 km.
The September 2017 coronal mass ejection (CME) and high-speed flow reached near-Earth space and triggered a strong geomagnetic storm with successive violent disturbances in the ionosphere [19,20,21]. Li et al. [22] observed that prompt penetration undershielding electric fields (PPEF) caused by the southward shift of the interplanetary magnetic field (IMF) Bz during the storm was responsible for the significant enhancement of an equatorial plasma bubble (EPB) in the 120°E/60°W longitudinal sector. Zhang et al. [23] reported simultaneous large- and medium-scale traveling ionospheric disturbances (TIDs) at dusk during geomagnetic storms at subaurora and mid-latitudes. Based on observations from the U.S. Continuously Operating Reference Station (CORS) network, Liu et al. [24] explored the total electron content (TEC) of the ionosphere in response to this geomagnetic storm and found medium TIDs with intensities higher than 2.5 TECU. Wan et al. [25] discussed nighttime ionospheric behavior during the recovery phase of the geomagnetic storm. They found that the nighttime ionosphere in the American sector was largely depressed, while in the Asian sector, only a small TEC increase was observed at nighttime, which was much weaker than the prominent daytime TEC enhancement in this longitude sector. Zakharenkova and Cherniak [26] considered the effect of EPB generated by geomagnetic storms on the PPP in mid-latitudes, especially at 25°~35°N, where the three-dimensional (3D) error of GPS stations rises to the meter scale.
Strong geomagnetic storms occurred infrequently during the early part of the 25th solar cycle. However, the occurrence of medium geomagnetic storms also had a severe impact on navigation, communications, and aerospace [27]. For example, the SpaceX storm event in February 2022 resulted in 38 SpaceX Starlink satellites not being able to ascend to their assigned orbits and having to re-enter the atmosphere to be destroyed [28]. With the arrival of the peak year of the 25th solar activity cycle, there has been a gradual increase in intense geomagnetic storms. Based on the 11-year cycle of solar activity [29], October 2023 was in a phase in the 25th solar activity cycle of increasing intensity of solar activity (sunspot number and F10.7) that, as of the time of this writing, had already exceeded the peak of the 24th cycle. Even though many studies have been conducted to analyze the effects of geomagnetic storms occurring at different times on the ionosphere, the geomagnetic storm events under this condition still need further investigation. In this paper, based on the globally distributed GNSS station data and the FORMOSAT-7/COSMIC-2 occultation data, the geomagnetic storm on 23–24 April 2023 is taken as an example to investigate the ionospheric disturbances and the PPP accuracy of global GNSS stations during this period.

2. Data and Methods

2.1. Ionospheric Data

The International GNSS Service (IGS) has established 516 GNSS stations around the world (as of 25 October 2023), providing a large amount of raw observational data for geophysical and space physics investigations. Based on dual-frequency observations of GNSS stations worldwide (see Figure 1) on 23 and 24 April 2023 at a sampling rate of 30 s, the ionospheric TEC of the GNSS stations is solved using a carrier phase smoothing pseudorange:
< P i , j + L i , j > = [ ( λ i N i λ j N j ) + 2 c ( D C B r , i , j + D C B s , i , j ) ]
T E C = L i , j < P i , j + L i , j > c ( D C B r , i , j + D C B s , i , j ) 40.3 ( f i 2 f j 2 )
where r and s denote receiver and satellite, respectively; i and j denote signals at different frequencies ( f i and f j ); P i , j is a combination of pseudorange observations; L i , j is a combination of carrier-phase observations; < · > denotes the average value of a continuous arc segment; and λ i N i λ j N j is a combination of integer ambiguity. D C B r , i , j and D C B s , i , j are the differential code biases (DCB) of the receivers and satellites, respectively, both from the CODE’s (Center for Orbit Determination in Europe) DCB products. The GPS L1 and L2 measurements are used in this paper.
The rate of total electron content index (ROTI) is defined as the standard deviation of the rate of TEC, which can indicate the extent to which the GNSS measurements are disturbed by the ionosphere, and is calculated as follows [30]:
R O T = T E C ( t + Δ t ) T E C ( t ) Δ t
R O T I = < R O T 2 > < R O T > 2
where ROT is the rate of TEC and < · > denotes the average value of a continuous time period. In this paper, we used the observation data with a sampling interval of 30 s, so the time period was set to 5 min. The unit of both ROT and ROTI is TECU/min.
The Massachusetts Institute of Technology (MIT) Haystack Observatory automatically processes original observations from about 6000 GPS receivers around the world every day, generating global ionospheric TEC products with a spatial resolution of 1° × 1° (geographic latitude × geographic longitude) every 5 min [31]. Meanwhile, the global ionospheric maps (GIM) from CODE are used in this paper. The product is calculated from a spherical harmonic function of 15 orders and 15 degrees, taking 5° × 2.5° along the latitude and longitude, with a total of 5183 grid points.
The Canadian High Arctic ionospheric network (CHAIN) is a distributed terrestrial radio instrument array located in the Canadian Arctic. It includes 25 GNSS ionospheric scintillation and total electron content monitors (GISTMs) with high time resolution and 6 advanced digital Canadian ionosondes. Each GISTM provides GPS amplitude scintillation index S4, phase scintillation index σ ϕ , and ionospheric TEC data. The CHAIN provides powerful data support for understanding solar wind–magnetosphere–ionosphere coupling [32].
The FORMOSAT-7/COSMIC-2 radio occultation mission satellite, jointly developed by the United States and the Taiwan Province of China, carries an advanced Tri-GNSS radio occultation system instrument (TGRS), which is capable of receiving GPS and GLONASS signals, as well as Galileo and BDS signals, and provides measurements of about 5000 occultation events per day [33,34]. The ionospheric amplitude scintillation S4 index is calculated as follows, where I is the intensity of the signal and < · > denotes the average value over 1 min:
S 4 = < I 2 > < I > 2 < I > 2

2.2. Space Weather Data

Space weather data are widely used in various types of geophysical and space physics investigations. The space weather data used in this paper include the IMF Bx/By/Bz components, solar wind plasma speed, plasma flow pressure, Kp index, Dst index, and F10.7 index, where the Kp index and the Dst index characterize the degree of geomagnetic disturbance. According to the NOAA space weather scale, a Kp index from 5 to 9 represents minor, moderate, strong, severe, and extreme geomagnetic storms, respectively. The negative Dst index indicates the occurrence of geomagnetic storms, and the larger its absolute value, the greater the intensity of the geomagnetic storm. Its unit is nT. The Space Physics Data Facility of the National Aeronautics and Space Administration provided the space weather data for this paper.

2.3. Precision Point Positioning

PPP is typically based on dual-frequency GNSS observations, and it uses ionosphere-free (IF) combinations for positioning [35,36]:
P r , I F s = ρ r s + c ( d t r d t s ) + T r s + ε P
L r , I F s = ρ r s + c ( d t r d t s ) + T r s + λ I F A I F + ε L
where P r , I F s is the ionosphere-free combination ( f 1 2 P 1 f 2 2 P 2 ) / ( f 1 2 f 2 2 ) of pseudorange observations P 1 and P 2 for signal frequencies f 1 and f 2 , L r , I F s is the ionosphere-free combination ( f 1 2 L 1 f 2 2 L 2 ) / ( f 1 2 f 2 2 ) of the corresponding carrier phases L 1 and L 2 , ρ r s is the geometric range between the satellite and receiver antennas, c is the speed of light, d t r is the receiver’s clock offset (including the receiver code bias and delay), d t s is the clock offset of the satellite (including the satellite code bias and delay), T r s is the signal path delay, λ I F is the ionosphere-free combination of carrier phase wavelengths λ L 1 and λ L 2 of signals L 1 and L 2 , A I F is the nonperiodic ambiguity, and ε P and ε L are the noises in the measurements.
The RTKLIB software (version 2.4.3) developed by Takasu and Yasuda [37] is widely used in GNSS data processing. In this paper, RTKLIB software was used to solve the PPP Kinematic and the solution strategy is shown in Table 1.

3. Results

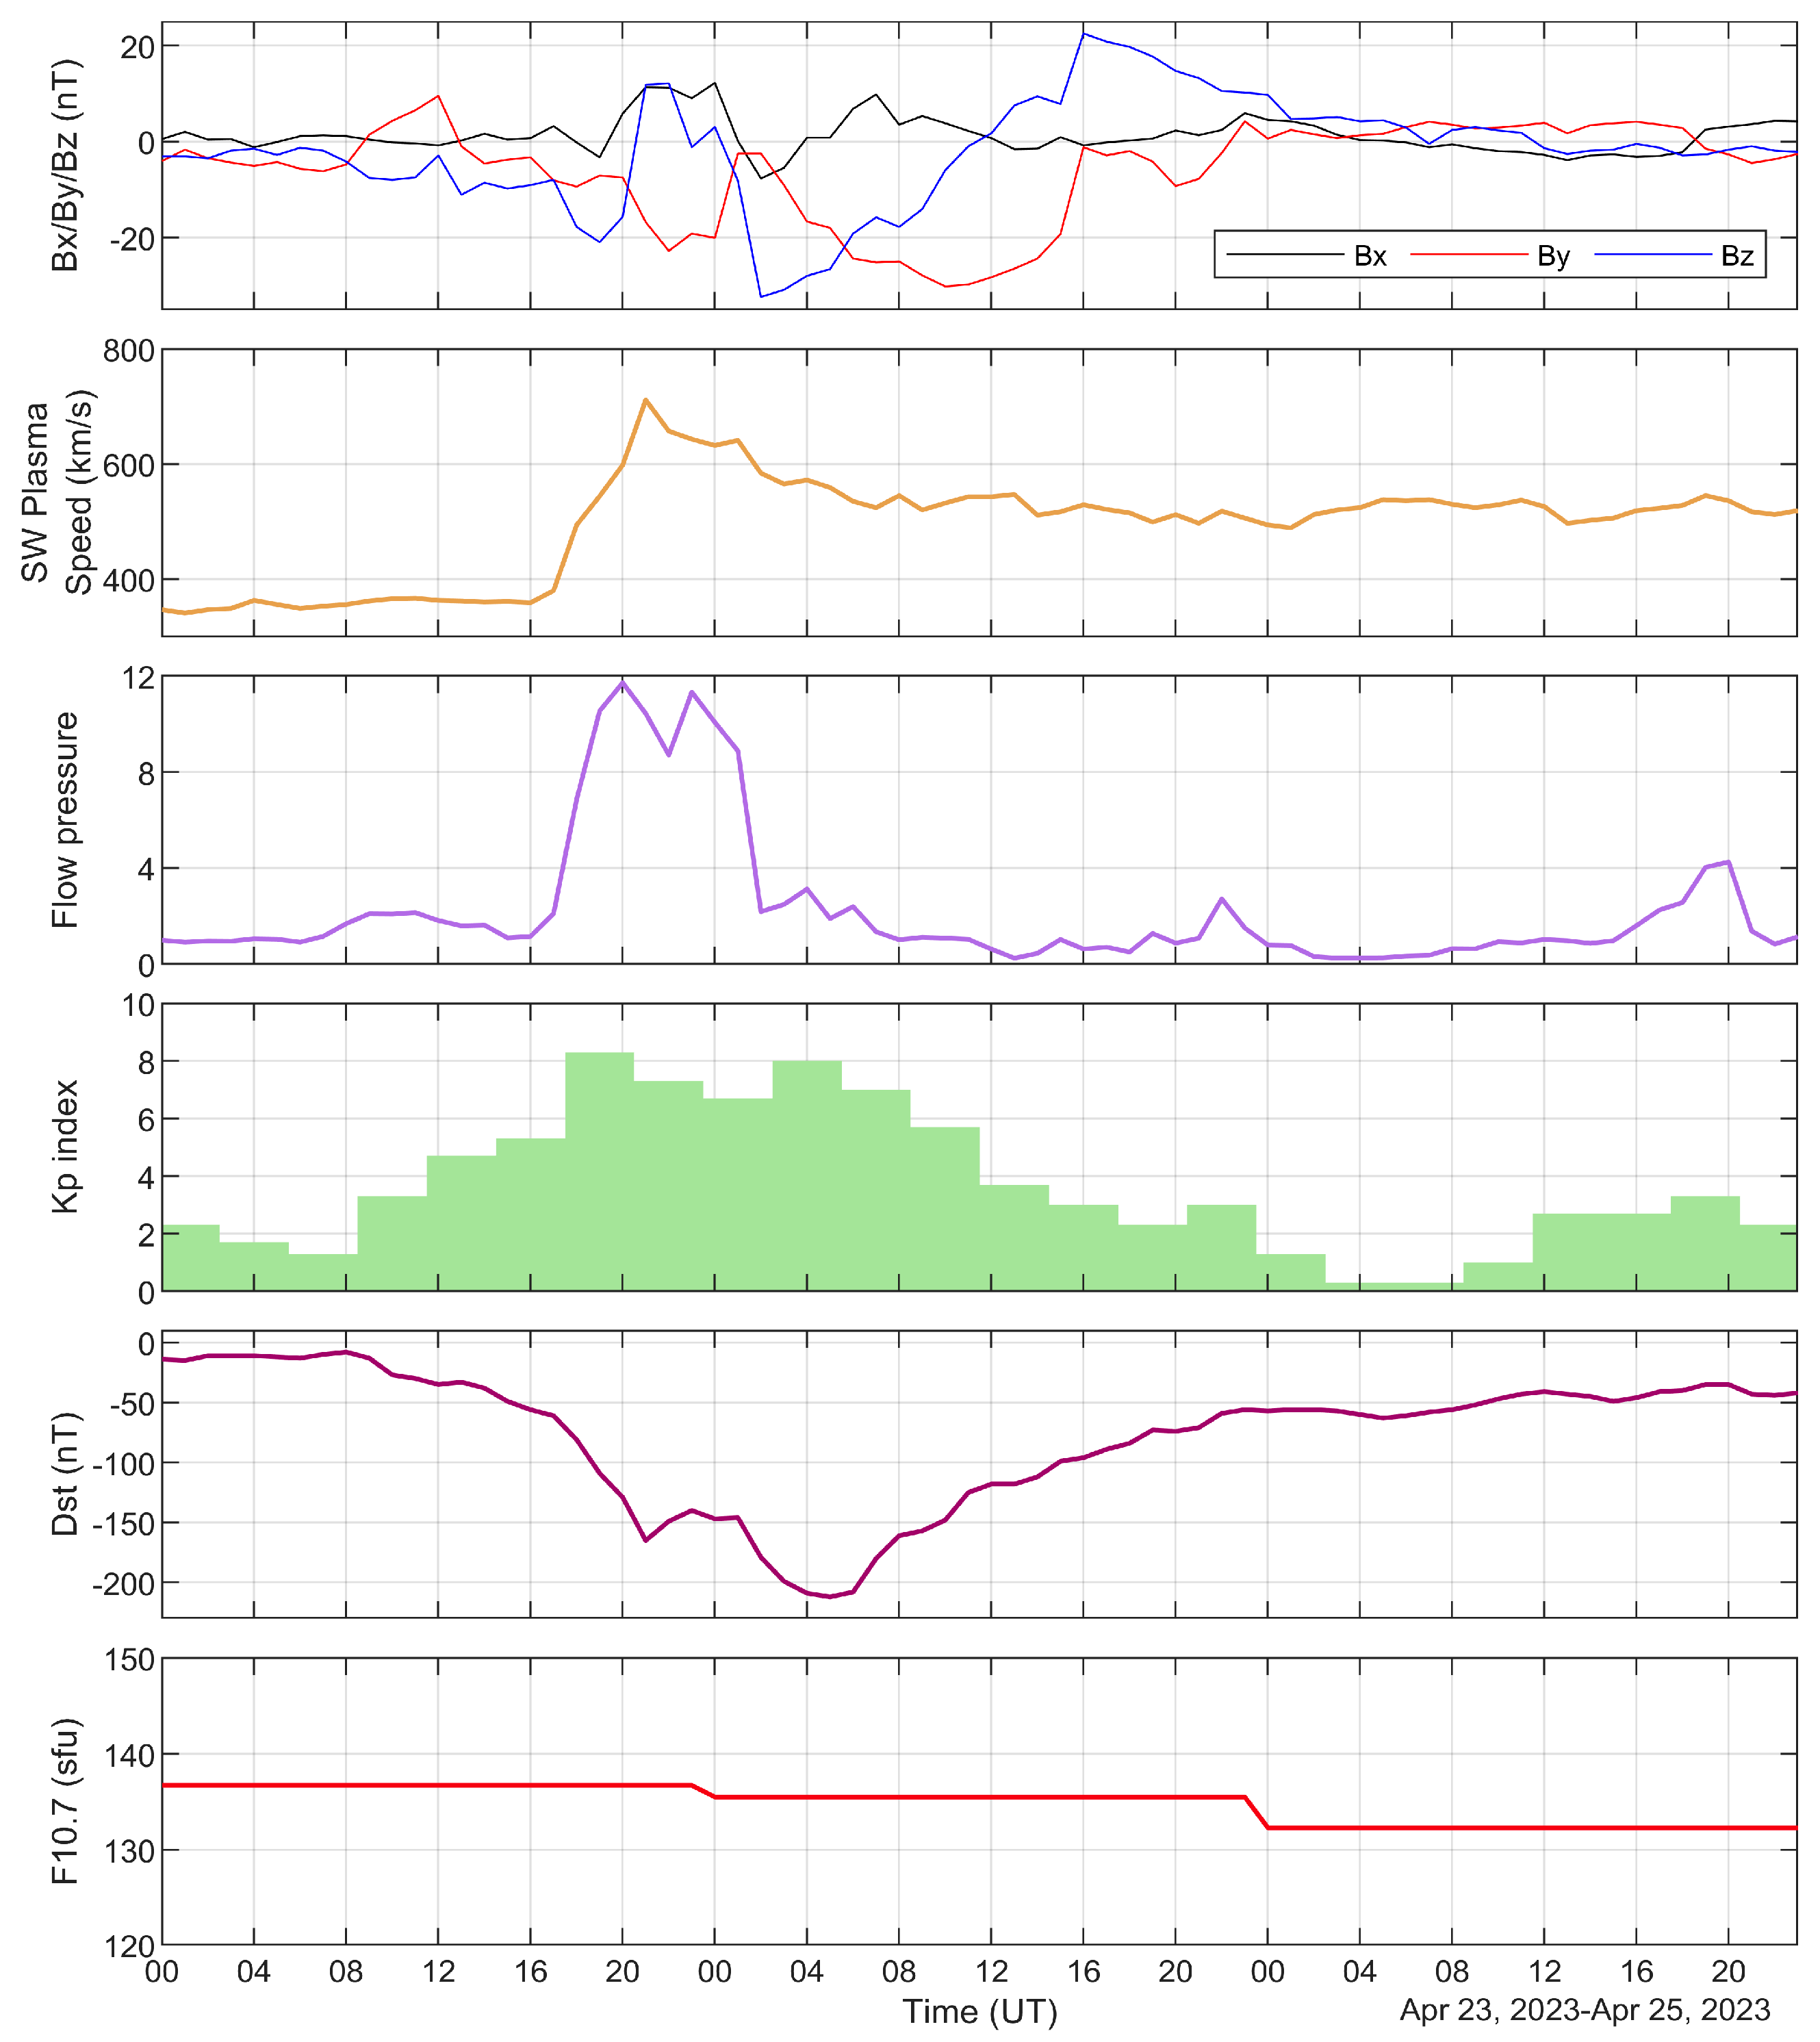
3.1. Analysis of Space Weather Disturbances

Figure 2 shows the variations of the IMF Bx/By/Bz components, solar wind plasma speed, plasma flow pressure, Kp index, Dst index, and F10.7 index for 23–25 April 2023. As far as the IMF was concerned, the Bx, By, and Bz components were in a calm state with no large fluctuations until 08:00 UT on 23 April. The solar wind plasma speed was below 400 km/s, the plasma flow pressure was also at a low pressure, and the values of the Kp index and the Dst index showed no geomagnetic disturbance. The plasma flow pressure showed a small increase at 08:00 UT on 23 April, except for the solar wind plasma speed and IMF Bx component, which did not change significantly. The IMF By component gradually increased from −4.2 nT to 9.5 nT. The IMF Bz component turned southward, but not by much. The Kp index gradually increased and exceeded four at 12:00 UT, and the Dst index also showed a decreasing trend, falling to −35 nT at 12:00 UT.
Unlike a case of typical geomagnetic storms [6], there was no apparent storm surge commencement (SSC) in this geomagnetic storm and the geomagnetic storm process appeared to be a two-step process. From 12:00 to 16:00 UT, the Dst index continued to fall, the IMF By component decreased from 9.5 nT to −3.3 nT, and the Kp index increased to 5.3, indicating a small geomagnetic storm. At this time, the solar wind plasma speed and plasma flow pressure still did not show any significant variation. Starting from 16:00 UT, the solar wind plasma speed started to increase rapidly from 359 km/s to 711 km/s at 21:00 UT, the plasma flow pressure likewise started to increase from 1.15 to 11.72 at 20:00 UT, and the IMF Bx component also showed an increasing trend. The IMF Bz component turned southward from 17:00 UT, reaching −21 nT at 19:00 UT, and then quickly turned northward, reaching 11.8 nT at 21:00 nT. During this process, influenced by IMF and plasma, the Kp index increased to 8.3, indicating a severe geomagnetic storm, and the Dst index decreased from −56 nT to −165 nT. The IMF Bx component showed an increasing–decreasing–increasing trend, and the IMF By showed a fluctuating state of decreasing–increasing. The IMF Bz component quickly turned southward from 21:00 UT and decreased to −32.4 nT at 02:00 UT on 24 April, then turned northward and slowly increased to 22.5 nT at 16:00 UT before finally returning to a calm state. The solar wind plasma speed slowly decreased to about 500 km/s at 21:00 UT on 23 April. The plasma flow pressure first decreased to 8.21 at 22:00 UT on 23 April after reaching its maximum value, and then it increased to 11.33 at 23:00 UT followed by a rapid decrease and then gradually returned to a low-pressure state. After the occurrence of the severe geomagnetic storm, the Kp index decreased from 8.3 to 6.7, then increased to 8, and finally slowly decreased to a calm state. The Dst index did not continue to decrease after −165 nT. It increased to −146 nT at 01:00 UT on 24 April, decreased to −212 nT at 05:00 UT, and subsequently entered the recovery phase of the geomagnetic storm, returning to a state of geomagnetic calm. Due to this being a rising year of the 25th solar activity cycle, the solar activity parameter F10.7 has been maintained at a level of about 135 sfu during this period.

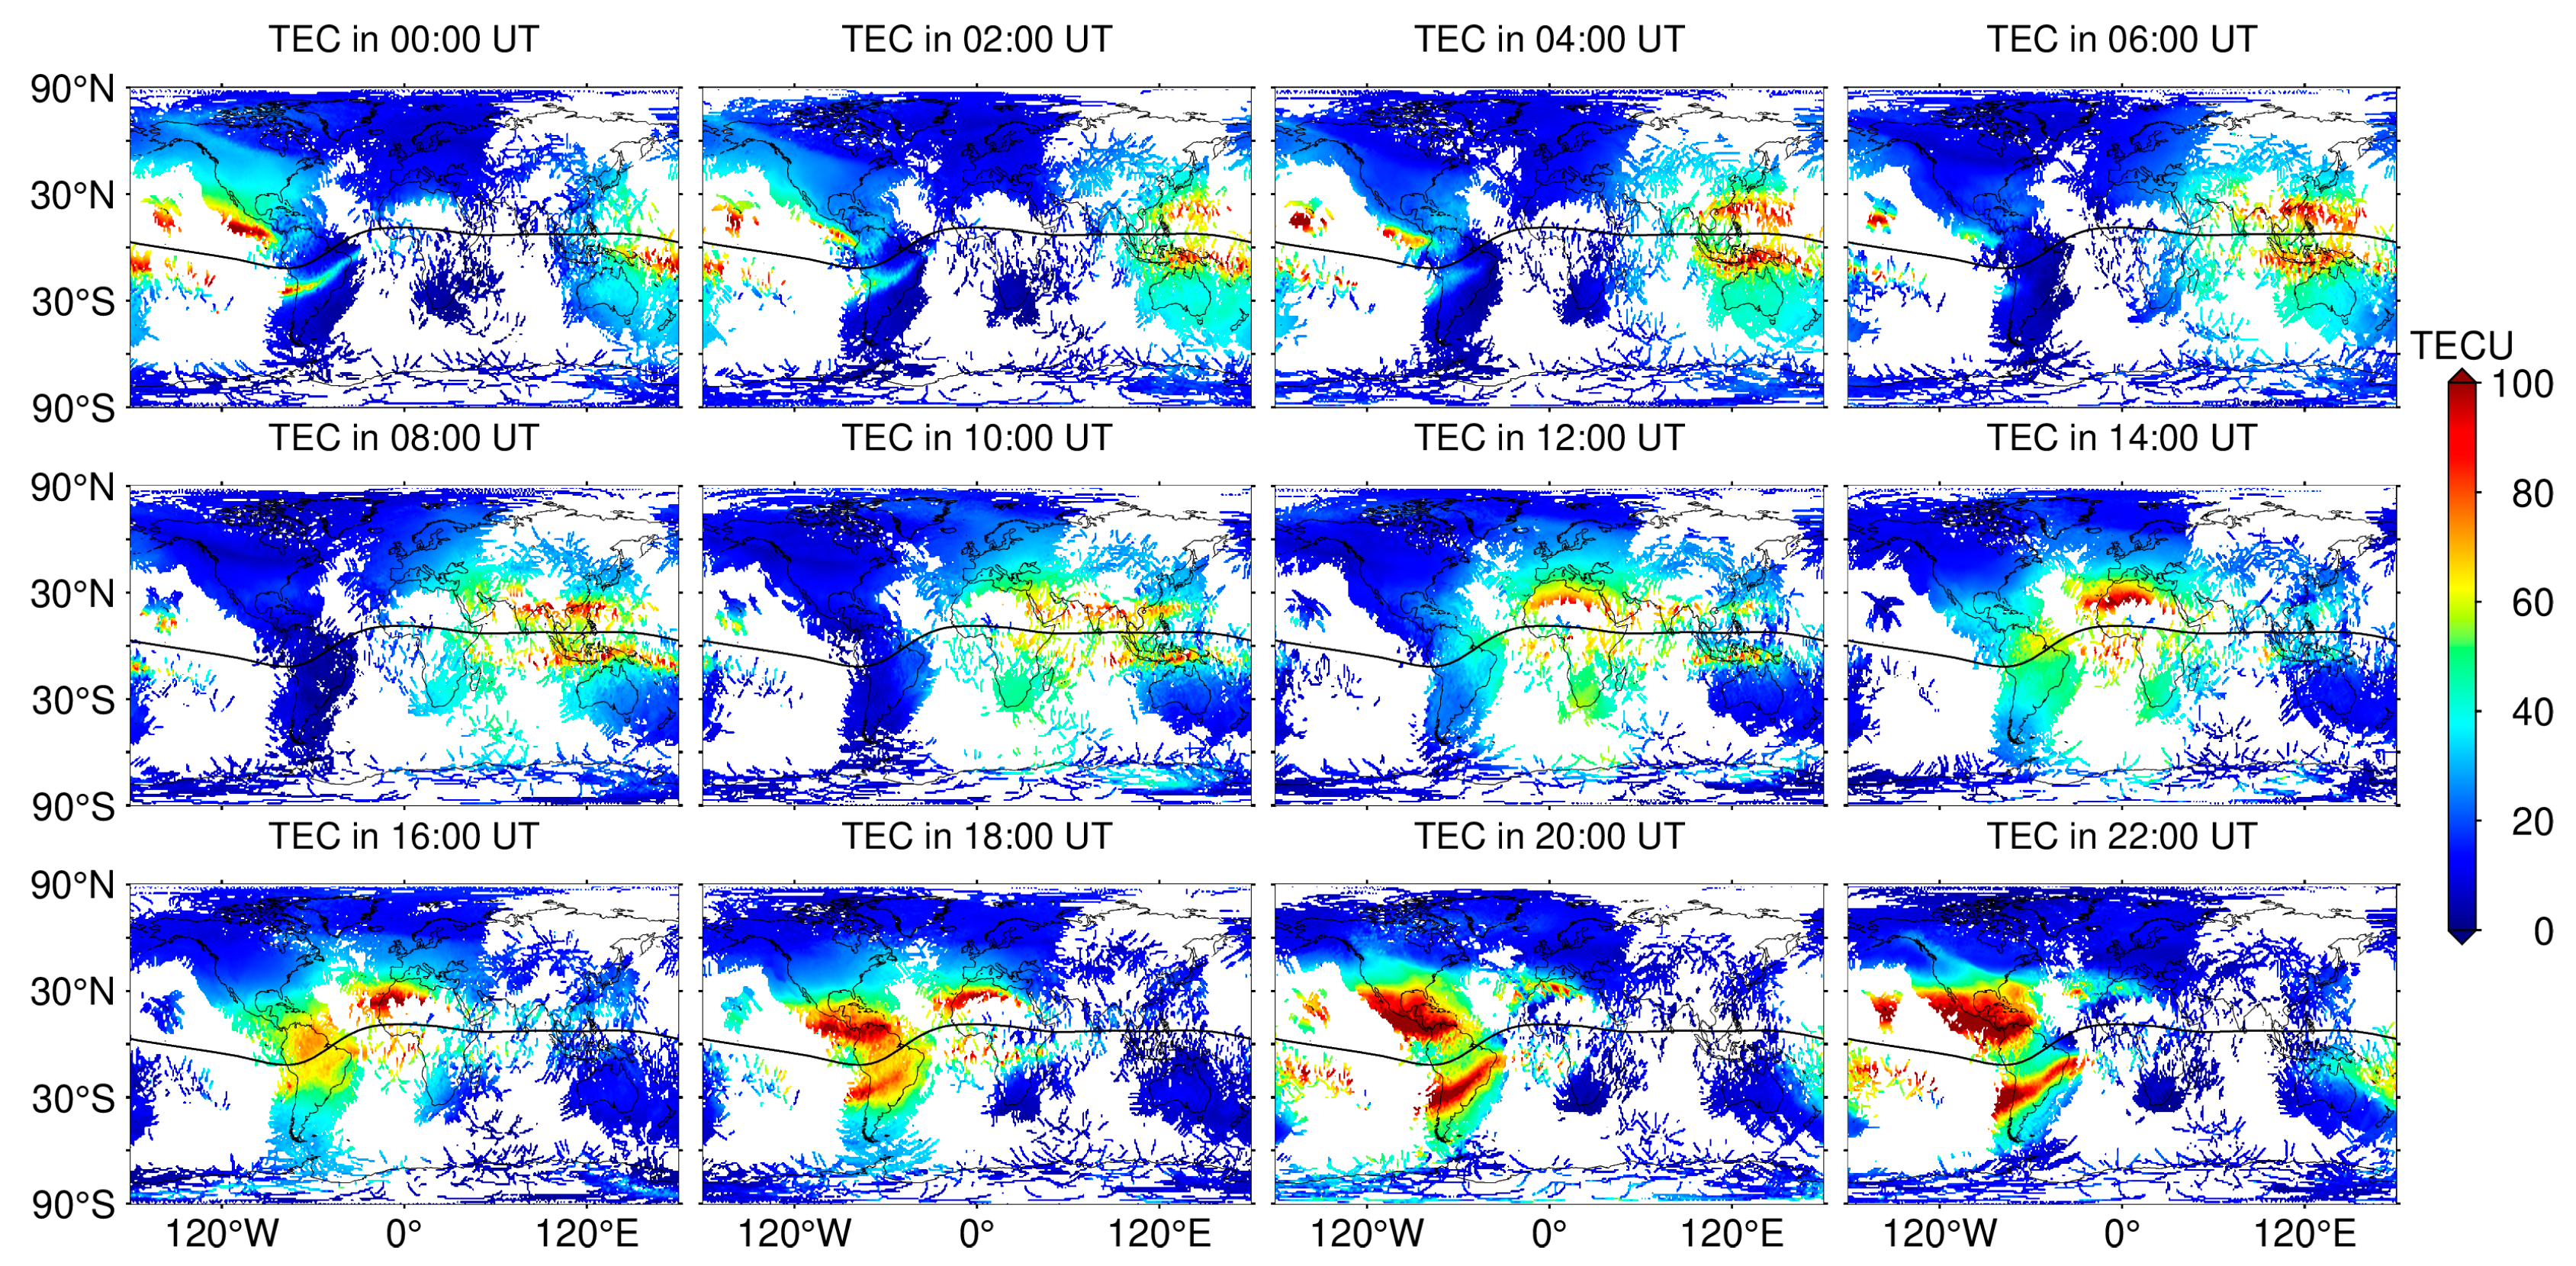
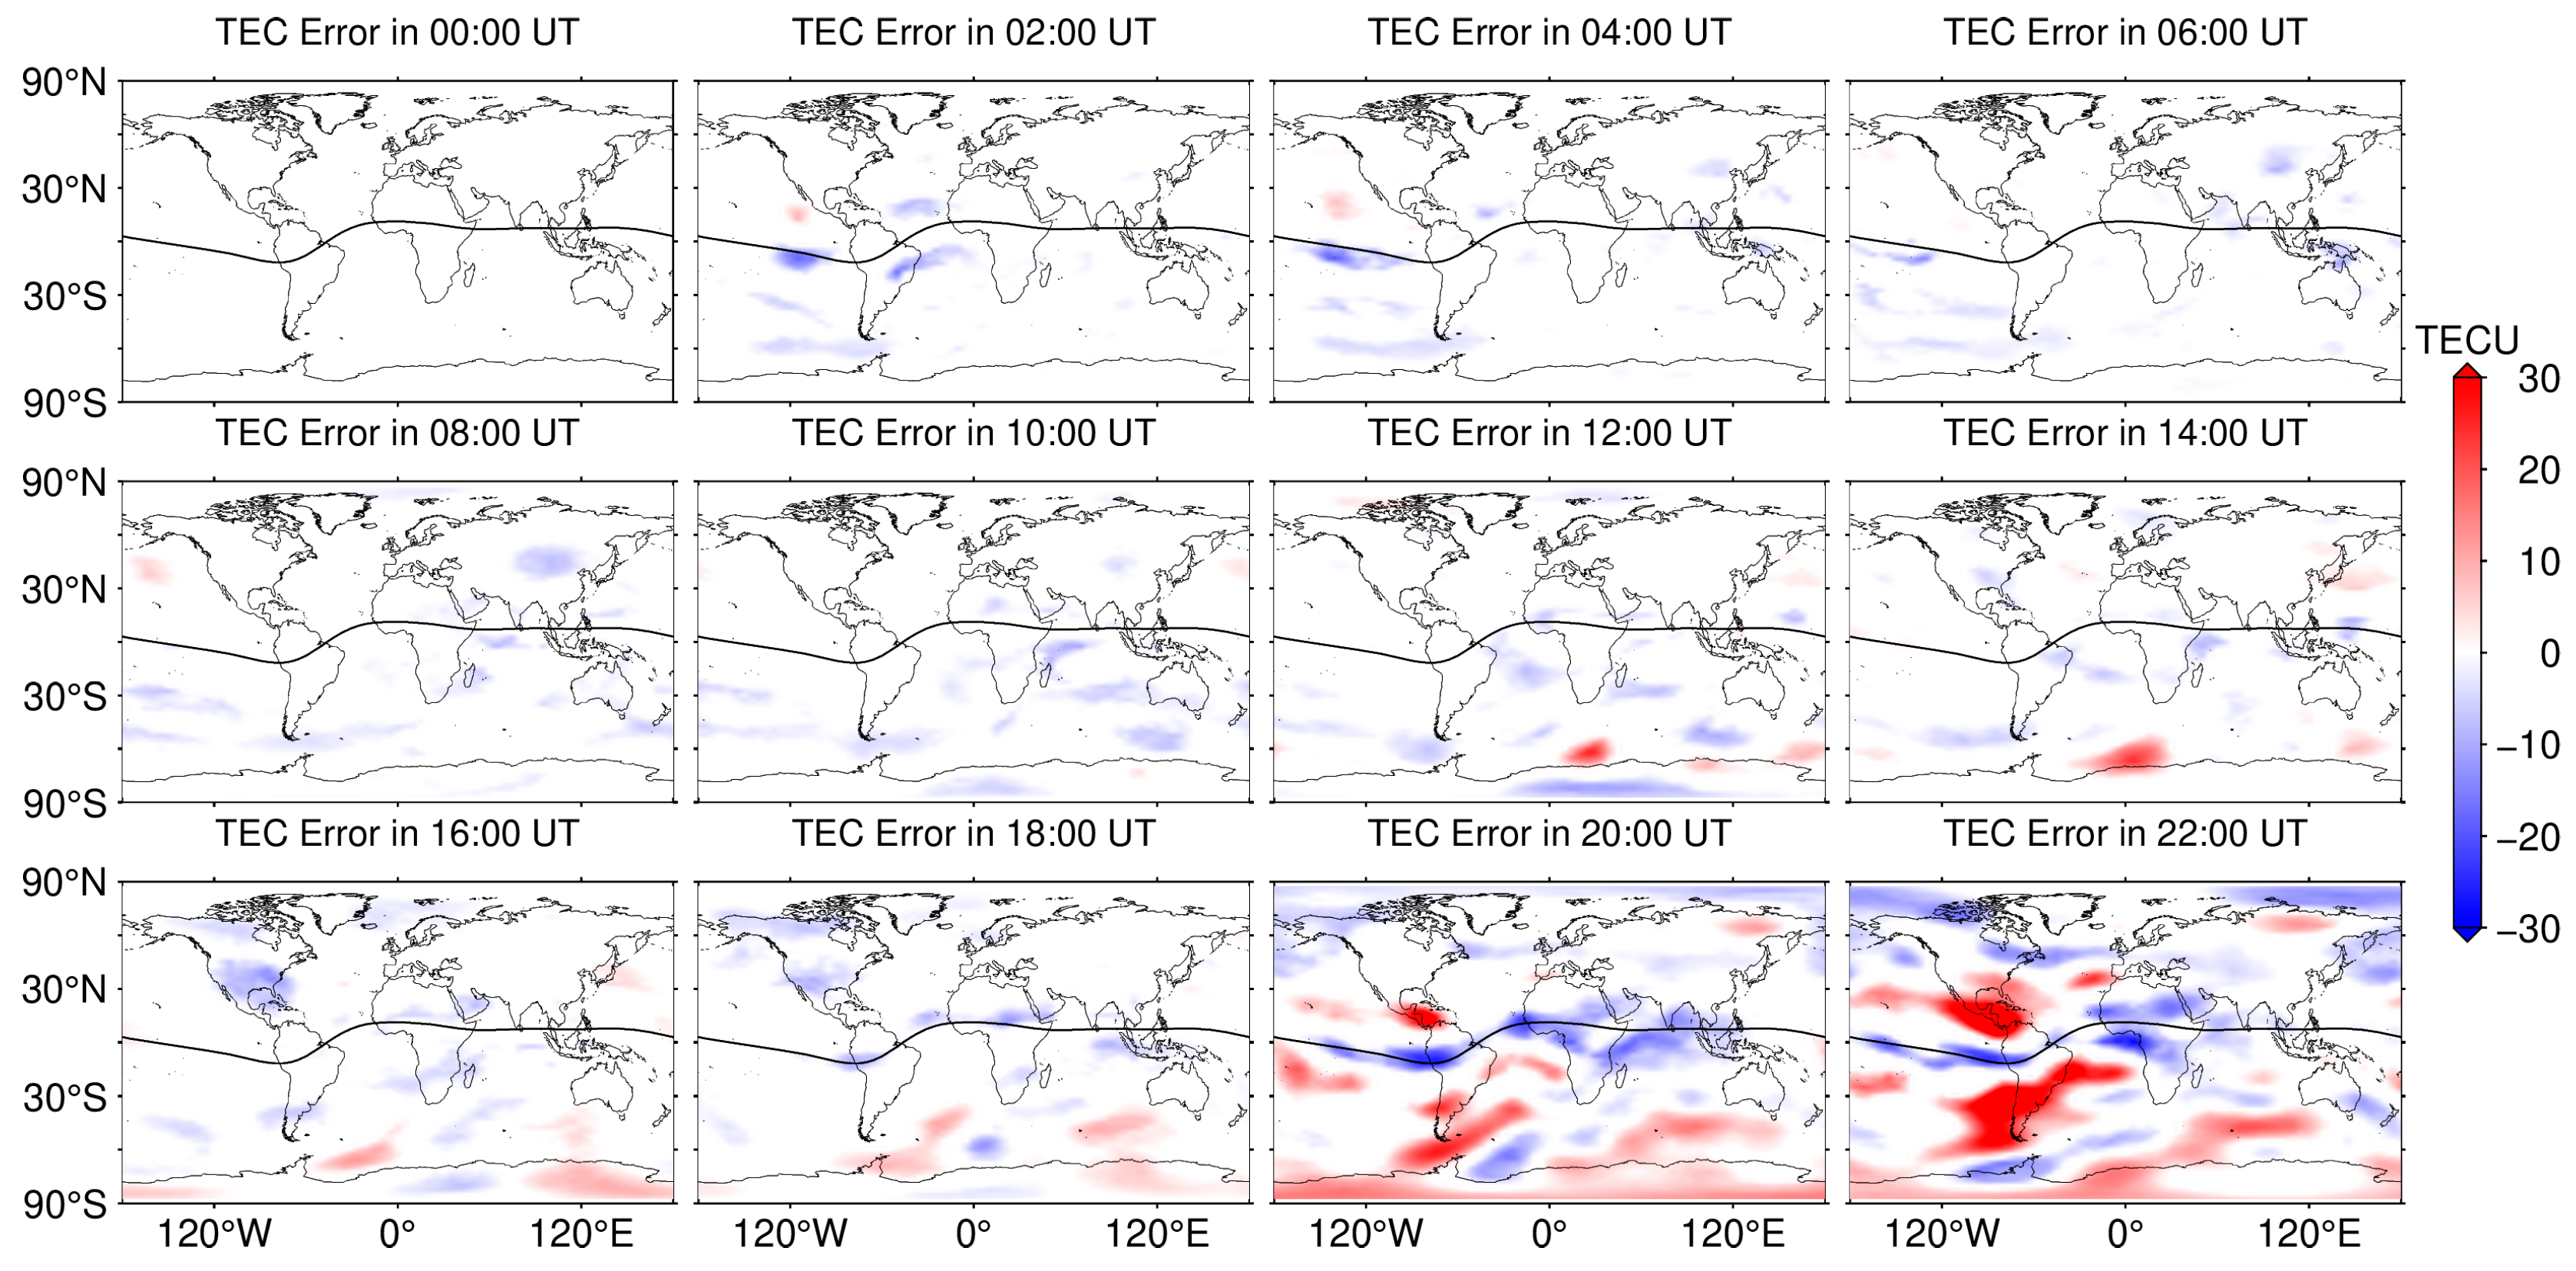
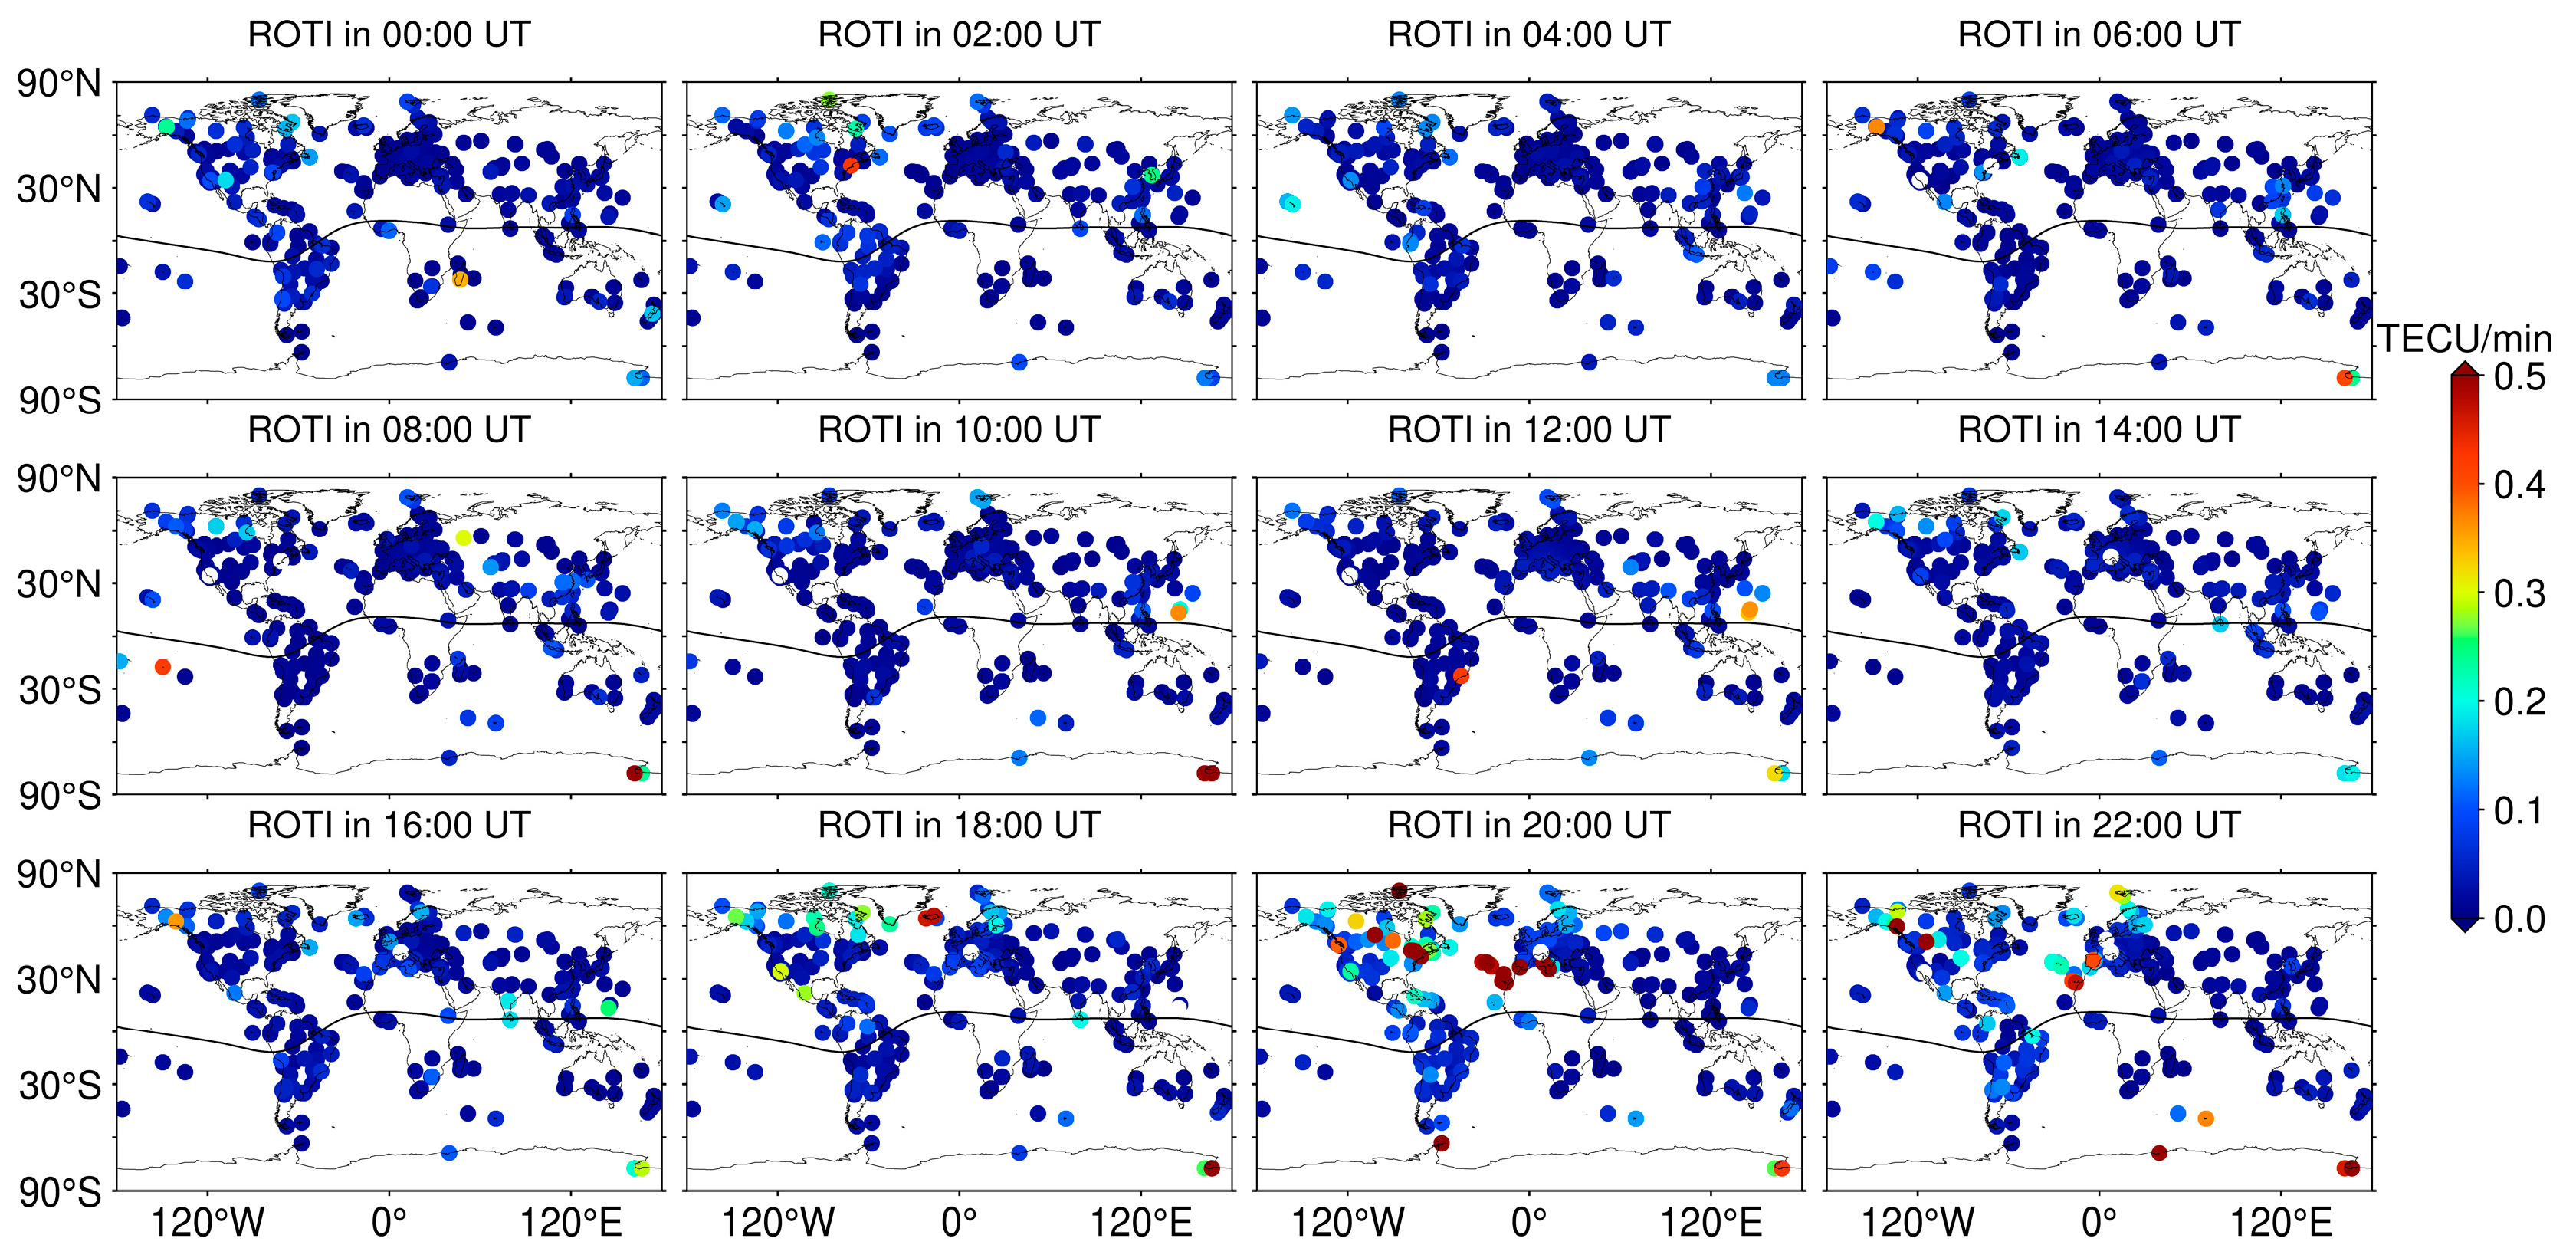
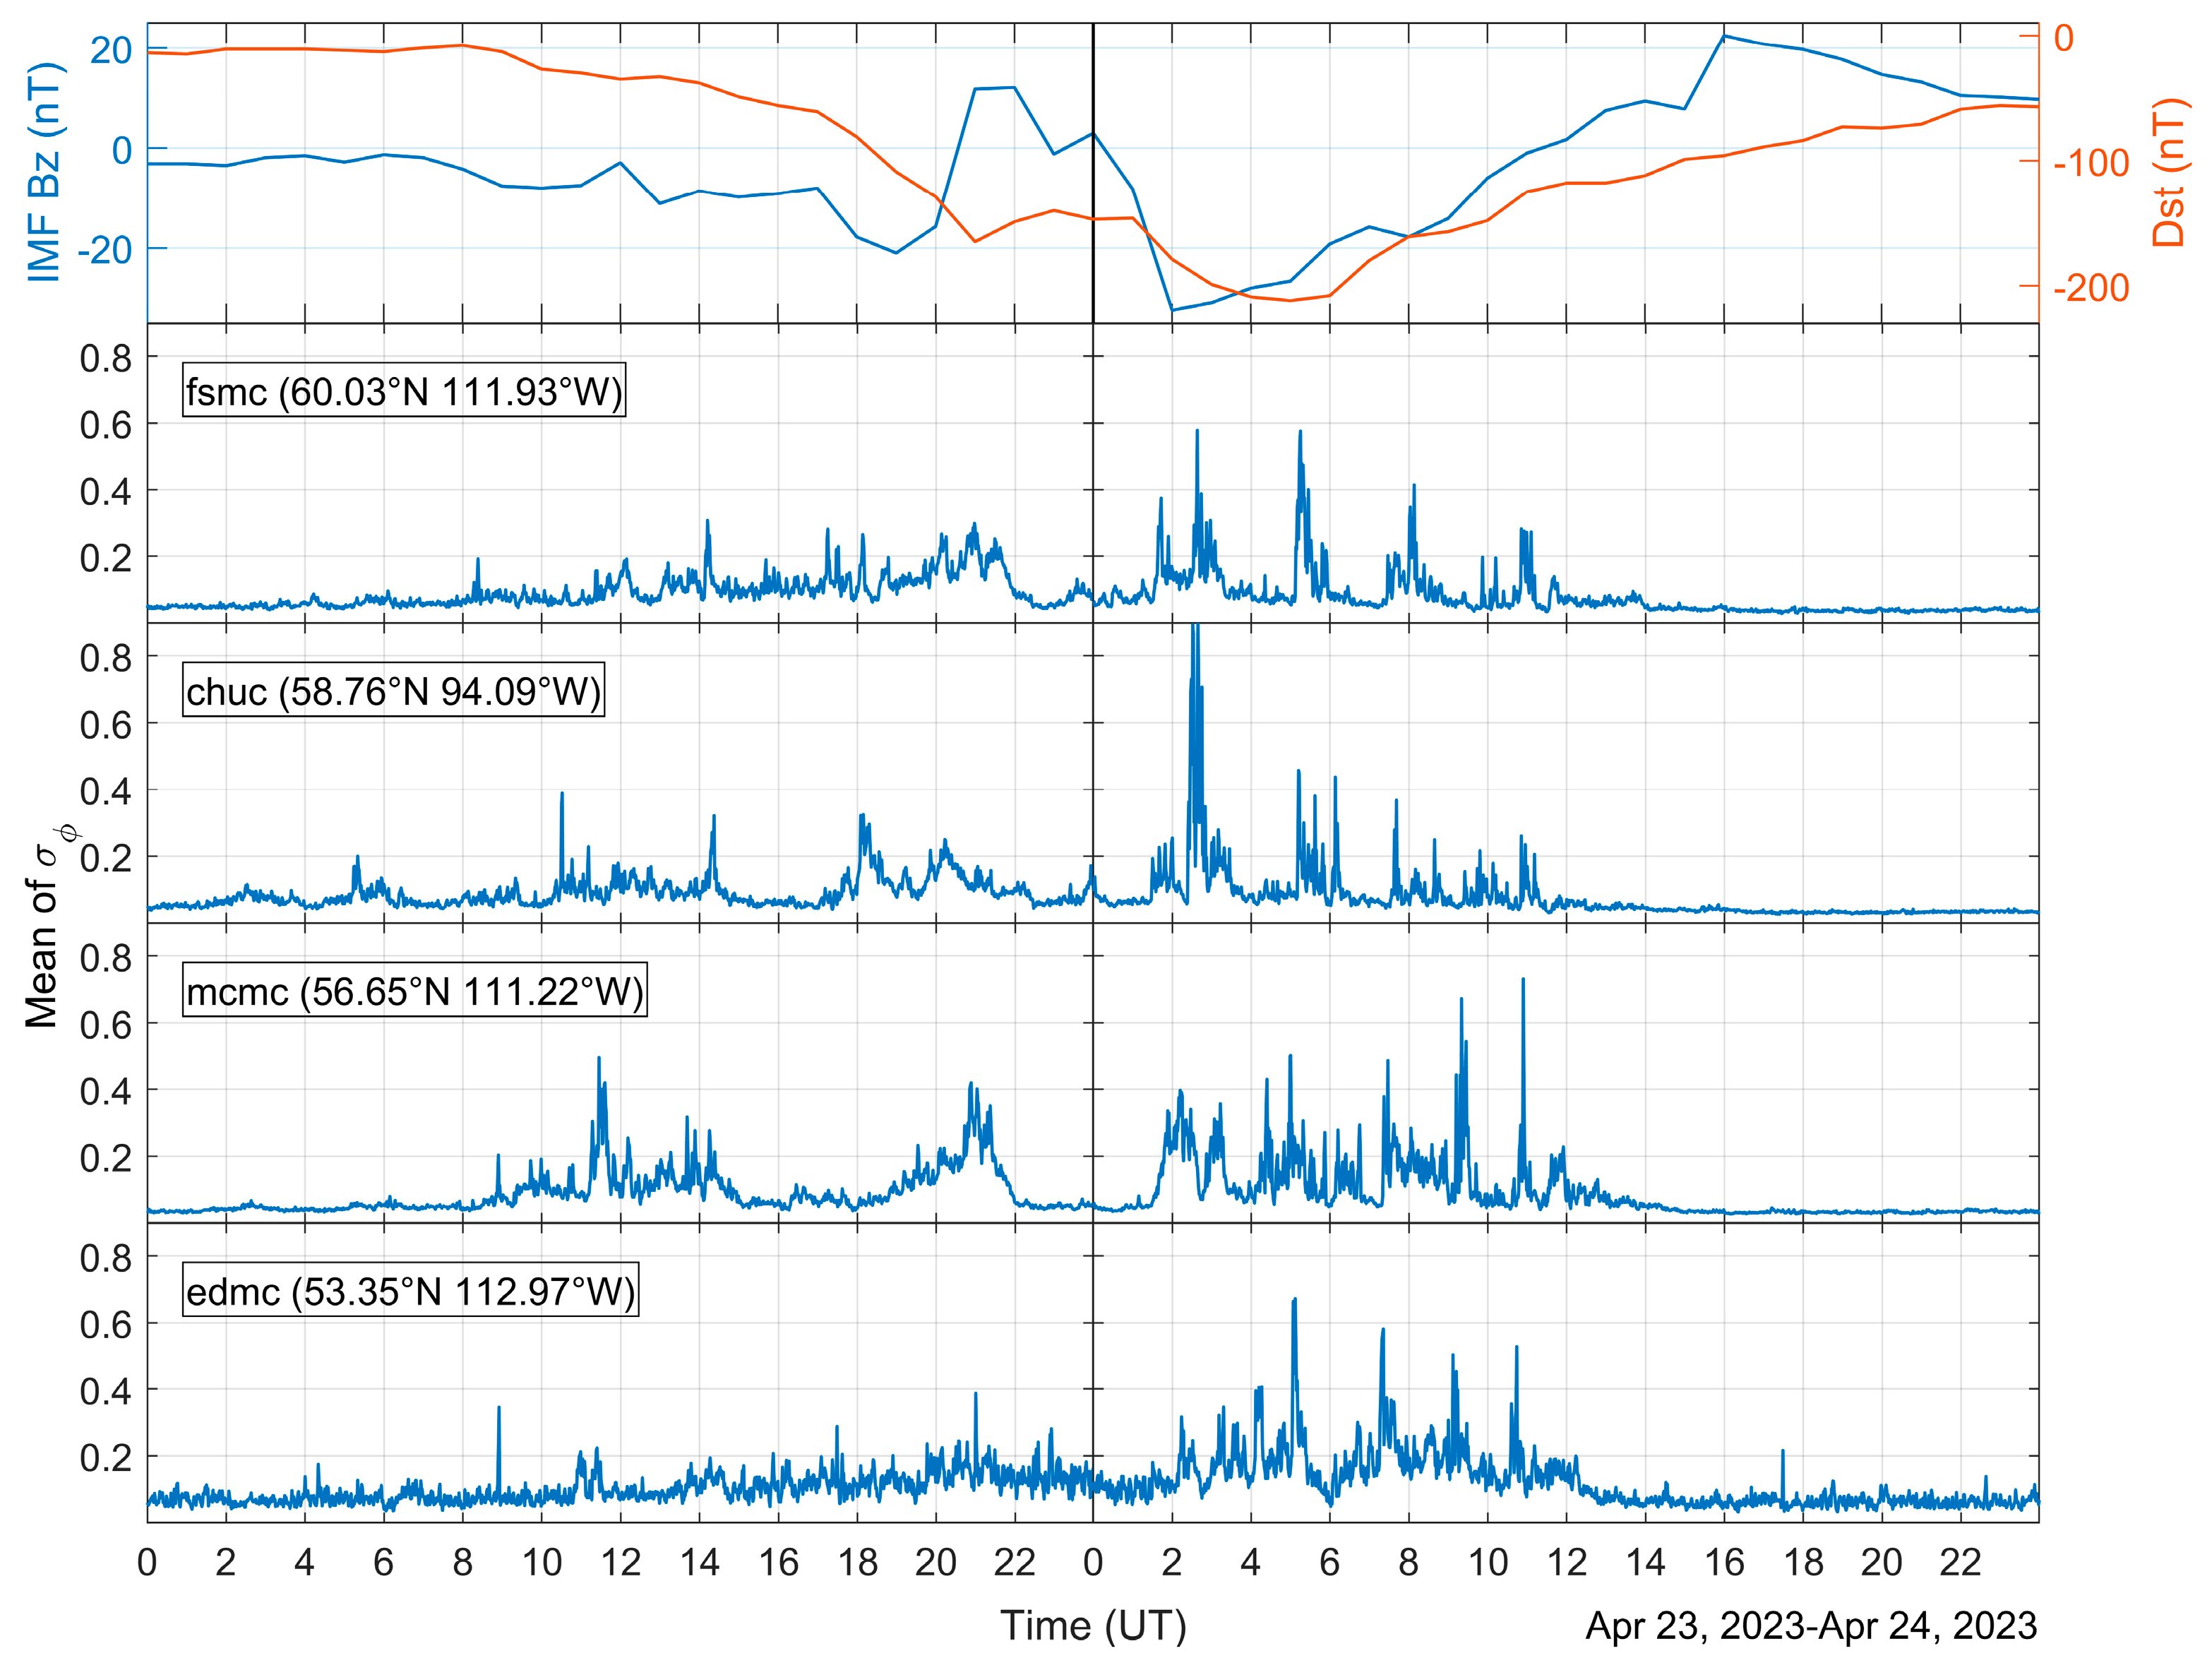
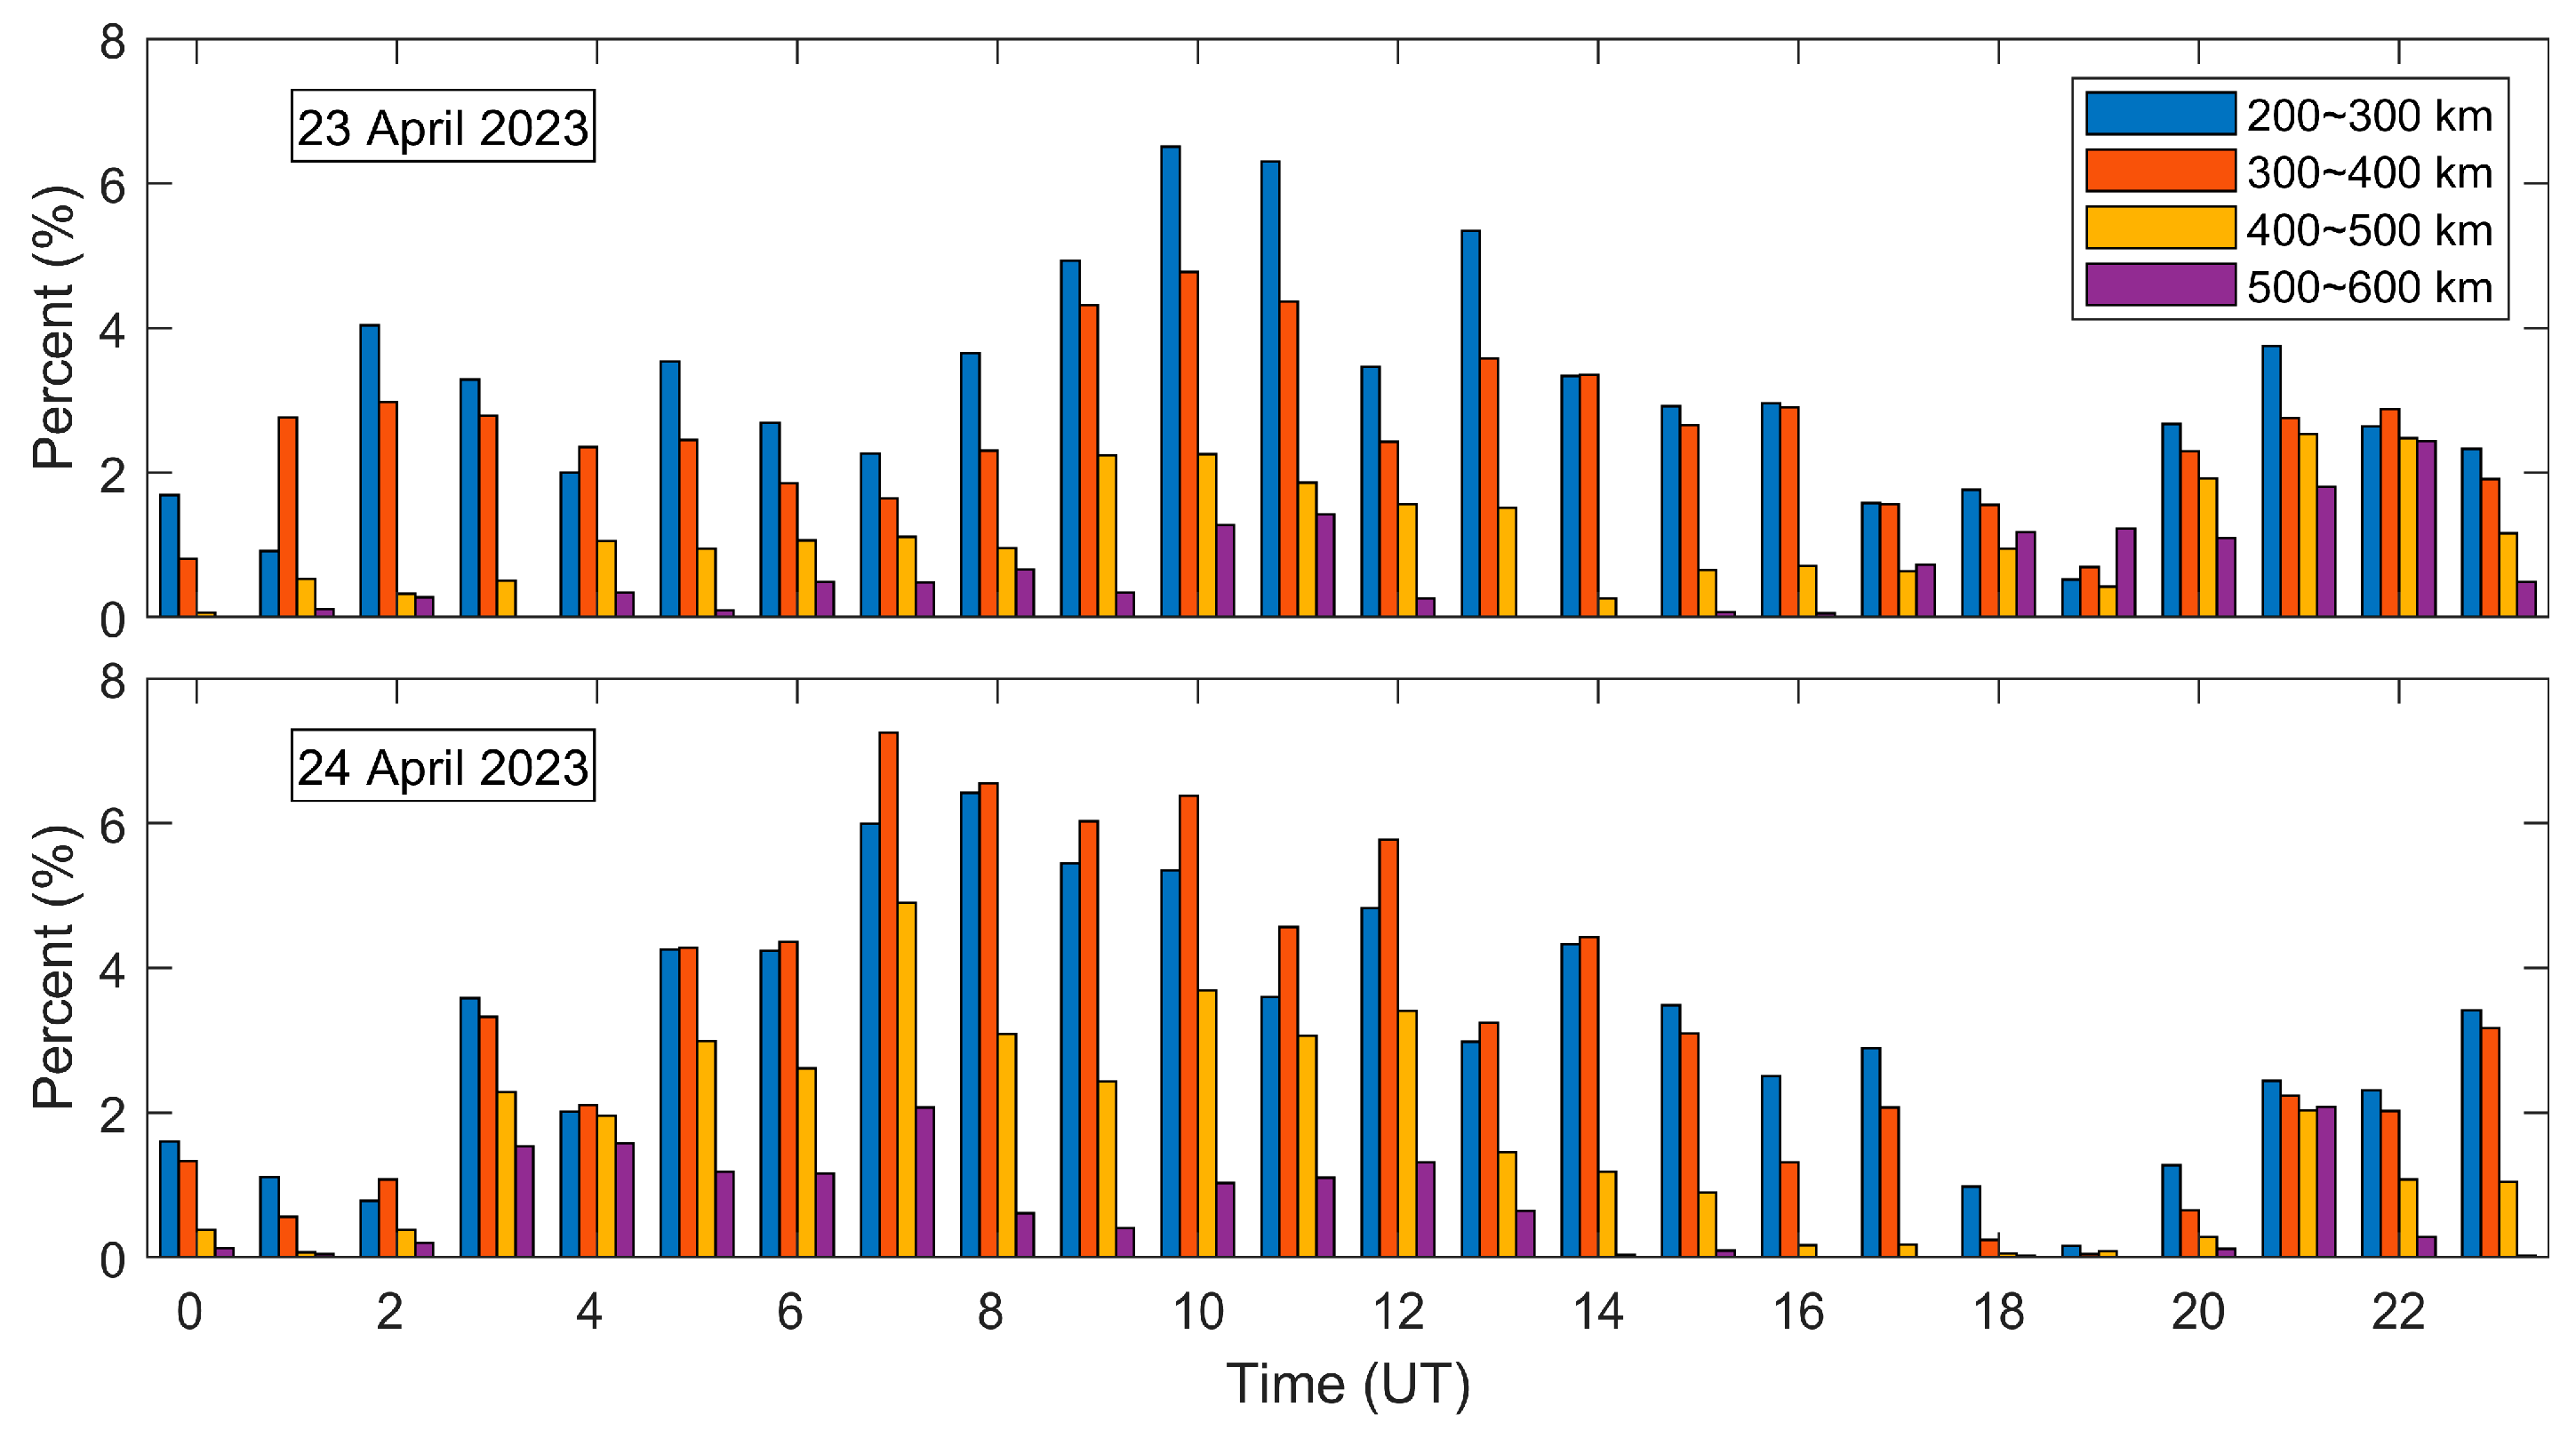
3.2. Ionospheric Disturbances

In order to investigate the impact of this geomagnetic storm on the global ionosphere, we analyzed the TEC response to the geomagnetic storm using ionospheric TEC data provided by the GNSS receiver network from the Madrigal database. The time resolution of this product is 5 min, from which we calculated the hours-averaged ionospheric TEC values over the period of 0 to 23 h. The global distribution of ionospheric TEC hours-averaged values for 23 and 24 April 2023 is given in Figure 3 and Figure 4, respectively. In order to visualize the effect of geomagnetic storms on the ionospheric TEC, we processed the global ionospheric maps of calm days based on the sliding interquartile range method to generate the global ionospheric TEC anomaly distribution, as shown in Figure 5 and Figure 6. The calculation method of the sliding interquartile range is from Feng et al. [38].
Combining Figure 3 and Figure 5, it can be found that on 23 April, the ionospheric TEC was in a relatively normal state before 20:00 UT on 23 April, i.e., the equatorial region had a significant double crest phenomenon, and there was little variation in the TEC in other regions. Starting from 20:00 UT, the ionospheric anomalies began to appear, as shown in Figure 5, which were manifested by the weakening of the TEC near the geomagnetic equator and the obvious enhancement of the TEC in the EIA double crest and the high latitude region of the Antarctic, where the TEC value of the EIA exceeded 100 TECU. The global ionospheric TEC anomaly expanded from 20:00 to 22:00 UT. At 22:00 UT, the intensity of the EIA reached the maximum value of the day, exceeding that of a quiet day by about 30 TECU, and the range of the EIA gradually spread to the poles. The variations of the EIA on 23 April show a highly temporal consistency with the first step of the geomagnetic storm process, indicating that this geomagnetic storm also affected the equatorial low-latitude region.
The global ionospheric TEC distribution and anomalies for 24 April are shown in Figure 4 and Figure 6, further illustrating the effect of geomagnetic storms on the ionosphere and the second step in the process of geomagnetic storms. Starting from 22:00 UT on 23 April, the EIA crest and latitudinal range gradually decreased, the positive anomaly of the northern peak of the EIA disappeared, and the positive anomaly of the southern crest became weaker until 02:00 UT on 24 April. According to the status of the geomagnetic activity in Figure 1, this was the beginning time of the second step of the change process of the geomagnetic storm. Starting from 02:00 UT on 24 April, the crest and range of the EIA began to gradually increase again, and the double crest gradually changed to a single crest on the south side of the equator. The single crest of the EIA was close to the maximum at 04:00 UT, and this continued until 06:00 UT. At 08:00 UT, only a small range of positive anomalies of the south crest of EIA remained. Starting from 06:00 UT, the middle and high latitude regions of the longitude sector in which the EIA was located exhibited negative anomalies in the TEC, which continued until 22:00 UT. A phenomenon of weakening TEC intensity occurs mainly during the recovery phase of geomagnetic storms.
Above, we found the response of the ionospheric TEC to geomagnetic storms in different regions. Then, we calculated the ROTI for each station using observations distributed in more than 400 GNSS stations around the world, as shown in Figure 7 and Figure 8. As can be seen in Figure 7, the number of GNSS stations with an increased ROTI gradually increased from 18:00 UT on 23 April, and the ROTI of all GNSS stations in the northern part of North America and the northern part of Europe increased to more than 0.2 TECU/min at 18:00 UT. From 18:00 UT to 20:00 UT, the number of GNSS stations affected by geomagnetic storms increased further, and the geographic latitude of GNSS stations responding to geomagnetic storms gradually decreased. At 20:00 UT, the ROTI increased to over 0.5 TECU/min at some GNSS stations in central North America and northern Africa. At 22:00 UT, GNSS stations with a ROTI exceeding 0.3 TECU/min were mainly located in central North America, northern Africa, and the polar regions. However, unlike at 20:00 UT, some GNSS stations had an increased ROTI near the geomagnetic equator in South America. On 24 April, the ROTI variations of the GNSS stations shown in Figure 8 continued to be affected by geomagnetic storms, but not as significantly as on 23 April. Starting from 00:00 UT to 06:00 UT, the ROTIs of the perturbed GNSS stations were higher than the 0.2 TECU/min, and they were mostly located in the central and northern parts of North America. After 12:00 UT, the ROTI of the global GNSS stations tended to calm down.
Ionospheric irregularities in the polar regions make ionospheric amplitude scintillations in the polar regions weak [39]. Therefore, we selected ionospheric phase scintillation index ( σ ϕ ) data from four GNSS stations in CHAIN to analyze the effect of geomagnetic storms on the ionosphere in the near high-latitude region. Figure 9 shows the sequence of mean phase flashes per minute for four high-rate GNSS stations (fsmc, chuc, mcmc, and edmc) on 23 and 24 April 2023, and also gives the IMF Bz and Dst indices for these time periods. As can be seen in Figure 9, there was a small fluctuation in the IMF Bz component from 10:00 UT to 14:00 UT on 23 April, during which all four stations showed different levels of ionospheric scintillation. Among them, the phase scintillation index of the mcmc station showed a peak of more than 0.4 at 11:00 UT. From 18:00 UT to 22:00 UT, the IMF Bz turned northward and the Dst decreased rapidly. The chuc station phase scintillation index showed an extreme value of more than 0.3 at 18:00 UT. An extreme value close to 0.3 and 0.4 was observed at 21:00 UT for the fcmc and mcmc stations, respectively. The edmc station did not have any obvious peaks appear, but the intensity of its fluctuations were higher than that of a quiet time. On 24 April, ionospheric scintillation was observed at the fsmc, chuc, and mcmc stations from 01:00 UT, which is when the second step of the geomagnetic storm started. The phase scintillation index at the mcmc station reached 0.4 at 02:00 UT and it even exceeded 0.8 at the chuc station close to 03:00 UT. During 04:00–06:00 UT, the four GNSS stations again showed various levels of ionospheric scintillations, and this is also the period when Dst reached its minimum. During the recovery phase of the geomagnetic storm, different levels of ionospheric disturbances continued to occur at the four GNSS stations, but there were basically no ionospheric disturbances after 12:00 UT.
To explore the response of the ionospheric F-layer to geomagnetic storms in the low to middle latitude region, we used data from the FORMOSAT-7/COSMIC-2 mission’s podTc2 product to calculate the position of the substar point at which the occultation event occurred. Since the F-layer of the ionosphere is the region with the highest electron density, the variation of parameters in the F-layer ultimately forms the variation of the ionosphere, but due to the presence of other layers of the ionosphere, some irregular structures increase the complexity of the ionosphere, especially the phenomenon of the episodic E-layer. To avoid such anomalies, we selected the S4 data in the L1 band of the GPS satellites from 200 to 600 km (i.e., the F-layer altitude) for analysis, and the results are shown in Figure 10.
Figure 10 gives the percent of occultation points with S4 indices for the greater than 0.3 of all occultation points for different altitudes from 23 April 2023 to 24 April 2023. We mainly consider the variations of S4 under the time period of the occurrence of geomagnetic storms. As can be seen in Figure 11, on 23 April 2023, the number of S4 > 0.3 at different altitudes started to increase from 08:00 UT. The number of S4 > 0.3 at 200–300 km altitude was more than 50% higher at 10:00 UT than in the quiet time (02:00 UT). From 16:00 UT to 22:00 UT, as the Dst index reached the first minima, the number of S4 > 0.3 at all heights also tended to increase, but in the case of 200~400 km heights, the increase was not significant. On the contrary, for heights of 400~600 km, the increase in their number was more than that in the early stage of the geomagnetic storm. During the second phase of the geomagnetic storm on 24 April 2023, the number of S4 > 0.3 at different heights varied with the geomagnetic index. At 21:00 UT, the number of S4 > 0.3 increased again, and in combination with Figure 2, the increase in the number may be due to a sudden increase in the flow pressure index.

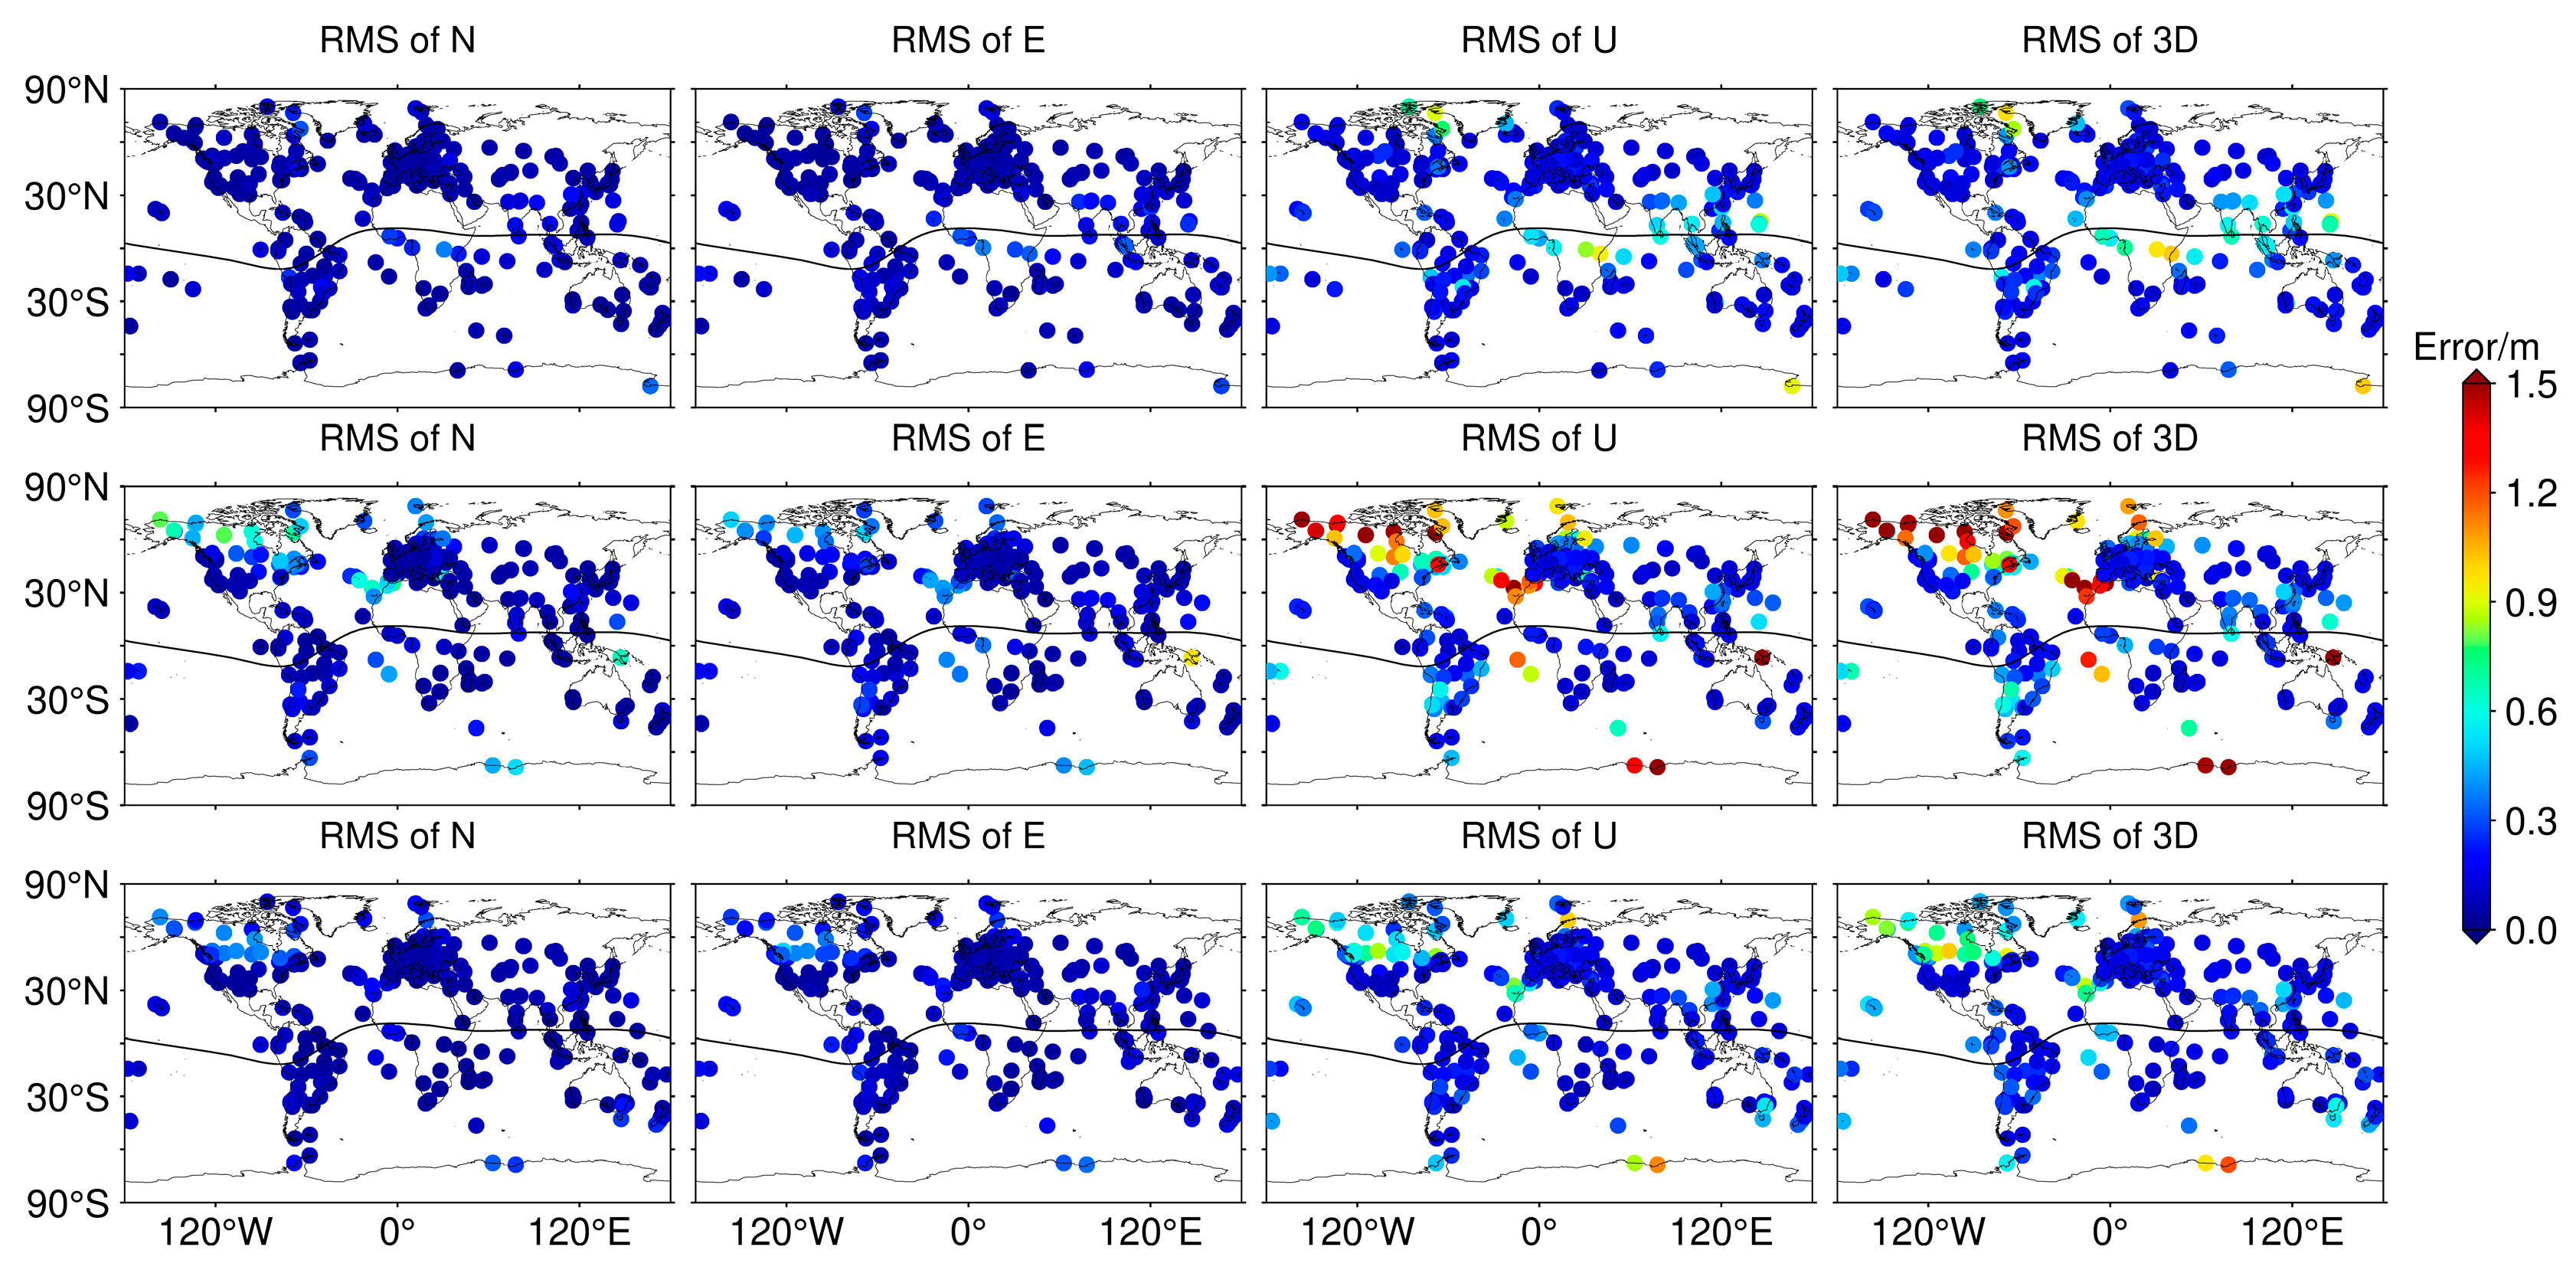
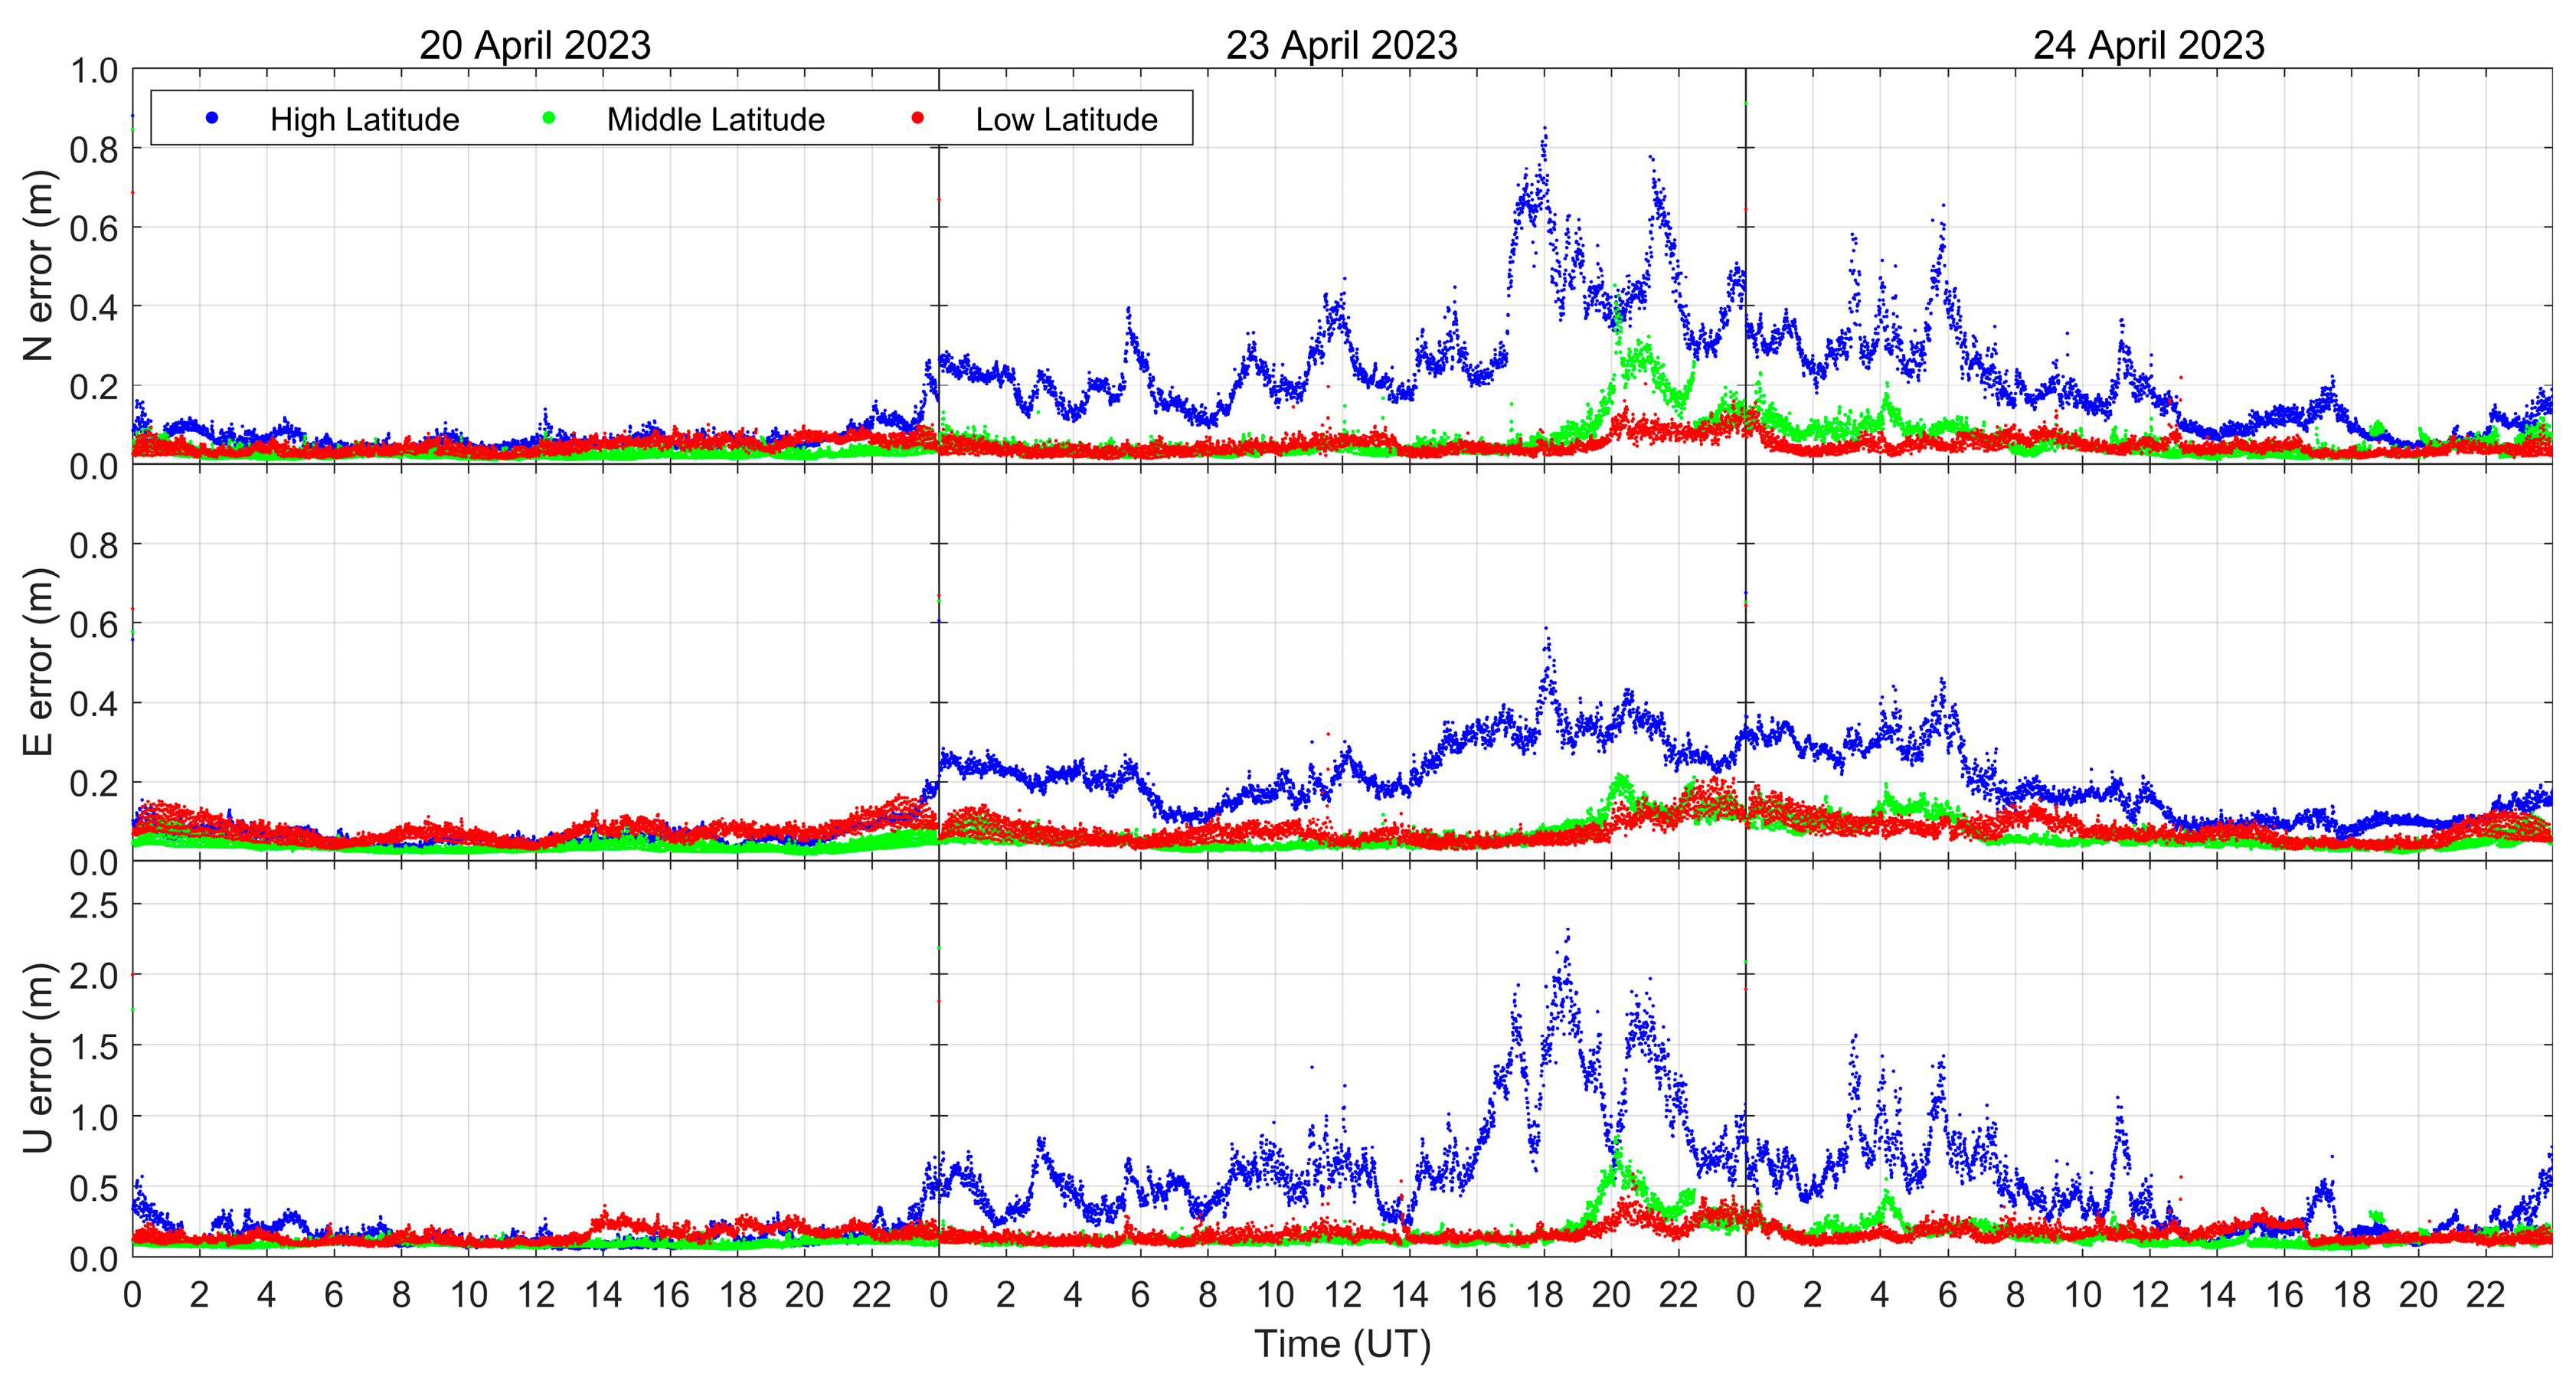
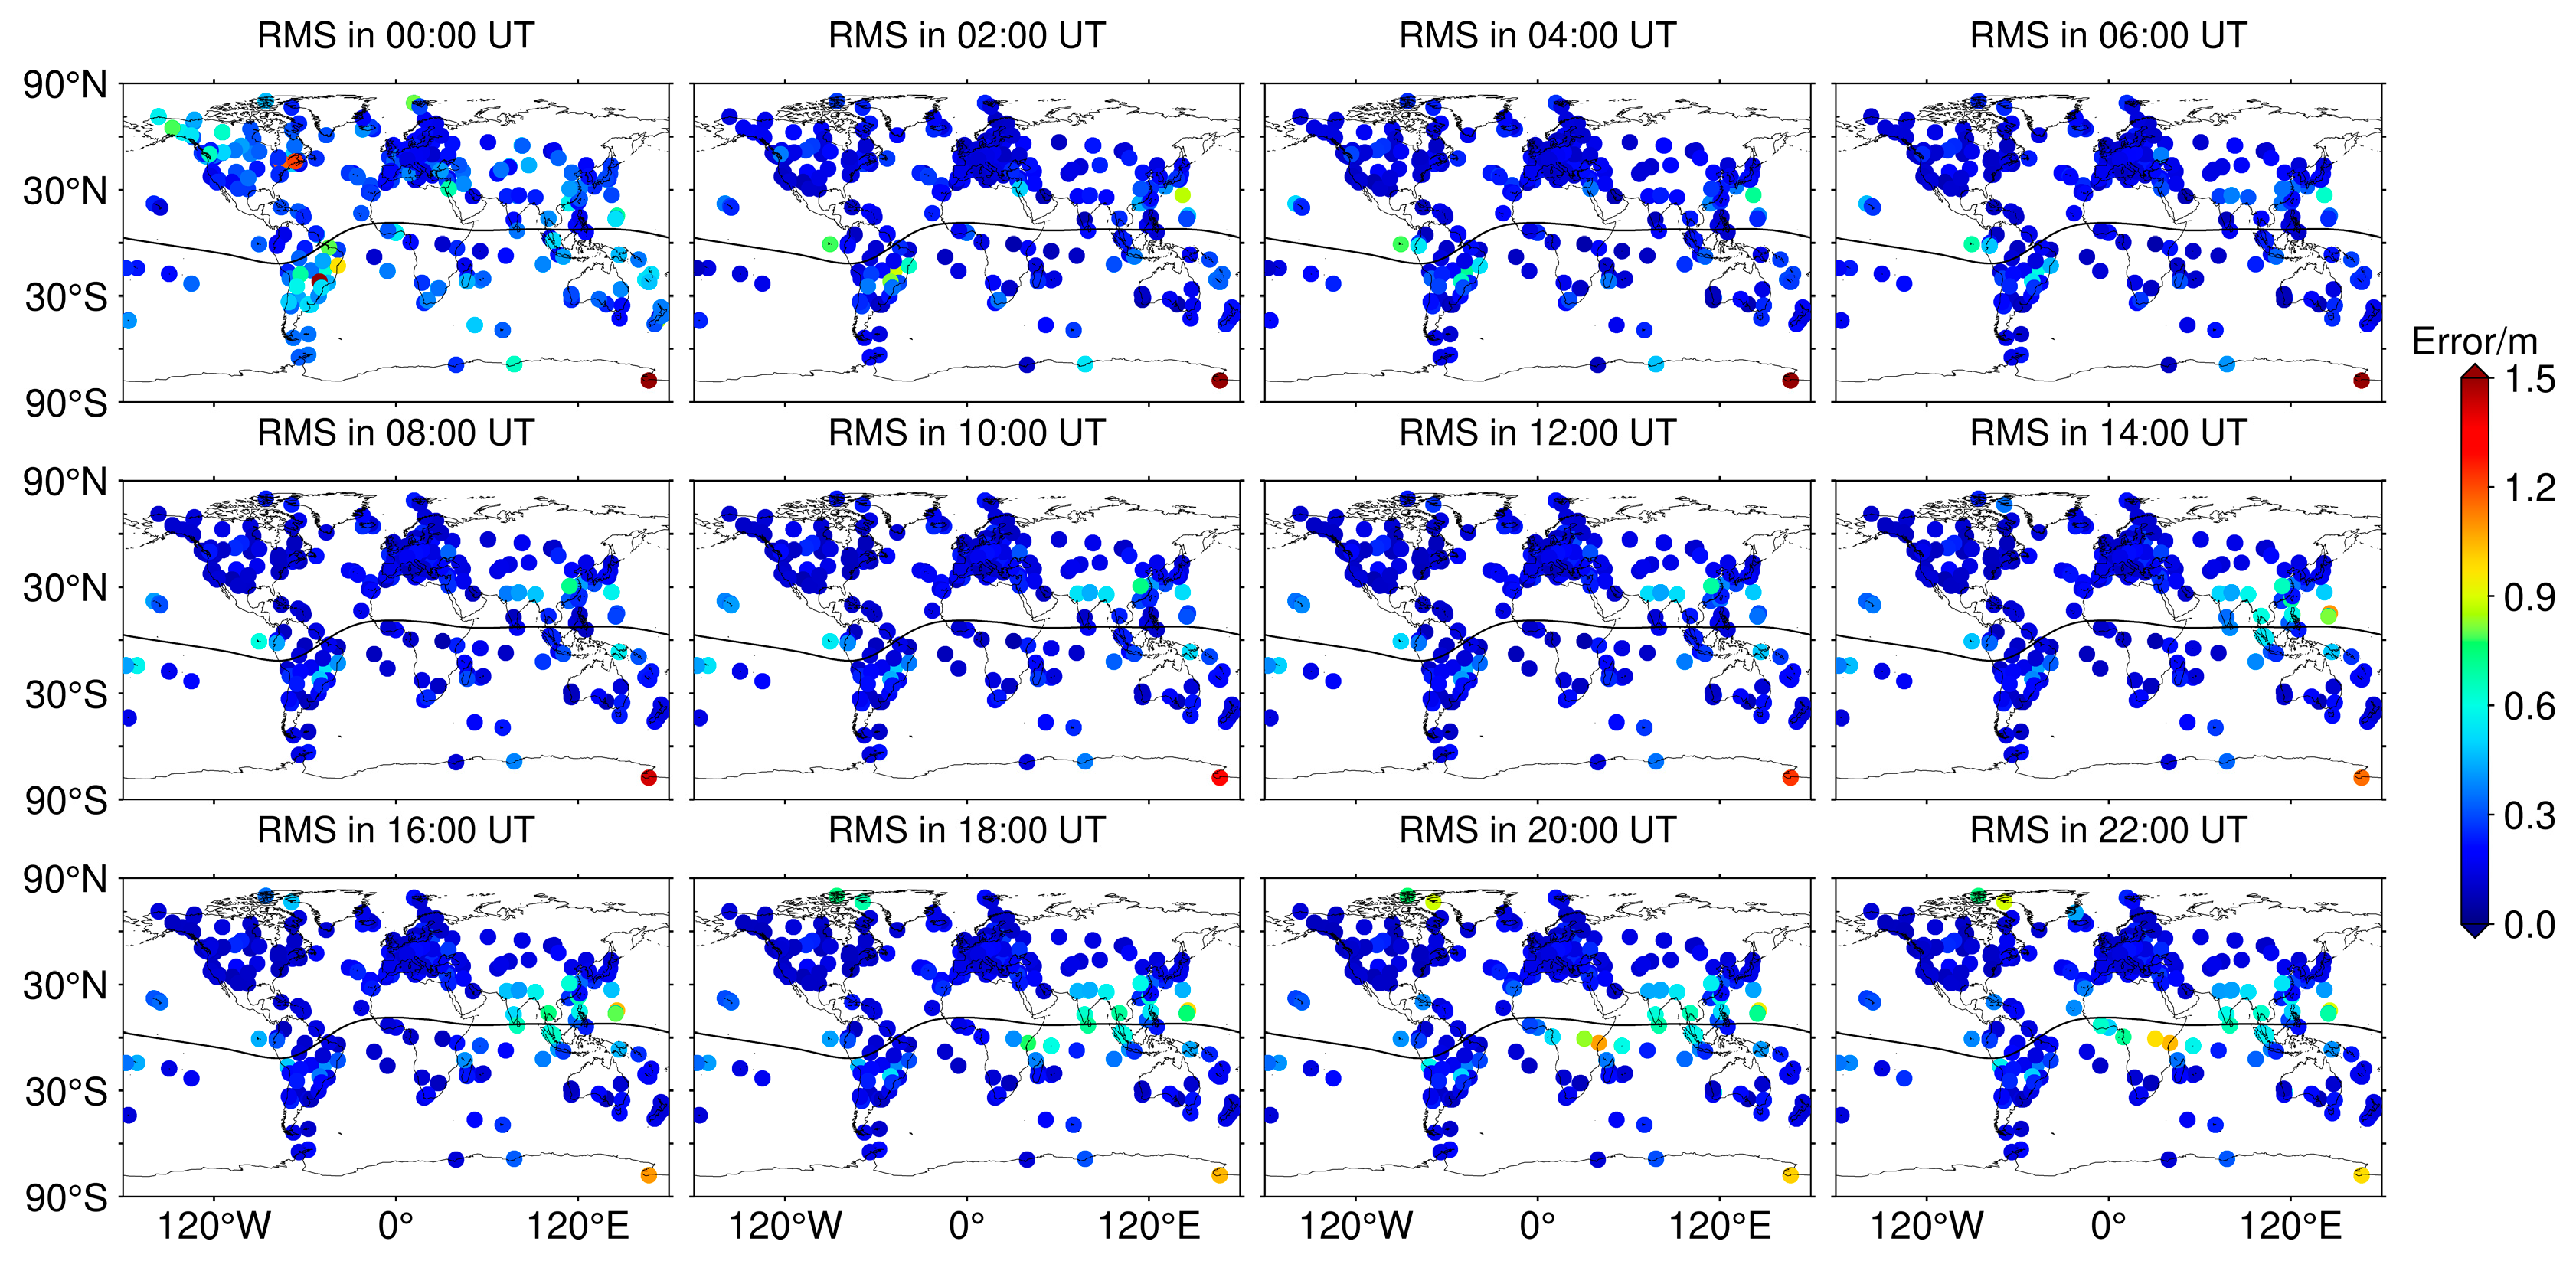
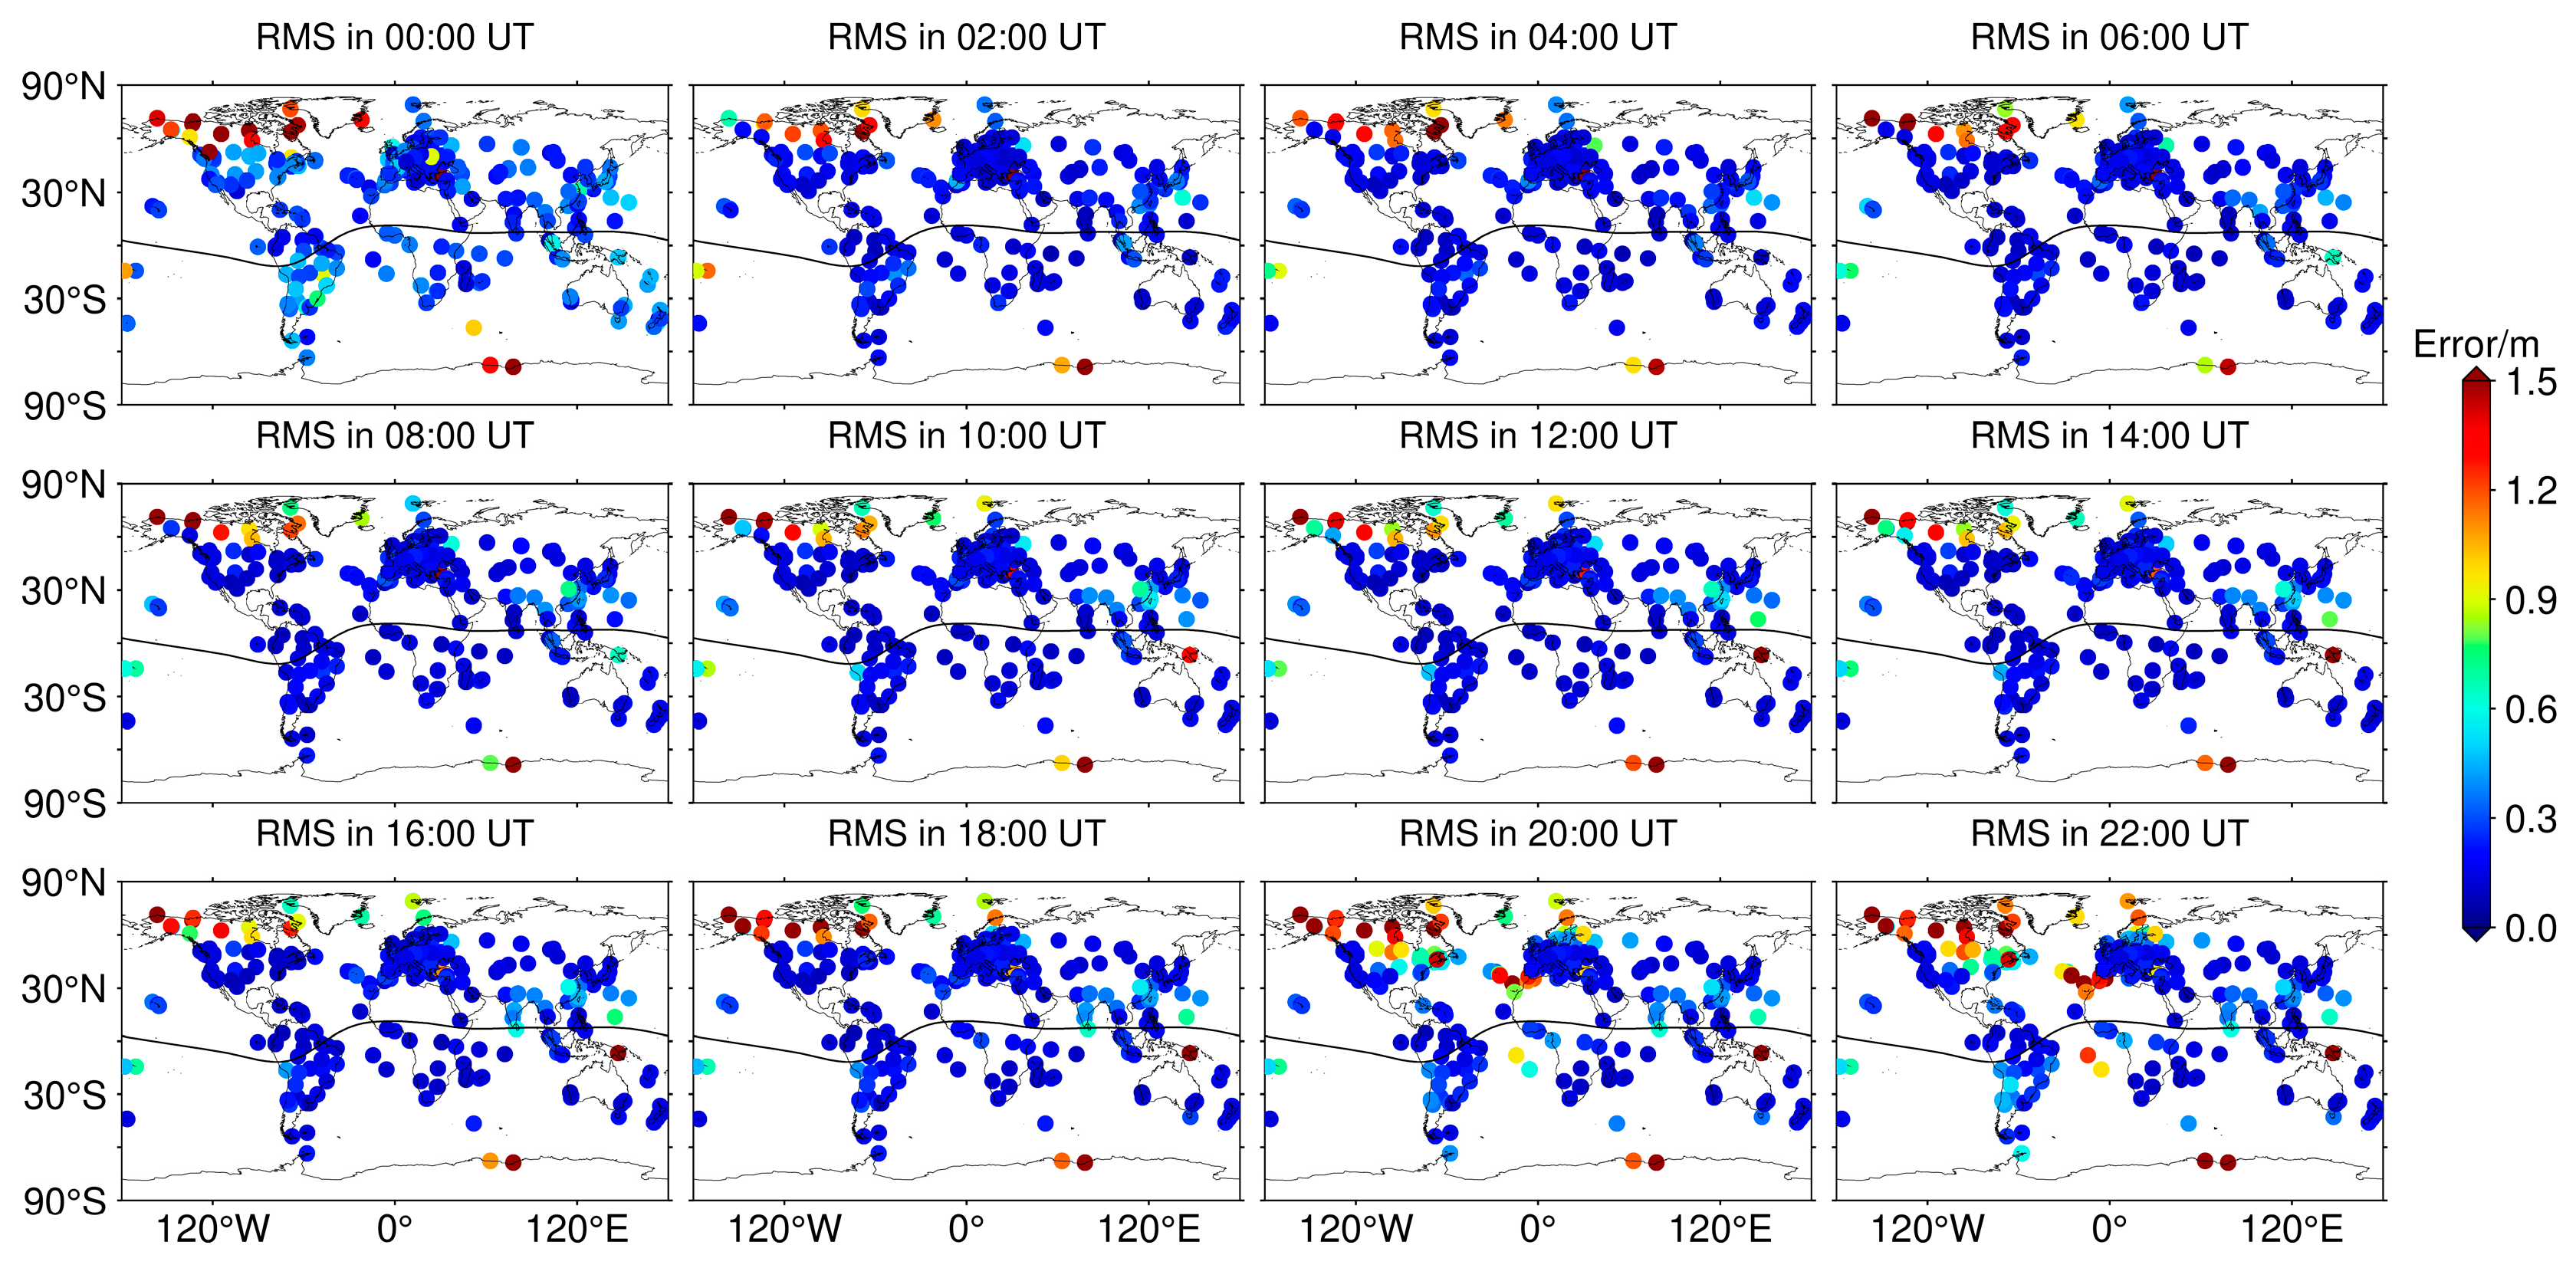
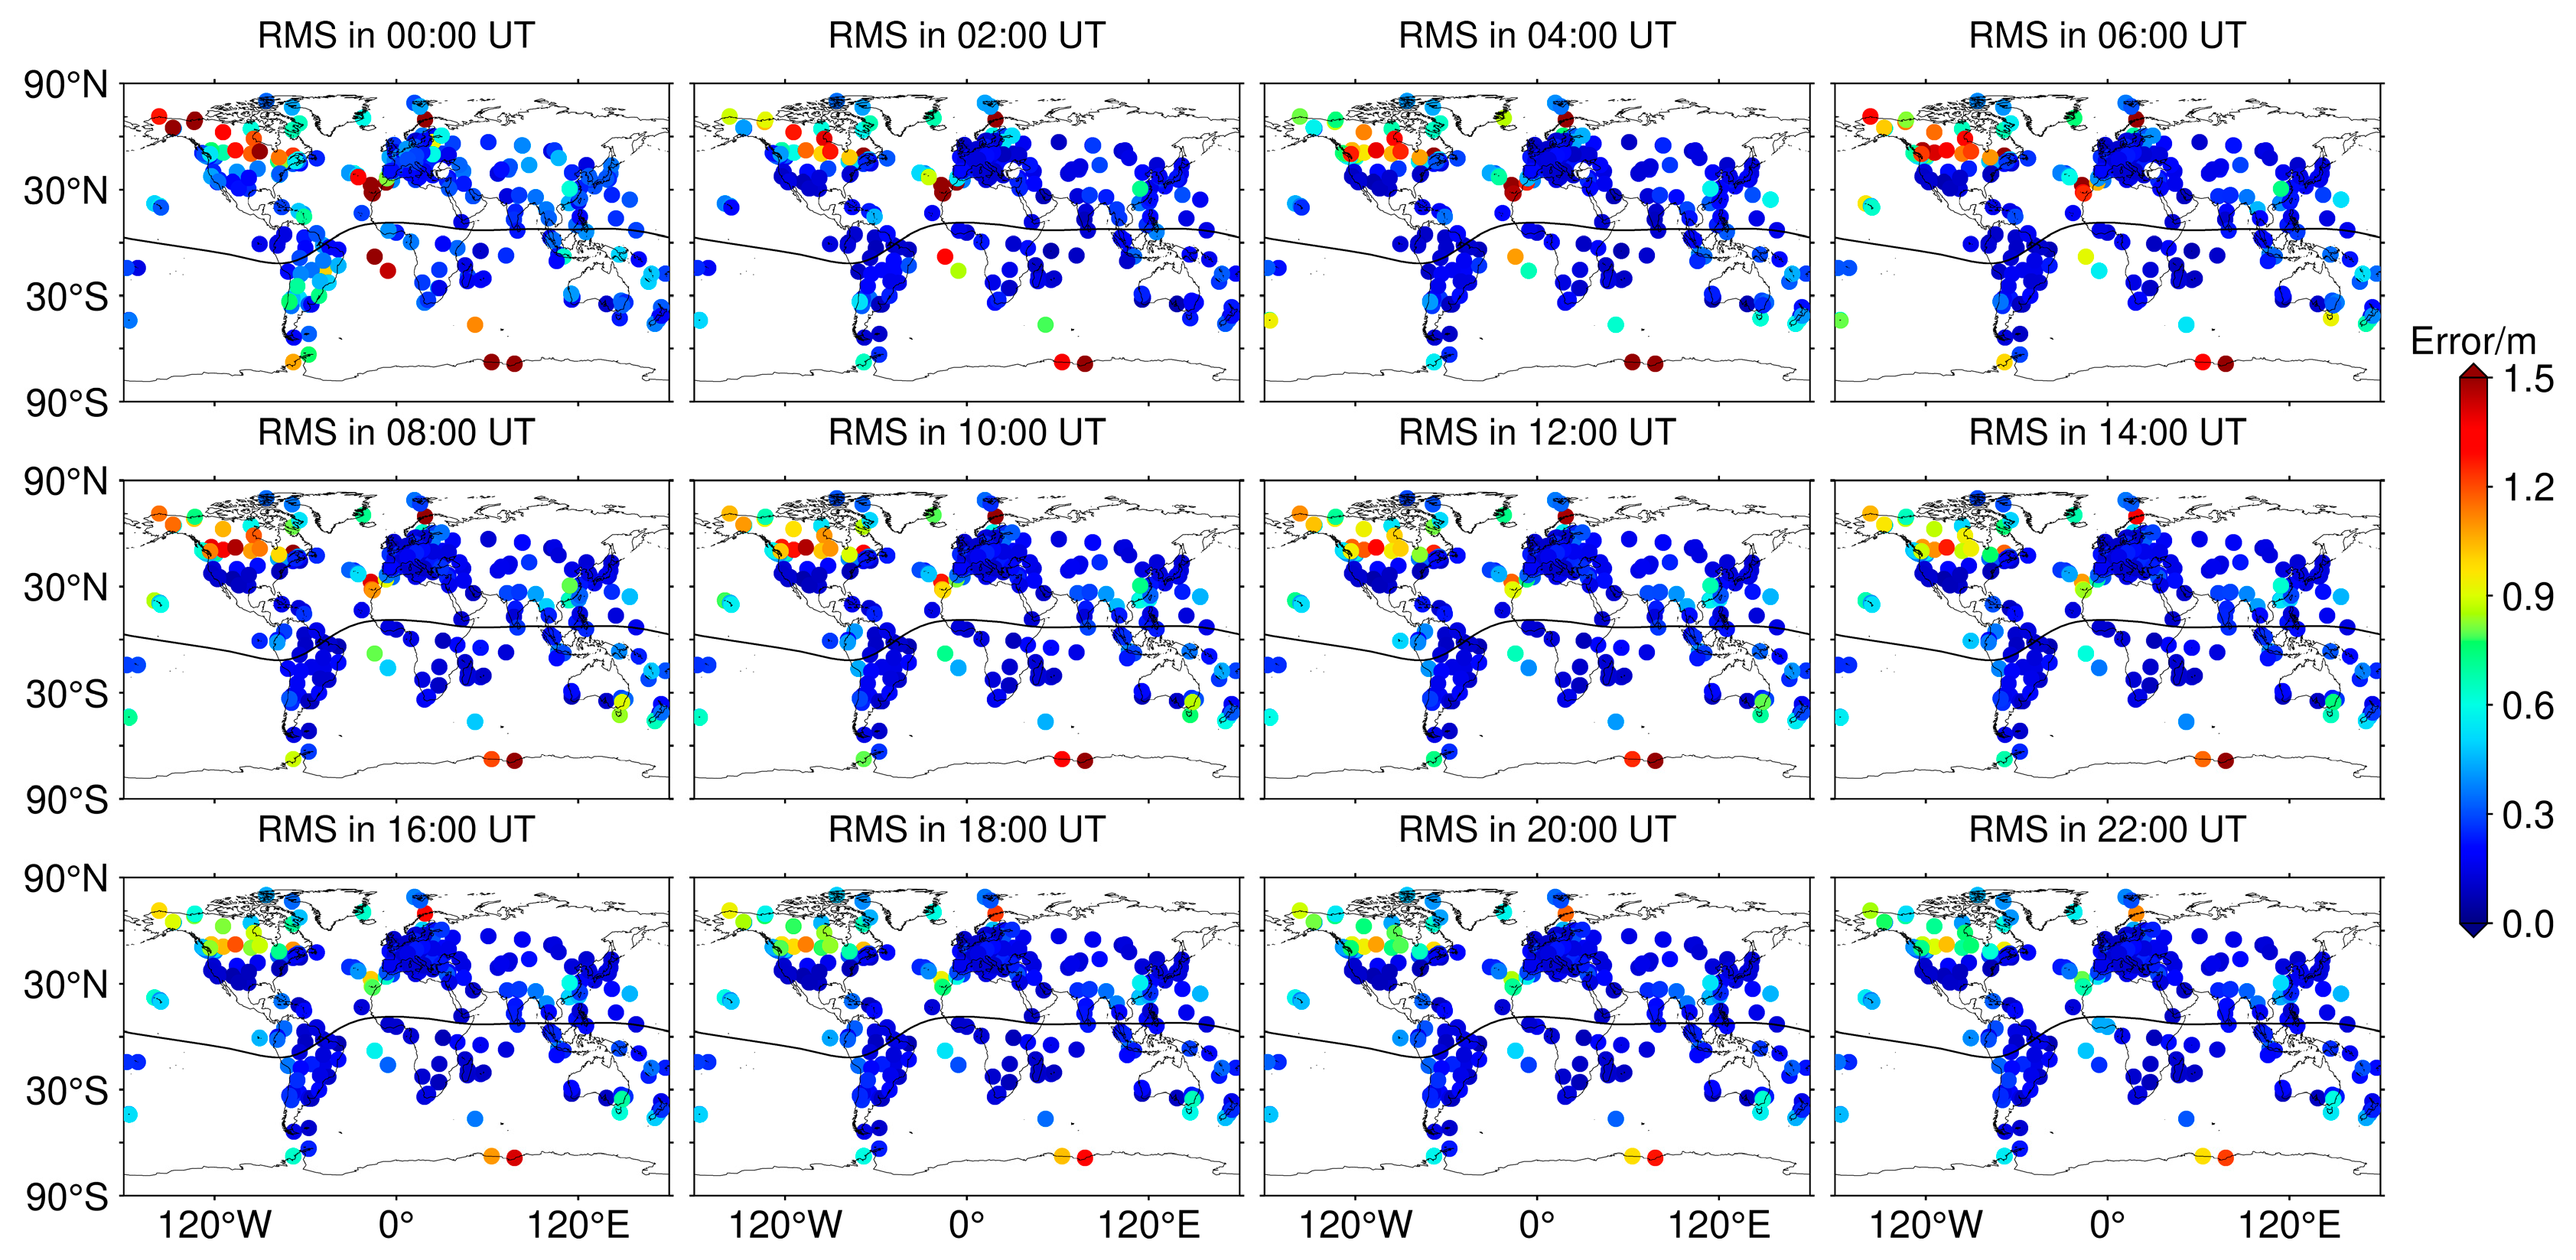
3.3. Degradation of PPP Accuracy

After a detailed analysis of the ionospheric response during geomagnetic storms, our focus turned to the investigation of the performance of PPP during geomagnetic storms. Based on the PPP solution strategy given in the Section 2, we processed more than 400 GNSS station observations worldwide. The errors in the north (N), east (E), vertical (U), and 3D directions corresponding to the coordinates of the real GNSS stations were obtained, and the root mean square (RMS) of the errors was calculated. In this process, we excluded some of the GNSS stations with positioning anomalies based on the data from a geomagnetic quiet day (20 April 2023) to visualize the effect of geomagnetic storms on PPP.
Figure 11 illustrates the RMS of the PPP errors on 20 April, 23 April, and 24 April 2023 in the N, E, U, and 3D directions. On geomagnetically quiet days, the PPP in the N and E directions has an RMS of about 0.3 m only near the magnetic equator, and the RMS in other regions is less than 0.1 m. The RMS of PPP in the U direction is larger, close to 1.0 m, and is mainly distributed in the magnetic equator and pole regions, while the RMS is less than 0.3 m in other regions. The RMS of global GNSS stations during geomagnetic storms in the N and E directions is small, the RMS of GNSS stations in the middle and low latitudes is below 0.2 m, and the PPP accuracy is mostly in the centimeter level, while the RMS of GNSS stations in high latitudes is below 1.0 m. However, in the U direction, the RMS of both middle and high latitude GNSS stations exceeded 1.0 m on 23 April, and the RMS of the GNSS stations in the polar region even exceeded 2.0 m. The RMS of both middle and high latitude GNSS stations on 24 April was close to 1.0 m. The degradation of the positioning accuracy in the vertical direction leads to the degradation of the accuracy in the 3D direction. The RMS of the 3D errors of the GNSS stations in the high latitude region all exceeded 1.2 m on 23 April. The RMS of the 3D errors of the GNSS stations in the high latitude region on 24 April were lower than that on 23 April, and the PPP accuracy degraded to the meter level.
Figure 12 shows the mean absolute errors (MAE) of the PPP on 20 April, 23 April, and 24 April 2023 in the N, E, and U directions for the high, middle, and low latitude GNSS stations. It is obvious from Figure 12 that during the development of geomagnetic storms, the positioning errors of GNSS stations at low, middle, and high latitudes fluctuate to different levels. The GNSS station positioning errors in the low latitude region occurred between 20:00 UT on 23 April and 02:00 UT on 24 April, with maximum MAEs exceeding 0.2 m, 0.2 m, and 0.5 m in the N, E, and U directions, respectively. The GNSS station positioning errors in the middle latitude region occurred between 18:00 UT on 23 April and 08:00 UT on 24 April. The MAE maximum in the N direction occurred at 20:00 UT on April 23, with a maximum value exceeding 0.4 m. The U direction showed a maximum value close to 1.0 m at the same time. However, the PPP MAE at the middle latitude was smaller than that at the low latitude in the E, N, and U directions on geomagnetically quiet days. The most obvious fluctuations in positioning errors were observed at the high latitude GNSS stations, and the significant degradation of PPP accuracy caused by the geomagnetic storm occurred from 14:00 UT on 23 April to 12:00 UT on 24 April, with the maximum MAE exceeding 0.8 m in the N direction. The maximum MAE was close to 0.6 m in the E direction, and the maximum MAE in the U direction exceeded 2.3 m. The GNSS positioning MAEs in all three latitude bands were affected by the geomagnetic storm, especially more significantly at high latitudes.
To further investigate the degradation of the PPP accuracy for GNSS stations in different temporal and spatial dimensions, the RMS of the PPP errors for 20 April, 23 April, and 24 April 2023 for the 3D direction are given in Figure 13, Figure 14 and Figure 15. On geomagnetically quiet days, the larger RMS in the 3D direction is found mainly in the polar regions and in the low latitude EIA region. During the time period when no geomagnetic storms occurred on 23 April, the RMS exceeded 1.0 m only in the high latitude region of North America and the Antarctic region, while the RMS in all other regions was close to that of a geomagnetically quiet day. Starting at 08:00 UT, the RMS of GNSS stations in the high latitude region gradually increased as geomagnetic storms began to develop, and the number of GNSS stations with an RMS exceeding 1.0 m continued to increase. At 20:00 UT and 22:00 UT, the RMS of the GNSS stations in the high latitude region, the middle latitude region of North America, and the northern part of Africa were the largest, with the maximum exceeding 2.0 m. On 24 April, the RMS of the disturbed GNSS stations was smaller than the maximum on 23 April, which is in accordance with the above that the response of the ionosphere was smaller during the second step of the development of the geomagnetic storm. After 12:00 UT, the RMS in the disturbed region decreased further. The above variations in the RMS adequately illustrate the poor effects on GNSS positioning during the development of geomagnetic storms. The PPP error prior to 08:00 UT on 23 April may have been caused by the CME event that occurred on 21 April and will not be discussed in detail in this paper.

4. Discussion and Conclusions

In part of the analysis of ionospheric disturbances triggered by a geomagnetic storm, we found a significant positive ionospheric TEC anomaly over a wide range of low and middle latitudes during the main phase of the geomagnetic storm (i.e., from 20:00 UT on 23 April to 00:00 UT on 24 April), a phenomenon referred to as a positive ionospheric storm. Ionospheric storms caused by geomagnetic storms are categorized into positive and negative storms, and the physical factors affecting ionospheric parameter changes during geomagnetic storms include thermospheric circulation, disturbance dynamo electric fields, penetration electric fields, TIDs, and neutral component changes [40,41,42]. During geomagnetic storms, equatorward neutral winds may cause an eastward prompt penetration electric field (PPEP) to occur during the daytime, moving the EIA crests to higher than normal latitudes, and thus, positive ionospheric storms are likely to occur in the morning to noon local time [43]. Based on the global ionospheric TEC product provided by MIT and CODE, we found a significant enhancement of the EIA during the geomagnetic storms of 23 and 24 April 2023, and the EIA enhancement region was localized in the morning to noon time. This suggests that the cause of the EIA enhancement that occurred at low and middle latitudes in this geomagnetic storm was likely to be positive ionospheric storms caused by equatorward neutral winds. Typically, equatorward neutral winds lift the low and middle latitude F-layer to higher altitudes, where the recombination process is slower and therefore the TEC increases [44]. Therefore, we investigated the variations in the F layer of the ionosphere at low and middle latitudes using the FORMOSAT-7/COSMIC-2 ionospheric scintillation S4 index from 200 to 600 km. We found that ionospheric disturbances are more significant at 400~600 km altitude than at 200~400 km altitude during geomagnetic storms. This further demonstrated that the cause of this positive ionospheric storm is most likely the equatorward neutral wind.
Based on the observation data from more than 400 GNSS stations around the world, we calculated the ROTI during quiet days and geomagnetic storm days. We found that the ROTI during geomagnetic storms was significantly higher than on quiet days, and found that the ionospheric ROTI variations were consistent with the process of geomagnetic storms. The ROTI variation of GNSS stations in the high latitude region was the largest, and the maximum ROTI was more than 0.5 TECU/min. The maximum ROTI in the middle and low latitude was not more than 0.3 TECU/min. Phase scintillation data from four GNSS stations in CHAIN showed that ionospheric scintillation of varying levels were observed at all GNSS stations during geomagnetic storms in near high latitudes, and the largest mean phase scintillation indices exceeded 0.8.
The ionospheric disturbances induced by geomagnetic storms severely affected the performance of the GNSS PPP during this period. In particular, the error in the U direction was the largest, and the RMS exceeded 2.0 m, which led to an increase of the error in the 3D direction and the degradation of the PPP accuracy. Nie et al. [45] proposed that the reason for the increase in the PPP error during geomagnetic storms is related to the occurrence of cycle slips in the observing satellites, and that increasing the threshold value of the ionospheric scintillation detector can improve the PPP accuracy in the high latitude region. Luo, et al. [46] fused the ROTI into an elevation angle stochastic model (EAS), which also improved the performance of the PPP on a global scale during storms. This means that we can improve the GNSS data processing methods or incorporate perturbation models with a view to improving the accuracy of GNSS positioning during geomagnetic storms. This is the direction of our future investigations.
We have investigated in detail the ionospheric disturbances and the degradation of PPP accuracy during a severe geomagnetic storm that occurred during the rising year of the 25th solar active cycle. With the arrival of the peak solar activity year, we will consider the investigation of more cases of GNSS positioning problems caused by ionospheric disturbance phenomena, which will be of reference value for space weather and GNSS research during the upcoming peak solar activity year.

Author Contributions

Conceptualization, writing—original draft preparation, writing—review and editing, and methodology, Y.W., Y.Y., M.L., T.Z. and H.G.; validation, Y.W., T.Z. and G.W. (Guofang Wang); data curation, Y.Y., M.L. and G.W. (Gang Wen); formal analysis, Y.W. and T.Z.; funding acquisition, Y.W., Y.Y. and M.L. All authors have read and agreed to the published version of the manuscript.

Funding

This research was funded by the Science and technology project of China Southern Power Grid Yunnan Power Grid Co., Ltd. (grant number. YNKJXM20220033), Yunnan Fundamental Research Projects (grant number. 202301AU070101), the China Postdoctoral Science Foundation (grant number. 2021MD703896), and was partially supported by the National Natural Science Foundation of China (No. 42004027).

Data Availability Statement

The GNSS observations and CODE products are available from the IGS (https://cddis.nasa.gov/archive/gnss/data/, registration required, accessed on 25 October 2023). The FORMOSAT-7/COSMIC-2 occultation data are available from CDAAC (https://data.cosmic.ucar.edu/gnss-ro/cosmic2/, accessed on 25 October 2023). The MIT GNSS data products are stored in the Madrigal database (http://cedar.openmadrigal.org/openmadrigal, accessed on 25 October 2023). The GISTM Data are derived from CHAIN (http://chain.physics.unb.ca/data/, accessed on 25 October 2023), and the solar geomagnetic parameters are available from the GSFC/SPDF OMNIWeb (https://omniweb.gsfc.nasa.gov/form/dx4.html, accessed on 25 October 2023).

Acknowledgments

We acknowledge the use of MATrix LABoratory (MATLAB R2022b) software, the RTKLIB program package, and Generic Mapping Tools. We would also like to thank the anonymous reviewers for their helpful suggestions.

Conflicts of Interest

Authors Yifan Wang, Hao Geng, Guofang Wang and Gang Wen were employed by the company Yunnan Power Grid Company Ltd. The remaining authors declare that the research was conducted in the absence of any commercial or financial relationships that could be construed as a potential conflict of interest.

References

  1. Yuan, Y. Study on Theories and Methods of Correcting Ionospheric Delay and Monitoring Ionosphere Based on GPS. Ph.D. Thesis, Institute of Geodesy and Geophysics, Chinese Academy of Sciences, Wuhan, China, 2002. (In Chinese). [Google Scholar]
  2. Yuan, Y.; Tscherning, C.C.; Knudsen, P.; Xu, G.; Ou, J. The ionospheric eclipse factor method (IEFM) and its application to determining the ionospheric delay for GPS. J. Geod. 2008, 82, 1–8. [Google Scholar] [CrossRef]
  3. Yuan, Y.; Wang, N.; Li, Z.; Huo, X. The BeiDou global broadcast ionospheric delay correction model (BDGIM) and its preliminary performance evaluation results. Navigation 2019, 66, 55–69. [Google Scholar] [CrossRef]
  4. Feng, J.; Zhang, T.; Li, W.; Zhao, Z.; Han, B.; Wang, K. A new global TEC empirical model based on fusing multi-source data. GPS Solut. 2022, 27, 20. [Google Scholar] [CrossRef]
  5. D’Amicis, R.; Bruno, R.; Bavassano, B. Is geomagnetic activity driven by solar wind turbulence? Geophys. Res. Lett. 2007, 34, 28896. [Google Scholar] [CrossRef]
  6. Gonzalez, W.D.; Joselyn, J.A.; Kamide, Y.; Kroehl, H.W.; Rostoker, G.; Tsurutani, B.T.; Vasyliunas, V.M. What is a geomagnetic storm? J. Geophys. Res. Space Phys. 1994, 99, 5771–5792. [Google Scholar] [CrossRef]
  7. Afraimovich, E.L.; Demyanov, V.V.; Kondakova, T.N. Degradation of GPS performance in geomagnetically disturbed conditions. GPS Solut. 2003, 7, 109–119. [Google Scholar] [CrossRef]
  8. Astafyeva, E.; Yasyukevich, Y.; Maksikov, A.; Zhivetiev, I. Geomagnetic storms, super-storms, and their impacts on GPS-based navigation systems. Space Weather 2014, 12, 508–525. [Google Scholar] [CrossRef]
  9. Peng, Y.; Scales, W.A.; Hartinger, M.D.; Xu, Z.; Coyle, S. Characterization of multi-scale ionospheric irregularities using ground-based and space-based GNSS observations. Satell. Navig. 2021, 2, 14. [Google Scholar] [CrossRef]
  10. Lin, C.H.; Richmond, A.D.; Liu, J.Y.; Yeh, H.C.; Paxton, L.J.; Lu, G.; Tsai, H.F.; Su, S.Y. Large-scale variations of the low-latitude ionosphere during the October–November 2003 superstorm: Observational results. J. Geophys. Res. Space Phys. 2005, 110, 10900. [Google Scholar] [CrossRef]
  11. Nishioka, M.; Saito, A.; Tsugawa, T. Super-medium-scale traveling ionospheric disturbance observed at midlatitude during the geomagnetic storm on 10 November 2004. J. Geophys. Res. Space Phys. 2009, 114, 13581. [Google Scholar] [CrossRef]
  12. Park, J.; Lühr, H.; Jakowski, N.; Gerzen, T.; Kil, H.; Jee, G.; Xiong, C.; Wook Min, K.; Noja, M. A long-lived band of plasma density enhancement at mid-latitudes during the 2003 Halloween magnetic storm. J. Atmos. Sol.-Terr. Phys. 2012, 80, 100–110. [Google Scholar] [CrossRef]
  13. Li, W.; Zhao, D.; He, C.; Hancock, C.M.; Shen, Y.; Zhang, K. Spatial-Temporal Behaviors of Large-Scale Ionospheric Perturbations During Severe Geomagnetic Storms on 7–8 September 2017 Using the GNSS, SWARM and TIE-GCM Techniques. J. Geophys. Res. Space Phys. 2022, 127, e2021JA029830. [Google Scholar] [CrossRef]
  14. Dugassa, T.; Mezgebe, N.; Habarulema, J.B.; Habyarimana, V.; Oljira, A. Ionospheric response to the 23–31 August 2018 geomagnetic storm in the Europe-African longitude sector using multi-instrument observations. Adv. Space Res. 2023, 71, 2269–2287. [Google Scholar] [CrossRef]
  15. Cherniak, I.; Zakharenkova, I. Dependence of the high-latitude plasma irregularities on the auroral activity indices: A case study of 17 March 2015 geomagnetic storm. Earth Planets Space 2015, 67, 151. [Google Scholar] [CrossRef]
  16. Nava, B.; Rodríguez-Zuluaga, J.; Alazo-Cuartas, K.; Kashcheyev, A.; Migoya-Orué, Y.; Radicella, S.M.; Amory-Mazaudier, C.; Fleury, R. Middle- and low-latitude ionosphere response to 2015 St. Patrick’s Day geomagnetic storm. J. Geophys. Res. Space Phys. 2016, 121, 3421–3438. [Google Scholar] [CrossRef]
  17. Jacobsen, K.S.; Andalsvik, Y.L. Overview of the 2015 St. Patrick’s day storm and its consequences for RTK and PPP positioning in Norway. J. Space Weather Space Clim. 2016, 6, 2016004. [Google Scholar] [CrossRef]
  18. Zakharenkova, I.E.; Cherniak, I.V.; Shagimuratov, I.I.; Klimenko, M.V. Features of High-Latitude Ionospheric Irregularities Development as Revealed by Ground-Based GPS Observations, Satellite-Borne GPS Observations and Satellite In Situ Measurements over the Territory of Russia during the Geomagnetic Storm on March 17–18, 2015. Geomagn. Aeron. 2018, 58, 70–82. [Google Scholar] [CrossRef]
  19. Aa, E.; Huang, W.; Liu, S.; Ridley, A.; Zou, S.; Shi, L.; Chen, Y.; Shen, H.; Yuan, T.; Li, J.; et al. Midlatitude Plasma Bubbles Over China and Adjacent Areas During a Magnetic Storm on 8 September 2017. Space Weather 2018, 16, 321–331. [Google Scholar] [CrossRef]
  20. Habarulema, J.B.; Katamzi-Joseph, Z.T.; Burešová, D.; Nndanganeni, R.; Matamba, T.; Tshisaphungo, M.; Buchert, S.; Kosch, M.; Lotz, S.; Cilliers, P.; et al. Ionospheric Response at Conjugate Locations During the 7–8 September 2017 Geomagnetic Storm Over the Europe-African Longitude Sector. J. Geophys. Res. Space Phys. 2020, 125, e2020JA028307. [Google Scholar] [CrossRef]
  21. Alfonsi, L.; Cesaroni, C.; Spogli, L.; Regi, M.; Paul, A.; Ray, S.; Lepidi, S.; Di Mauro, D.; Haralambous, H.; Oikonomou, C.; et al. Ionospheric Disturbances Over the Indian Sector During 8 September 2017 Geomagnetic Storm: Plasma Structuring and Propagation. Space Weather 2021, 19, e2020SW002607. [Google Scholar] [CrossRef]
  22. Li, G.; Ning, B.; Wang, C.; Abdu, M.A.; Otsuka, Y.; Yamamoto, M.; Wu, J.; Chen, J. Storm-Enhanced Development of Postsunset Equatorial Plasma Bubbles Around the Meridian 120°E/60°W on 7–8 September 2017. J. Geophys. Res. Space Phys. 2018, 123, 7985–7998. [Google Scholar] [CrossRef]
  23. Zhang, S.-R.; Erickson, P.J.; Coster, A.J.; Rideout, W.; Vierinen, J.; Jonah, O.; Goncharenko, L.P. Subauroral and Polar Traveling Ionospheric Disturbances During the 7–9 September 2017 Storms. Space Weather 2019, 17, 1748–1764. [Google Scholar] [CrossRef]
  24. Liu, Y.; Li, Z.; Fu, L.; Wang, J.; Zhang, C. Studying the ionospheric responses induced by a geomagnetic storm in September 2017 with multiple observations in America. GPS Solut. 2019, 24, 3. [Google Scholar] [CrossRef]
  25. Wan, X.; Xiong, C.; Gao, S.; Huang, F.; Liu, Y.; Aa, E.; Yin, F.; Cai, H. The nighttime ionospheric response and occurrence of equatorial plasma irregularities during geomagnetic storms: A case study. Satell. Navig. 2021, 2, 23. [Google Scholar] [CrossRef]
  26. Zakharenkova, I.; Cherniak, I. Effects of storm-induced equatorial plasma bubbles on GPS-based kinematic positioning at equatorial and middle latitudes during the September 7–8, 2017, geomagnetic storm. GPS Solut. 2021, 25, 132. [Google Scholar] [CrossRef]
  27. Duann, Y.; Chang, L.C.; Liu, J.-Y. Impact of the February 3–4, 2022 geomagnetic storm on ionospheric S4 amplitude scintillation index: Observations and implications. Adv. Space Res. 2023, 72, 4379–4391. [Google Scholar] [CrossRef]
  28. Hapgood, M.; Liu, H.; Lugaz, N. SpaceX—Sailing Close to the Space Weather? Space Weather 2022, 20, e2022SW003074. [Google Scholar] [CrossRef]
  29. Feng, J.; Zhang, Y.; Li, W.; Han, B.; Zhao, Z.; Zhang, T.; Huang, R. Analysis of ionospheric TEC response to solar and geomagnetic activities at different solar activity stages. Adv. Space Res. 2023, 71, 2225–2239. [Google Scholar] [CrossRef]
  30. Cherniak, I.; Krankowski, A.; Zakharenkova, I. ROTI Maps: A new IGS ionospheric product characterizing the ionospheric irregularities occurrence. GPS Solut. 2018, 22, 69. [Google Scholar] [CrossRef]
  31. Rideout, W.; Coster, A. Automated GPS processing for global total electron content data. GPS Solut. 2006, 10, 219–228. [Google Scholar] [CrossRef]
  32. Jayachandran, P.T.; Langley, R.B.; MacDougall, J.W.; Mushini, S.C.; Pokhotelov, D.; Hamza, A.M.; Mann, I.R.; Milling, D.K.; Kale, Z.C.; Chadwick, R.; et al. Canadian High Arctic Ionospheric Network (CHAIN). Radio Sci. 2009, 44, 4046. [Google Scholar] [CrossRef]
  33. Heelis, R.A.; Stoneback, R.A.; Perdue, M.D.; Depew, M.D.; Morgan, W.A.; Mankey, M.W.; Lippincott, C.R.; Harmon, L.L.; Holt, B.J. Ion Velocity Measurements for the Ionospheric Connections Explorer. Space Sci. Rev. 2017, 212, 615–629. [Google Scholar] [CrossRef]
  34. Schreiner, W.S.; Weiss, J.P.; Anthes, R.A.; Braun, J.; Chu, V.; Fong, J.; Hunt, D.; Kuo, Y.H.; Meehan, T.; Serafino, W.; et al. COSMIC-2 Radio Occultation Constellation: First Results. Geophys. Res. Lett. 2020, 47, e2019GL086841. [Google Scholar] [CrossRef]
  35. Zumberge, J.F.; Heflin, M.B.; Jefferson, D.C.; Watkins, M.M.; Webb, F.H. Precise point positioning for the efficient and robust analysis of GPS data from large networks. J. Geophys. Res. Solid Earth 1997, 102, 5005–5017. [Google Scholar] [CrossRef]
  36. Kouba, J.; Lahaye, F.; Tétreault, P. Precise Point Positioning. In Springer Handbook of Global Navigation Satellite Systems; Teunissen, P.J.G., Montenbruck, O., Eds.; Springer International Publishing: Cham, Switzerland, 2017; pp. 723–751. [Google Scholar]
  37. Takasu, T.; Yasuda, A. Development of the low-cost RTK-GPS receiver with an open source program package RTKLIB. In Proceedings of the International Symposium on GPS/GNSS, Jeju, Republic of Korea, 4–6 November 2009. [Google Scholar]
  38. Feng, J.; Yuan, Y.; Zhang, T.; Zhang, Z.; Meng, D. Analysis of Ionospheric Anomalies before the Tonga Volcanic Eruption on 15 January 2022. Remote Sens. 2023, 15, 4879. [Google Scholar] [CrossRef]
  39. Prikryl, P.; Jayachandran, P.T.; Mushini, S.C.; Pokhotelov, D.; MacDougall, J.W.; Donovan, E.; Spanswick, E.; St.-Maurice, J.P. GPS TEC, scintillation and cycle slips observed at high latitudes during solar minimum. Ann. Geophys. 2010, 28, 1307–1316. [Google Scholar] [CrossRef]
  40. Sastri, J.H.; Jyoti, N.; Somayajulu, V.V.; Chandra, H.; Devasia, C.V. Ionospheric storm of early November 1993 in the Indian equatorial region. J. Geophys. Res. Space Phys. 2000, 105, 18443–18455. [Google Scholar] [CrossRef]
  41. Maruyama, T.; Nakamura, M. Conditions for intense ionospheric storms expanding to lower midlatitudes. J. Geophys. Res. Space Phys. 2007, 112, 12226. [Google Scholar] [CrossRef]
  42. Zhao, B.; Wan, W.; Tschu, K.; Igarashi, K.; Kikuchi, T.; Nozaki, K.; Watari, S.; Li, G.; Paxton, L.J.; Liu, L.; et al. Ionosphere disturbances observed throughout Southeast Asia of the superstorm of 20–22 November 2003. J. Geophys. Res. Space Phys. 2008, 113, 13054. [Google Scholar] [CrossRef]
  43. Balan, N.; Bailey, G.J. A Physical Mechanism of Positive Ionospheric Storms. In Aeronomy of the Earth’s Atmosphere and Ionosphere; Abdu, M.A., Pancheva, D., Eds.; Springer: Dordrecht, The Netherlands, 2011; pp. 465–475. [Google Scholar]
  44. Pedatella, N.M.; Liu, H.L. The Influence of Internal Atmospheric Variability on the Ionosphere Response to a Geomagnetic Storm. Geophys. Res. Lett. 2018, 45, 4578–4585. [Google Scholar] [CrossRef]
  45. Nie, W.; Rovira-Garcia, A.; Li, M.; Fang, Z.; Wang, Y.; Zheng, D.; Xu, T. The Mechanism for GNSS-Based Kinematic Positioning Degradation at High-Latitudes Under the March 2015 Great Storm. Space Weather 2022, 20, e2022SW003132. [Google Scholar] [CrossRef]
  46. Luo, X.; Du, J.; Galera Monico, J.F.; Xiong, C.; Liu, J.; Liang, X. ROTI-Based Stochastic Model to Improve GNSS Precise Point Positioning Under Severe Geomagnetic Storm Activity. Space Weather 2022, 20, e2022SW003114. [Google Scholar] [CrossRef]
Figure 1. Global distribution of GNSS stations (dark orange dots) and CHAIN stations (dark blue dots) used in this paper.
Remotesensing 15 05512 g001
Figure 2. Space weather conditions from 23 to 25 April 2023.
Remotesensing 15 05512 g002
Figure 3. Distribution of global ionospheric TEC hours-averaged values on 23 April 2023. The solid black line indicates the geomagnetic equator (the same as below).
Remotesensing 15 05512 g003
Figure 4. Distribution of global ionospheric TEC hours-averaged values on 24 April 2023.
Remotesensing 15 05512 g004
Figure 5. Distribution of CODE TEC error on 23 April 2023.
Remotesensing 15 05512 g005
Figure 6. Distribution of CODE TEC error on 24 April 2023.
Remotesensing 15 05512 g006
Figure 7. ROTI calculated from more than 400 GNSS stations worldwide on 23 April 2023.
Remotesensing 15 05512 g007
Figure 8. ROTI calculated from more than 400 GNSS stations worldwide on 24 April 2023.
Remotesensing 15 05512 g008
Figure 9. The sequence of mean phase scintillation index ( σ ϕ ) per minute for 4 GNSS stations in CHAIN on 23 and 24 April 2023.
Remotesensing 15 05512 g009
Figure 10. The percent of S4 index greater than 0.3 for 23 April 2023 (top) and 24 April 2023 (bottom) given by the FORMOSAT-7/COSMIC-2 products.
Remotesensing 15 05512 g010
Figure 11. RMS for PPP errors in the N, E, U, and 3D directions on 20 April 2023 (top), 23 April 2023 (middle), and 24 April 2023 (bottom).
Remotesensing 15 05512 g011
Figure 12. Mean absolute errors of the PPP in N, E, and U directions for GNSS stations at different latitudes on 20 April 2023 (left), 23 April 2023 (middle), and 24 April 2023 (right).
Remotesensing 15 05512 g012
Figure 13. RMS of PPP errors for the 3D direction of global GNSS stations on 20 April 2023.
Remotesensing 15 05512 g013
Figure 14. RMS of PPP errors for the 3D direction of global GNSS stations on 23 April 2023.
Remotesensing 15 05512 g014
Figure 15. RMS of PPP errors for the 3D direction of global GNSS stations on 24 April 2023.
Remotesensing 15 05512 g015
Table 1. PPP Kinematic Processing Techniques.
ItemsStrategy
Sampling interval30 s
FrequenciesGPS L1 and L2
Filter typeSmoother combined solution with forward and backward filter solutions
Elevation mask angle15°
Satellite orbit and clockCODE precise ephemeris and precise clock files
Earth tidesSolid earth tides, ocean tide loading, and pole tide corrections
Ionospheric delayIonosphere-free linear combination with dual-frequency measurements is used for ionospheric correction
Tropospheric delayEstimate ZTD + grad
Receiver reference coordinatesIGS SINEX files
Satellite antenna phase center correctionIGS20.atx
Differential code biasCODE products (P1C1, P1P2, P2C2 files)
Disclaimer/Publisher’s Note: The statements, opinions and data contained in all publications are solely those of the individual author(s) and contributor(s) and not of MDPI and/or the editor(s). MDPI and/or the editor(s) disclaim responsibility for any injury to people or property resulting from any ideas, methods, instructions or products referred to in the content.

