
Distributions and Direct Radiative Effects of Different Aerosol Types in North China


Abstract
:1. Introduction
2. Materials and Methods
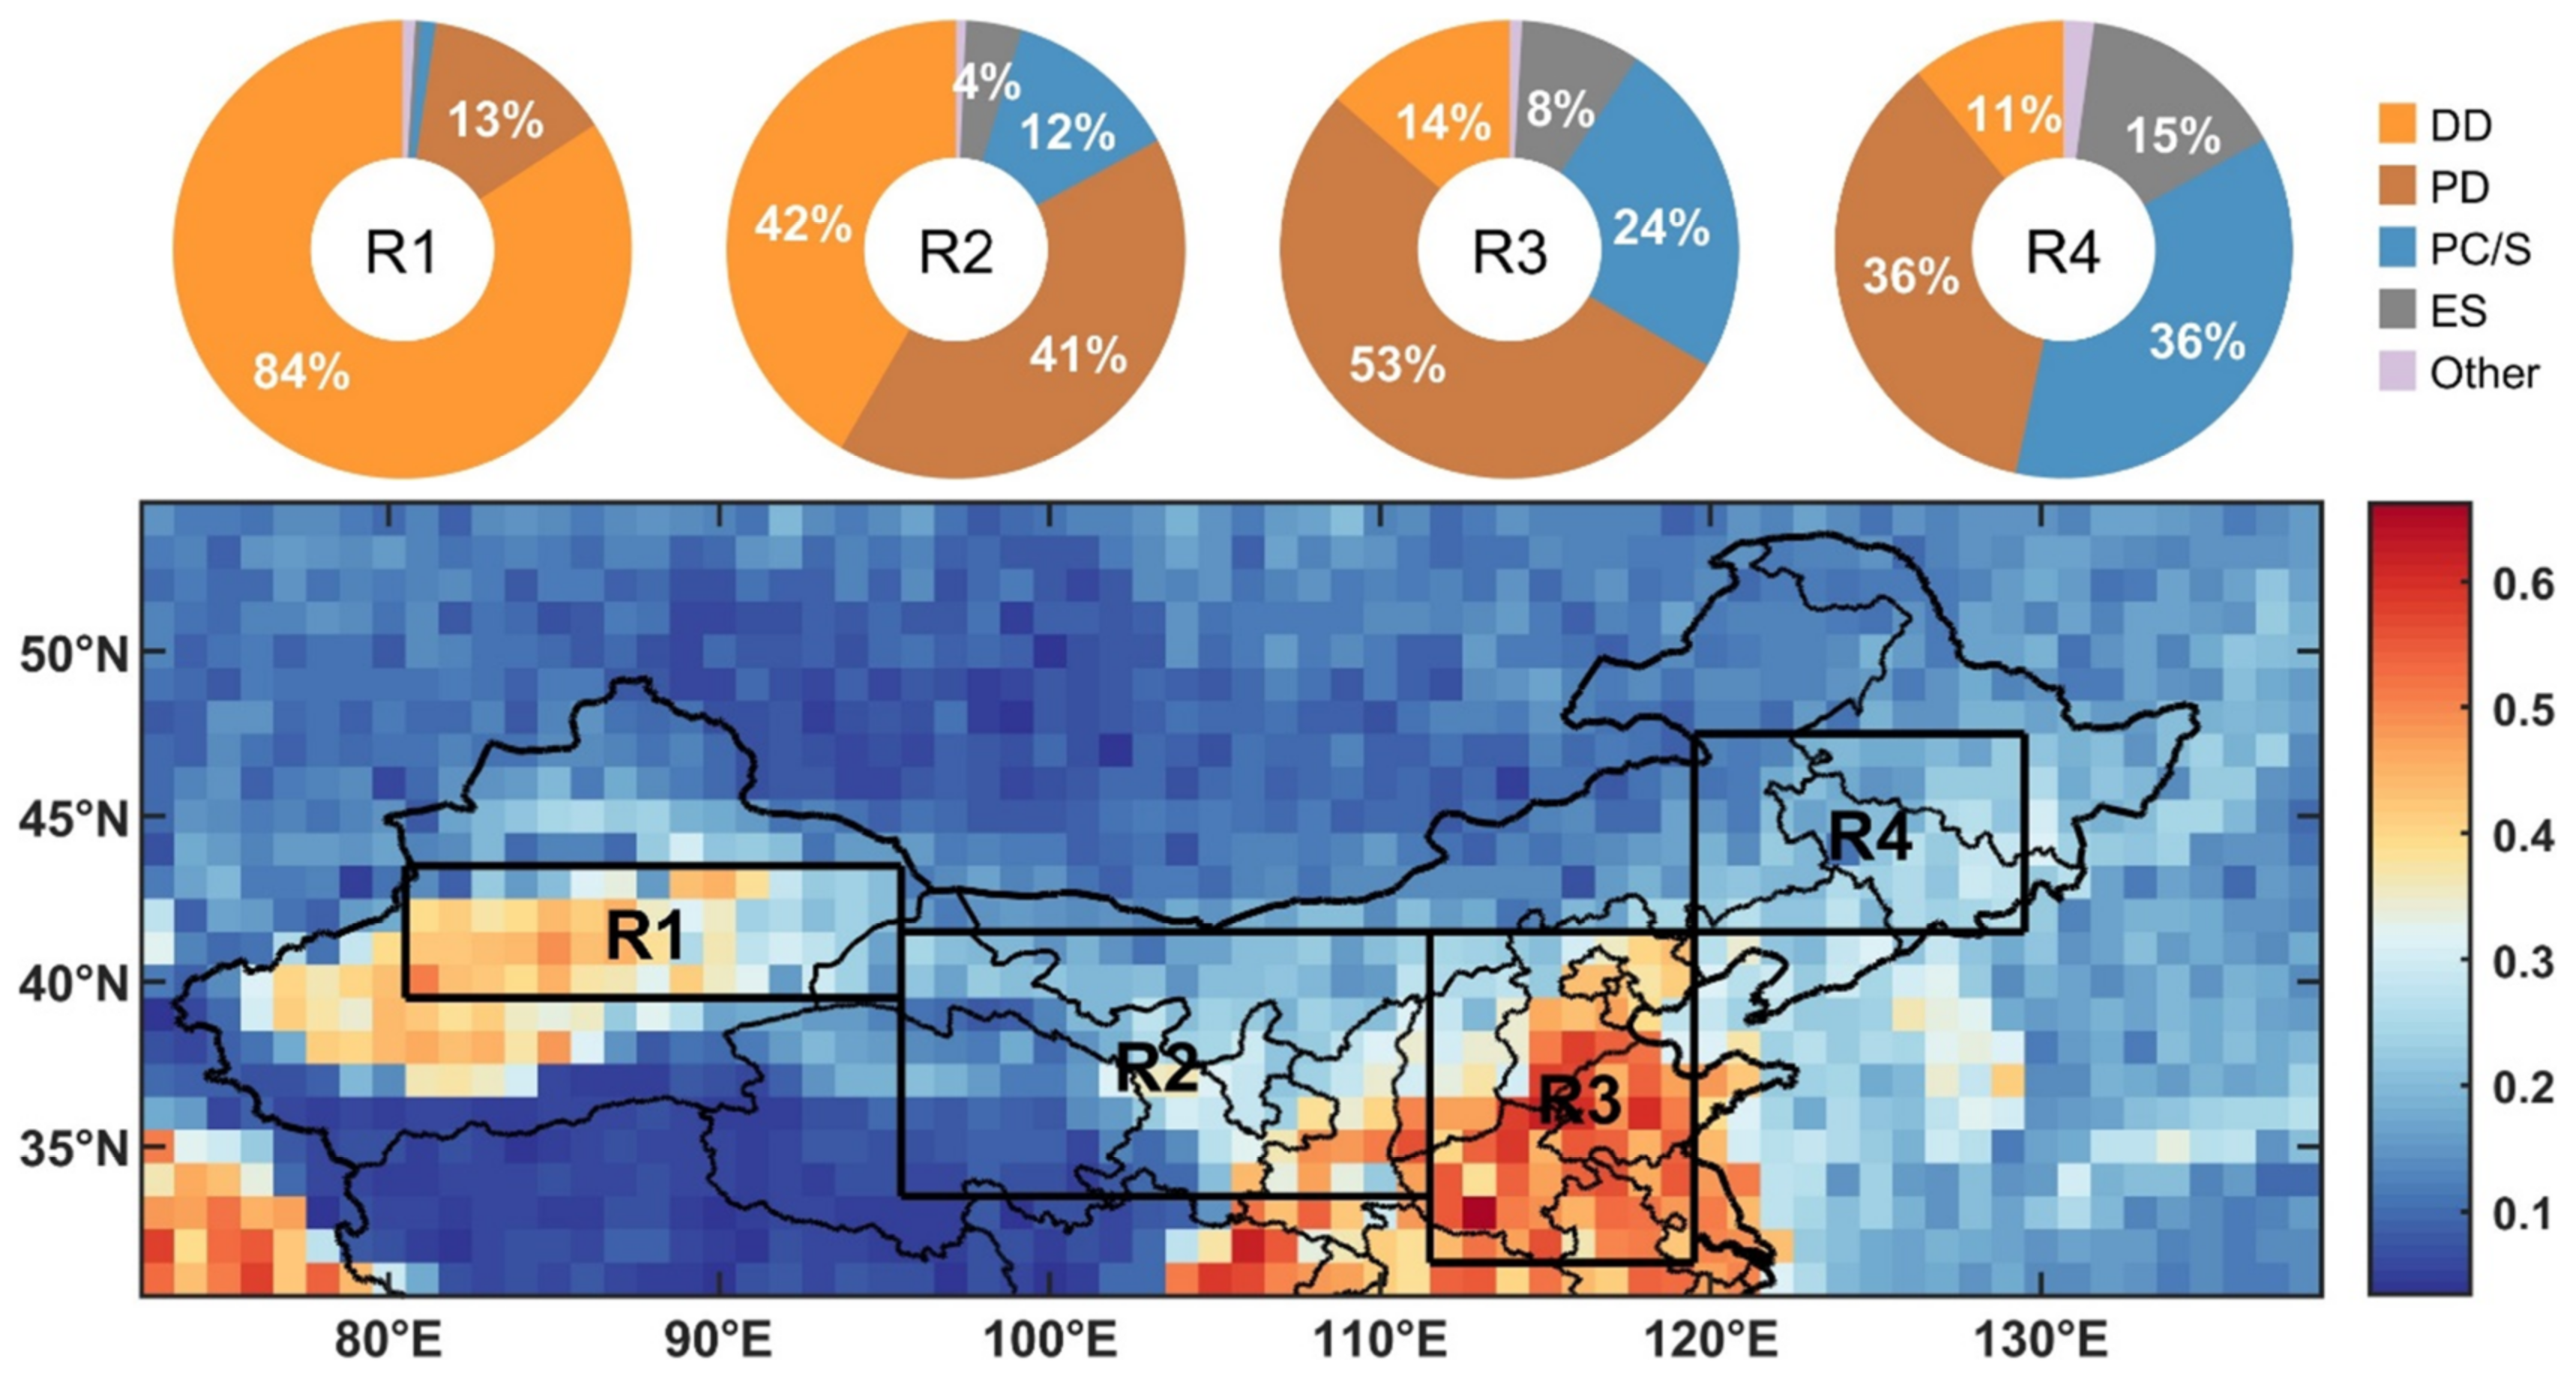
2.1. Study Area
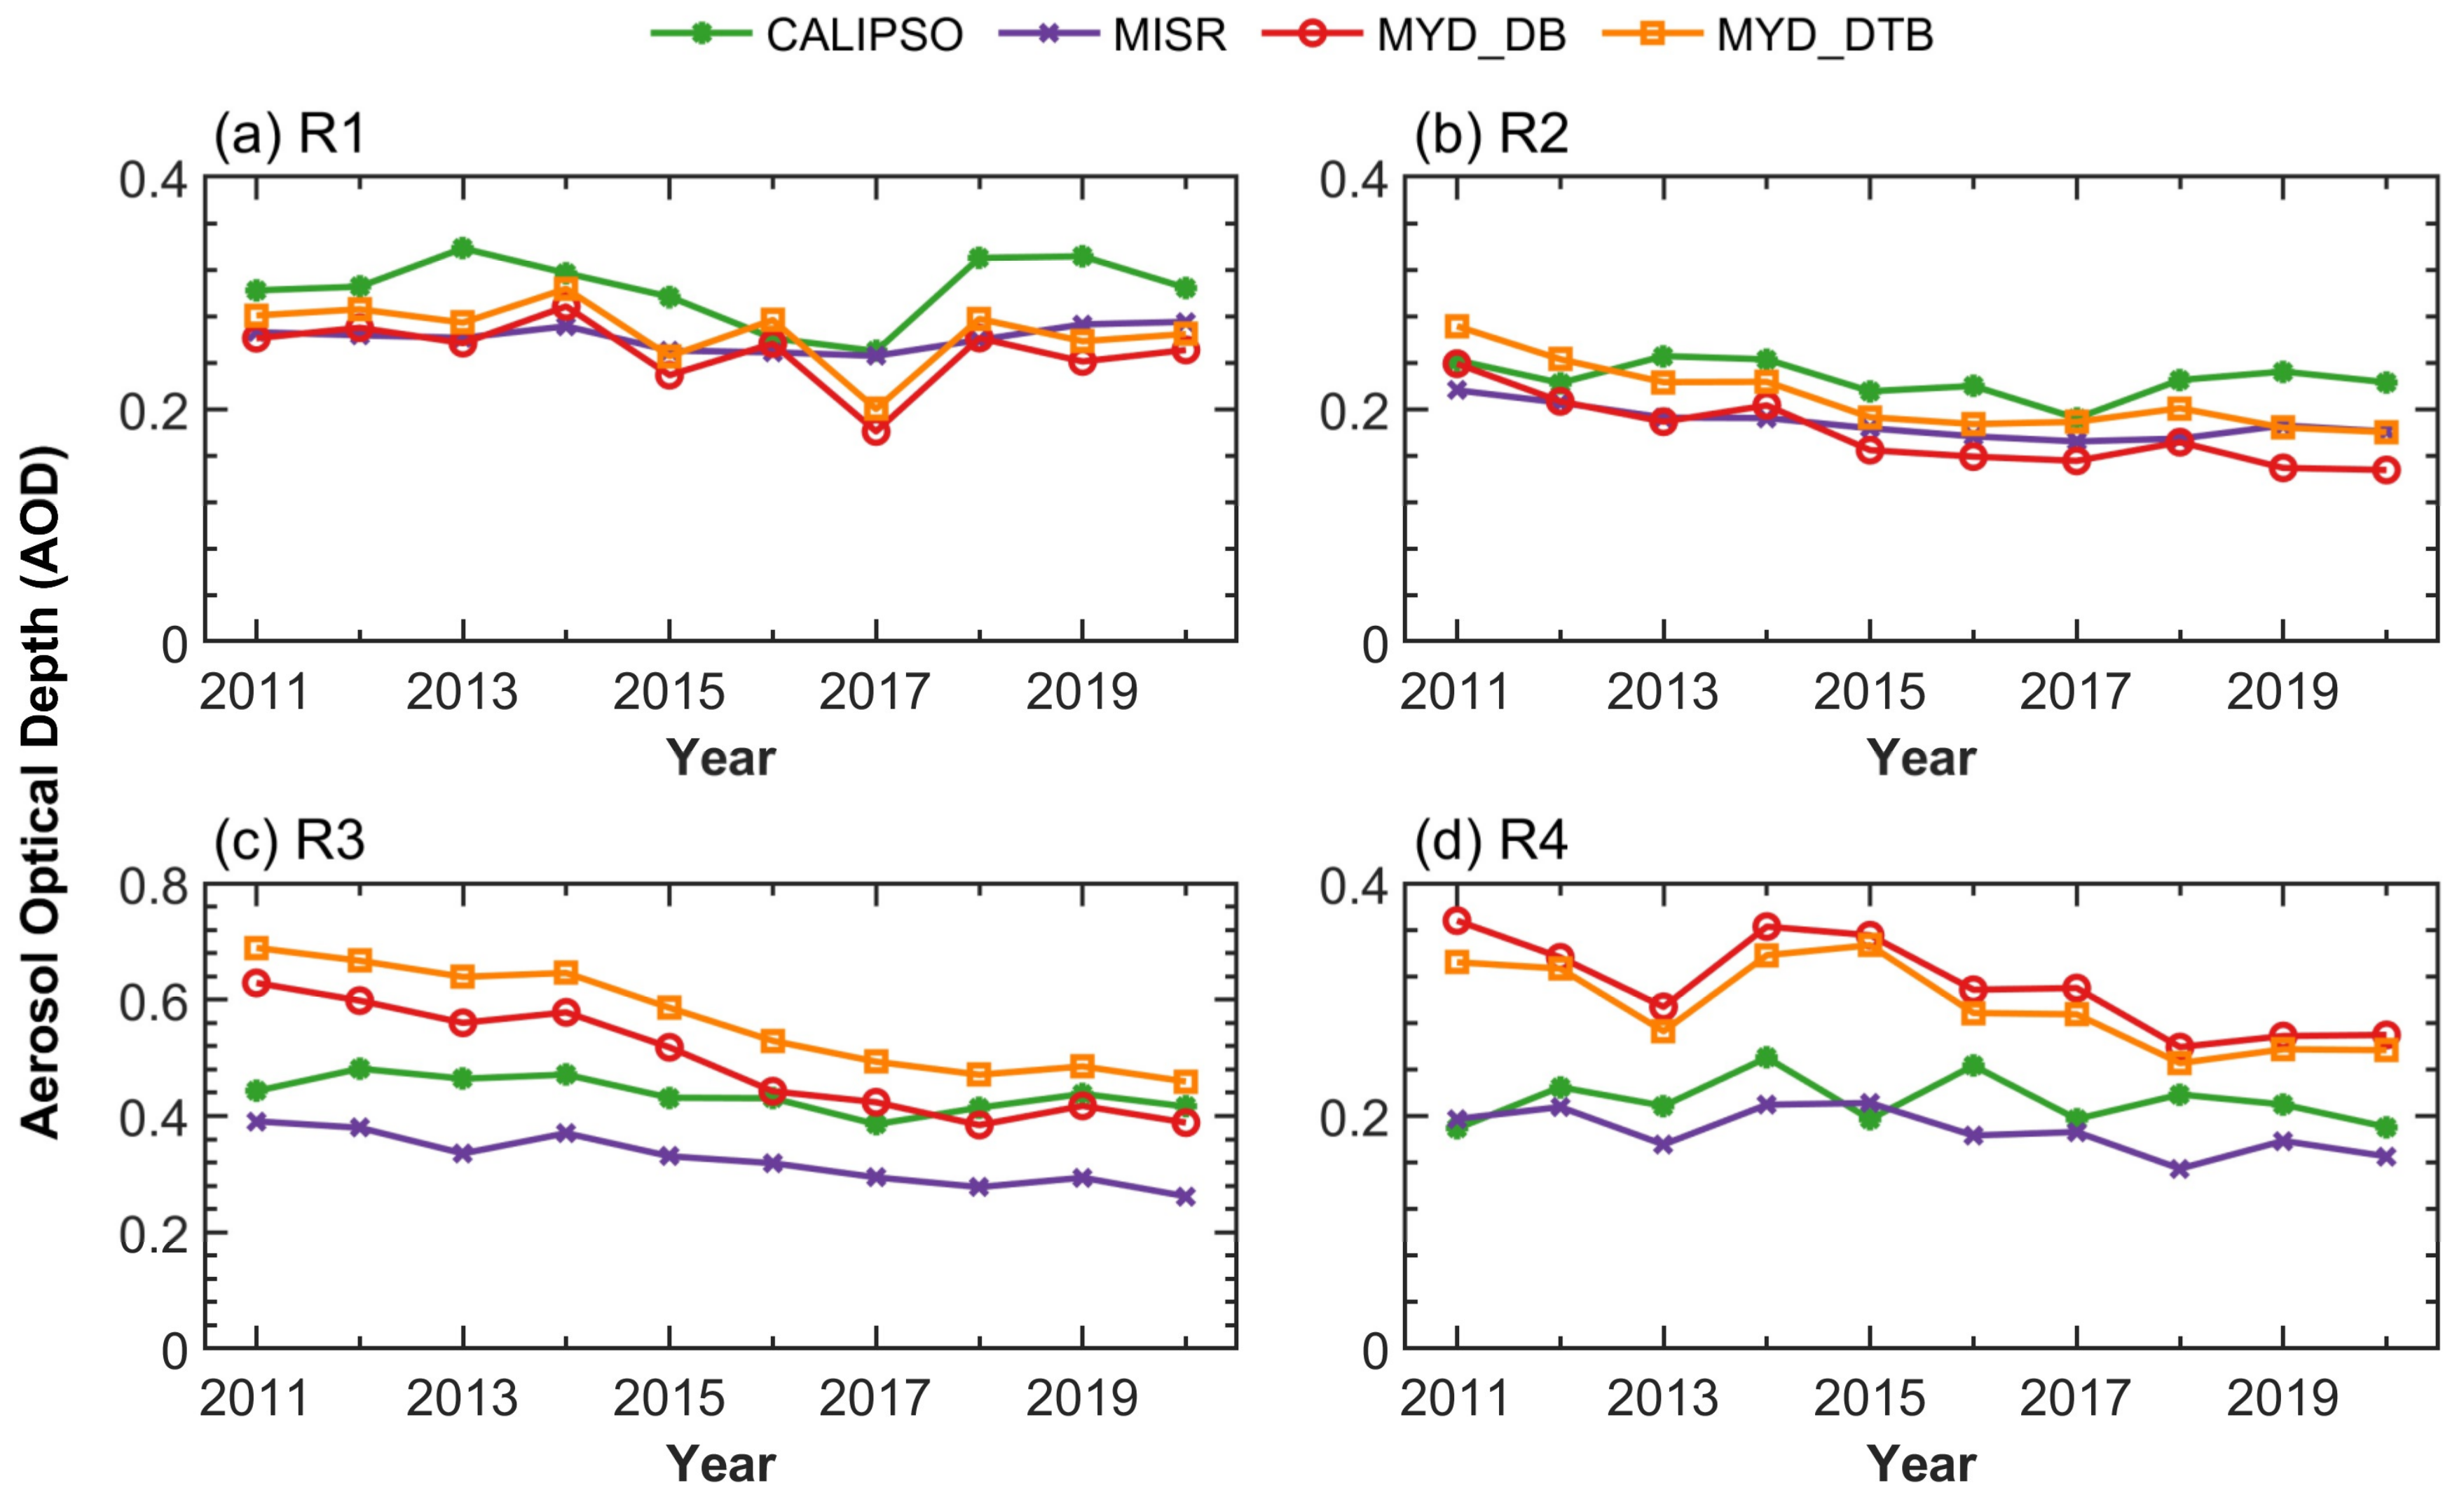
2.2. Datasets
2.3. Fu–Liou Radiative Transfer Model
2.4. Calculation Methods
3. Results
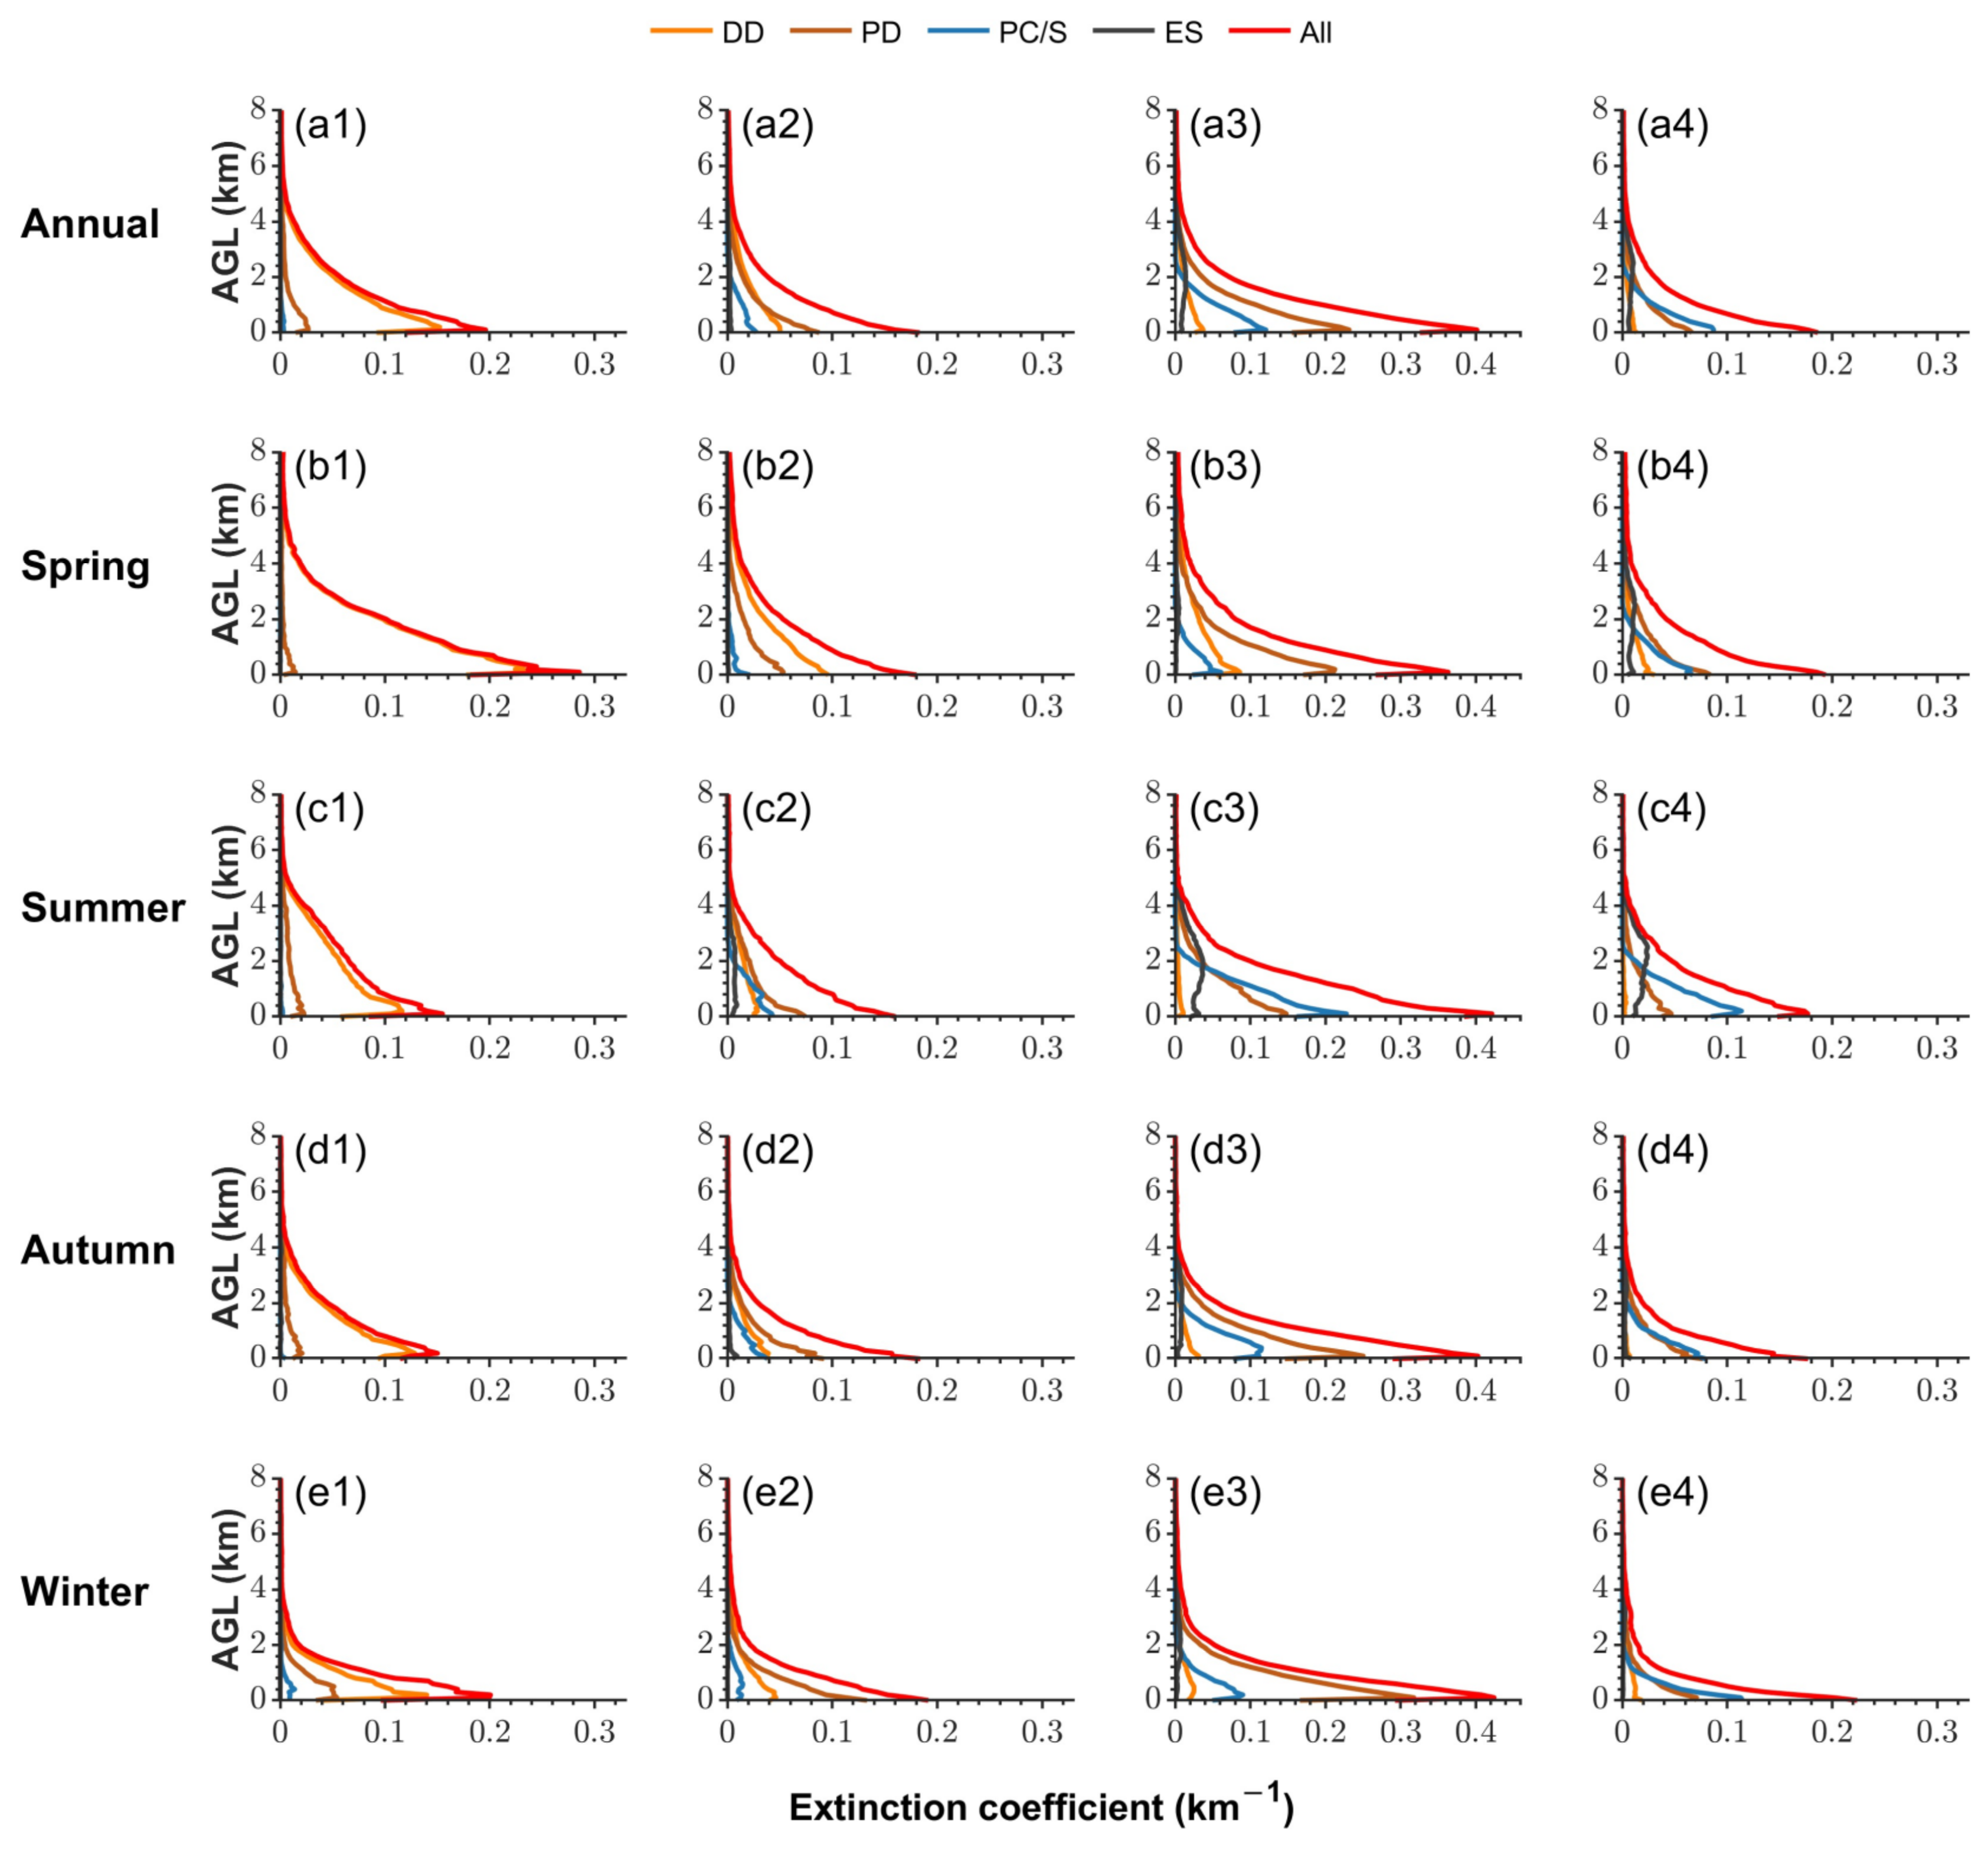
3.1. Distributions of Aerosol Types
3.2. Aerosol Radiative Effects
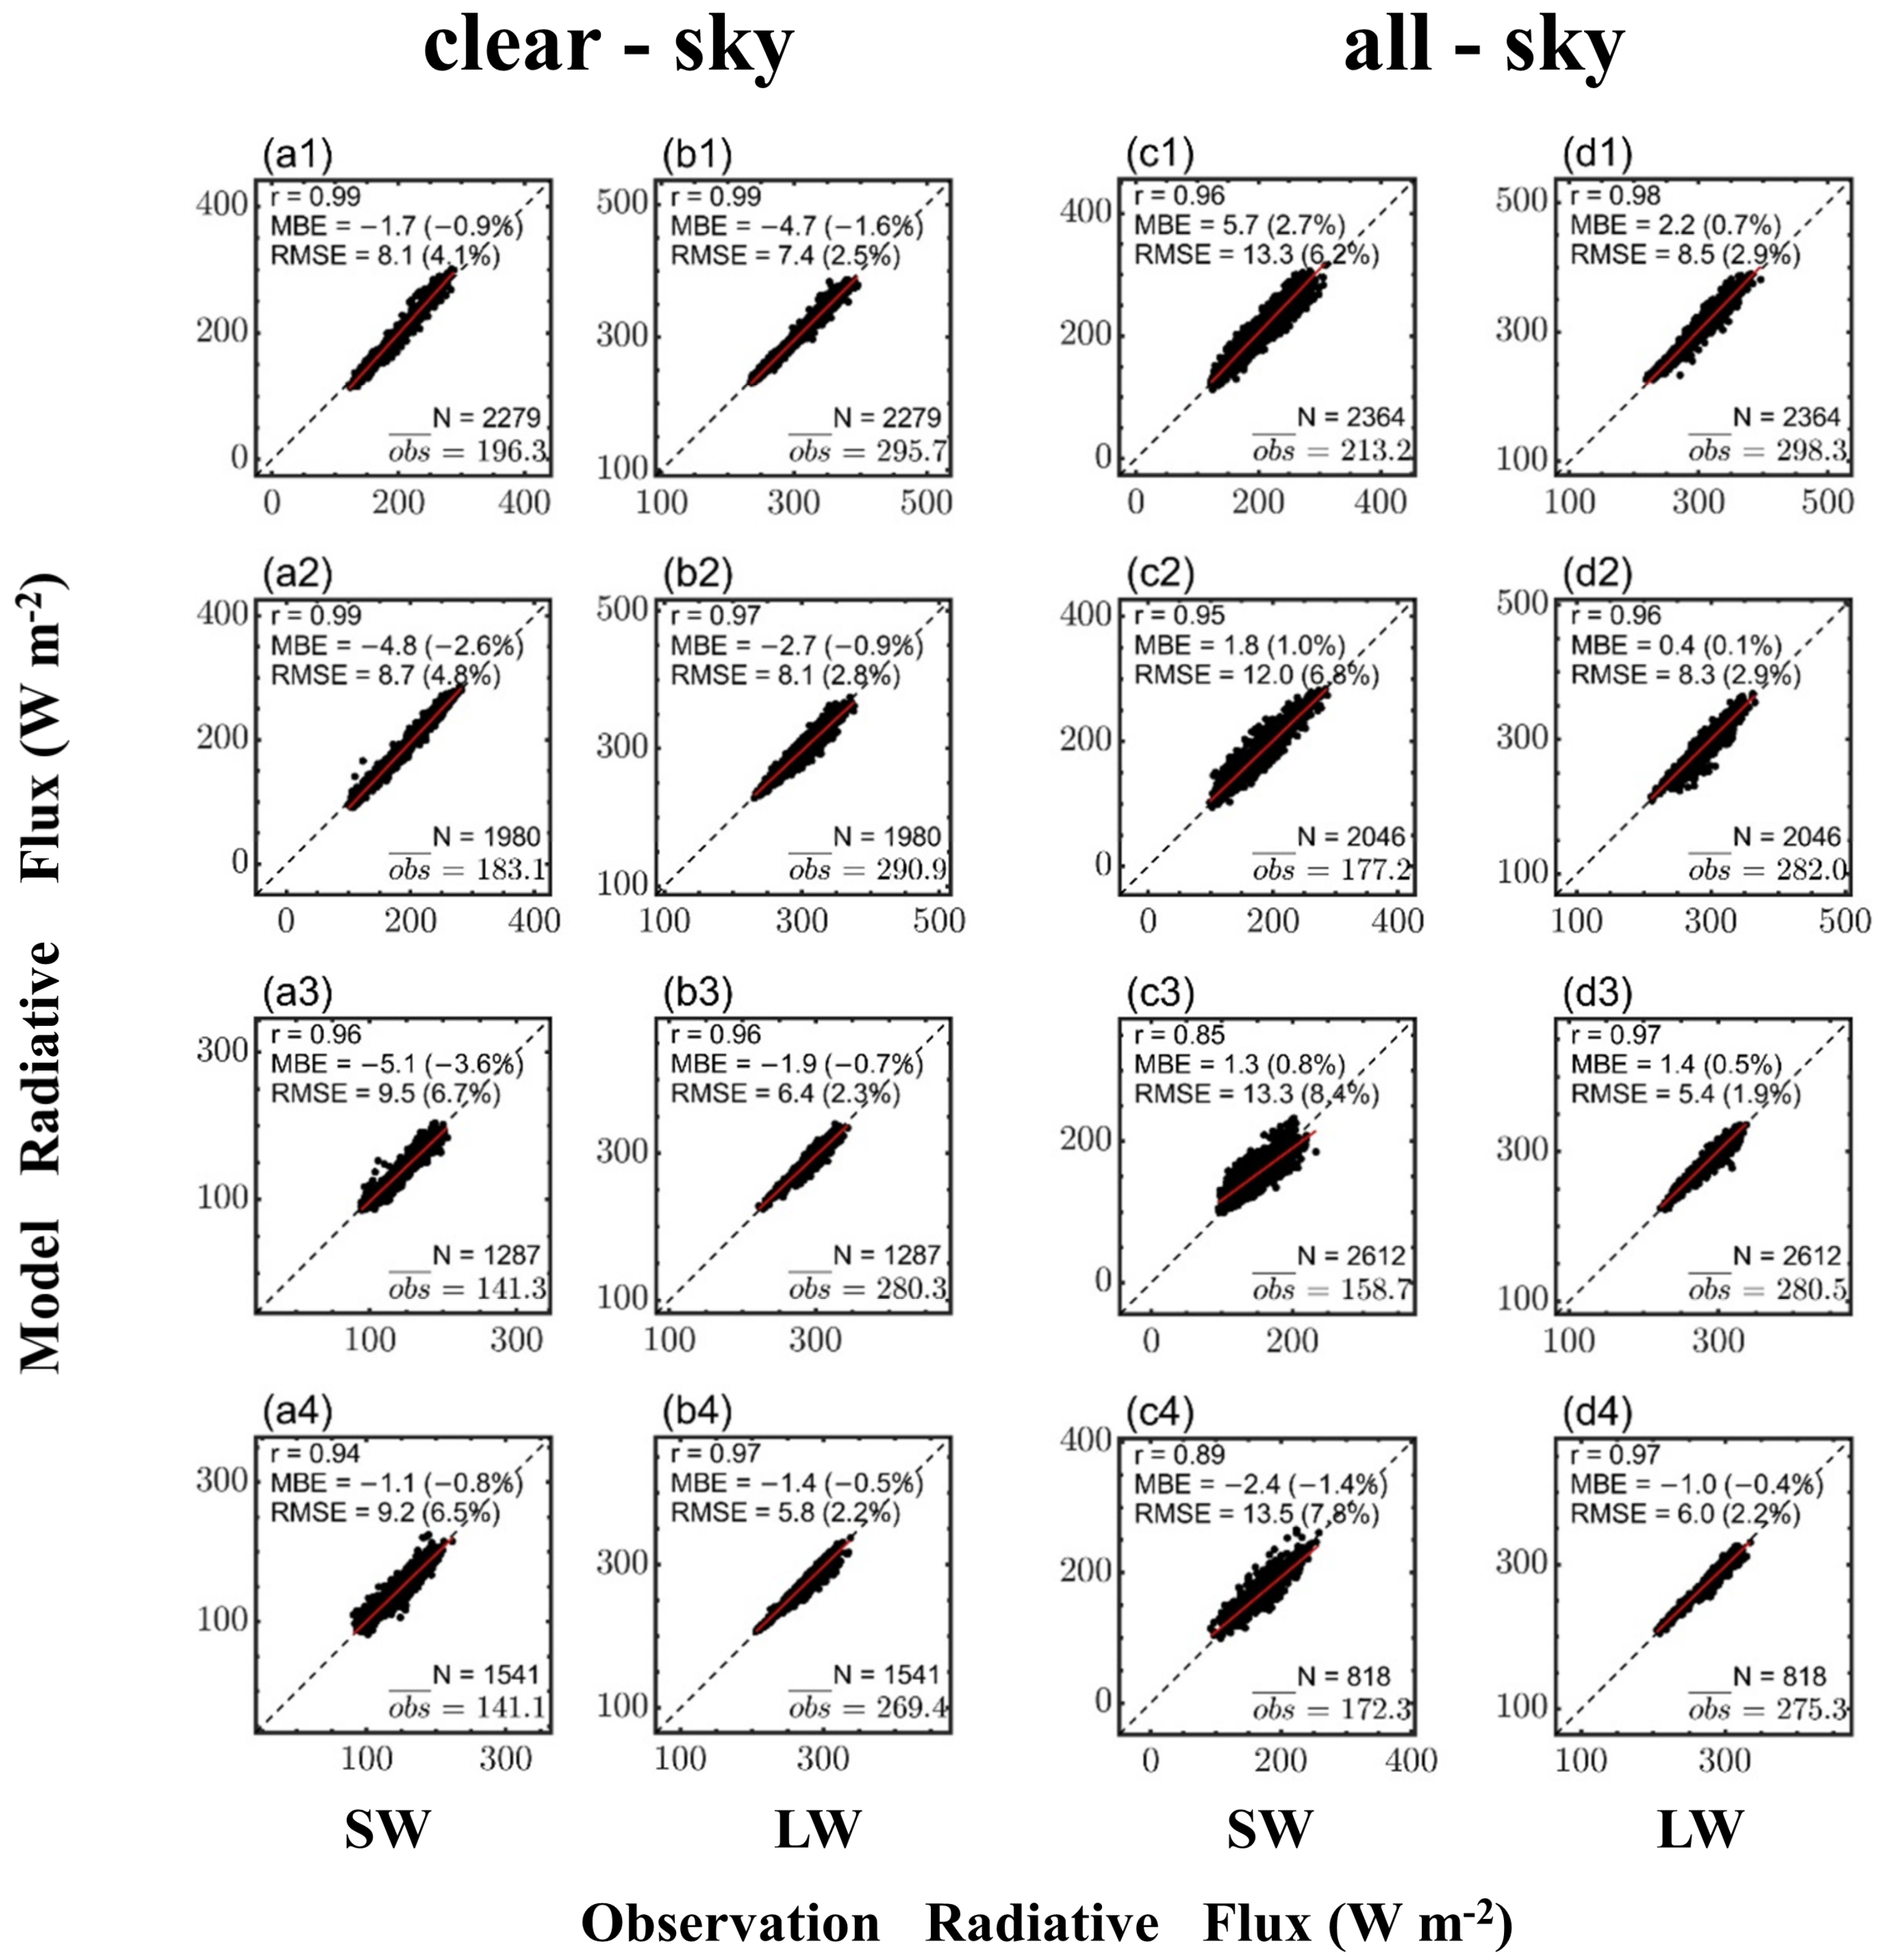
3.2.1. Radiative Closure Experiment
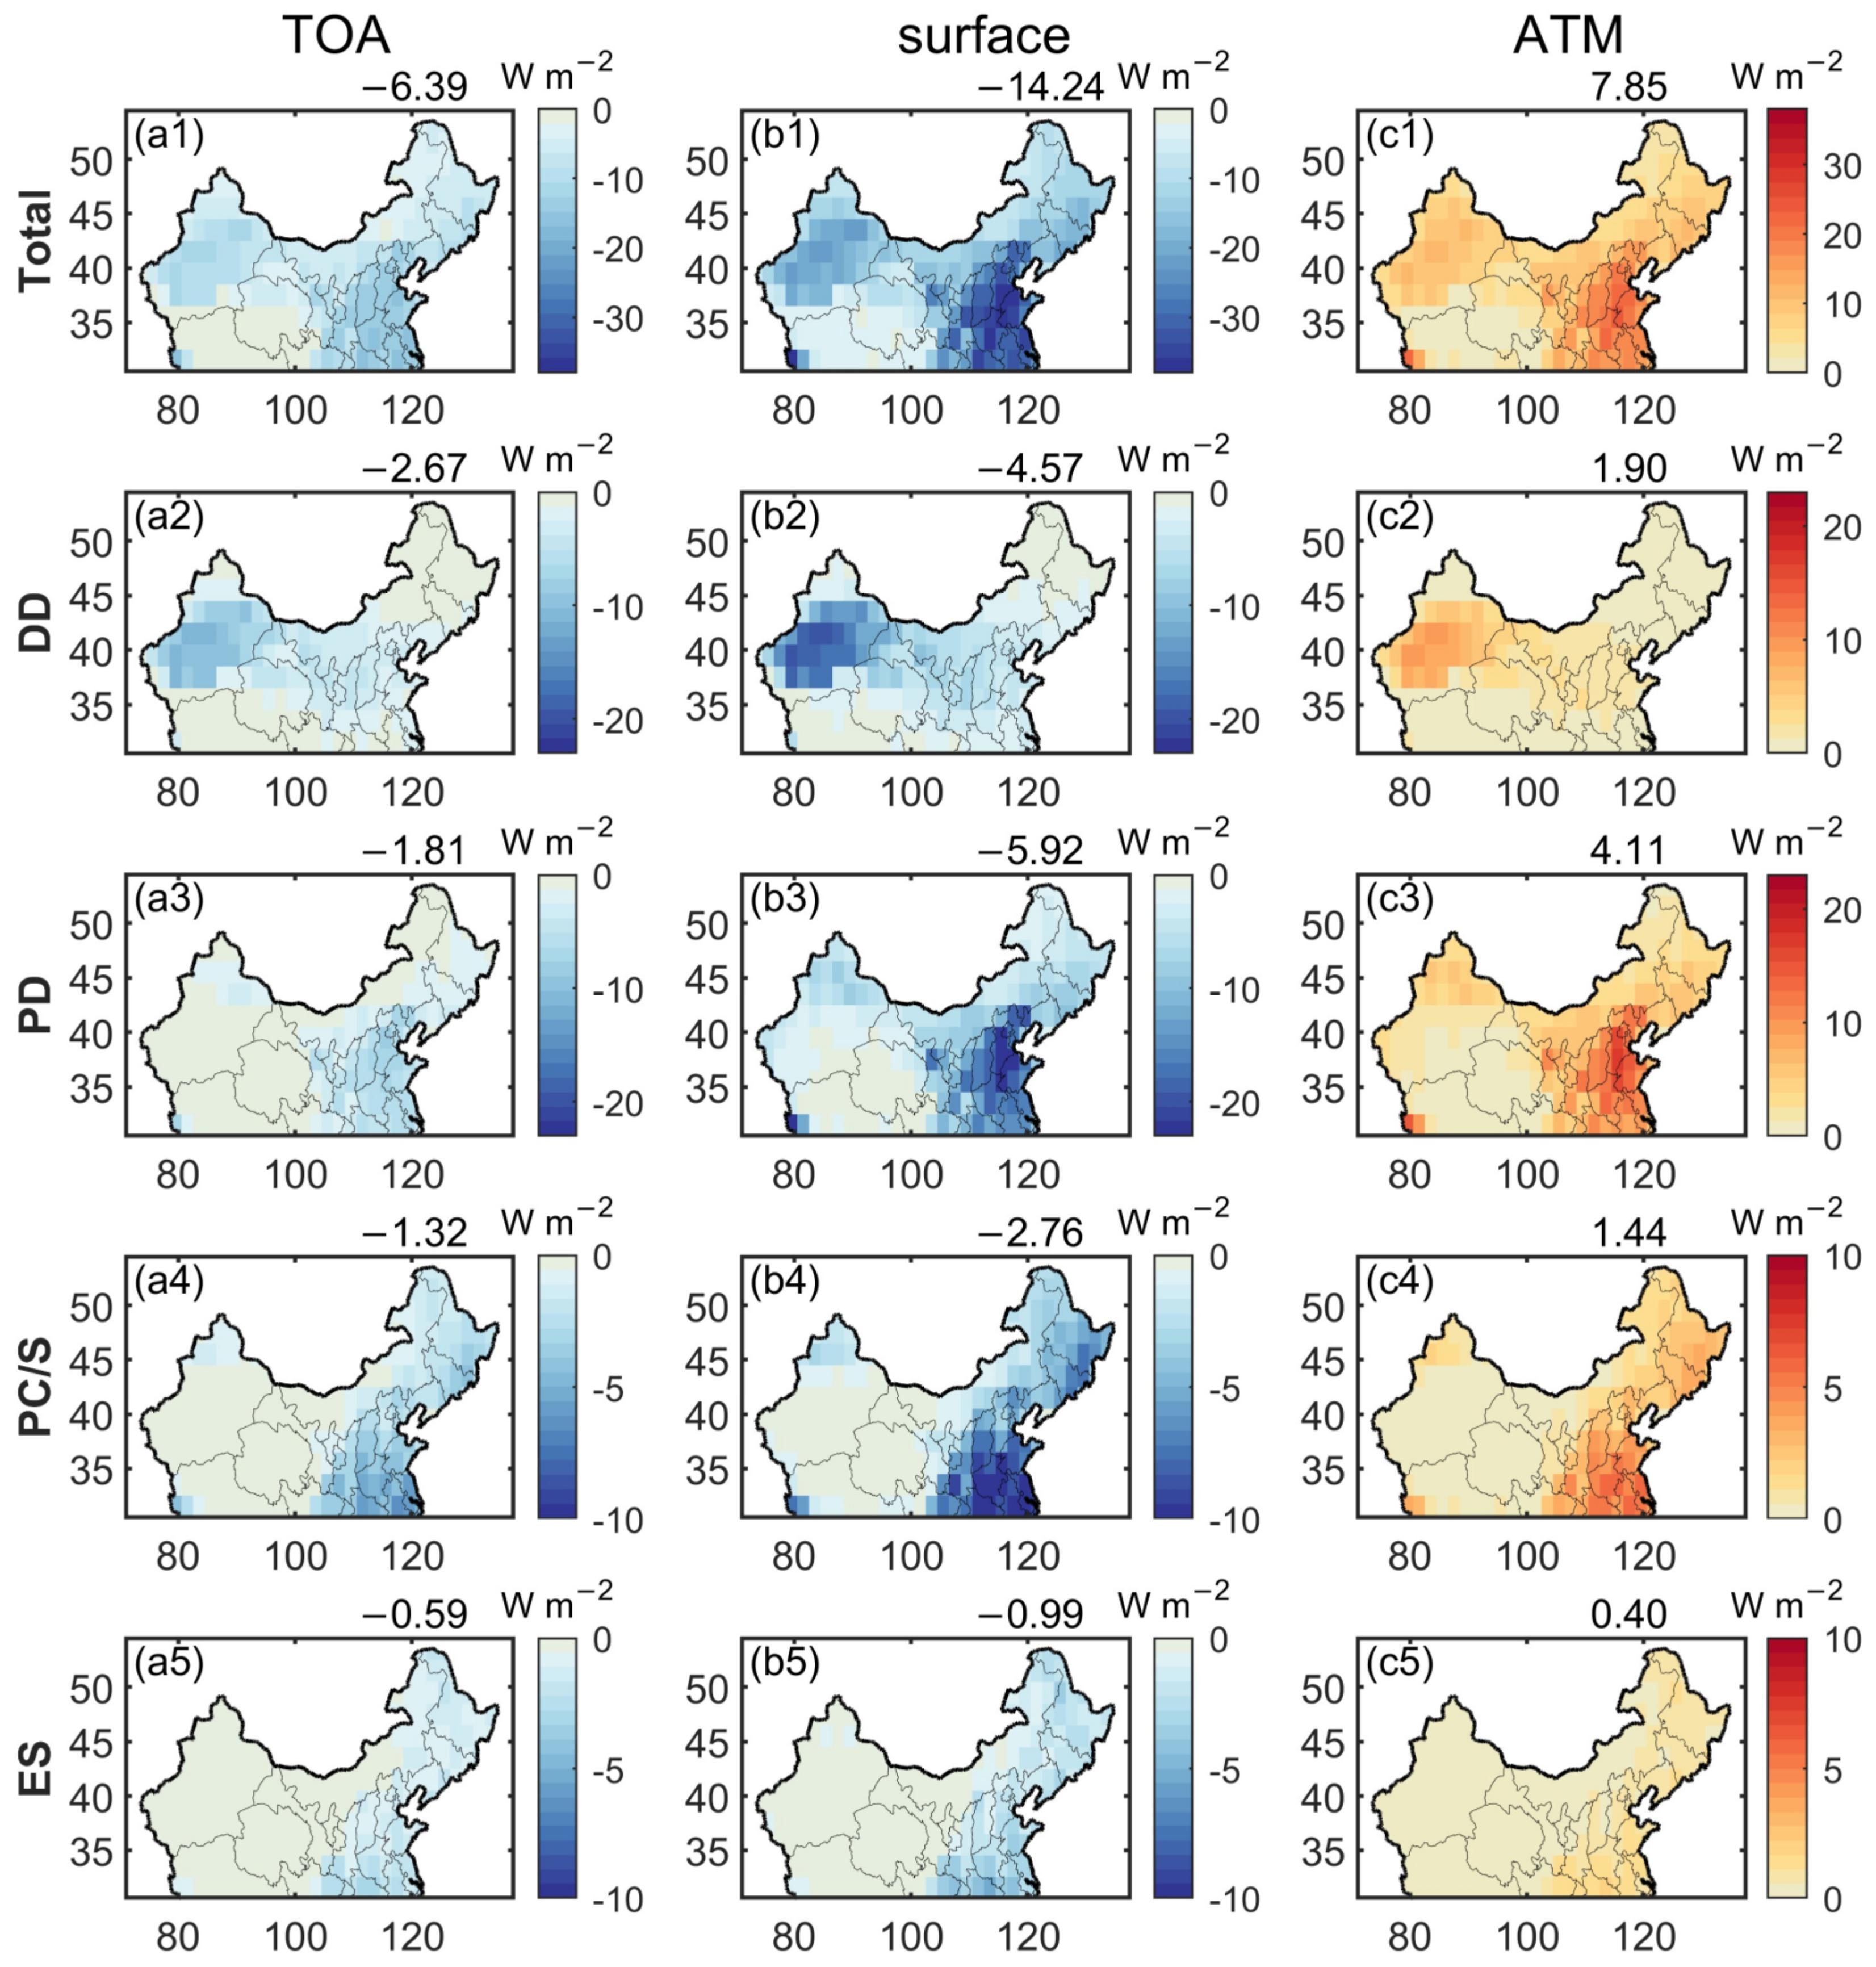
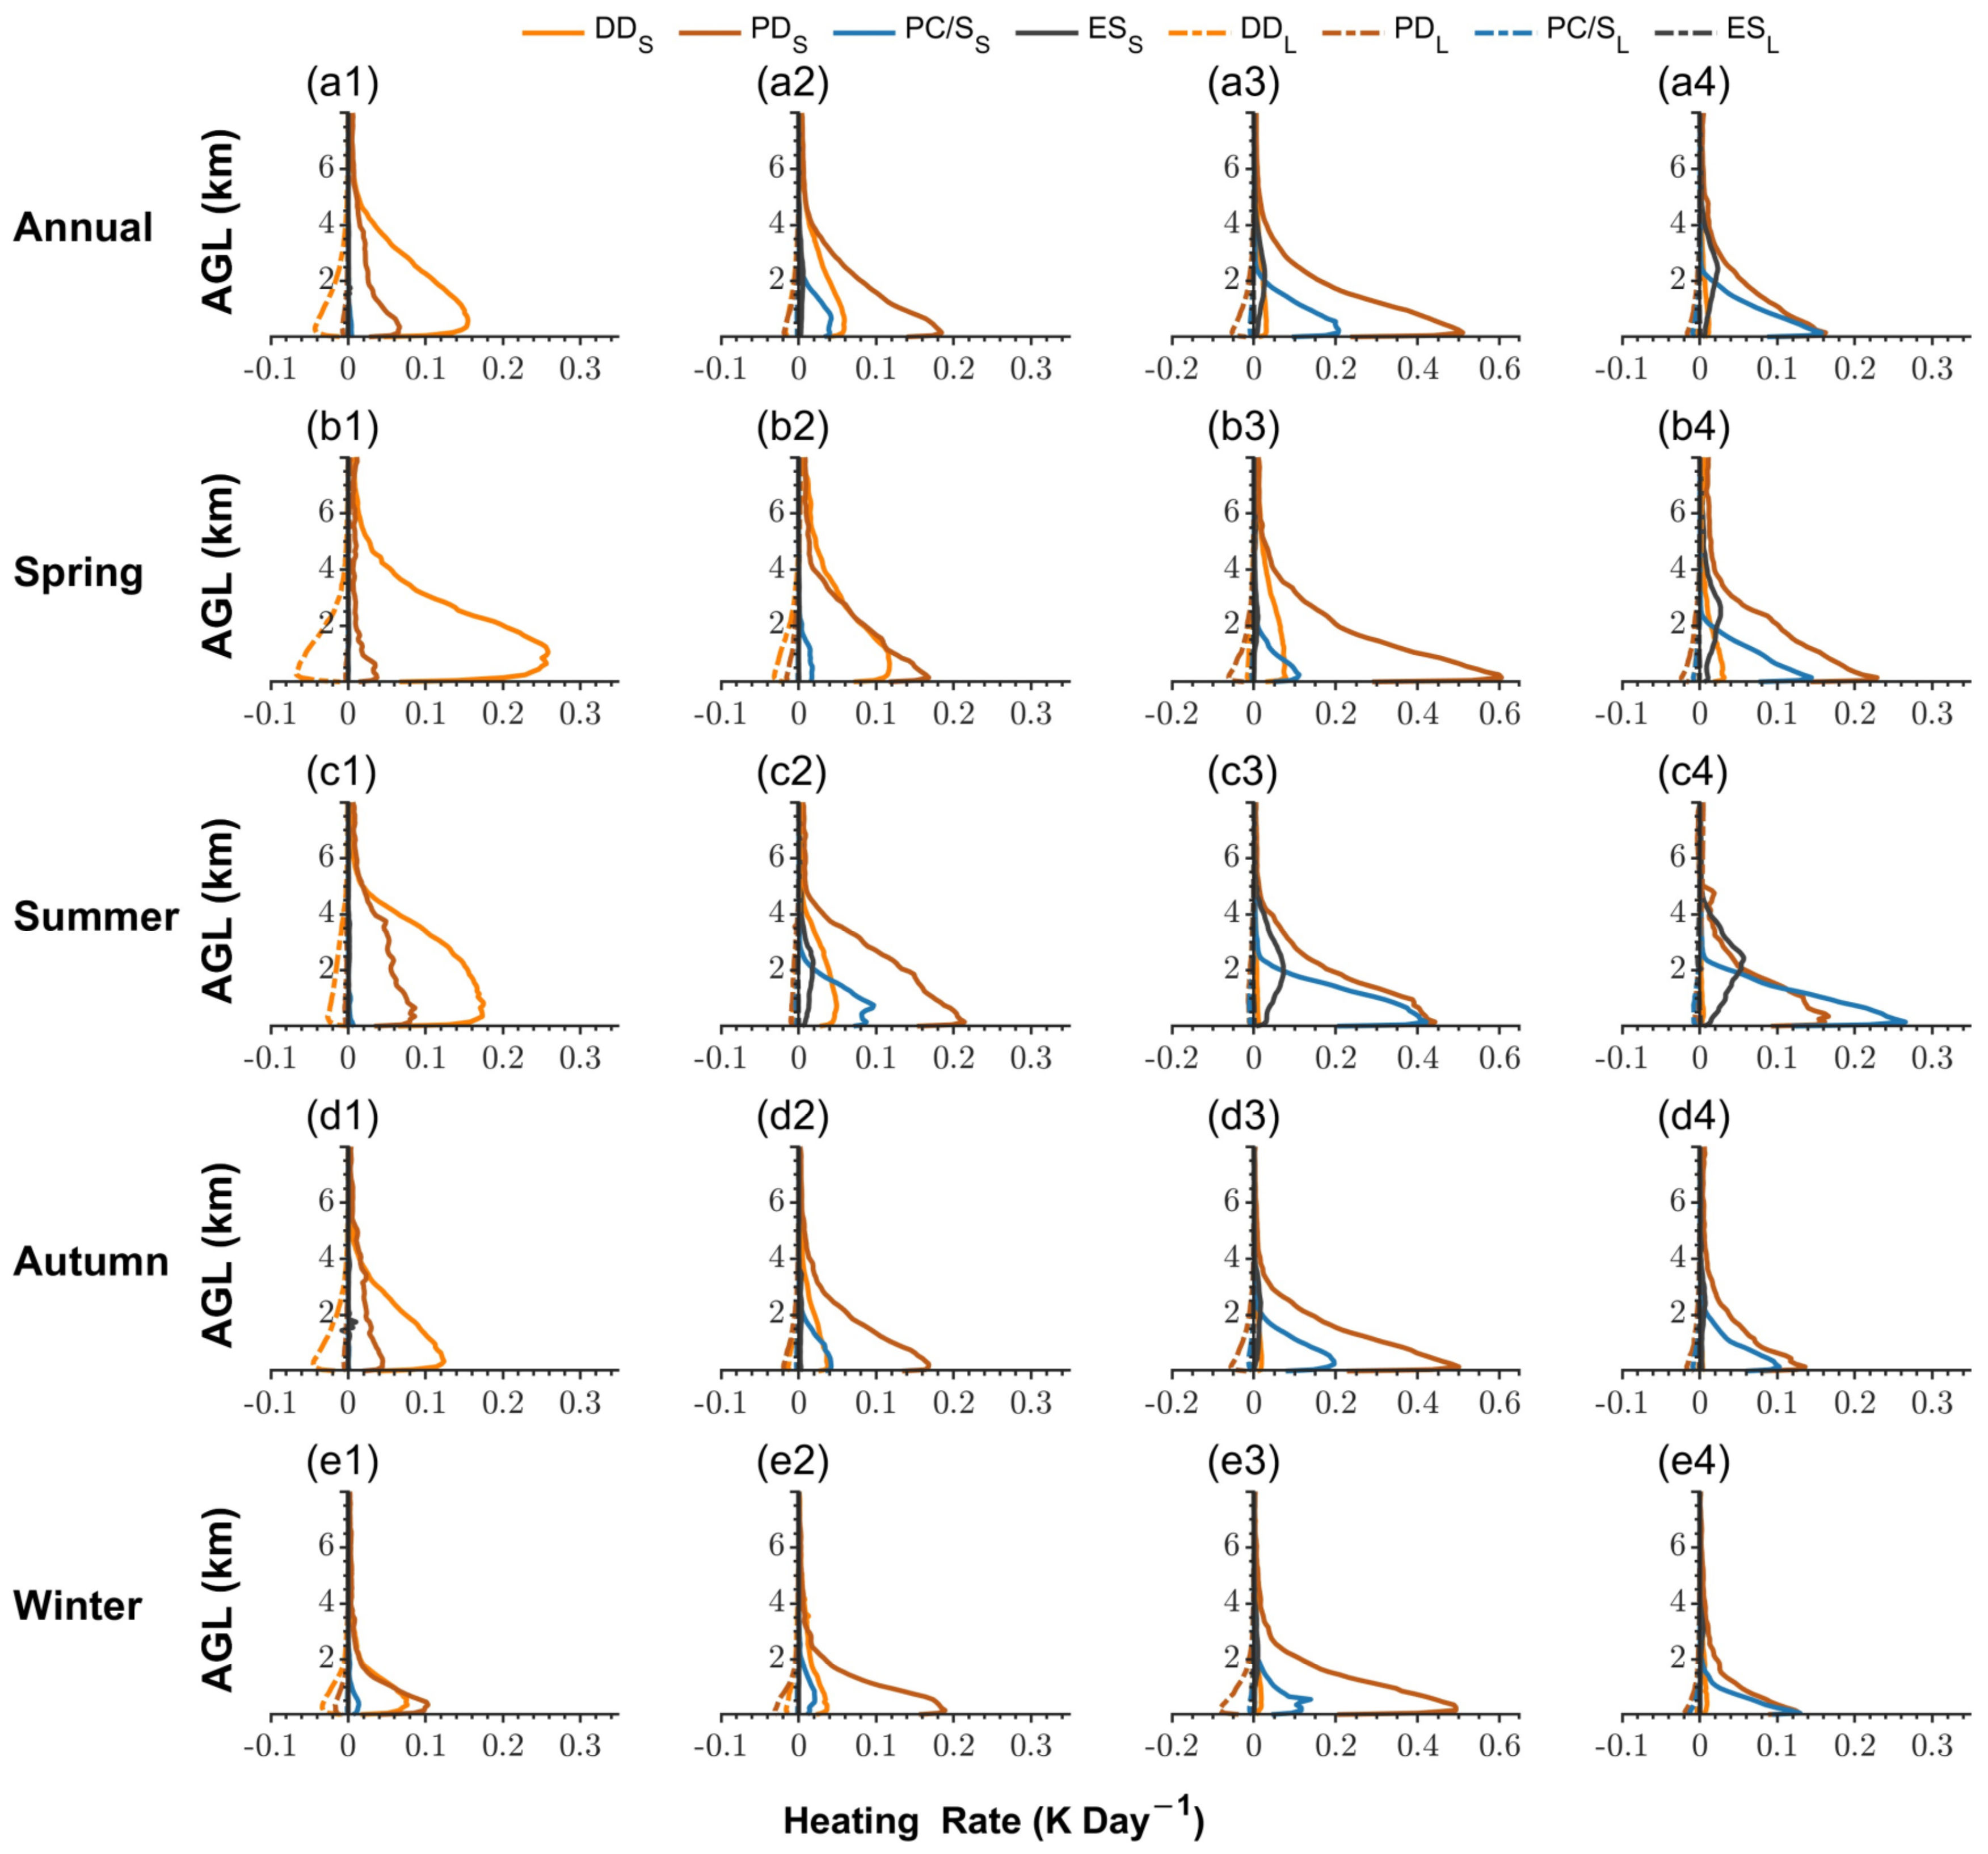
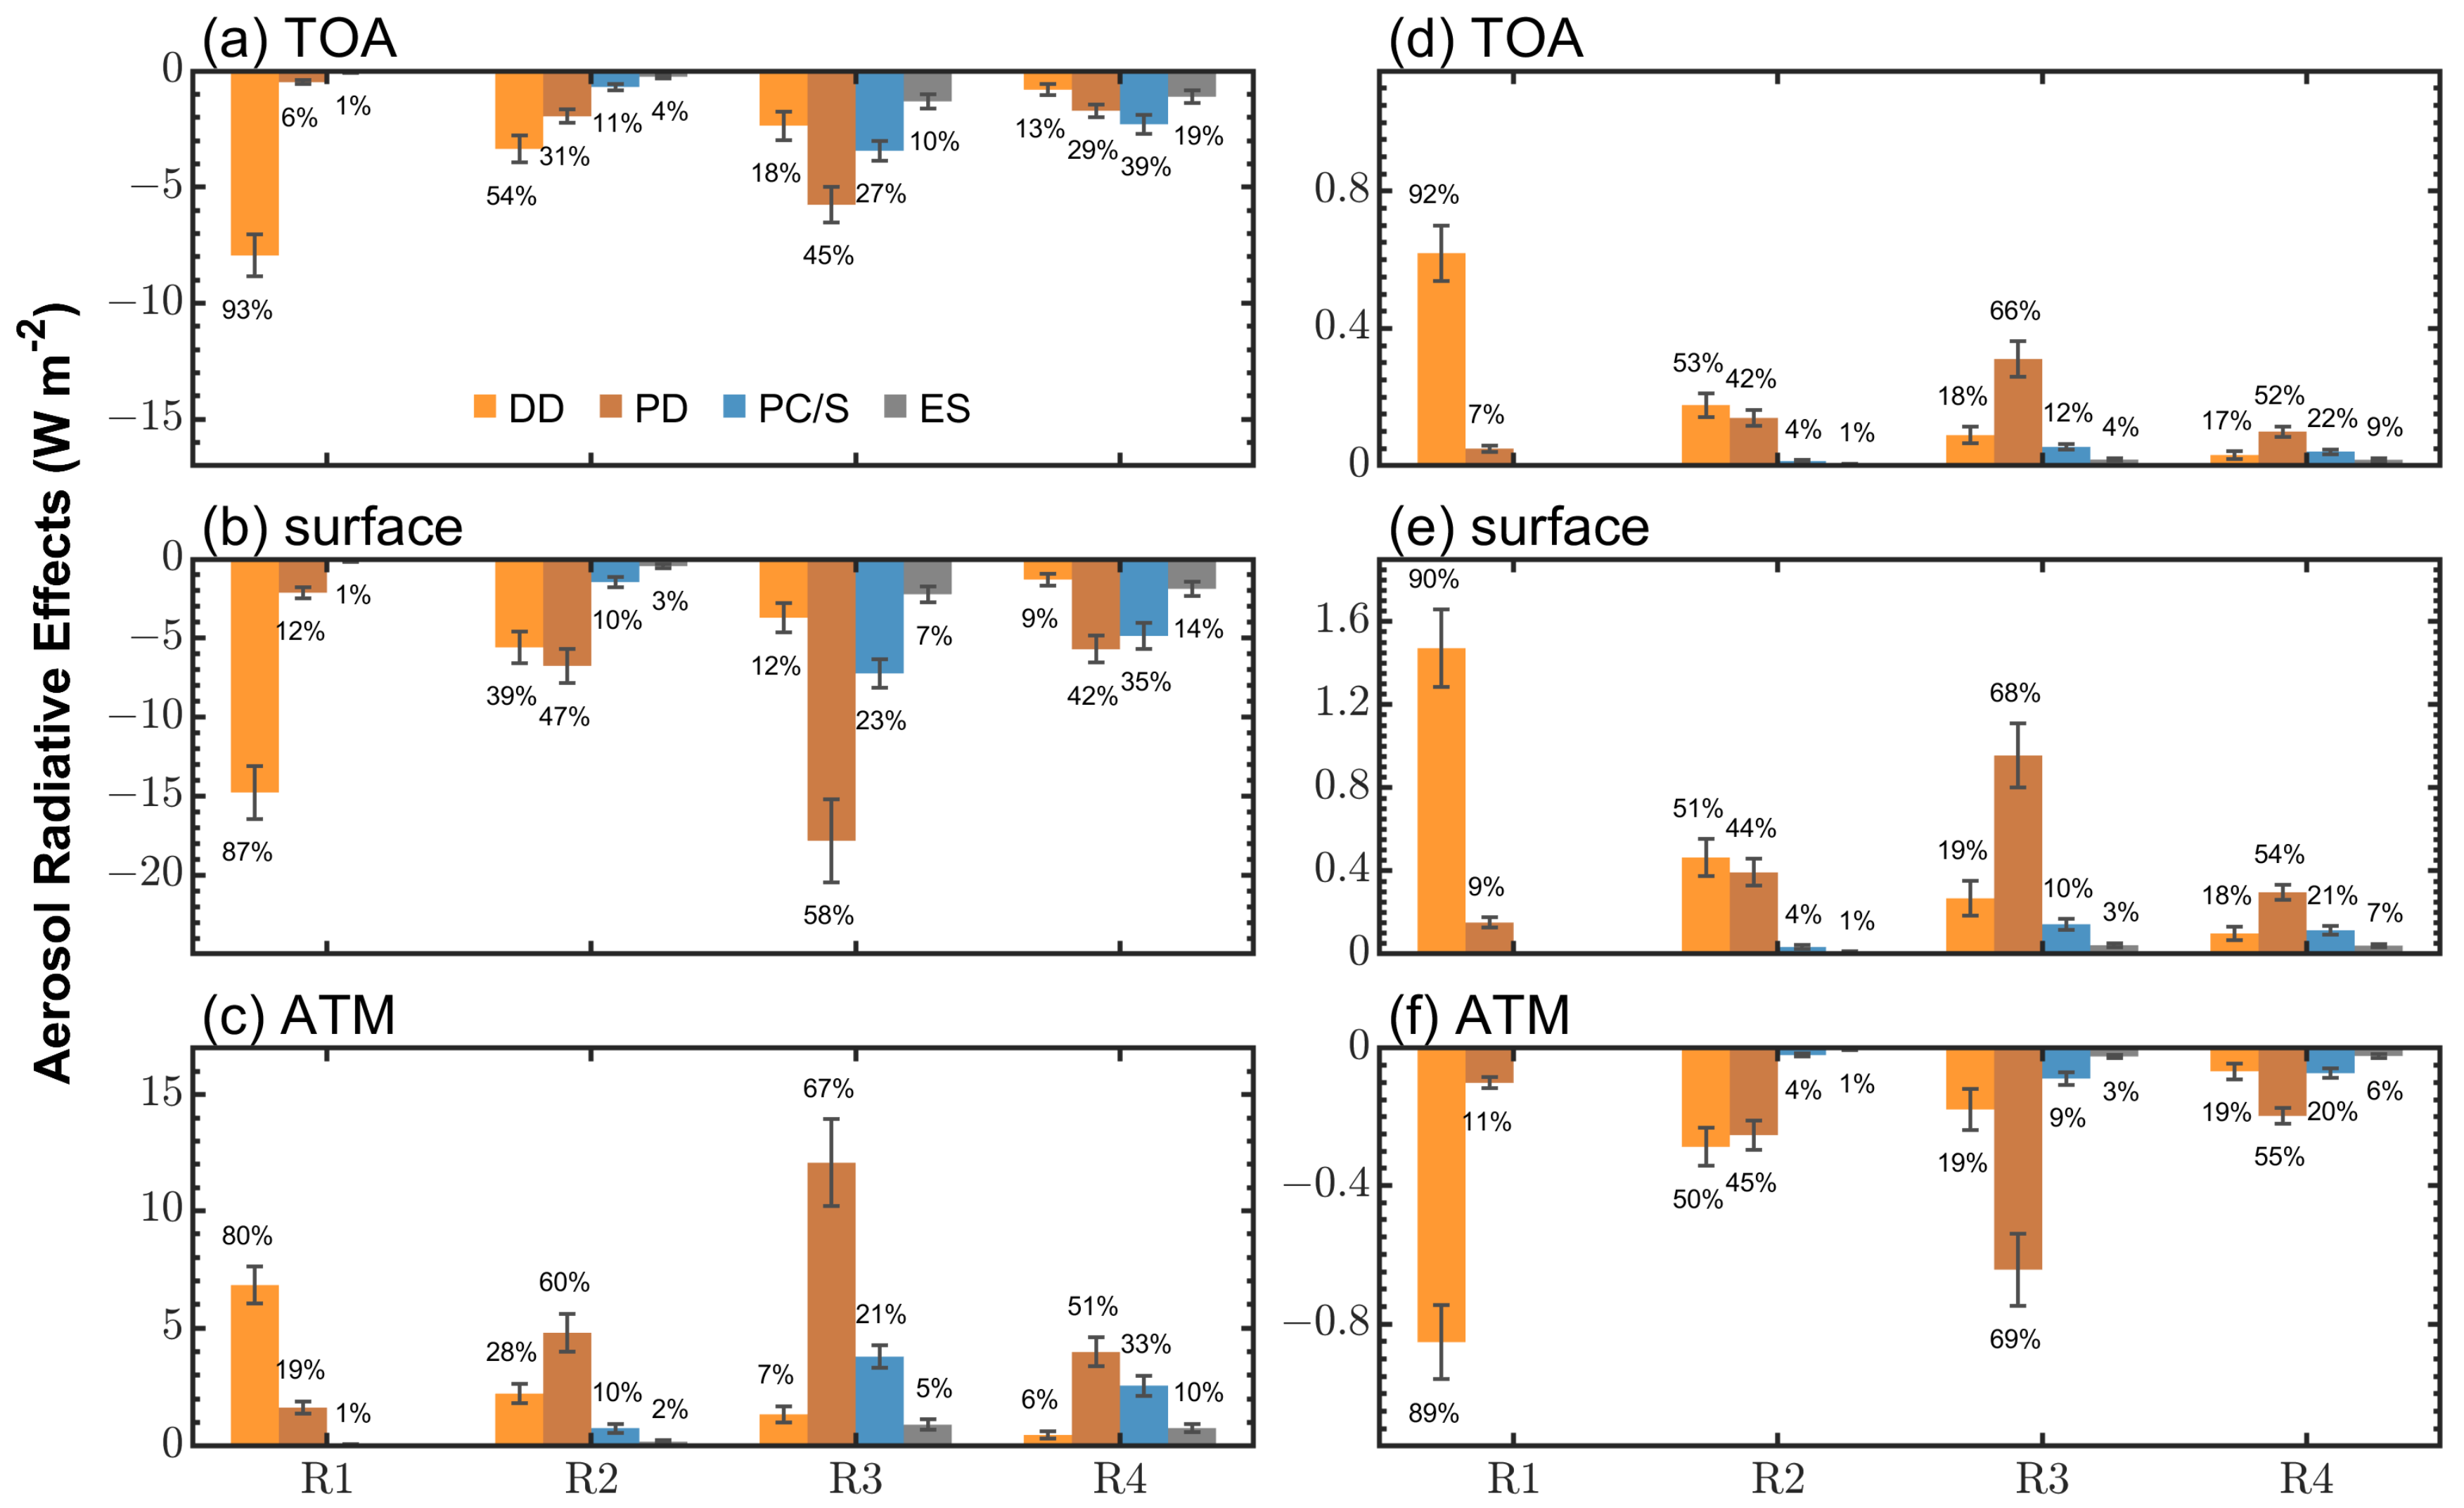
3.2.2. Distributions of ADRE and Aerosol Heating Rate
4. Discussion and Conclusions
Supplementary Materials
Author Contributions
Funding
Data Availability Statement
Acknowledgments
Conflicts of Interest
References
- Twomey, S. The Influence of Pollution on the Shortwave Albedo of Clouds. J. Atmos. Sci. 1977, 34, 1149–1152. [Google Scholar] [CrossRef]
- Charlson, R.J.; Schwartz, S.E.; Hales, J.M.; Cess, R.D.; Coakley, J.A.; Hansen, J.E.; Hofmann, D.J. Climate Forcing by Anthropogenic Aerosols. Science 1992, 255, 423–430. [Google Scholar] [CrossRef]
- Huang, J.; Fu, Q.; Su, J.; Tang, Q.; Minnis, P.; Hu, Y.; Yi, Y.; Zhao, Q. Taklimakan Dust Aerosol Radiative Heating Derived from CALIPSO Observations Using the Fu-Liou Radiation Model with CERES Constraints. Atmos. Chem. Phys. 2009, 9, 4011–4021. [Google Scholar] [CrossRef]
- Storelvmo, T.; Leirvik, T.; Lohmann, U.; Phillips, P.C.B.; Wild, M. Disentangling Greenhouse Warming and Aerosol Cooling to Reveal Earth’s Climate Sensitivity. Nat. Geosci. 2016, 9, 286–289. [Google Scholar] [CrossRef]
- Li, Z.; Lee, K.-H.; Wang, Y.; Xin, J.; Hao, W.-M. First Observation-Based Estimates of Cloud-Free Aerosol Radiative Forcing across China. J. Geophys. Res. Atmos. 2010, 115, 1–9. [Google Scholar] [CrossRef]
- Kuniyal, J.C.; Guleria, R.P. The Current State of Aerosol-Radiation Interactions: A Mini Review. J. Aerosol Sci. 2019, 130, 45–54. [Google Scholar] [CrossRef]
- Xu, X.; Wang, J.; Wang, Y.; Zeng, J.; Torres, O.; Reid, J.S.; Miller, S.D.; Martins, J.V.; Remer, L.A. Detecting Layer Height of Smoke Aerosols over Vegetated Land and Water Surfaces via Oxygen Absorption Bands: Hourly Results from EPIC/DSCOVR in Deep Space. Atmos. Meas. Tech. 2019, 12, 3269–3288. [Google Scholar] [CrossRef]
- Li, J.; Carlson, B.E.; Yung, Y.L.; Lv, D.; Hansen, J.; Penner, J.E.; Liao, H.; Ramaswamy, V.; Kahn, R.A.; Zhang, P.; et al. Scattering and Absorbing Aerosols in the Climate System. Nat. Rev. Earth Environ. 2022, 3, 363–379. [Google Scholar] [CrossRef]
- Chlek, P.; Coakley, J.A. Aerosols and Climate. Science 1974, 183, 75–77. [Google Scholar] [CrossRef]
- Rajesh, T.A.; Ramachandran, S. Spatial, Seasonal, and Altitudinal Heterogeneity in Single Scattering Albedo of Aerosols over an Urban and a Remote Site: Radiative Implications. Atmos. Environ. 2019, 218, 116954. [Google Scholar] [CrossRef]
- Khan, R.; Kumar, K.R.; Zhao, T.; Ali, G. The Contribution of Different Aerosol Types to Direct Radiative Forcing over Distinct Environments of Pakistan Inferred from the AERONET Data. Environ. Res. Lett. 2020, 15, 114062. [Google Scholar] [CrossRef]
- Srivastava, A.K.; Mehrotra, B.J.; Singh, A.; Singh, V.; Bisht, D.S.; Tiwari, S.; Srivastava, M.K. Implications of Different Aerosol Species to Direct Radiative Forcing and Atmospheric Heating Rate. Atmos. Environ. 2020, 241, 117820. [Google Scholar] [CrossRef]
- Song, S.-K.; Choi, Y.-N.; Choi, Y.; Flynn, J.; Sadeghi, B. Characteristics of Aerosol Chemical Components and Their Impacts on Direct Radiative Forcing at Urban and Suburban Locations in Southeast Texas. Atmos. Environ. 2021, 246, 118151. [Google Scholar] [CrossRef]
- Yang, Y.; Wang, H.; Smith, S.J.; Easter, R.; Ma, P.-L.; Qian, Y.; Yu, H.; Li, C.; Rasch, P.J. Global Source Attribution of Sulfate Concentration and Direct and Indirect Radiative Forcing. Atmos. Chem. Phys. 2017, 17, 8903–8922. [Google Scholar] [CrossRef]
- Suzuki, K.; Takemura, T. Perturbations to Global Energy Budget Due to Absorbing and Scattering Aerosols. J. Geophys. Res. Atmos. 2019, 124, 2194–2209. [Google Scholar] [CrossRef]
- Wang, Q.; Jacob, D.J.; Spackman, J.R.; Perring, A.E.; Schwarz, J.P.; Moteki, N.; Marais, E.A.; Ge, C.; Wang, J.; Barrett, S.R.H. Global Budget and Radiative Forcing of Black Carbon Aerosol: Constraints from Pole-to-Pole (HIPPO) Observations across the Pacific. J. Geophys. Res. Atmos. 2014, 119, 195–206. [Google Scholar] [CrossRef]
- Kaspari, S.; Painter, T.H.; Gysel, M.; Skiles, S.M.; Schwikowski, M. Seasonal and Elevational Variations of Black Carbon and Dust in Snow and Ice in the Solu-Khumbu, Nepal and Estimated Radiative Forcings. Atmos. Chem. Phys. 2014, 14, 8089–8103. [Google Scholar] [CrossRef]
- Shi, T.; Pu, W.; Zhou, Y.; Cui, J.; Zhang, D.; Wang, X. Albedo of Black Carbon-Contaminated Snow Across Northwestern China and the Validation With Model Simulation. J. Geophys. Res. Atmos. 2020, 125, e2019JD032065. [Google Scholar] [CrossRef]
- Di Biagio, C.; Formenti, P.; Balkanski, Y.; Caponi, L.; Cazaunau, M.; Pangui, E.; Journet, E.; Nowak, S.; Andreae, M.O.; Kandler, K.; et al. Complex Refractive Indices and Single-Scattering Albedo of Global Dust Aerosols in the Shortwave Spectrum and Relationship to Size and Iron Content. Atmos. Chem. Phys. 2019, 19, 15503–15531. [Google Scholar] [CrossRef]
- Su, L.; Toon, O.B. Saharan and Asian Dust: Similarities and Differences Determined by CALIPSO, AERONET, and a Coupled Climate-Aerosol Microphysical Model. Atmos. Chem. Phys. 2011, 11, 3263–3280. [Google Scholar] [CrossRef]
- Ramanathan, V.; Crutzen, P.J.; Kiehl, J.T.; Rosenfeld, D. Aerosols, Climate, and the Hydrological Cycle. Science 2001, 294, 2119–2124. [Google Scholar] [CrossRef] [PubMed]
- Tie, X.; Cao, J. Aerosol Pollution in China: Present and Future Impact on Environment. Particuology 2009, 7, 426–431. [Google Scholar] [CrossRef]
- Hu, B.; Zhao, X.; Liu, H.; Liu, Z.; Song, T.; Wang, Y.; Tang, L.; Xia, X.; Tang, G.; Ji, D.; et al. Quantification of the Impact of Aerosol on Broadband Solar Radiation in North China. Sci. Rep. 2017, 7, 44851. [Google Scholar] [CrossRef] [PubMed]
- Saikawa, E.; Naik, V.; Horowitz, L.W.; Liu, J.; Mauzerall, D.L. Present and Potential Future Contributions of Sulfate, Black and Organic Carbon Aerosols from China to Global Air Quality, Premature Mortality and Radiative Forcing. Atmos. Environ. 2009, 43, 2814–2822. [Google Scholar] [CrossRef]
- Westervelt, D.M.; Horowitz, L.W.; Naik, V.; Golaz, J.-C.; Mauzerall, D.L. Radiative Forcing and Climate Response to Projected 21st Century Aerosol Decreases. Atmos. Chem. Phys. 2015, 15, 12681–12703. [Google Scholar] [CrossRef]
- Breider, T.J.; Mickley, L.J.; Jacob, D.J.; Ge, C.; Wang, J.; Payer Sulprizio, M.; Croft, B.; Ridley, D.A.; McConnell, J.R.; Sharma, S.; et al. Multidecadal Trends in Aerosol Radiative Forcing over the Arctic: Contribution of Changes in Anthropogenic Aerosol to Arctic Warming since 1980. J. Geophys. Res. Atmos. 2017, 122, 3573–3594. [Google Scholar] [CrossRef]
- Zhou, H.; Yue, X.; Lei, Y.; Tian, C.; Zhu, J.; Ma, Y.; Cao, Y.; Yin, X.; Zhang, Z. Distinguishing the Impacts of Natural and Anthropogenic Aerosols on Global Gross Primary Productivity through Diffuse Fertilization Effect. Atmos. Chem. Phys. 2022, 22, 693–709. [Google Scholar] [CrossRef]
- Valenzuela, A.; Costa, M.J.; Guerrero-Rascado, J.L.; Bortoli, D.; Olmo, F.J. Solar and Thermal Radiative Effects during the 2011 Extreme Desert Dust Episode over Portugal. Atmos. Environ. 2017, 148, 16–29. [Google Scholar] [CrossRef]
- Yu, L.; Zhang, M.; Wang, L.; Qin, W.; Li, J. Aerosol Radiative Effects from Observations and Modelling over the Yangtze River Basin, China from 2001 to 2015. Int. J. Climatol. 2019, 39, 3476–3491. [Google Scholar] [CrossRef]
- Zhang, X.; Zhou, Y. Aerosol Direct Radiative Forcing over China: A 40-Year MERRA-2-Based Evaluation. Atmos. Environ. 2023, 299, 119659. [Google Scholar] [CrossRef]
- Fu, Y.; Zhu, J.; Yang, Y.; Yuan, R.; Liu, G.; Xian, T.; Liu, P. Grid-Cell Aerosol Direct Shortwave Radiative Forcing Calculated Using the SBDART Model with MODIS and AERONET Observations: An Application in Winter and Summer in Eastern China. Adv. Atmos. Sci. 2017, 34, 952–964. [Google Scholar] [CrossRef]
- Wang, Y.; Lyu, R.; Xie, X.; Meng, Z.; Huang, M.; Wu, J.; Mu, H.; Yu, Q.-R.; He, Q.; Cheng, T. Retrieval of Gridded Aerosol Direct Radiative Forcing Based on Multiplatform Datasets. Atmos. Meas. Tech. 2020, 13, 575–592. [Google Scholar] [CrossRef]
- Filonchyk, M.; Yan, H.; Zhang, Z. Analysis of Spatial and Temporal Variability of Aerosol Optical Depth over China Using MODIS Combined Dark Target and Deep Blue Product. Theor. Appl. Climatol. 2019, 137, 2271–2288. [Google Scholar] [CrossRef]
- Jiang, X.; Hong, C.; Zheng, Y.; Zheng, B.; Guan, D.; Gouldson, A.; Zhang, Q.; He, K. To What Extent Can China’s near-Term Air Pollution Control Policy Protect Air Quality and Human Health? A Case Study of the Pearl River Delta Region. Environ. Res. Lett. 2015, 10, 104006. [Google Scholar] [CrossRef]
- Hu, Z.; Jin, Q.; Ma, Y.; Pu, B.; Ji, Z.; Wang, Y.; Dong, W. Temporal Evolution of Aerosols and Their Extreme Events in Polluted Asian Regions during Terra’s 20-Year Observations. Remote Sens. Environ. 2021, 263, 112541. [Google Scholar] [CrossRef]
- Liu, M.; Matsui, H. Aerosol Radiative Forcings Induced by Substantial Changes in Anthropogenic Emissions in China from 2008 to 2016. Atmos. Chem. Phys. 2021, 21, 5965–5982. [Google Scholar] [CrossRef]
- Xue, W.; Zhang, J.; Zhong, C.; Li, X.; Wei, J. Spatiotemporal PM2.5 Variations and Its Response to the Industrial Structure from 2000 to 2018 in the Beijing-Tianjin-Hebei Region. J. Clean. Prod. 2021, 279, 123742. [Google Scholar] [CrossRef]
- Han, X.; Cao, T. Urbanization Level, Industrial Structure Adjustment and Spatial Effect of Urban Haze Pollution: Evidence from China’s Yangtze River Delta Urban Agglomeration. Atmos. Pollut. Res. 2022, 13, 101427. [Google Scholar] [CrossRef]
- Liu, X.; Guo, C.; Wu, Y.; Huang, C.; Lu, K.; Zhang, Y.; Duan, L.; Cheng, M.; Chai, F.; Mei, F.; et al. Evaluating Cost and Benefit of Air Pollution Control Policies in China: A Systematic Review. J. Environ. Sci. 2023, 123, 140–155. [Google Scholar] [CrossRef]
- Han, X.; Zhao, B.; Lin, Y.; Chen, Q.; Shi, H.; Jiang, Z.; Fan, X.; Wang, J.; Liou, K.-N.; Gu, Y. Type-Dependent Impact of Aerosols on Precipitation Associated With Deep Convective Cloud Over East Asia. J. Geophys. Res. Atmos. 2022, 127, e2021JD036127. [Google Scholar] [CrossRef]
- Toth, T.D.; Zhang, J.; Campbell, J.R.; Reid, J.S.; Vaughan, M.A. Temporal Variability of Aerosol Optical Thickness Vertical Distribution Observed from CALIOP. J. Geophys. Res. Atmos. 2016, 121, 9117–9139. [Google Scholar] [CrossRef]
- Lakshmi, N.B.; Nair, V.S.; Suresh Babu, S. Vertical Structure of Aerosols and Mineral Dust Over the Bay of Bengal From Multisatellite Observations. J. Geophys. Res. Atmos. 2017, 122, 12845–12861. [Google Scholar] [CrossRef]
- Zhao, B.; Jiang, J.H.; Diner, D.J.; Su, H.; Gu, Y.; Liou, K.-N.; Jiang, Z.; Huang, L.; Takano, Y.; Fan, X.; et al. Intra-Annual Variations of Regional Aerosol Optical Depth, Vertical Distribution, and Particle Types from Multiple Satellite and Ground-Based Observational Datasets. Atmos. Chem. Phys. 2018, 18, 11247–11260. [Google Scholar] [CrossRef]
- Mehta, M.; Khushboo, R.; Raj, R.; Singh, N. Spaceborne Observations of Aerosol Vertical Distribution over Indian Mainland (2009–2018). Atmos. Environ. 2021, 244, 117902. [Google Scholar] [CrossRef]
- Wei, J.; Peng, Y.; Guo, J.; Sun, L. Performance of MODIS Collection 6.1 Level 3 Aerosol Products in Spatial-Temporal Variations over Land. Atmos. Environ. 2019, 206, 30–44. [Google Scholar] [CrossRef]
- Fu, Q.; Liou, K.N. Parameterization of the Radiative Properties of Cirrus Clouds. J. Atmos. Sci. 1993, 50, 2008–2025. [Google Scholar] [CrossRef]
- Fu, Q.; Liou, K.N. On the Correlated K-Distribution Method for Radiative Transfer in Nonhomogeneous Atmospheres. J. Atmos. Sci. 1992, 49, 2139–2156. [Google Scholar] [CrossRef]
- Rose, F.G.; Charlock, T.P. New Fu-Liou Code Tested with ARM Raman Lidar Aerosols and CERES In Pre-CALIPSO Sensitivity Study. In Proceedings of the 14th Annual Conference on Atmospheric Radiation, Boston, MA, USA, 7–18 July 2002. [Google Scholar]
- Kato, S.; Rose, F.G.; Charlock, T.P. Computation of Domain-Averaged Irradiance Using Satellite-Derived Cloud Properties. J. Atmos. Ocean. Technol. 2005, 22, 146–164. [Google Scholar] [CrossRef]
- Kratz, D.P.; Rose, F.G. Accounting for Molecular Absorption within the Spectral Range of the Ceres Window Channel. J. Quant. Spectrosc. Radiat. Transf. 1999, 61, 83–95. [Google Scholar] [CrossRef]
- Su, J.; Huang, J.; Fu, Q.; Minnis, P.; Ge, J.; Bi, J. Estimation of Asian Dust Aerosol Effect on Cloud Radiation Forcing Using Fu-Liou Radiative Model and CERES Measurements. Atmos. Chem. Phys. 2008, 8, 2763–2771. [Google Scholar] [CrossRef]
- Markowicz, K.M.; Lisok, J.; Xian, P. Simulations of the Effect of Intensive Biomass Burning in July 2015 on Arctic Radiative Budget. Atmos. Environ. 2017, 171, 248–260. [Google Scholar] [CrossRef]
- Lu, X.; Mao, F.; Pan, Z.; Gong, W.; Zhu, Y.; Yang, J. Enhancement of Atmospheric Stability by Anomalous Elevated Aerosols During Winter in China. J. Geophys. Res. Atmos. 2020, 125, e2019JD031734. [Google Scholar] [CrossRef]
- Balmes, K.A.; Fu, Q. All-Sky Aerosol Direct Radiative Effects at the ARM SGP Site. Geophys. Res. Atmos. 2021, 126. [Google Scholar] [CrossRef]
- Wu, X.; Balmes, K.A.; Fu, Q. Aerosol Direct Radiative Effects at the ARM SGP and TWP Sites: Clear Skies. J. Geophys. Res. Atmos. 2021, 126, e2020JD033663. [Google Scholar] [CrossRef]
- Balmes, K.A.; Fu, Q. The Diurnally-Averaged Aerosol Direct Radiative Effect and the Use of the Daytime-Mean and Insolation-Weighted-Mean Solar Zenith Angles. J. Quant. Spectrosc. Radiat. Transf. 2020, 257, 107363. [Google Scholar] [CrossRef]
- He, Q.; Gu, Y.; Zhang, M. Spatiotemporal Patterns of Aerosol Optical Depth throughout China from 2003 to 2016. Sci. Total Environ. 2019, 653, 23–35. [Google Scholar] [CrossRef]
- Meng, L.; Yang, X.; Zhao, T.; He, Q.; Mamtimin, A.; Wang, M.; Huo, W.; Yang, F.; Zhou, C.; Pan, H. Simulated Regional Transport Structures and Budgets of Dust Aerosols during a Typical Springtime Dust Storm in the Tarim Basin, Northwest China. Atmos. Res. 2020, 238, 104892. [Google Scholar] [CrossRef]
- Liang, Y.; Gui, K.; Che, H.; Li, L.; Zheng, Y.; Zhang, X.; Zhang, X.; Zhang, P.; Zhang, X. Changes in Aerosol Loading before, during and after the COVID-19 Pandemic Outbreak in China: Effects of Anthropogenic and Natural Aerosol. Sci. Total Environ. 2022, 857, 159435. [Google Scholar] [CrossRef]
- Godhani, N.; Joshi, H.; Jana, S.; Gogoi, M.M.; Suresh Babu, S. Columnar Aerosol Optical Depth, Water Vapor and Ozone over a Semi-Arid Urban Location of Western India: Potential Sources and Direct Radiative Effects. Adv. Space Res. 2022, 70, 3092–3106. [Google Scholar] [CrossRef]
- Gui, L.; Tao, M.; Wang, Y.; Wang, L.; Chen, L.; Lin, C.; Tao, J.; Wang, J.; Yu, C. Climatology of Aerosol Types and Their Vertical Distribution over East Asia Based on CALIPSO Lidar Measurements. Int. J. Clim. 2022, 42, 6042–6054. [Google Scholar] [CrossRef]
- Husar, R.B.; Tratt, D.M.; Schichtel, B.A.; Falke, S.R.; Li, F.; Jaffe, D.; Gassó, S.; Gill, T.; Laulainen, N.S.; Lu, F.; et al. Asian Dust Events of April 1998. J. Geophys. Res. Atmos. 2001, 106, 18317–18330. [Google Scholar] [CrossRef]
- Huang, L.; Jiang, J.H.; Tackett, J.L.; Su, H.; Fu, R. Seasonal and Diurnal Variations of Aerosol Extinction Profile and Type Distribution from CALIPSO 5-Year Observations. J. Geophys. Res. Atmos. 2013, 118, 4572–4596. [Google Scholar] [CrossRef]
- Tao, M.; Chen, L.; Wang, J.; Wang, L.; Wang, W.; Lin, C.; Gui, L.; Wang, L.; Yu, C.; Wang, Y. Characterization of Dust Activation and Their Prevailing Transport over East Asia Based on Multi-Satellite Observations. Atmos. Res. 2022, 265, 105886. [Google Scholar] [CrossRef]
- Wang, L.; Gong, W.; Xia, X.; Zhu, J.; Li, J.; Zhu, Z. Long-Term Observations of Aerosol Optical Properties at Wuhan, an Urban Site in Central China. Atmos. Environ. 2015, 101, 94–102. [Google Scholar] [CrossRef]
- Xia, X.; Li, Z.; Wang, P.; Chen, H.; Cribb, M. Estimation of Aerosol Effects on Surface Irradiance Based on Measurements and Radiative Transfer Model Simulations in Northern China. J. Geophys. Res. Atmos. 2007, 112. [Google Scholar] [CrossRef]
- Huang, J.; Wang, T.; Wang, W.; Li, Z.; Yan, H. Climate Effects of Dust Aerosols over East Asian Arid and Semiarid Regions. J. Geophys. Res. Atmos. 2014, 119, 11398–11416. [Google Scholar] [CrossRef]
- Kai, Z.; Huiwang, G. The Characteristics of Asian-Dust Storms during 2000–2002: From the Source to the Sea. Atmos. Environ. 2007, 41, 9136–9145. [Google Scholar] [CrossRef]
- Wang, J.; Gui, H.; An, L.; Hua, C.; Zhang, T.; Zhang, B. Modeling for the Source Apportionments of PM10 during Sand and Dust Storms over East Asia in 2020. Atmos. Environ. 2021, 267, 118768. [Google Scholar] [CrossRef]
- Dubovik, O.; Holben, B.; Eck, T.F.; Smirnov, A.; Kaufman, Y.J.; King, M.D.; Tanré, D.; Slutsker, I. Variability of Absorption and Optical Properties of Key Aerosol Types Observed in Worldwide Locations. J. Atmos. Sci. 2002, 59, 590–608. [Google Scholar] [CrossRef]


| DD | PD | PC/S | ES | |
|---|---|---|---|---|
| SSA | 0.9647 | 0.8893 | 0.9384 | 0.8875 |
| g | 0.6649 | 0.6322 | 0.6389 | 0.6110 |
| TOA | SFC | ATM | |||||||||||
|---|---|---|---|---|---|---|---|---|---|---|---|---|---|
| MAM | JJA | SON | DJF | MAM | JJA | SON | DJF | MAM | JJA | SON | DJF | ||
| R1 | DD | −11.78 | −9.41 | −6.78 | −3.81 | −22.77 | −19.25 | −11.22 | −5.86 | 10.99 | 9.84 | 4.44 | 2.05 |
| PD | −0.17 | −0.32 | −0.52 | −0.94 | −1.08 | −2.59 | −1.93 | −2.89 | 0.92 | 2.27 | 1.41 | 1.95 | |
| PC/S | - | −0.02 | −0.03 | −0.14 | - | −0.06 | −0.05 | −0.28 | - | 0.04 | 0.03 | 0.14 | |
| ES | - | - | - | - | - | - | - | - | - | - | - | - | |
| R2 | DD | −6.30 | −2.40 | −2.48 | −2.25 | −10.95 | −4.41 | −3.72 | −3.26 | 4.66 | 2.01 | 1.25 | 1.01 |
| PD | −1.46 | −1.88 | −2.27 | −2.20 | −5.98 | −8.61 | −6.64 | −5.80 | 4.52 | 6.73 | 4.36 | 3.60 | |
| PC/S | −0.20 | −1.33 | −0.85 | −0.37 | −0.45 | −3.04 | −1.64 | −0.69 | 0.25 | 1.71 | 0.79 | 0.32 | |
| ES | −0.06 | −0.77 | −0.16 | −0.01 | −0.10 | −1.38 | −0.27 | −0.01 | 0.05 | 0.60 | 0.11 | - | |
| R3 | DD | −5.73 | −0.70 | −1.40 | −1.59 | −9.39 | −1.20 | −1.99 | −2.25 | 3.65 | 0.50 | 0.58 | 0.67 |
| PD | −6.17 | −4.23 | −6.06 | −6.60 | −21.51 | −15.86 | −16.76 | −17.19 | 15.35 | 11.64 | 10.70 | 10.59 | |
| PC/S | −1.48 | −6.44 | −3.64 | −2.18 | −3.23 | −14.52 | −7.11 | −4.07 | 1.74 | 8.08 | 3.48 | 1.89 | |
| ES | −0.42 | −3.36 | −0.90 | −0.58 | −0.71 | −5.88 | −1.44 | −0.87 | 0.29 | 2.51 | 0.54 | 0.29 | |
| R4 | DD | −1.86 | −0.26 | −0.39 | −0.73 | −3.07 | −0.43 | −0.55 | −1.10 | 1.22 | 0.17 | 0.16 | 0.37 |
| PD | −2.42 | −1.67 | −1.94 | −0.83 | −8.60 | −5.99 | −5.05 | −3.17 | 6.18 | 4.32 | 3.11 | 2.34 | |
| PC/S | −2.05 | −3.93 | −2.11 | −1.09 | −4.48 | −8.50 | −3.85 | −2.62 | 2.43 | 4.57 | 1.74 | 1.52 | |
| ES | −1.43 | −2.50 | −0.43 | −0.09 | −2.44 | −4.25 | −0.66 | −0.17 | 1.01 | 1.75 | 0.23 | 0.08 | |
| TOA | SFC | ATM | |||||||||||
|---|---|---|---|---|---|---|---|---|---|---|---|---|---|
| MAM | JJA | SON | DJF | MAM | JJA | SON | DJF | MAM | JJA | SON | DJF | ||
| R1 | DD | 1.08 | 0.83 | 0.42 | 0.15 | 2.41 | 1.64 | 1.19 | 0.64 | −1.34 | −0.82 | −0.76 | −0.49 |
| PD | 0.03 | 0.07 | 0.05 | 0.05 | 0.07 | 0.15 | 0.14 | 0.24 | −0.04 | −0.07 | −0.10 | −0.19 | |
| PC/S | - | - | - | - | - | - | - | 0.01 | - | - | - | −0.01 | |
| ES | - | - | - | - | - | - | - | - | - | - | - | - | |
| R2 | DD | 0.38 | 0.14 | 0.11 | 0.08 | 0.93 | 0.30 | 0.32 | 0.30 | −0.56 | −0.16 | −0.21 | −0.22 |
| PD | 0.14 | 0.18 | 0.14 | 0.10 | 0.35 | 0.39 | 0.41 | 0.43 | −0.21 | −0.20 | −0.27 | −0.32 | |
| PC/S | - | 0.03 | 0.02 | 0.01 | 0.01 | 0.06 | 0.04 | 0.02 | −0.01 | −0.03 | −0.03 | −0.02 | |
| ES | - | 0.01 | - | - | - | 0.03 | - | - | - | −0.01 | - | - | |
| R3 | DD | 0.24 | 0.03 | 0.04 | 0.05 | 0.67 | 0.05 | 0.15 | 0.20 | −0.43 | −0.03 | −0.11 | −0.15 |
| PD | 0.39 | 0.22 | 0.31 | 0.32 | 1.12 | 0.46 | 0.95 | 1.29 | −0.72 | −0.24 | −0.64 | −0.98 | |
| PC/S | 0.03 | 0.10 | 0.06 | 0.03 | 0.07 | 0.21 | 0.17 | 0.13 | −0.04 | −0.11 | −0.11 | −0.09 | |
| ES | 0.01 | 0.04 | 0.01 | 0.01 | 0.02 | 0.09 | 0.03 | 0.03 | −0.01 | −0.05 | −0.02 | −0.02 | |
| R4 | DD | 0.08 | 0.01 | 0.01 | 0.03 | 0.22 | 0.02 | 0.04 | 0.11 | −0.14 | −0.01 | −0.03 | −0.09 |
| PD | 0.16 | 0.09 | 0.10 | 0.06 | 0.44 | 0.19 | 0.30 | 0.26 | −0.28 | −0.10 | −0.21 | −0.20 | |
| PC/S | 0.04 | 0.06 | 0.04 | 0.02 | 0.11 | 0.13 | 0.11 | 0.11 | −0.07 | −0.07 | −0.07 | −0.08 | |
| ES | 0.03 | 0.04 | 0.01 | - | 0.06 | 0.08 | 0.02 | 0.01 | −0.04 | −0.04 | −0.01 | −0.01 | |
Disclaimer/Publisher’s Note: The statements, opinions and data contained in all publications are solely those of the individual author(s) and contributor(s) and not of MDPI and/or the editor(s). MDPI and/or the editor(s) disclaim responsibility for any injury to people or property resulting from any ideas, methods, instructions or products referred to in the content. |
© 2023 by the authors. Licensee MDPI, Basel, Switzerland. This article is an open access article distributed under the terms and conditions of the Creative Commons Attribution (CC BY) license (https://creativecommons.org/licenses/by/4.0/).
Share and Cite
Peng, N.; Su, J.; Han, X.; Deng, X.; Lan, W.; Wang, J. Distributions and Direct Radiative Effects of Different Aerosol Types in North China. Remote Sens. 2023, 15, 5511. https://doi.org/10.3390/rs15235511
Peng N, Su J, Han X, Deng X, Lan W, Wang J. Distributions and Direct Radiative Effects of Different Aerosol Types in North China. Remote Sensing. 2023; 15(23):5511. https://doi.org/10.3390/rs15235511
Chicago/Turabian StylePeng, Nan, Jing Su, Xinyi Han, Xingzhu Deng, Weiqi Lan, and Jinyan Wang. 2023. "Distributions and Direct Radiative Effects of Different Aerosol Types in North China" Remote Sensing 15, no. 23: 5511. https://doi.org/10.3390/rs15235511
APA StylePeng, N., Su, J., Han, X., Deng, X., Lan, W., & Wang, J. (2023). Distributions and Direct Radiative Effects of Different Aerosol Types in North China. Remote Sensing, 15(23), 5511. https://doi.org/10.3390/rs15235511