Article

Spatial–Temporal Mapping and Landscape Influence of Aquaculture Ponds in the Yangtze River Economic Belt from 1985 to 2020

1
State Key Laboratory of Resources and Environmental Information System, Institute of Geographic Sciences and Natural Resources Research, Chinese Academy of Sciences, Beijing 100101, China
2
School of Geographical Sciences, Southwest University, Chongqing 400715, China
3
University of Chinese Academy of Sciences, Beijing 100049, China
4
Key Laboratory of Quantitative Remote Sensing Information Technology, Aerospace Information Research Institute, Chinese Academy of Sciences, Beijing 100094, China
*
Author to whom correspondence should be addressed.
These authors contributed equally to this work.
Remote Sens. 2023, 15(23), 5477; https://doi.org/10.3390/rs15235477
Submission received: 22 October 2023 / Revised: 16 November 2023 / Accepted: 22 November 2023 / Published: 23 November 2023

Abstract

:
Most current research on aquaculture ponds focuses on coastal areas, leaving a gap in understanding of inland regions, such as the strategically significant Yangtze River Economic Belt in China. This study introduces an intelligent extraction method for extensive monitoring of aquaculture ponds in Yangtze River Economic Belt, using Landsat and Sentinel data from 1985 to 2020 with five-year intervals based on the Google Earth Engine (GEE) platform. Land cover change data were also analyzed to understand the impact of aquaculture-related changes. Results indicate a significant increase in aquaculture ponds in the Yangtze River Economic Belt from 3235.51 km2 to 14,207.08 km2 between 1985 and 2020. Aquaculture activity primarily shifted eastward from 1985 to 2015, then westward from 2015 to 2020. Approximately 2018.36 km2 of aquatic areas underwent conversion, mainly to water bodies or croplands, with fewer transitions to impervious surfaces, grasslands, or forests. This study highlights that inland areas can also experience significant increases in aquaculture ponds, particularly alongside large rivers, and that the environmental impacts of these changes differ from those in coastal areas, warranting specific attention.

1. Introduction

Over the past four decades, since the late 20th century, China’s aquaculture industry has witnessed rapid growth, spurred by the evolution of fishing rights and technological advancements [1,2]. However, the long-standing practices of small-scale, decentralized operations and relatively extensive production methods have inevitably led to a series of ecological issues, such as eutrophication [3]. These issues present significant limitations and pose challenges to China’s sustainable socio-economic development [4,5,6,7]. Therefore, gaining a comprehensive understanding of the spatial distribution and changes in aquaculture is crucial for the industry’s growth and for investigating the interplay of environmental changes. On 12 May 2021, China issued a directive to implement policies supporting the high-quality development of the fishing industry. This directive explicitly advocates for the green and circular development of the industry, with a focus on standardizing concentrated inland fish ponds, ensuring aquaculture tail water meets regulatory standards, and equipping facilities with intelligent water quality monitoring and environmental control systems. Currently, while aquaculture statistical data provide a summary of the industry’s quantity and coverage area, they offer limited real-time spatial distribution and environmental monitoring information, thus falling short of the requirements for real-time monitoring during the aquaculture development process. The Food and Agriculture Organization recommends the use of geographic information systems and remote sensing to elucidate geographical spatial information related to food. Consequently, the judicious use of these systems and remote sensing technology to systematically understand the spatial distribution and temporal evolution of inland aquaculture can aid fisheries management departments in accurately assessing aquaculture capacity. This, in turn, can facilitate the rational regulation and management of aquaculture models and structures, ensuring the orderly growth of the aquaculture industry while reinforcing resource and environmental protection.
In the context of large-scale environmental monitoring and resource surveys, the significance of remote sensing technology is increasingly evident [8,9,10,11]. In aquaculture, the methods of interpreting remote sensing data are consistently evolving towards automation, speed, and intelligence [12,13,14,15,16,17,18,19,20,21,22]. However, our current understanding of the spatial distribution of aquaculture ponds remains scant [23,24,25,26,27]. To address this knowledge gap, numerous scholars have employed remote sensing methods for automated extraction. For example, Virdis et al. utilized Worldview-1 and SPOT5 remote sensing data, applying an object-oriented fully automatic classification approach, to successfully extract shrimp ponds in the Tam Giang-Cau Hai lagoon in central Vietnam [12]. Similarly, Ke Wen et al., using the northern Beibu Gulf coast of Guangxi as a case study and based on Sentinel-2 and Sentinel-1 SAR time-series remote sensing data, selected the water body index NDWI and calculated the inundation frequency IF. They introduced SWIR2mean(10%~90%) and VHYEARmean indices to correct errors such as shadows and dams, proposing a method for extracting aquaculture ponds by determining the optimal segmentation threshold at multiple scales through training samples and object-oriented classification [28]. Furthermore, Jiachan Hu et al. leveraged Sentinel-2 remote sensing images, utilizing the spectral and spatial information of nearshore aquaculture ponds, calculated indices, and combined the support vector machine model and the Markov random field model to classify spectral information, successfully extracting the Haiwangjiu Island aquaculture area in the eastern part of the Liaodong Peninsula [29].
While existing research has yielded some results in small watershed or coastal regions [30,31,32,33,34,35,36,37,38], studies on inland aquaculture ponds remain scarce, necessitating further validation of the universality of current extraction findings. Xin Yuan conducted an analysis of land cover transitions in the coastal areas of Hainan Island, revealing that the expansion of aquaculture has led to the occupation of substantial coastal agricultural land, water bodies, and mangrove wetlands, thereby exacerbating coastal land loss [39]. Qiqi Meng examined the spatiotemporal relationship between land cover intensity and ecosystem service value in the northern region of Liaodong Bay, discovering that aquaculture has the highest influx, with the overall value of ecosystem services exhibiting a declining trend [40]. Ramki Periyasamy et al. performed a land cover analysis in the southeastern coastal region of Nagapattinam, India, assessing the impact of brackish water aquaculture. They found that fertile agricultural lands, such as arable land, fallow land, and artificial forests, are primarily being converted into aquaculture [41]. Despite the progress made in understanding land cover transitions in coastal aquaculture, the inland ecosystem differs from its coastal counterpart, and comparative studies on the rules of aquaculture pond transitions remain limited. Consequently, the spatiotemporal distribution, inflow and outflow patterns, and associated resource and environmental issues of aquaculture ponds necessitate further systematic research and in-depth investigation.
The Yangtze River Economic Belt, characterized by its coastal proximity, dense river networks, and numerous lakes, benefits from abundant rainfall resources. This wealth of material and natural resources underpins the development of China’s aquaculture, securing a pivotal strategic position within the country’s aquaculture industry. Utilizing a global-scale remote sensing cloud computing platform, such as Google Earth Engine (GEE) [42], for the intelligent interpretation of aquaculture areas not only ensures the quality of image processing but also significantly reduces processing time. Compared to traditional remote sensing analysis methods, GEE offers superior capabilities for the rapid processing of large-scale, high-resolution data. This makes it particularly valuable for fully leveraging and mining information from remote sensing big data [43].
In conclusion, this study aims to investigate the spatiotemporal evolution patterns of long-term series of inland aquaculture ponds in China. Leveraging the GEE remote sensing cloud platform and utilizing Landsat 5 and Sentinel-2 data, we examine the efficient and accurate identification and extraction patterns of aquaculture areas in the Yangtze River Economic Belt region from 1985 to 2020, with approximately five-year intervals. The results were analyzed from various perspectives, focusing on spatiotemporal evolution characteristics and key resource and environmental issues. Our findings aim to foster the development of inland aquaculture remote sensing monitoring systems, optimize land resource utilization structures, and expedite the progress of ecological civilization construction in the era of big data.

2. Materials and Methods

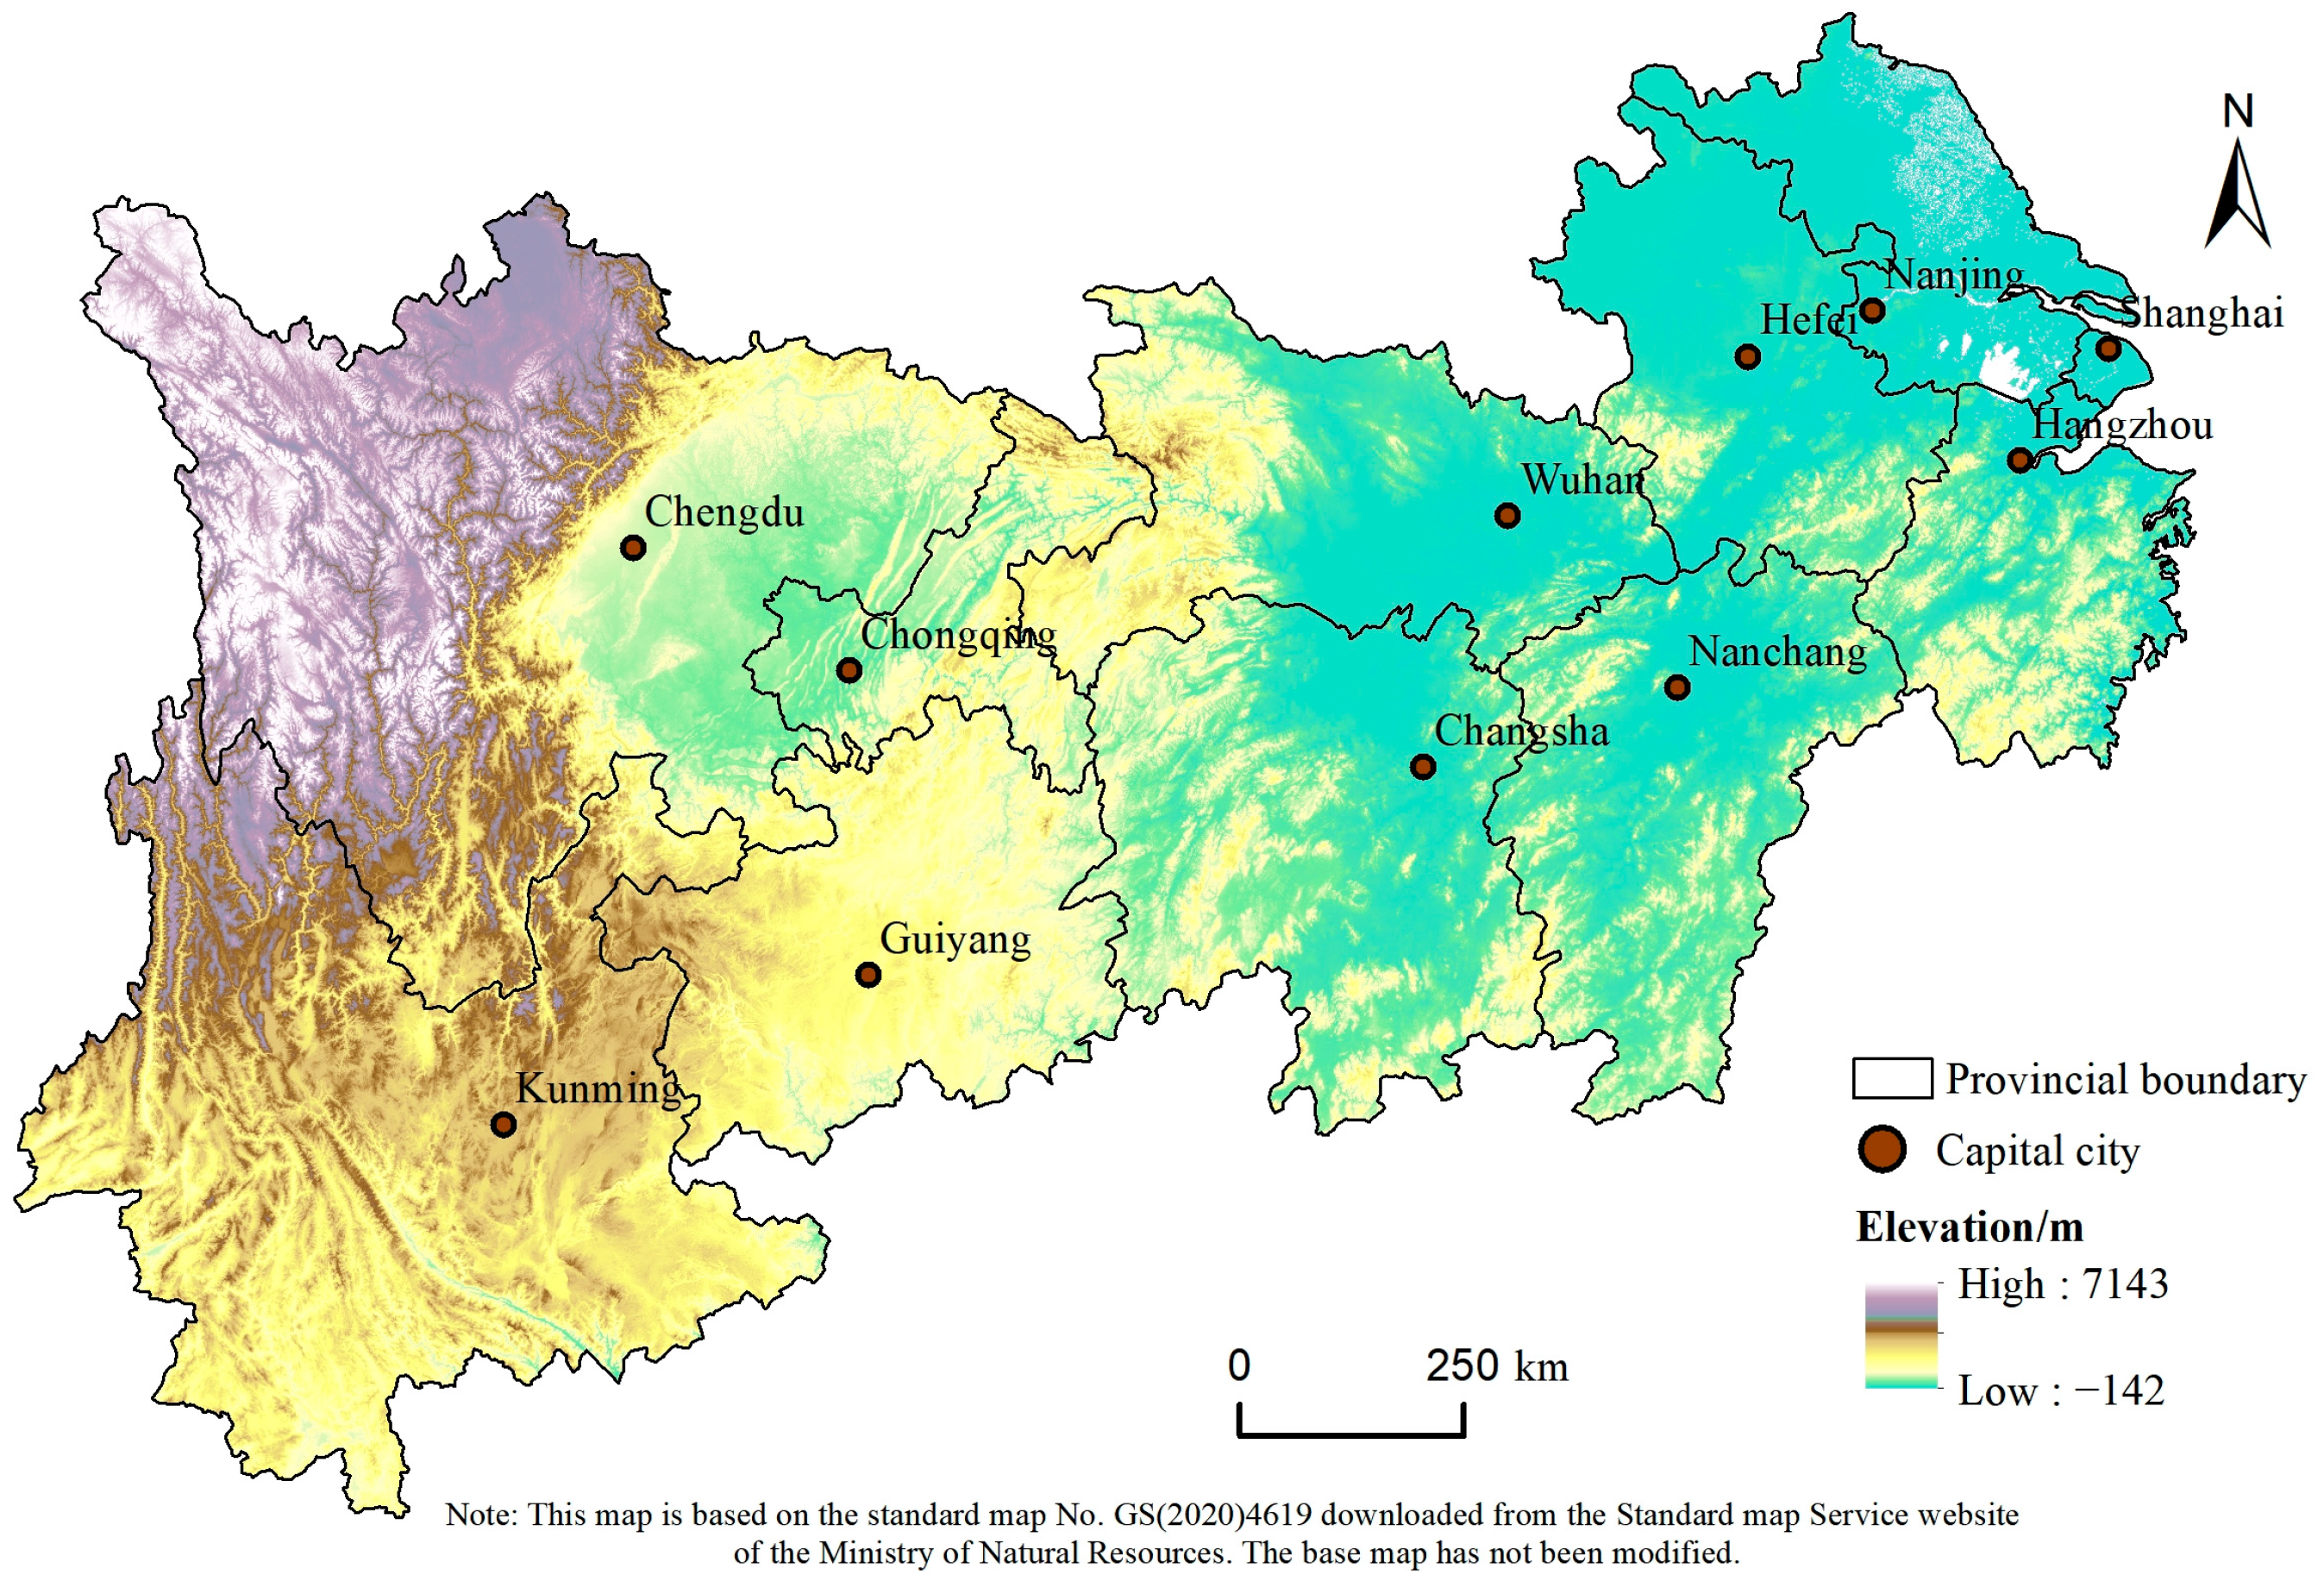
2.1. Overview of the Study Area

The Yangtze River Economic Belt (Figure 1), which includes provinces such as Jiangsu, Zhejiang, Hubei, and eight other provinces or municipalities, is a significant region in China known for its abundant aquaculture yield. This region serves as a strategic conduit for orchestrating the growth and development of China’s aquaculture industry. It also represents a comprehensive green ecological corridor for the river basin, providing a wealth of material resources and natural reserves for aquaculture [44]. In 2021, the total economic output of the fisheries sector within the Yangtze River Economic Belt reached CNY 1.3686 trillion, constituting 46% of the national total. Freshwater aquaculture production amounted to 20.25 million tons, representing 64% of the nation’s total freshwater aquatic product output and occupying 56% of the country’s total freshwater aquaculture area. This makes it one of the key sources of aquatic products in the country [45]. Consequently, accurately and efficiently acquiring spatiotemporal distribution information on aquaculture ponds within the Yangtze River Economic Belt region holds significant implications for fishery resource surveys, scientific industrial management, and high-quality sustainable development.

2.2. Sources of Data

  • Remote Sensing Data: This study utilizes Landsat 5 and Sentinel-2 remote sensing imagery data, both of which were accessed online and preprocessed via the GEE platform. This allowed us to conduct a longitudinal study on the extraction of large-scale aquaculture ponds in the Yangtze River Economic Belt region. The parameters and sources of the satellites are detailed in Table 1. To minimize the impact of cloud interference on the extraction process, we selected Sentinel data with less than 20% cloud coverage and screened the Landsat data for cloud coverage using the relevant parameters in the “QA_PIXEL” band. We also employed the median () function available in GEE [43] to calculate the mean pixel value within the corresponding image set, thereby constructing the foundational image for the experiment.
  • Elevation and Surface Water Data: Leveraging the GEE platform, this study utilizes the SRTM data [46] measured and released by NASA and the National Geospatial-Intelligence Agency as the elevation data. This restricts the complex inland terrain from both the Digital Elevation Model (DEM) and slope perspectives. Additionally, we selected the corresponding global surface water monthly data [47] to mitigate the impact of perennial snow in the Yangtze River’s upper reaches on the identification and extraction of aquaculture ponds. This dataset comprises maps detailing the location and temporal distribution of surface water from 1984 to 2021. The parameters and sources of the satellites are detailed in Table 1.
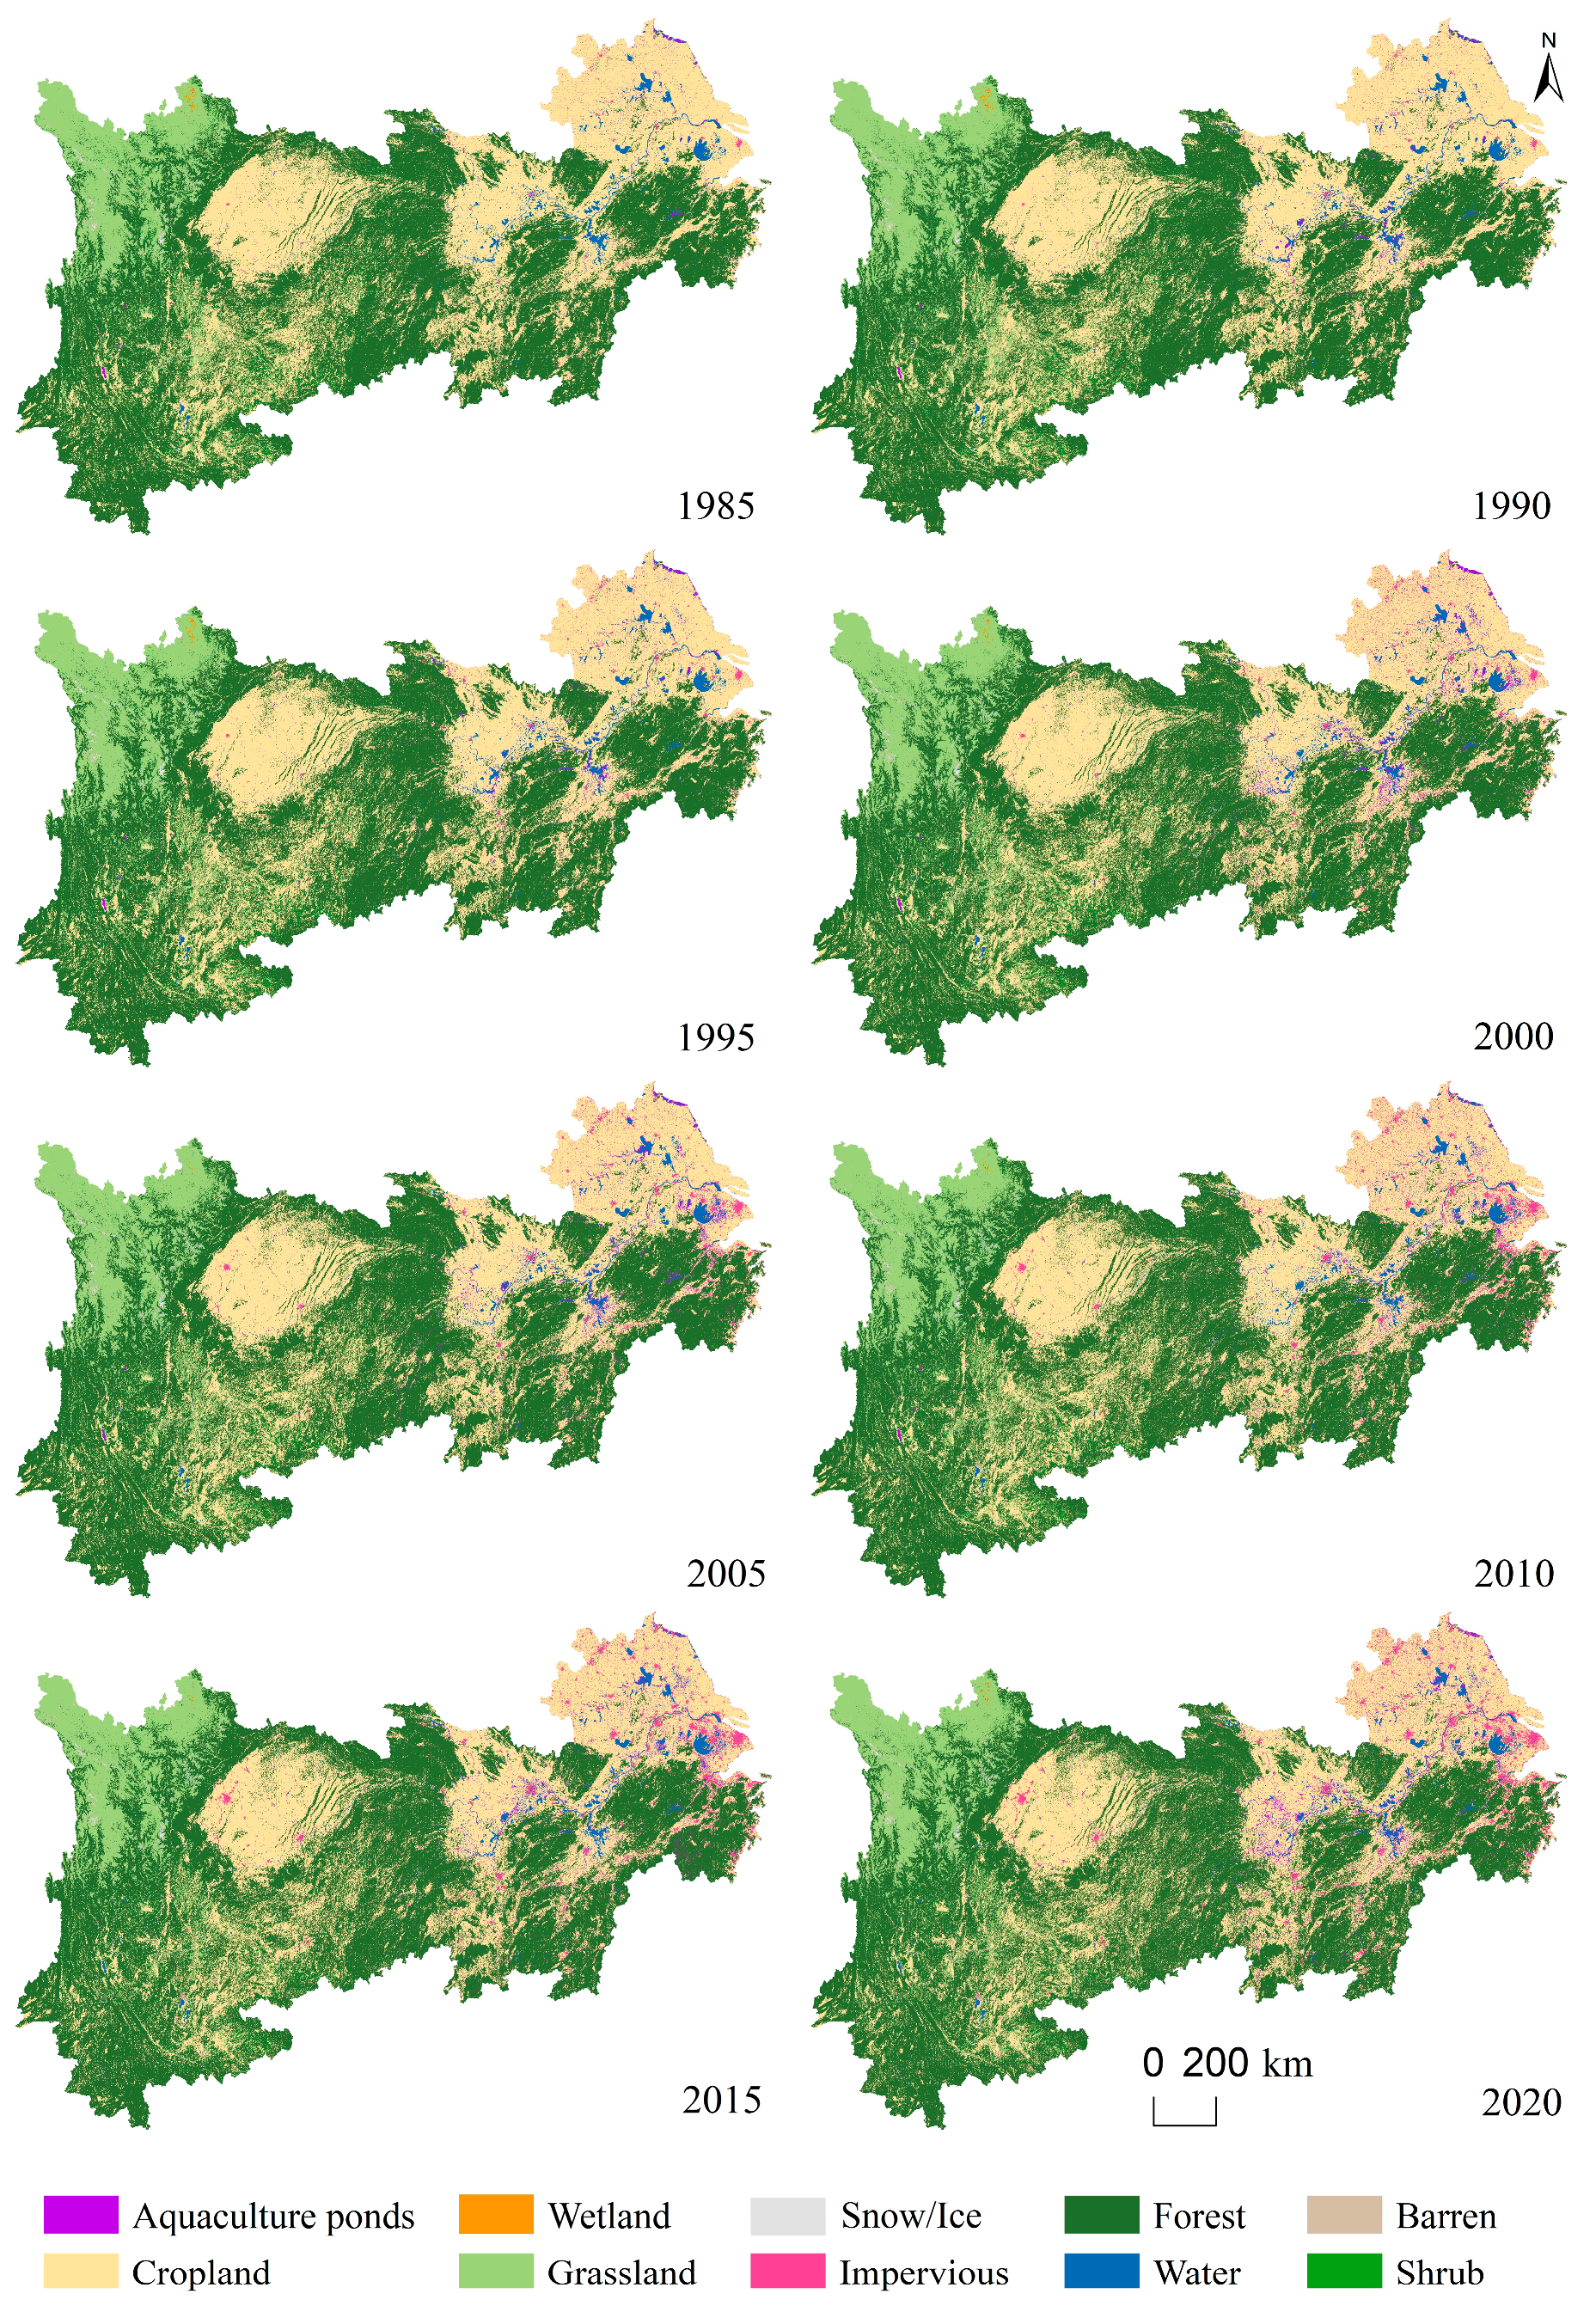
  • Land Cover Dataset: The land cover dataset employed in this study is the Annual China Land Cover Dataset (CLCD) [48], Version 1.0.0, produced by Wuhan University, with 30 m as the spatial resolution. Yang J and his team selected a stable sample of China’s land use/cover dataset with visual interpretation samples from multiple sources, used 335,709 Landsat images from GEE to create time indicators, and used the Random Forest classifier to generate classification results (for CLCD) with an overall accuracy of 79.31%. From this dataset, the years from which we selected the data were 1985, 1990, 1995, 2000, 2005, 2010, 2016, and 2020, and the dataset was sourced from https://zenodo.org, accessed on 1 May 2023. The classification system used is the Land Cover Classification System (LCCS) (9), including “Cropland”, “Forest”, “Shrub”, “Grassland”, “Water”, “Snow/Ice”, “Barren”, “Impervious”, and “Wetland”.

2.3. Research Methods

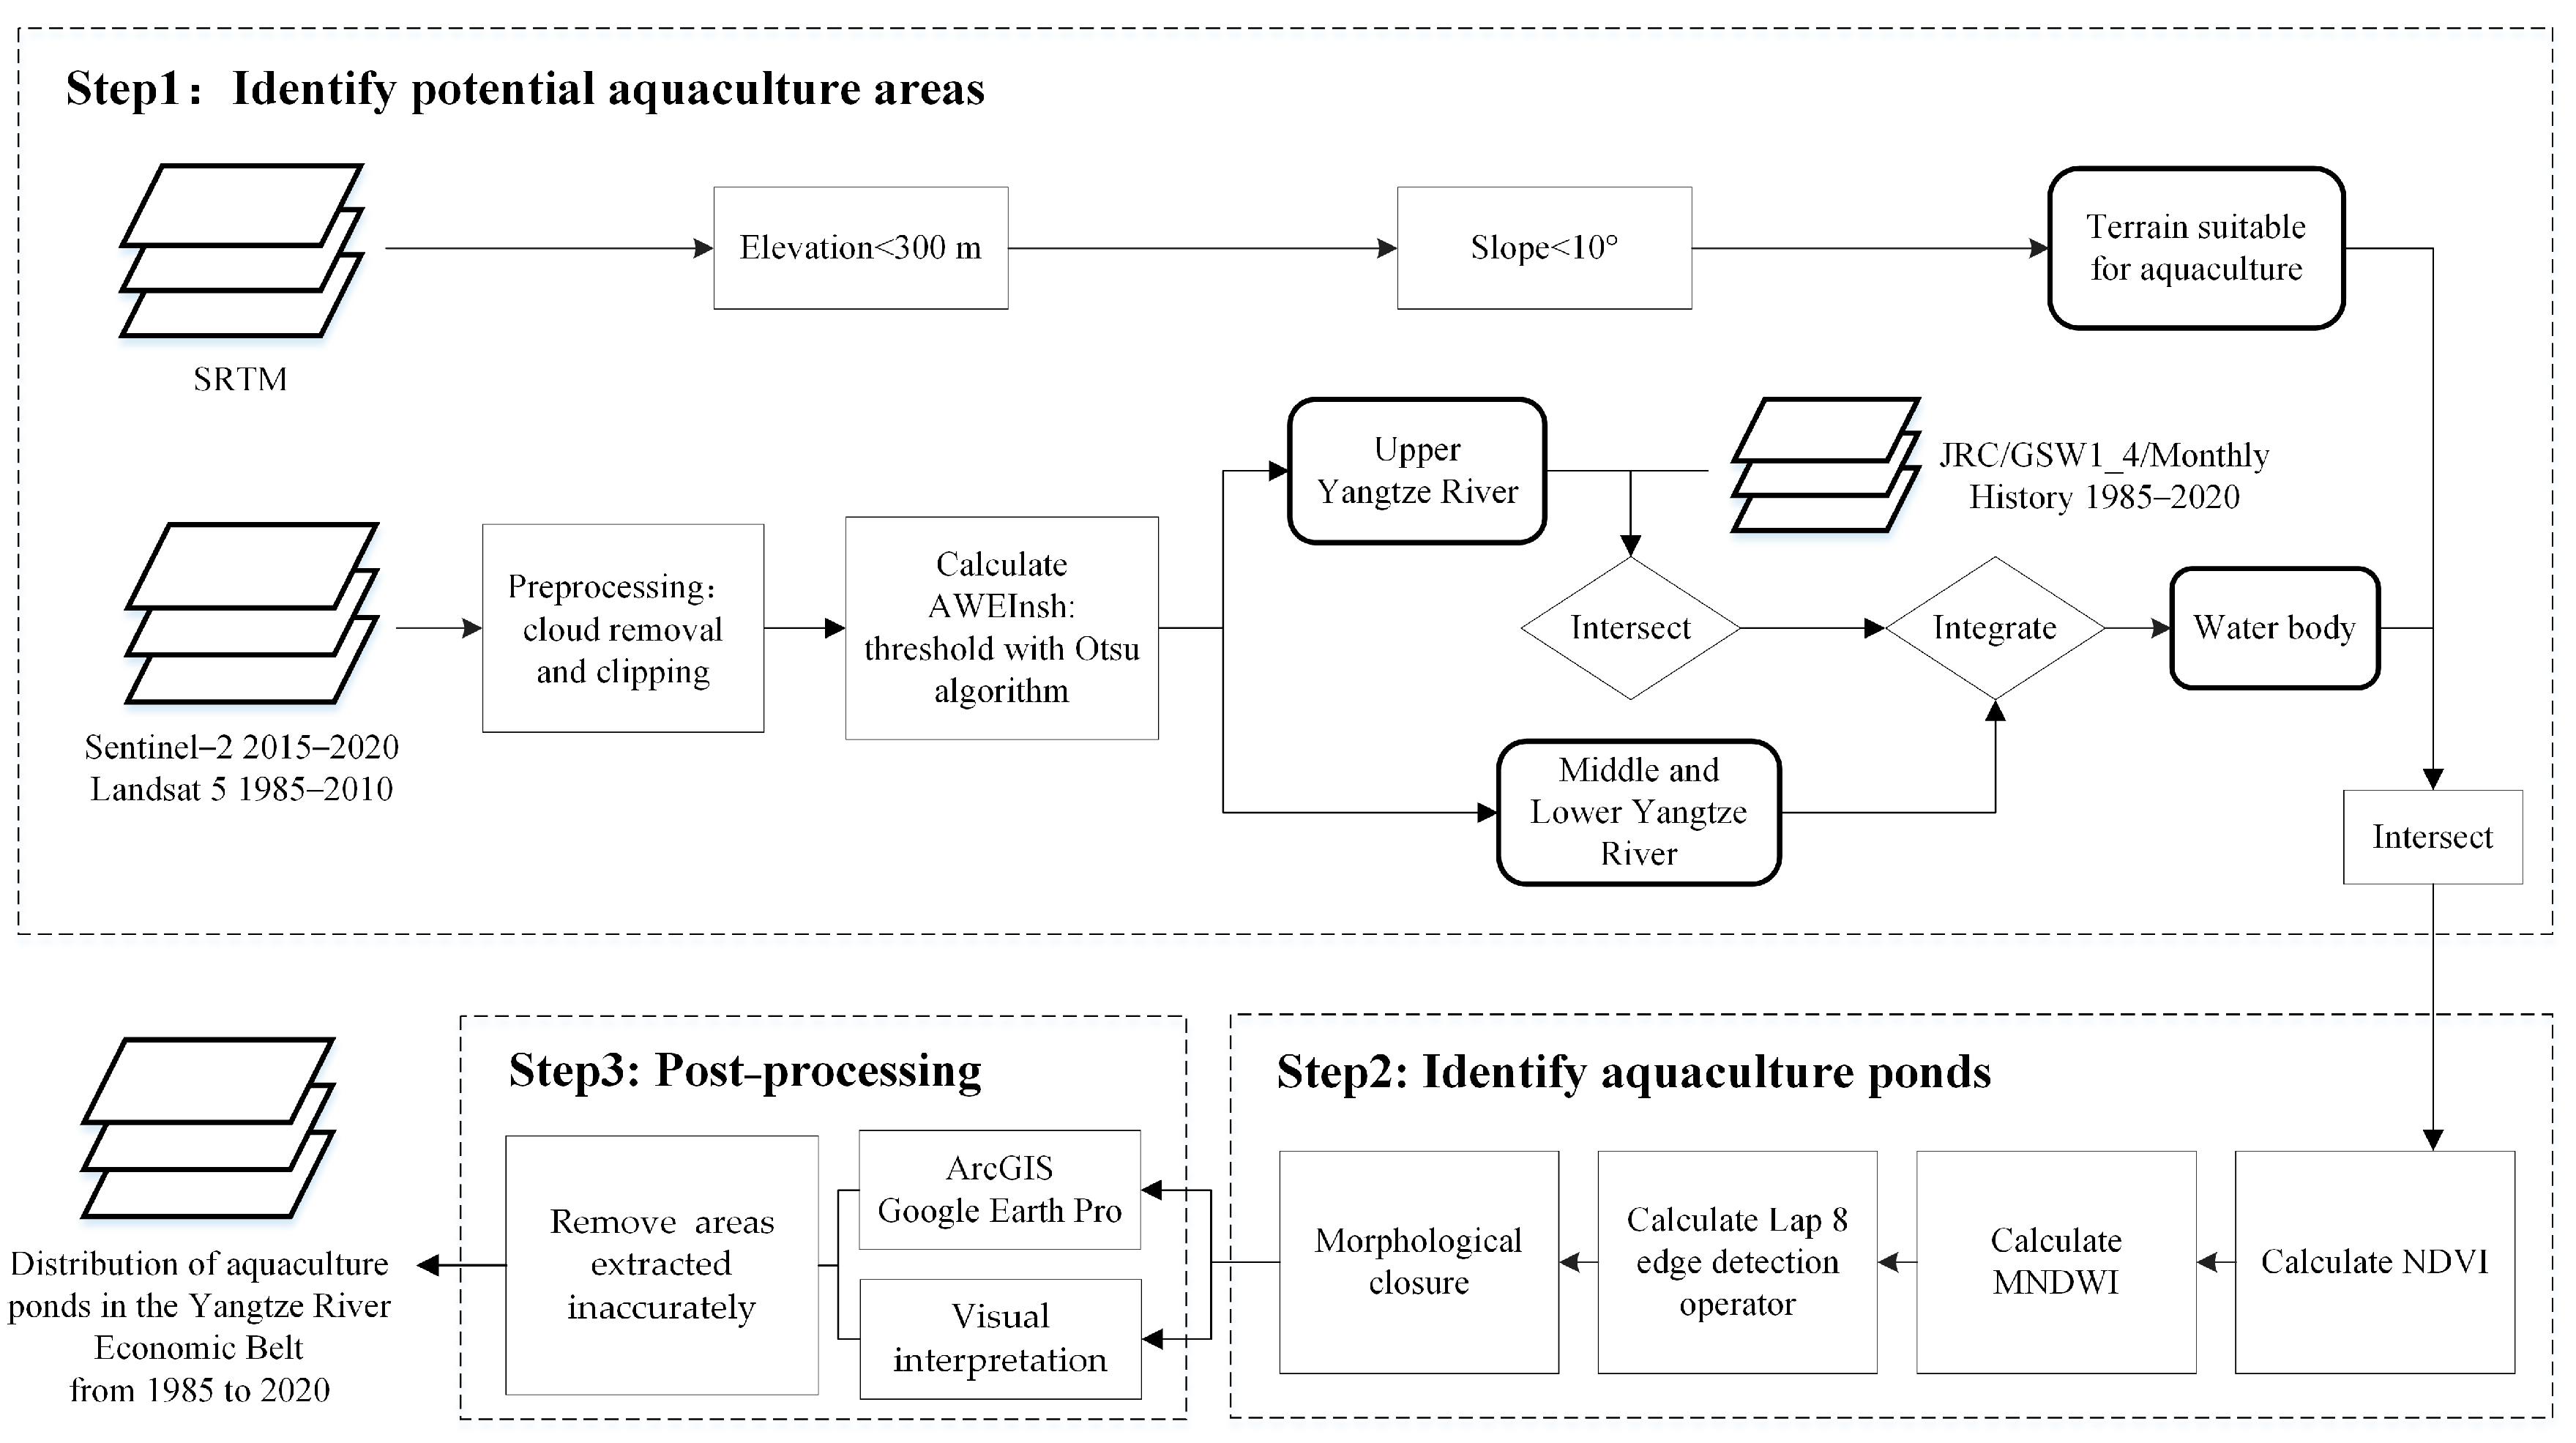
2.3.1. Technical Route

In this study, we reference Yuanqiang Duan’s methodology for extracting data on aquaculture ponds within China’s coastal regions [49]. Given the unique characteristics of the aquaculture ponds within the inland Yangtze River Economic Belt in China, we adapted this method accordingly. We meticulously adjusted various parameters and chose the optimal threshold through visual interpretation to better accommodate the specific traits of the aquaculture ponds within the Yangtze River Economic Belt. Furthermore, we incorporated global water body data to mitigate the effects of potential confusion between high-altitude mountain shadows and accumulated snow with water bodies in the southwestern region of the Yangtze River Economic Belt. This led to the design of an algorithm for the extraction of aquaculture ponds in the Yangtze River Economic Belt region based on Sentinel-2 and Landsat 5 satellites. The data processing workflow primarily consists of three steps:
  • Step 1. Using the GEE platform, potential aquaculture areas are identified by eliminating background noise. Suitable aquaculture regions are filtered based on terrain conditions using SRTM elevation data and by setting specific elevation and slope parameters. The Automated Water Extraction Index (AWEInsh) is computed using preprocessed Sentinel-2 and Landsat 5 data. The Otsu algorithm is employed to determine the threshold for water body extraction, which is then combined with global water data to mitigate the influence of high mountain shadows, ice, snow, and other geographical features in the upper Yangtze River region. Overlaying water bodies and terrain-appropriate areas helps exclude complex geographical features and land classes unsuitable for aquaculture, thereby identifying potential aquaculture areas.
  • Step 2. The GEE platform is used to identify aquaculture ponds by leveraging spatial structure and phenological rhythm. The Normalized Difference Vegetation Index (NDVI), Modified Normalized Difference Water Index (MNDWI), and Laplacian 8 (Lap 8) edge detection operators are computed, integrating texture information and spectral characteristics. Morphological operations assist in the identification and extraction of aquaculture ponds.
  • Step 3. Post-processing. ArcGIS and Google Earth Pro software are used for visual interpretation of the extraction results, primarily to eliminate narrow rivers, coastal salt fields, and other irregular natural water bodies.
The detailed process is depicted in Figure 2. The following section will elaborate on the method used for aquaculture pond extraction, using the identification and extraction of aquaculture ponds in Gaohutang, Beixian, Ningbo City, Zhejiang Province, in 2020 as a case study.

2.3.2. Intelligent Interpretation of Inland Large-Scale Aquaculture Ponds

  • Identify Potential Aquaculture Areas
Aquaculture ponds in the Yangtze River Economic Belt are predominantly located in coastal low-lying plains, tidal flats, and similar areas, with the pixels of these ponds often manifesting as complex mixed pixels, as depicted in Figure 3a. In order to identify potential aquaculture areas, we used SRTM data to generate a terrain conducive to aquaculture. Yuanqiang Duan et al. established an elevation threshold of 100 m for the extraction of coastal aquaculture ponds [49]. However, the distribution of inland aquaculture ponds differs from that of coastal regions. In this study, the terrain threshold is not solely determined by the distribution of the aquaculture ponds. Additionally, the snow-capped mountains and high mountain shadows in the southwest region can easily be mistaken for water bodies. To minimize this interference, we made multiple adjustments to the threshold, performing visual interpretations based on shape, texture, and color, among other factors. Based on the optimal results of these visual interpretations, we ultimately selected an elevation threshold of 300 m and a slope within 10 degrees. We conducted an on-site survey of the aquaculture pond distribution in Jinyun Mountain, Chongqing, and found that the distribution of large-scale aquaculture ponds indeed adheres to the conditions of an elevation below 300 m and a slope within 10 degrees. To mitigate the influence of buildings on the extraction of aquaculture ponds and enhance the low water reflectance characteristics, AWEInsh [50] was used for computation. The calculation method is as shown in Equation (1). This index can efficiently remove non-water pixels, including dark building surfaces in urban background areas that are often mistaken for aquaculture ponds. The results of the AWEInsh computation are illustrated in Figure 3b, and the outcomes following binary opening and closing operations are presented in Figure 3c. We established distinct threshold values for the open–close operation parameters corresponding to remote sensing image data of varying resolutions according to the optimal parameter threshold for multiple contrast debugging through visual interpretation. Specifically, for Sentinel-2 data with a spatial resolution of 10 m, we set the threshold at 8; for Landsat data with a spatial resolution of 30 m, the threshold was set at 6.
A W E I n s h = 4 × ρ G r e e n ρ S W I R 1 0.25 × ρ N I R + 2.75 × ρ S W I R 2 .
In the given equation, the variable ρ denotes the spectral reflectance. The variables ρ G r e e n , ρ N I R , ρ S W I R 1 , ρ S W I R 2 correspond to Band3, Band8, Band11, Band12 of the Multi-Spectral Instrument (MSI) sensor on the Sentinel satellite, and to Band2, Band4, Band5, Band7 of the Thematic Mapper (TM) sensor, respectively. SWIR means short-wave infrared; NIR means near-infrared spectroscopy.
In this study, we employed the Otsu algorithm to determine the AWEInsh threshold, also known as the maximum inter-class variance method [51]. This algorithm identifies an optimal threshold by maximizing the variance between categories, segregating image pixels into two or more distinct areas, thereby effectively distinguishing image regions with varying characteristics. According to this algorithm, the AWEInsh threshold calculated for 2020 is 3.25, which can effectively differentiate water body pixels from other areas, as depicted in Figure 3d. Since the extracted water body data exclude dam data, which are not conducive to subsequent texture feature analysis, we performed morphological closing operations on the extracted water body data to obtain water body mask data, as shown in Figure 3e. Given that the upper reaches of the Yangtze River, namely the provinces of Chongqing, Sichuan, Yunnan, and Guizhou, experience perennial cloudiness and mountain snow accumulation, we divided the research area into two parts: the upper reaches and the middle and lower reaches of the Yangtze River. The extraction of the water body mask in the downstream of the Yangtze River Economic Belt follows the aforementioned process; the extraction result of the upper reaches overlaps with the global surface water body data of the corresponding year to form an intersection, serving as the water body mask of the upper reaches of the Yangtze River, thereby enhancing the accuracy of aquaculture area extraction. The intersection of the terrain mask and the water body mask yields the potential aquaculture area.
  • Preliminary Identification of Aquaculture Ponds
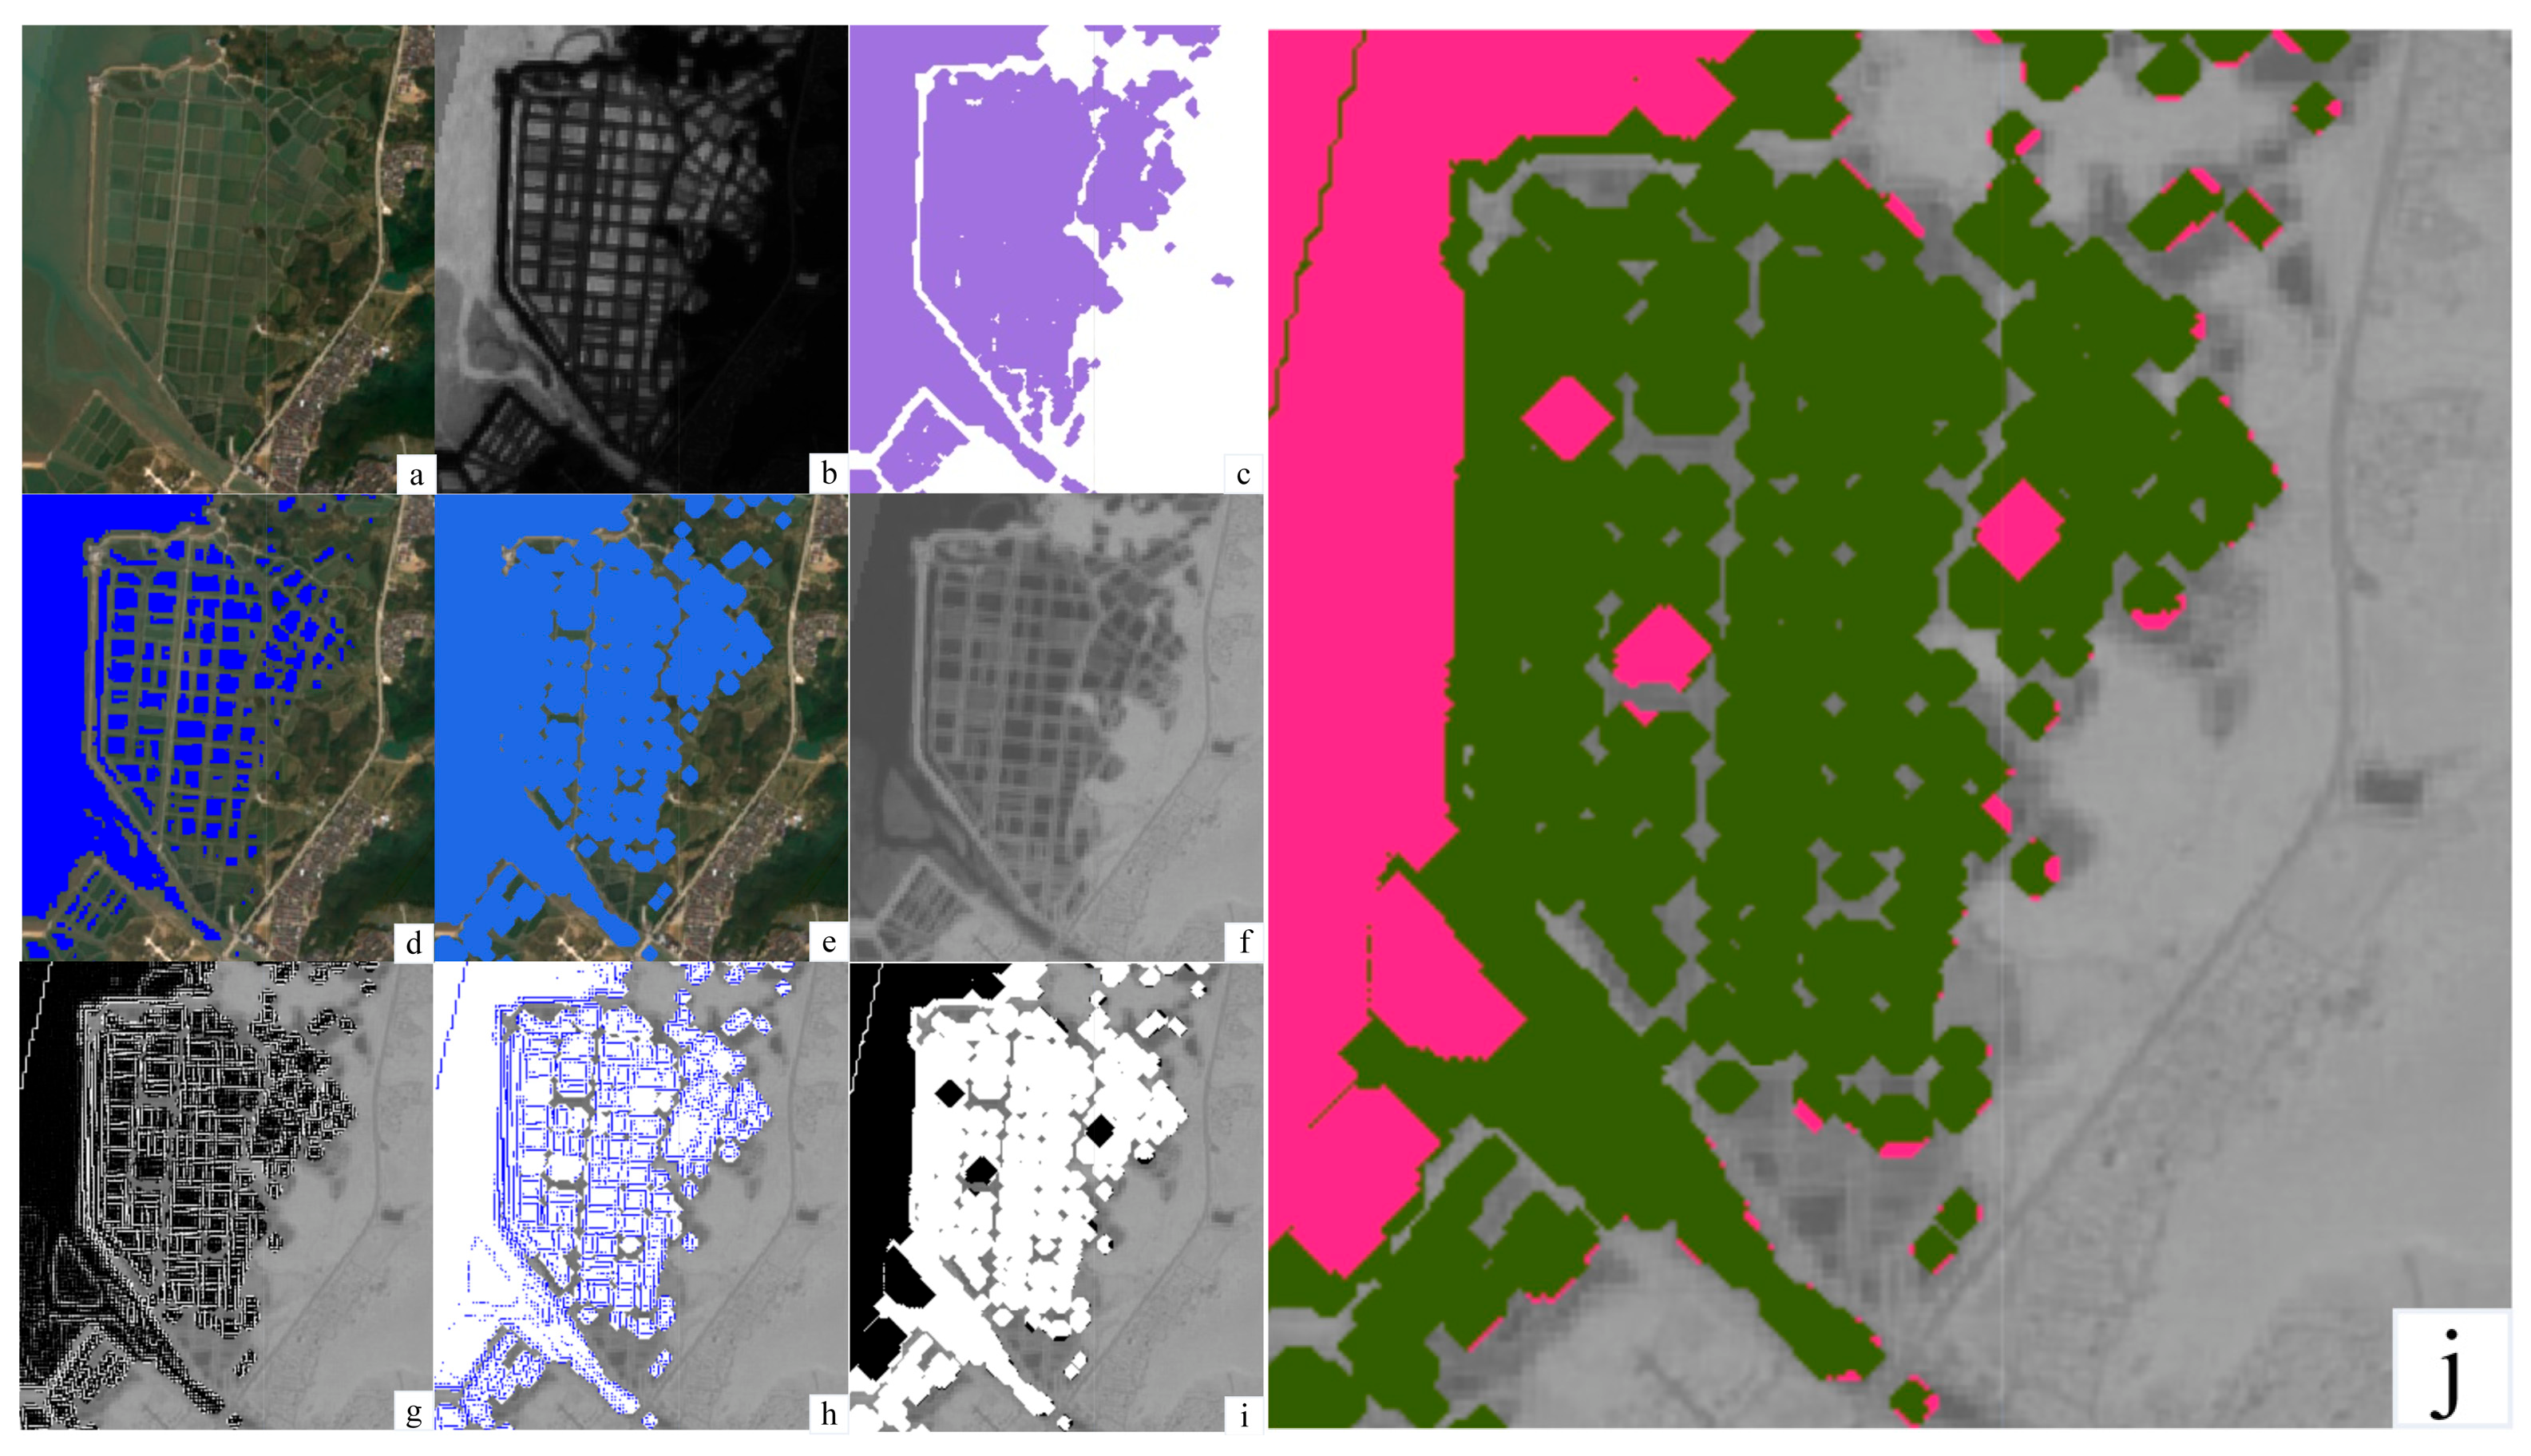
NDVI represents the normalized ratio between the near-infrared and red bands. This index serves as an indicator of seasonal variations in vegetation growth and activity [52]. Given that rice fields, prevalent in the Yangtze River Economic Belt region, can be erroneously identified as aquaculture ponds during the early growth stages, this study further incorporates the phenological traits of rice, using NDVI to identify and eliminate rice. As per the research by Xiaojun Liu et al. [53], the spectral sensor of the rice canopy is influenced by exposed soil and water backdrop during the early growth stages due to the non-closure of the rice canopy, thereby reducing the reliability of NDVI in estimating crop growth. However, from the tillering stage onwards, the NDVI value exhibits a steep trend with the rapid changes in the growth curve, stabilizing post the heading stage and then gradually declining. Consequently, this study identifies rice based on the NDVI values during the tillering and heading stages of rice. In line with the research by Fenghua Yu et al. [54] and Shanshan Liu et al. [55], the NDVI corresponding to these two stages of rice increases from 0.65 and stabilizes around 0.8, leading us to select 0.65 as the NDVI threshold to effectively exclude rice. Consequently, we calculate the NDVI with the mathematical expression [56] presented in Equation (2).
N D V I = ρ N I R ρ R E D ρ N I R + ρ R E D .
In the presented equation, the variable ρ signifies the spectral reflectance, whereas ρ N I R ,   ρ R E D denote the reflectance of the terrestrial object in the near-infrared and red bands, respectively. Specifically, ρ N I R ,   ρ R E D align with Band8, Band4 of the Multi-Spectral Instrument (MSI) sensor on the Sentinel-2 satellite, and with Band4, Band3 of the Thematic Mapper (TM) sensor. NIR means near-infrared spectroscopy.
Given the weak spectral reflectance of the aquaculture zones within the aquaculture ponds and the easily distinguishable high-frequency information presented by the narrow dams between the ponds, we employed the MNDWI [57] to enhance the spatial texture features of the aquaculture ponds. The extraction result is depicted in Figure 3f, and the outcome post binarization is shown in Figure 3g, where the texture of the dam and the boundary of the aquaculture pond are notably prominent. Subsequently, we used the Lap 8 edge detection operator to identify areas in the image where the gray level changed abruptly, specifically the edge and contour areas of the aquaculture pond, as illustrated in Figure 3h. Setting the Lap 8 threshold at 0.8 and performing binarization yielded. Following morphological operations, as shown in Figure 3i, we can observe the successful distinction between the aquaculture ponds and other water bodies, indicating the initial extraction of the aquaculture pond. The calculation methods for MNDWI and Lap 8 are presented in Equations (3) and (4), respectively.
M N D W I = ρ G r e e n ρ S W I R 1 ρ G r e e n + ρ S W I R 1 .
In the presented equation, the variable ρ denotes the spectral reflectance. The variables ρ G r e e n ,   ρ S W I R 1 ,   ρ S W I R 2 correspond to the central wavelengths of 0.5625 μm, 0.1610 μm, and 2.200 μm, respectively. SWIR means short-wave infrared.
K e r n e l L a p   8 = 1 1 1 1 8 1 1 1 1 .
We performed binarization on the preliminary extraction of the aquaculture ponds depicted in Figure 3i, resulting in Figure 3j. It is important to note that we utilized the nearest-neighbor method within the GEE platform to generate images with a spatial resolution of 30 m, based on the extraction results derived from the 10 m resolution Sentinel-2 data. It is evident that some aquaculture ponds are densely distributed and were not effectively extracted. Given the scarcity of such patches, we employed visual interpretation to rectify this shortcoming, which serves as the extraction result of the aquaculture ponds in the Yangtze River Economic Belt region.
Figure 3. (ai) Map of extraction process. (j) Binary map of aquaculture ponds (the green sections represent the extracted aquaculture ponds).
Remotesensing 15 05477 g003
  • Post Processing
During the post-processing phase, we used ArcGIS software to visually interpret and manually remove inaccurately extracted rivers, narrow channels, and coastal salt pans. The middle and lower regions of the Yangtze River Economic Belt exhibit a dense distribution of river networks. A minor proportion of rivers and narrow channels were erroneously identified as having the textural characteristics of aquaculture ponds, leading to their incorrect extraction. These inaccurately extracted features are predominantly found in this area and exhibit distinct shape characteristics, simplifying the identification and removal process. Coastal salt pans in China are relatively concentrated, primarily around the Bohai Sea and certain regions in northern and central Jiangsu [49]. These can be systematically removed through visual interpretation. We leveraged the comprehensive and reliable spatial and attribute information provided by high-resolution imagery, Point of Interest (POI) layers, and street view image data in Google Earth Pro. This information was compared with the aquaculture extraction results of our study, facilitating the identification and removal of narrow rivers and coastal salt pans.

2.3.3. Precision Evaluation

We employed the validation point efficacy analysis method [58] to quantitatively assess the consistency and accuracy between the classification or segmentation results and the actual geographical features. After calculations, we find that 1000 validation points can satisfy the requirements for validation accuracy. Initially, we generated 1000 random points within the study area using the GEE platform. Subsequently, these points were superimposed onto Google Earth Pro software, where we use its high-resolution imagery, POI layers, and street view image data for reference. Each point was visually interpreted based on attributes such as shape, color, and spatial structure, thereby assigning each random point with the corresponding real-world surface attributes. In the third step, these random points, now equipped with real-world surface attributes, were imported into ArcGIS software as validation points. These points were then assigned the attributes derived from the aquaculture extraction results of our study, facilitating the creation of a confusion matrix. Finally, this process was repeated annually for the aquaculture extraction results, yielding multiple confusion matrices, as presented in Table 2 and Table 3.
The overall accuracy of the automatic extraction results of aquaculture ponds in the Yangtze River Economic Belt region in 2020 is 0.82. Additionally, to analyze the accuracy of the extraction results of the aquaculture ponds, we also used the bootstrapping method [59] to obtain a representative sample set that fulfilled the research needs. After performing 1000 iterations on the sample results, we obtained Table 2. The overall accuracy of the extraction of aquaculture ponds in the Yangtze River Economic Belt is 0.96 (0.94–0.97, 95% confidence interval), the user accuracy of non-aquaculture pond classification points is 0.97 (0.96–0.98, 95% confidence interval), and the user accuracy of aquaculture pond classification points is 0.89 (0.83–0.94, 95% confidence interval).

3. Results

3.1. The Spatiotemporal Changes in Aquaculture Ponds of the Yangtze River Economic Belt from 1985 to 2020

Using the research methodology outlined in this paper, we procured data pertaining to aquaculture ponds in the Yangtze River Economic Belt from 1985 to 2020. These data, downloaded from the Google Earth Engine (GEE) platform and imported into ArcGIS, were then statistically analyzed by province, the results of which are presented in Table 4. Table 4 shows that from 1985 to 2020, the aquaculture ponds in the Yangtze River Economic Belt region have experienced significant changes, generally exhibiting a continuous growth trend. The aquaculture ponds expanded from 3235.51 km2 in 1985 to 14,207.08 km2 in 2020, marking a substantial increase. The newly added aquaculture ponds are primarily located in Zhejiang, Jiangxi, Jiangsu, Hubei, Anhui, and Hunan provinces. However, it is noteworthy that the growth rate of aquaculture ponds first increases and then decreases. The annual growth rate rose from 1.07% in 1985 to 9.09% in 2010, and then fell to 4.16% by 2020. Zhejiang province has the most significant increase in aquaculture ponds, with an addition of 2229.6 km2 over 35 years. Although the scale of aquaculture in Shanghai shows fluctuations, it maintains an overall upward trend. Between 2000 and 2010, the growth rate of aquaculture in various provinces was generally high, with Jiangxi province experiencing the most substantial increase, reaching 1039.85 km2, before slightly decreasing.
In this study, we substitute the corresponding pixels of the Annual China Land Cover Dataset (CLCD) land cover data with the extraction results of large-scale inland aquaculture areas in the Yangtze River Economic Belt from 1985 to 2020. This substitution results in a spatial pattern of land cover in the Yangtze River Economic Belt that includes the aquaculture area, as depicted in Figure 4.
In terms of spatial distribution, the changes in aquaculture areas in Hubei and Jiangxi provinces are particularly noticeable, demonstrating various degrees of expansion. From 1985 to 2015, the overall aquaculture area exhibited an “east more, west less” spatial distribution pattern. In other words, the eastern provinces had larger aquaculture areas, primarily concentrated in the central and northern parts of Jiangsu and the southern areas bordering Shanghai, Anhui, and Zhejiang. In contrast, the western provinces had relatively fewer aquaculture areas, and their distribution was more scattered and fragmented. However, between 2015 and 2020, the spatial distribution of aquaculture ponds underwent significant changes. Overall, the aquaculture areas on the east and west sides showed an increasing trend, but the increase on the west side was more pronounced than on the east.

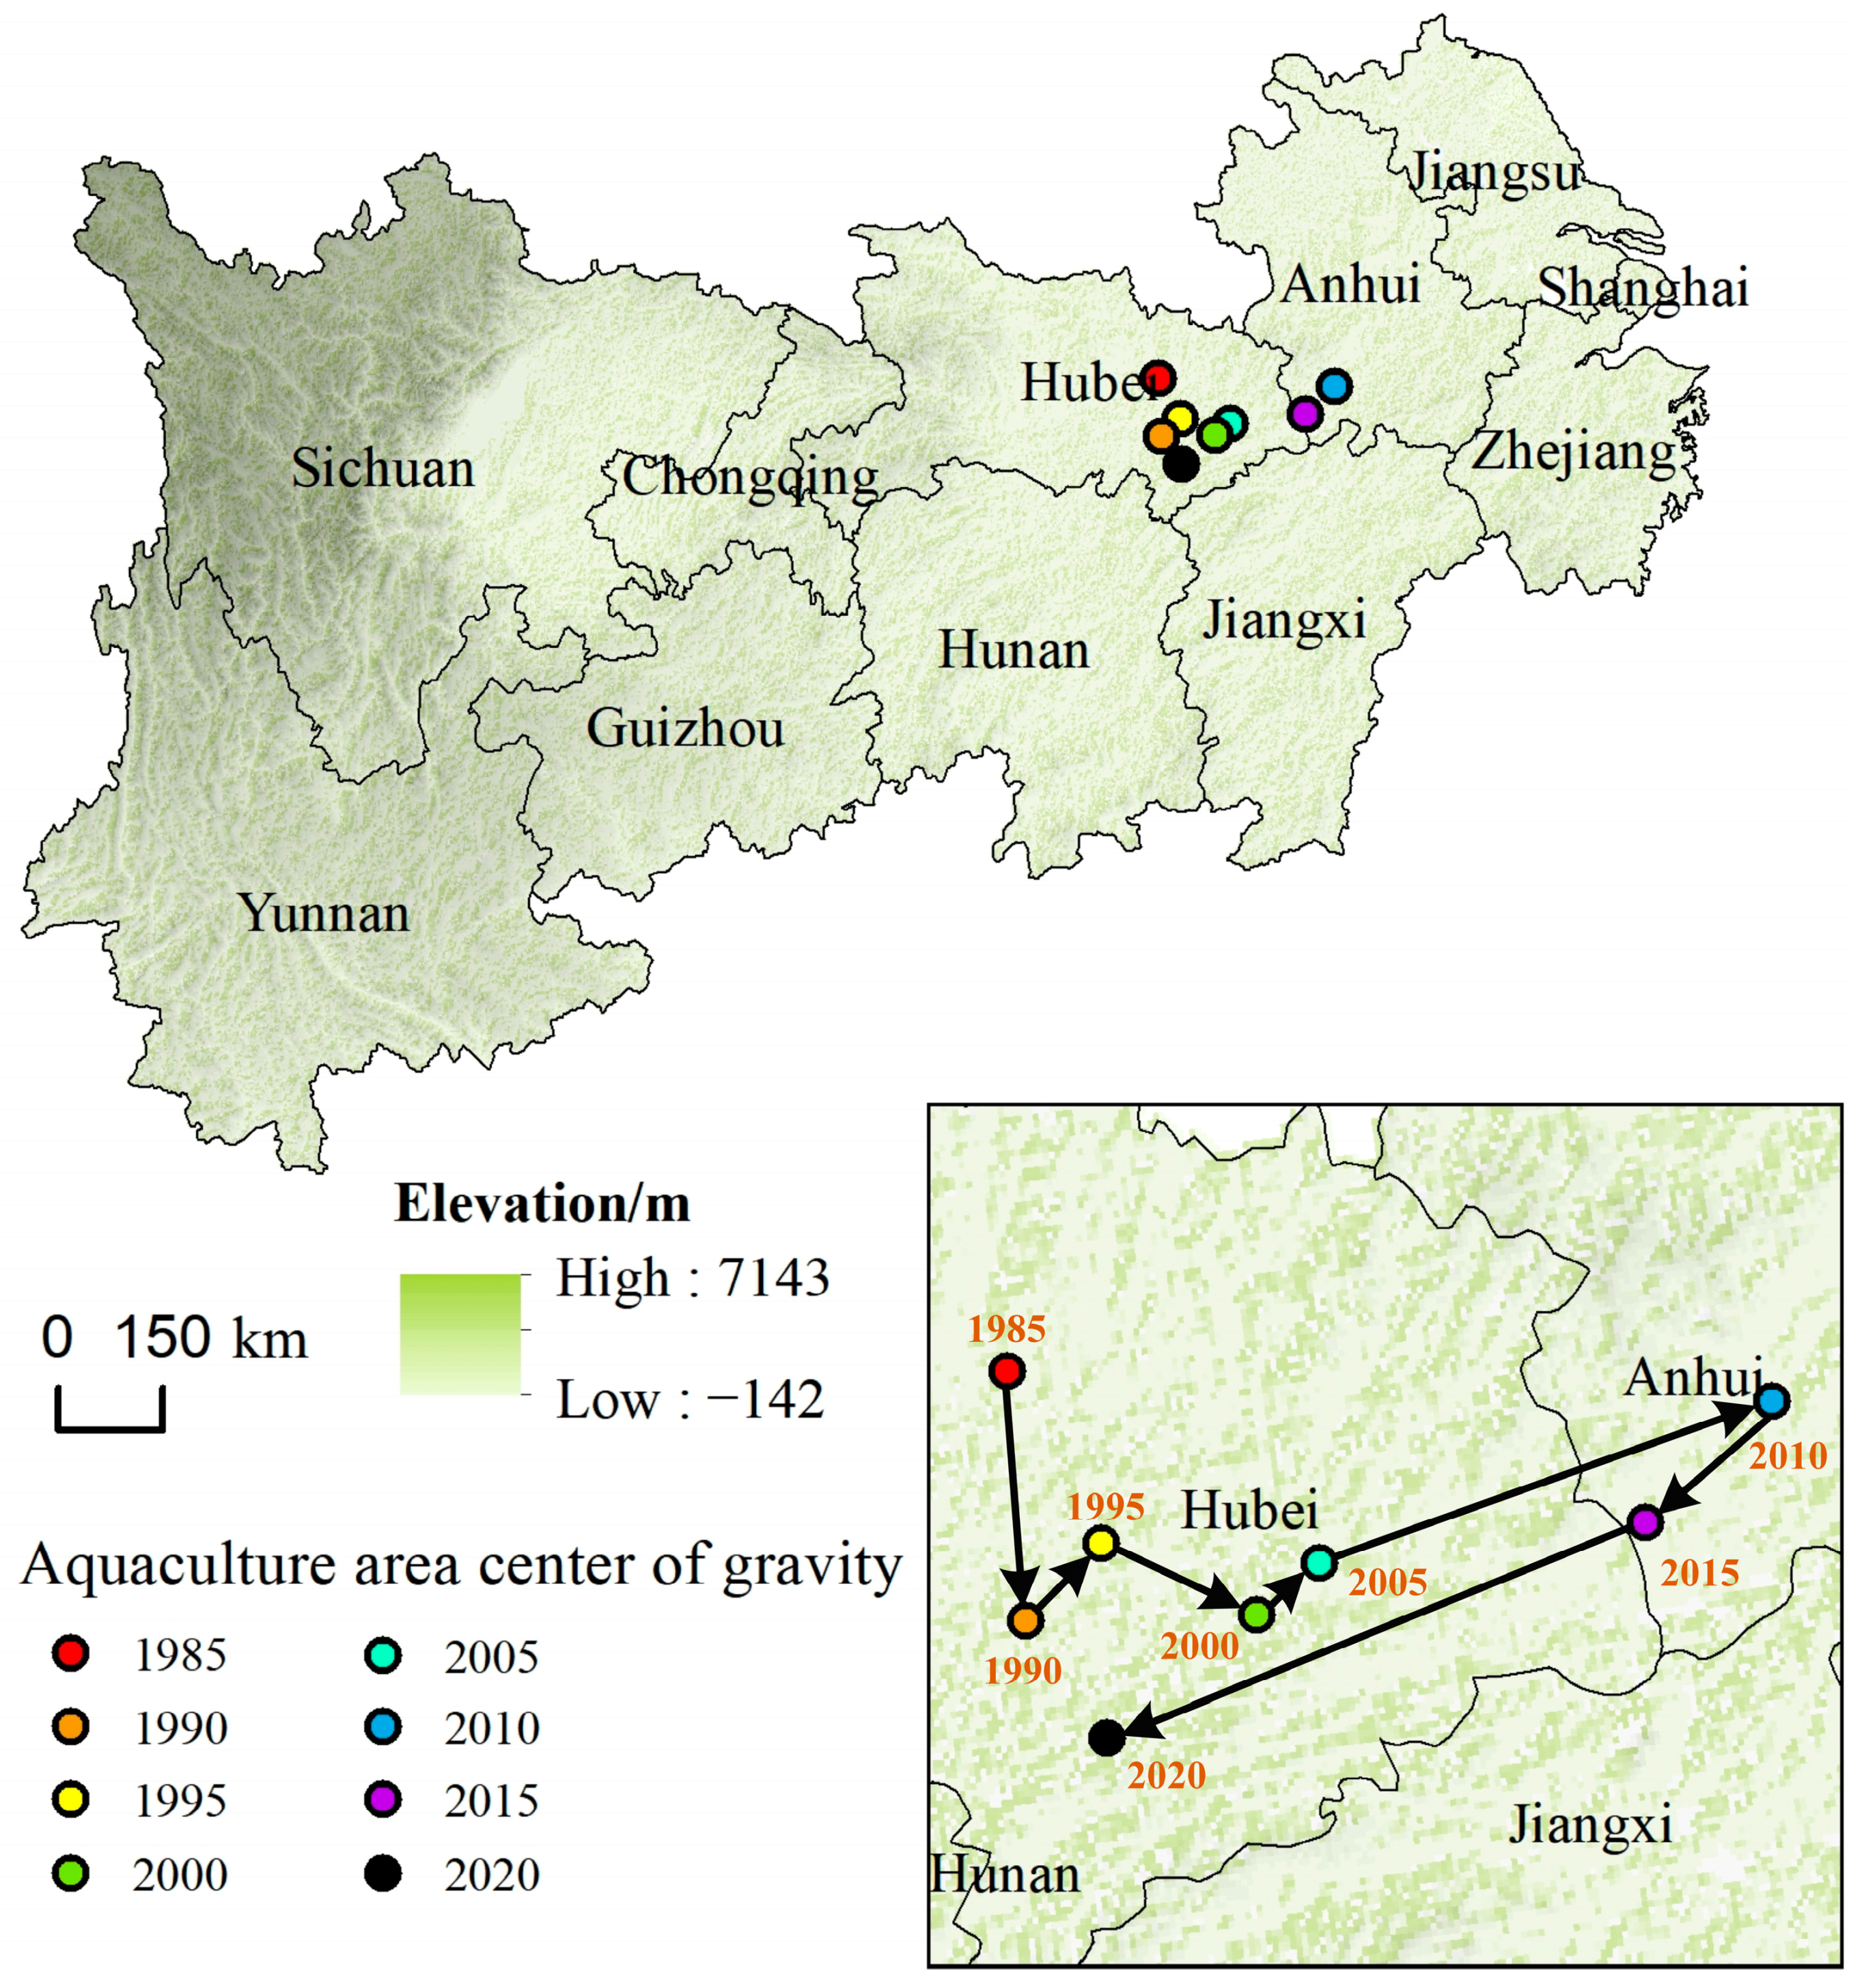
3.2. Analysis of the Centroid Shift in Aquaculture Ponds of the Yangtze River Economic Belt from 1985 to 2020

The centroid shift provides an intuitive representation of the overall characteristics of spatial changes in regional land cover. By examining the direction and distance of this shift across different land cover types, we can gain insights into the distributional characteristics of these spatial changes. Furthermore, associating the direction and distance of the centroid shift with the regional natural economic conditions can shed light on the variations in the quality of land cover types. The direction and distance of the centroid shift can be articulated through the changes in the centroid coordinates [60], which can be calculated using Equation (5):
X t = i = 1 n C t i × X i i = 1 n C t i , Y t = i = 1 n C t i × Y i i = 1 n C t i
where Xt and Yt denote the longitudinal and latitudinal coordinates of the centroid for a specific land cover type’s distribution in the t-th year. Cti signifies the area of the i-th patch of a specific land cover type in the t-th year. Xj and Yi, on the other hand, represent the longitudinal and latitudinal coordinates of the geometric center of the i-th patch of a specific land cover type. The centroid shift analysis results, depicted in Figure 5, were obtained by conducting calculations in ArcGIS based on Equation (5).
As depicted in Figure 5, the centroid of the aquaculture ponds was situated within the boundaries of Hubei Province during the periods of 1985–2005 and 2020, and within Anhui Province in the years 2010 and 2015. In general, the centroid of aquaculture exhibited a trend of initially moving eastward, then westward in the east–west direction, and an overall southward shift in the north–south direction. More specifically, from 1985 to 2010, the centroid of the aquaculture ponds shifted westward, and continued this westward shift from 2010 to 2020. The precise numerical values of the direction and distance of the centroid migration are presented in Table 5. In recent years, the centroid has gradually shifted to the west side, mainly concentrating in certain areas of Hubei and Anhui provinces. This shift indicates that, in recent years, the aquaculture ponds in the western provinces have experienced relatively rapid expansion, which is more evident compared to the expansion speed in the eastern provinces.

3.3. The Impact of Changes in Aquaculture Ponds on the Yangtze River Economic Belt region from 1985 to 2020

The land cover transition matrix provides insights into the structural characteristics of land cover types at the beginning and end of the study period, as well as the state of land class transitions. It is currently the most extensively utilized method in studies of dynamic land cover changes [61]. Its expression is represented as in Equation (6):
S i j = S 11 S 12 S 13 S 1 n S 21 S 22 S 23 S 2 n S 31 S 32 S 33 S 3 n S n 1 S n 2 S n 3 S n n
where S represents area; n represents the type and quantity of land cover; Sij is the area of land cover type i transformed into type j during the study period.
This study used the land cover data (including aquaculture areas) of the Yangtze River Economic Belt region from 1985 to 2020, as discussed in the previous section, to calculate the corresponding land cover transition matrix in ArcGIS. We then analyzed the changes in land cover transitions of the aquaculture ponds in the Yangtze River Economic Belt region from 1985 to 2020. As shown in Table 6 and Figure 6, between 1985 and 2020, the overall area of inland aquaculture ponds was on an upward trend, increasing from 3235.51 km2 in 1985 to 14,207.08 km2 in 2020, indicating a significant expansion.
From the perspective of transfer, the aquaculture ponds was mainly transferred out to water body and cropland, and the transfer area was 1232.39 km2 and 371.41 km2, accounting for 61.06% and 18.40% of the total area transferred out, respectively; on the other hand, aquaculture ponds was mainly transferred in from cropland, water bodies, and forests, and the transfer areas are 7786.77 km2, 3297.68 km2, and 1404.90 km2, accounting for 70.97%, 30.06%, and 12.80% of the total area transferred in, respectively.
In terms of net increase or decrease, grassland and wetland were mainly restored from aquaculture ponds, and the restored area is 4.03 km2 and 0.16 km2, accounting for 96.18% and 3.82% of the total restored area, respectively; additionally, aquaculture ponds mainly expanded to cropland, water bodies, and forests, with expansion areas of 7415.36 km2, 2065.29 km2, and 1260.69 km2, accounting for 67.84%, 18.90%, and 11.53% of the total expansion areas, respectively, from 1985 to 2020.
Further longitudinal analysis revealed that the expansion of aquaculture ponds exhibited different trends at various stages: Initially, inland aquaculture ponds mainly transitioned to cropland and water bodies; with industry development, aquaculture ponds began transitioning to more diverse types of land, particularly expanding into ecologically vulnerable areas like forests and grasslands. In recent years, the trend of transitioning to water bodies and cropland has remained stable. However, it is worth noting that the transition of aquaculture ponds to ecologically vulnerable areas like forests and grasslands continues to increase, suggesting that its impact on the ecological environment may become increasingly complex and significant in the future.

4. Discussion

Currently, studies on land cover transitions in aquaculture ponds predominantly concentrate on coastal regions or smaller inland zones, leaving the land transition scenarios and driving factors in extensive inland aquaculture regions largely unexplored. For instance, Chunying Ren et al. discovered that the expansion of coastal aquaculture ponds in China, primarily triggered by wetlands and cropland, was evident from the analysis of land cover types converted into aquaculture ponds in China’s coastal provinces from 1984 to 2016 [62]. Similarly, Bochuan Zhao et al. deduced from the 2009 and 2019 land cover data of Suining City, Jiangsu Province, in China’s coastal region, that the area primarily expanded its aquaculture ponds by encroaching upon cropland [63]. Jie Xu et al., utilizing Landsat imagery, visually interpreted and extracted the aquaculture area in Qianjiang City, Hubei Province, from 1990 to 2022, noting a rapid decrease in cropland area and an increase in aquaculture area [64]. These findings bear relevance to this study’s conclusion that the expansion of aquaculture ponds within the Yangtze River Economic Belt primarily involves the utilization of cropland, water bodies, and forests, albeit with certain discrepancies. Consequently, this paper will delve into the driving forces behind the inflow and outflow transitions in the aquaculture ponds within China’s inland Yangtze River Economic Belt.
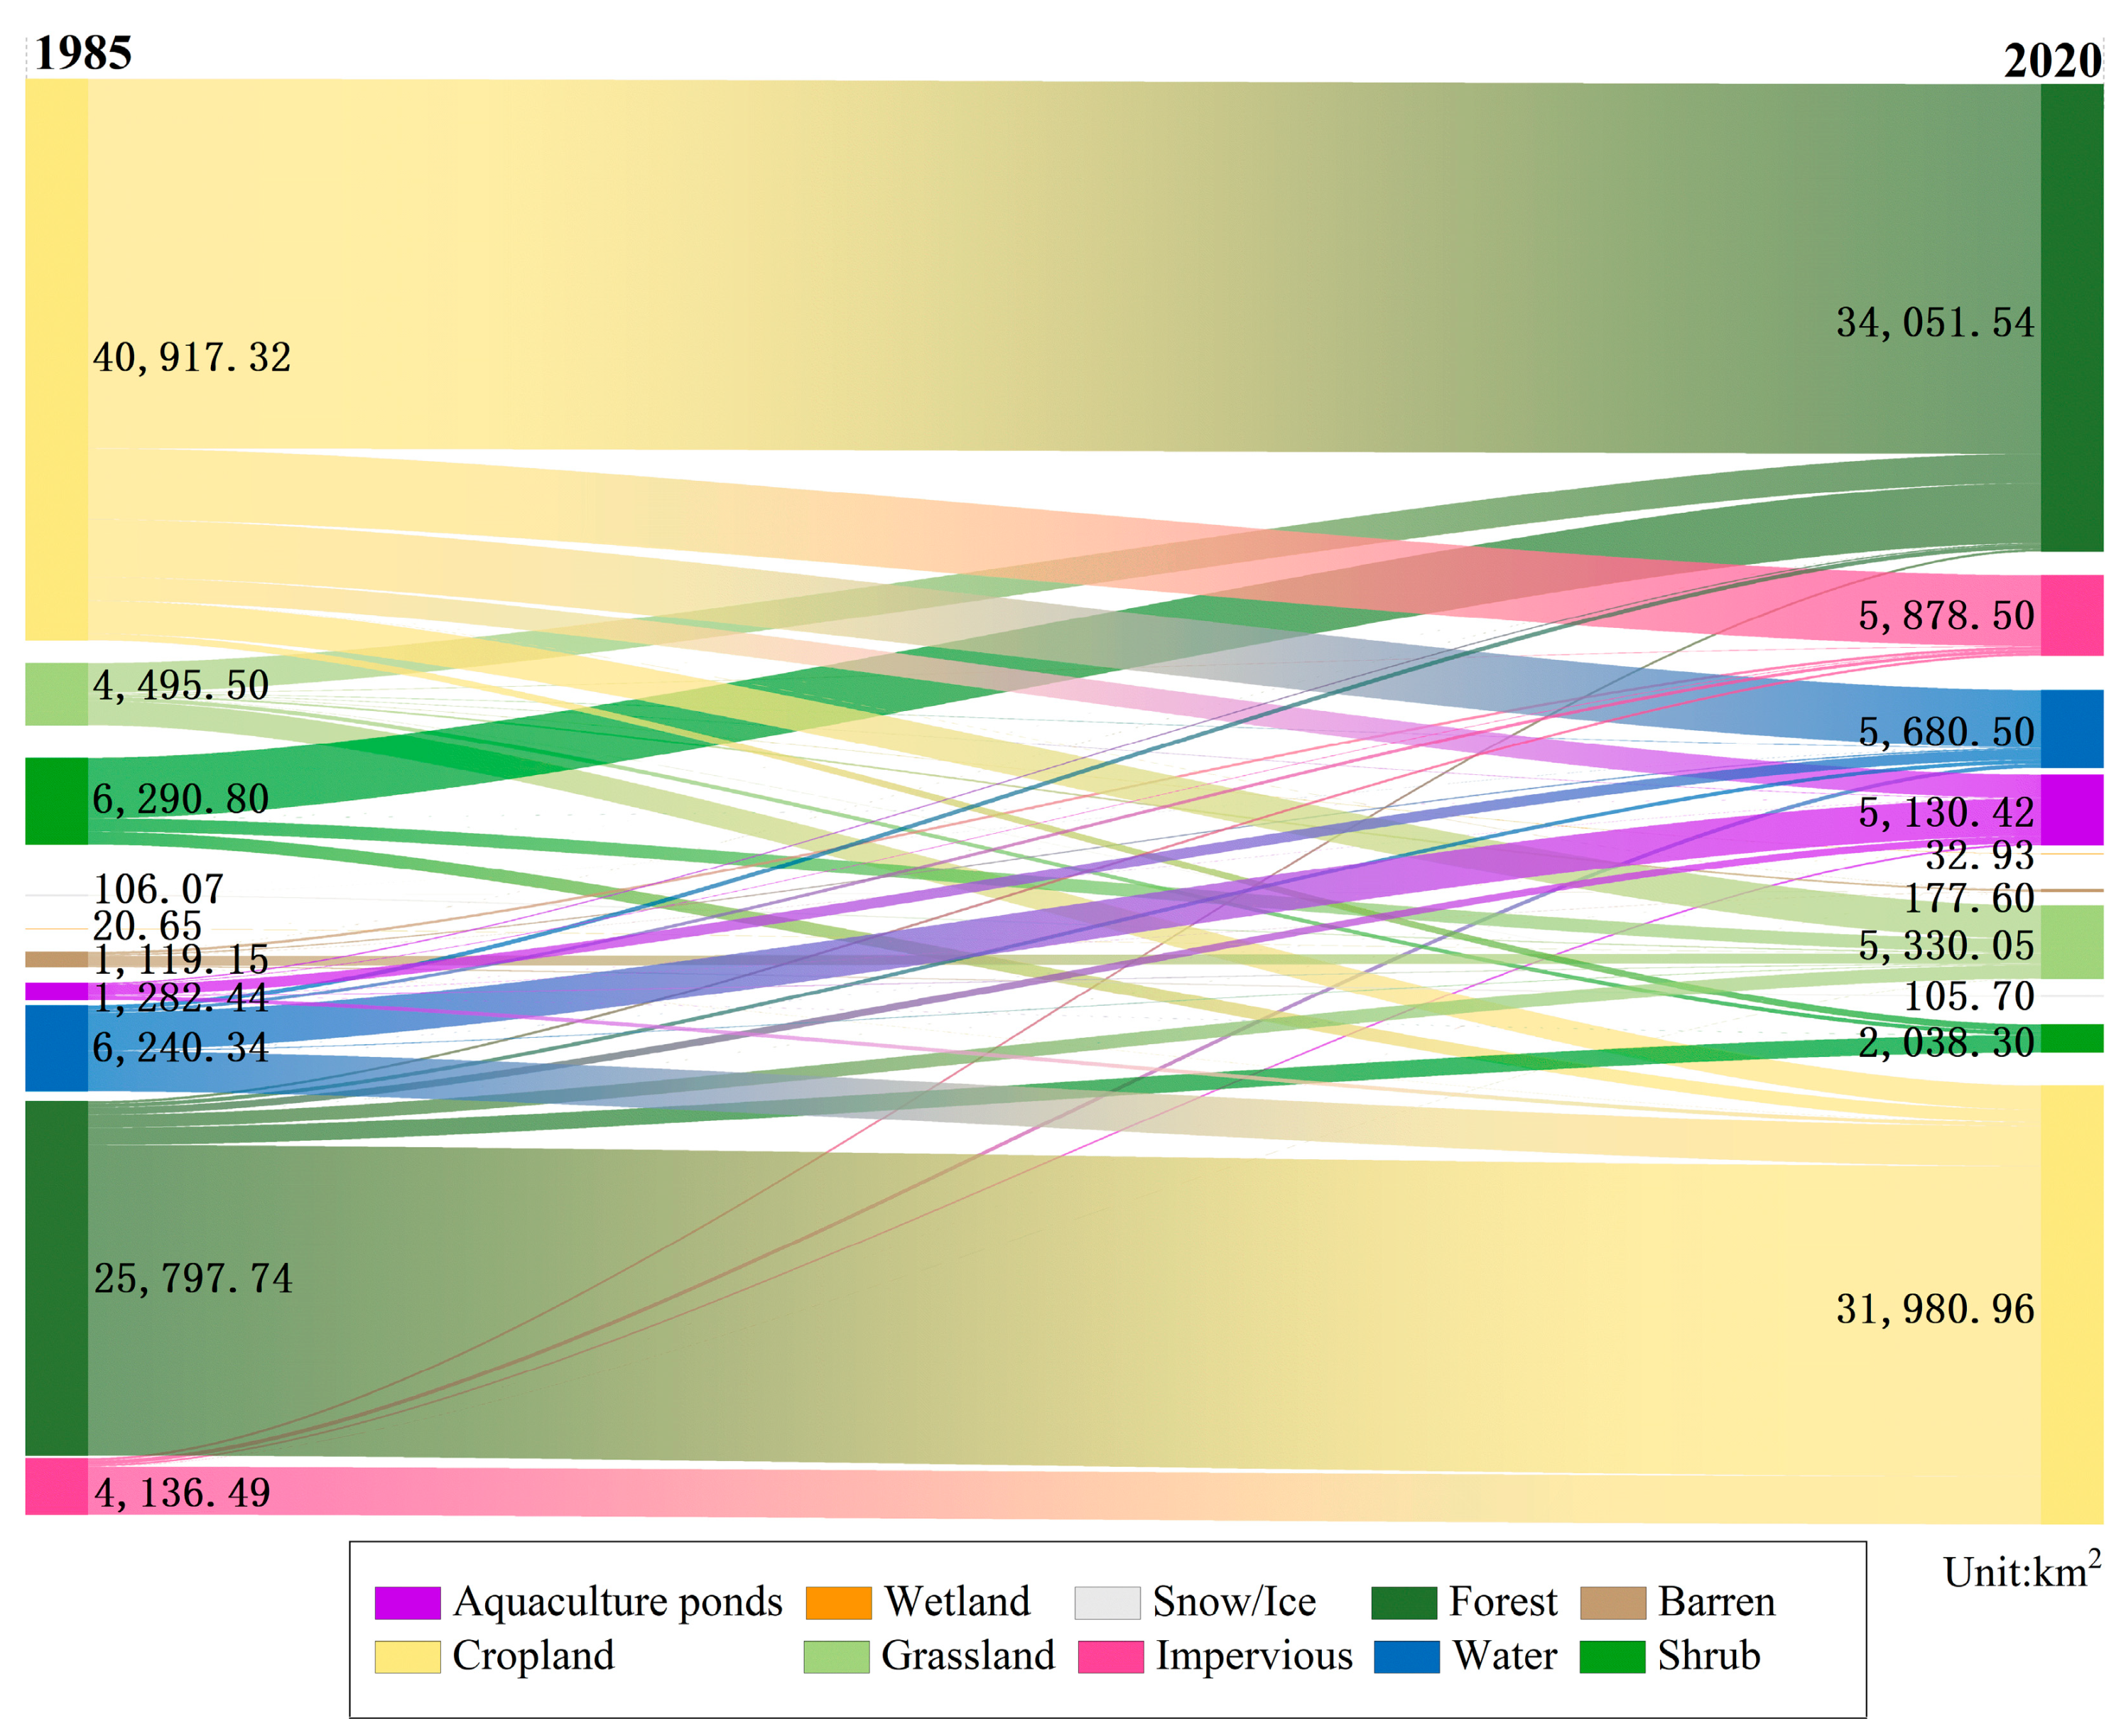
  • Aquaculture ponds in inland regions predominantly transition into cropland, while those in coastal regions largely convert into water bodies. This trend could be attributed to the relatively fertile soil conditions in inland areas, coupled with the state’s enforcement of permanent basic cropland protection and cropland occupation–compensation balance systems to safeguard arable land. Conversely, coastal regions are influenced by the richness of marine resources and the tradition of aquaculture. Given the limited nature of terrestrial resources, a majority of coastal countries or regions have adopted strategies for large-scale marine development. China has also officially proposed and initiated the implementation of marine–land spatial planning, extending the spatial functional zoning previously confined to land to encompass marine areas [65]. Consequently, this paper advocates the formulation of differentiated planning and management strategies for aquaculture areas in both inland and coastal regions to cater to the unique development needs and environmental protection objectives of these diverse regions.
  • The primary land types transitioning into aquaculture areas are cropland, water bodies, and forests. Specifically, the area of cropland transitioning into aquaculture ponds amounts to 7415.36 km2. This shift could be associated with agricultural transformation and adjustments in industrial structure. As a significant sector within agriculture, aquaculture attracts farmers to allocate a portion of their cropland for breeding purposes, aiming to reap higher economic returns. The area of water bodies transitioning into aquaculture zones is 2065.29 km2. This transition could be attributed to the scarcity of fishery resources and the surge in market demand. As aquaculture expands, some water bodies are repurposed for aquaculture to cater to the public’s demand for aquatic products. The area of forests transitioning into aquaculture zones is 1260.69 km2. This shift could be due to a combination of resource utilization and market demand, as aquaculture necessitates a certain area of forest for farm construction and timber supply. However, it is crucial to note that the large-scale transition of cropland, water bodies, and forests could potentially impact food production and the sustainable development of ecosystems. Therefore, in the decision-making process, it is essential to strike a balance between the growth of agriculture and aquaculture and reinforcing the protection and rational utilization of water and forest resources.
Furthermore, Procambarus clarkii, commonly known as crayfish, plays a pivotal role in the proliferation of aquaculture within the Yangtze River Economic Belt. A comparative analysis of the “China Fisheries Statistical Yearbook” and the “China Crayfish Industry Development Report” for corresponding years reveals that from 1985 to 2020, provinces such as Zhejiang, Hubei, and Jiangxi, which have witnessed significant aquaculture expansion within the Yangtze River Economic Belt, primarily cultivate species like crayfish, bass, and tilapia. Notably, the evolution of crayfish aquaculture in this region is the most striking [66,67]. The crayfish industry experienced a rapid expansion from 2000 to 2018, and although the growth rate decelerated from 2018 to 2020, it maintains a steady upward trajectory (Figure 7). This pattern is consistent with the expansion of aquaculture in the western region of the Yangtze River Economic Belt, providing some explanation for its transformation.
This study has accomplished an examination of the spatiotemporal evolution of aquaculture ponds in the Yangtze River Economic Belt from 1985 to 2020, primarily focusing on large-scale, typical aquaculture ponds. Despite achieving initial research findings, the diversity of aquaculture methods and water bodies has not been fully considered. This study does not account for small, fragmented earth ponds or offshore cage farming, among others. Some paddy fields utilized for freshwater farming have not been considered. Additionally, the aquaculture ponds have not been segmented into distinct categories. Consequently, the study has certain limitations and presents a gap in conducting a comprehensive national fishery resource survey. These aspects will be addressed and enhanced in future research.

5. Conclusions

This study uses Landsat 5 and Sentinel-2 data to identify aquaculture ponds within the Yangtze River Economic Belt. The employed method amalgamates various types of information, including spectral characteristics, spatial structure, cyclical rhythms of objects, and topography, thereby ensuring effective extraction. Further analysis of spatiotemporal distribution shifts and land cover evolution patterns leads to the following specific conclusions:
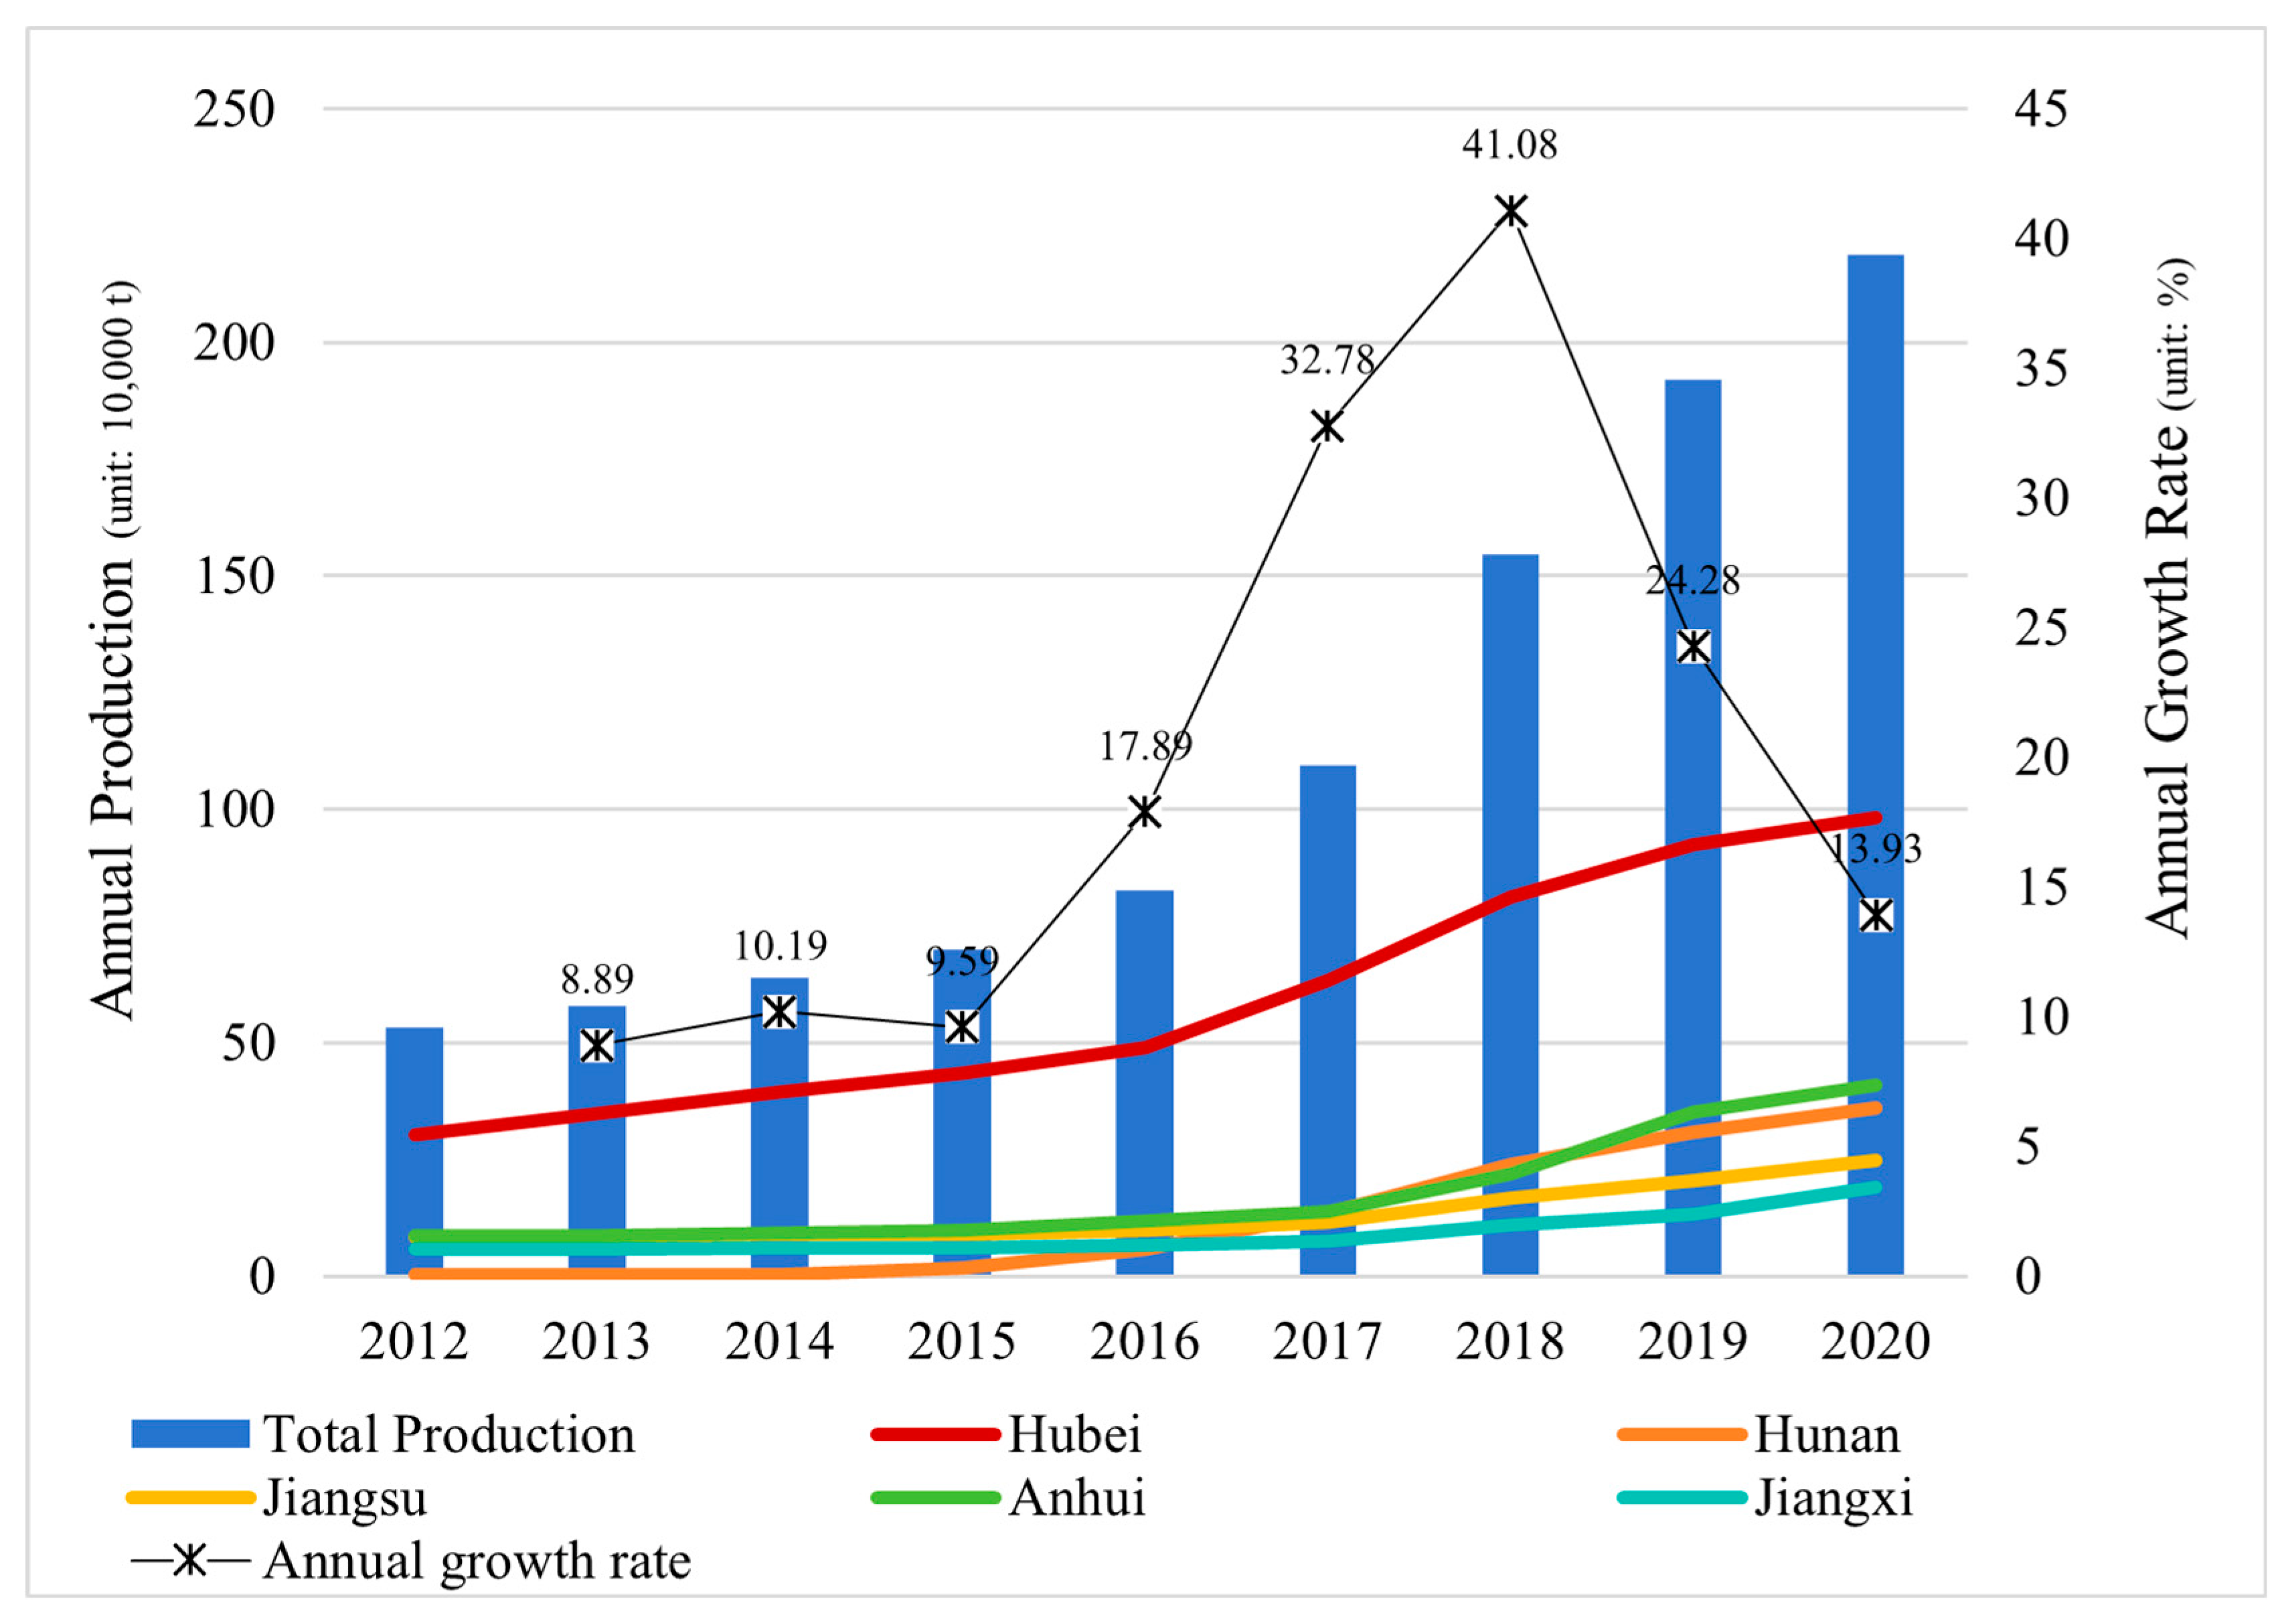
  • From the perspective of scale, the area of aquaculture ponds in the Yangtze River Economic Belt underwent substantial changes from 1985 to 2020, exhibiting an overall growth trend, escalating from 3235.51 km2 in 1985 to 14,207.08 km2 in 2020. The newly established aquaculture ponds are primarily located in Zhejiang, Jiangxi, Jiangsu, and Hubei provinces.
  • In terms of spatial distribution, the overall aquaculture ponds in the Yangtze River Economic Belt from 1985 to 2015 displayed an “east-heavy, west-light” spatial distribution pattern, primarily concentrated in the central–northern and southern parts of Jiangsu, bordering Shanghai, Anhui, and Zhejiang. From 2015 to 2020, the aquaculture area gradually shifted westward, primarily concentrating in parts of Hubei, Hunan, and Jiangxi provinces. In recent years, the aquaculture area in the western region has experienced a relatively rapid expansion, noticeably contrasting with the expansion speed in the eastern region.
  • From the perspective of land cover changes, between 1985 and 2020 the aquaculture area in the Yangtze River Economic Belt increased overall, with the aquaculture area mainly transitioning to water bodies and cropland, and a minor portion transitioning to impervious surfaces, forests, and grasslands. The expansion in the aquaculture area exhibited different trends at different stages. The large-scale conversion of cropland, water bodies, and forest land could potentially impact food production and the sustainable development of ecosystems. Therefore, in the decision-making process, it is crucial to balance the protection and rational utilization of water and forest resources while promoting agricultural and aquaculture development. Given the differences between Inland and coastal areas, it is recommended to formulate differentiated planning and management strategies for aquaculture areas to cater to the development needs of different regions and achieve environmental protection objectives.

Author Contributions

Conceptualization, Y.M. and Z.W.; methodology, Y.M. and J.Z.; software, Y.M. and J.Z.; formal analysis Y.M. and J.Z.; writing—original draft preparation, Y.M. and J.Z.; writing—review and editing, Z.W. and X.Y.; supervision, Z.W. All authors have read and agreed to the published version of the manuscript.

Funding

This study was funded by the National Natural Science Foundation of China (42371473), the Youth Project of Innovation LREIS (YPI004), and the Key Project of Innovation LREIS (KPI001).

Data Availability Statement

The data will be made available upon request.

Acknowledgments

The authors would like to extend sincere appreciation to the United States Geological Survey and the National Aeronautics and Space Administration for the provision of the SRTM v4 data. Our gratitude also goes to the European Space Agency for making the Sentinel-2 data available. We also acknowledge the Standard Map Service website of the Ministry of Natural Resources for supplying the standard map data. We would like to extend our heartfelt thanks to Google for their provision of an efficient and robust computing platform for the GEE platform. We express our gratitude to the reviewers and editors for their invaluable suggestions for revising this paper. We also extend our appreciation to Ku Gao from the State Key Laboratory of Resources and Environmental Information System for his insightful guidance during the revision phase of the paper.

Conflicts of Interest

The authors declare no conflict of interest.

References

  1. Wang, P.; Ji, J.; Zhang, Y. Aquaculture extension system in China: Development, challenges, and prospects. Aquac. Rep. 2020, 17, 100339. [Google Scholar] [CrossRef]
  2. Zhang, W.B.; Ma, X.Z. China’s aquaculture development trends since 2000 and future directions. J. Shang Hai Ocean Univ. 2020, 29, 661–674. [Google Scholar]
  3. Liu, Y.; Wang, Z.; Yang, X.; Wang, S.; Liu, X.; Liu, B.; Zhang, J.; Meng, D.; Ding, K.; Gao, K. Changes in mariculture and offshore seawater quality in China during the past 20 years. Ecol. Indic. 2023, 157, 111220. [Google Scholar] [CrossRef]
  4. Crab, R.; Defoirdt, T.; Bossier, P.; Verstraete, W. Biofloc technology in aquaculture: Beneficial effects and future challenges. Aquaculture 2012, 356–357, 351–356. [Google Scholar] [CrossRef]
  5. Yang, P.; Lai, D.Y.F.; Jin, B.; Bastviken, D.; Tan, L.; Tong, C. Dynamics of dissolved nutrients in the aquaculture shrimp ponds of the Min River estuary, China: Concentrations, fluxes and environmental loads. Sci. Total Environ. 2017, 603–604, 256–267. [Google Scholar] [CrossRef] [PubMed]
  6. Zhang, K.; Xie, J.; Yu, D.; Wang, G.; Yu, E.; Gong, W.; Li, Z.; Wang, C.; Xia, Y. A comparative study on the budget of nitrogen and phosphorus in polyculture systems of snakehead with bighead carp. Aquaculture 2018, 483, 69–75. [Google Scholar] [CrossRef]
  7. Ouyang, Y. Study on Water Footprint of Freshwater Cultured Fish and Spatial Optimization of Cultured Policy in China. Ph.D. Thesis, Dalian University of Technology, Dalian, China, 2018. [Google Scholar]
  8. Tran, H.; Tran, T.; Kervyn, M. Dynamics of land cover/landuse changes in the mekong delta, 1973–2011: A remote sensing analysis of the tran van thoi district, Ca Mau province, Vietnam. Remote Sens. 2015, 7, 2899–2925. [Google Scholar] [CrossRef]
  9. Vo, T.Q.; Kuenzer, C.; Oppelt, N. How remote sensing supports mangrove ecosystem service valuation: A case study in Ca Mau province, Vietnam. Ecosyst. Serv. 2015, 14, 67–75. [Google Scholar]
  10. Vo, Q.; Oppelt, N.; Leinenkugel, P.; Kuenzer, C. Remote sensing in mapping mangrove ecosystems: An object-based approach. Remote Sens. 2013, 5, 183–201. [Google Scholar] [CrossRef]
  11. Liu, Y.; Saitoh, S.-I.; Nakada, S.; Zhang, X.; Hirawake, T. Impact of oceanographic environmental shifts and atmospheric events on the sustainable development of coastal aquaculture: A case study of kelp and scallops in Southern Hokkaido, Japan. Sustainability 2015, 7, 1263–1279. [Google Scholar] [CrossRef]
  12. Virdis, S.G.P. An object- based image analysis approach for aquaculture ponds precise mapping and monitoring: A case study of Tam Giang-Cau Hai Lagoon, Vietnam. Environ. Monit. Assess. 2014, 186, 117–133. [Google Scholar] [CrossRef] [PubMed]
  13. Chang, B.; Li, R.; Zhu, C.; Liu, K. Quantitative impacts of climate change and human activities on water- surface area variations from the 1990s to 2013 in Honghu Lake, China. Water 2015, 7, 2881–2899. [Google Scholar] [CrossRef]
  14. Lu, Y.; Li, Q.; Du, X.; Wang, H.; Liu, J. A method of coastal aquaculture area automatic extraction with high spatial resolution images. Remote Sens. Technol. Appl. 2015, 30, 486–494. [Google Scholar]
  15. Liu, J.X.; Ma, Y.; Li, X.M.; Cui, T.W. TUPU characteristic analysis of the salt fields and aquaculture areas incoastal zone based on domestic high spatial resolution satellite images. Mar. Sci. 2015, 39, 63. [Google Scholar]
  16. Du, Y.Y.; Wu, D.; Liang, F.Y.; Li, C. Integration of case-based reasoning and object- based image classification toclassify SPOT images: A case study of aquaculture landuse mapping in coastal areas of Guangdong province, China. Mapp. Sci. Remote Sens. 2013, 50, 574–589. [Google Scholar]
  17. Meng, Q.W. Monitoring drought in mountainous areabased on temperature/vegetation dryness index (TVDI). Arid. Land Geogr. 2007, 30, 30–35. [Google Scholar]
  18. Jayanthi, M. Monitoring brackishwater aquaculture development using multi-spectral satellite data and GIS: A case study near Pichavaram mangroves south-east coast of India. Indian J. Fish. 2011, 58, 85–90. [Google Scholar]
  19. Zhou, X.C.; Wang, X.Q.; Xiang, T.L.; Jiang, H. Method of automatic extracting seaside aquaculture land based on ASTER remote sensing image. Wetl. Sci. 2006, 4, 64–68. [Google Scholar]
  20. Li, J.J.; He, L.H.; Dai, J.F.; Li, J.L. Extract enclosure culture in lakes based on remote sensing image texture information. J. Lake Sci. 2006, 18, 337–342. [Google Scholar]
  21. Wang, Z.H.; Yang, X.M.; Zhou, C.H. Geographic knowledge graph for remote sensing big data. J. Geo-Inf. Sci. 2021, 23, 16–28. [Google Scholar]
  22. Salas, E.; Boykin, K.; Valdez, R. Multispectral and texture feature application in image- object analysis of summer Vegetation in Eastern Tajikistan Pamirs. Remote Sens. 2016, 8, 78. [Google Scholar] [CrossRef]
  23. Hussain, E.; Shan, J. Object-based urban land cover classification using rule inheritance over very high- resolution multisensor and multitemporal data. Mapp. Sci. Remote Sens. 2016, 53, 164–182. [Google Scholar] [CrossRef]
  24. Zhang, C. Multiscale quantification of urban composition from EO-1/Hyperion data using object-based spectral unmixing. Int. J. Appl. Earth Obs. Geoinf. 2016, 47, 153–162. [Google Scholar] [CrossRef]
  25. Shirke, S.; Pinto, S.M.; Kushwaha, V.K.; Mardikar, T.; Vijay, R. Object-based image analysis for the impact of sewage pollution in Malad Creek, Mumbai, India. Environ. Monit. Assess. 2016, 188, 95. [Google Scholar] [CrossRef] [PubMed]
  26. Duan, Y.Q.; Li, X.; Zang, L.P.; Chen, D.; Liu, S.; Ji, H.Y. Mapping national-scale aquaculture ponds based on the Google Earth Engine in the Chinese coastal zone. Aquaculture 2020, 520, 734666. [Google Scholar] [CrossRef]
  27. Zhang, J.Y.; Yang, X.M.; Wang, Z.H.; Liu, Y.M.; Liu, X.L.; Ding, Y.X. Mapping of land-based aquaculture regions in southeast asia and its spatiotemporal change from 1990 to 2020 using time-series remote sensing data. Int. J. Appl. Earth Obs. Geoinf. 2023, 124, 103518. [Google Scholar] [CrossRef]
  28. Wen, K.; Yao, H.M.; Huang, Y.; Chen, H.Q.; Liao, P.R. Remote sensing image extraction for coastal aquaculture ponds in the Guangxi Beibu Gulf based on Google Earth Engine. Trans. Chin. Soc. Agric. Eng. 2021, 37, 280–288. [Google Scholar]
  29. Hu, J.C.; Huang, M.D.; Yu, H.Y.; Li, Q.B. Research on extraction method of offshore aquaculture area based on Sentinel-2 remote sensing imagery. Mar. Environ. Sci. 2022, 41, 619–627. [Google Scholar]
  30. Wang, Z.H.; Zhang, J.Y.; Yang, X.M.; Huang, C.; Su, F.Z.; Liu, X.L.; Liu, Y.M.; Zhang, Y.Z. Global mapping of the landside clustering of aquaculture ponds from dense time-series 10 m Sentinel-2 images on Google Earth Engine. Int. J. Appl. Earth Obs. Geoinf. 2022, 115, 103100. [Google Scholar] [CrossRef]
  31. Wang, Z.H.; Yang, X.M.; Liu, Y.M.; Lu, C. Extraction of coastal raft cultivation area with heterogeneous water background by thresholding object-based visually salient NDVI from high spatial resolution imagery. Remote Sens. Lett. 2018, 9, 839–846. [Google Scholar] [CrossRef]
  32. Liu, Y.M.; Yang, X.M.; Wang, Z.H.; Lu, C. Extracting raft aquaculture areas in Sanduao from high- resolution remote sensing images using RCF. Haiyang Xuebao 2019, 41, 119–130. [Google Scholar]
  33. Liu, Y.M.; Yang, X.M.; Wang, Z.H.; Lu, C.; Li, Z.; Yang, F.S. Aquaculture area extraction and vulnerability assessment in Sanduao based on richer convolutional features network model. J. Oceanol. Limnol. 2019, 37, 1941–1954. [Google Scholar] [CrossRef]
  34. Wang, J.; Sui, L.C.; Yang, X.M.; Wang, Z.H.; Liu, M.Y.; Kang, J.M.; Lu, C.; Yang, F.S.; Liu, B. Extracting Coastal Raft Aquaculture Data from Landsat 8 OLI Imagery. Sensors 2019, 19, 1221. [Google Scholar] [CrossRef] [PubMed]
  35. Kang, J.M.; Sui, L.C.; Yang, X.M.; Wang, Z.H.; Wang, J.; Yang, F.S.; Liu, B.; Ma, Y.Z. Sea Surface-Visible Aquaculture Spatial-Temporal Distribution Remote Sensing: A Case Study in Liaoning Province, China from 2000 to 2018. Sustainability 2019, 11, 7186. [Google Scholar] [CrossRef]
  36. Liu, Y.M.; Wang, Z.H.; Yang, X.M.; Zhang, Y.Z.; Yang, F.S.; Liu, B.; Cai, P.Y. Satellite-based monitoring and statistics for raft and cage aquaculture in China’s offshore waters. Int. J. Appl. Earth Obs. Geoinf. 2020, 91, 102118. [Google Scholar] [CrossRef]
  37. Liu, X.L.; Wang, Z.H.; Yang, X.M.; Liu, Y.M.; Liu, B.; Zhang, J.Y.; Gao, K.; Meng, D.; Ding, Y.X. Mapping China’s offshore mariculture based on dense time-series optical and radar data. Int. J. Digit. Earth 2022, 15, 1326–1349. [Google Scholar] [CrossRef]
  38. Wang, J.; Yang, X.M.; Wang, Z.H.; Ge, D.Z.; Kang, J.M. Monitoring Marine Aquaculture and Implications for Marine Spatial Planning-An Example from Shandong Province. Remote Sens. 2022, 14, 732. [Google Scholar] [CrossRef]
  39. Yuan, X. Remote Sensing Monitoring of the Spatial and Temporal Changes and Ecological Impact Analysis of Coastal Aquaculture in Hainan Island. Master’s Thesis, Shandong University of Science and Technology, Qingdao, China, 2021. [Google Scholar]
  40. Meng, Q.Q. Spatial-Temporal Relationship between Land Use Intensity and Ecosystem Service Value and Scenario Simulation for Sustainability in Northern Liaodong Bay in Recent 30 Years. Master’s Thesis, Liaoning Normal University, Liaoning, China, 2021. [Google Scholar]
  41. Periyasamy, R.; Roy, P.D.; Chokkalingam, L.; Natarajan, L.; Sundar, S.; Moorthy, P.; Gowrappan, M. Transformation Analysis on Landuse/Land Cover Changes for Two Decades Between 1999 and 2019 CE with Reference to Aquaculture—Nagapattinam Coast, Southeast India. Indian Soc. Remote Sens. 2021, 49, 2831–2845. [Google Scholar] [CrossRef]
  42. Gorelick, N.; Hancher, M.; Dixon, M.; Ilyushchenko, S.; Thau, D.; Moore, R. Google earth engine: Planetary-scale geospatial analysis for everyone. Remote Sens. Environ. 2017, 202, 18–27. [Google Scholar] [CrossRef]
  43. Wang, X.L.; Shi, S.H. Spatio-temporal changes of vegetation in the Yellow River Basin and related effect of landform based on GEE. J. Geo-Inf. Sci. 2022, 24, 1087–1098. [Google Scholar]
  44. Li, X.F.; Jiang, Q.J. Evaluation on the green development of aquaculture in the Yangtze River Economic Zone. Chin. Fish. Econ. 2021, 39, 81–89. [Google Scholar]
  45. Gao, L.F.; Wu, J.Y.; Ge, X.D.; Li, W.H.; Gao, X.; Huang, J.J. Pollution load characteristics of freshwater aquaculture in the Yangtze River Economic Belt. J. Huazhong Agric. Univ. 2021, 40, 64–74. [Google Scholar]
  46. Farr, T.G.; Rosen, P.A.; Caro, E.; Crippen, R.; Duren, R.; Hensley, S.; Kobrick, M.; Paller, M.; Rodriguez, E.; Roth, L.; et al. The Shuttle Radar Topography Mission. Rev. Geophys. 2007, 45, 361. [Google Scholar] [CrossRef]
  47. Pekel, J.F.; Cottam, A.; Gorelick, N.; Belward, A.S. High-resolution mapping of global surface water and its long-term changes. Nature 2016, 540, 418–422. [Google Scholar] [CrossRef] [PubMed]
  48. Yang, J.; Huang, X. The 30 m annual land cover dataset and its dynamics in China from 1990 to 2019. Earth Syst. Sci. Data 2021, 13, 3907–3925. [Google Scholar] [CrossRef]
  49. Duan, Y.Q. Automated Extraction and Spatiotemporal Analysis of Chinese Aquaculture Ponds Based on Google Earth. Master’s Thesis, Jiangsu Normal University, Xuzhou, China, 2020. [Google Scholar]
  50. Feyisa, G.L.; Meilby, H.; Fensholt, R.; Proud, S.R. Automated Water Extraction Index: A new technique for surface water mapping using Landsat imagery. Remote Sens. Environ. Interdiscip. J. 2014, 140, 23–35. [Google Scholar] [CrossRef]
  51. Zhang, H.; Zhang, D.Y.; He, Z.H. Study of OSTU Dynamic Threshold Based on Gray-scale Processing. Sens. World 2008, 157, 24–27. [Google Scholar]
  52. Huete, A.; Didan, K.; Miura, T.; Rodriguez, E.P.; Gao, X.; Ferreira, L.G. Overview of the radiometric and biophysical performance of the MODIS vegetation indices. Remote Sens. Environ. 2002, 83, 195–213. [Google Scholar] [CrossRef]
  53. Liu, X.; Ferguson, R.B.; Zheng, H.B.; Cao, Q.; Tian, Y.C.; Cao, W.X.; Zhu, Y. Using an active-optical sensor to develop an optimal NDVI dynamic model for high-yield rice production (Yangtze, China). Sensors 2017, 17, 672. [Google Scholar] [CrossRef]
  54. Yu, F.H.; Xu, T.Y.; Cao, Y.L.; Yang, G.J. Models for estimating the leaf NDVI of japonica rice on a canopy scale by combining canopy NDVI and multisource environmental data in Northeast China. Int. J. Agric. Biol. Eng. 2016, 9, 132–142. [Google Scholar]
  55. Liu, S.S.; Niu, C.J.; Bian, L.; Dao, J.; Wang, J.X.; Zhang, F.X. Remote sensing estimation of rice yield based on NDVI. Jiangsu Agric. Sci. 2019, 47, 193–198. [Google Scholar]
  56. Bao, J.; Gao, S. The Dynamic Evolution and Its Driving Fac tors of China’s Marine Salt Industry Since the 13th Century. Sci. Geogr. Sin. 2019, 39, 596–605. [Google Scholar]
  57. Xu, H.Q.; Xu, H. A study on information extraction of water body with the modified normalized difference water index (MNDWI). Remote Sens. 2005, 5, 589–595. [Google Scholar]
  58. Lyons, M.B.; Keith, D.A.; Phinn, S.R.; Mason, T.J.; Elith, J. A comparison of resampling methods for remote sensing classification and accuracy assessment. Remote Sens. Environ. 2018, 208, 145–153. [Google Scholar] [CrossRef]
  59. Efron, B.; Tibshirani, R. Improvements on Cross-Validation: The 632+ Bootstrap Method. J. Am. Stat. Assoc. 1997, 92, 548–560. [Google Scholar]
  60. Yang, Y.Y.; Liu, Y.S.; Li, Y.R.; Du, G.M. Quantifying spatio-temporal patterns of urban expansion in beijing during 1985–2013 with rural-urban development transformation. Land Use Policy 2018, 74, 220–230. [Google Scholar] [CrossRef]
  61. Mao, H.X.; Jia, K.L.; Gao, X.W.; Zhang, J.H. Spatiotemporal Pattern of Land Use Change in Yinchuan Plain from 1980 to 2018. Sci. Technol. Eng. 2020, 20, 8008–8018. [Google Scholar]
  62. Ren, C.Y.; Wang, Z.M.; Zhang, Y.Z.; Zhang, B.; Chen, L.; Xi, Y.B.; Xiao, X.M.; Doughty, R.B.; Liu, M.Y.; Jia, M.M. Rapid expansion of coastal aquaculture ponds in china from landsat observations during 1984–2016. Int. J. Appl. Earth Obs. Geoinf. 2019, 82, 101902. [Google Scholar] [CrossRef]
  63. Zhao, B.C.; Li, Y.F.; Wang, Y.Z.; Zhi, G.Q. Research on expansion characteristics of aquaculture ponds and variations in ecosystem service value from the perspective of protecting cultivated lands: A case study of Liyang city, China. Int. J. Environ. Res. Public Health 2022, 19, 8774. [Google Scholar] [CrossRef]
  64. Xu, J.; Mu, M.; Liu, Y.B.; Zhou, Z. Assessing 30-year land use and land cover change and the driving forces in qianjiang, china, using multitemporal remote sensing images. Water 2023, 15, 3322. [Google Scholar] [CrossRef]
  65. Wang, Z.H.; Gao, K.; Yang, X.M.; Su, F.Z.; Huang, C.; Shi, T.Z.; Yan, F.Q.; Li, H.; Zhang, H.F.; Lu, N.; et al. Land use/land cover classification development from a geographical perspective. Geogr. Res. 2022, 41, 2946–2962. [Google Scholar]
  66. Xu, Y.; Xu, Z.Q.; Huang, H.B.; Yan, W.H.; Tang, J.Q.; Xia, A.J.; Pan, J.L. Development history, present situation and prospect of Jiangsu crayfish industry. J. Aquac. 2021, 42, 77–80. [Google Scholar]
  67. Yu, X.J.; Hao, X.J.; Yang, L.K.; Dang, Z.Q.; Wang, X.G.; Zhang, Y.H.; Zhang, X. China crayfish Industry Development Report (2023) released that the farming area and output value have achieved steady growth. China Food 2023, 13, 92–95. [Google Scholar]
Figure 1. Overview of the study area.
Remotesensing 15 05477 g001
Figure 2. Technical route for extraction of aquaculture ponds in Yangtze River Economic Belt. (AWEInsh: Automated Water Extraction Index; NDVI: Normalized Difference Vegetation Index; MNDWI: Modified Normalized Difference Water Index; Lap 8: Laplacian 8).
Remotesensing 15 05477 g002
Figure 4. Spatial pattern of land cover in the Yangtze River Economic Belt, 1985–2020 (including land types of aquaculture areas).
Remotesensing 15 05477 g004
Figure 5. The centroid shift in aquaculture ponds of the Yangtze River Economic Belt from 1985 to 2020.
Remotesensing 15 05477 g005
Figure 6. Sankey chart of the land cover transition in Yangtze River Economic Belt, 1985–2020.
Remotesensing 15 05477 g006
Figure 7. Annual production and growth rate of crayfish in the main provinces of the Yangtze River Economic Belt where crayfish are farmed, 2012–2020.
Remotesensing 15 05477 g007
Table 1. Introduction and parameter description of Landsat, SRTM, and Sentinel series satellites.
Satellite PlatformSensorResolutionAccessGEE IDYears Selected in This Paper
Landsat 5TM30 mGEE datasetLANDSAT/LT05/C01/T1_SR1986, 1990, 1995, 2000, 2005, 2010
Sentinel-2 A/BMSI10 mGEE datasetCOPERNICUS/S2_SR2020
Sentinel-2 A/BMSI10 mGEE datasetCOPERNICUS/S22016
SRTMSAR90 mGEE datasetCGIAR/SRTM90_V41986–2020
Landsat 5, 7, 8TM, ETM+, OLI/TIRS30 mGEE datasetJRC/GSW1_4/Monthly History1986–2020
Table 2. Confusion matrix of aquaculture pond extraction results, 2020.
Reference Points
Aquaculture PondsNon-Aquaculture PondsUser
Accuracy
Classification PointsAquaculture Ponds131170.89
Non-Aquaculture Ponds278250.97
Cartographic Accuracy0.830.98
Overall Accuracy 0.96
Kappa 0.82
Table 3. Accuracy evaluation of aquaculture pond extraction results, 1985–2015.
YearOverall AccuracyKappa Coefficients
19850.88 0.76
19900.89 0.79
19950.90 0.79
20000.91 0.80
20050.92 0.81
20100.93 0.82
20150.95 0.83
Table 4. Changes in the area * of aquaculture ponds in the Yangtze River Economic Belt from 1986 to 2020.
Province19851990199520002005201020152020
Anhui399.73423.29454.8482.16733.58885.031051.461357.22
Guizhou6.9814.08101.64116.16325.29482.6653.96746.33
Hubei434.21480.61513.75552.03903.751527.662141.362468.29
Hunan431.6296.4340.32406.45649.6797.9887.561255.15
Jiangsu501.23575.71606.37658.07889.661485.851424.291932.57
Jiangxi614.5640.83674.54711.37989.261751.221924.142622.55
Shanghai25.2329.1232.6235.633.1553.6262.3766.44
Sichuan121.96171.81180.02191.1345.68430.49536.34616.85
Yunnan24.2629.3134.739.4886.23106.34141.89172.36
Zhejiang624.7694.67729.87813.181071.981811.442655.662854.3
Chongqing51.1156.4562.7665.8172.3194.27106.36115.02
Summation3235.513412.283731.394071.416100.499426.4211,585.3914,207.08
* Unit is km2.
Table 5. Parameters of the centroid shift in aquaculture ponds in Yangtze River Economic Belt, 1985–2020.
Time PeriodOffset DirectionOffset AngleOffset Distance
1985–1990West by South86.00°97.10 km
1990–1995East by North44.61°41.71 km
1995–2000East by South35.80°65.46 km
2000–2005East by North55.82°31.30 km
2005–2010East by North14.75°185.07 km
2010–2015West by South34.73°674.96 km
2015–2020West by South17.16°222.03 km
Table 6. Land cover type transition matrix * in Yangtze River Economic Belt, 1985–2020.
19852020
Snow/IceImperviousGrasslandShrubBarrenCroplandForestWetlandWaterAquaculture PondsDecrement
1217.6460,195.54180,779.0416,614.204365.13655,891.591,064,211.64373.3037,439.4514,207.08
Snow/Ice1462.48 741.08 190.08 1.00 392.39 7.81 129.24 0.10 721.39
Impervious17,175.23 14,616.60 5.27 0.12 1.38 1456.74 128.38 673.32 290.85 2558.63
Grassland203,723.54 155.57 299.33 164,647.71 1962.81 1995.75 8699.14 25,280.66 82.01 488.46 85.63 39,075.83
Shrub29,970.56 6.48 2232.31 6560.52 1.43 5081.56 16,056.43 1.00 14.13 11.30 23,410.04
Barren3630.97 314.28 122.04 1038.31 0.11 1854.13 60.91 19.52 169.86 47.21 1776.84
Cropland710,983.67 41,132.19 7162.65 2232.23 24.68 551,915.00 92,015.44 1.73 8634.24 7786.77 159,068.66
Forest1,028,542.01 0.55 2496.46 4883.15 5851.82 11.24 83,253.22 929,790.55 0.44 691.02 1404.90 98,751.46
Wetland702.81 377.28 3.99 30.68 286.77 3.35 0.74 416.05
Water35,853.13 6.11 1353.63 139.12 0.08 79.99 4992.01 581.76 0.46 25,399.17 3297.68 10,453.95
Aquaculture Ponds3235.51 0.05 154.59 89.66 3.80 1.58 371.41 144.21 0.90 1232.39 1217.14 2018.36
Increment476.56 45,578.93 16,131.33 10,053.69 2511.00 103,976.59 134,421.09 86.54 12,040.27 12,989.94 /
Net Increase or Decrease−244.83 43,020.30 −22,944.51 −13,356.36 734.16 −55,092.08 35,669.62 −329.51 1586.32 10,971.57 14.71
* Unit is km2.
Disclaimer/Publisher’s Note: The statements, opinions and data contained in all publications are solely those of the individual author(s) and contributor(s) and not of MDPI and/or the editor(s). MDPI and/or the editor(s) disclaim responsibility for any injury to people or property resulting from any ideas, methods, instructions or products referred to in the content.

