Article

Differences in the Vertical Distribution of Aerosols, Nitrogen Dioxide, and Formaldehyde between Islands and Inland Areas: A Case Study in the Yangtze River Delta of China

1
The Department of Health Promotion and Behavioral Sciences, School of Public Health, Anhui Medical University, Hefei 230032, China
2
Key Lab of Environmental Optics and Technology, Anhui Institute of Optics and Fine Mechanics, Hefei Institutes of Physical Science, Chinese Academy of Sciences, Hefei 230031, China
3
School of Environmental Science and Engineering, Suzhou University of Science and Technology, Suzhou 215009, China
4
Institute of Physical Science and Information Technology, Anhui University, Hefei 230601, China
5
Anhui Provincial Academy of Eco-Environmental Science Research, Hefei 230071, China
6
Information Materials and Intelligent Sensing Laboratory of Anhui Province, Anhui University, Hefei 230601, China
7
School of Environmental Science and Optoelectronic Technology, University of Science and Technology of China, Hefei 230026, China
8
Department of Precision Machinery and Precision Instrumentation, University of Science and Technology of China, Hefei 230026, China
9
Center for Excellence in Regional Atmospheric Environment, Institute of Urban Environment, Chinese Academy of Sciences, Xiamen 361021, China
10
Key Laboratory of Precision Scientific Instrumentation of Anhui Higher Education Institutes, University of Science and Technology of China, Hefei 230026, China
*
Author to whom correspondence should be addressed.
Remote Sens. 2023, 15(23), 5475; https://doi.org/10.3390/rs15235475
Submission received: 8 October 2023 / Revised: 16 November 2023 / Accepted: 17 November 2023 / Published: 23 November 2023

Abstract

:
Due to the difference of industrialization degree and meteorological conditions, there are obvious differences in the composition of air pollution between islands and inland areas. With Zhoushan (ZS) and Nanjing (NJ) representing islands and inland cities in the Yangtze River Delta, the differences in vertical distribution of atmospheric components were investigated. A combination of multi-axial differential optical absorption spectroscopy (MAX-DOAS), weather research and forecasting (WRF), and potential source contribution function (PSCF) models were used to obtain vertical distribution data for aerosols, nitrogen dioxide (NO2) and formaldehyde (HCHO), meteorological factors, and pollution sources in summer 2019. The findings indicate that, except for the aerosol extinction coefficient (AE), the atmospheric composition at the ZS site was not significantly stratified. However, the AE, NO2, and HCHO at NJ all displayed a decreasing trend with altitude. Here is the interesting finding that the ZS site has a higher AE value than the NJ site, while NJ displays higher NO2 and HCHO columns than the ZS site. This discrepancy was primarily attributable to Zhoushan City’s extremely low traffic emissions when compared to inland cities. In addition, HCHO in the YRD region was significantly affected by human activities. Analysis of potential pollution sources found that regional transport contributed to differences in atmospheric composition at different altitudes in different regions. Aerosols, NO2, and HCHO in Nanjing were significantly affected by transport in inland areas. Aerosols in Zhoushan were easily affected by transport in the Yellow Sea and East China Sea, and NO2 and HCHO were significantly affected by transport contributions from surrounding areas in inland areas. The study strongly suggests that land and sea breezes play an important role in the vertical distribution of aerosols over island regions.

1. Introduction

As an important economic region in China, the Yangtze River Delta (YRD) is facing increasingly serious air pollution problems. Air pollution not only restricts economic development but also affects global climate change and poses a threat to human health [1]. Among them, aerosol, nitrogen dioxide (NO2), and formaldehyde (HCHO), as important components of the atmosphere, play important roles in the tropospheric atmospheric photochemistry and the joint prevention and control of PM2.5 and ozone (O3) [2,3,4]. Therefore, monitoring the evolution of aerosols, NO2, and HCHO is necessary in order to understand their role in atmospheric chemical processes and to develop effective pollution control measures.
There have been many meaningful research results on the causes of air pollution in the YRD [5], but previous studies have focused on single or multiple pollutant gases in a single city, regional distribution characteristics, and air pollution conditions in the industrially developed areas of the YRD [6,7]. Few studies have explored the differences between inland and island regions. The comparison of air pollution characteristics between inland and island areas deserves attention. On the one hand, industrial and domestic pollution is mainly concentrated in urban areas, and the quantity of cars and the flow of pollutants have gradually enhanced the regional pollution characteristics of inland regions. On the other hand, island areas are important gateways for the exchange of sea, land, and atmosphere, and island regions are ideal for studying the distribution and source characteristics of aerosol, NO2, and HCHO components in the marine atmosphere [8]. In addition, due to the different degrees of industrialization and differences in meteorological conditions, the composition of the air pollution in the inland and island regions clearly differed. Therefore, it is of unique scientific significance to pay attention to the air pollution components of the inland and island regions in the YRD.
With the reduction of emissions, regional transport and secondary pollution problems have become increasingly prominent, especially in the YRD, which presents uneven regional distribution and frequent transport characteristics. Studies have shown that many important air pollutant transport processes often occur 1–8 km above the surface, affecting surface air pollution [9]. When assessing the regional transport of air pollutants, the transport flux will probably be over- or underestimated if only the surface concentration is employed and the vertical information is disregarded [8]. For a thorough analysis of the sources and transmission mechanisms of air pollutants, it is crucial to comprehend the vertical distribution of those contaminants.
The vertical monitoring of atmospheric composition has been studied in the past using crewless aerial vehicles, tethered balloons, airplanes, and light detection and ranging (LIDAR) [10,11,12,13,14]. Although LIDAR has near-ground blind spots, it can monitor the vertical profiles of aerosols and O3 with high temporal resolution [15]. To track the vertical distribution of atmospheric constituents, on-site measurement equipment can be mounted on aircraft and drones, but continuous monitoring is not feasible, and detection is expensive [16]. A multi-axis differential optical absorption spectrometer (MAX-DOAS) captures dispersed sunlight through a telescope at various elevation angles before directing it through a prism reflector and quartz fiber as a passive ground remote sensing technique. It has been extensively utilized to assess the vertical distribution of trace gases because of its high spectral resolution, high sensitivity, and long-term steady observation profile. The most important advantage of the MAX-DOAS is that it can simultaneously monitor various atmospheric components, including aerosols, NO2, and HCHO, thereby overcoming the errors of atmospheric component monitoring using different instruments. MAX-DOAS has been widely used in studies of the vertical distribution characteristics of atmospheric components in different environments (suburban, regional, island, and offshore) in different regions, e.g., the Beijing-Tianjin-Hebei [9,17,18,19], the Pearl River Delta region [13,20,21] and the YRD region [22,23,24,25,26,27]. This technology provides a promising method for the accurate monitoring and management of air pollution.
To explore the differences in atmospheric distribution between the island and inland regions in the YRD region, Zhoushan and Nanjing have been chosen as the observation areas, and MAX-DOAS was used to examine the vertical profiles of aerosols, NO2, and HCHO. To identify their temporal and spatial distribution characteristics and sources, as well as to gauge the impact of regional transport, their distribution, daily and weekly variation, and pollutant characteristics were examined from a variety of angles. This study aids in clarifying the differences in the vertical distribution of air pollution between inland areas and the islands of the YRD.

2. Materials and Methods

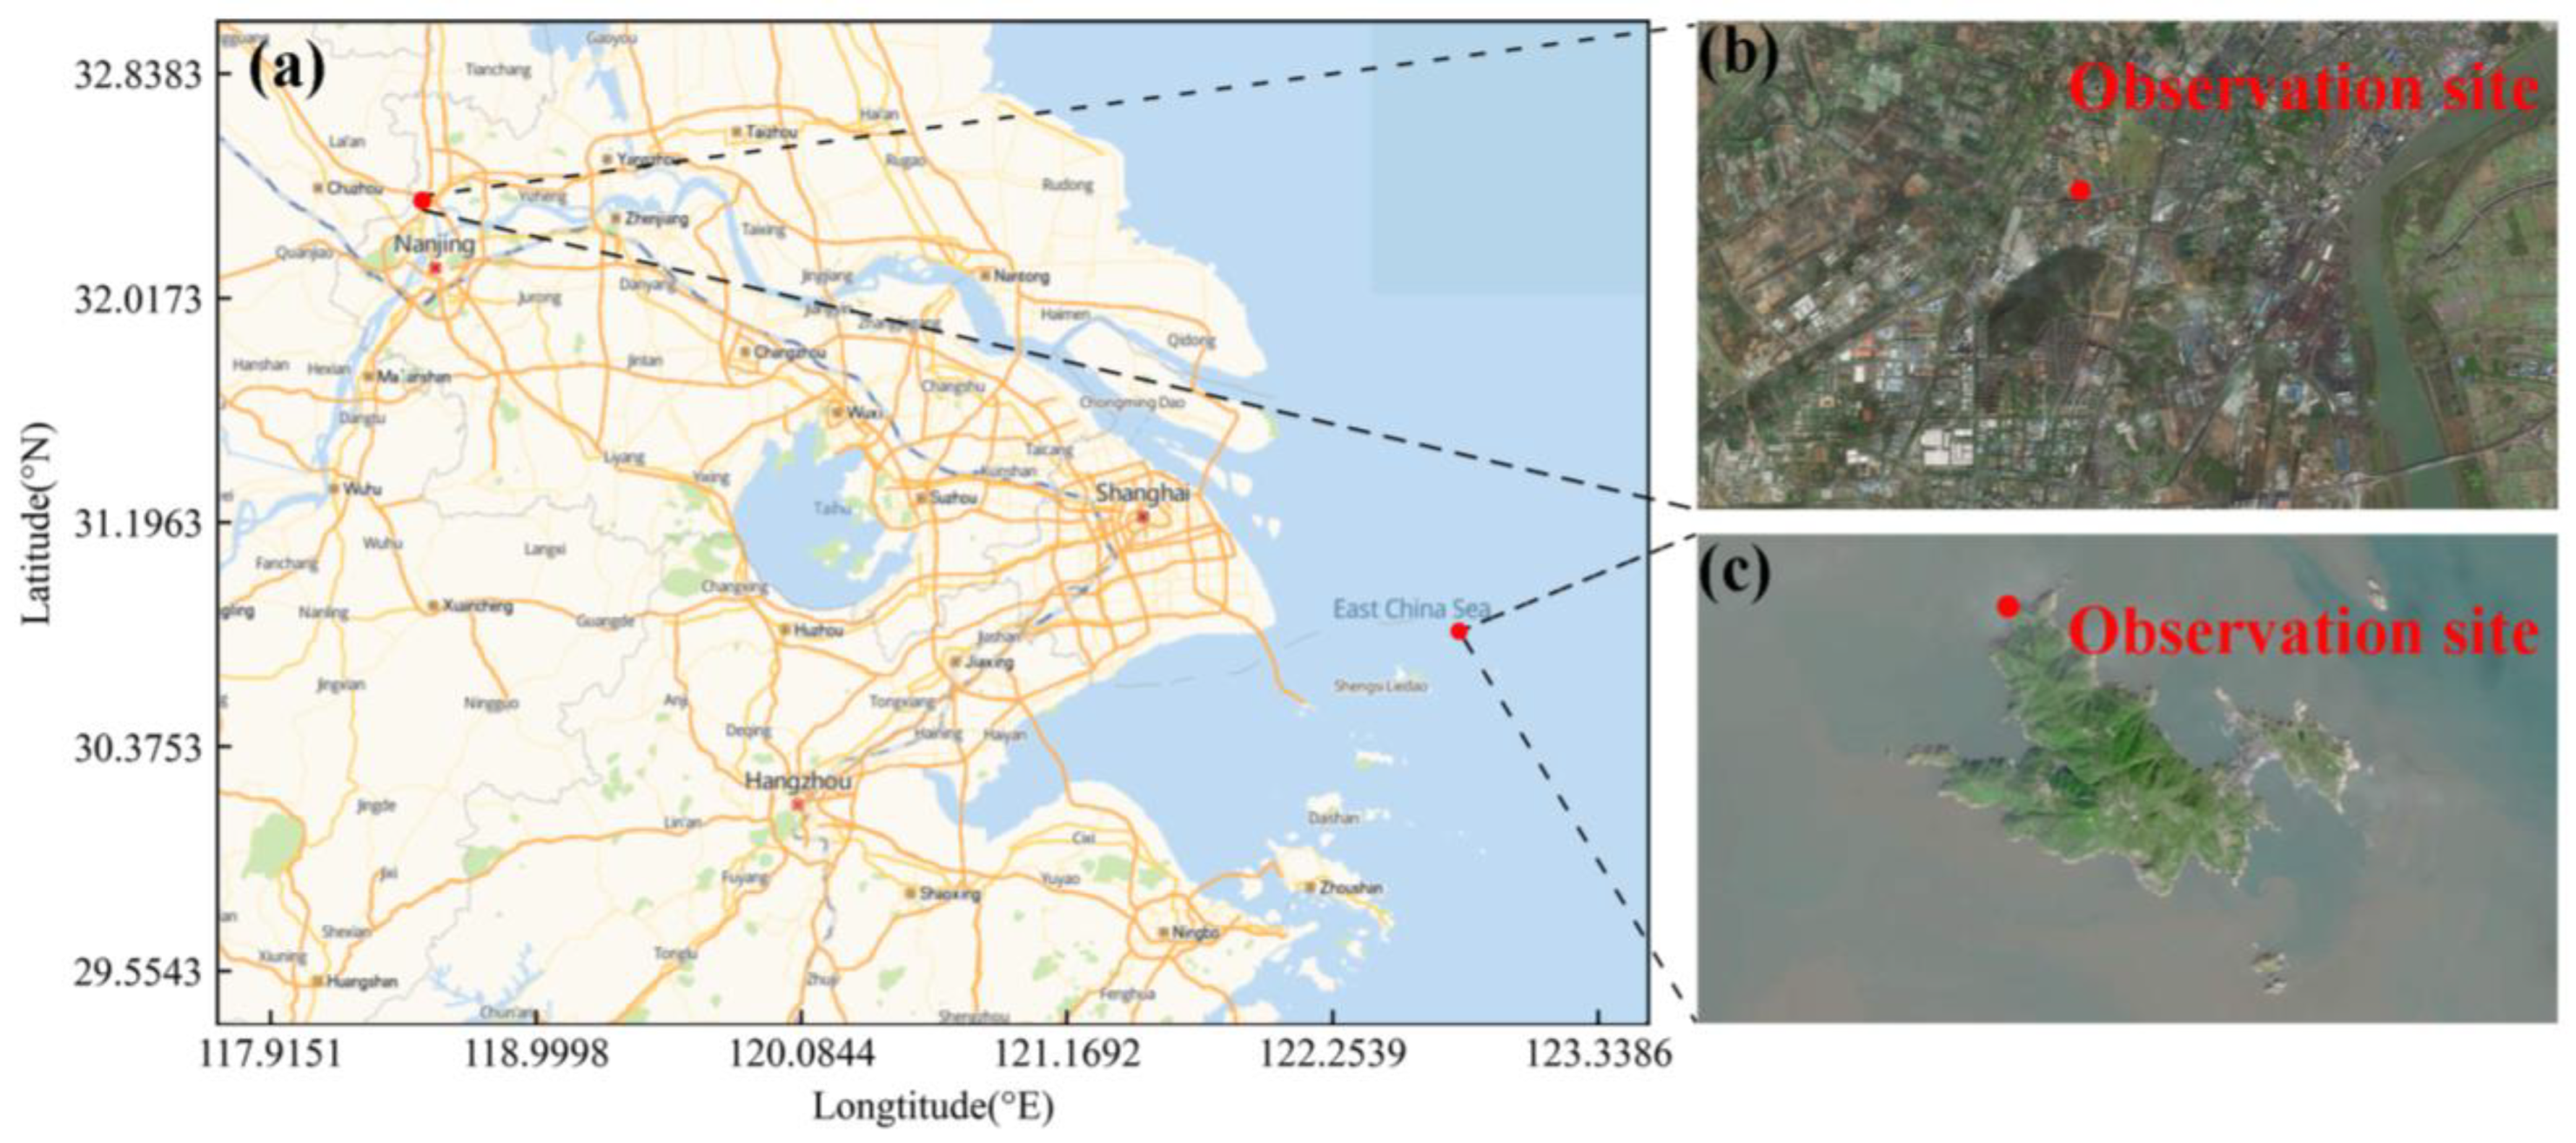
2.1. Observation Site

The vertical distributions of atmospheric compositions in inland and island locations during the summer is the main topic of this study. The experimental data were measured from 6 May to 18 July 2019, and were collected from the Zhoushan (ZS) site (island region) and Nanjing (NJ) site (inland region). The MAX-DOAS instrument at the ZS site (~60 m a.s.l.) was set up on Huaniao Island (30.86°N, 122.67°E) that is roughly 80 km from the mainland. It is 5 m above the ground. There is no industry and low traffic, but the site is heavily affected by land transport, ships, and marine emissions within the East China Sea (ECS) region [26,27]. Nanjing, a comprehensive national transportation hub with well-developed electronic, automobile, petrochemical, and steel industries, is one of the most important urban areas in the YRD. The MAX-DOAS observation system was located at the Nanjing University of Information Science and Technology (32.21°N, 118.72°E), Pukou District, Nanjing, China, at an altitude of 73 m. The equipment was attached to the roof 20 m above the ground with a tripod, and the instrument’s azimuth was 31° (northeast direction). It is far from the city center, with three expressways within five kilometers, but the industrial area is not far north of the observation site. Figure 1 displays the locations of the two observation sites.

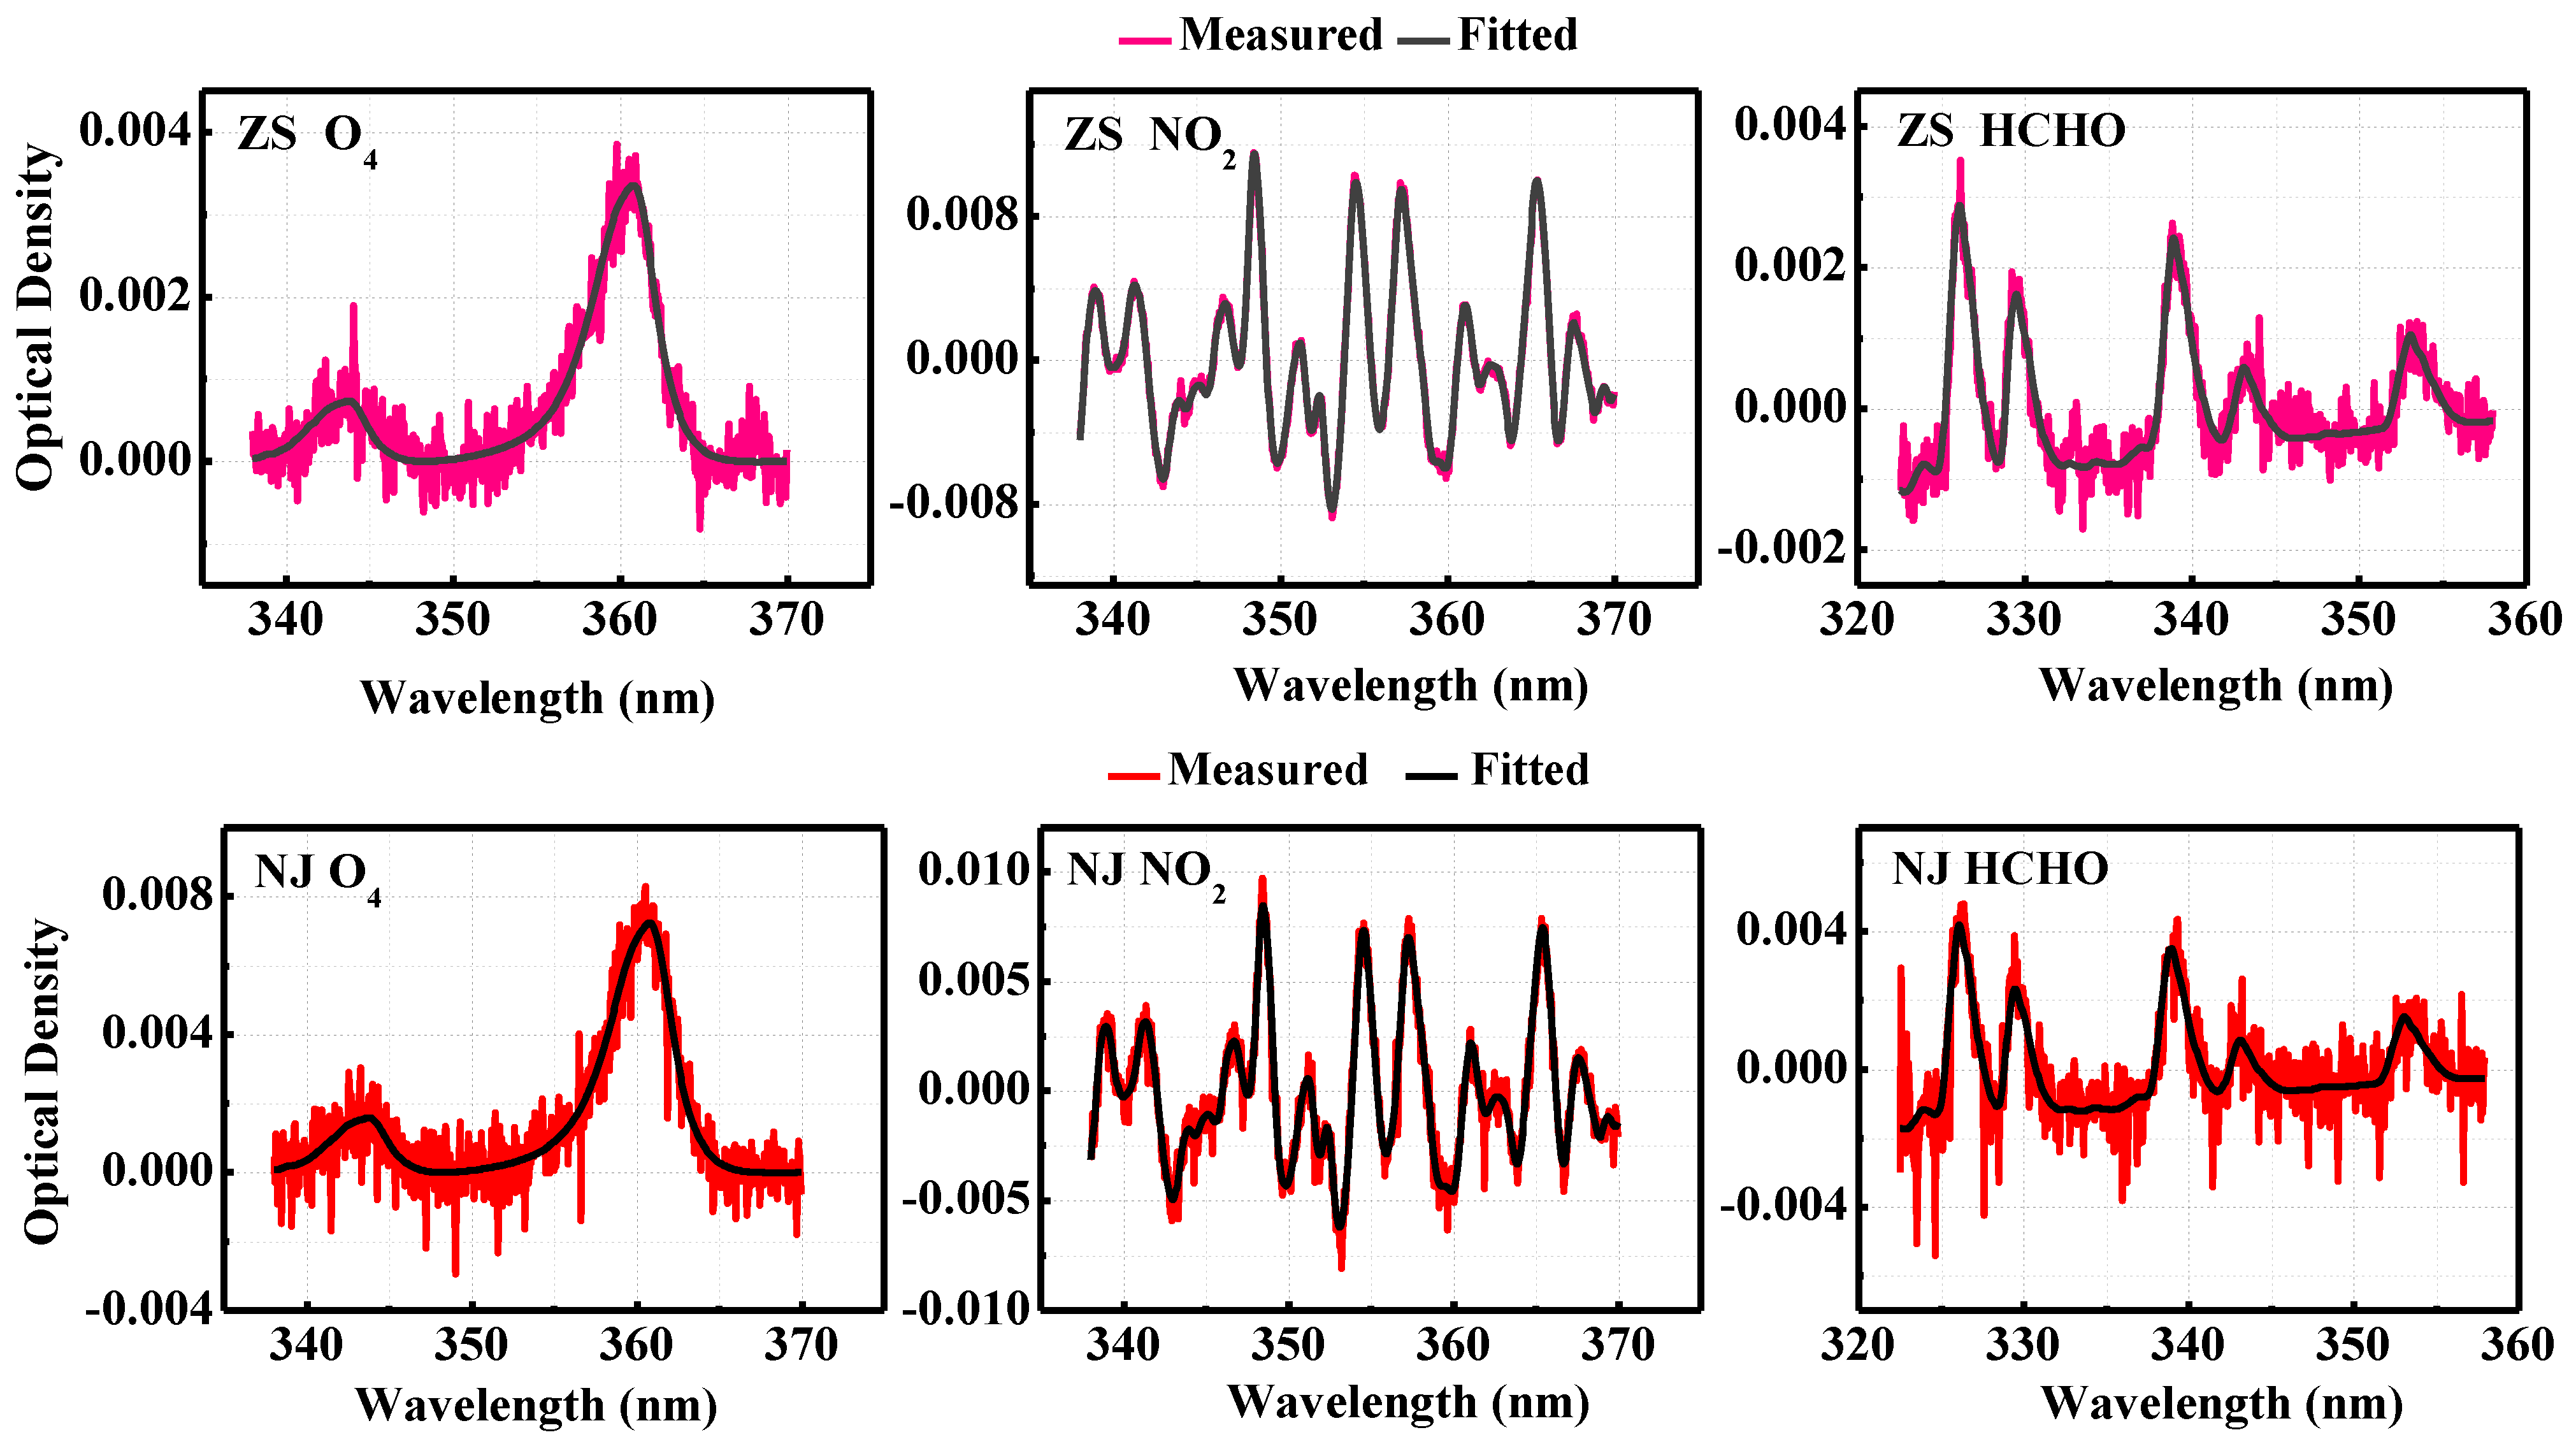
2.2. Spectral Analysis and DOAS Vertical Profile Retrieval

A telescope, a control and data analysis terminal, and a spectrometer make up the three major components of the MAX-DOAS. The information of the two spectrometers is as follows: the model is AvaSpec-ULS2048L-USB2, the ultraviolet band range is 296–408 nm, the visible band range is 420–565 nm, the spectral resolution is 0.45 nm. The temperature needs to be controlled at 20 °C (±0.5 °C). The telescope’s elevation accuracy (α) is 0.1°, and its field of vision (FOV) is 0.3°. A total of 11 elevation angles—1°, 2°, 3°, 4°, 5°, 6°, 8°, 10°, 15°, 30°, and 90°—were established for this observation. Throughout the day, the device gathered stray sunlight. The script was used to automatically measure the dark current and offset spectra at night and subtract them from all observed spectra. To evaluate the vertical profile of near-surface gas, only partial spectra with a solar zenith angle (SZA) of less than 75° were examined.
QDOAS software (http://uv-vis.aeronomie.be/software/QDOAS/, accessed on 22 December 2022) developed by BIRA-IASB was employed to analyze the filtered spectrum [8]. The difference in slant column density (dSCD), or the difference between the outer zenith skew column concentration and the zenith slant column density, is the result of the DOAS fitting process. Using the recommended setting based on the CINDI International comparison exercise [28], the spectra between the bands of 338–370 nm were used to examine the dSCDs of oxygen dimer (O4) and NO2, and HCHO absorption was analyzed using wavelength intervals of 322.5–358 nm, with low RMS and residual errors [16]. The detailed DOAS fitting information used in this study appears in Table 1. Illustrations of the DOAS fitting results on 6 July 2019 are shown in Figure 2. The root mean square (RMS) larger than 5 × 10⁻⁴ filtered out during the DOAS fitting process.
Utilizing the inversion procedure of the HEIPRO algorithm based on the optimal estimation method (OEM), vertical profiles of aerosols, NO2, and HCHO concentrations were obtained [8]. Our previous research study provided a detailed introduction to the HEIPRO algorithm [16]. The aerosol, NO2, and HCHO profiles were inverted, covering a range of 0–3.8 km, in which the vertical resolution below 2 km was 100 m and that of 2–3.8 km was 200 m. The inversion period was specified at 15 min. The vertical integral of the inversion profile was used to determine the AOD and VCD for trace gases. Additionally, the retrieved profiles with relative errors of more than 50% and degrees of freedom lower than 1.0 were removed.

2.3. Potential Source Analysis

The National Oceanic and Atmospheric Administration’s Air Resources Laboratory (NOAA-ARL, http://www.ready.noaa.gov (accessed on 21 January 2021)), based on the global data assimilation system (GDAS 1°), developed a hybrid single-particle Lagrange integral path (HYSPLIT) model. It is used to analyze the 24-h and 72-h back trajectories of the air mass arriving at the observation sites. Cluster analysis is carried out based on statistical analysis.
The main transport routes and possible sources of atmospheric compositions in the YRD were identified using the potential source contribution function (PSCF) [23]. After the research area had been gridded, a single grid coordinate was (i, j), the total number of trajectory endpoints that fell within the lattice point ij was determined to be nij. mij was the total number of endpoints with pollutant concentrations over the established standard concentration, and Equation (1) specified the PSCF value for the ijth grid:
P S C F i j = m i j n i j .
A weighted PSCF index, Wij, the empirical weight value derived from the number of endpoints of the air mass trajectory in the grid, was utilized in the study [25]. The Wij value is as shown in Equation (2):
W i j = 1.00 n i j > 3 A v g 0.70 A v g < n i j 3 A v g   0.42 0.5 A v g < n i j A v g     0.17 n i j 0.5 A v g ,
where Avg is the average number of endpoints in each cell.
Further weighted calculations of PSCF and the values are shown in Equation (3):
W P S C F = W i j × P S C F i j .

2.4. Ancillary Data

The PM2.5 and NO2 concentrations for the research period were obtained from the monitoring station of the CNEMC. The TROPOspheric Monitoring Instrument (TROPOMI) measurements were used to determine the vertical column concentration (VCD) of HCHO. The overpass time for TROPOMI is 13:30 (LST), and the spatial resolution is 7.0 × 3.5 km2. The National Center for Environmental Prediction (NCEP), the Global Analytical Dataset (FNL), and the weather research and forecast (WRF) atmospheric weather model, with a spatial resolution of 0.1° × 0.1°, were used to obtain the vertical distribution of meteorological parameters such as wind speed (WS), wind direction (WD), relative humidity (RH), and temperature (T). Detailed instructions on the WRF model configuration are included in the Supplementary File (S1).

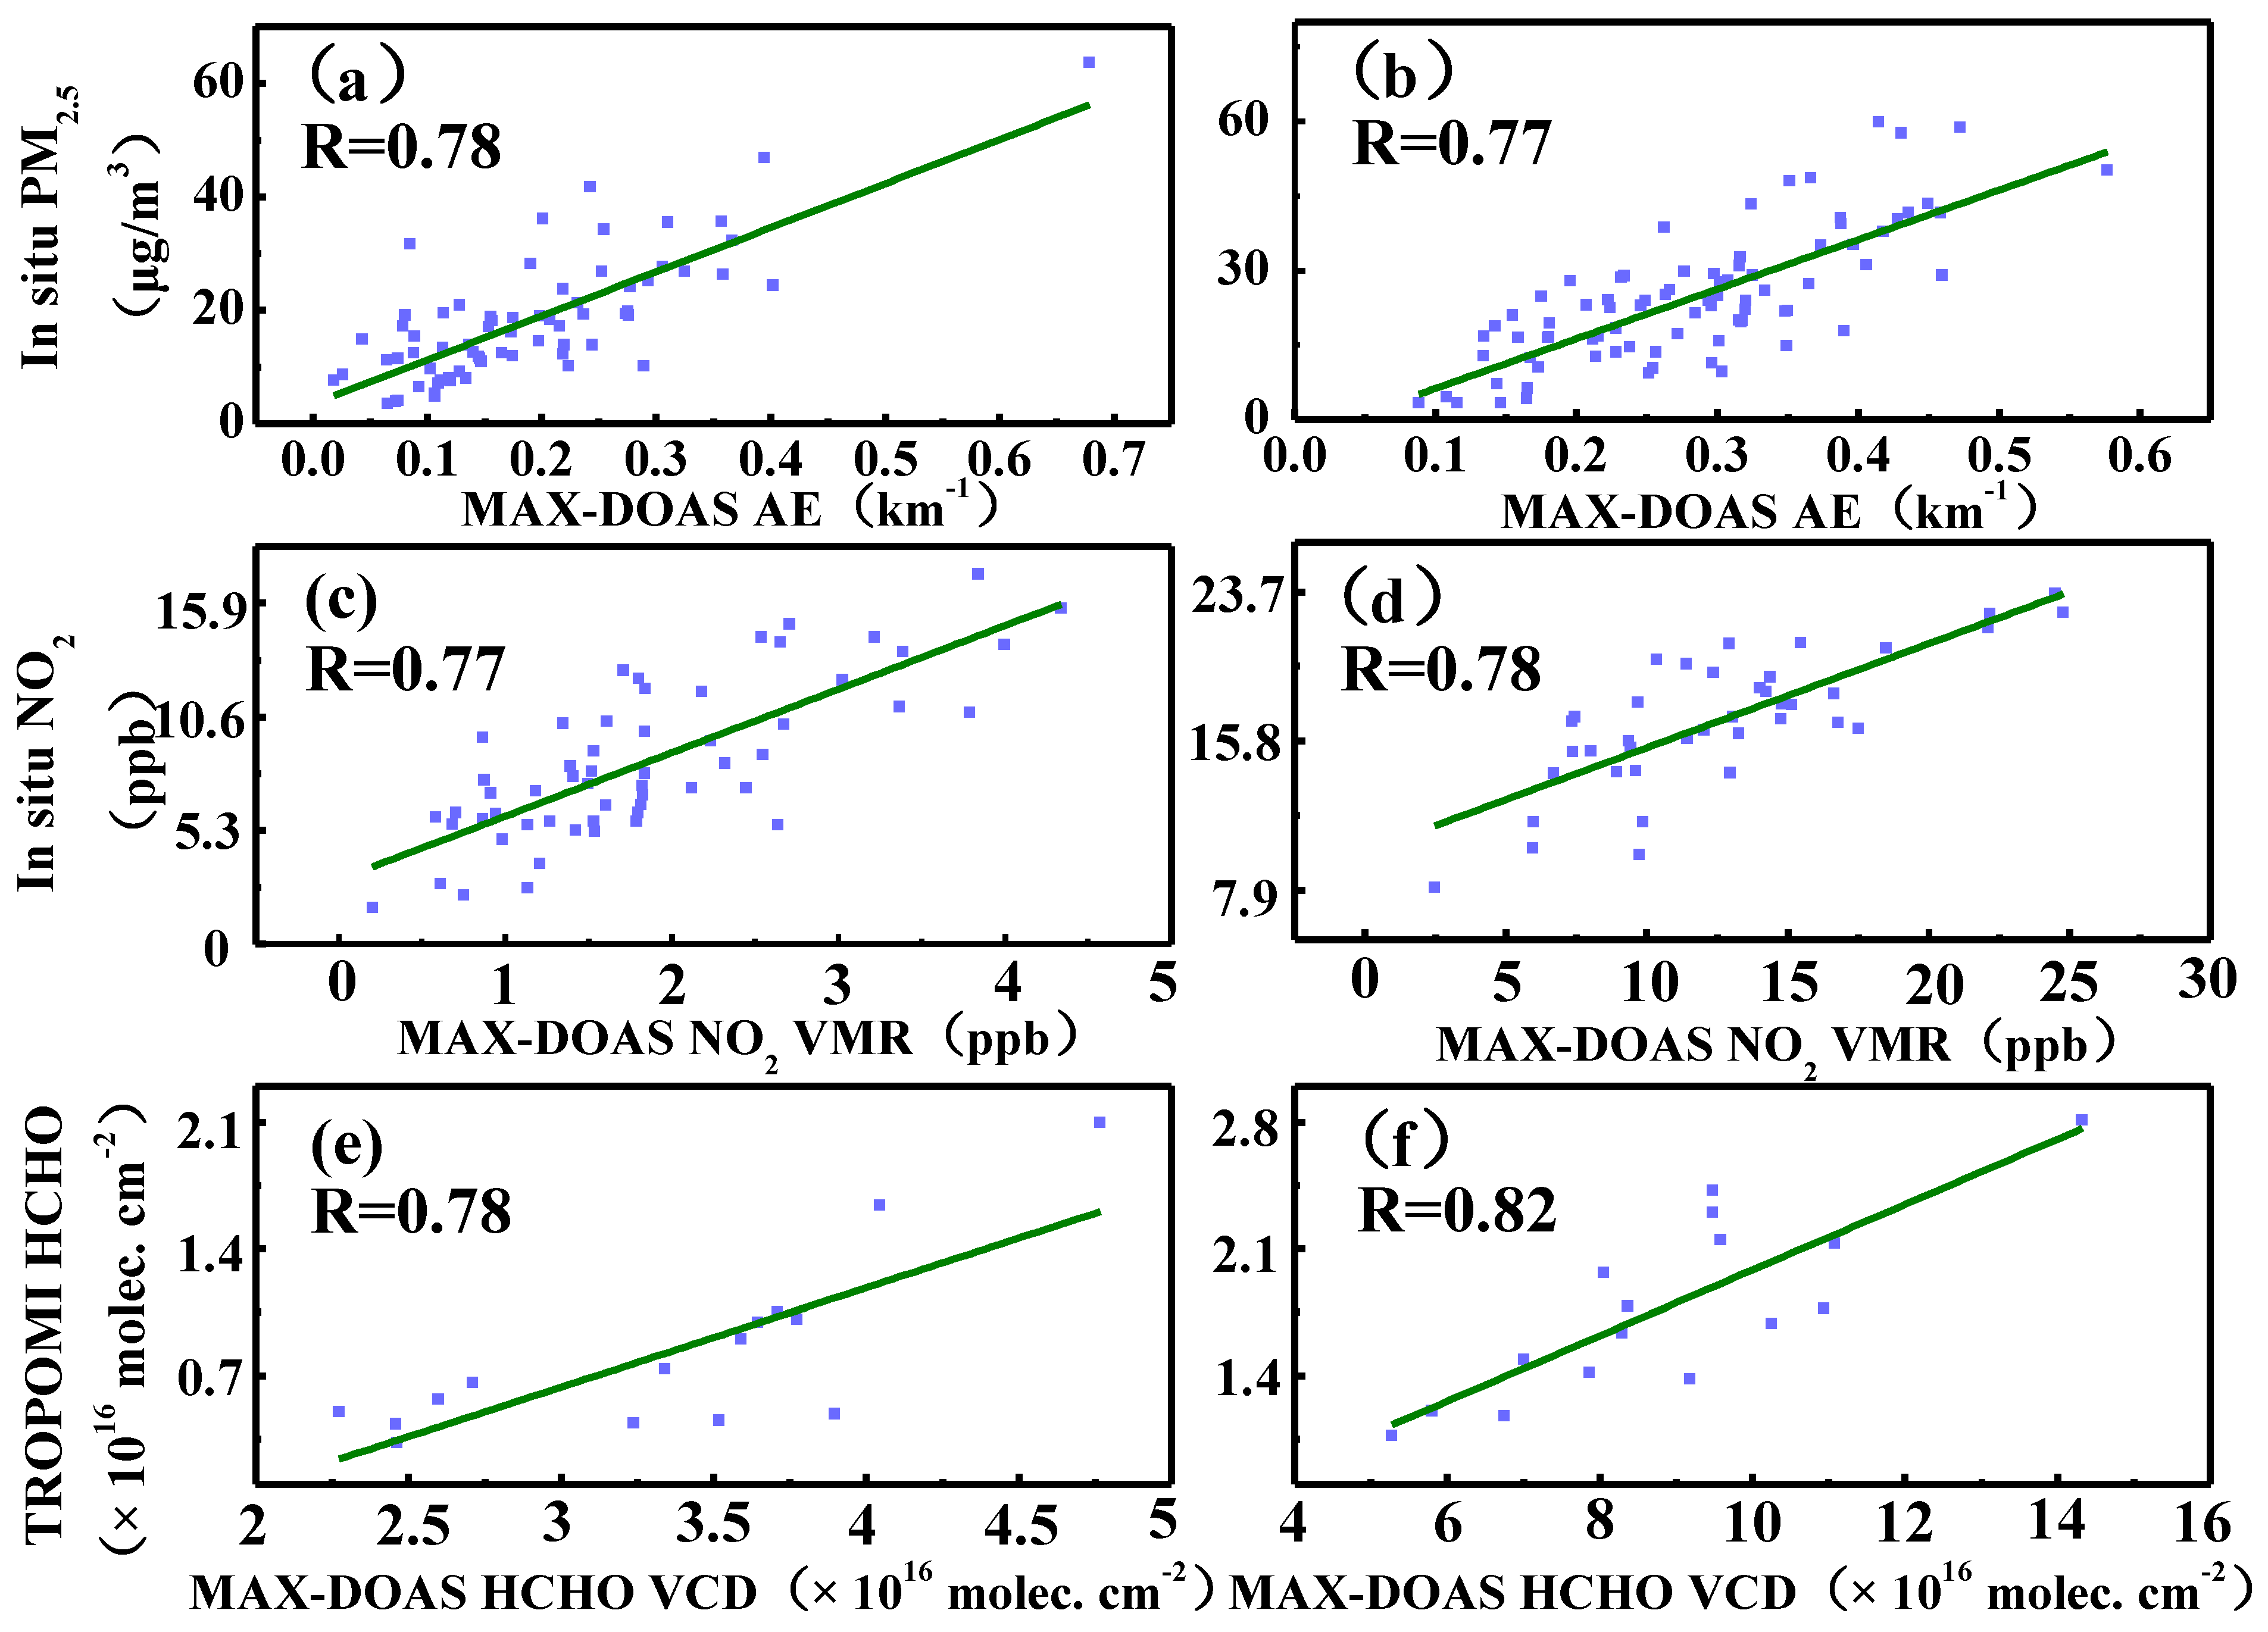
2.5. Data Verification

To evaluate the credibility of the data, AE and NO2 obtained via MAX-DOAS inversion and PM2.5 and NO2 obtained via CNEMC data were compared and verified for the ZS and NJ sites. The correlation between the HCHO obtained by the MAX-DOAS inversion and the TROPOMI HCHO obtained via simultaneous TROPOMI HCHO was compared. As shown in Figure 3, the AE and NO2 data of the two MAX-DOAS sites and the data of the CNEMC showed a good correlation, with the correlation coefficient (R) exceeding 0.76. The HCHO, MAX-DOAS, and TROPOMI data from the two sites showed a good correlation. The HCHO correlation coefficient (R) of the ZS site was 0.78, and the HCHO correlation coefficient (R) of the NJ site was 0.82. Therefore, this study analyzed and discussed the data of AE, NO2, and HCHO obtained via MAX-DOAS inversion.

3. Results

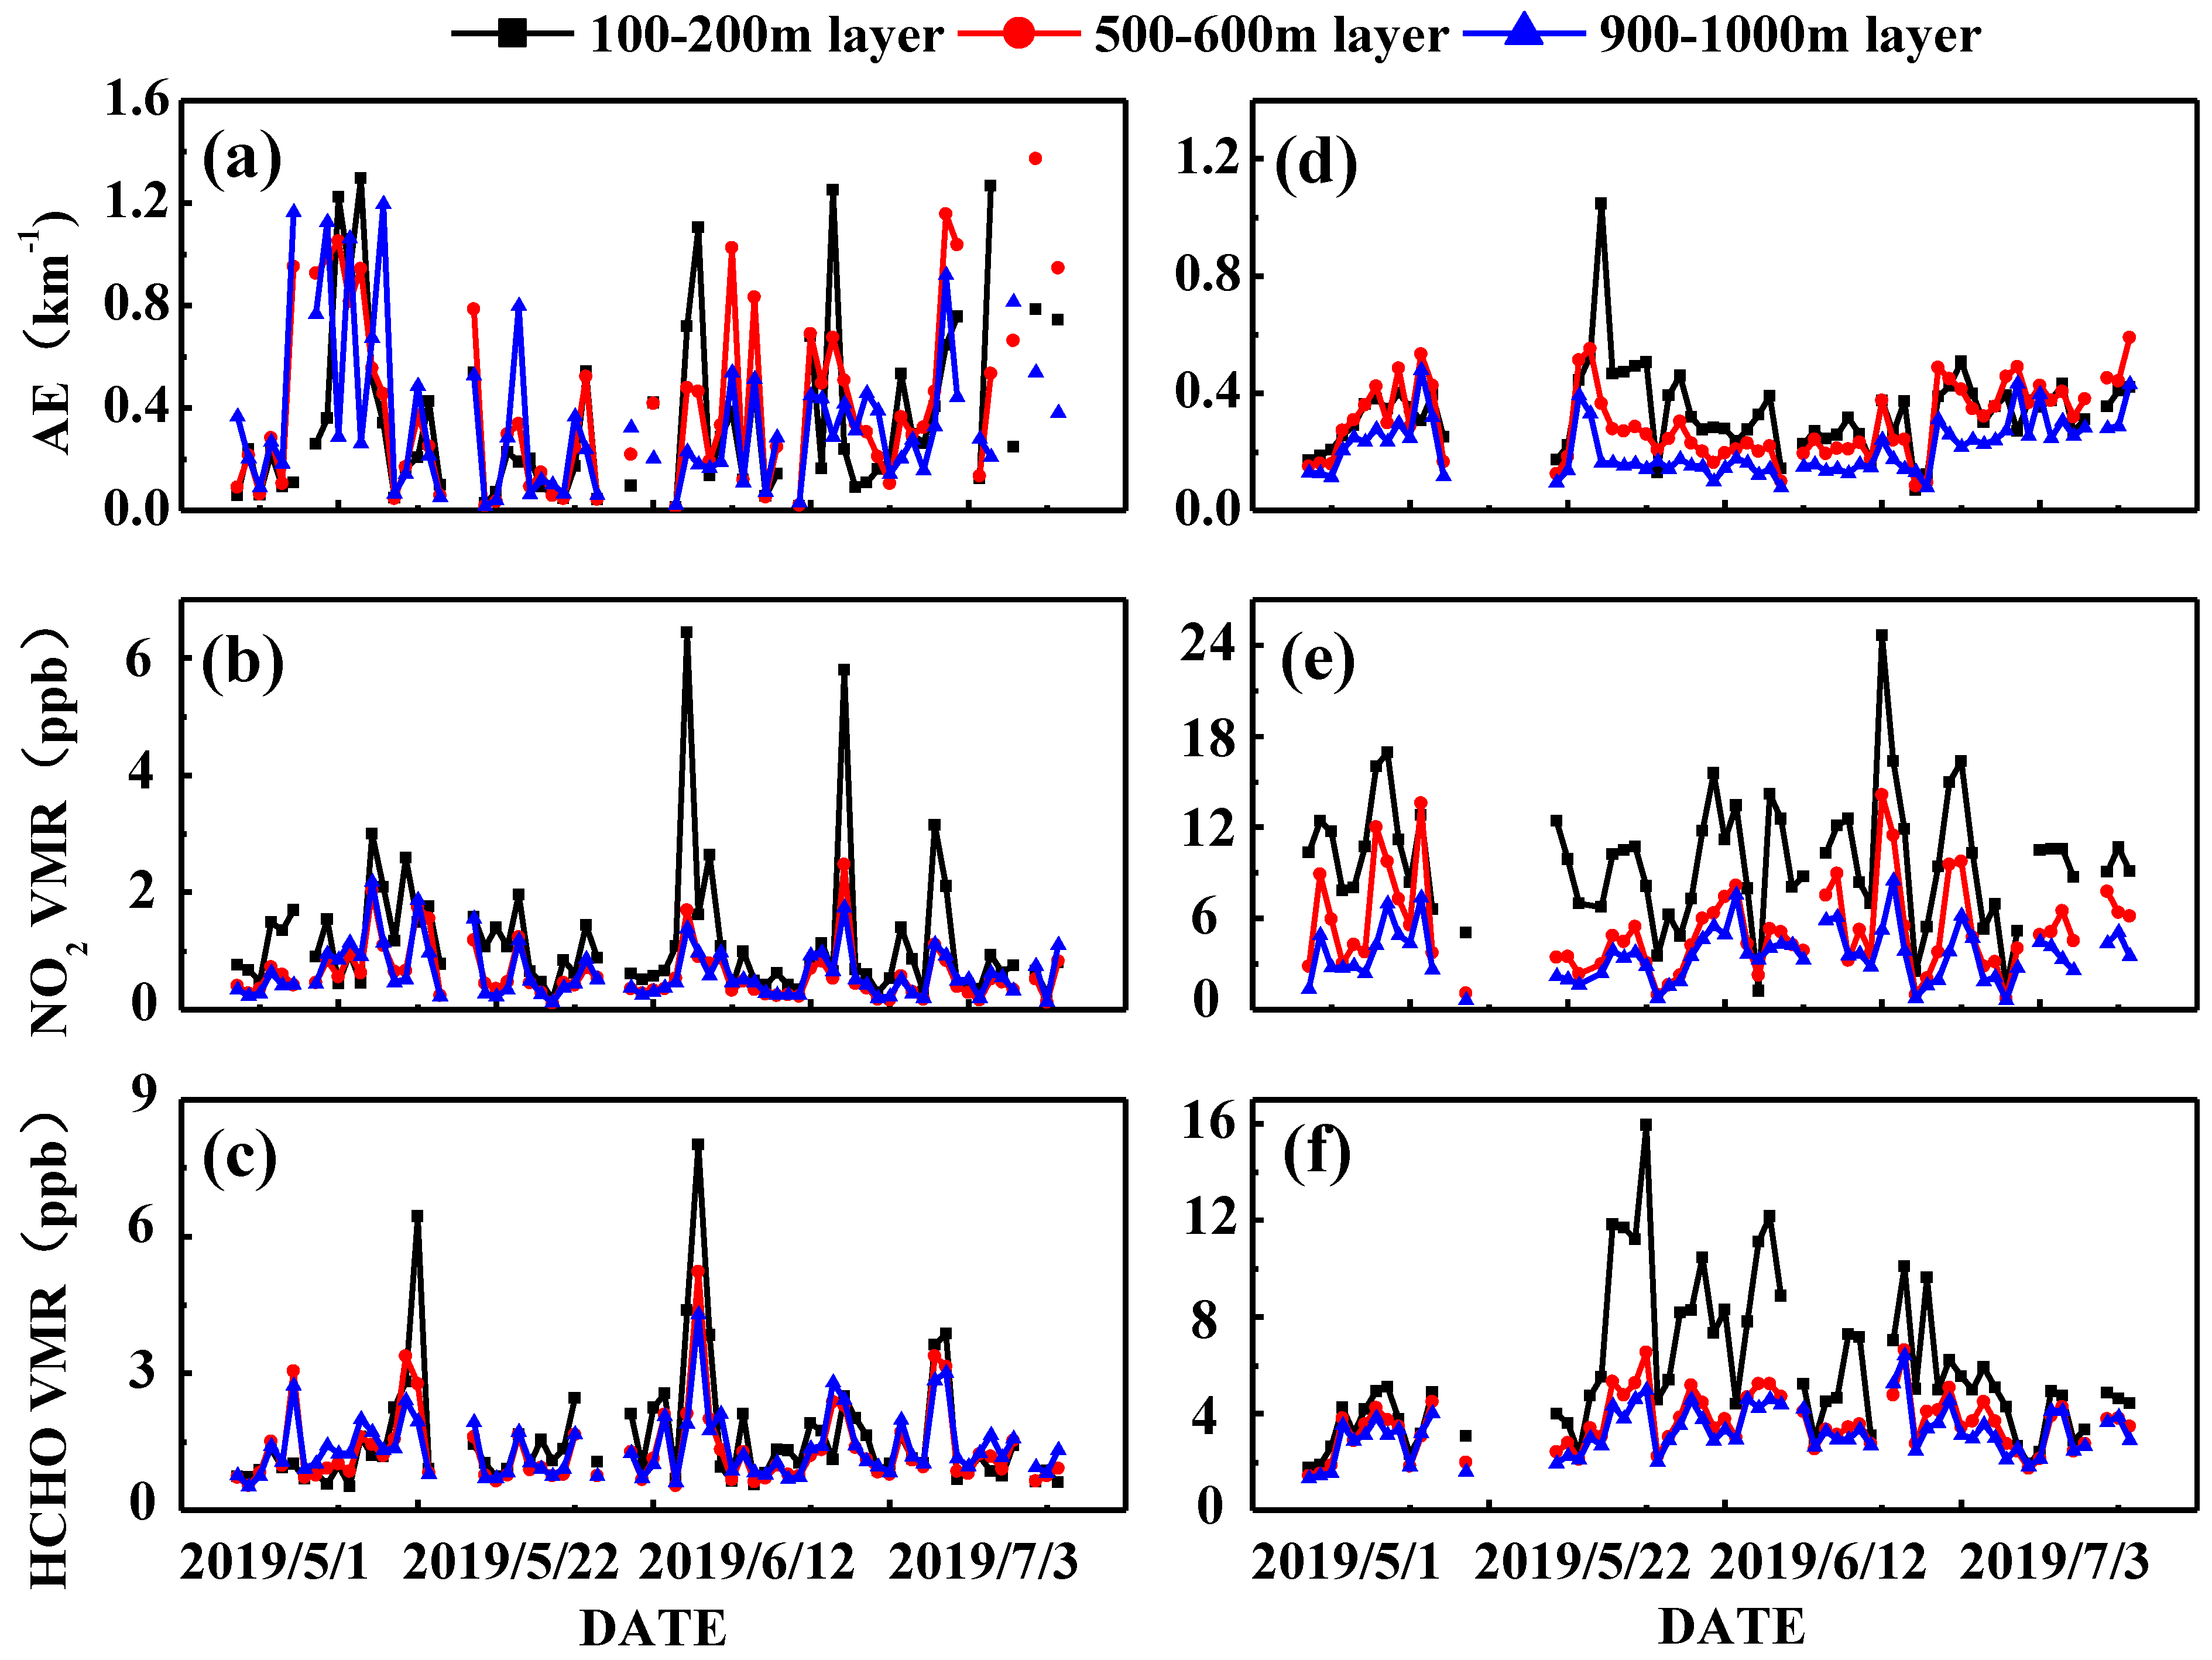
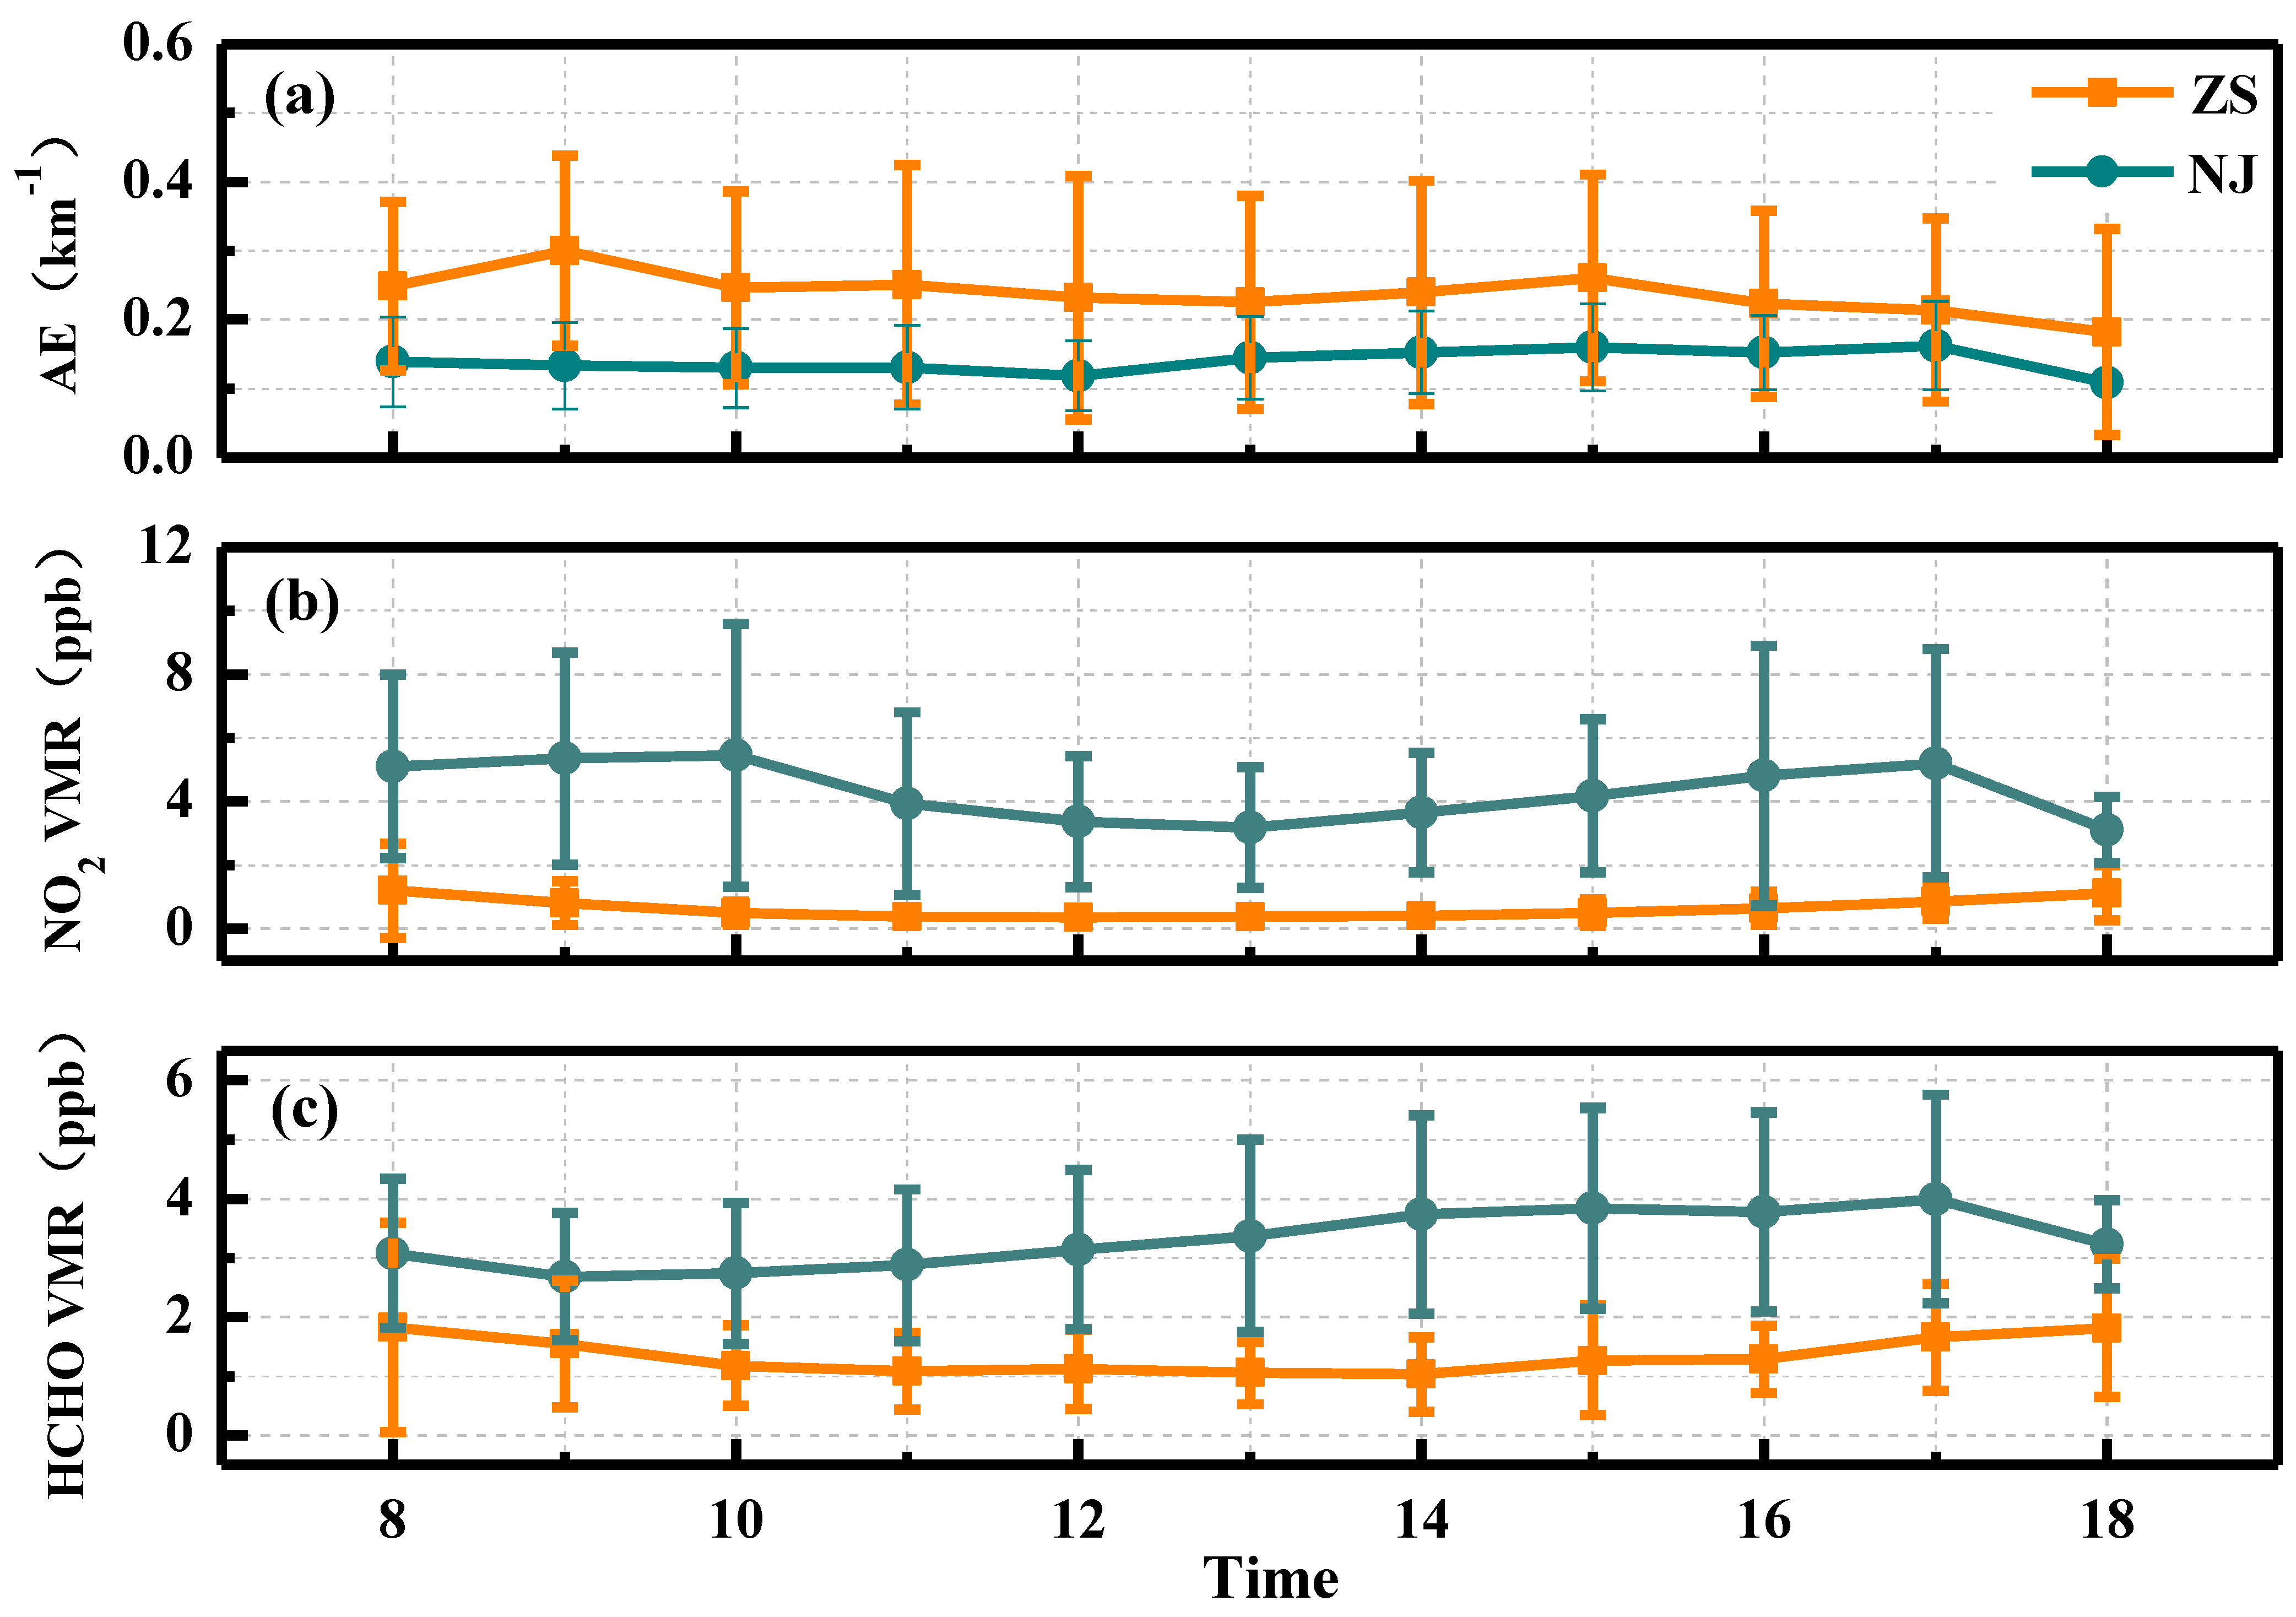
3.1. Spatiotemporal Variations of AE, NO2, and HCHO

The temporal evolution of AE, NO2, and HCHO at different altitude layers is shown in Figure 4. These three atmospheric components (AE, NO2, and HCHO) at the NJ site were mainly concentrated below 200 m, possibly because the main source of these atmospheric components were near-surface emissions [23,37]. From the perspective of height distribution, the high stratification of the three atmospheric components at the ZS site was less pronounced during the study period. The temporal variability of these three atmospheric components at Zhoushan was obvious. The variation amplitude of these three atmospheric components in the NJ site was opposite to that in the ZS site, and the horizontal variation amplitude of NO2 and HCHO is more prominent than that of AE.
As an island region, the AE value of the ZS site fluctuated greatly at different altitude levels; in particular, the frequency of the AE value greater than 0.8 km−1 was generally higher than that of the NJ site (Figure 4a,d). On the one hand, the high surface relative humidity at island areas increases the AE due to the hygroscopic development of fine particles [38]. However, heterogeneous interactions between aerosols with trace gases (such as NO2, SO2, and HCHO) increasing aerosols favor the growth of secondary aerosols [39,40]. Additionally, sea breezes circulation enhances the buildup of pollutants at island locations and has an impact on air pollution [8]. In comparison to the ZS site, the NO2 concentrations in the NJ site were substantially greater. This phenomenon could be brought on by the NJ site, which, as a large inland region, has fast industrialization and high car ownership, leading to the emission of primary pollutants [41]. Similar to NO2, the HCHO values at different heights at the NJ site were significantly higher than those at the ZS site. This phenomenon is attributed to the high density of population and cars at the NJ site. In addition to anthropogenic sources, biological sources are also one of the reasons for the higher HCHO at the NJ site [7].

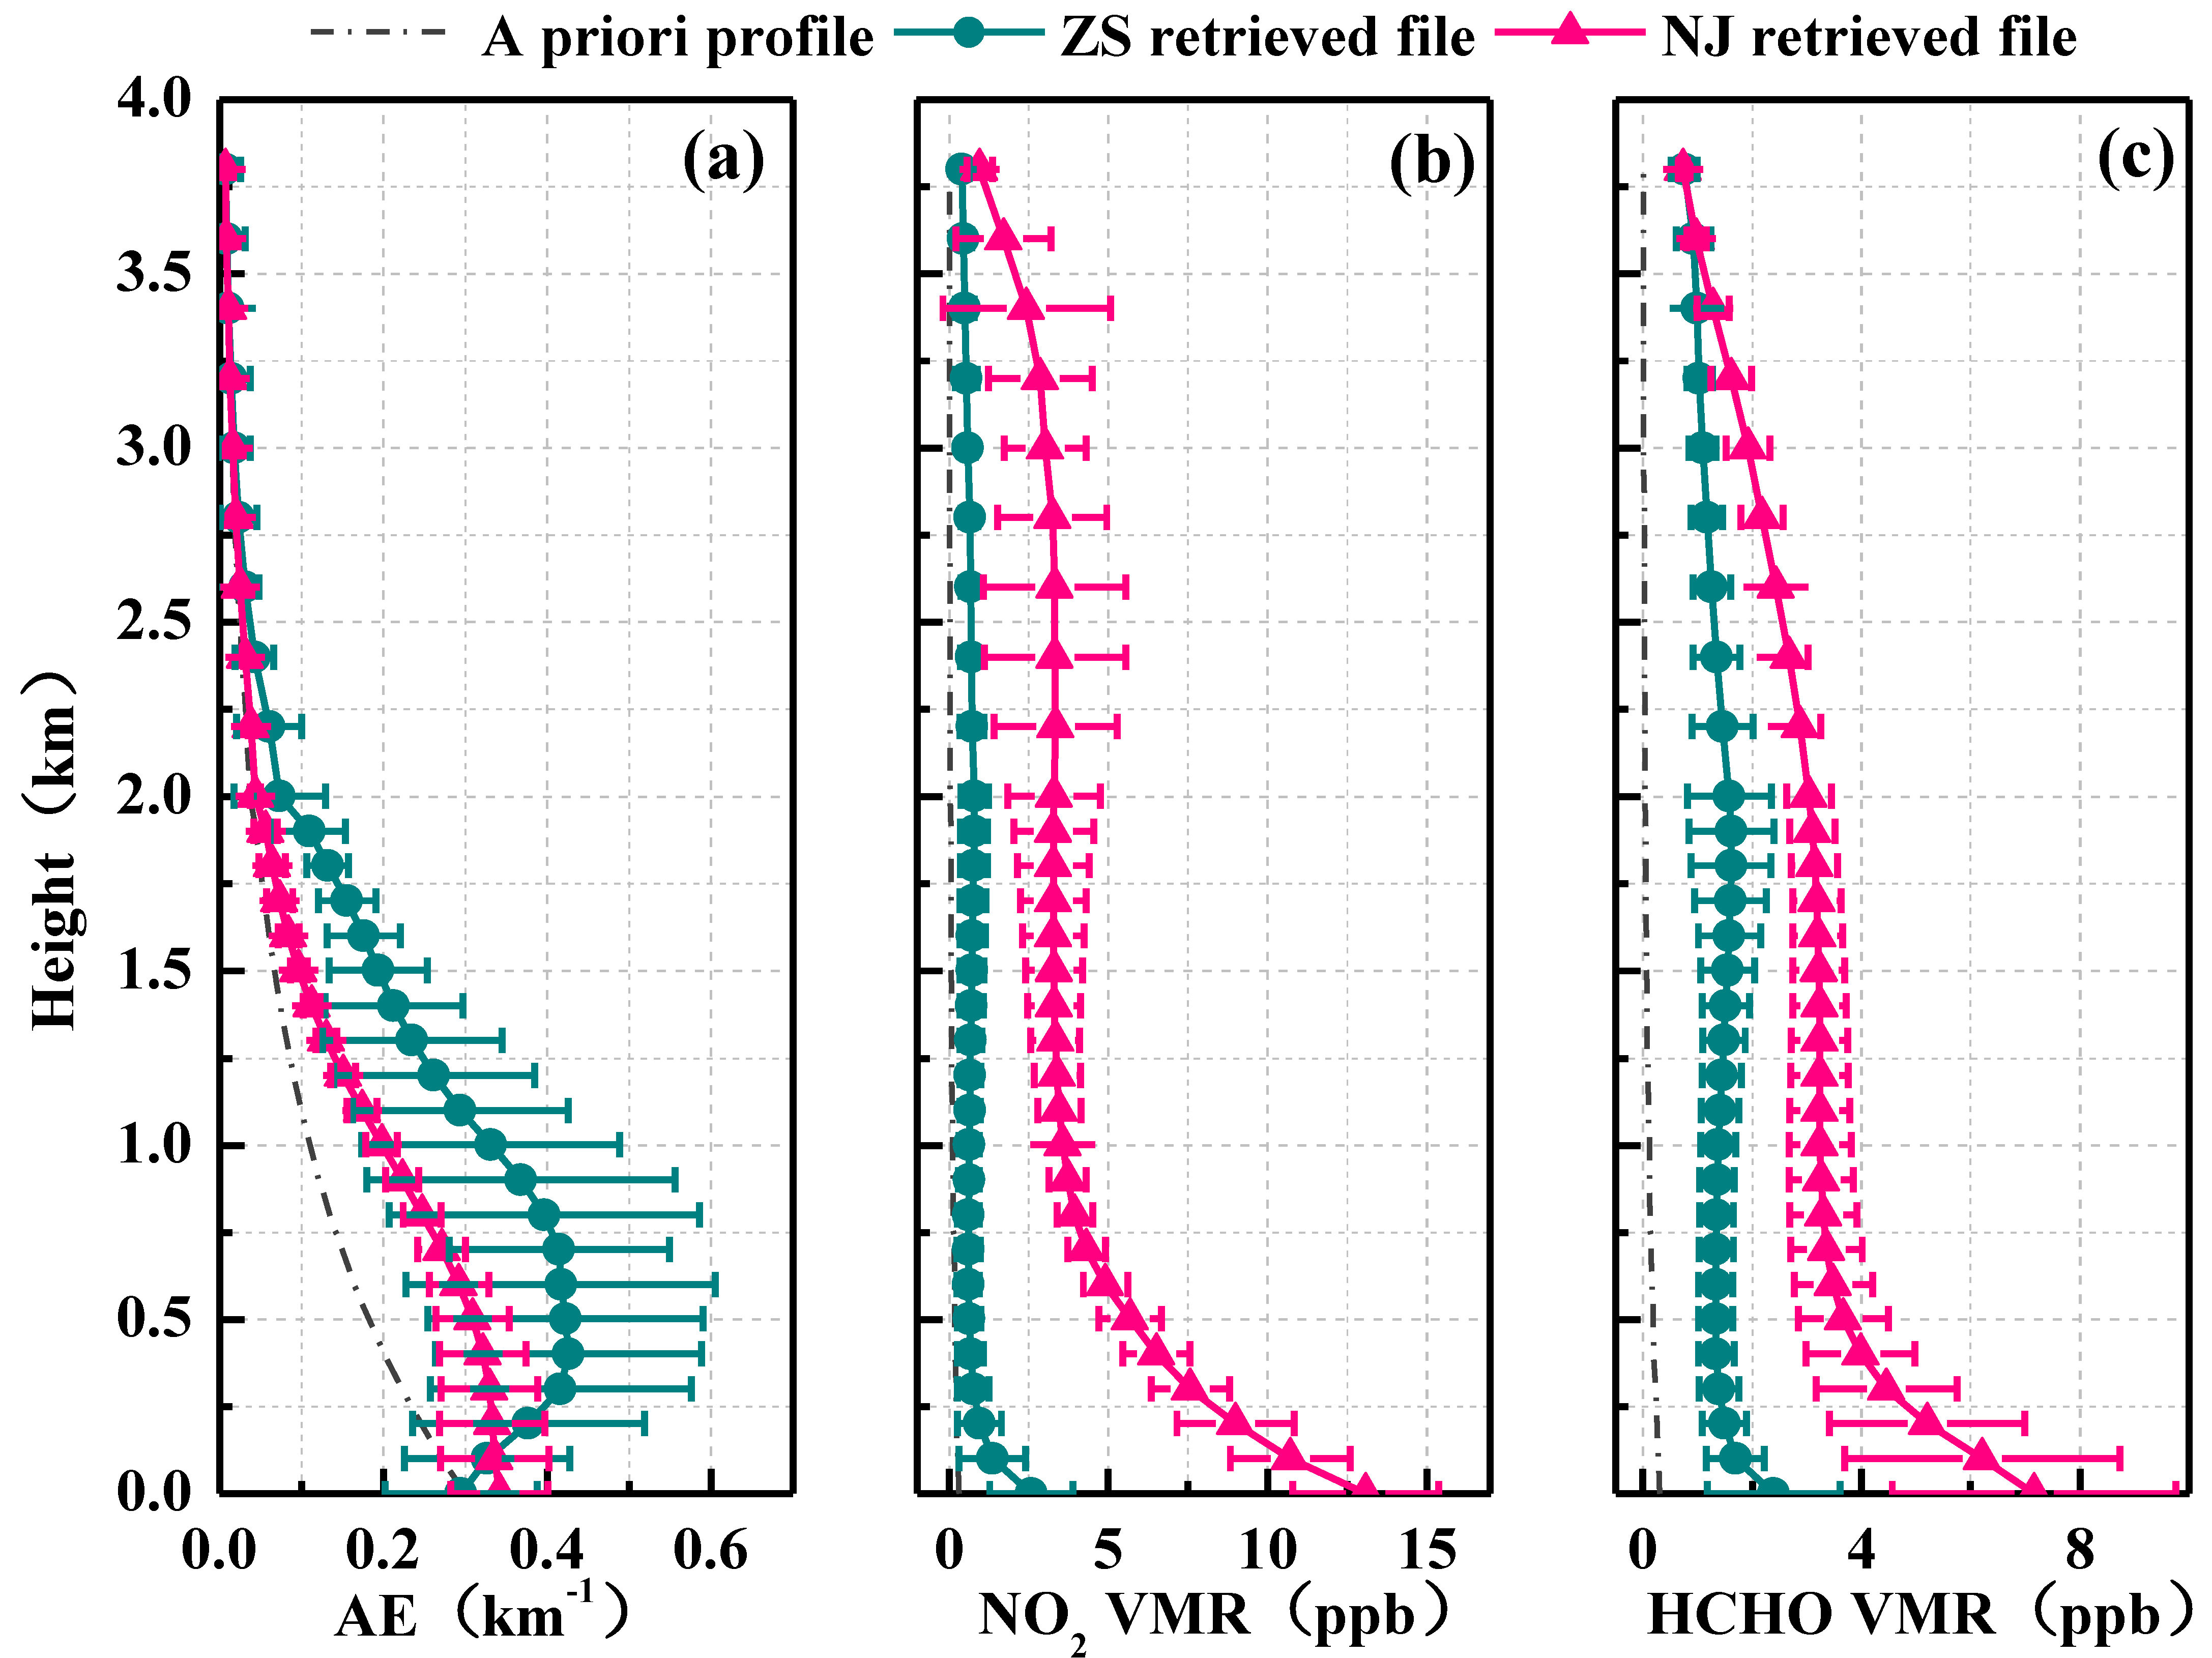
3.2. Vertical Profiles of Aerosols, NO2 and HCHO

The vertical profile features of aerosols, NO2, and HCHO at the ZS and NJ sites were further examined based on the variations in atmospheric composition between the island and inland regions at various elevations (Figure 5). As shown in Figure 4a, the vertical distribution pattern of AE at the NJ site was Gaussian, with a peak value appearing at 0.5 km, which agrees with the findings of other research conducted in other areas [16,42]. However, at 200–700 m, the AE values of the ZS site are significantly higher than those near the ground, which is likely due to external propagation. According to Xing et al. [8] and Pace et al. [43], sea breezes circulation causes pollutant deposition at island locations. In addition to being influenced by local emissions, meteorological conditions also have a role in the variance in air pollution components [44]. As shown in Figure S1, Zhoushan, an island region, has a strong relative variation in wind direction, mainly from the southeast, south, and southwest. The wind speed was higher than that at the NJ site and was mainly distributed in the 6–8 m/s range. The correlation coefficient between AE and wind speed was large and positive (0.74) at ZS (Table 2). This correlation is consistent with the above speculation that the AE at the ZS site was caused by the exportation of pollutants from the continent. In addition, the AE at the NJ site showed a significant positive correlation with HCHO (Table 3), whereas the AE at the ZS site was not correlated with NO2 or HCHO, which indicated that aerosols at the ZS site were mainly from external transport. As shown in Figure 5b, the NO2 concentrations of the two sites revealed a decreasing trend with altitude, and the NO2 values of the NJ site at 2.5–3 km showed a high value, which may be due to transport impact from the surrounding areas [8]. In addition, HCHO at the NJ site decreased with altitude (Figure 5c), whereas it showed little variation at the ZS site, and even a slight increase at 1.5–2 km. Some studies have pointed out that levels of pollutants increase at higher elevation due to transport from polluted areas [16,23].

4. Discussion

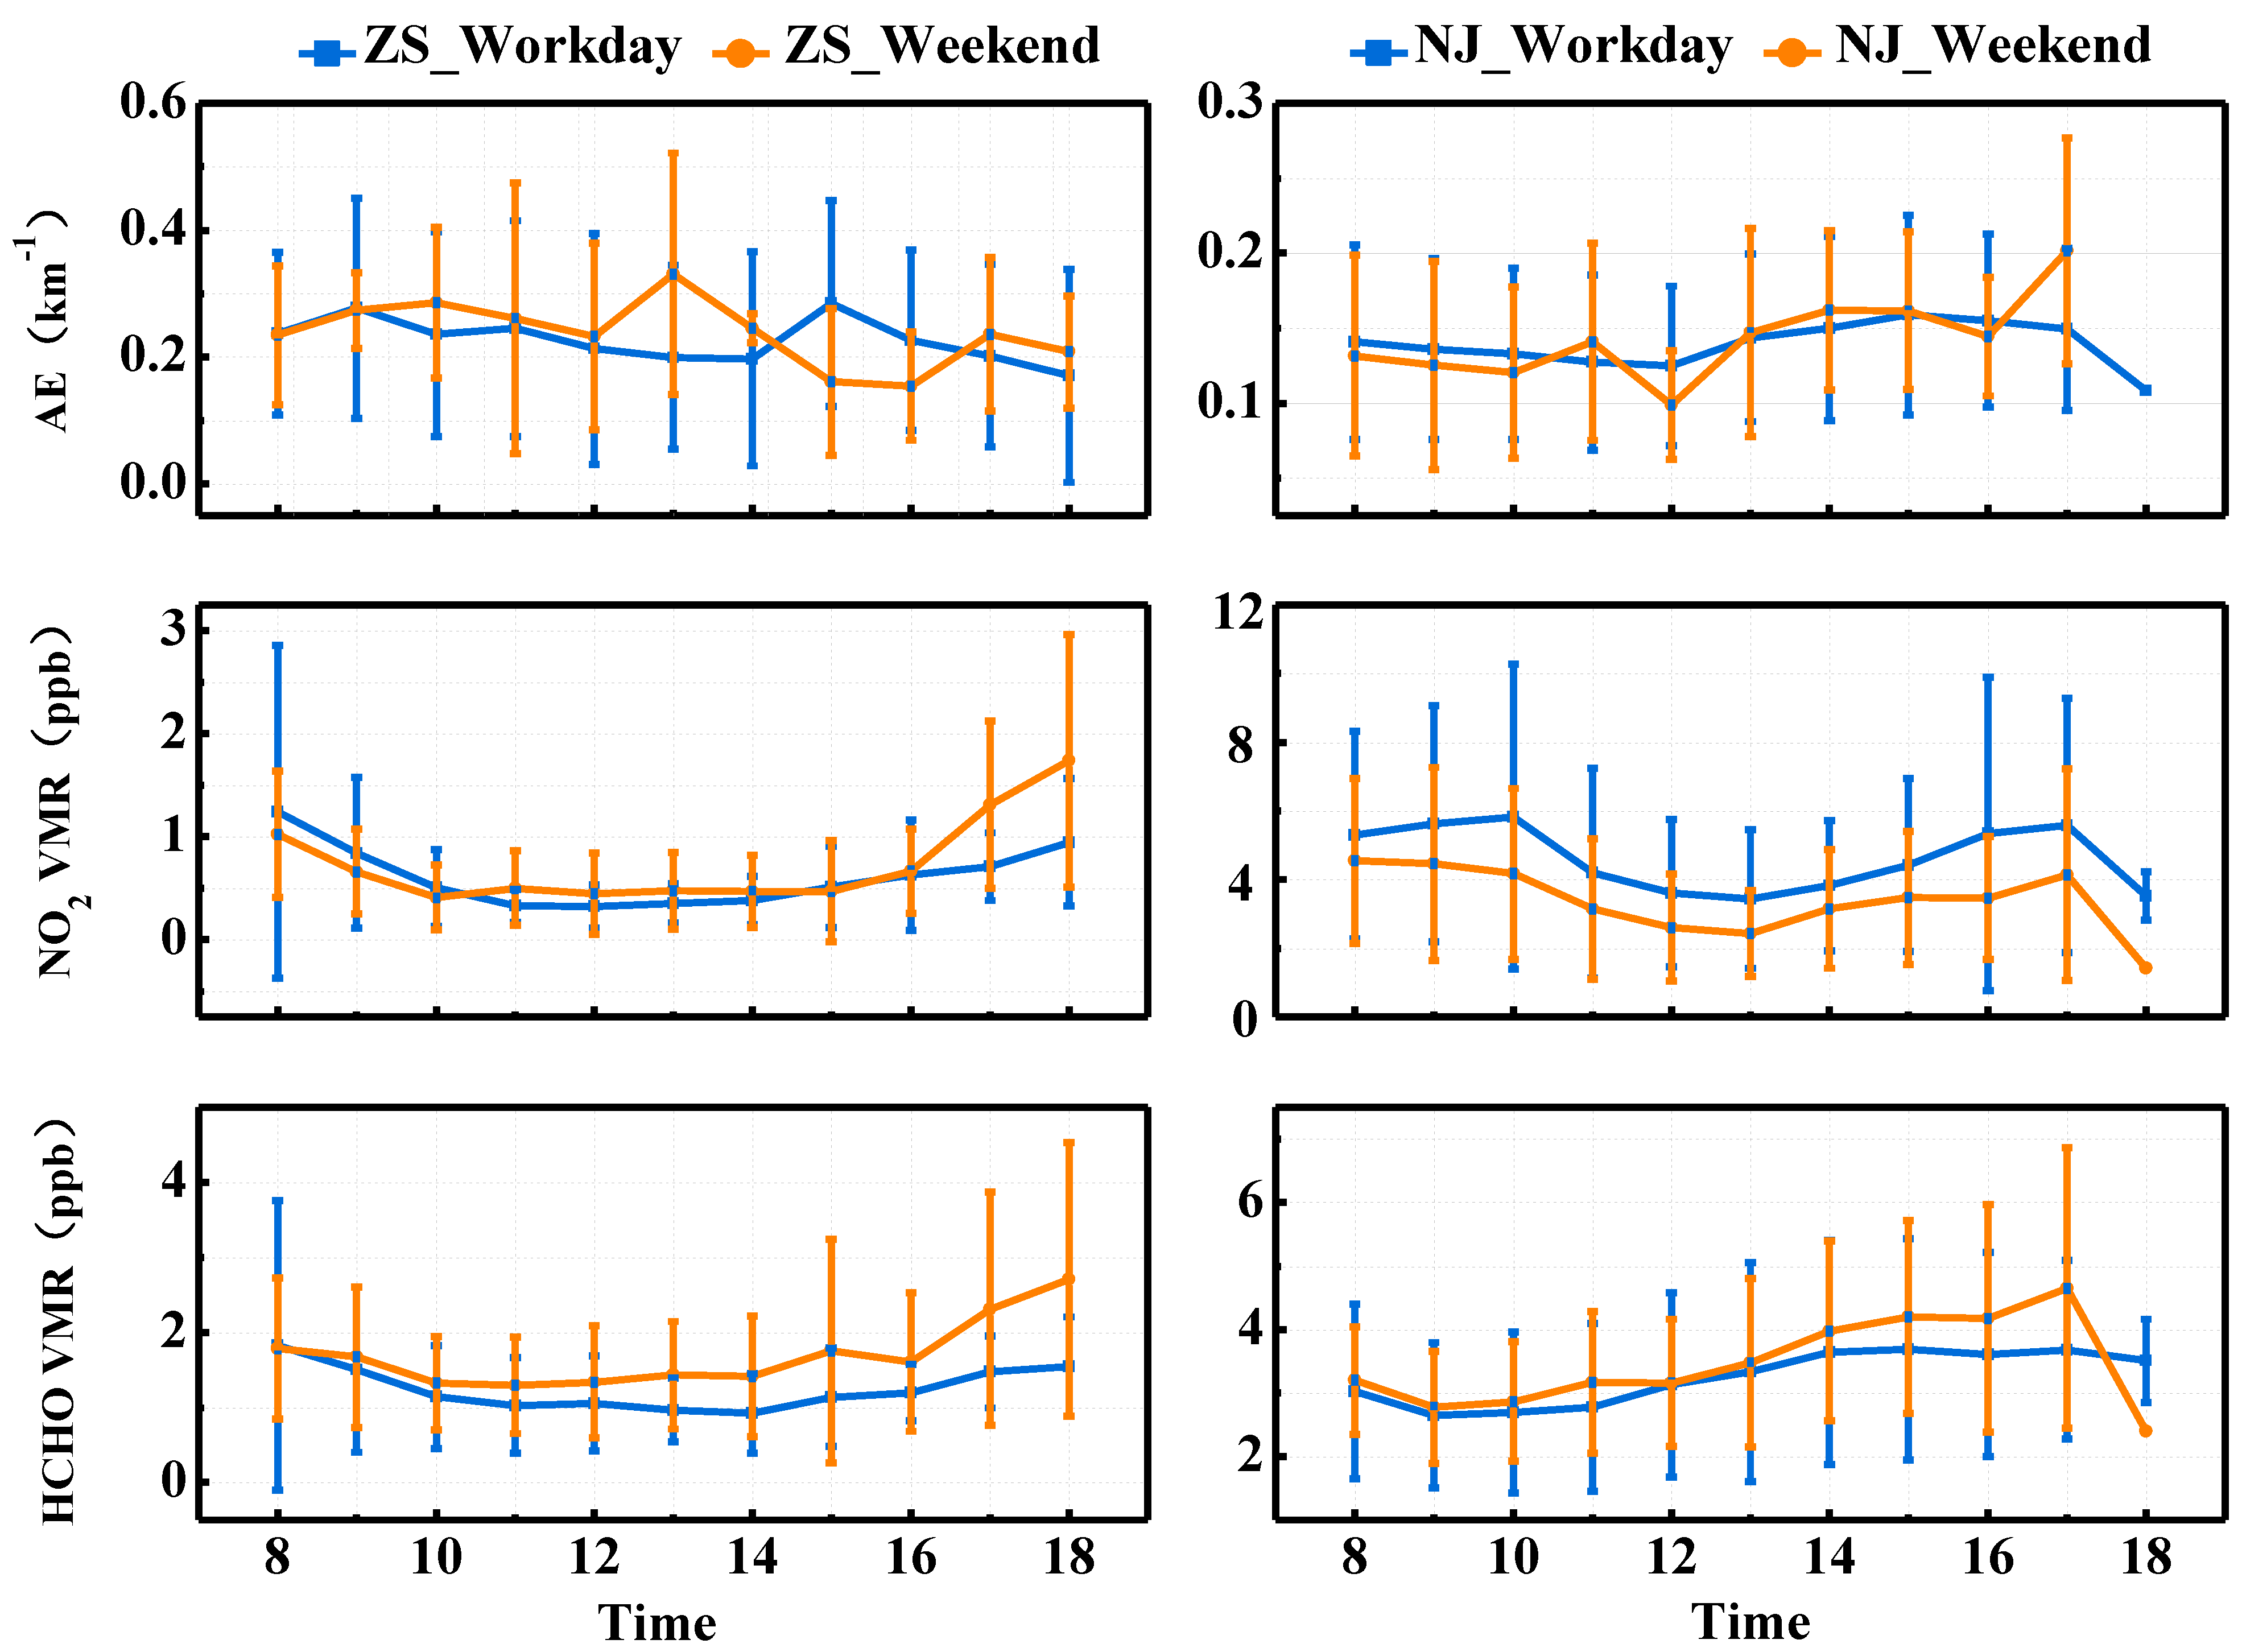
4.1. Diurnal and Weekly Variations of Aerosols, NO2, and HCHO

We analyzed the diurnal variation of the pollutants at 0–200 m from 08:00 to 18:00 LT. Figure 6a shows that during the period from 8:00 to 18:00 LT, the daily variation of AE at the ZS site is bimodal, with peak values occurring at 9:00 and 15:00. The AE value of the ZS site is higher than that of the NJ site. This may be caused by the frequent industrial activities and traffic activities in Nanjing area [45,46,47]. The AE peak of the NJ site appeared in the afternoon. Figure 6b shows that the variation in NO2 during the daytime is not apparent at ZS, mainly due to the low traffic emissions, and there was no obvious traffic emission source [27]. In addition, the photolysis of NO2 led to the low NO2 value near noon [8]. The peak of NO2 at the NJ sites occurred at 10:00 and 17:00, which was mainly caused by vehicle emissions during traffic hours [5]. Figure 6c shows that the HCHO value of ZS began to decline in the morning and increased from 14:00 to 18:00. This may relate to changes in wind speed and direction in the island region [26,27]. The HCHO value of the NJ site increased from 10:00 to approximately 14:00, remained constant until 17:00, and then began to decline. The daily pattern of formaldehyde in Nanjing was similar to that in Shanghai in the YRD and Beijing, which should be attributed to vehicle biogenic emissions, and the secondary formation from the photolysis of volatile organic compounds (VOCs) [5,48].
The weekend impact denotes the decrease in traffic, human industrial activity, and pollutant emission levels over the weekend [49]. By comparing the daily distribution characteristics of the three atmospheric components at the two sites on weekdays and weekends (Figure 7), the HCHO content at the NJ site was slightly higher on weekends than that during the workday. Considering the uncertainty in the monitoring process of HCHO, there was no significant difference between workdays and weekends, which was also confirmed via ANOVA analysis (p > 0.05). In addition to the time period of 17:00–18:00, the HCHO distribution of the ZS site also showed the same characteristics as that of NJ site. This may be because Zhoushan was a tourist attraction; the tourist flow on weekends was higher than on weekdays, and May to July was the peak season for tourism [26]. NO2 at the Nanjing site showed a noticeable weekend effect and a bimodal distribution. This conclusion is consistent with that for Shanghai [50].

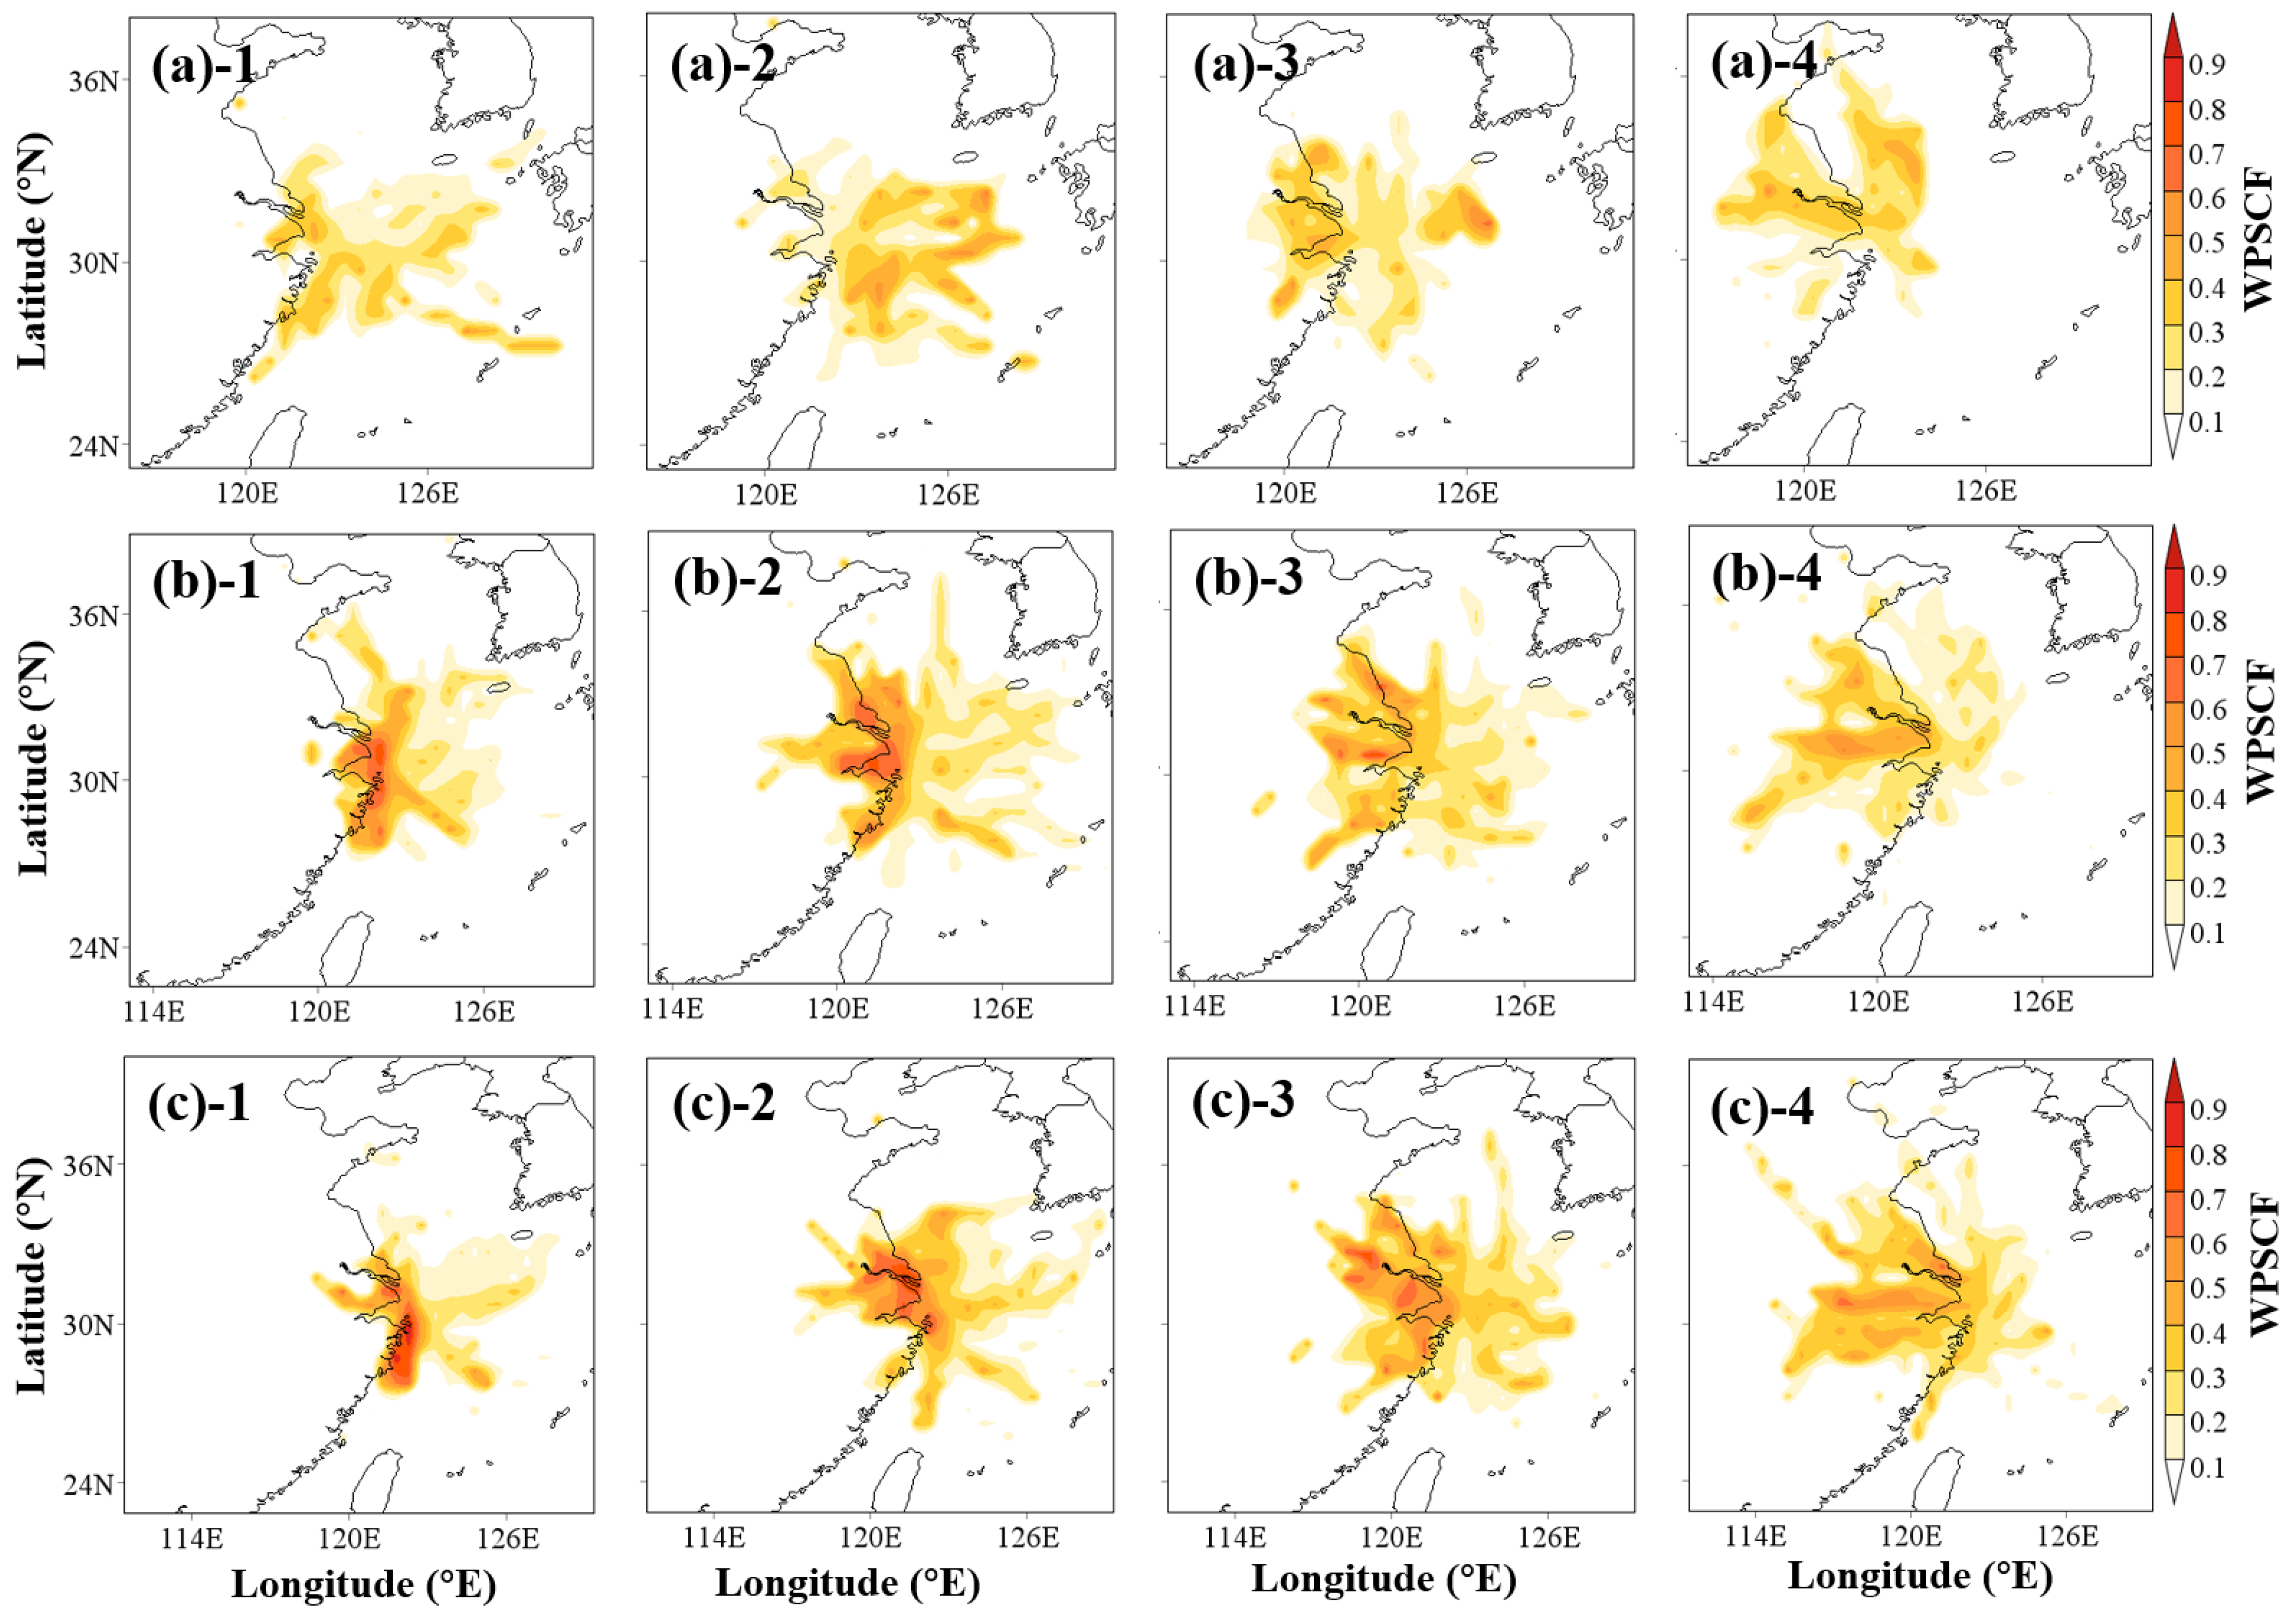
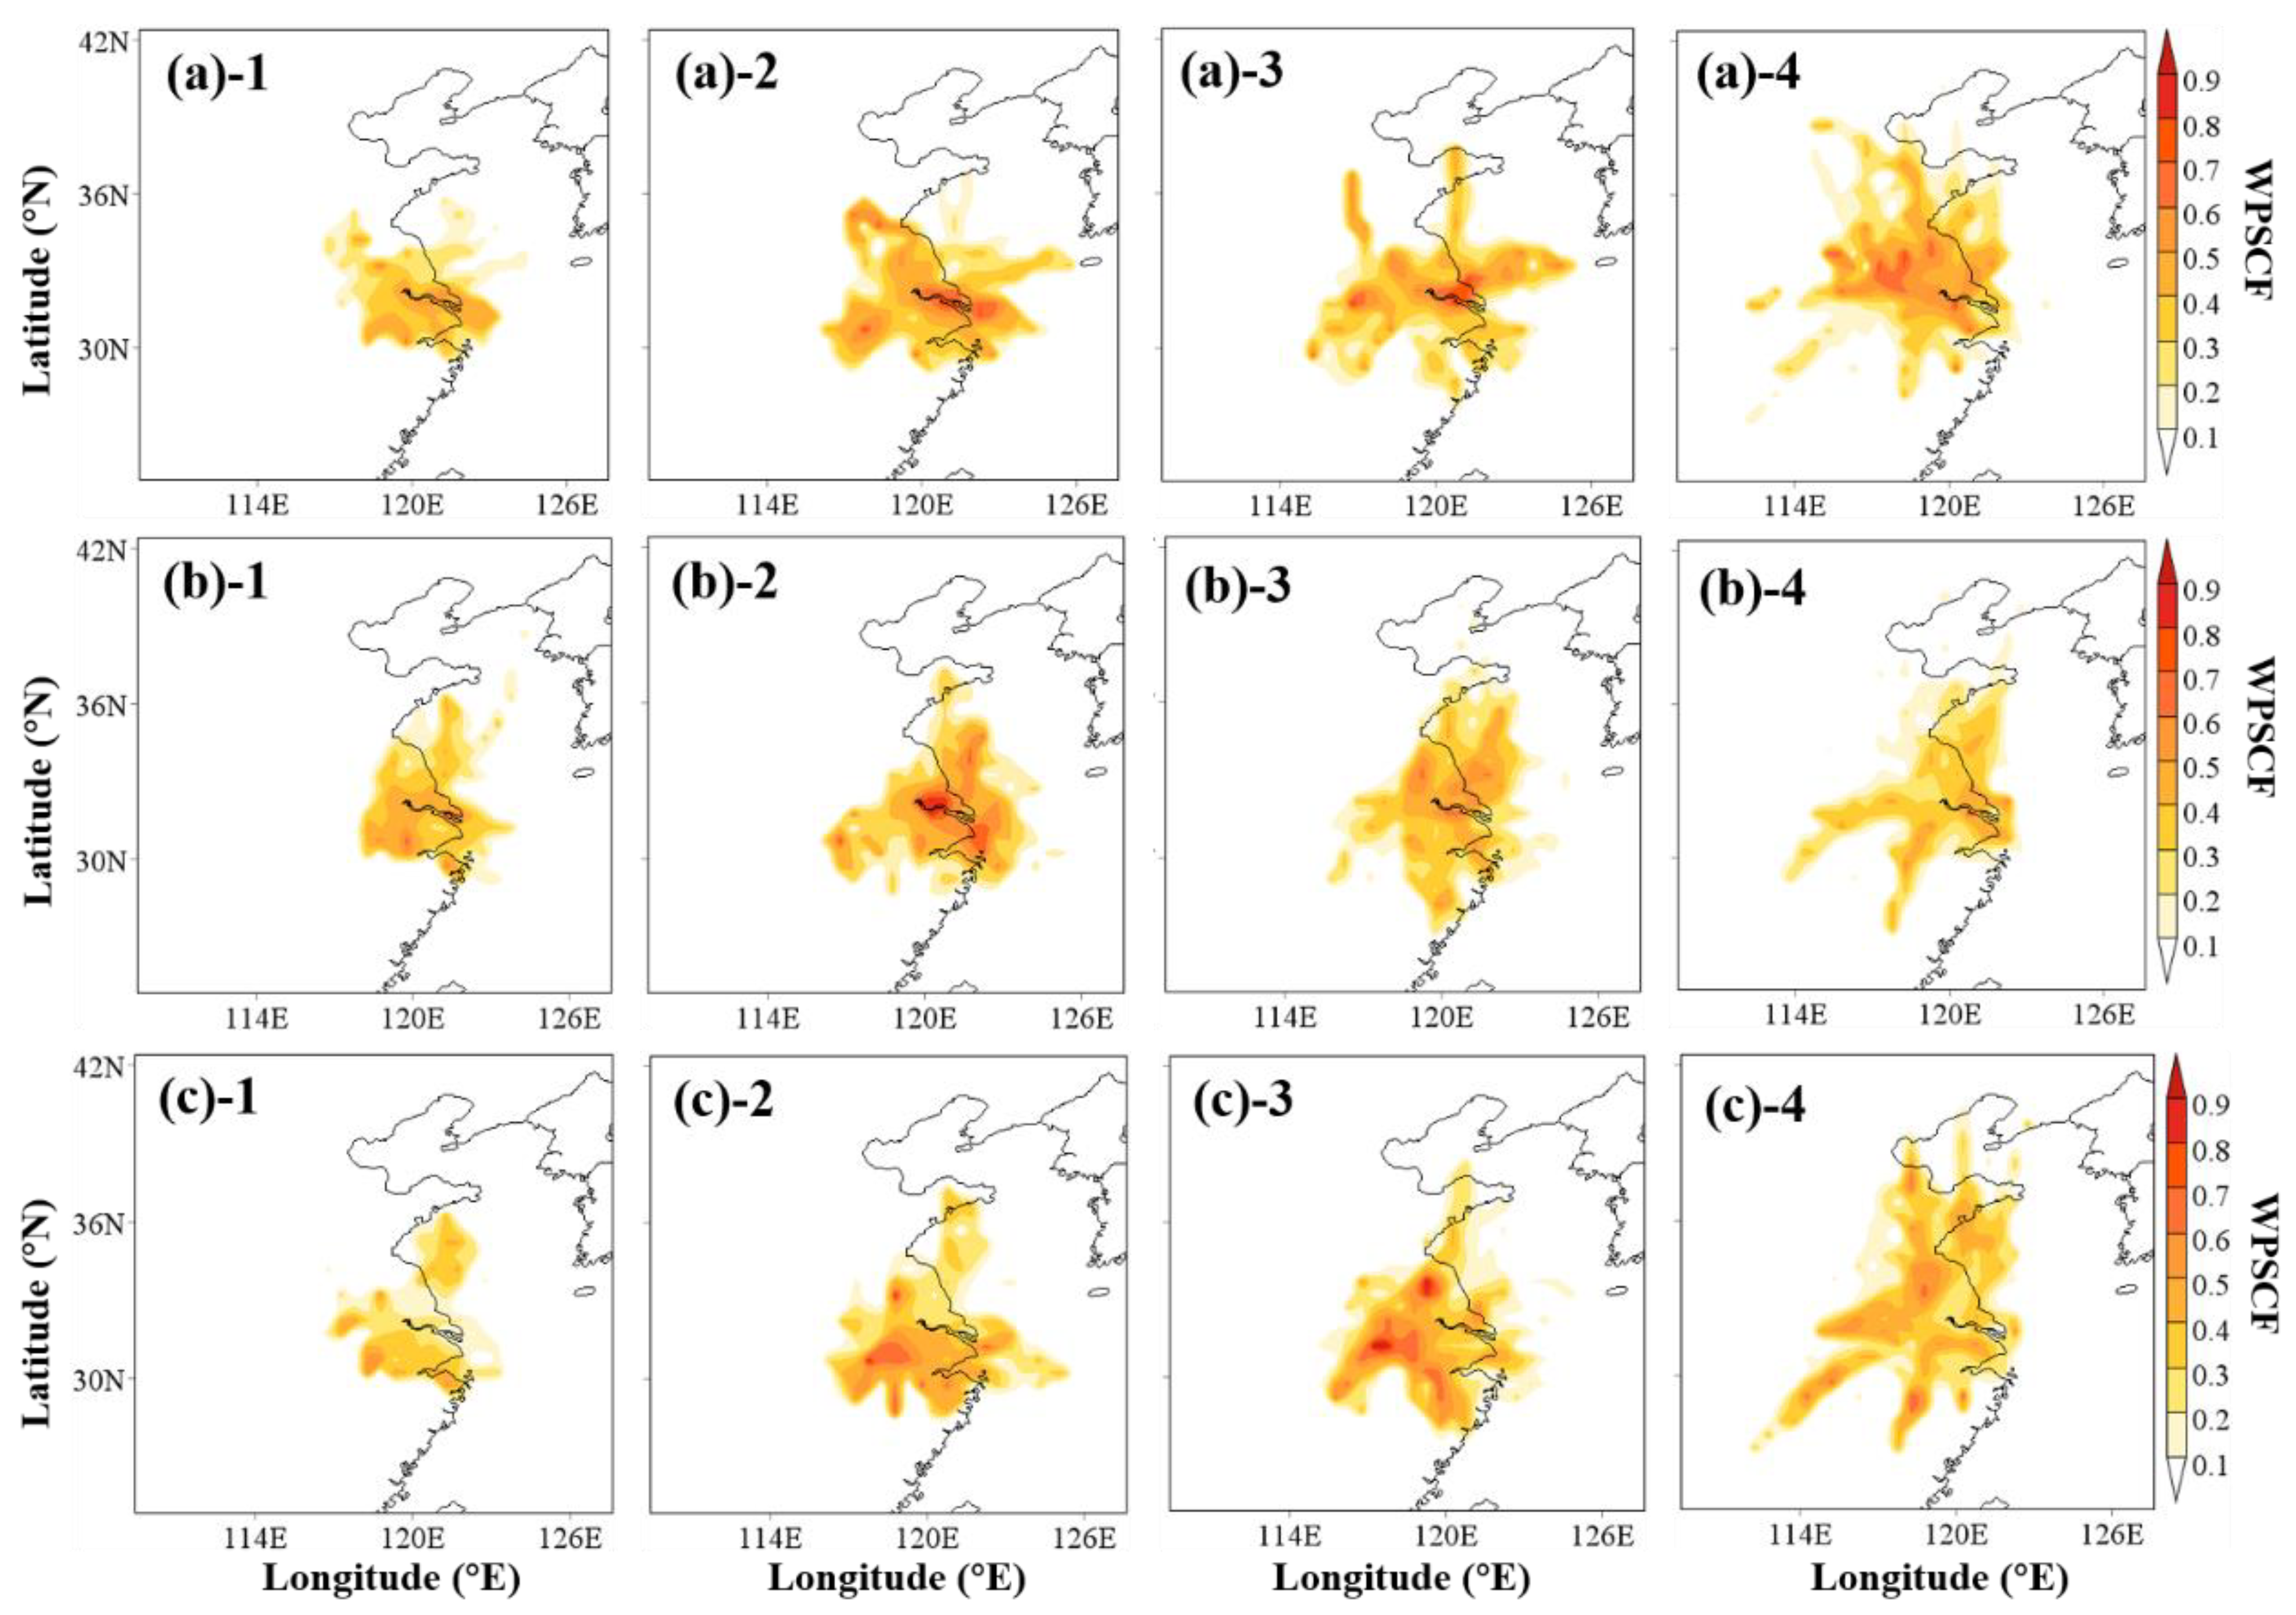
4.2. Differences in Potential Sources of Aerosols, NO2, and HCHO between Islands and Inland Areas

Previous studies have found that higher values of atmospheric components at high altitudes (greater than 500 m) may be sourced from regional transport [16,51,52,53]. Therefore, this study used the PSCF model to study the relative contributions of potential source regions. Since aerosol and the other two trace gases (NO2 and HCHO) have different lifetimes in the atmosphere, 72-h and 24-h air mass backward trajectory analyses were adopted for aerosol and trace gases (NO2 and HCHO) to analyze potential sources of pollutants, respectively [6,23].
For the Zhoushan site (Figure 8 and Figure 9), the 24-h backward air masses mainly come from YRD and central provinces, such as Jiangsu Province, southern Anhui Province, Henan Province, northern Zhejiang Province, Shanghai, and ECS. In addition to the above areas, the sources of the 72-h backward air masses also include Mongolia and the Yellow Sea. In Nanjing, China (Figure 8 and Figure 9), the sources of the 24-h backward air masses mainly included Jiangsu Province, Shandong Province, northern Zhejiang Province, southern Anhui Province, and Shanghai, which is consistent with the findings of various other studies [27,54,55,56,57]. Sources of the 72-h backward air masses mainly include Mongolia, the Yellow Sea, and the ECS, in addition to the areas covered in 24 h. Contrary to Zhoushan, the 24-h backward air masses at different altitudes mainly come from the northeast, southeast, south, and east. Nonetheless, the 72-h backward air masses originate from several sources at various altitudes.
The WPSCF results showed that the local emissions and the ECS were the main sources of aerosols in Zhoushan at elevation of 100 m, 500 m, and 1000 m, whereas the pollution sources at 2000 m mainly included Jiangsu Province and the Yellow Sea (Figure 10). The NO2 pollution sources at 500 m were mainly northeastern Zhejiang, Shanghai, and the ECS. The HCHO sources at different heights were mainly distributed in Jiangsu Province, northeastern Zhejiang Province, and the Yellow Sea. Figure 11 shows that the potential sources of aerosol pollution at 100 m from Nanjing were mainly local emissions and Jiangsu Province. However, aerosol sources at 500 m, 1000 m, and 2000 m included Shanghai and southeastern Anhui Province in addition to Jiangsu Province and local emissions. The NO2 source area at 500 m was mainly distributed in the southeastern Jiangsu Province and Shanghai. Local emissions primarily affected HCHO at a distance of 100 m, whereas at a distance of 500 m, pollution sources included Shanghai, southern Jiangsu Province, and southeast Anhui Province [23]. Southeast Anhui Province and Jiangsu Province are two of the areas where pollution from the 1000 m HCHO is produced. Pollution sources at 2000 m included southeastern Anhui Province, Jiangsu Province, and Shandong Province. In summary, aerosols, NO2, and HCHO in Nanjing were more influenced by the transport of inland regions, whereas aerosols in Zhoushan were more susceptible to the transport of pollutants in the Yellow Sea and ECS, and the transport contributions of the surrounding inland regions more influenced NO2 and HCHO.

5. Conclusions

This research revealed the vertical and temporal distribution features, as well as possible pollution sources, of various atmospheric components (aerosols, NO2, and HCHO) at different heights on islands and inland regions in the YRD region based on MAX-DOAS measurements. Compared to the ZS site, the AE values close to the surface at the NJ site were greater. Owing to the impact of sea breezes, the AE value at high altitude in ZS is higher than that in NJ. In contrast, because of the high degree of urbanization, Nanjing’s NO2 and HCHO values were higher than those in Zhoushan. The diurnal variation characteristics of HCHO at both sites showed that the HCHO content on working days was slightly lower than on weekends. The correlation between meteorological factors and AE, NO2, and HCHO confirms that the high AE value of ZS is consistent with the regional transport of pollutants driven by wind speed. Identifying potential sources of air pollution components at vertical heights in the YRD showed that aerosols, NO2, and HCHO in Zhoushan and Nanjing were mainly influenced by pollutant transport in the Yellow Sea, inland regions, and the ECS. According to our study, the pollutants transported from surrounding seas play an important role in the vertical distribution characteristics of aerosols, NO2, and HCHO in Zhoushan. In the future, we plan to study more coastal air composition samples using our study methodology and remote sensing technologies.

Supplementary Materials

The following supporting information can be downloaded at https://www.mdpi.com/article/10.3390/rs15235475/s1. S1: WRF model configuration. Figure S1: The averaged vertical profiles of (a) T, (b) RH, (c) WD and (d) WS from May to July 2019. Table S1: Parametric scheme of physical process in WRF model. Refs. [16,25,58,59,60,61] are cited in the Supplementary Materials.

Author Contributions

Conceptualization, J.O. and C.X.; Validation, Y.Z. and J.F.; Writing—original draft, J.O.; Writing—review and editing, C.X., Q.H. and C.L.; Software, J.F., X.J. and H.L.; Formal analysis, X.W. and H.Y. Resources, J.O., C.X. and C.L. All authors have read and agreed to the published version of the manuscript.

Funding

This research was supported by grants from the Natural Science Foundation of Anhui Province (2208085QD117) and the National Natural Science Foundation of China (42207113).

Data Availability Statement

The data presented in this study are available on request from the corresponding author.

Acknowledgments

We acknowledge all developers for contributing to the development of the WRF model. We thank NCEP for providing the final reanalysis dataset (FNL). Thanks to the Remote Sensing Group of the University of Science and Technology of China for their support and help with respect to ground remote sensing data. We thank the Belgian Institute for Space Aeronomy (BIRAIASB), Brussels, Belgium, for their freely accessible QDOAS software. We are grateful for the great contribution of the SCIATRAN radiative transfer model. We thank the National Oceanic and Atmospheric Administration (NOAA) Air Resources Laboratory (ARL) for the provision of the HYSPLIT transport and dispersion model.

Conflicts of Interest

The authors declare no conflict of interest.

References

  1. Xin, J.; Ma, Y.; Zhao, D.; Gong, C.; Ren, X.; Tang, G.; Xia, X.; Wang, Z.; Cao, J.; De Arellano, J.V.-G.; et al. The Feedback Effects of Aerosols from Different Sources on the Urban Boundary Layer in Beijing China. Environ. Pollut. 2023, 325, 121440. [Google Scholar] [CrossRef] [PubMed]
  2. Wu, S.; Tang, G.; Wang, Y.; Yang, Y.; Yao, D.; Zhao, W.; Gao, W.; Sun, J.; Wang, Y. Vertically Decreased VOC Concentration and Reactivity in the Planetary Boundary Layer in Winter over the North China Plain. Atmos. Res. 2020, 240, 104930. [Google Scholar] [CrossRef]
  3. Falah, S.; Kizel, F.; Banerjee, T.; Broday, D.M. Accounting for the Aerosol Type and Additional Satellite-Borne Aerosol Products Improves the Prediction of PM2.5 Concentrations. Environ. Pollut. 2023, 320, 121119. [Google Scholar] [CrossRef] [PubMed]
  4. Hossain, M.S.; Frey, H.C.; Louie, P.K.K.; Lau, A.K.H. Combined Effects of Increased O3 and Reduced NO2 Concentrations on Short-Term Air Pollution Health Risks in Hong Kong. Environ. Pollut. 2021, 270, 116280. [Google Scholar] [CrossRef]
  5. Tian, X.; Xie, P.; Xu, J.; Li, A.; Wang, Y.; Qin, M.; Hu, Z. Long-Term Observations of Tropospheric NO2, SO2 and HCHO by MAX-DOAS in Yangtze River Delta Area, China. J. Environ. Sci. 2018, 71, 207–221. [Google Scholar] [CrossRef]
  6. Ren, B.; Xie, P.; Xu, J.; Li, A.; Qin, M.; Hu, R.; Zhang, T.; Fan, G.; Tian, X.; Zhu, W.; et al. Vertical Characteristics of NO2 and HCHO, and the Ozone Formation Regimes in Hefei, China. Sci. Total Environ. 2022, 823, 153425. [Google Scholar] [CrossRef]
  7. Gao, Y.; Pan, H.; Cao, L.; Lu, C.; Yang, Q.; Lu, X.; Ding, H.; Li, S.; Zhao, T. Effects of Anthropogenic Emissions and Meteorological Conditions on Diurnal Variation of Formaldehyde (HCHO) in the Yangtze River Delta, China. Atmos. Pollut. Res. 2023, 14, 101779. [Google Scholar] [CrossRef]
  8. Xing, C.; Liu, C.; Hong, Q.; Liu, H.; Wu, H.; Lin, J.; Song, Y.; Chen, Y.; Liu, T.; Hu, Q.; et al. Vertical Distributions and Potential Sources of Wintertime Atmospheric Pollutants and the Corresponding Ozone Production on the Coast of Bohai Sea. J. Environ. Manag. 2022, 319, 115721. [Google Scholar] [CrossRef]
  9. Liu, C.; Xing, C.; Hu, Q.; Li, Q.; Liu, H.; Hong, Q.; Tan, W.; Ji, X.; Lin, H.; Lu, C.; et al. Ground-Based Hyperspectral Stereoscopic Remote Sensing Network: A Promising Strategy to Learn Coordinated Control of O3 and PM2.5 over China. Engineering 2022, 19, 71–83. [Google Scholar] [CrossRef]
  10. Zhang, Q.; Ma, X.; Tie, X.; Huang, M.; Zhao, C. Vertical Distributions of Aerosols under Different Weather Conditions: Analysis of in-Situ Aircraft Measurements in Beijing, China. Atmos. Environ. 2009, 43, 5526–5535. [Google Scholar] [CrossRef]
  11. Klein, A.; Ancellet, G.; Ravetta, F.; Thomas, J.L.; Pazmino, A. Characterizing the Seasonal Cycle and Vertical Structure of Ozone in Paris, France Using Four Years of Ground Based LIDAR Measurements in the Lowermost Troposphere. Atmos. Environ. 2017, 167, 603–615. [Google Scholar] [CrossRef]
  12. Zhang, K.; Xiu, G.; Zhou, L.; Bian, Q.; Duan, Y.; Fei, D.; Wang, D.; Fu, Q. Vertical Distribution of Volatile Organic Compounds within the Lower Troposphere in Late Spring of Shanghai. Atmos. Environ. 2018, 186, 150–157. [Google Scholar] [CrossRef]
  13. Luo, Y.; Dou, K.; Fan, G.; Huang, S.; Si, F.; Zhou, H.; Wang, Y.; Pei, C.; Tang, F.; Yang, D.; et al. Vertical Distributions of Tropospheric Formaldehyde, Nitrogen Dioxide, Ozone and Aerosol in Southern China by Ground-Based MAX-DOAS and LIDAR Measurements during PRIDE-GBA 2018 Campaign. Atmos. Environ. 2020, 226, 117384. [Google Scholar] [CrossRef]
  14. Tang, G.; Liu, Y.; Huang, X.; Wang, Y.; Hu, B.; Zhang, Y.; Song, T.; Li, X.; Wu, S.; Li, Q.; et al. Aggravated Ozone Pollution in the Strong Free Convection Boundary Layer. Sci. Total Environ. 2021, 788, 147740. [Google Scholar] [CrossRef] [PubMed]
  15. Lv, L.; Xiang, Y.; Zhang, T.; Chai, W.; Liu, W. Comprehensive Study of Regional Haze in the North China Plain with Synergistic Measurement from Multiple Mobile Vehicle-Based Lidars and a Lidar Network. Sci. Total Environ. 2020, 721, 137773. [Google Scholar] [CrossRef] [PubMed]
  16. Ou, J.; Hu, Q.; Liu, H.; Hong, Q.; Xing, C.; Tan, W.; Lin, H.; Wang, X.; Xu, H.; Zhu, P.; et al. Vertical Characterization and Potential Sources of Aerosols in Different Seasons over the Yangtze River Delta Using Ground-Based MAX-DOAS. Environ. Pollut. 2021, 279, 116898. [Google Scholar] [CrossRef]
  17. Lee, H.; Ryu, J.; Irie, H.; Jang, S.-H.; Park, J.; Choi, W.; Hong, H. Investigations of the Diurnal Variation of Vertical HCHO Profiles Based on MAX-DOAS Measurements in Beijing: Comparisons with OMI Vertical Column Data. Atmosphere 2015, 6, 1816–1832. [Google Scholar] [CrossRef]
  18. Zhang, J.; Chen, J.; Xia, X.; Che, H.; Fan, X.; Xie, Y.; Han, Z.; Chen, H.; Lu, D. Heavy Aerosol Loading over the Bohai Bay as Revealed by Ground and Satellite Remote Sensing. Atmos. Environ. 2016, 124, 252–261. [Google Scholar] [CrossRef]
  19. Hu, Q.; Liu, C.; Li, Q.; Liu, T.; Ji, X.; Zhu, Y.; Xing, C.; Liu, H.; Tan, W.; Gao, M. Vertical Profiles of the Transport Fluxes of Aerosol and Its Precursors between Beijing and Its Southwest Cities. Environ. Pollut. 2022, 312, 119988. [Google Scholar] [CrossRef]
  20. Ding, H.; Liu, Y.; Yu, Z.; Cheung, C.; Zhan, J. Spatial and Temporal Characteristics and Main Contributing Regions of High PM2.5 Pollution in Hong Kong. Aerosol Air Qual. Res. 2017, 17, 2955–2965. [Google Scholar] [CrossRef]
  21. Zhang, H.; Li, A.; Hu, Z.; Guo, J.; Yun, L.; Zhang, M.; Ren, H.; Zhong, H.; Xu, J. Evaluation and Measurement of Tropospheric Glyoxal Retrieved from MAX-DOAS in Shenzhen, China. Sci. Total Environ. 2023, 878, 162727. [Google Scholar] [CrossRef] [PubMed]
  22. Xu, S.; Wang, S.; Xia, M.; Lin, H.; Xing, C.; Ji, X.; Su, W.; Tan, W.; Liu, C.; Hu, Q. Observations by Ground-Based MAX-DOAS of the Vertical Characters of Winter Pollution and the Influencing Factors of HONO Generation in Shanghai, China. Remote Sens. 2021, 13, 3518. [Google Scholar] [CrossRef]
  23. Ren, B.; Xie, P.; Xu, J.; Li, A.; Tian, X.; Hu, Z.; Huang, Y.; Li, X.; Zhang, Q.; Ren, H.; et al. Use of the PSCF Method to Analyze the Variations of Potential Sources and Transports of NO2, SO2, and HCHO Observed by MAX-DOAS in Nanjing, China during 2019. Sci. Total Environ. 2021, 782, 146865. [Google Scholar] [CrossRef]
  24. Tanvir, A.; Bilal, M.; Zhang, S.; Sandhu, O.; Xue, R.; Ali, M.A.; Zhu, J.; Qiu, Z.; Wang, S.; Zhou, B. Seasonal Investigation of MAX-DOAS and In Situ Measurements of Aerosols and Trace Gases over Suburban Site of Megacity Shanghai, China. Remote Sens. 2022, 14, 3676. [Google Scholar] [CrossRef]
  25. Zhang, J.; Wang, S.; Guo, Y.; Zhang, R.; Qin, X.; Huang, K.; Wang, D.; Fu, Q.; Wang, J.; Bin Zhou, B. Aerosol vertical profile retrieved from ground-based MAX-DOAS observation and characteristic distribution during wintertime in Shanghai, China. Atmos. Environ. 2018, 192, 193–205. [Google Scholar] [CrossRef]
  26. Zhou, S.; Li, H.; Yang, T.; Chen, Y.; Deng, C.; Gao, Y.; Chen, C.; Xu, J. Characteristics and Sources of Aerosol Aminiums over the Eastern Coast of China: Insights from the Integrated Observations in a Coastal City, Adjacent Island and Surrounding Marginal Seas. Atmos. Chem. Phys. 2019, 19, 10447–10467. [Google Scholar] [CrossRef]
  27. Tian, M.; Li, H.; Wang, G.; Fu, M.; Qin, X.; Lu, D.; Liu, C.; Zhu, Y.; Luo, X.; Deng, C.; et al. Seasonal Source Identification and Formation Processes of Marine Particulate Water Soluble Organic Nitrogen over an Offshore Island in the East China Sea. Sci. Total Environ. 2023, 863, 160895. [Google Scholar] [CrossRef]
  28. Kreher, K.; Van Roozendael, M.; Hendrick, F.; Apituley, A.; Dimitropoulou, E.; Frieß, U.; Richter, A.; Wagner, T.; Lampel, J.; Abuhassan, N.; et al. Intercomparison of NO2, O4, O3 and HCHO slant column measurements by MAX-DOAS and zenith-sky UV-Visible spectrometers during the CINDI-2 campaign. Atmos. Meas. Tech. 2020, 13, 2169–2208. [Google Scholar] [CrossRef]
  29. Vandaele, A.C.; Hermans, C.; Simon, P.C.; Carleer, M.; Colin, R.; Fally, S.; Mérienne, M.F.; Jenouvrier, A.; Coquart, B. Measurements of the NO2 Absorption Cross-Section from 42,000 cm−1 to 10,000 cm−1 (238–1000 Nm) at 220 K and 294 K. J. Quant. Spectrosc. Radiat. Transf. 1998, 59, 171–184. [Google Scholar] [CrossRef]
  30. Serdyuchenko, A.; Gorshelev, V.; Weber, M.; Chehade, W.; Burrows, J.P. High Spectral Resolution Ozone Absorption Cross-Sections—Part 2: Temperature Dependence. Atmos. Meas. Tech. 2014, 7, 625–636. [Google Scholar] [CrossRef]
  31. Thalman, R.; Volkamer, R. Temperature Dependent Absorption Cross-Sections of O2–O2 Collision Pairs between 340 and 630 Nm and at Atmospherically Relevant Pressure. Phys. Chem. Chem. Phys. PCCP 2013, 15, 15371–15381. [Google Scholar] [CrossRef]
  32. Fleischmann, O.C.; Hartmann, M.; Burrows, J.P.; Orphal, J. New Ultraviolet Absorption Cross-Sections of BrO at Atmospheric Temperatures Measured by Time-Windowing Fourier Transform Spectroscopy. J. Photochem. Photobiol. A Chem. 2004, 168, 117–132. [Google Scholar] [CrossRef]
  33. Rothman, L.S.; Gordon, I.E.; Barbe, A.; Benner, D.C.; Bernath, P.F.; Birk, M.; Boudon, V.; Brown, L.R.; Campargue, A.; Champion, J.-P. The HITRAN 2008 molecular spectroscopic database. J. Quant. Spectrosc. Radiat. Transf. 2009, 110, 533–572. [Google Scholar] [CrossRef]
  34. Meller, R.; Moortgat, G.K. Temperature Dependence of the Absorption Cross Sections of Formaldehyde between 223 and 323 K in the Wavelength Range 225–375 Nm. J. Geophys. Res. Atmos. 2000, 105, 7089–7101. [Google Scholar] [CrossRef]
  35. Chance, K.V.; Spurr, R.J.D. Ring Effect Studies: Rayleigh Scattering, Including Molecular Parameters for Rotational Raman Scattering, and the Fraunhofer Spectrum. Appl. Opt. 1997, 36, 5224–5230. [Google Scholar] [CrossRef] [PubMed]
  36. Chance, K.; Kurucz, R.L. An Improved High-Resolution Solar Reference Spectrum for Earth’s Atmosphere Measurements in the Ultraviolet, Visible, and near Infrared. J. Quant. Spectrosc. Radiat. Transf. 2010, 111, 1289–1295. [Google Scholar] [CrossRef]
  37. Zhang, K.; Batterman, S. Air Pollution and Health Risks Due to Vehicle Traffic. Sci. Total Environ. 2013, 450, 307–316. [Google Scholar] [CrossRef]
  38. Han, S.; Cai, Z.; Liu, J.; Zhang, M.; Chen, J.; Lin, Y. Comparison on Aerosol Physicochemical Properties of Sea and Land along the Coast of Bohai, China. Sci. Total Environ. 2019, 673, 148–156. [Google Scholar] [CrossRef]
  39. Bian, Y.X.; Zhao, C.S.; Ma, N.; Chen, J.; Xu, W.Y. A Study of Aerosol Liquid Water Content Based on Hygroscopicity Measurements at High Relative Humidity in the North China Plain. Atmos. Chem. Phys. 2014, 14, 6417–6426. [Google Scholar] [CrossRef]
  40. Zhang, Y.; Ding, A.; Mao, H.; Nie, W.; Zhou, D.; Liu, L.; Huang, X.; Fu, C. Impact of Synoptic Weather Patterns and Inter-Decadal Climate Variability on Air Quality in the North China Plain during 1980–2013. Atmos. Environ. 2016, 124, 119–128. [Google Scholar] [CrossRef]
  41. Zhou, M.; Zhang, Y.; Han, Y.; Wu, J.; Du, X.; Xu, H.; Feng, Y.; Han, S. Spatial and Temporal Characteristics of PM2.5 Acidity during Autumn in Marine and Coastal Area of Bohai Sea, China, Based on Two-Site Contrast. Atmos. Res. 2018, 202, 196–204. [Google Scholar] [CrossRef]
  42. Hong, Q.; Zhu, L.; Xing, C.; Hu, Q.; Lin, H.; Zhang, C.; Zhao, C.; Liu, T.; Su, W.; Liu, C. Inferring Vertical Variability and Diurnal Evolution of O3 Formation Sensitivity Based on the Vertical Distribution of Summertime HCHO and NO2 in Guangzhou, China. Sci. Total Environ. 2022, 827, 154045. [Google Scholar] [CrossRef]
  43. Pace, G.; Junkermann, W.; Vitali, L.; Di Sarra, A.; Meloni, D.; Cacciani, M.; Cremona, G.; Iannarelli, A.M.; Zanini, G. On the Complexity of the Boundary Layer Structure and Aerosol Vertical Distribution in the Coastal Mediterranean Regions: A Case Study. Tellus B Chem. Phys. Meteorol. 2015, 67, 27721. [Google Scholar] [CrossRef]
  44. Zhang, Q.; Hu, W.; Ren, H.; Yang, J.; Deng, J.; Wang, D.; Sun, Y.; Wang, Z.; Kawamura, K.; Fu, P. Diurnal Variations in Primary and Secondary Organic Aerosols in an Eastern China Coastal City: The Impact of Land-Sea Breezes. Environ. Pollut. 2023, 319, 121016. [Google Scholar] [CrossRef] [PubMed]
  45. Molozhnikova, Y.V.; Shikhovtsev, M.Y.; Netsvetaeva, O.G.; Khodzher, T.V. Ecological Zoning of the Baikal Basin Based on the Results of Chemical Analysis of the Composition of Atmospheric Precipitation Accumulated in the Snow Cover. Appl. Sci. 2023, 13, 8171. [Google Scholar] [CrossRef]
  46. Zhu, S.; Lyu, Q.; Zhu, J.; Liang, C. Experimental Study on NOx Emissions of Pulverized Bituminous Coal Combustion Preheated by a Circulating Fluidized Bed. J. Energy Inst. 2019, 92, 247–256. [Google Scholar] [CrossRef]
  47. Pérez-Vega, R.; Adánez-Rubio, I.; Gayán, P.; Izquierdo, M.T.; Abad, A.; García-Labiano, F.; De Diego, L.F.; Adánez, J. Sulphur, Nitrogen and Mercury Emissions from Coal Combustion with CO2 Capture in Chemical Looping with Oxygen Uncoupling (CLOU). Int. J. Greenh. Gas. Con. 2016, 46, 28–38. [Google Scholar] [CrossRef]
  48. De Smedt, I.; Stavrakou, T.; Hendrick, F.; Danckaert, T.; Vlemmix, T.; Pinardi, G.; Theys, N.; Lerot, C.; Gielen, C.; Vigouroux, C.; et al. Diurnal, Seasonal and Long-Term Variations of Global Formaldehyde Columns Inferred from Combined OMI and GOME-2 Observations. Atmos. Chem. Phys. 2015, 15, 12519–12545. [Google Scholar] [CrossRef]
  49. Cleveland, W.S.; Graedel, T.E.; Kleiner, B.; Warner, J.L. Sunday and Workday Variations in Photochemical Air Pollutants in New Jersey and New York. Science 1974, 186, 1037–1038. [Google Scholar] [CrossRef]
  50. Chan, K.L.; Hartl, A.; Lam, Y.F.; Xie, P.H.; Liu, W.Q.; Cheung, H.M.; Lampel, J.; Pöhler, D.; Li, A.; Xu, J.; et al. Observations of Tropospheric NO2 Using Ground Based MAX-DOAS and OMI Measurements during the Shanghai World Expo 2010. Atmos. Environ. 2015, 119, 45–58. [Google Scholar] [CrossRef]
  51. Obolkin, V.; Molozhnikova, E.; Shikhovtsev, M.; Netsvetaeva, O.; Khodzher, T. Sulfur and Nitrogen Oxides in the Atmosphere of Lake Baikal: Sources, Automatic Monitoring, and Environmental Risks. Atmosphere 2021, 12, 1348. [Google Scholar] [CrossRef]
  52. Lai, I.-C.; Brimblecombe, P. Long-Range Transport of Air Pollutants to Taiwan during the COVID-19 Lockdown in Hubei Province. Aerosol Air Qual. Res. 2021, 21, 200392. [Google Scholar] [CrossRef]
  53. Wang, Y.; Hu, M.; Lin, P.; Tan, T.; Li, M.; Xu, N.; Zheng, J.; Du, Z.; Qin, Y.; Wu, Y.; et al. Enhancement in Particulate Organic Nitrogen and Light Absorption of Humic-Like Substances over Tibetan Plateau Due to Long-Range Transported Biomass Burning Emissions. Environ. Sci. Technol. 2019, 53, 14222–14232. [Google Scholar] [CrossRef]
  54. Ming, L.; Jin, L.; Li, J.; Fu, P.; Yang, W.; Liu, D.; Zhang, G.; Wang, Z.; Li, X. PM2.5 in the Yangtze River Delta, China: Chemical Compositions, Seasonal Variations, and Regional Pollution Events. Environ. Pollut. 2017, 223, 200–212. [Google Scholar] [CrossRef]
  55. Sun, T.; Che, H.; Qi, B.; Wang, Y.; Dong, Y.; Xia, X.; Wang, H.; Gui, K.; Zheng, Y.; Zhao, H.; et al. Characterization of vertical distribution and radiative forcing of ambient aerosol over the Yangtze River Delta during 2013–2015. Sci. Total Environ. 2019, 650, 1846–1857. [Google Scholar] [CrossRef]
  56. Fan, W.; Qin, K.; Xu, J.; Yuan, L.; Li, D.; Jin, Z.; Zhang, K. Aerosol vertical distribution and sources estimation at a site of the Yangtze River Delta region of China. Atmos. Res. 2019, 217, 128–136. [Google Scholar] [CrossRef]
  57. Sheng, Z.; Che, H.; Chen, Q.; Xia, X.; Liu, D.; Wang, Z.; Zhao, H.; Gui, K.; Zheng, Y.; Sun, T.; et al. Aerosol vertical distribution and optical properties of different pollution events in Beijing in autumn 2017. Atmos. Res. 2019, 215, 193–207. [Google Scholar] [CrossRef]
  58. Lin, Y.L.; Farley, R.D.; Orville, H.D. Bulk parameterization of the snow field in a cloud model. J. Appl. Meteorol. 1983, 22, 1065–1092. [Google Scholar] [CrossRef]
  59. Mlawer, E.J.; Taubman, S.J.; Brown, P.D.; Iacono, M.J.; Clough, S.A. Radiative Transfer for Inhomogeneous Atmospheres: RRTM, a Validated Correlated-k Model for the Longwave. J. Geophys. Res. 1997, 102, 16663–16682. [Google Scholar] [CrossRef]
  60. Ek, M.B.; Mitchell, K.E.; Lin, Y.; Rogers, E.; Grunmann, P.; Koren, V.; Gayno, G.; Tarpley, J.D. Implementation of Noah Land Surface Model Advances in the National Centers for Environmental Prediction Operational Mesoscale Eta Model. J. Geophys. Res. 2003, 108, 2002JD003296. [Google Scholar] [CrossRef]
  61. Grell, G.A.; Dévényi, D.A. Generalized Approach to Parameterizing Convection Combining Ensemble and Data Assimilation Techniques: Parameterizing Convection Combining Ensemble and Data Assimilation Techniques. Geophys. Res. Lett. 2002, 29, 38-1–38-4. [Google Scholar] [CrossRef]
Figure 1. Measurement locations: (a) location of the two observation sites; (b) NJ site; (c) ZS site.
Remotesensing 15 05475 g001
Figure 2. Examples of O4, NO2, and HCHO findings from DOAS fitting at the ZS and NJ sites.
Remotesensing 15 05475 g002
Figure 3. Linear regression plots between (a) MAX-DOAS AE and CNEMC PM2.5 in the ZS site, (b) MAX-DOAS AE and CNEMC PM2.5 in the NJ site, (c) MAX-DOAS NO2 and CNEMC NO2 in the ZS site, (d) MAX-DOAS NO2 and CNI NO2 in the NJ site, (e) MAX-DOAS HCHO and TROPOMI HCHO in the ZS site, and (f) MAX-DOAS HCHO and TROPOMI HCHO in the NJ site.
Remotesensing 15 05475 g003
Figure 4. Time trends of the following concentrations in the lower (100–200 m), middle (500–600 m), and upper (900–1000 m) layers from May to July 2019: (a) ZS_AE, (b) ZS_NO2, (c) ZS_HCHO, (d) NJ_AE, (e) NJ_NO2, and (f) NJ_HCHO.
Remotesensing 15 05475 g004
Figure 5. The vertical average profiles of (a) aerosols, (b) NO2, and (c) HCHO from May to July 2019. Error bars represent the mean retrieved errors of AE, NO2, and HCHO.
Remotesensing 15 05475 g005
Figure 6. The diurnal variation of (a) AE, (b) NO2, and (c) HCHO from May to July 2019. Error bars represent the mean retrieved errors of AE, NO2, and HCHO.
Remotesensing 15 05475 g006
Figure 7. Weekend effects of atmospheric composition at different observation sites. Error bars represent the mean retrieved errors of AE, NO2, and HCHO.
Remotesensing 15 05475 g007
Figure 8. Backward trajectory and cluster analysis of ZS site: (a,b) represent the 24 and 72-h backward track, respectively; 1–4 represent 100 m, 500 m, 1000 m and 2000 m, respectively; the black line represents the backward trajectory of the air masses; the colored lines represent clusters for cluster analysis.
Remotesensing 15 05475 g008
Figure 9. Backward trajectory and cluster analysis of NJ site: (a,b) represent the 24 and 72-h backward track, respectively; 1–4 represent 100 m, 500 m, 1000 m and 2000 m, respectively; the black line represents the backward trajectory of the air masses; the colored lines represent clusters for cluster analysis.
Remotesensing 15 05475 g009
Figure 10. WPSCF distribution map of the ZS site: (ac) represent AE, NO2, HCHO, respectively; 1–4 represent 100 m, 500 m, 1000 m, and 2000 m, respectively.
Remotesensing 15 05475 g010
Figure 11. WPSCF distribution map of the NJ site: (ac) represent AE, NO2, HCHO, respectively; 1–4 represent 100 m, 500 m, 1000 m, and 2000 m, respectively.
Remotesensing 15 05475 g011
Table 1. Setting up the DOAS retrieval for a spectrum analysis of NO2, O4, and HCHO.
ParameterData SourceFitting Interval (nm)
O4/NO2HCHO
Wavelength range 338–370322.5–358
NO2298 K, I0 correction (SCD of 1017 molecules cm−2) [29]
NO2220 K, I0 correction (SCD of 1017 molecules cm−2) [29]
O3223 K, I0 correction (SCD of 1020 molecules cm−2) [30]
O3243 K, I0 correction (SCD of 1020 molecules cm−2) [30]
O4293 K [31]
BrO223 K [32]
H2O296 K, HITEMP [33]×
HCHO297 K [34]
RingCalculated with QDOAS [35]
Wavelength calibrationA high-resolution solar reference spectrum (SAO2010 solar spectra) [36]
Polynomial degree Order 3Order 5
Intensity offset ConstantConstant
Table 2. Correlation analysis between atmospheric composition and meteorological factors at the ZS site.
ZS_NO2ZS_HCHOZS_AE
ZS_NO21
ZS_HCHO0.98 **1
ZS_AE−0.19−0.191
ZS_T0.140.18−0.74 **
ZS_RH0.65 *0.64 *0.19
ZS_WD0.1160.040.74 **
ZS_WS−0.22−0.250.35
** p < 0.01; * p < 0.05.
Table 3. Correlation analysis between atmospheric composition and meteorological factors at the NJ site.
NJ_NO2NJ_HCHONJ_AE
NJ_NO21
NJ_HCHO−0.161
NJ_AE0.340.73 *1
NJ_T0.38−0.71 *−0.18
NJ_RH0.65 *−0.83 **−0.35
NJ_WD−0.450.81 **0.29
NJ_WS−0.72 *0.70 *0.19
** p < 0.01; * p < 0.05.
Disclaimer/Publisher’s Note: The statements, opinions and data contained in all publications are solely those of the individual author(s) and contributor(s) and not of MDPI and/or the editor(s). MDPI and/or the editor(s) disclaim responsibility for any injury to people or property resulting from any ideas, methods, instructions or products referred to in the content.

