Article

Evaluation of Five Satellite-Based Precipitation Products for Extreme Rainfall Estimations over the Qinghai-Tibet Plateau

1
State Key Laboratory of Earth Surface Processes and Resource Ecology, Faculty of Geographical Science, Beijing Normal University, Beijing 100875, China
2
Key Laboratory of Intelligent Control Technology for Wuling-Mountain Ecological Agriculture in Hunan Province, School of Mathematics and Computational, Huaihua University, Huaihua 418008, China
3
State Key Laboratory of Remote Sensing Science, Aerospace Information Research Institute, Chinese Academy of Sciences, Beijing 100101, China
*
Author to whom correspondence should be addressed.
Remote Sens. 2023, 15(22), 5379; https://doi.org/10.3390/rs15225379
Submission received: 19 September 2023 / Revised: 8 November 2023 / Accepted: 13 November 2023 / Published: 16 November 2023
(This article belongs to the Special Issue Remote Sensing of Precipitation Extremes)

Abstract

:
The potential of satellite precipitation products (SPPs) in monitoring and mitigating hydrometeorological disasters caused by extreme rainfall events has been extensively demonstrated. However, there is a lack of comprehensive assessment regarding the performance of SPPs over the Qinghai-Tibet Plateau (QTP). Therefore, this research aimed to evaluate the effectiveness of five SPPs, including CMORPH, IMERG-Final, PERSIANN-CDR, TRMM-3B42V7, and TRMM-3B42RT, in identifying variations in the occurrence and distribution of intense precipitation occurrences across the QTP during the period from 2001 to 2015. To evaluate the effectiveness of the SPPs, a reference dataset was generated by utilizing rainfall measurements collected from 104 rainfall stations distributed across the QTP. Ten standard extreme precipitation indices (SEPIs) were the main focus of the evaluation, which encompassed parameters such as precipitation duration, amount, frequency, and intensity. The findings revealed the following: (1) Geographically, the SPPs exhibited better retrieval capability in the eastern and southern areas over the QTP, while displaying lower detection accuracy in high-altitude and arid areas. Among the five SPPs, IMERG-Final outperformed the others, demonstrating the smallest inversion error and the highest correlation. (2) In terms of capturing annual and seasonal time series, IMERG-Final performs better than other products, followed by TRMM-3B42V7. All products performed better during summer and autumn compared to spring and winter. (3) The statistical analysis revealed that IMERG-Final demonstrates exceptional performance, especially concerning indices related to precipitation amount and precipitation intensity. Moreover, it demonstrates a slight advantage in detecting the daily rainfall occurrences and occurrences of intense precipitation. On the whole, IMERG-Final’s ability to accurately detect extreme precipitation events on annual, seasonal, and daily scales is superior to other products for the QTP. It was also noted that all products overestimate precipitation events to some extent, with TRMM-3B42RT being the most overestimated.

1. Introduction

Precipitation is of utmost importance in maintaining the delicate equilibrium between water and energy exchange in the dynamic interplay between land and the atmosphere [1]. Its uneven and unpredictable distribution across space and time can lead to both devastating floods and prolonged droughts. Therefore, precise and reliable precipitation observation is vital for timely drought alerts, accurate flood forecasts, effective waterlogging predictions, and efficient water resource management [2].
Per the Intergovernmental Panel on Climate Change (IPCC)’s Sixth Assessment Report (AR6), the continuous process of global warming will intensify disruptions in the global hydrological cycle, bringing more intense and frequent rainfall patterns [3]. As the occurrence of intense precipitation events continues to increase, it results in heightened flooding and significant detrimental impacts on critical infrastructure, regional economies, and human well-being [4,5].
Amidst this scenario, the Qinghai-Tibet Plateau (QTP) emerges as a region highly sensitive to climate change, making it prone to various types of natural disasters. These include sudden floods, landslides, debris flow, and the outburst of glacial lakes [6,7]. Consequently, it is crucial to obtain accurate observations of extreme rainfall in this area. Precisely monitoring extreme rainfall is essential for identifying patterns, tracking changes, and understanding the underlying mechanisms of such events on the QTP. This knowledge can facilitate early planning and proactive measures to mitigate hydrometeorological disasters, promoting sustainable socioeconomic development [8].
The availability of appropriate precipitation data sources is crucial for observing extreme precipitation. At present, the most direct approach of acquiring rainfall data is through the use of ground meteorological stations or rainfall stations [9]. However, it is essential to recognize the uneven distribution of these monitoring stations, as significant variations in their density can be observed in various geographical regions. Especially in the QTP, the stations are sparse and mostly located in the eastern part of the region, making it difficult to obtain uniform precipitation observations on spatial and temporal scales [10,11]. Weather radar can offer near real-time information on precipitation, capturing continuous variations in both space and time. Nevertheless, external factors as well as the radar’s own signals can impact the accuracy of weather radar. For example, the radar electronic signal transmission can be affected by the interference of the terrain environment, leading to the occurrence of both systematic and random errors [12].
Meanwhile, satellite precipitation products (SPPs) have surfaced as a substantial and invaluable source of precipitation information [10,12]. These products offer numerous benefits compared to conventional ground-based observations. For instance, SPPs are not constrained by the physical features of the land and have the ability to estimate precipitation on a quasi-global level, providing extensive coverage, uninterrupted observation time, and superior spatio-temporal resolution [13,14]. In regions with complex geographical features, where rain gauges are predominantly located in low-lying areas, SPPs play a crucial role in filling the data void for precipitation in highland regions [15]. This is especially critical given the substantial variation in precipitation patterns associated with different altitudes. Since the 1980s, more than 30 SPPs have been established worldwide, each characterized by unique spatial and temporal resolutions. Prominent examples include the Tropical Rainfall Measuring Mission (TRMM), Integrated Multi-satellite Retrievals for GPM (IMERG), Climate Prediction Center Morphing (CMORPH), Global Satellite Mapping of Precipitation (GSMaP), Global Precipitation Climatology Project (GPCP), and Precipitation Estimation from Remotely Sensed Information using Artificial Neural Networks (PERSIANN). These SPPs leverage advanced satellite sensors and algorithms to deliver comprehensive and precise precipitation data, thereby facilitating meteorological research, weather forecasting, and hydrological modeling.
Currently, several studies in the literature have utilized SPPs to evaluate extreme precipitation events at a regional scale. These studies have focused on various regions, including the United States [16,17], Europe [18], Nepal [19], Sub-Saharan Africa [20], and China [21,22,23,24]. In summary, most SPPs have the potential to detect the occurrence of extreme rainfall, but their performances vary considerably at different time scales and across different regions with respective climatic conditions, topography, and elevation [12]. The existing literature has not extensively addressed the evaluation of SPPs’ effectiveness in identifying severe rainfall occurrences on the QTP; it is important to note that previous assessments have primarily focused on a single time scale, neglecting the seasonality of extreme precipitation. To gain a comprehensive understanding of precipitation variability and estimation uncertainty, it is essential to conduct multi-timescale assessments of SPPs. Therefore, this research aimed to comprehensively assess the effectiveness of different products, namely CMORPH, IMERG-Final, PERSIANN-CDR, TRMM-3B42V7, and TRMM-3B42RT across the spatial and temporal dimensions (including seasonal and annual scales) on the QTP. The small-scale extreme rainfall events can be effectively monitored with increased reliability by utilizing these SPPs, which have higher spatial (0.25° or finer) and all provide daily precipitation records for more than 20 years. The results of this research are also of significant importance to further promote the application of new high-resolution SPPs in the QTP.
In this study, five internationally used SPPs were evaluated to show their detection abilities of the extreme precipitation in QTP region of China from 2001 to 2015. To establish a reliable benchmark, we used surface daily observed rainfall data from 104 meteorological stations operated by the China Meteorological Administration (CMA). This study aimed to identify the more suitable SPPs for the long-term surveillance of intense rainfall occurrences on the QTP. The organization of this study is outlined as follows: Section 1 provides a brief overview of the QTP. In Section 2, we elaborate on the evaluation methods and data sources employed. The assessment outcomes are presented in Section 3, where we compare the effectiveness of the five SPPs in capturing extreme rainfall events. In Section 4, we provide a discussion of the findings. Lastly, Section 5 provides a comprehensive summary of the conclusions drawn from this research.

2. Material and Methods
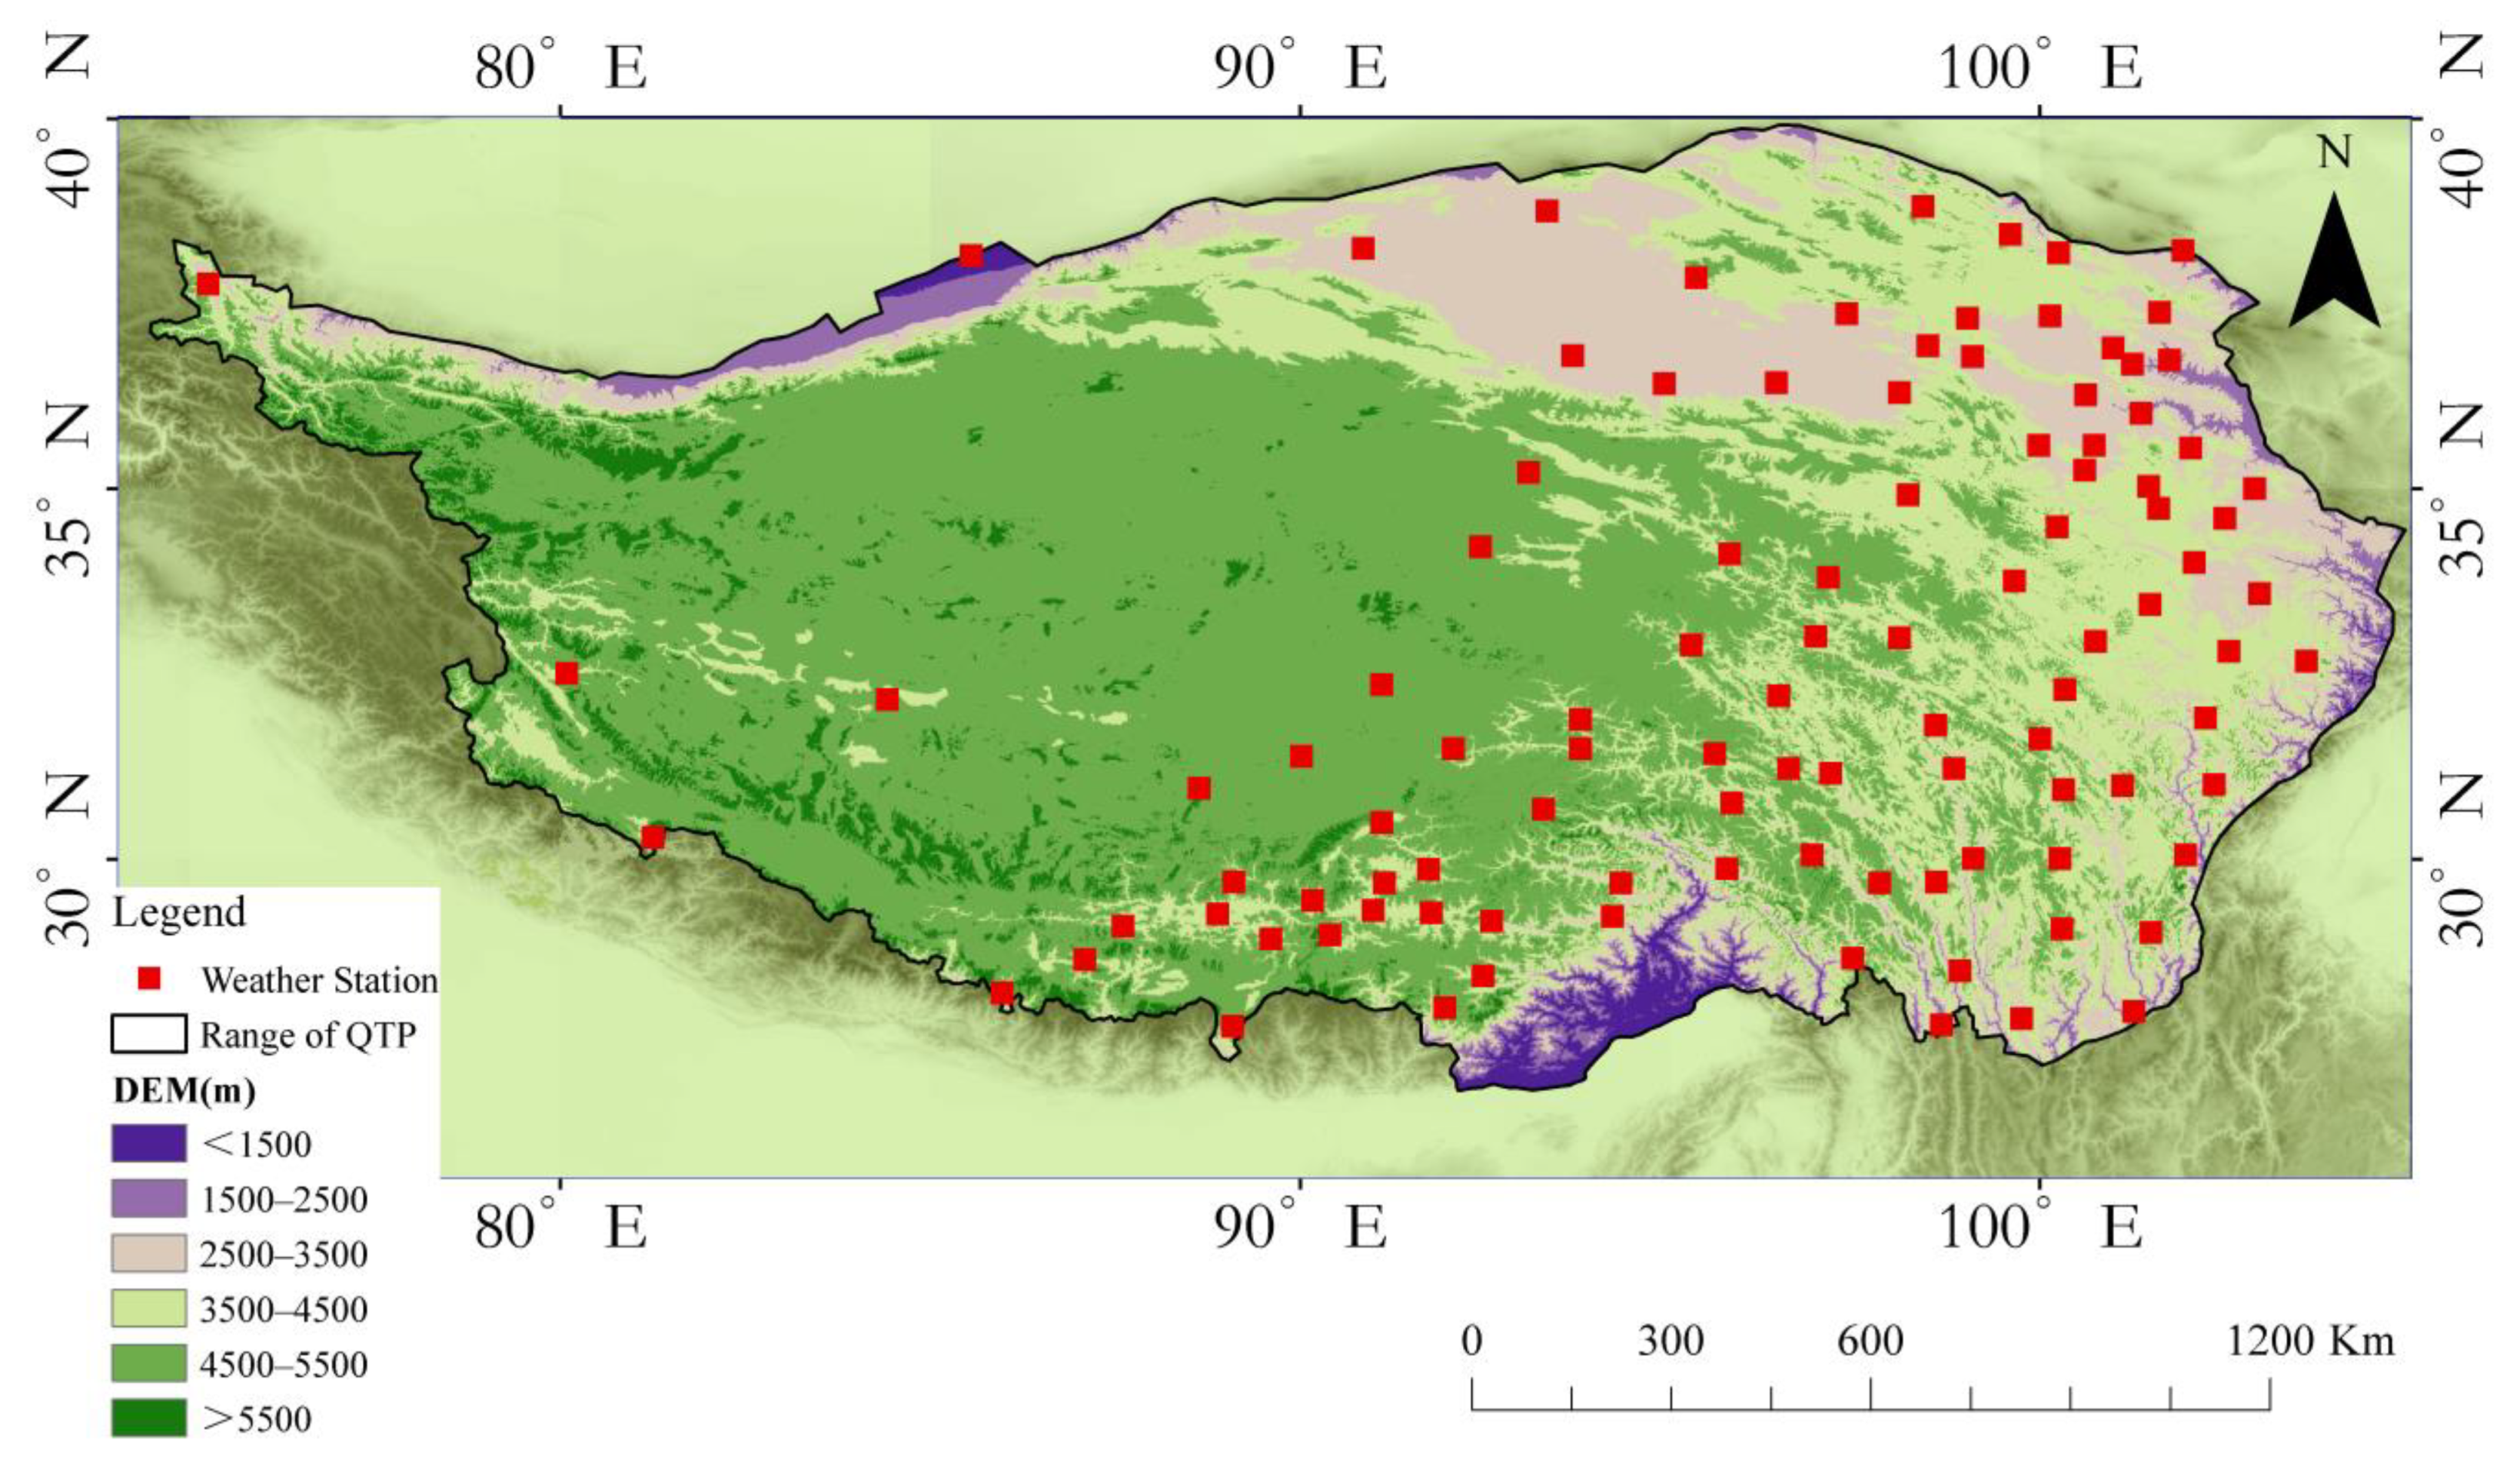
2.1. Study Area

The QTP, located in south-central Asia, spans from 26°00′ to 39°47′N and 73°19′ to 104°47′E (Figure 1). With its remarkable topographical characteristics, the QTP stands out as the world’s highest elevated plateau and the largest expanse within China, it has an average elevation of about 4320 m, a total area of about 2.57 × 10⁶ km2, earning it the prestigious titles of the “Roof of the World” and the “Third Pole.” Owing to its unique topography, the QTP falls within the plateau climate system. The region experiences average annual temperatures ranging from −6 to 20 °C, with temperatures dropping below freezing in the interior [25]; the annual precipitation is 50–2000 mm, with an average of about 400 mm, and more than 80% of the annual rainfall is concentrated during the summer half year, which spans from May to October [26]. The temperature and precipitation patterns gradually decrease from southeast to northwest due to factors such as altitude, latitude, and the obstructive nature of high mountain ranges on the QTP.

2.2. Site-Observed Precipitation Data

For this research, we employed the rainfall data observed at various stations, which were acquired from the China Meteorological Administration (CMA, http://data.cma.cn/ (accessed on 1 June 2022)) as the reference dataset to evaluate the performance of SPPs on the QTP from 2001 to 2015. Under the quality control based on the criteria of continuity, uniformity, and consistency in time, the precipitation data of 104 meteorological stations (marked as red square in Figure 1) were finally selected to form a highly concentrated network of rain gauges across the QTP [27].

2.3. Satellite Precipitation Products (SPPs)

Five widely used SPPs (CMORPH, IMERG-Final, PERSIANN-CDR, TRMM-3B42V7, and TRMM-3B42RT) were selected to evaluate extreme precipitation on the QTP. In this study, we selected five SPPs, and Table 1 provides comprehensive information regarding their essential characteristics. It is important to note that these SPPs are not entirely independent, and some of them may utilize the same sensor as a data source. However, this factor does not impact the accuracy evaluation of the SPPs.

2.3.1. CMORPH

The CMORPH method is a robust approach that integrates passive microwave sensors and infrared sensors to improve the precision and frequency of rainfall estimation. By harnessing the capabilities of both types of sensors, this robust approach significantly improves the precision and temporal resolution of rainfall estimations. By leveraging motion vectors derived from infrared sources, it effectively propagates the rainfall information obtained from passive microwave sources. This integration of sensor technologies significantly improves the precision and temporal resolution of precipitation estimates. The dataset covers a wide geographical range from 60°S to 60°N and encompasses a timeframe spanning from 1981 to 2019 [28].

2.3.2. IMERG-Final

The GPM project, initiated on 27 February 2014 [35], serves as a follow-up to TRMM and has the objective of collecting global-scale rainfall estimations using satellite observations. These estimates are obtained using the IMERG Level 3 algorithm [36], which combines microwave precipitation estimates from multiple satellite constellations, infrared satellite estimates, and monthly gauge precipitation data. The main goal of IMERG is to generate improved global precipitation products with enhanced accuracy. IMERG products provide precipitation estimates every 30 min, with a high spatial resolution of 0.1° × 0.1° [12,37]. They are further classified into three categories: “early-run,” “late-run,” and “final-run,” based on their calibration accuracy. The quasi-real-time products, namely IMERG-Early and IMERG-Late, are released after 4 h and 12 h of observation, respectively. In contrast, IMERG-Final is a post-processing output that is not in real-time and undergoes calibration using the bias of month-to-month observation data from ground-based rainfall stations [36]. Typically, IMERG-Final is released after 2 months of observation. For this study, the researchers selected the IMERG-F V6 product, which is also referred to as IMERG in the text.

2.3.3. PERSIANN-CDR

The PERSIANN-CDR algorithm utilizes infrared radiation data acquired from the Grid-Sat-B1 satellite as input for the PERSIANN model. To reduce bias in the precipitation estimates, corrections are applied using the GPCP precipitation product, which provides spatial range 60°S to 60°N [38]. In this paper, we refer to this product as PERSIANN.

2.3.4. TRMM-3B42V7

The primary objective of the TRMM was to offer highly accurate global rainfall estimates. In order to accomplish this objective, the mission integrated a range of rainfall sensors, such as a precipitation radar, the TRMM microwave imager, and radiometers capable of detecting visible and infrared radiation [33,39]. Originally designed for rainfall retrieval in tropical regions, the TRMM product has been expanded to cover global scales. The precipitation estimates in the TRMM 3B42 dataset were derived using the TPMA (TRMM Multi-satellite Precipitation Analysis) algorithm, and a lagged correction was applied using monthly precipitation data from GPCC. In this paper, we refer to this product as TRMM3B42.

2.3.5. TRMM-3B42RT

TRMM provided two types of precipitation datasets: a quasi-real-time product, which had a minor time lag of a few hours in its observations, and a product that was adjusted using rainfall station data with an observation delay of 2 to 3 months. The near real-time product provided more immediate information on precipitation, allowing for timely monitoring and forecasting of rainfall patterns. However, there was a minor time lag of several hours required for processing and analyzing the gathered data before generating the final output. The near real-time product, known as TRMM-3B42RT, had a lag of 3 to 9 h compared to quasi-real time. It is specifically mentioned as TRMM3B42RT in the text.

2.4. Methodology

2.4.1. Data Resampling

To maintain consistency of the five SPPs with the ground-based measurements of precipitation, this study used the NCAR Command Language (NCL) software to perform bilinear interpolation to interpolate gridded precipitation data from the SPPs to the station scale for point-to-point comparison. The bilinear interpolation method utilizes data from adjacent four grid points to estimate variable values at the target location. This interpolation method can significantly mitigate the spatial uncertainty associated with gridded data, leading to a more accurate representation of the climate and weather conditions at the station level.

2.4.2. Standard Extreme Precipitation Indices (SEPIs)

Extreme precipitation events are characterized by their infrequent likelihood of transpiring during a given period of observation. To monitor such events, specific indicators are used. The Expert Team on Climate Change Detection and Indices (ETCCDI), established jointly by the Climate Commission of the World Meteorological Organization (WMO) and the Climate Variability and Predictability Research Program (CLIVAR) [40,41], has proposed eleven SEPIs to assess extreme precipitation indices, including duration, amount, frequency, and intensity. We selected 10 SEPIs that are widely employed in research and are applicable to the QTP. These SEPIs have been further classified into four categories based on their characteristics: indices based on duration, indices based on amount, indices based on frequency, and indices based on intensity. For more comprehensive information on each category, including the name, definition, and unit, please refer to Table 2.

2.4.3. Statistical Metrics

In order to effectively showcase the variations in performance among five SPPs concerning the extreme precipitation indices of the QTP, this study employed several evaluation metrics. These metrics include the correlation coefficient (CC), the root mean square error (RMSE), and the Kling–Gupta coefficient (KGE). The CC quantifies the magnitude of the linear association between the SPPs and the precipitation observations obtained from ground-based measurements. It provides insights into the level of correlation between these two datasets. The RMSE quantifies the dispersion between the SPPs and the ground-based precipitation observations. It provides an estimation of the average magnitude of the disparities between the SPPs and observed values. The KGE evaluates the overall goodness-of-fit between the SPPs and gauge-observed precipitation. It takes into account both the mean and deviation of the site-observed dataset and the satellite-measured data. The KGE is a commonly employed metric for evaluating the accuracy of gridded precipitation data [42,43,44]. For more detailed information on the statistical metrics, please refer to Table 3.

2.4.4. Categorical Skill Metrics

To enhance the evaluation of the accuracy of SPPs in detecting extreme rainfall events three categorical skill metrics were computed, namely the POD, FAR, and CSI [45,46,47]. More detailed information can be found in Table 4. The evaluation considered the 75th percentile of rainfall as the threshold for extreme precipitation, specifically for rainy days with rainfall exceeding 1 mm per day [48]. POD reflects the probability that SPPs correctly monitor extreme precipitation events, FAR reflects the probability that SPPs incorrectly monitor extreme precipitation events, and CSI reflects the probability that SPPs hit the real extreme precipitation events. These commonly employed metrics are utilized to evaluate the effectiveness of SPPs in detecting precipitation events or gauging the intensity of precipitation levels. It is important to highlight that the utilization of 0.1 mm day−1 as the threshold to determine the presence of precipitation does not provide an accurate representation of the prevailing conditions across the entire QTP; in particular, within the southern region characterized by abundant rainfall, the conditions are noteworthy. Therefore, as the threshold for defining precipitation occurrence, a value of 1 mm day−1 was ultimately selected.

3. Results

3.1. Spatial Evaluation

We employed the CDD and CWD as indices based on the duration of precipitation. As for the indices based on the amount of precipitation, we utilized the measurements of R95p, R99p, and PRCPTOT. The precipitation-frequency-based indices were determined based on two rainfall thresholds: 10 mm per day (referred to as R10 mm) and 20 mm per day (referred to as R20 mm). As for the precipitation-intensity-based indices, they were calculated using Rx1day, Rx5day, and SDII.

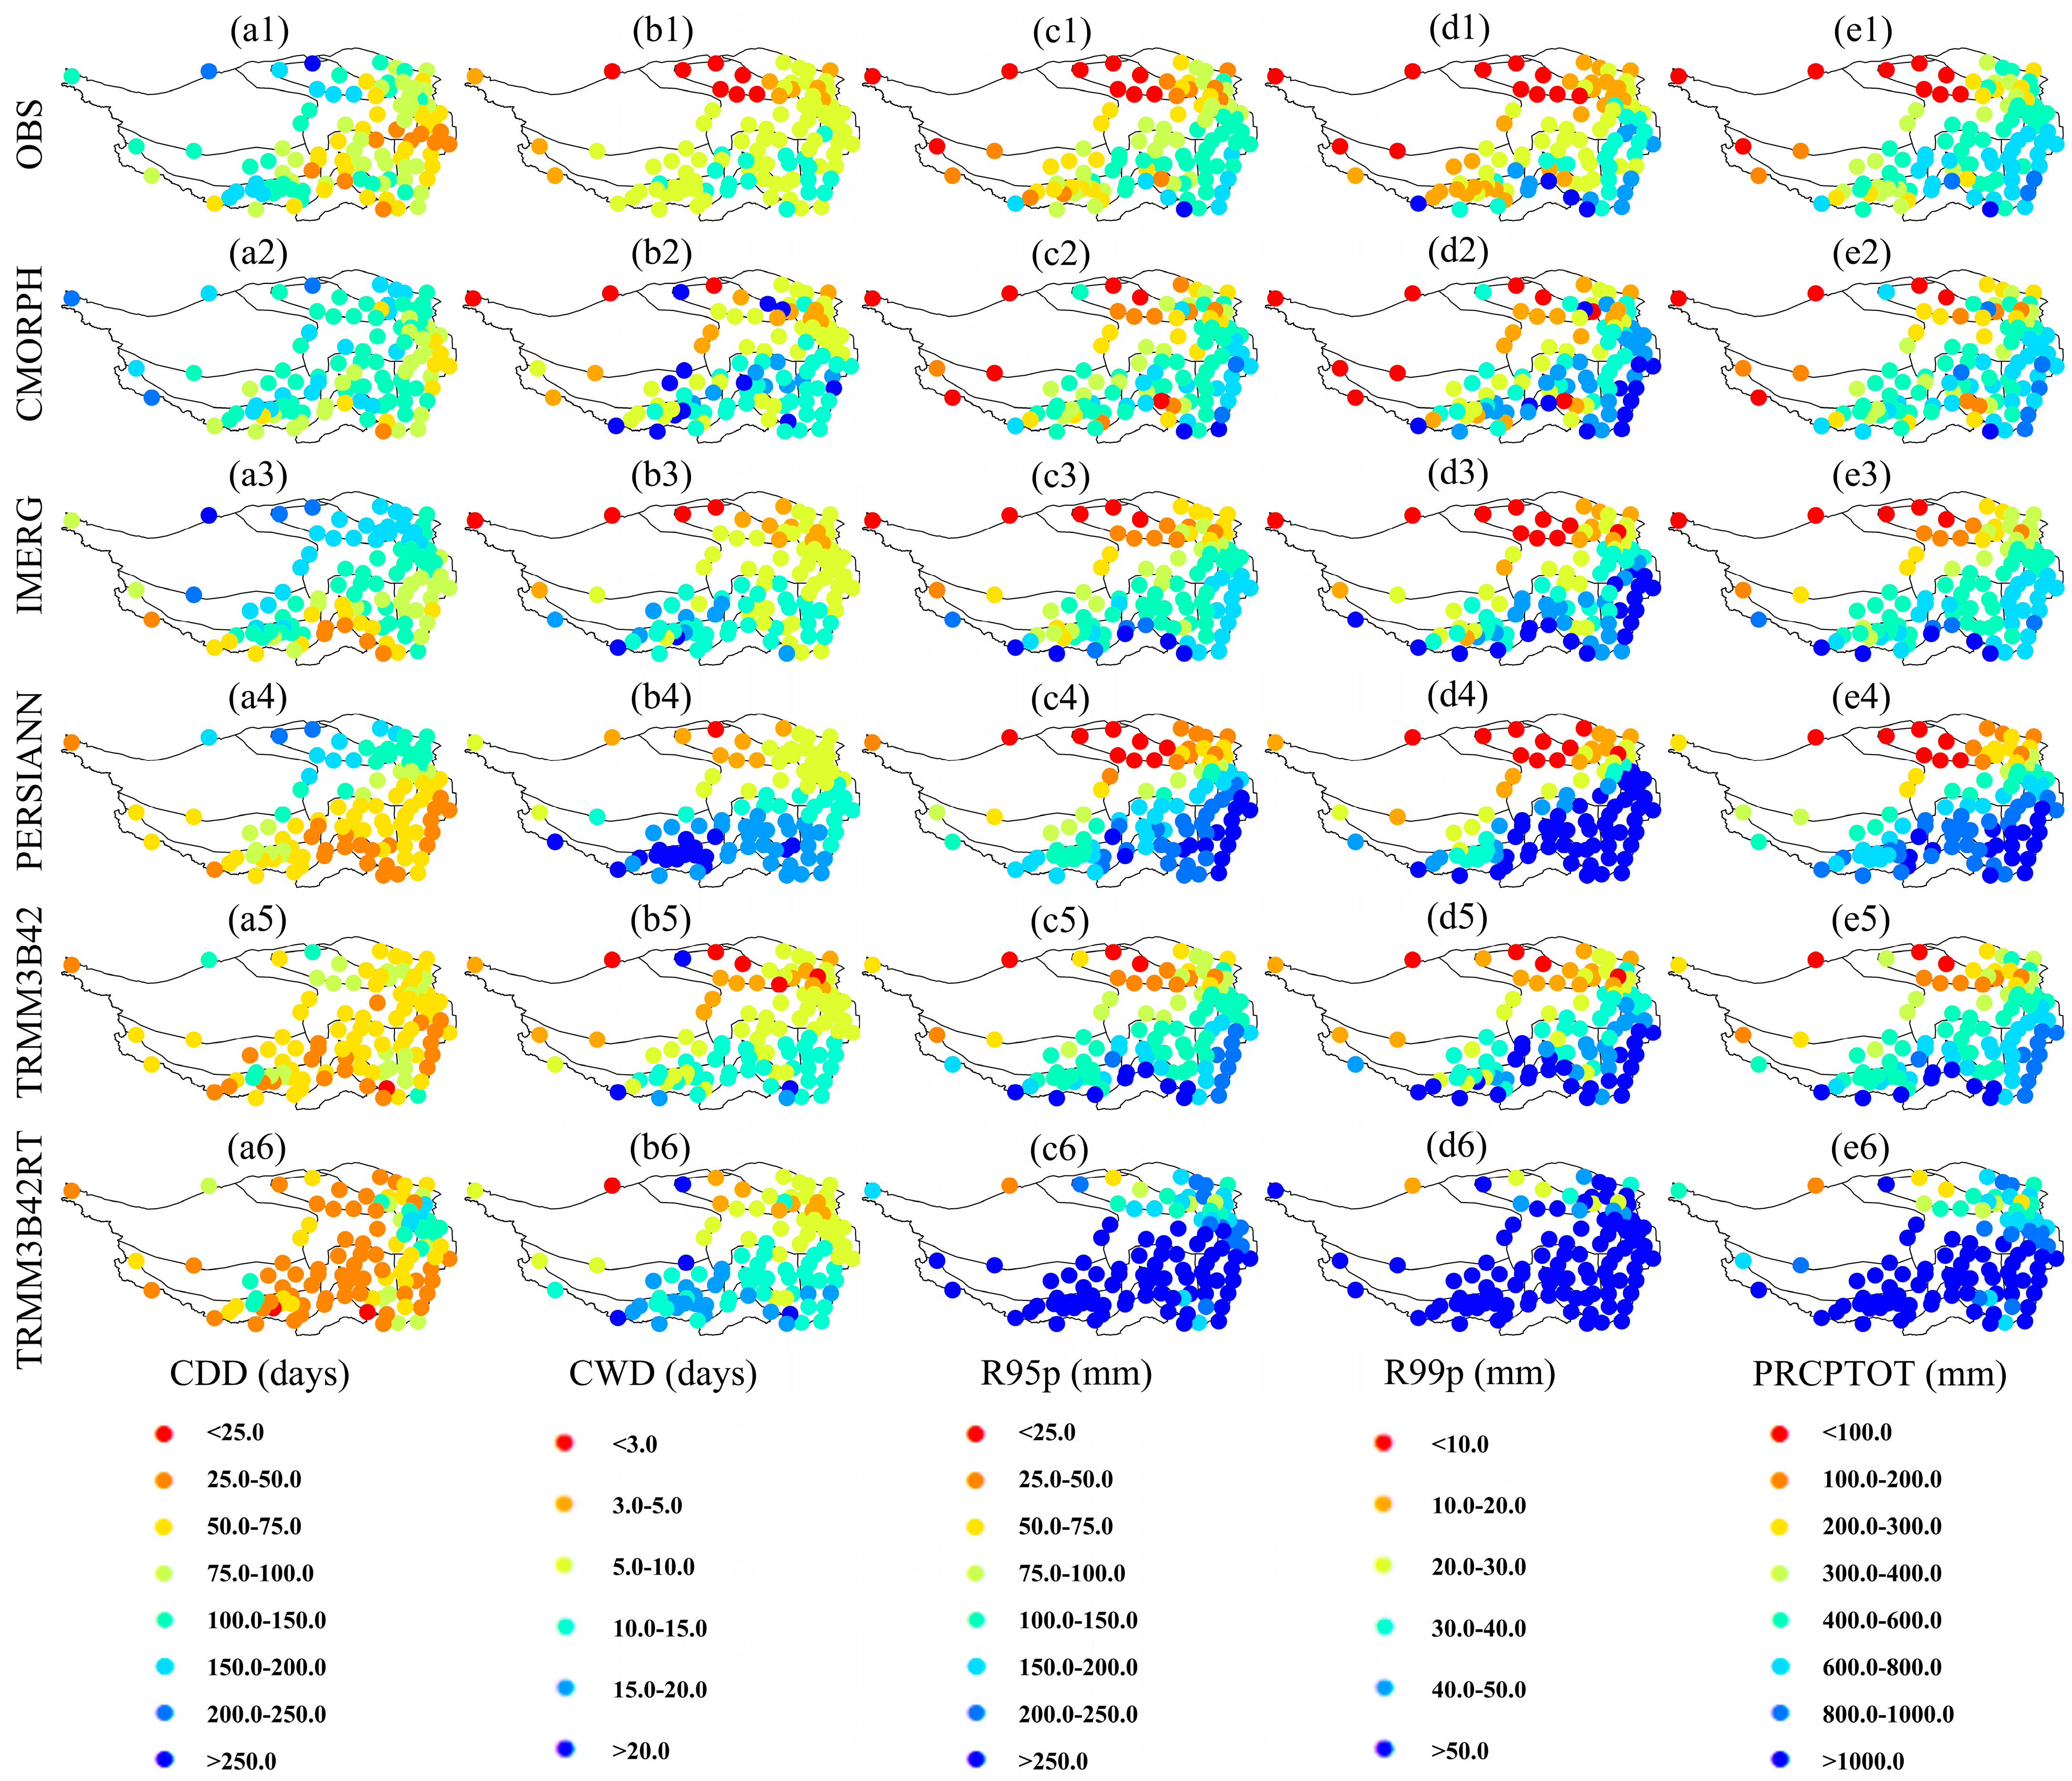
3.1.1. Indices Based on Duration and Amount of Precipitation

Figure 2 depicts the mean spatial pattern of five SEPIs (CDD, CWD, R95p, R99p, and PRCPTOT) derived from ground-based observations (OBS) and five SPPs (CMORPH, IMERG, PERSIANN, TRMM3B42, and TRMM3B42RT).
For CDD, IMERG and PERSIANN are closer to OBS than the other SPPs overall. Specifically, PERSIANN underestimates CDD in the southern part, IMERG overestimates CDD in the northern part of the QTP, CMORPH overestimates CDD in almost all places; however, TRMM3B42 and TRMM3B42RT underestimate CDD in almost all places.
For CWD, IMERG has the best performance overall, capturing especially well in the northern and eastern part of the QTP, followed by TRMM3B42. CMORPH overestimates CWD overall and abnormally overestimates in the northern part of the QTP, while PERSIANN overestimates CWD mainly in the southern part. All in all, SPPs are not good at capturing extreme precipitation duration in the southern part of the QTP and show varying degrees of overvaluation.
Regarding precipitation-amount-based indices (R95p, R99p, and PRCPTOT), IMERG generally exhibits the strongest correlation with OBS, followed by CMORPH and TRMM3B42. Specifically, CMORPH can capture localized outliers, which is superior to the other SPPs. PERSIANN performs better in the northern part and severely overestimates the indices in the southern part of the QTP, while CMORPH performs well in the southern part. PERSIANN performs better in the northern part but grossly overestimates the indices in the southern part. TRMM3B42RT has the worst performance, showing significant overestimation over the whole QTP, especially in the southern part.

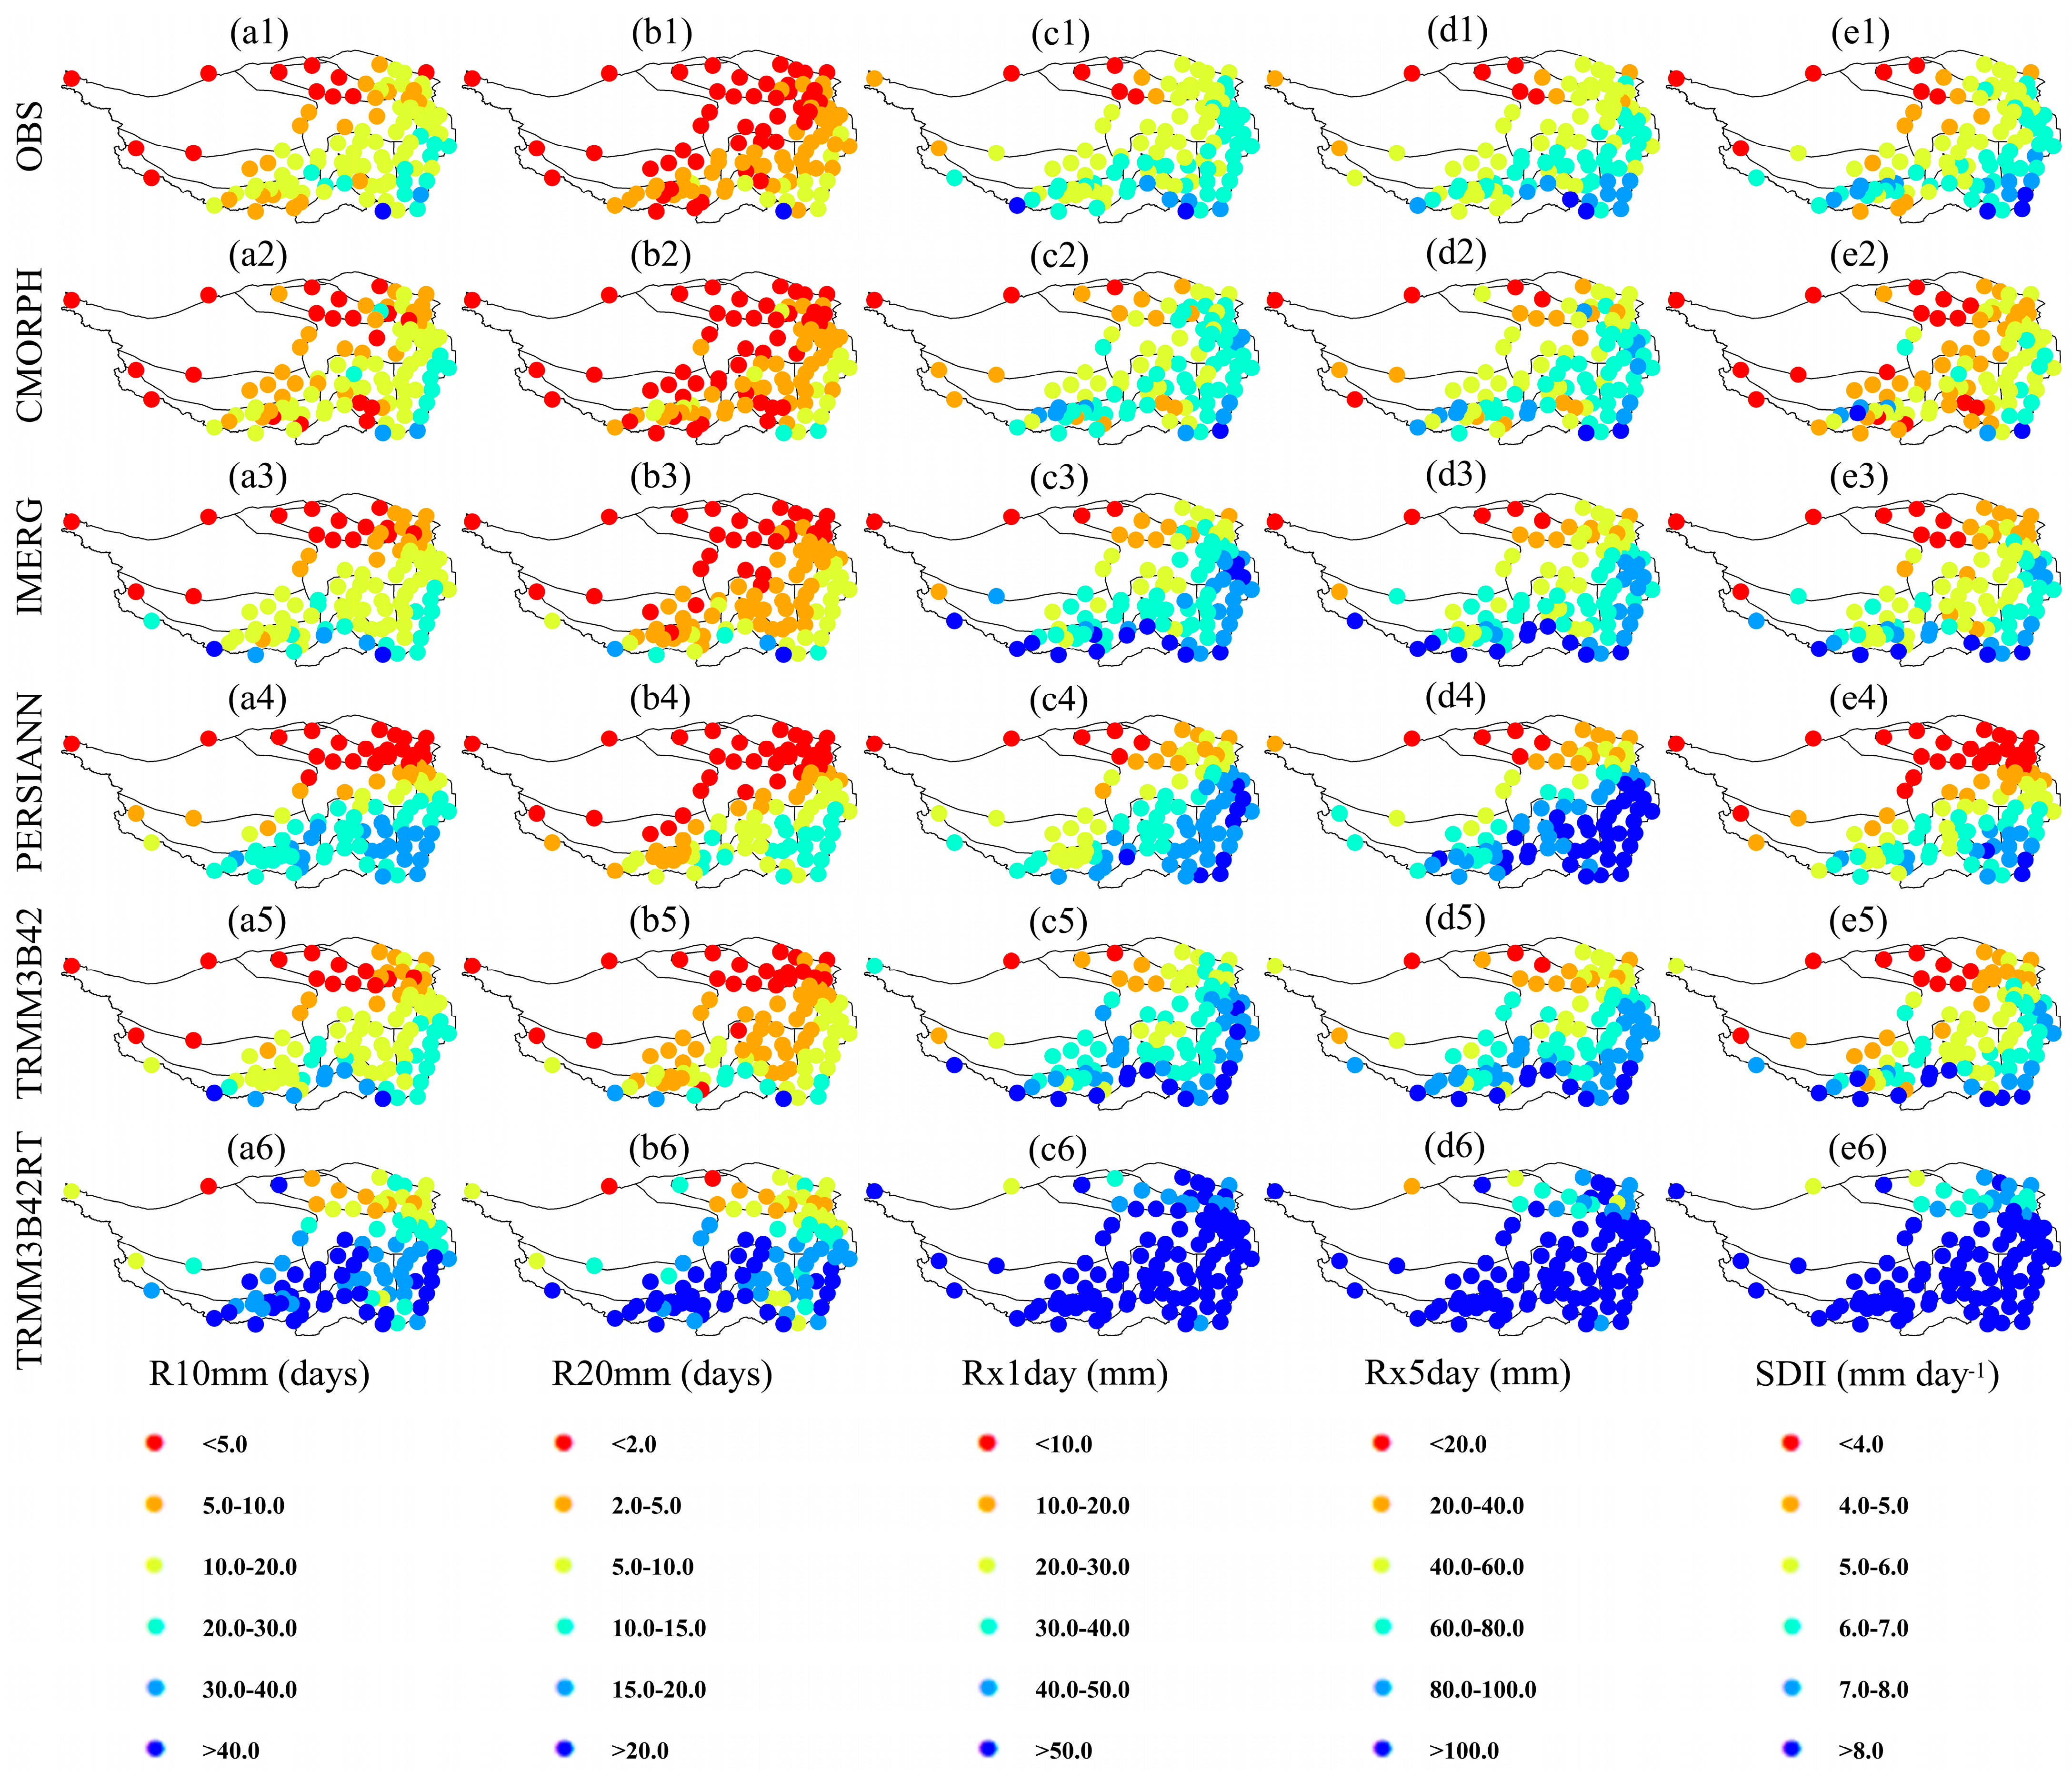
3.1.2. Indices Based on Frequency and Intensity of Precipitation

Figure 3 depicts the average spatial pattern of five SEPIs (R10 mm, R20 mm, Rx1day, Rx5day, and SDII) from OBS with five SPPs (CMORPH, IMERG, PERSIANN, TRMM3B42, and TRMM3B42RT).
For R10 mm, generally speaking, CMORPH, IMERG, and TRMM3B42 perform better overall. PERSIANN is overvalued in the southern part of QTP and undervalued in the northern part, and TRMM3B42RT is spatially grossly overestimated in QTP as a whole. In general, CMORPH and IMERG demonstrate superior performance for R20 mm, with CMORPH exhibiting better performance specifically in the southern region of the QTP. TRMM3B42 overestimates in the southern part and PERSIANN overestimates in the eastern and southern parts. TRMM3B42RT demonstrates the poorest performance within the QTP, with an overall tendency to overestimate. In summary, CMORPH and IMERG demonstrate superior performance for precipitation-frequency-based indices.
For the Rx1day and Rx5day indices, CMORPH, IMERG, and TRMM3B42 generally perform the best among the five SPPs. However, there are some variations in their performance in different regions of the plateau. Specifically, CMORPH shows localized anomalies and performs slightly worse than the other two SPPs in the northern part of the plateau, while TRMM3B42 performs slightly worse than the other two SPPs in the southern part of the QTP. In other words, IMERG exhibits a slight advantage over CMORPH and TRMM3B42. Additionally, PERSIANN underestimates the indices in the northern part of the QTP but significantly overestimates them in the southern part, particularly in the southeastern region. TRMM3B42RT performs the worst among all SPPs, overestimating the indices throughout the entire region and having the highest bias. Regarding the SDII index, both IMERG and TRMM3B42 outperform the other SPPs. However, CMORPH significantly underestimates the index in the southern part of the QTP. PERSIANN performs well in the south but underestimates SDII in the northern part. TRMM3B42RT exhibits the poorest performance, with significant spatial overestimation and the largest bias among all the products. In summary, IMERG and TRMM3B42 exhibit superior performance for precipitation-intensity-based indices.

3.2. Temporal Evaluation

3.2.1. Annual Precipitation Distribution

To delve deeper into evaluating the efficacy of SPPs in monitoring the sequential occurrence of extreme rainfall in the QTP, each SEPI was integrated into the interannual precipitation series from 2001 to 2015 at each station. This allowed for the calculation of the CC and RMSE of the SEPI sequence at each station. Subsequently, the CCs and RMSEs for all stations were collected to generate boxplots representing the CC and RMSE of the SEPI for the period of 2001–2015. Finally, all SEPI boxplots for five SPPs were obtained (Figure 4). The evaluation of SEPIs for QTP is specified in Table 5.
According to the data presented in Figure 4 and Table 5, among all SPPs, IMERG exhibits the strongest correlation with the OBS. The PRCPTOT index of the IMERG product achieves the highest CC value of 0.75. Among all ten SEPIs, three SEPIs of IMERG products meet the criterion of having a CC value higher than 0.4. TRMM3 B42 shows similar performance, with three SEPIs meeting the criterion of having a CC value higher than 0.4, although its CC values are lower than IMERG. PERSIANN only has one SEPI that meets the criterion of having a CC value higher than 0.4. CMORPH and TRMM3B42RT perform the weakest, with all CC values falling below 0.4. In terms of RMSE, IMERG demonstrates the lowest values among the five SPPs in the QTP, followed by TRMM3B42. It is worth noting that TRMM3B42 has the lowest RMSE for the CDD index, while CMORPH achieves the lowest RMSEs for R20 mm and Rx1day. However, IMERG performs closely to these two products on those specific indices. Overall, IMERG exhibits the best performance in reflecting the SEPIs on an annual scale among the five SPPs, followed by TRMM3B42. Additionally, each SPP shows the highest capacity to reflect PRCPTOT with the highest CC, followed by R10 mm, R95p, Rx5day, and SDII.

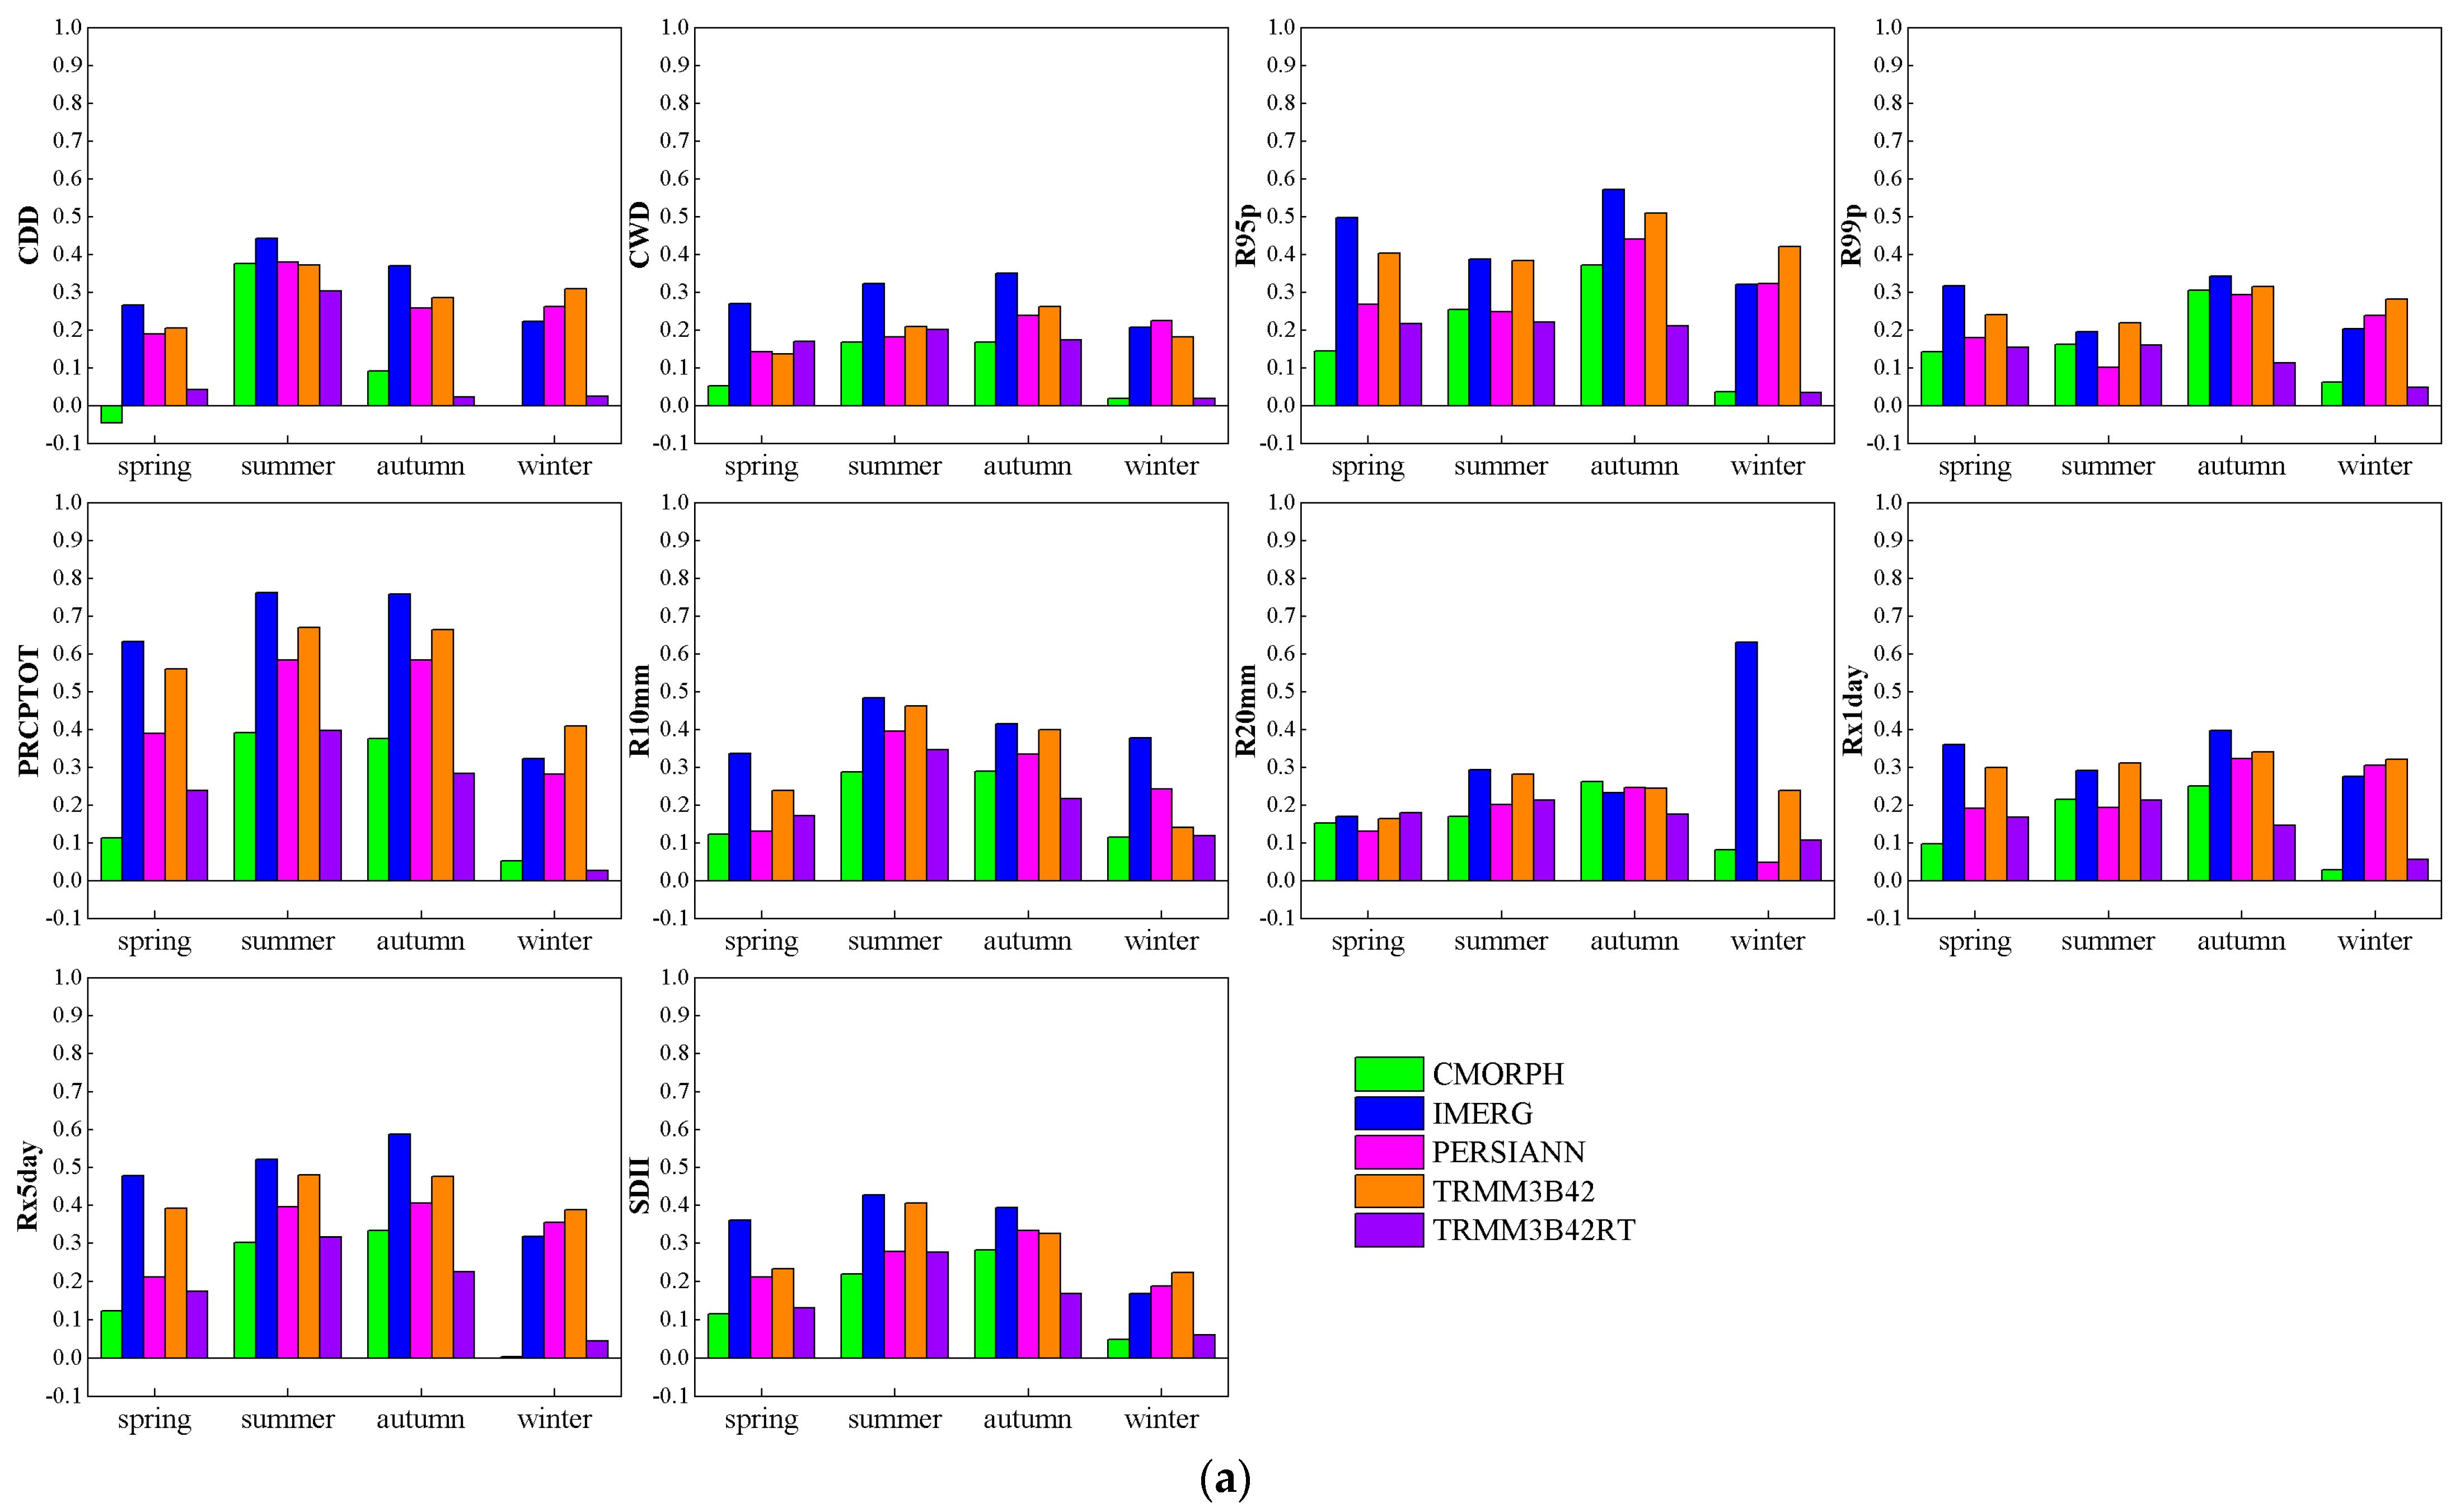
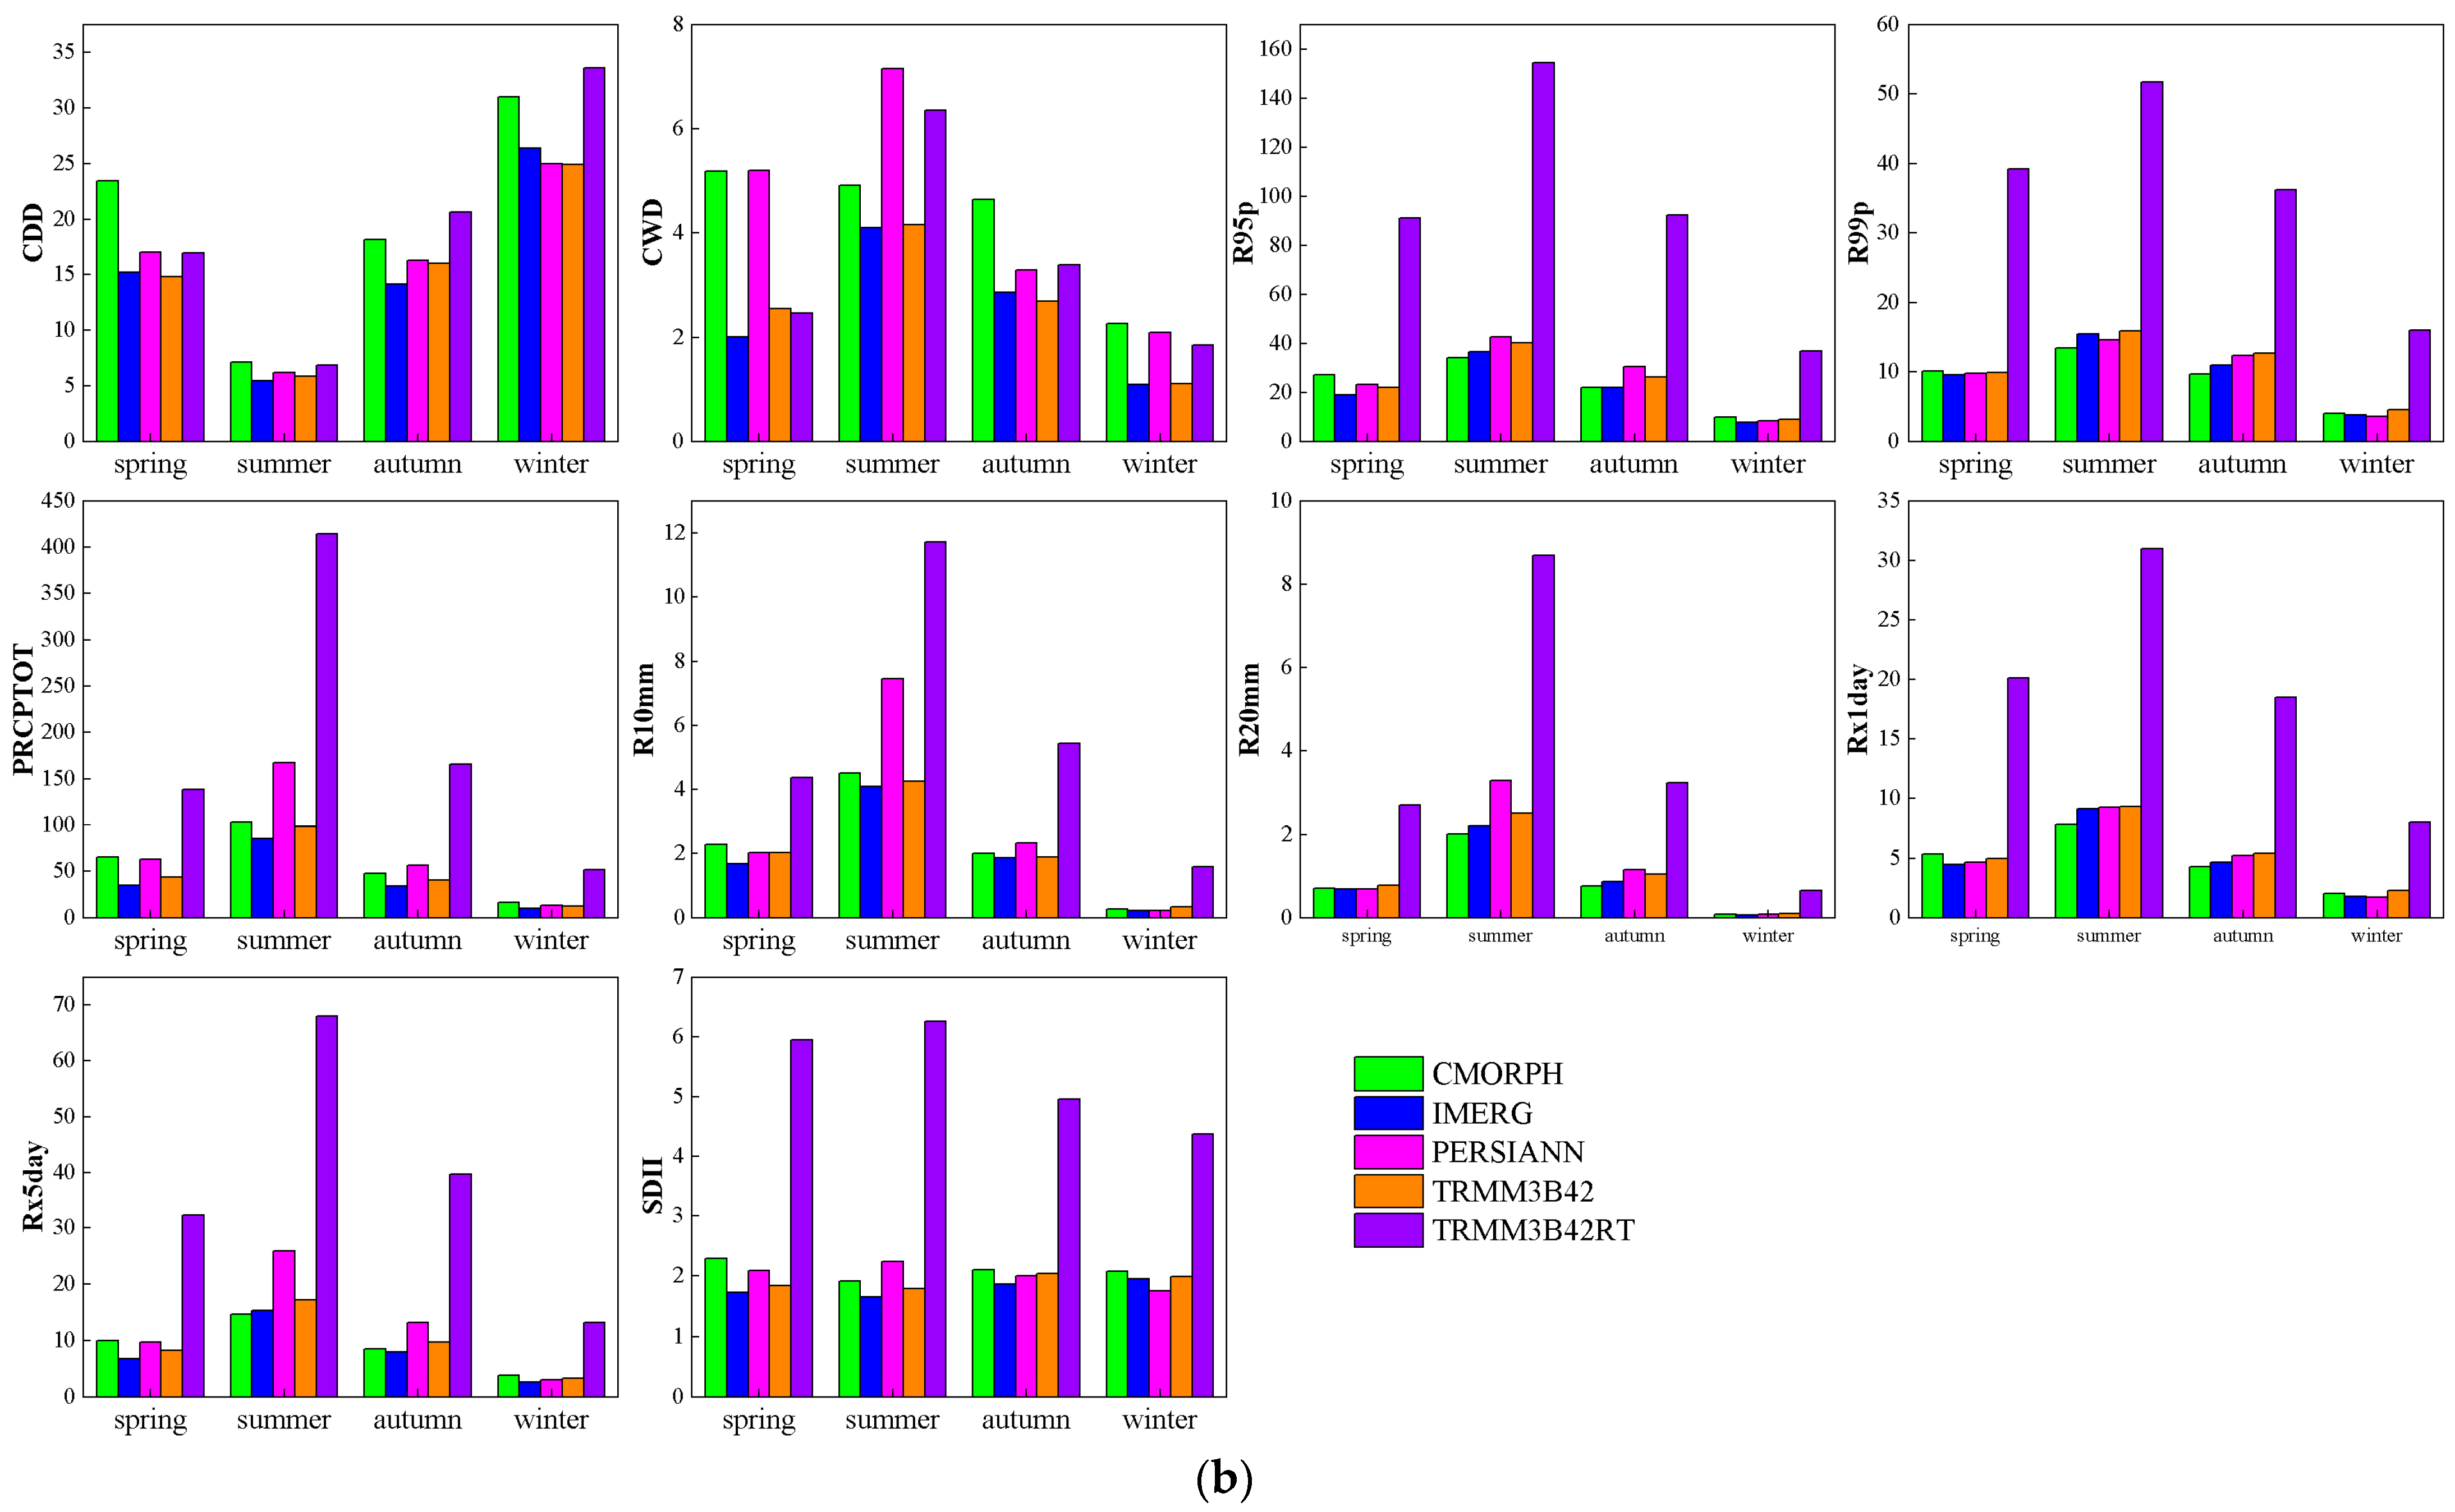
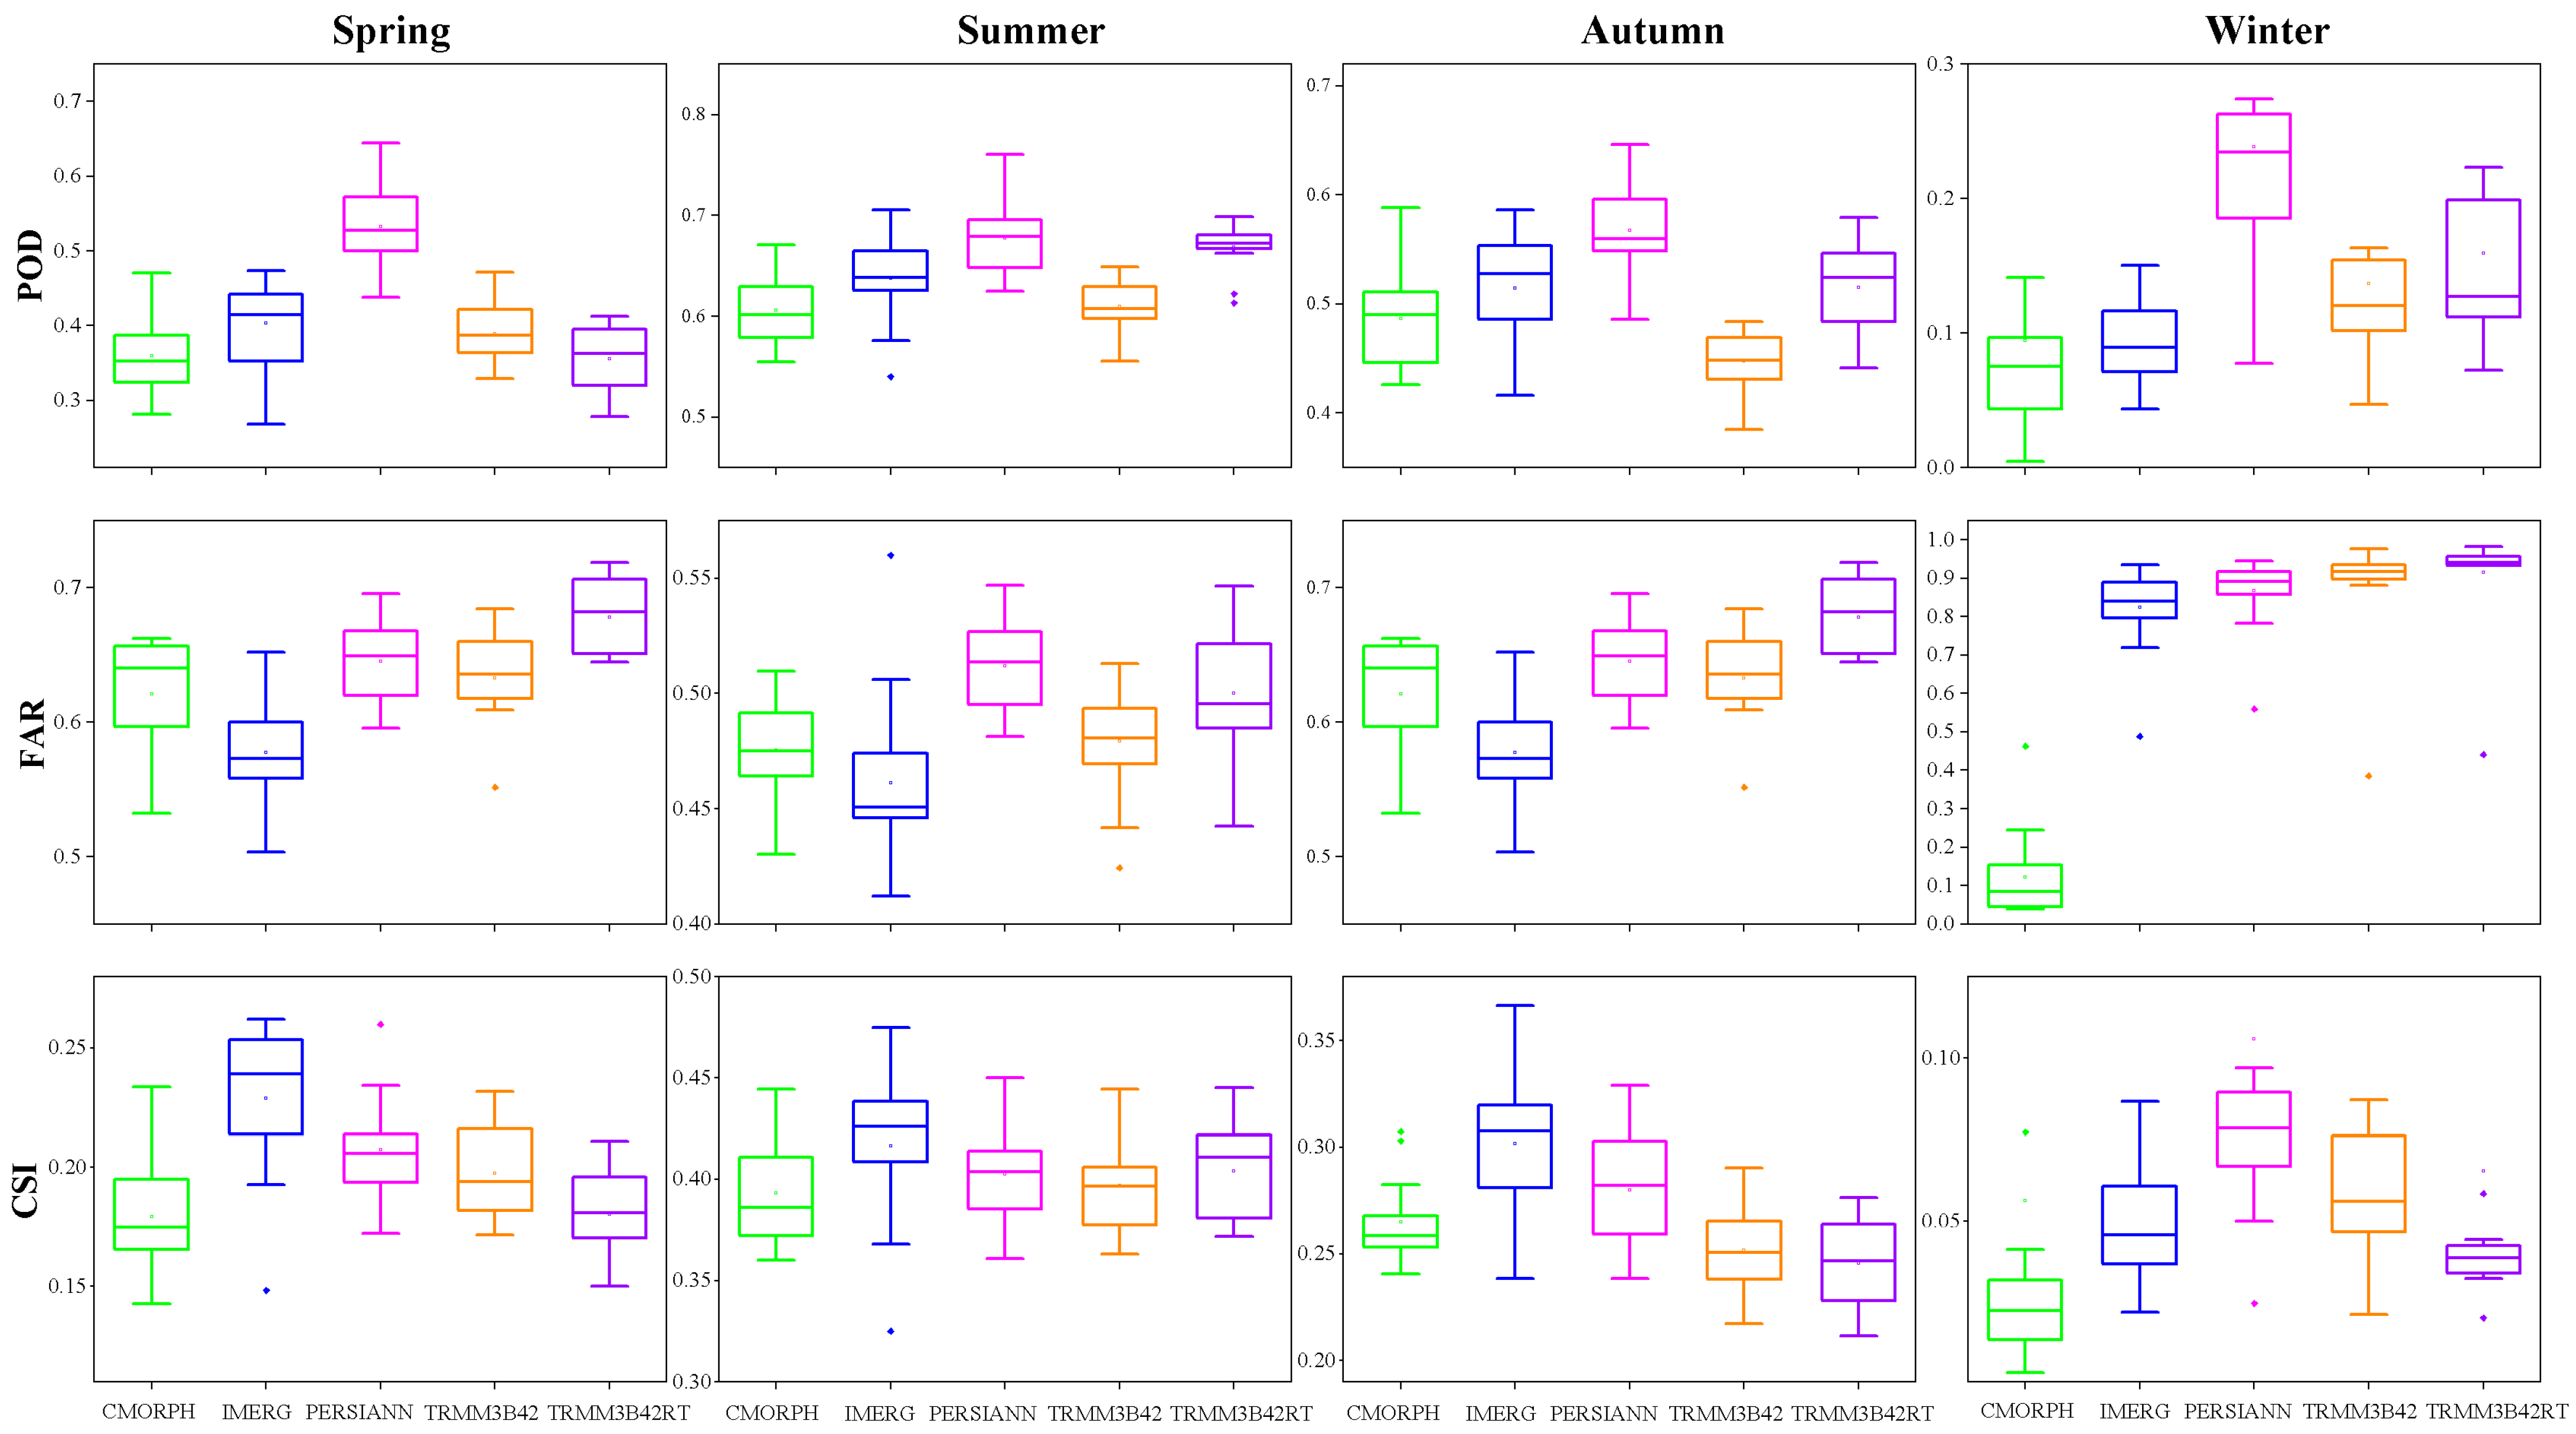
3.2.2. Seasonal Precipitation Distribution

To further assess the effectiveness of various SPPs in monitoring the seasonal time series of extreme precipitation on the QTP, a sequential analysis was conducted. Each SEPI was individually incorporated into the four seasonal sequences at each station from 2001 to 2015, allowing for the calculation of the CC and RMSE values for the SEPI seasonal sequences at each station. Subsequently, the CCs and RMSEs of the seasonal time series of SEPIs for all stations were averaged to obtain the mean CC and RMSE values for each SPP during the period from 2001 to 2015. Figure 5 displays histograms of CC and RMSE, illustrating the performance of all SEPIs across the five SPPs.
As shown in Figure 5, for all SEPIs, IMERG exhibits the most favorable performance among all the SPPs, displaying the highest CCs and the lowest RMSEs during the spring season. TRMM3B42 follows IMERG in terms of performance. Conversely, CMORPH and TRMM3B42RT demonstrate poorer performance, characterized by lower CC values and higher RMSE values, particularly TRMM3B42RT. During summer, IMERG displays the highest CC and RMSE values for over half of the SEPIs, while TRMM3B42 ranks second with slightly higher CCs and RMSEs. Conversely, PERSIANN and TRMM3B42RT perform inversely, with TRMM3B42RT showing particularly poor results. For autumn and winter, IMERG and TRMM3B42 consistently demonstrate higher CCs and lower RMSEs for most SEPIs. Overall, IMERG outperforms other products with higher CCs and lower RMSEs across all seasons, exhibiting a significant advantage during spring. TRMM3B42 follows IMERG as the second-best performer. Conversely, TRMM3B42RT consistently displays lower CCs and higher RMSEs in all seasons, with RMSE values notably higher compared to other products. Generally, SPPs perform better during summer and autumn compared to spring and winter.

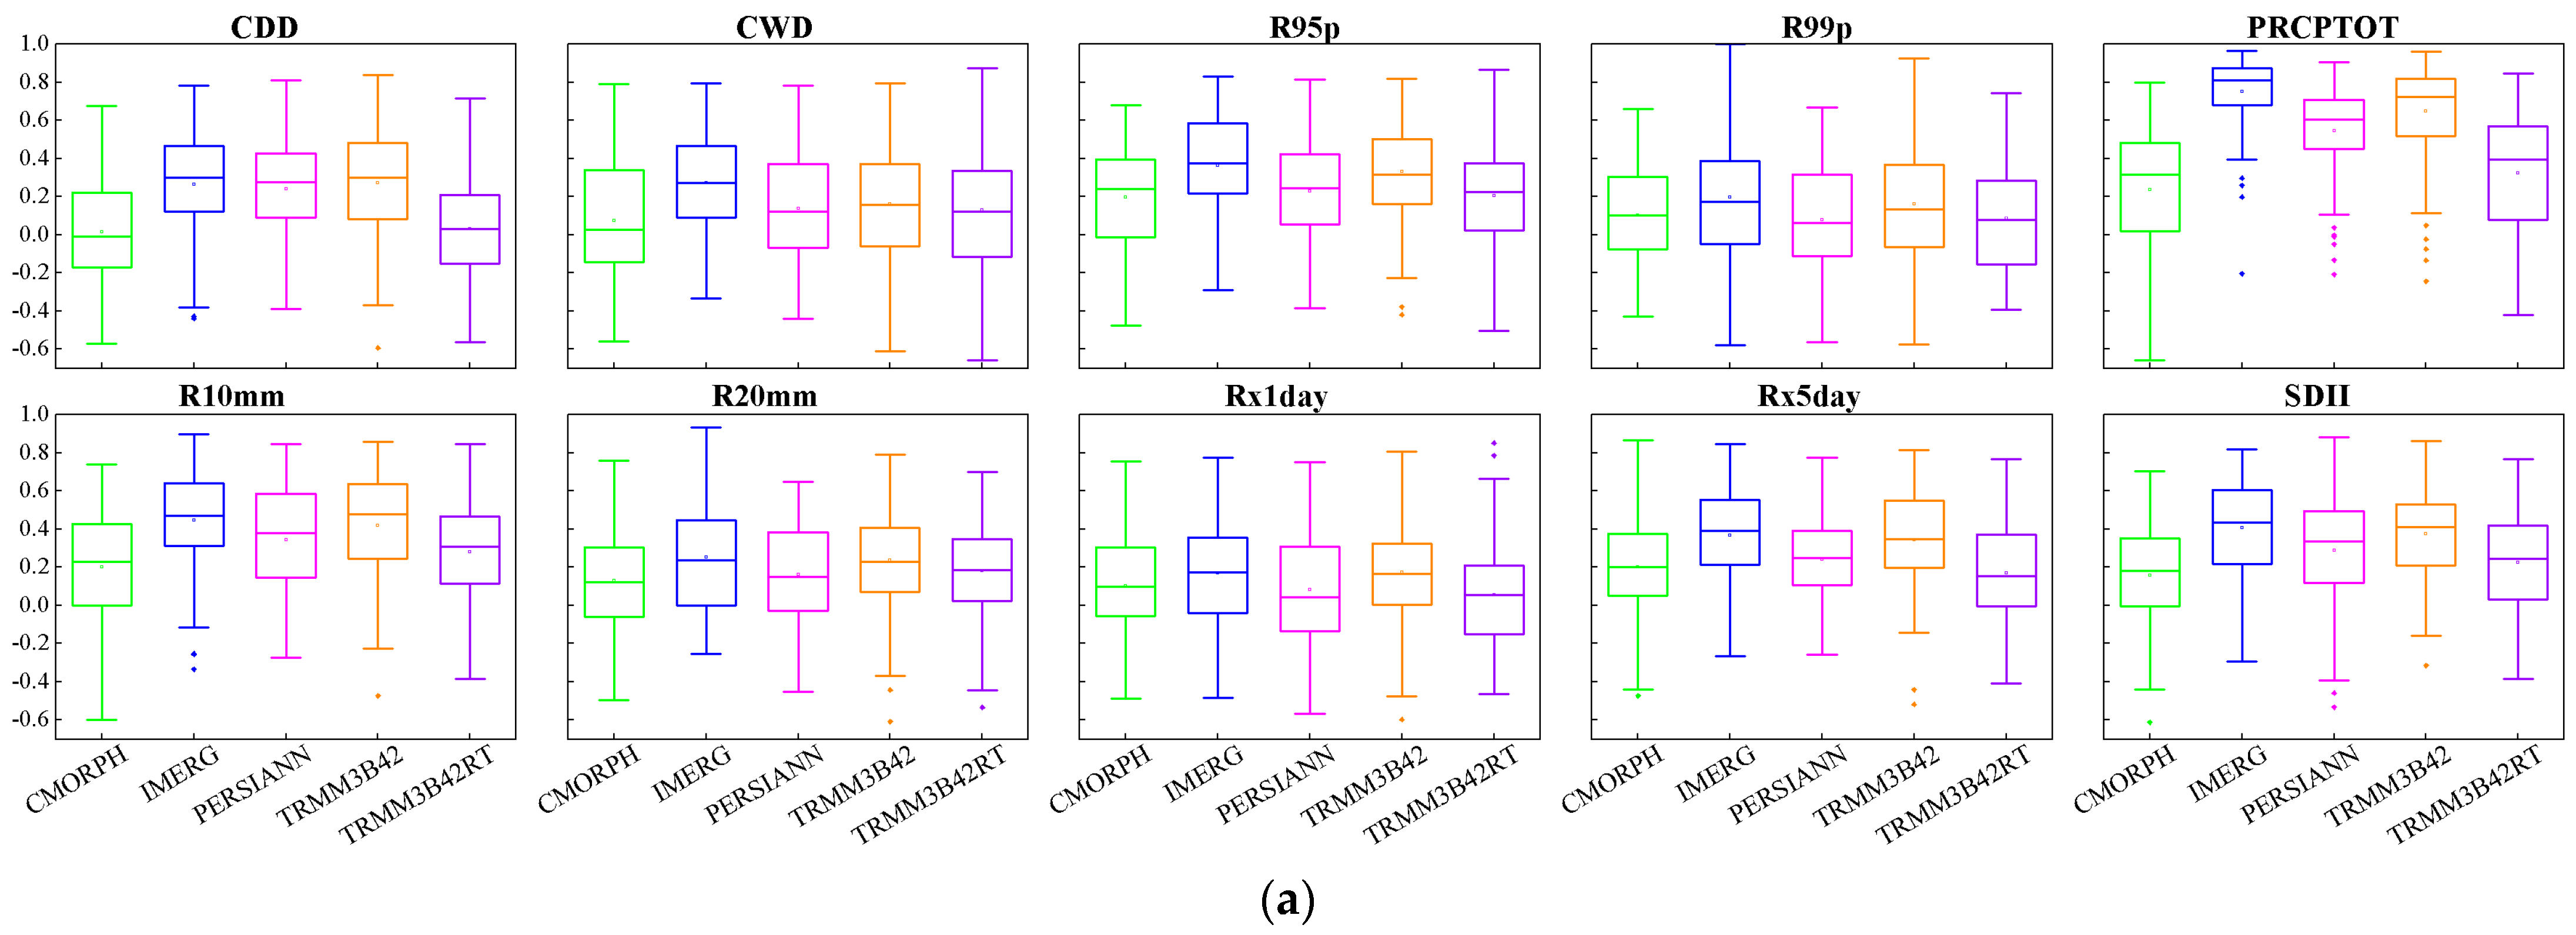
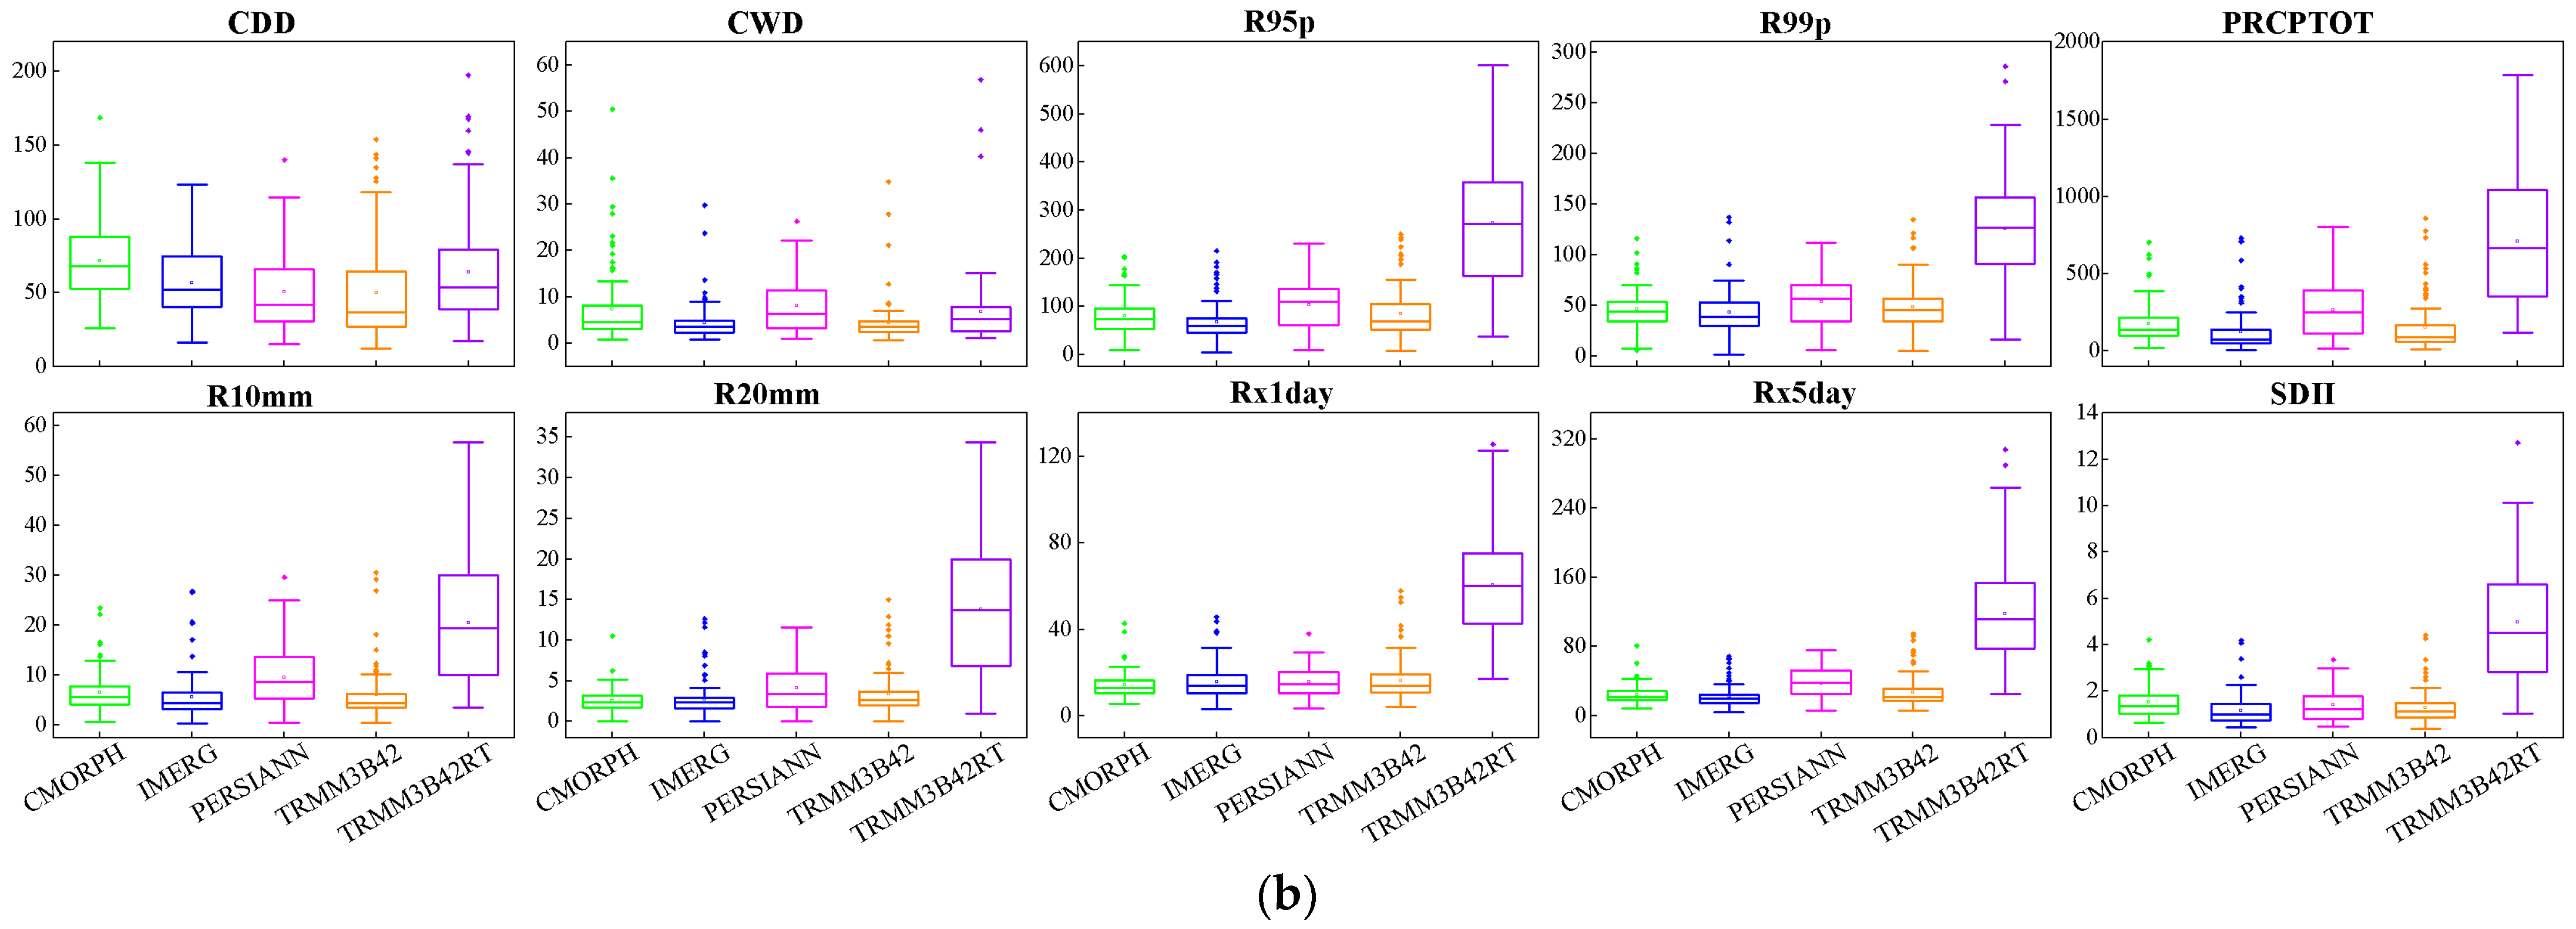
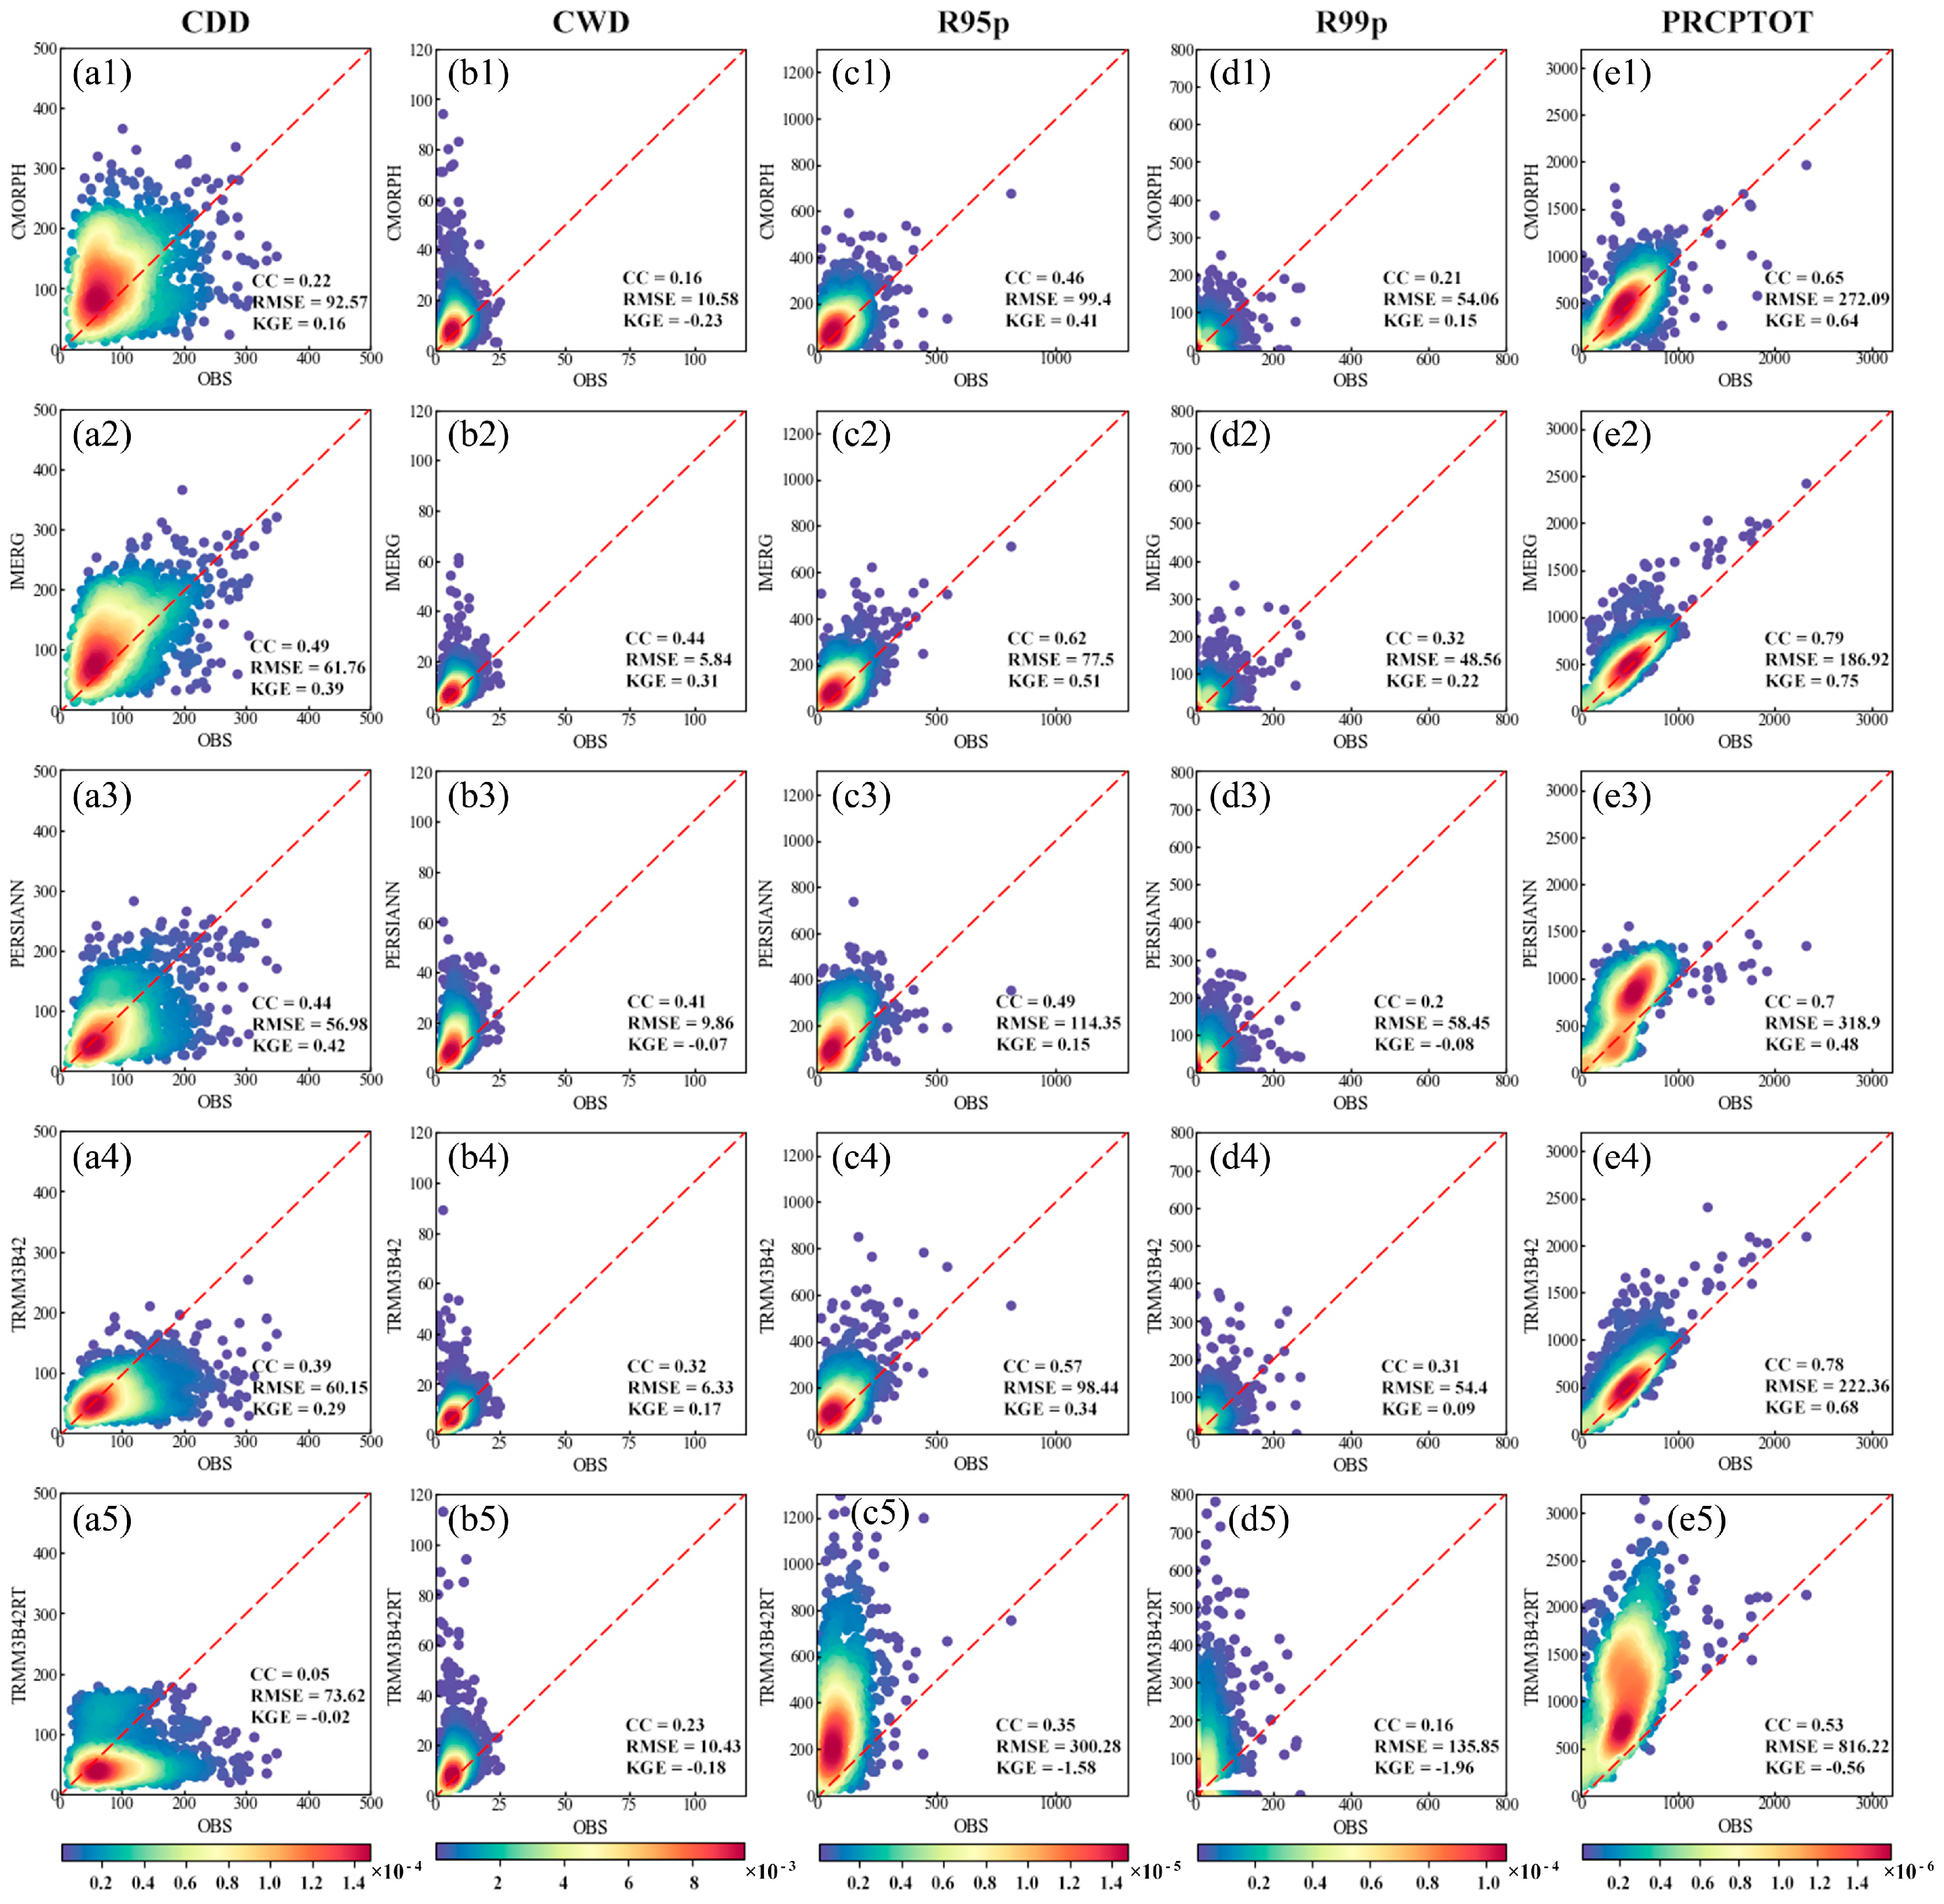
3.3. Statistical Assessments

3.3.1. Indices Based on Duration and Amount of Precipitation

Figure 6 depicts the scatter density plots illustrating the precipitation duration (CDD and CWD) and amount (R95p, R99p, and PRCPTOT) for OBS and five SPPs (CMORPH, IMERG, PERSIANN, TRMM3B42, and TRMM3B42RT). For CDD, the CMORPH and IMERG generally show overestimates, while the PERSIANN, TRMM3B42, and TRMM3B42RT show underestimates. PERSIANN demonstrates superior performance with a KGE value of 0.42, indicating the highest agreement with observed data, and an RMSE value of 56.98, indicating the lowest deviation from the observed values. IMERG follows closely with a KGE of 0.39 and RMSE of 61.76. The remaining SPPs have KGE values below 0.3, particularly TRMM3B42RT, which has the lowest KGE of −0.02. All products generally overestimate CWD. IMERG exhibits exceptional performance, achieving a KGE value of 0.31, indicating the highest agreement with observed data. Additionally, it achieves a CC value of 0.44, the highest correlation coefficient, and an RMSE value of 5.84, indicating the lowest deviation from the observed values. The other SPPs perform poorly with KGE values below 0.
For precipitation-amount-based indices (R95p, R99p, and PRCPTOT), IMERG outperformed other SPPs, as indicated by its highest KGE and CC values, as well as its lowest RMSE. Therefore, it can be concluded that IMERG exhibits the best performance in capturing the duration and amount of extreme rainfall for the QTP region. It is worth noting that among the five SPPs, TRMM3B42RT showed the weakest ability to capture precipitation duration and amount, with all KGE values less than 0. This deficiency may be attributed to its limited integration with ground stations.
For the two precipitation-amount-based indices of CDD and CWD, SPPs perform better for CDD and worse for CWD. For the three precipitation-amount-based indices of R95p, R99p, and PRCPTOT, SPPs perform best for PRCPTOT and worst for R99p.

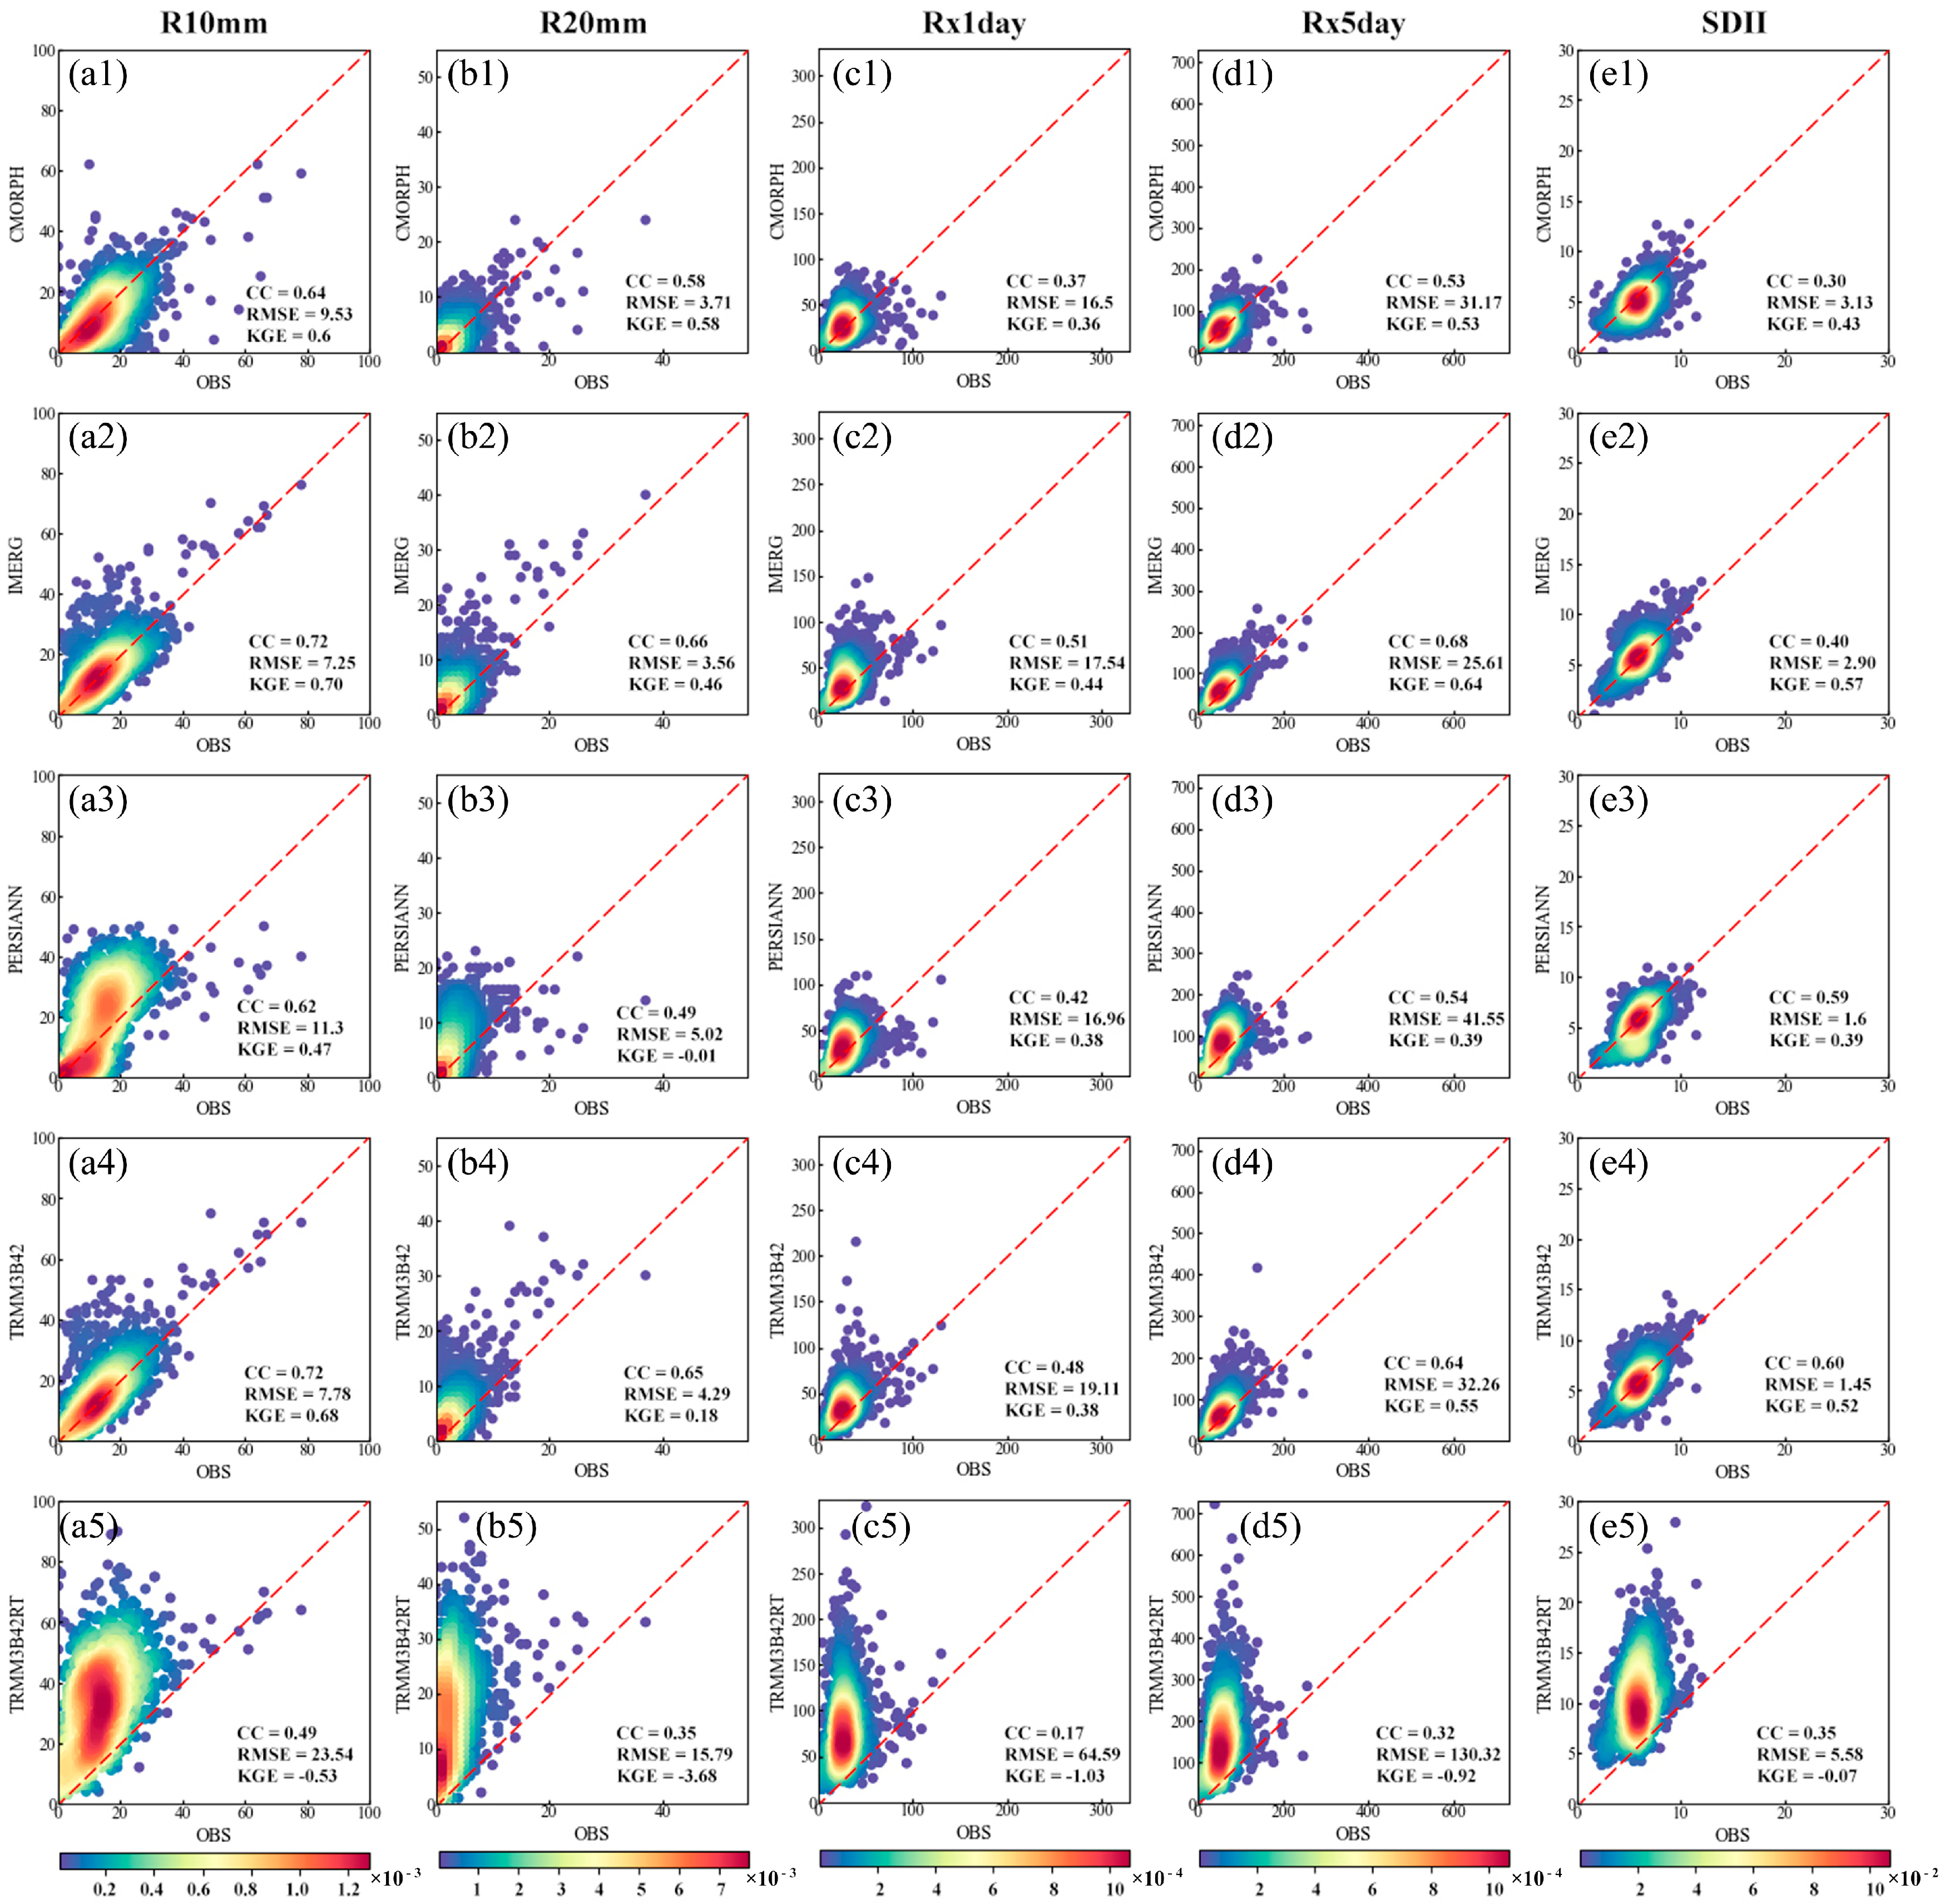
3.3.2. Indices Based on Frequency and Intensity of Precipitation

Figure 7 displays scatter density plots of SEPIs for precipitation frequency (R10 mm, R20 mm) and intensity (Rx1day, Rx5day, SDII) comparing OBS with five SPPs (CMORPH, IMERG, PERSIANN, TRMM3B42, and TRMM3B42RT), along with associated statistical metrics. Regarding R10 mm, CMORPH underestimates R10 mm, while other SPPs overestimate it. IMERG demonstrates outstanding performance, achieving the highest KGE (0.7), CC (0.72), and the lowest RMSE (7.25 days). For R20 mm, CMORPH generally exhibits the best performance, achieving the highest KGE (0.58), followed by IMERG with a KGE of 0.46. The other SPPs demonstrate poorer performance capabilities, with KGE values below 0.2. For Rx1day, IMERG has the highest CC (0.51) and KGE (0.44) while RMSE is slightly higher than CMORPH. For Rx5day, IMERG has the highest KGE (0.64), CC (0.68), and the lowest RMSE (25.61 mm 5 day−1). For SDII, IMERG has the highest KGE (0.57), while CC and RMSE are slightly worse than PERSIANN and TRMM3B42. In conclusion, IMERG has the best performances to capture extreme precipitation frequency and intensity for QTP. It is also noted that TRMM3B42RT has the worst ability to capture extreme precipitation frequency and intensity among the five SPPs, with KGEs less than 0 in all cases.
Regarding the two precipitation-frequency-based indices (R10 mm and R20 mm), SPPs exhibit better performance for R10 mm but worse performance for R20 mm. However, when it comes to the three indices related to precipitation intensity (Rx1day, Rx5day, and SDII), SPPs demonstrate superior performance for Rx5day and SDII, but the poorest performance for Rx1day.

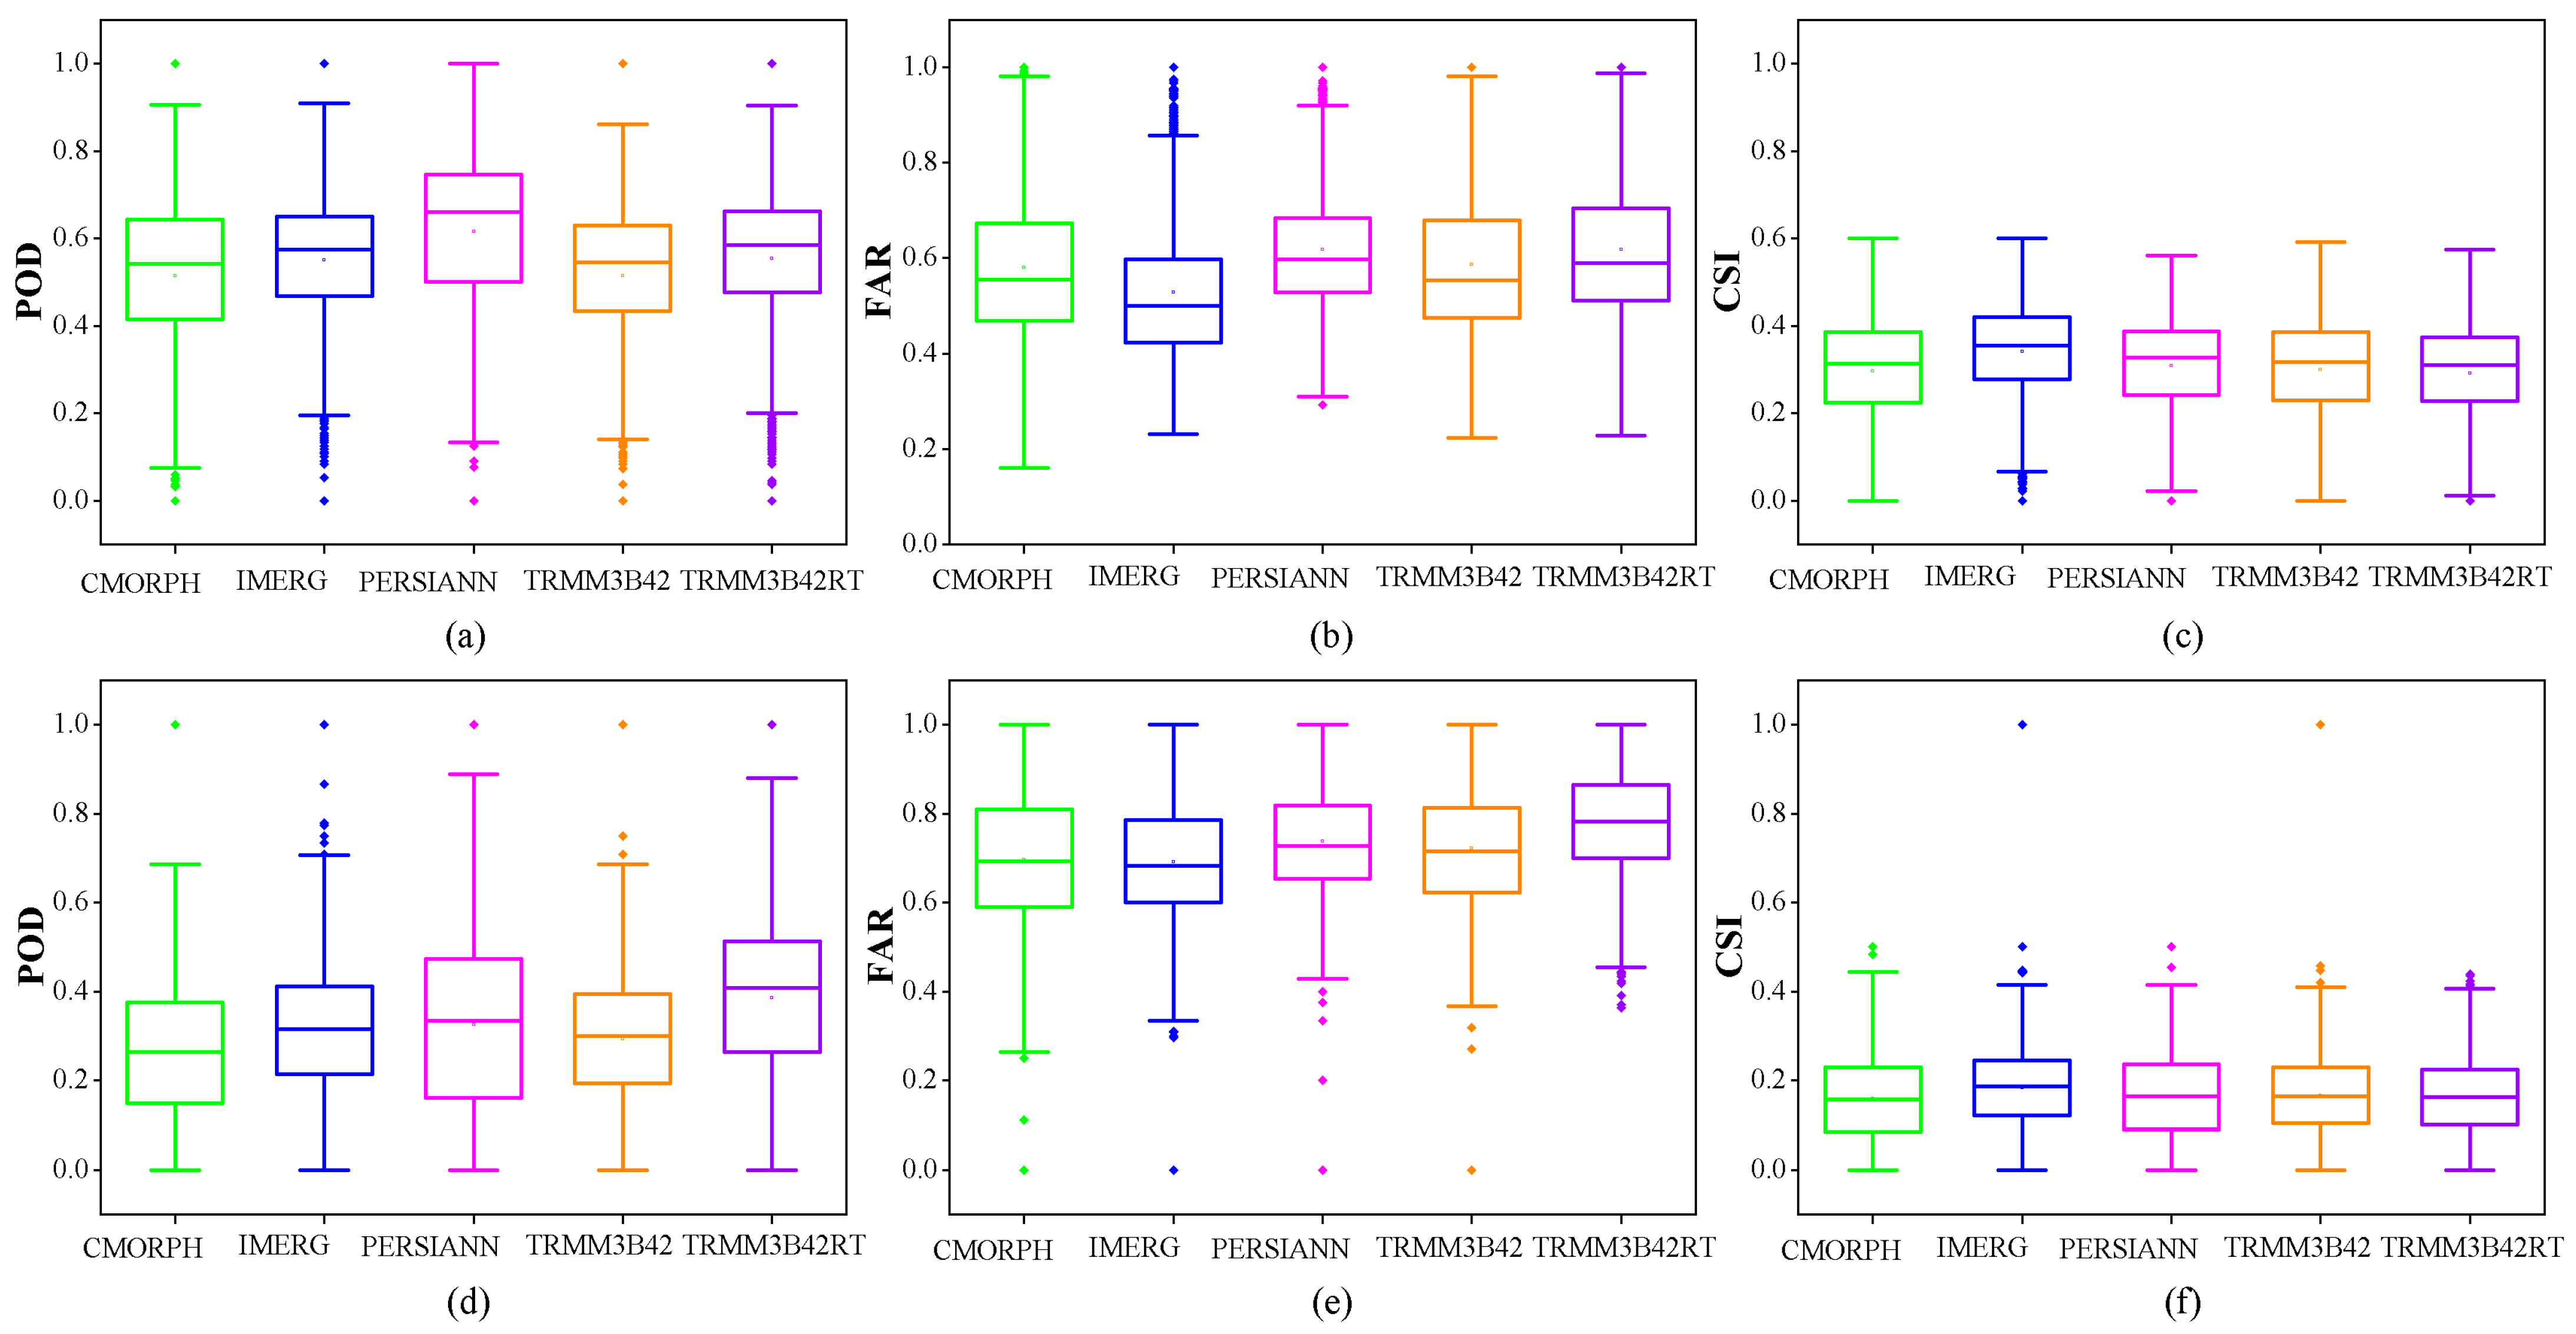
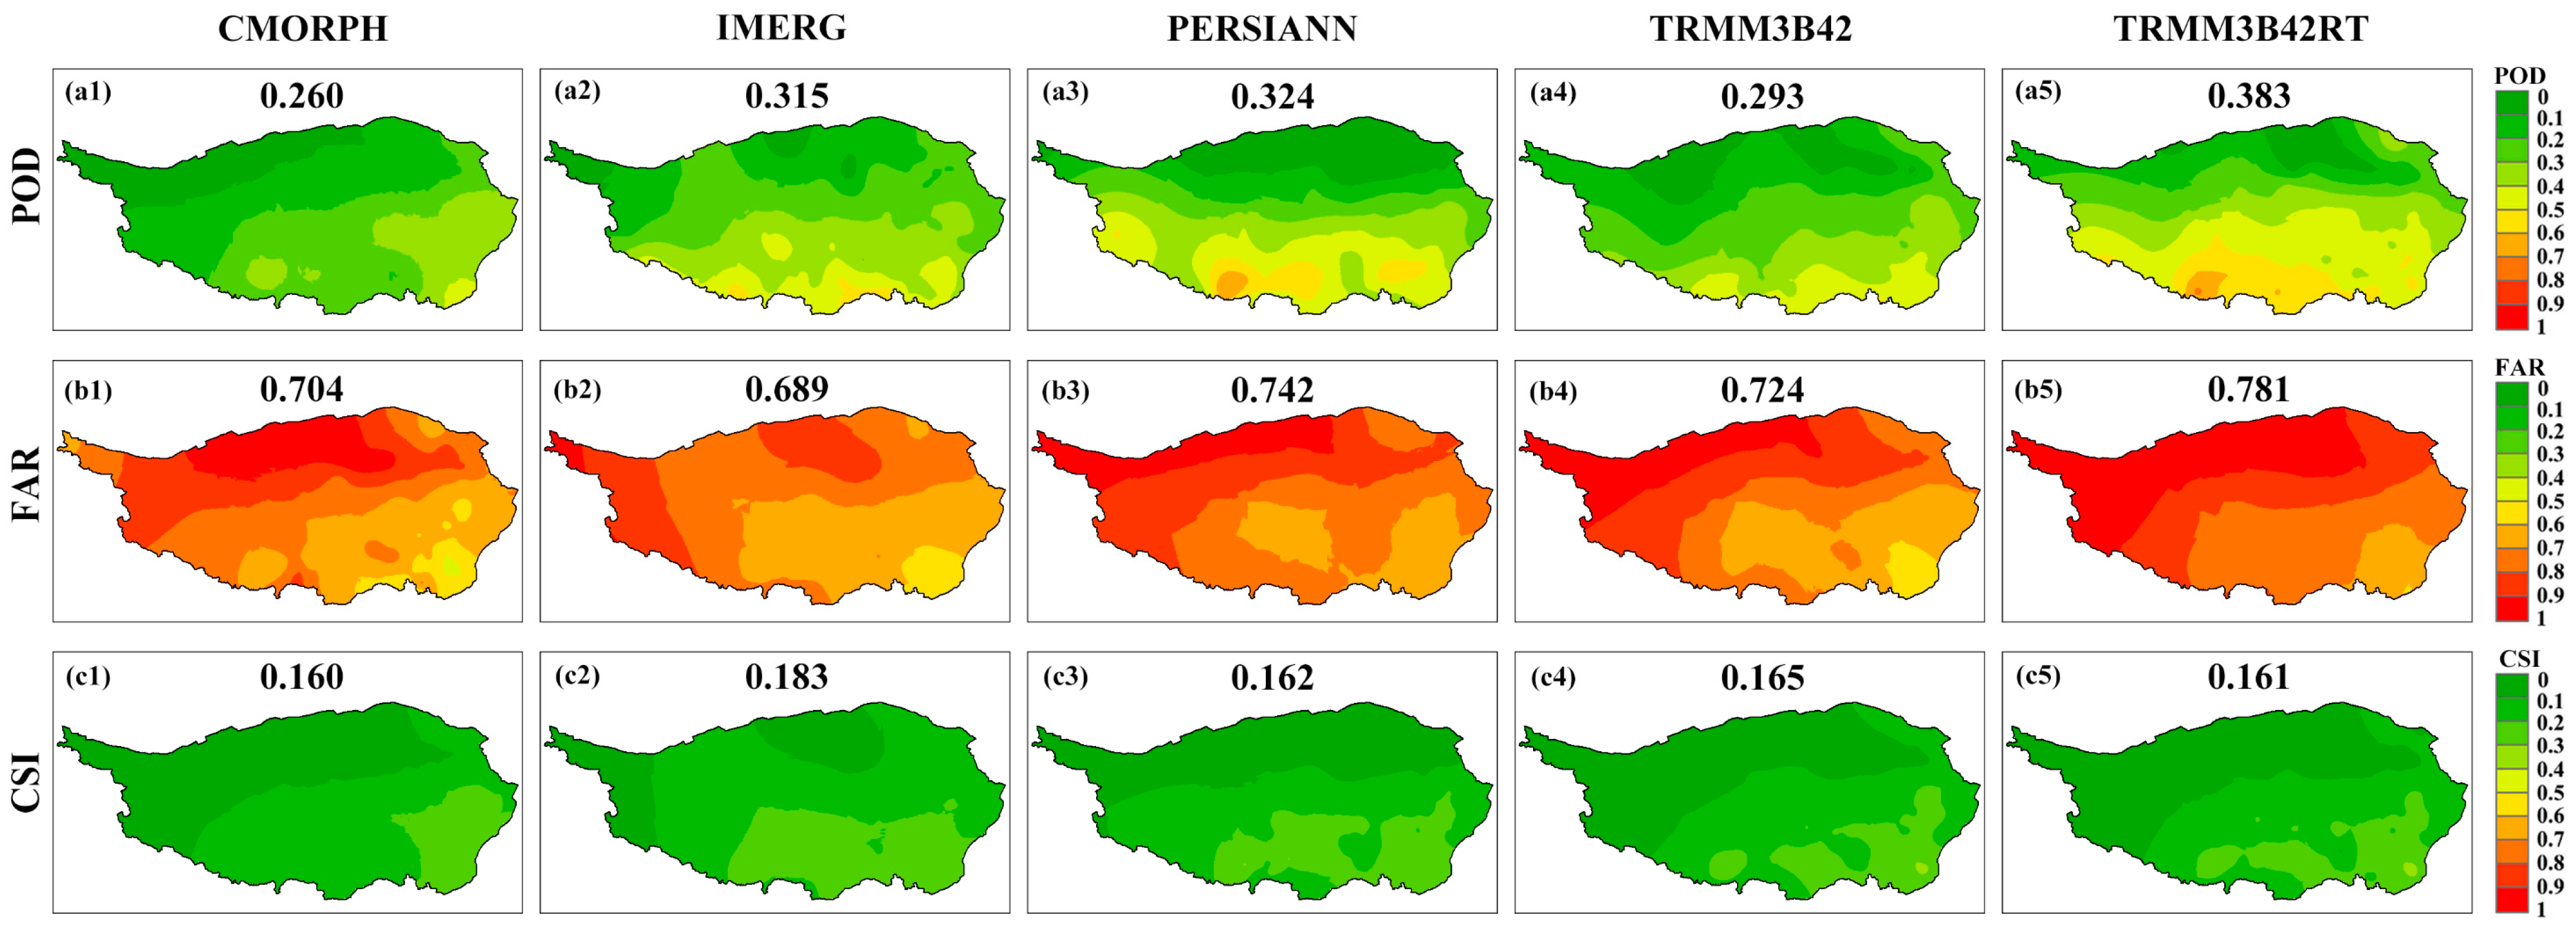
3.4. Accuracy Evaluation of the Extreme Precipitation Event Occurrences

Figure 8 presents a graphical representation of boxplots illustrating POD, FAR, and CSI for five SPPs in detecting daily rainfall events (Figure 8a–c) and daily extreme precipitation events (Figure 8d–f). These intense precipitation events are characterized as rainfall surpassing the 75th percentile of all recorded rainy days between 2001 and 2015. Regarding daily precipitation events (Figure 8a–c), the analysis shows that PERSIANN exhibits the highest POD, while IMERG has the lowest FAR and the highest CSI. It should be noted also that the PODs for five SPPs are relatively high with values larger than 0.5, and IMERG is slightly lower than PERSIANN for POD. Therefore, IMERG is considered to have the best detection capability in the categorical skill metrics in general.
In Figure 8d–f, the results of SPPs for extreme precipitation events are similar to those for rainy days, except for TRMM3B42RT, which has the highest POD. However, it should be noted that the rankings of CSI differ from those of POD for both rainy events and extreme heavy rainy events. For instance, PERSIANN and TRMM3B42RT exhibit higher POD and FAR compared to IMERG, while IMERG demonstrates a higher CSI than both PERSIANN and TRMM3B42RT. In addition, IMERG has the lowest FAR and the highest CSI. A possible reason is that the SPPs generally overestimate the daily rainfall and extreme rainfall, especially for PERSIANN and TRMM3B42RT as the most overestimated (see Figure 2 and Figure 3). Overall, it is concluded from Figure 8 that IMERG has the most reliable detection capability with fewer false detections to the extreme precipitation events. However, the similar POD and FAR for precipitation events (Figure 8a,b) and larger FAR than POD for extreme precipitation (Figure 8d,e) also demonstrate that the advantage of IMERG is not significant enough at the daily scale.
Figure 9 shows the spatial patterns of POD, FAR, and CSI for five different SPPs in detecting extreme precipitation events where the precipitation surpasses the 75th percentile of all days with rainfall from 2001 to 2015. We also provide the average values for POD, FAR, and CSI in the figure. Generally, the SPPs demonstrate superior performance in the eastern and southern part of the QTP compared to the northwestern part, with higher POD and CSI values and lower FARs. Specifically, IMERG does not achieve the highest POD (0.315), but it displays the lowest FAR (0.689) and the highest CSI (0.183), particularly in the southern part of the QTP. This suggests that IMERG has greater potential for detecting extreme precipitation events than other SPPs in QTP. PERSIANN and TRMM3B42 show similar patterns of categorical skill metrics in detecting extreme precipitation events across most of the QTP. In addition, CMORPH has the lowest POD (0.260) and CSI (0.160); TRMM3B42RT has the highest POD (0.383) and FAR (0.781), and a relatively small CSI (0.161), especially in the northern part of QTP. The results suggest that CMORPH and TRMM3B42RT exhibit constrained capability in detecting extreme precipitation events. It was also found that the PODs, FARs, and CSIs for five SPPs in the QTP ranged from 0.263 to 0.383, from 0.689 to 0.781, and from 0.16 to 0.183, respectively. Obviously, the advantage of IMERG is slightly significant compared with other SPPs at the daily scale.
Figure 10 depicts boxplots that showcase the three categorical skill metrics of five SPPs in identifying extreme precipitation occurrences on a seasonal level from 2001 to 2015 across the QTP. The results indicate that during the summer, the SPPs exhibit the highest POD (mean 0.31–0.45) and CSI (mean 0.18–0.21), and the lowest FAR (mean 0.67–0.71) compared to other seasons. In contrast, winter shows lower POD and CSI values for all SPPs, along with higher FAR values, indicating the weakest detection ability for extreme precipitation events during this season. TRMM3B42RT consistently demonstrates the highest FAR values across all four seasons, ranging from 0.89 in summer to 0.98 in winter, suggesting its limited accuracy in detecting extreme precipitation events. On the other hand, IMERG exhibits higher POD values (0.11–0.36), the highest CSI values (0.11–0.30), and the lowest FAR values (0.67–0.78) in all four seasons. These findings indicate that IMERG has more accurate detection ability of the extreme precipitation events, especially in the fall when its detection ability is far higher than that of other SPPs. It should also be noted that except for winter, the POD of IMERG is slight lower than PERSIANN, while the CSI of IMERG is significantly higher than other SPPs. It may be related to overestimate in PERSIANN.
Certainly, it should be noted that the results obtained in this section are based on an analysis of this particular QTP region and may be different in other regions.

4. Discussion

In this research, we utilized a grid-to-station validation approach to access the precision of SPPs in relation to ground-based measurements. Among the five products analyzed, IMERG exhibited exceptional performance surpassing the other four SPPs. In contrast, the TRMM3B42RT product exhibited a notable tendency to overstate rainfall when contrasted with the ground-based measurements conducted in the QTP. These findings align with similar conclusions drawn by Bai et al. [49], Zhang et al. [50], and Shen et al. [51] regarding the IMERG and TRMM3B42RT products in the QTP. Several scholars have already conducted assessments on the accuracy of different SPPs in other regions. For instance, Wang et al. [52] assessed the performance of TRMM 3B42, CMORPH, PERSIANN, and CHIRPS in the Ganjiang River Basin. Their findings indicated that TRMM 3B42 outperformed CMORPH and PERSIANN. Fang et al. [24] and Tang et al. [53] evaluated the performance of IMERG and TRMM-3B42 in mainland China, highlighting that GPM IMERG demonstrated better detection capabilities for extreme precipitation events and daily scales compared to TRMM-3B42. These findings align with the findings of this study in the QTP region. However, further research is still needed to investigate whether IMERG-Final performs better in most regions.
Most SPPs have better rainfall extremes detection in the eastern and southern part than in the western and northern part of the QTP; this implies that SPPs demonstrate higher efficacy in capturing rainfall extremes in regions with relatively higher humidity compared to high-altitude and dry areas. Several factors contribute to this observation. Firstly, SPPs undergo bias adjustment using gauge observations.
Nevertheless, the accuracy of SPPs is compromised due to the limited availability of rain gauges in the mountainous and dry regions of the western QTP [23,24,53,54]. Secondly, the dynamics of rainfall in high-altitude mountainous regions are typically characterized by greater complexity compared to flat lowland areas, primarily due to the intricate interactions of various terrain-related factors. Furthermore, in arid zones, the hydrometeors identified by satellite sensors have a tendency to evaporate swiftly before reaching the Earth’s surface, thereby intensifying the difficulty in accurately estimating precipitation using SPPs [55,56,57]. Furthermore, the presence of complex convective systems in elevated mountainous areas poses an additional challenge to accurately detect and measure precipitation using SPPs [58].
When considering precipitation-duration-based indices, the SPPs demonstrated higher CC and KGE values for CDD compared to consecutive wet days (CWD). One possible explanation for this observation is that the products tended to overestimate precipitation in situations with low rainfall amounts [59,60]. As for precipitation-amount-based indices, the CCs and KGEs of the SPPs exhibited a decline as the rainfall percentiles used (percentile 95 and 99) increased, with no significant variation in values among the different stations. Among all the SPPs, IMERG performed the best. On the other hand, the R99p index displayed lower CCs and KGEs (KGE < 0.22), primarily because the SPPs underestimated extreme rainfall rates [24]. Additionally, the results show that the α values of KGE for these indices was larger than 1, implying that all SPPs tended to overestimate both annual rainfall and extreme precipitation events. Conversely, the β values of KGE for these indices were lower than 1, indicating that all SPPs exhibited a tendency to underestimate the variability in rainfall patterns. These findings align with the outcomes reported by Ramadhan et al. [8]. In terms of precipitation-frequency-based indices, PERSIANN, TRMM3B42, and TRMM3B42RT tended to overestimate rainfall for higher rainfall intensities (>20 mm d−1). Additionally, their KGE values at higher rainfall intensities (−0.01, 0.18, and −3.68, respectively) are notably lower than the KGE values at lower rainfall intensities (0.47, 0.68, and −0.53, respectively). Conversely, IMERG and CMORPH had higher consistency in the frequency distributions of precipitation with the site, consistently yielding KGE values above 0.46 for both rainfall intensity levels. Observations of precipitation-frequency-based indices revealed lower KGE values (−1.03 < KGE < 0.44) for Rx1day, while Rx5day exhibited moderate KGE values (−0.92 < KGE < 0.64). These results are consistent with earlier investigations carried out in Bali [61] and the Indonesian Maritime Continent [8]. According to Liu et al. [61], IMERG demonstrated significantly stronger correlation with 5-day data as opposed to 1-day data. This can be attributed to IMERG’s enhanced capability in capturing rainfall over longer periods of time [62,63]. Generally, the assessment of extreme rainfall intensity over a 5-day timeframe yielded superior results compared to daily observations [8]. Therefore, it is highly recommended to utilize IMERG with a 5-day timeframe when monitoring intense rainfall events on the QTP.
The estimates of SEPIs varied significantly among the five SPPs on seasonal scales. In terms of detecting extreme precipitation events, all SPPs exhibited better performance during the summer compared to other seasons. This finding aligns with the conclusions drawn by Kidd et al. [64], who conducted an assessment and comparison of rainfall estimates from different SPPs, including CMORPH, PERSIANN, and TRMM3B42RT. The study highlighted that these SPPs generally exhibit relatively stronger performance during the summer and relatively worse performance during the winter. One possible explanation could be the increased frequency of mild rainfall or the existence of frigid surface conditions throughout the winter season. These factors have an impact on passive microwave retrievals, resulting in decreased precision when estimating precipitation events using SPPs.
The assessment of extreme precipitation event occurrence accuracy reveals that IMERG outperforms other SPPs, particularly TRMM3B42RT, in accurately capturing the occurrence rate of SEPIs throughout the year and different seasons. IMERG exhibits the most promising potential in monitoring intense rainfall events, which may be due to the study area’s geographic location in the high-altitude region of the QTP. In this region, daily precipitation generally remains low, and heavy precipitation mostly takes the form of solid snowfall and hail. However, the GPM satellite carries a highly sensitive radar system, enabling it to observe even minor intensity precipitation. Consequently, the GPM’s performance in detecting weak precipitation is better than that of the other SPPs.
Furthermore, it has been demonstrated that altitude significantly impacts the accuracy of SPPs. For instance, in studies [65], it was observed that the POD index of IMERG products in the QTP region decreases at altitudes above 4200 m. Moreover, the deviation of SPPs in the southern part of the QTP exhibits a positive correlation with mean altitude, while the correlation coefficient displays a negative correlation with mean altitude. Additionally, the accuracy of IMERG’s assessment of the Yellow River Basin declines with increasing altitude. These findings within the QTP region align with the results of this study, indicating that SPPs become less accurate as altitude increases. Hence, there is a pressing need to further refine the algorithms for satellite precipitation estimation in high-altitude regions.
The reasons for the best performance of IMERG-Final may be as follows: the first reason is that the IMERG product has higher spatial and temporal resolution. The second reason is that the other products are the TRMM program and its derived precipitation data, while IMERG belongs to the new generation of Global Precipitation Measurement (GPM) program, which inherits the successful experience and results of TRMM, further improves the precipitation inversion algorithm, and at the same time, utilizes the more advanced passive GPM Microwave Imager (GMI) and Dual-frequency Precipitation Radar (DPR) sensor to improve the spatial coverage of TRMM in combination with the improved TRMM correction algorithm [30,31]. IMERG-Final, as the IMERG product with monthly scale correction from global ground stations, is the closest in accuracy to the actual precipitation data.
Regarding the error characteristics exhibited by the SPPs, the reason behind it may be the limitations of the current principles used for microwave-infrared satellite precipitation retrieval. In passive microwave remote sensing, precipitation satellites estimate precipitation by quantitatively relating the brightness temperature at the cloud top to precipitation intensity [66]. The brightness temperature at the cloud top increases with increasing precipitation intensity and gradually stabilizes, making it difficult to establish a relationship between microwave brightness and precipitation intensity during extreme precipitation events [67]. Additionally, the microwave emissivity at the surface fluctuates significantly due to variations in land surface complexity, further complicating the retrieval of land precipitation. Infrared sensors on precipitation satellites utilize the cloud top temperature data obtained in the infrared band to establish a relationship between cloud top infrared brightness temperature and precipitation intensity, based on their negative correlation [68]. However, the precipitation characteristics in complex terrain areas, such as orographic precipitation, do not meet the basic assumptions of this precipitation retrieval method [69], resulting in significantly lower estimation accuracy for precipitation in regions with complex terrain.
The accuracy of extreme precipitation retrieval by the five SPPs is relatively low in the QTP, potentially due to the influence of terrain and downscaling methods. This aligns with previous studies [70,71,72], and there are several possible reasons behind it. Firstly, the convective systems in the QTP are complex, which increases the difficulty of detection by SPPs. Secondly, as suggested by Hu et al. [70], the sensitivity of satellite sensors decreases in areas with more complex terrain. Tan et al. [60] proposed a possible explanation that the GPCC data used for calibration of IMERG and TRMM products are limited in complex mountainous and plateau regions. Similar situations may arise for other near-real-time products such as CMORPH and PERSIANN CDR, as there are usually fewer observation stations in high-altitude regions. Furthermore, the mismatch between point measurements (i.e., weather stations) and pixel measurements (i.e., SPPs) may lead to underestimation of the exact accuracy of SPPs. The different spatial resolutions of SPPs and the limited representativeness of point observations can affect the results. However, Zhang et al. [73] suggested that comparisons between point and pixel measurements, as well as pixel-to-pixel comparisons, provide similar statistical results, and the mutual comparison and ranking of SPPs can be considered negligible, which supports our findings.
In this study, despite implementing a comprehensive range of quality control measures aimed at achieving objective and sound assessment conclusions, certain uncertainties unavoidably persist. Firstly, the sparsity of meteorological stations in the QTP region [74] poses a challenge as many remote sensing precipitation products rely on ground-based information as input data sources. Moreover, the calibration process of SPPs involves even fewer meteorological stations, resulting in a lower correlation between the SPPs and the observations of weather stations in the research of inter-annual variability within this region. At the same time, the variations in the geographic placement of weather stations, the assortment of observation tools and installation methods, and the variability in precipitation observation techniques all introduce inherent uncertainties that are challenging to eliminate [75]. Due to the extensive span of the grid, the employment of the weather station-image element grid for comparative analysis yielded an inadequate depiction of weather stations. Nevertheless, notwithstanding these uncertainties, this study successfully mitigates the impact of local disparities on the effectiveness of remotely detected rainfall products by implementing rigorous quality assurance measures. Moreover, it is essential to recognize that climatic circumstances and terrain exert notable influences on the geographical arrangement of rainfall in the QTP [76]. Earlier research has demonstrated that elevation plays a pivotal role in precipitation patterns, particularly in intricate mountainous terrain [77]. This factor could potentially explain the underwhelming results of products in the QTP.

5. Conclusions

The objective of this research is to evaluate the proficiency of five SPPs (CMORPH, IMERG, PERSIANN, TRMM3B42, and TRMM3B42RT) in detecting and analyzing the spatiotemporal distribution of severe precipitation events across the QTP. To measure the characteristics of extreme precipitation, we utilized ten SEPIs categorized into four types: duration, amount, frequency, and intensity. The performances of the SPPs on extreme precipitation of the QTP were evaluated by the gauge-based precipitation dataset from 104 rainfall stations from 2001 to 2015 using a grid-to-station metric approach with three accuracy metrics (CC, RMSE, and KGE) and three categorical skill metrics (POD, FAR, and CSI). The evaluation utilized a gauge-based precipitation dataset from 104 rainfall stations spanning from 2001 to 2015. The key conclusions and findings are as follows:
The spatial analysis shows that all SPPs have better inversion capability for precipitation in the eastern and southern regions of the plateau, and lower detection accuracy in the high altitude and arid regions. Among the five SPPs, IMERG has the smallest inversion error for precipitation in the plateau region, has the highest correlation with the station observation, and is able to characterize the spatial variability of the extreme precipitation of the QTP well. In contrast, TRMM3B42RT has the largest inversion error for precipitation in the plateau region and the lowest correlation with station observations.
Analysis of annual and seasonal time series indicates that IMERG excels in accurately estimating the magnitude and frequency of the majority of SEPIs, with TRMM 3B42 ranking second in performance. The correlation between the accuracy of these products in estimating precipitation and the seasonal variability of precipitation is apparent. There is a small variability and high correlation between the inversion precipitation of SPPs and station observations during the warm and wet seasons, indicating that the performance of these products is relatively stronger during the summer and autumn seasons, as opposed to the spring and winter seasons.
The statistical analysis reveals that IMERG outperforms other SPPs in both precipitation amount-based and precipitation intensity-based indices. The ability of extreme precipitation indices deteriorates from R95p, R20 mm, Rx5day to extreme rainfall indices with high rainfall intensities (R99p, R10 mm, Rx1day). The five SPPs exhibit better performance for the PRCPTOT index, potentially because each accuracy metric is highly sensitive to satellite anomalies that result in overestimation or underestimation of precipitation values. The cumulative extreme precipitation mitigates the significant impact caused by these anomalous deviations. The SPPs exhibit the lowest KGE values for the CWD and P99p indices (<0.31 and 0.22, respectively), primarily because the SPPs tend to overestimate mild precipitation and underestimate intense heavy rainfall in their daily rainfall data.
The accuracy assessment of extreme precipitation occurrence reveals that IMERG demonstrates a slightly advantage compared with other SPPs in detecting both daily rainfall events and extreme rainfall events (defined as rainfall exceeding the 75th percentile of rainy days) in the QTP. Overall, the PODs, FARs, and CSIs for five SPPs in the QTP ranged from 0.263 to 0.383, from 0.689 to 0.781, and from 0.16 to 0.183, respectively. Furthermore, each SPP exhibits its strongest detection ability during the summer season, characterized by higher values of POD (0.31–0.45) and CSI (0.18–0.21), lower values of FAR (0.67–0.71), and its weakest detection ability during winter.
The findings indicate that IMERG holds promising potential for the analysis of extreme rainfall events and their impact on climate and risk assessment in the QTP. Nevertheless, it is crucial to acknowledge certain constraints, such as the inclination to overestimate mild rainfall, underestimate intense rainfall, and experience reduced accuracy at higher altitudes. Future research should focus on continual updates and optimization of the SPPs, particularly in terms of their performance at hourly scales and during typical precipitation extremes. These efforts will provide valuable data for monitoring and warning of extreme rainfall events. It should be noted that the western and southern Himalayan part of the plateau present extremely complex terrain and harsh geographic and climatic conditions, which pose challenges for the establishment of ground observation stations. Consequently, there is a lack of comparative data with the satellite data, so the assessment of extreme precipitation in the above regions by SPPs needs to be further consolidated after obtaining more ground observation data.

Author Contributions

Conceptualization, W.Z. and Z.D.; methodology, W.Z. and Z.D.; software, W.Z.; validation, W.Z., Z.D. and J.L.; formal analysis, Z.D. and S.Z.; investigation, J.L. and S.Z.; resources, W.Z. and Z.L.; data curation, W.Z.; writing—original draft, W.Z.; writing—review and editing, Z.D., S.Z., J.L., X.W. and H.S.; visualization, W.Z.; supervision, Z.D.; project administration, Z.D., S.Z. and J.L.; funding acquisition, Z.D., S.Z. and J.L. All authors have read and agreed to the published version of the manuscript.

Funding

National Natural Science Foundation of China (Grant Nos. 41930970, 41571368, and 42275021) and the Natural Science Foundation of Hunan Province (Grant No. 2023JJ30484).

Data Availability Statement

The burned area datasets used in our work can be freely accessed on follow websites: CMORPH: https://rda.ucar.edu/ (accessed on 1 June 2022); IMERG-Final: https://disc.gsfc.nasa.gov/ (accessed on 5 June 2022); PERSIANN-CDR: http://chrsdata.eng.uci.edu/ (accessed on 3 June 2022); TRMM-3B42V7 and TRMM3B42RT: https://www.earthdata.nasa.gov/ (accessed on 6 June 2022).

Conflicts of Interest

The authors declare no conflict of interest.

References

  1. Michaelides, S.; Levizzani, V.; Anagnostou, E.; Bauer, P.; Kasparis, T.; Lane, J. Precipitation: Measurement, remote sensing, climatology and modeling. Atmos. Res. 2009, 94, 512–533. [Google Scholar] [CrossRef]
  2. Ghorbanian, A.; Mohammadzadeh, A.; Jamali, S.; Duan, Z. Performance Evaluation of Six Gridded Precipitation Products throughout Iran Using Ground Observations over the Last Two Decades (2000–2020). Remote Sens. 2022, 14, 3783. [Google Scholar] [CrossRef]
  3. Arias, P.; Bellouin, N.; Coppola, E.; Jones, R.; Krinner, G.; Marotzke, J.; Naik, V.; Palmer, M.; Plattner, G.-K.; Rogelj, J.; et al. Technical Summary. In Climate Change 2021: The Physical Science Basis: Contribution of Working Group I to the Sixth Assessment Report of the Intergovernmental Panel on Climate Change; Cambridge University Press: Cambridge, UK, 2021; pp. 33–144. [Google Scholar] [CrossRef]
  4. Cao, L.; Pan, S. Changes in precipitation extremes over the “Three-River Headwaters” region, hinterland of the Tibetan Plateau, during 1960–2012. Quat. Int. 2014, 321, 105–115. [Google Scholar] [CrossRef]
  5. Katsanos, D.; Retalis, A.; Tymvios, F.; Michaelides, S. Analysis of precipitation extremes based on satellite (CHIRPS) and in situ dataset over Cyprus. Nat. Hazards 2016, 83, 53–63. [Google Scholar] [CrossRef]
  6. Cui, P.; Dang, C.; Cheng, Z.; Scott, K.M. Debris flows resulting from glacial-lake outburst floods in Tibet, China. Phys. Geogr. 2010, 31, 508–527. [Google Scholar] [CrossRef]
  7. Wang, S.; Che, Y.; Xinggang, M. Integrated risk assessment of glacier lake outburst flood (GLOF) disaster over the Qinghai–Tibetan Plateau (QTP). Landslides 2020, 17, 2849–2863. [Google Scholar] [CrossRef]
  8. Ramadhan, R.; Marzuki, M.; Yusnaini, H.; Muharsyah, R.; Suryanto, W.; Sholihun, S.; Vonnisa, M.; Battaglia, A.; Hashiguchi, H. Capability of GPM IMERG products for extreme precipitation analysis over the Indonesian Maritime Continent. Remote Sens. 2022, 14, 412. [Google Scholar] [CrossRef]
  9. Yu, C.; Hu, D.; Liu, M.; Wang, S.; Di, Y. Spatio-temporal accuracy evaluation of three high-resolution satellite precipitation products in China area. Atmos. Res. 2020, 241, 104952. [Google Scholar] [CrossRef]
  10. Tan, J.; Huffman, G.J.; Bolvin, D.T.; Nelkin, E.J. Diurnal cycle of IMERG V06 precipitation. Geophys. Res. Lett. 2019, 46, 13584–13592. [Google Scholar] [CrossRef]
  11. Yang, K.; Wu, H.; Qin, J.; Lin, C.; Tang, W.; Chen, Y. Recent climate changes over the Tibetan Plateau and their impacts on energy and water cycle: A review. Glob. Planet. Chang. 2014, 112, 79–91. [Google Scholar] [CrossRef]
  12. Zhou, C.; Gao, W.; Hu, J.; Du, L.; Du, L. Capability of imerg v6 early, late, and final precipitation products for monitoring extreme precipitation events. Remote Sens. 2021, 13, 689. [Google Scholar] [CrossRef]
  13. Gottardi, F.; Obled, C.; Gailhard, J.; Paquet, E. Statistical reanalysis of precipitation fields based on ground network data and weather patterns: Application over French mountains. J. Hydrol. 2012, 432, 154–167. [Google Scholar] [CrossRef]
  14. Marra, F.; Morin, E.; Peleg, N.; Mei, Y.; Anagnostou, E.N. Intensity–duration–frequency curves from remote sensing rainfall estimates: Comparing satellite and weather radar over the eastern Mediterranean. Hydrol. Earth Syst. Sci. 2017, 21, 2389–2404. [Google Scholar] [CrossRef]
  15. Derin, Y.; Yilmaz, K.K. Evaluation of multiple satellite-based precipitation products over complex topography. J. Hydrometeorol. 2014, 15, 1498–1516. [Google Scholar] [CrossRef]
  16. Timmermans, B.; Wehner, M.; Cooley, D.; O’Brien, T.; Krishnan, H. An evaluation of the consistency of extremes in gridded precipitation data sets. Clim. Dyn. 2019, 52, 6651–6670. [Google Scholar] [CrossRef]
  17. AghaKouchak, A.; Behrangi, A.; Sorooshian, S.; Hsu, K.; Amitai, E. Evaluation of satellite-retrieved extreme precipitation rates across the central United States. J. Geophys. Res. Atmos. 2011, 116, D02115. [Google Scholar] [CrossRef]
  18. Lockhoff, M.; Zolina, O.; Simmer, C.; Schulz, J. Evaluation of satellite-retrieved extreme precipitation over Europe using gauge observations. J. Clim. 2014, 27, 607–623. [Google Scholar] [CrossRef]
  19. Nepal, B.; Shrestha, D.; Sharma, S.; Shrestha, M.S.; Aryal, D.; Shrestha, N. Assessment of GPM-Era Satellite Products’(IMERG and GSMaP) ability to detect precipitation extremes over mountainous country Nepal. Atmosphere 2021, 12, 254. [Google Scholar] [CrossRef]
  20. Harrison, L.; Funk, C.; Peterson, P. Identifying changing precipitation extremes in Sub-Saharan Africa with gauge and satellite products. Environ. Res. Lett. 2019, 14, 085007. [Google Scholar] [CrossRef]
  21. Zhou, B.; Xu, Y.; Wu, J.; Dong, S.; Shi, Y. Changes in temperature and precipitation extreme indices over China: Analysis of a high-resolution grid dataset. Int. J. Climatol. 2016, 36, 1051–1066. [Google Scholar] [CrossRef]
  22. Miao, C.; Ashouri, H.; Hsu, K.-L.; Sorooshian, S.; Duan, Q. Evaluation of the PERSIANN-CDR daily rainfall estimates in capturing the behavior of extreme precipitation events over China. J. Hydrometeorol. 2015, 16, 1387–1396. [Google Scholar] [CrossRef]
  23. Zhang, Y.; Wu, C.; Yeh, P.J.-F.; Li, J.; Hu, B.X.; Feng, P.; Lei, Y. Evaluation of multi-satellite precipitation products in estimating precipitation extremes over mainland China at annual, seasonal and monthly scales. Atmos. Res. 2022, 279, 106387. [Google Scholar] [CrossRef]
  24. Fang, J.; Yang, W.; Luan, Y.; Du, J.; Lin, A.; Zhao, L. Evaluation of the TRMM 3B42 and GPM IMERG products for extreme precipitation analysis over China. Atmos. Res. 2019, 223, 24–38. [Google Scholar] [CrossRef]
  25. Wu, Q.; Liu, Y. Ground temperature monitoring and its recent change in Qinghai–Tibet Plateau. Cold Reg. Sci. Technol. 2004, 38, 85–92. [Google Scholar]
  26. Liu, J.; Shangguan, D.; Liu, S.; Ding, Y. Evaluation and hydrological simulation of CMADS and CFSR reanalysis datasets in the Qinghai-Tibet Plateau. Water 2018, 10, 513. [Google Scholar] [CrossRef]
  27. Liu, J.; Shangguan, D.; Liu, S.; Ding, Y.; Wang, S.; Wang, X. Evaluation and comparison of CHIRPS and MSWEP daily-precipitation products in the Qinghai-Tibet Plateau during the period of 1981–2015. Atmos. Res. 2019, 230, 104634. [Google Scholar] [CrossRef]
  28. Joyce, R.J.; Janowiak, J.E.; Arkin, P.A.; Xie, P. CMORPH: A method that produces global precipitation estimates from passive microwave and infrared data at high spatial and temporal resolution. J. Hydrometeorol. 2004, 5, 487–503. [Google Scholar] [CrossRef]
  29. Dangol, S.; Talchabhadel, R.; Pandey, V.P. Performance evaluation and bias correction of gridded precipitation products over Arun River Basin in Nepal for hydrological applications. Theor. Appl. Climatol. 2022, 148, 1353–1372. [Google Scholar] [CrossRef]
  30. Huffman, G.J.; Bolvin, D.T.; Braithwaite, D.; Hsu, K.; Joyce, R.; Xie, P.; Yoo, S.-H. NASA global precipitation measurement (GPM) integrated multi-satellite retrievals for GPM (IMERG). Algorithm Theor. Basis Doc. ATBD Version 2015, 4, 30. [Google Scholar]
  31. Musie, M.; Sen, S.; Srivastava, P. Comparison and evaluation of gridded precipitation datasets for streamflow simulation in data scarce watersheds of Ethiopia. J. Hydrol. 2019, 579, 124168. [Google Scholar] [CrossRef]
  32. Ashouri, H.; Hsu, K.-L.; Sorooshian, S.; Braithwaite, D.K.; Knapp, K.R.; Cecil, L.D.; Nelson, B.R.; Prat, O.P. PERSIANN-CDR: Daily precipitation climate data record from multisatellite observations for hydrological and climate studies. Bull. Am. Meteorol. Soc. 2015, 96, 69–83. [Google Scholar] [CrossRef]
  33. Huffman, G.J.; Adler, R.F.; Bolvin, D.T.; Nelkin, E.J. The TRMM multi-satellite precipitation analysis (TMPA). In Satellite Rainfall Applications for Surface Hydrology; Springer: Dordrecht, The Netherlands, 2010; pp. 3–22. [Google Scholar]
  34. Huffman, G.J.; Bolvin, D.T.; Nelkin, E.J.; Wolff, D.B.; Adler, R.F.; Gu, G.; Hong, Y.; Bowman, K.P.; Stocker, E.F. The TRMM multisatellite precipitation analysis (TMPA): Quasi-global, multiyear, combined-sensor precipitation estimates at fine scales. J. Hydrometeorol. 2007, 8, 38–55. [Google Scholar] [CrossRef]
  35. Liu, J.; Zhang, W.; Nie, N. Spatial downscaling of TRMM precipitation data using an optimal subset regression model with NDVI and terrain factors in the Yarlung Zangbo River Basin, China. Adv. Meteorol. 2018, 2018, 3491960. [Google Scholar] [CrossRef]
  36. Lv, P.; Hao, H.; Wu, G. Differences in Global Precipitation Regimes between Land and Ocean Areas Based on the GPM IMERG Product. Remote Sens. 2023, 15, 4179. [Google Scholar] [CrossRef]
  37. Hou, A.Y.; Kakar, R.K.; Neeck, S.; Azarbarzin, A.A.; Kummerow, C.D.; Kojima, M.; Oki, R.; Nakamura, K.; Iguchi, T. The global precipitation measurement mission. Bull. Am. Meteorol. Soc. 2014, 95, 701–722. [Google Scholar] [CrossRef]
  38. Sorooshian, S.; Hsu, K.-L.; Gao, X.; Gupta, H.V.; Imam, B.; Braithwaite, D. Evaluation of PERSIANN system satellite-based estimates of tropical rainfall. Bull. Am. Meteorol. Soc. 2000, 81, 2035–2046. [Google Scholar] [CrossRef]
  39. Cifelli, R.; Chen, H.; Chandrasekar, V.; Xie, P. Improving Quantitative Precipitation Estimation via Data Fusion of High-Resolution Ground-based Radar Network and CMORPH Satellite-based Product. In Proceedings of the AGU Fall Meeting 2015, San Francisco, CA, USA, 14–18 December 2015. Abstracts ID H23L-01. [Google Scholar]
  40. Karki, R.; Hasson, S.u.; Schickhoff, U.; Scholten, T.; Böhner, J. Rising precipitation extremes across Nepal. Climate 2017, 5, 4. [Google Scholar] [CrossRef]
  41. Zhang, X.; Alexander, L.; Hegerl, G.C.; Jones, P.; Tank, A.K.; Peterson, T.C.; Trewin, B.; Zwiers, F.W. Indices for monitoring changes in extremes based on daily temperature and precipitation data. Wiley Interdiscip. Rev. Clim. Chang. 2011, 2, 851–870. [Google Scholar] [CrossRef]
  42. Jiang, L.; Bauer-Gottwein, P. How do GPM IMERG precipitation estimates perform as hydrological model forcing? Evaluation for 300 catchments across Mainland China. J. Hydrol. 2019, 572, 486–500. [Google Scholar] [CrossRef]
  43. Tang, G.; Clark, M.P.; Papalexiou, S.M.; Ma, Z.; Hong, Y. Have satellite precipitation products improved over last two decades? A comprehensive comparison of GPM IMERG with nine satellite and reanalysis datasets. Remote Sens. Environ. 2020, 240, 111697. [Google Scholar] [CrossRef]
  44. Hosseini-Moghari, S.-M.; Tang, Q. Validation of GPM IMERG V05 and V06 precipitation products over Iran. J. Hydrometeorol. 2020, 21, 1011–1037. [Google Scholar] [CrossRef]
  45. Chen, F.; Gao, Y.; Wang, Y.; Li, X. A downscaling-merging method for high-resolution daily precipitation estimation. J. Hydrol. 2020, 581, 124414. [Google Scholar] [CrossRef]
  46. Chen, H.; Yong, B.; Gourley, J.J.; Liu, J.; Ren, L.; Wang, W.; Hong, Y.; Zhang, J. Impact of the crucial geographic and climatic factors on the input source errors of GPM-based global satellite precipitation estimates. J. Hydrol. 2019, 575, 1–16. [Google Scholar] [CrossRef]
  47. Amjad, M.; Yilmaz, M.T.; Yucel, I.; Yilmaz, K.K. Performance evaluation of satellite-and model-based precipitation products over varying climate and complex topography. J. Hydrol. 2020, 584, 124707. [Google Scholar] [CrossRef]
  48. Mehran, A.; AghaKouchak, A. Capabilities of satellite precipitation datasets to estimate heavy precipitation rates at different temporal accumulations. Hydrol. Process. 2014, 28, 2262–2270. [Google Scholar] [CrossRef]
  49. Bai, P.; Liu, X. Evaluation of five satellite-based precipitation products in two gauge-scarce basins on the Tibetan Plateau. Remote Sens. 2018, 10, 1316. [Google Scholar] [CrossRef]
  50. Zhang, S.; Wang, D.; Qin, Z.; Zheng, Y.; Guo, J. Assessment of the GPM and TRMM precipitation products using the rain gauge network over the Tibetan Plateau. J. Meteorol. Res. 2018, 32, 324–336. [Google Scholar] [CrossRef]
  51. Shen, Y.; Xiong, A.; Wang, Y.; Xie, P. Performance of high-resolution satellite precipitation products over China. J. Geophys. Res. Atmos. 2010, 115, D02114. [Google Scholar] [CrossRef]
  52. Wang, Q.; Xia, J.; She, D.; Zhang, X.; Liu, J.; Zhang, Y. Assessment of four latest long-term satellite-based precipitation products in capturing the extreme precipitation and streamflow across a humid region of southern China. Atmos. Res. 2021, 257, 105554. [Google Scholar] [CrossRef]
  53. Chen, F.; Li, X. Evaluation of IMERG and TRMM 3B43 monthly precipitation products over mainland China. Remote Sens. 2016, 8, 472. [Google Scholar] [CrossRef]
  54. Tang, G.; Ma, Y.; Long, D.; Zhong, L.; Hong, Y. Evaluation of GPM Day-1 IMERG and TMPA Version-7 legacy products over Mainland China at multiple spatiotemporal scales. J. Hydrol. 2016, 533, 152–167. [Google Scholar] [CrossRef]
  55. Borga, M.; Anagnostou, E.N.; Frank, E. On the use of real-time radar rainfall estimates for flood prediction in mountainous basins. J. Geophys. Res. Atmos. 2000, 105, 2269–2280. [Google Scholar] [CrossRef]
  56. Dinku, T.; Connor, S.J.; Ceccato, P.; Ropelewski, C.F. Comparison of global gridded precipitation products over a mountainous region of Africa. Int. J. Climatol. J. R. Meteorol. Soc. 2008, 28, 1627–1638. [Google Scholar] [CrossRef]
  57. Huang, X.; Wang, D.; Liu, Y.; Feng, Z.; Wang, D. Evaluation of extreme precipitation based on satellite retrievals over China. Front. Earth Sci. 2018, 12, 846–861. [Google Scholar] [CrossRef]
  58. Gupta, V.; Jain, M.K.; Singh, P.K.; Singh, V. An assessment of global satellite-based precipitation datasets in capturing precipitation extremes: A comparison with observed precipitation dataset in India. Int. J. Climatol. 2020, 40, 3667–3688. [Google Scholar] [CrossRef]
  59. Yang, M.; Liu, G.; Chen, T.; Chen, Y.; Xia, C. Evaluation of GPM IMERG precipitation products with the point rain gauge records over Sichuan, China. Atmos. Res. 2020, 246, 105101. [Google Scholar] [CrossRef]
  60. Tan, M.L.; Duan, Z. Assessment of GPM and TRMM precipitation products over Singapore. Remote Sens. 2017, 9, 720. [Google Scholar] [CrossRef]
  61. Liu, C.-Y.; Aryastana, P.; Liu, G.-R.; Huang, W.-R. Assessment of satellite precipitation product estimates over Bali Island. Atmos. Res. 2020, 244, 105032. [Google Scholar] [CrossRef]
  62. Manz, B.; Páez-Bimos, S.; Horna, N.; Buytaert, W.; Ochoa-Tocachi, B.; Lavado-Casimiro, W.; Willems, B. Comparative ground validation of IMERG and TMPA at variable spatiotemporal scales in the tropical Andes. J. Hydrometeorol. 2017, 18, 2469–2489. [Google Scholar] [CrossRef]
  63. Freitas, E.d.S.; Coelho, V.H.R.; Xuan, Y.; de CD Melo, D.; Gadelha, A.N.; Santos, E.A.; Galvão, C.d.O.; Ramos Filho, G.M.; Barbosa, L.R.; Huffman, G.J. The performance of the IMERG satellite-based product in identifying sub-daily rainfall events and their properties. J. Hydrol. 2020, 589, 125128. [Google Scholar] [CrossRef]
  64. Kidd, C.; Bauer, P.; Turk, J.; Huffman, G.; Joyce, R.; Hsu, K.-L.; Braithwaite, D. Intercomparison of high-resolution precipitation products over northwest Europe. J. Hydrometeorol. 2012, 13, 67–83. [Google Scholar] [CrossRef]
  65. Xu, R.; Tian, F.; Yang, L.; Hu, H.; Lu, H.; Hou, A. Ground validation of GPM IMERG and TRMM 3B42V7 rainfall products over southern Tibetan Plateau based on a high-density rain gauge network. J. Geophys. Res. Atmos. 2017, 122, 910–924. [Google Scholar] [CrossRef]
  66. Wilheit, T.; Kummerow, C.D.; Ferraro, R. NASDARainfall algorithms for AMSR-E. IEEE Trans. Geosci. Remote Sens. 2003, 41, 204–214. [Google Scholar] [CrossRef]
  67. Wilheit, T.; Adler, R.; Avery, S.; Barrett, E.; Bauer, P.; Berg, W.; Chang, A.; Ferriday, J.; Grody, N.; Goodman, S. Algorithms for the retrieval of rainfall from passive microwave measurements. Remote Sens. Rev. 1994, 11, 163–194. [Google Scholar] [CrossRef]
  68. Prigent, C. Precipitation retrieval from space: An overview. Comptes Rendus Geosci. 2010, 342, 380–389. [Google Scholar] [CrossRef]
  69. Kidd, C. Satellite rainfall climatology: A review. Int. J. Climatol. J. R. Meteorol. Soc. 2001, 21, 1041–1066. [Google Scholar] [CrossRef]
  70. Hu, Q.; Yang, D.; Wang, Y.; Yang, H. Accuracy and spatio-temporal variation of high resolution satellite rainfall estimate over the Ganjiang River Basin. Sci. China Technol. Sci. 2013, 56, 853–865. [Google Scholar] [CrossRef]
  71. Liu, J.; Duan, Z.; Jiang, J.; Zhu, A. Evaluation of three satellite precipitation products TRMM 3B42, CMORPH, and PERSIANN over a subtropical watershed in China. Adv. Meteorol. 2015, 2015, 151239. [Google Scholar] [CrossRef]
  72. Hirpa, F.A.; Gebremichael, M.; Hopson, T. Evaluation of high-resolution satellite precipitation products over very complex terrain in Ethiopia. J. Appl. Meteorol. Climatol. 2010, 49, 1044–1051. [Google Scholar] [CrossRef]
  73. Zhang, M.; Leon, C.d.; Migliaccio, K. Evaluation and comparison of interpolated gauge rainfall data and gridded rainfall data in Florida, USA. Hydrol. Sci. J. 2018, 63, 561–582. [Google Scholar] [CrossRef]
  74. Li, Y.; Yu, W.; Wang, K.; Ma, X. Comparison of the aridity index and its drivers in eight climatic regions in China in recent years and in future projections. Int. J. Climatol. 2019, 39, 5256–5272. [Google Scholar] [CrossRef]
  75. Scheuerer, M.; Hamill, T.M. Statistical postprocessing of ensemble precipitation forecasts by fitting censored, shifted gamma distributions. Mon. Weather Rev. 2015, 143, 4578–4596. [Google Scholar] [CrossRef]
  76. Yong, B.; Liu, D.; Gourley, J.J.; Tian, Y.; Huffman, G.J.; Ren, L.; Hong, Y. Global view of real-time TRMM multisatellite precipitation analysis: Implications for its successor global precipitation measurement mission. Bull. Am. Meteorol. Soc. 2015, 96, 283–296. [Google Scholar] [CrossRef]
  77. Kumari, M.; Singh, C.K.; Bakimchandra, O.; Basistha, A. Geographically weighted regression based quantification of rainfall–topography relationship and rainfall gradient in Central Himalayas. Int. J. Climatol. 2017, 37, 1299–1309. [Google Scholar] [CrossRef]
Figure 1. The evaluation of Qinghai-Tibet Plateau (QTP) with 104 meteorological stations.
Remotesensing 15 05379 g001
Figure 2. Mean spatial distribution comparisons of indices based on amount and duration of precipitation including (a) CDD, (b) CWD, (c) R95p, (d) R99p, and (e) PRCPTOT over QTP between ground-based observations (OBS) and five SPPs for the period of 2001–2015.
Remotesensing 15 05379 g002
Figure 3. Mean spatial distribution comparisons of indices based on frequency and intensity of precipitation including (a) R10 mm, (b) R20 mm, (c) Rx1day, (d) Rx5day, and (e) SDII over QTP between OBS and five SPPs for the period of 2001–2015.
Remotesensing 15 05379 g003
Figure 4. Boxplots of (a) CC and (b) RMSE of ten annual SEPIs for five SPPs in QTP during the period 2001–2015. The three lines within each box indicate the 25th, 50th, and 75th percentiles, while the lower and upper limits indicate the minimum and maximum values, respectively.
Remotesensing 15 05379 g004aRemotesensing 15 05379 g004b
Figure 5. Histograms of (a) CC and (b) RMSE of ten seasonal SEPIs for five SPPs in the QTP during the period 2001–2015 in the QTP.
Remotesensing 15 05379 g005aRemotesensing 15 05379 g005b
Figure 6. Scatter density plots of SEPIs based on precipitation amount and duration including (a) CDD, (b) CWD, (c) R95p, (d) R99p, and (e) PRCPTOT, between OBS and five SPPs over the period 2001–2015 in the QTP.
Remotesensing 15 05379 g006
Figure 7. Scatter density plots of SEPIs based on precipitation frequency and intensity, including (a) R10 mm, (b) R20 mm, (c) Rx1day, (d) Rx5day, and (e) SDII between OBS and five SPPs over the period 2001–2015 in the QTP.
Remotesensing 15 05379 g007
Figure 8. Boxplots of three skill metrics for five SPPs (CMORPH, IMERG, PERSIANN, TRMM3B42 and TRMM3B42RT) in detecting the occurrences of the daily precipitation events (ac) and daily extreme precipitation events (df).
Remotesensing 15 05379 g008
Figure 9. Spatial distributions of three skill metrics for five SPPs (CMORPH, IMERG, PERSIANN, TRMM3B42 and TRMM3B42RT) in detecting the daily extreme precipitation events with rainfall exceeding the 75th percentile of all rainy days from 2001 to 2015 over the QTP. The average values are also provided.
Remotesensing 15 05379 g009
Figure 10. Boxplots of skill metrics for five SPPs (CMORPH, IMERG, PERSIANN, TRMM3B42, and TRMM3B42RT) depicting daily extreme precipitation events with rainfall exceeding the 75th percentile of all rainy days at a seasonal scale in the QTP.
Remotesensing 15 05379 g010
Table 1. Basic information of five SPPs.
Dataset *Time SpanResolutionCoverageReferences
CMORPH1998 to 20190.25° daily−160°S to 60°N[28,29]
IMERG-Final2000 to present0.1° daily−160°S to 60°N[30,31]
PERSIANN-CDR1983 to present0.25° daily−160°S to 60°N[32]
TRMM-3B42V71998 to present0.25° 3 h−150°S to 50°N[31,33]
TRMM-3B42RT1998 to present0.25° 3 h−150°S to 50°N[31,34]
* To enhance readability, the following abbreviations will be utilized in this paper to refer to the SPPs: IMERG-Final will be referred to as IMERG, PERSIANN-CDR as PERSIANN, TRMM-3B42V7 as TRMM3B42, and TRMM-3B42RT as TRMM3B42RT.
Table 2. Details of the selected ten SEPIs.
CategoryIndexDescriptive Name and DefinitionUnit
duration-based indicesCDDConsecutive dry days (Maximum number of consecutive dry days (rainfall below 1 mm))days
CWDConsecutive wet days (Maximum number of consecutive wet days (rainfall above 1 mm))days
amount-
based indices
R95pRainfall amount exceeded only by the top 5% of daily precipitation valuesmm
R99pRainfall amount exceeded only by the top 1% of daily precipitation valuesmm
PRCPTOTAnnual (Seasonal) total rainfall in wet daysmm
frequency-based indicesR10 mmNumber of days with rainfall equal to or exceeding 10 mmdays
R20 mmNumber of days with rainfall equal to or exceeding 20 mmdays
intensity-based indicesRx1dayMaximum 1-day rainfall amountmm day−1
Rx5dayMaximum 5-day consecutive rainfall amountmm 5 day−1
SDIISimple Daily Intensity Index (Total rainfall divided by the number of wet days)mm day−1
Table 3. Details of three statistical metrics in this study.
Short NameDescriptive NameFormula *Values RangePerfect Value
CCThe correlation coefficient C C = i = 1 n ( x i x ¯ ) ( y i y ¯ ) i = 1 n ( x i x ¯ ) 2 i = 1 n ( y i y ¯ ) 2 [−1, 1]1
RMSEThe root mean square error R M S E = 1 n i = 1 n ( x i y i ) 2 [0, +∞)0
KGEModified Kling–Gupta efficiency score K G E = 1 ( R 1 ) 2 + ( α 1 ) 2 + ( β 1 ) 2
α = μ f μ o , β = σ f σ o
(−∞, 1]1
* where n represents the total count of weather stations, xi represents the SPP value at station i, yi represents the ground-based observation data value at station i, x ¯ represents the average SPP value across all stations, and y ¯ represents the average ground-based observation data value across all stations. The formula for the KGE includes various parameters: R represents the CC between the reference and target, α represents the variability ratio, β represents the bias ratio, ( μ f , σ f ) represent the expectation and standard deviation of the simulated, respectively, ( μ o ,   σ o ) represent the expectation and standard deviation of the measured precipitation.
Table 4. Details of three categorical skill metrics.
Short NameDescriptive NameFormula *Values RangePerfect Value
PODThe probability of detection P O D = H H + M [0, 1]1
FARThe false alarm ratio F A R = F H + F [0, 1]0
CSIThe critical success index C S I = H H + F + M [0, 1]1
* where H (hit) represents the count of rainfall events detected simultaneously detected in both the ground-based observations and the products; M (miss) denotes the count of rainfall events observed in the observations but not detected by the products; and F (false) represents the count of rainfall events detected by the products but not observed in the observations [23].
Table 5. Results of annual SEPIs across QTP *.
IndexUnitCC
CMORPHIMERGPERSIANNTRMM3B42TRMM3B42RT
CDDday0.020.270.240.270.03
CWDday0.080.270.140.160.13
R95pmm0.200.360.230.330.21
R99pmm0.100.200.080.160.08
PRCPTOTmm0.240.750.550.650.32
R10 mmday0.210.450.350.420.28
R20 mmday0.140.270.170.250.19
Rx1daymm0.100.170.080.170.05
Rx5daymm0.210.370.240.340.17
SDIImm/day0.160.410.290.370.23
IndexUnitRMSE
CMORPHIMERGPERSIANNTRMM3B42TRMM3B42RT
CDDday71.2356.9250.4150.0864.03
CWDday7.294.378.084.416.84
R95pmm79.4967.58102.7584.47272.57
R99pmm46.0543.3153.7749.01125.80
PRCPTOTmm178.89125.74266.24153.31708.61
R10 mmday6.595.699.576.0220.49
R20 mmday2.522.774.123.3513.84
Rx1daymm14.2615.6215.6116.6160.41
Rx5daymm24.6122.4137.9727.43118.04
SDIImm/day1.531.181.431.284.99
* The bold represents the best performance.
Disclaimer/Publisher’s Note: The statements, opinions and data contained in all publications are solely those of the individual author(s) and contributor(s) and not of MDPI and/or the editor(s). MDPI and/or the editor(s) disclaim responsibility for any injury to people or property resulting from any ideas, methods, instructions or products referred to in the content.

