1. Introduction
The Mediterranean basin is a particularly challenging mid-latitude area for remote rainfall estimation, as precipitation may be caused by weather systems of different natures, such as mesoscale convective systems, intense extratropical cyclones, and tropical-type cyclones [
1,
2,
3,
4,
5]. This fact, coupled with the uncertainties involved in precipitation projections and the expected intensification of extreme precipitation in the coming decades [
6,
7], makes studies in this area an important issue [
8]. Reliable detection of the most intense precipitation events is crucial for the development of early warning systems, disaster management strategies, and water resource management.
Satellite precipitation estimates such as the Integrated Multi-satellitE Retrievals for GPM (IMERG) products provide valuable information over areas not covered by ground-based weather radars or rain gauge networks [
9]. The main basis of IMERG is to incorporate, merge, and intercalibrate various infrared and microwave (MW) observations [
10]. The resulting high spatiotemporal resolution (0.1° × 0.1° and 30 min) on a global scale makes IMERG one of the most interesting products for the study of convective phenomena that generate extreme precipitation [
11,
12,
13]. Version 06B (V06B) spans a period of more than 20 years with three different latency runs targeting disaster response (Early), agricultural modelling and public health applications (Late), and research (Final). The validation of IMERG is of paramount importance for understanding and addressing estimation errors, both for algorithm improvements and for documenting the capabilities and limitations of further applications developed by the scientific and operational communities [
14]. Several studies have confirmed the ability of IMERG to reproduce the global spatial characteristics of precipitation fields on annual and seasonal scales [
15,
16,
17]. However, spaceborne precipitation estimates at shorter timescales, particularly in the case of heavy rainfall events, pose more challenges, with a general tendency to underestimate [
13,
17,
18,
19,
20,
21,
22]. In addition, despite the large amount of work aimed at evaluating IMERG in different regions around the world, the authors of [
23] reviewed a number of limitations, gaps, and suggestions provided in recent studies. A relevant conclusion they reported was that the evaluation of IMERG products at multiple scales simultaneously, rather than constraining the analysis to a single spatial and temporal resolution, could help to better understand how the accuracy and errors vary with spatiotemporal aggregation and under different precipitation conditions. The latter can be addressed for different types of microphysical features of precipitating clouds, as well as the effect of different sensors contributing to the final IMERG products. Indeed, the works by [
24,
25] recommend an individual evaluation of the underlying passive microwave (PMW) and infrared (IR) sources to detect error cancelation effects. Some works, such as [
12,
26] have addressed issues directly related to cloud microphysics in the retrieval process, as well as the behavior of the different sensors contributing to the IMERG. From this perspective, they recommend extending these studies to different regions based on their own characteristics.
Based on these considerations and taking as a reference a previous study comparing IMERG products at different time scales with a dense rain gauge network over Catalonia on the northeast of the Iberian Peninsula, the objective of this study was to evaluate IMERG V06B in the estimation of heavy rainfall events at the daily and sub-daily scales in this region considering different intensity thresholds. The validation strategy further seeks to identify the contribution of different sensors (IR and PMW) that contribute to IMERG retrievals and, in a subsequent step, to identify the linkage of various microphysical properties of the precipitating cloud top in the estimation of heavy rainfall. Semi-hourly temporal evaluation based on IMERG sources and cloud properties can provide valuable information on the behavior, strengths, and weaknesses of IMERG in the detection of such events.
The remainder of this paper is organized as follows.
Section 2 provides a detailed description of the methodology, data, and assessment metrics used.
Section 3.1 describes the different intensity thresholds found for each aggregation period, according to the methodology introduced in
Section 2.
Section 3.2 compares the rain gauge observations and IMERG estimates at different time scales under different intensity thresholds.
Section 3.4 focus on the half-hourly scale, considering sensor contributions and their relationship with cloud microphysical properties. The most significant results are discussed in
Section 4, and a summary of the most relevant aspects is provided in
Section 5.
2. Materials and Methods
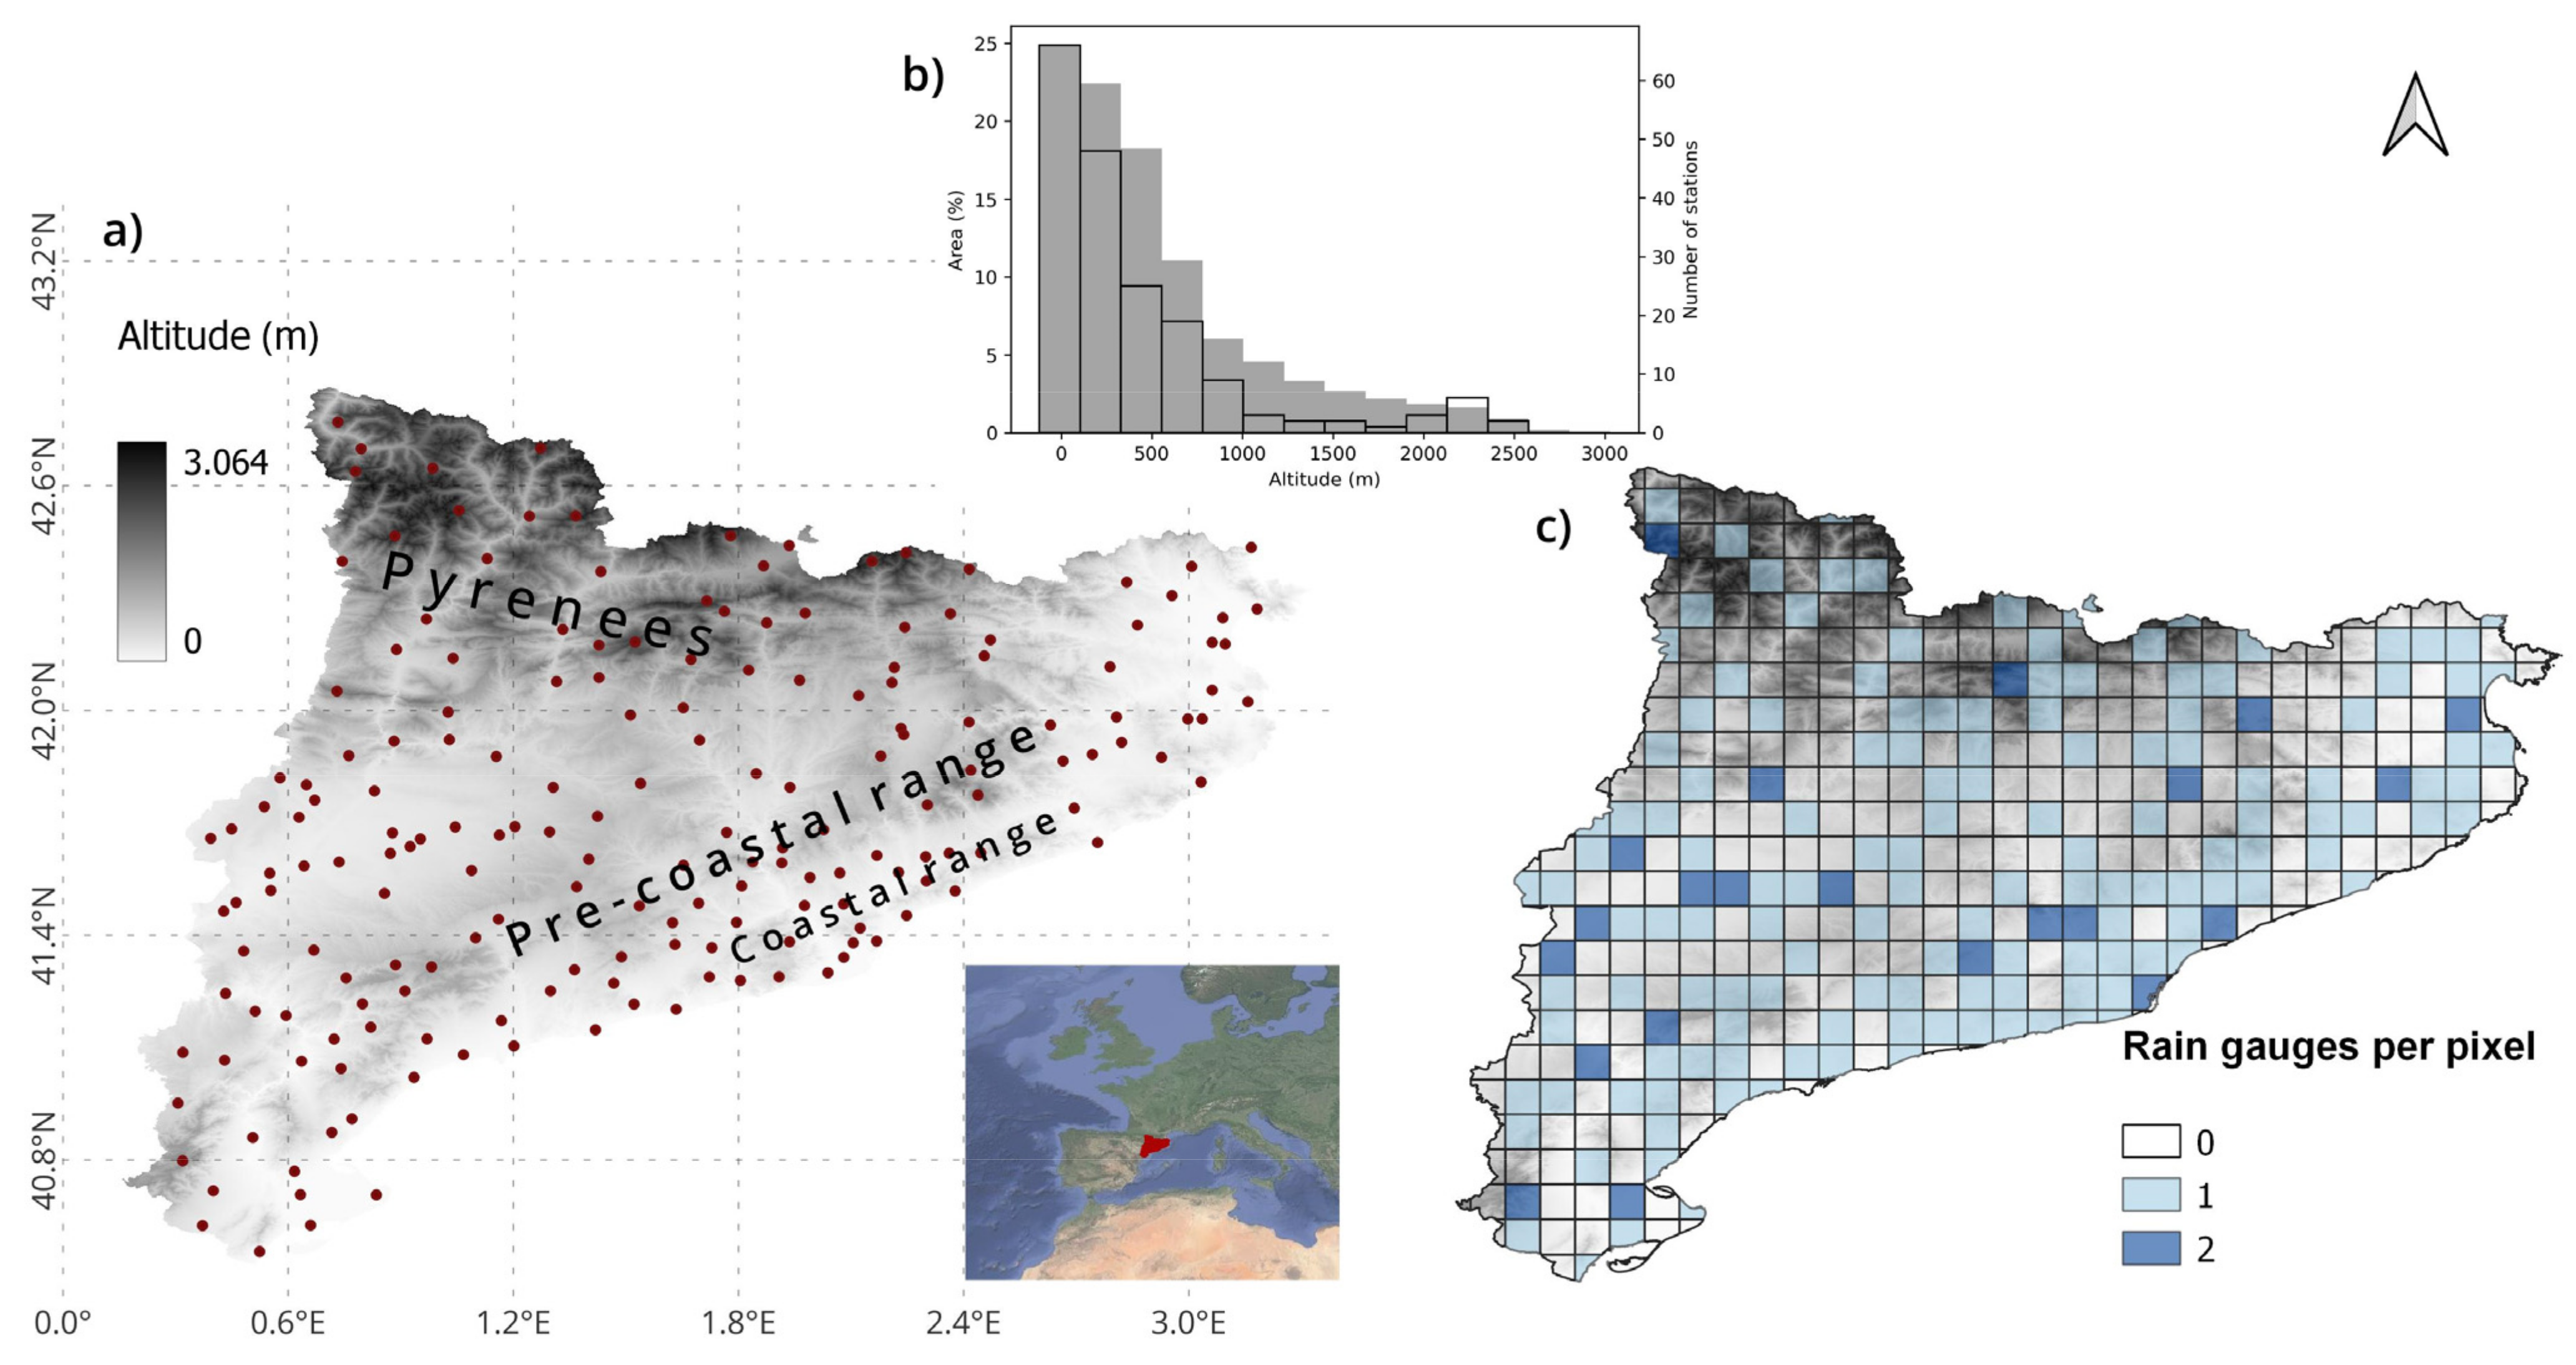
2.1. Study Area
The study area covers the region of Catalonia, located in the northeast of the Iberian Peninsula (southwestern Europe,
Figure 1). With approximately 32,107 km
2, it is characterized by a relatively wide range of climates derived from its latitudinal situation, the influence of the Mediterranean Sea, and complex orography [
27]. It is limited to the north by the Pyrenees mountains with elevations exceeding 3000 m ASL, whereas the inland area is characterized by mostly flat terrain with a few orographic contrasts resulting from the erosion of the Ebro River and its tributaries. These irregularities generate a marked average annual rainfall gradient that ranges between 350 mm in inland plains and over 1200 mm in the Pyrenees Mountains. The number of rainy days range from approximately 35 days on the southern coast to 135 days in the northwest Pyrenees (
Figure 1). In addition, the coastal and pre-coastal mountain ranges—oriented northeast to southwest toward the Mediterranean Sea—may enhance the pluviometric effects of Mediterranean cyclogenesis along the coast, which favors the occurrence of heavy rainfall, flash floods, and complex mesoscale meteorological events [
28,
29,
30], especially during autumn. The combination of these characteristics represents a challenge for the remote sensing of precipitation from satellites, ground-based weather radar, and traditional measurements from rain gauge stations [
31,
32].
2.2. Datasets
2.2.1. GPM IMERG V06B Data
The GPM core satellite and the rest of the GPM constellation satellites contribute to the IMERG algorithm [
10], where data are used to calibrate, fuse, and interpolate precipitation estimates from several microwave and infrared sensor sources every 30 min, at a spatial resolution of 0.1° × 0.1° and global coverage from −90° S to 90° N latitude. The GPM core satellite has a dual-frequency precipitation radar and 13-channel PMW GMI imager. The IMERG Early and Late V06B Level 3 data with latencies of 4 h and 14 h, respectively, were considered in this study focused on the low-latency IMERG products. The IMERG Final run, with 3.5 months’ latency required for gauge data climatological adjustment, was discarded due to its much higher latency and because it provided worse results for heavy rainfall at the daily and sub-daily scales according to some studies [
17,
33].
The IMERG algorithm starts from an initial calibration of all PMW sensors associated with the GPM Combined Radar-Radiometer (CORRA) precipitation estimates and merges them from their original spatial resolution into the IMERG grid [
14]. In areas without a direct PMW pass, these are spatiotemporally transformed forward in the Early version and backward and forward in the Late product using numerical model-derived motion vectors of total column water vapor (through the so-called Climate Prediction Center morphing (MORPH) method) [
34]. Beyond a forecast time of ± 30 min from near-direct PMW observation, PMW-calibrated precipitation estimates from geostationary IR satellites via Kalman filter principles are included [
14,
35].
IMERG semi-hourly NetCDF files (downloaded from
https://disc.gsfc.nasa.gov/, accessed on 13 October 2023) contained explicit information on the data type used in the precipitation estimate through the “PrecipitationCal” variable. In this study, we consider four categories associated with each precipitation estimate: (1) direct PMW overpasses (PMW-direct), (2) MORPH, (3) combination of PMW and transformed IR, and (4) direct IR. These categories were obtained from the IMERG variables “HQprecipitation” (high-quality precipitation from all available passive microwave sources) and “IRKalmanFilterWeight” (IR-data weights in MW Kalman smoothing). While the former is used to identify direct PMW, the latter quantifies the weight of IR observations wherever PMW direct is absent and varies from 0% (MORPH-only) to 100% (IR-only) [
12].
2.2.2. Rain Gauge Data
The IMERG products were validated using rain gauge records (hereafter RG) from the network of automatic stations of the Meteorological Service of Catalonia (SMC). Semi-hourly records with a resolution of 0.1 mm were obtained in the UTC time between 1 March 2014 and 11 October 2023, a period starting with the availability of GPM data. A quality control scheme was applied to SMC rain gauge records based on comparisons with nearby stations and correlation analysis [
36,
37]. Of the 417 IMERG pixels covering the Catalonia region, 164 were associated with 186 rain gauges considered in this study. According to the spatial distribution, 40% of the IMERG pixels contained at least one rain gauge, and 5% contained two rain gauges (
Figure 1). This corresponds to an overall density of 1.13 rain gauges per 100 km
2, which represents more than six times the threshold recommended by the World Meteorological Organization (WMO) for inland flat and undulating areas [
38].
2.2.3. CMIC NW SAF Product
The relationship between heavy rainfall events recorded both by rain gauges and IMERG estimates with cloud top microphysical properties was investigated from data provided by the Cloud Microphysics (CMIC) product, developed by the EUMETSAT’s Nowcasting Satellite Application Facility (NWC SAF) [
39].
CMIC was developed to support nowcasting applications, allowing the characterization of rapidly developing storms [
40]. In this study, four CMIC variables were used: (1) cloud top phase, of which only those time intervals with liquid, ice, or mixed presence are analyzed; (2) cloud top effective radius (
), defined as the weighted mean of the droplet size distribution; (3) cloud optical thickness (COT); and (4) cloud liquid water path (LWP) and cloud ice water path (IWP), which quantify the vertically integrated amount of liquid and frozen water droplets, respectively. These two quantities can be estimated from
where the subindices
l and
i refer to liquid and ice, respectively, and
and
represent the density and cloud top effective particle radius of liquid water and ice [
12].
The CMIC product has a spatial resolution of 3 km and 15 min of temporal resolution. To compensate for spatial differences in the rain gauges and IMERG, the values were taken at the closest grid point to each meteorological station. In terms of temporal resolution, the 15 min CMIC data were aggregated to a 30 min resolution. The cloud top phase variable was aggregated according to the criteria described in
Appendix A,
Table A1, and for the rest of the variables, the mean value of the two 15 min intervals was taken. When one 15 min interval detected ice and the other liquid, the phase was defined as mixed. For these cases, the variable total water path (TWP) was generated as the sum of the IWP and the LWP recorded in the two 15 min intervals that contributed to the semi-hourly aggregation.
2.3. Methodology
2.3.1. Definition and Selection of Extreme Precipitation Events
The IMERG validation process performed here was based on a pixel-to-point comparison [
18,
41] applied in such a way that information was obtained from the grid closest to each weather station. This method allows a pairwise comparison between the concurrent precipitation data of the RG and IMERG pixels at each time step. This approach avoids uncertainties arising from interpolating RG data in a region characterized by high orographic and climatic variability [
17]. As mentioned in
Section 2.2.2, the IMERG pixels contained two rain gauges, but as the gauge data were independent, they were treated as two different data points.
The first part of this study focused on evaluating the behavior of the IMERG Early and Late versions in the estimation of intense precipitation, considering different sub-daily temporal aggregations in the period 2014–2023. Temporal resolutions of 1, 3, 6, 9, 12, and 24 h were obtained from the aggregation of the semi-hourly accumulations of the initially created database. This database was constructed with records of at least 0.1 mm accumulated in 30 min present in both the rain gauges and IMERG. Note that 0.1 mm is the minimum precipitation threshold detected by the RG and GPM Ka band radar [
42].
To obtain the different extreme precipitation thresholds for different temporal aggregations, the method described by [
43] and recent studies [
44,
45,
46,
47] was applied. This method is based on the fact that a linear relationship between the maximum precipitation amount P and the temporal duration D in a log-log space can be found, so that the data follow a power-law equation:
where
a is the prefactor and
b is the scaling coefficient [
43]. All rain gauge data for the study period and region were used to obtain the fitted function.
Instead of directly using the curve fit of the extreme data to characterize the extreme precipitation records in Catalonia, the upper envelope method was used, that is, a curve that was greater than or equal to all the data, with a power-law scaling line. The specific method for deriving the envelope line is described in the work of [
46], and allows the generation of curves that estimate the maximum precipitation amounts for different time periods based on observed records. The scaling law of the adjusted extreme precipitation derived from Equation (2), expressed as a linear function, is
Once the upper envelope fitting curve corresponding to the reference data from the rain gauges was created, proportional curves (1%, 5%, 10%, and 18%) of equal slope were produced to generate various intensity thresholds. The results and thresholds selected using this method are presented in
Section 3.1.
The second part of the paper focuses on the evaluation of only the IMERG Early product and sources at half-hourly resolution under different extreme precipitation criteria based on the envelope curve. The results were stratified according to the characteristics of the precipitating cloud phase: liquid, ice, or mixed. Owing to the availability of the NWC SAF data, 17 case studies between 2021 and 2023 were selected for this analysis. The selected cases were characterized by extreme precipitation events in both RG and IMERG at multiple weather station locations, exceeding the heavy rainfall threshold set by the Meteorological Service of Catalonia (20 mm in 30 min). In this way, the sample was selected to allow for a detailed study of the properties of clouds related to episodes of intense precipitation observed at ground level by RG and estimated by IMERG.
2.3.2. Point-Pixel Validation Measures
IMERG products were validated using two approaches: categorical scores based on contingency tables and continuous statistical scores. The first approach considered a 2 × 2 contingency table with four possible scenarios for a given threshold (see
Table 1), from which several categorical scores were computed (
Table 2): the probability of detection (POD), representing the proportion of events correctly detected by IMERG out of the total observed rainfall events, and the false-alarm ratio (FAR) representing the fraction of false detected rainfall events.
The continuous statistical scores used were Spearman’s correlation coefficient, BIAS, Rbias, MAE, and RMSE (
Table 3). BIAS is a measure of the average error between IMERG and RG, while Rbias describes the systematic error. Positive (negative) values of BIAS and Rbias denote overestimation (underestimation) of the satellite products. MAE shows the average size of the absolute errors and, finally, RMSE measures the size of the average error, giving more weight to large errors without showing the direction of deviation between IMERG and RG.
3. Results
3.1. General Characteristics of Extreme Precipitation Events
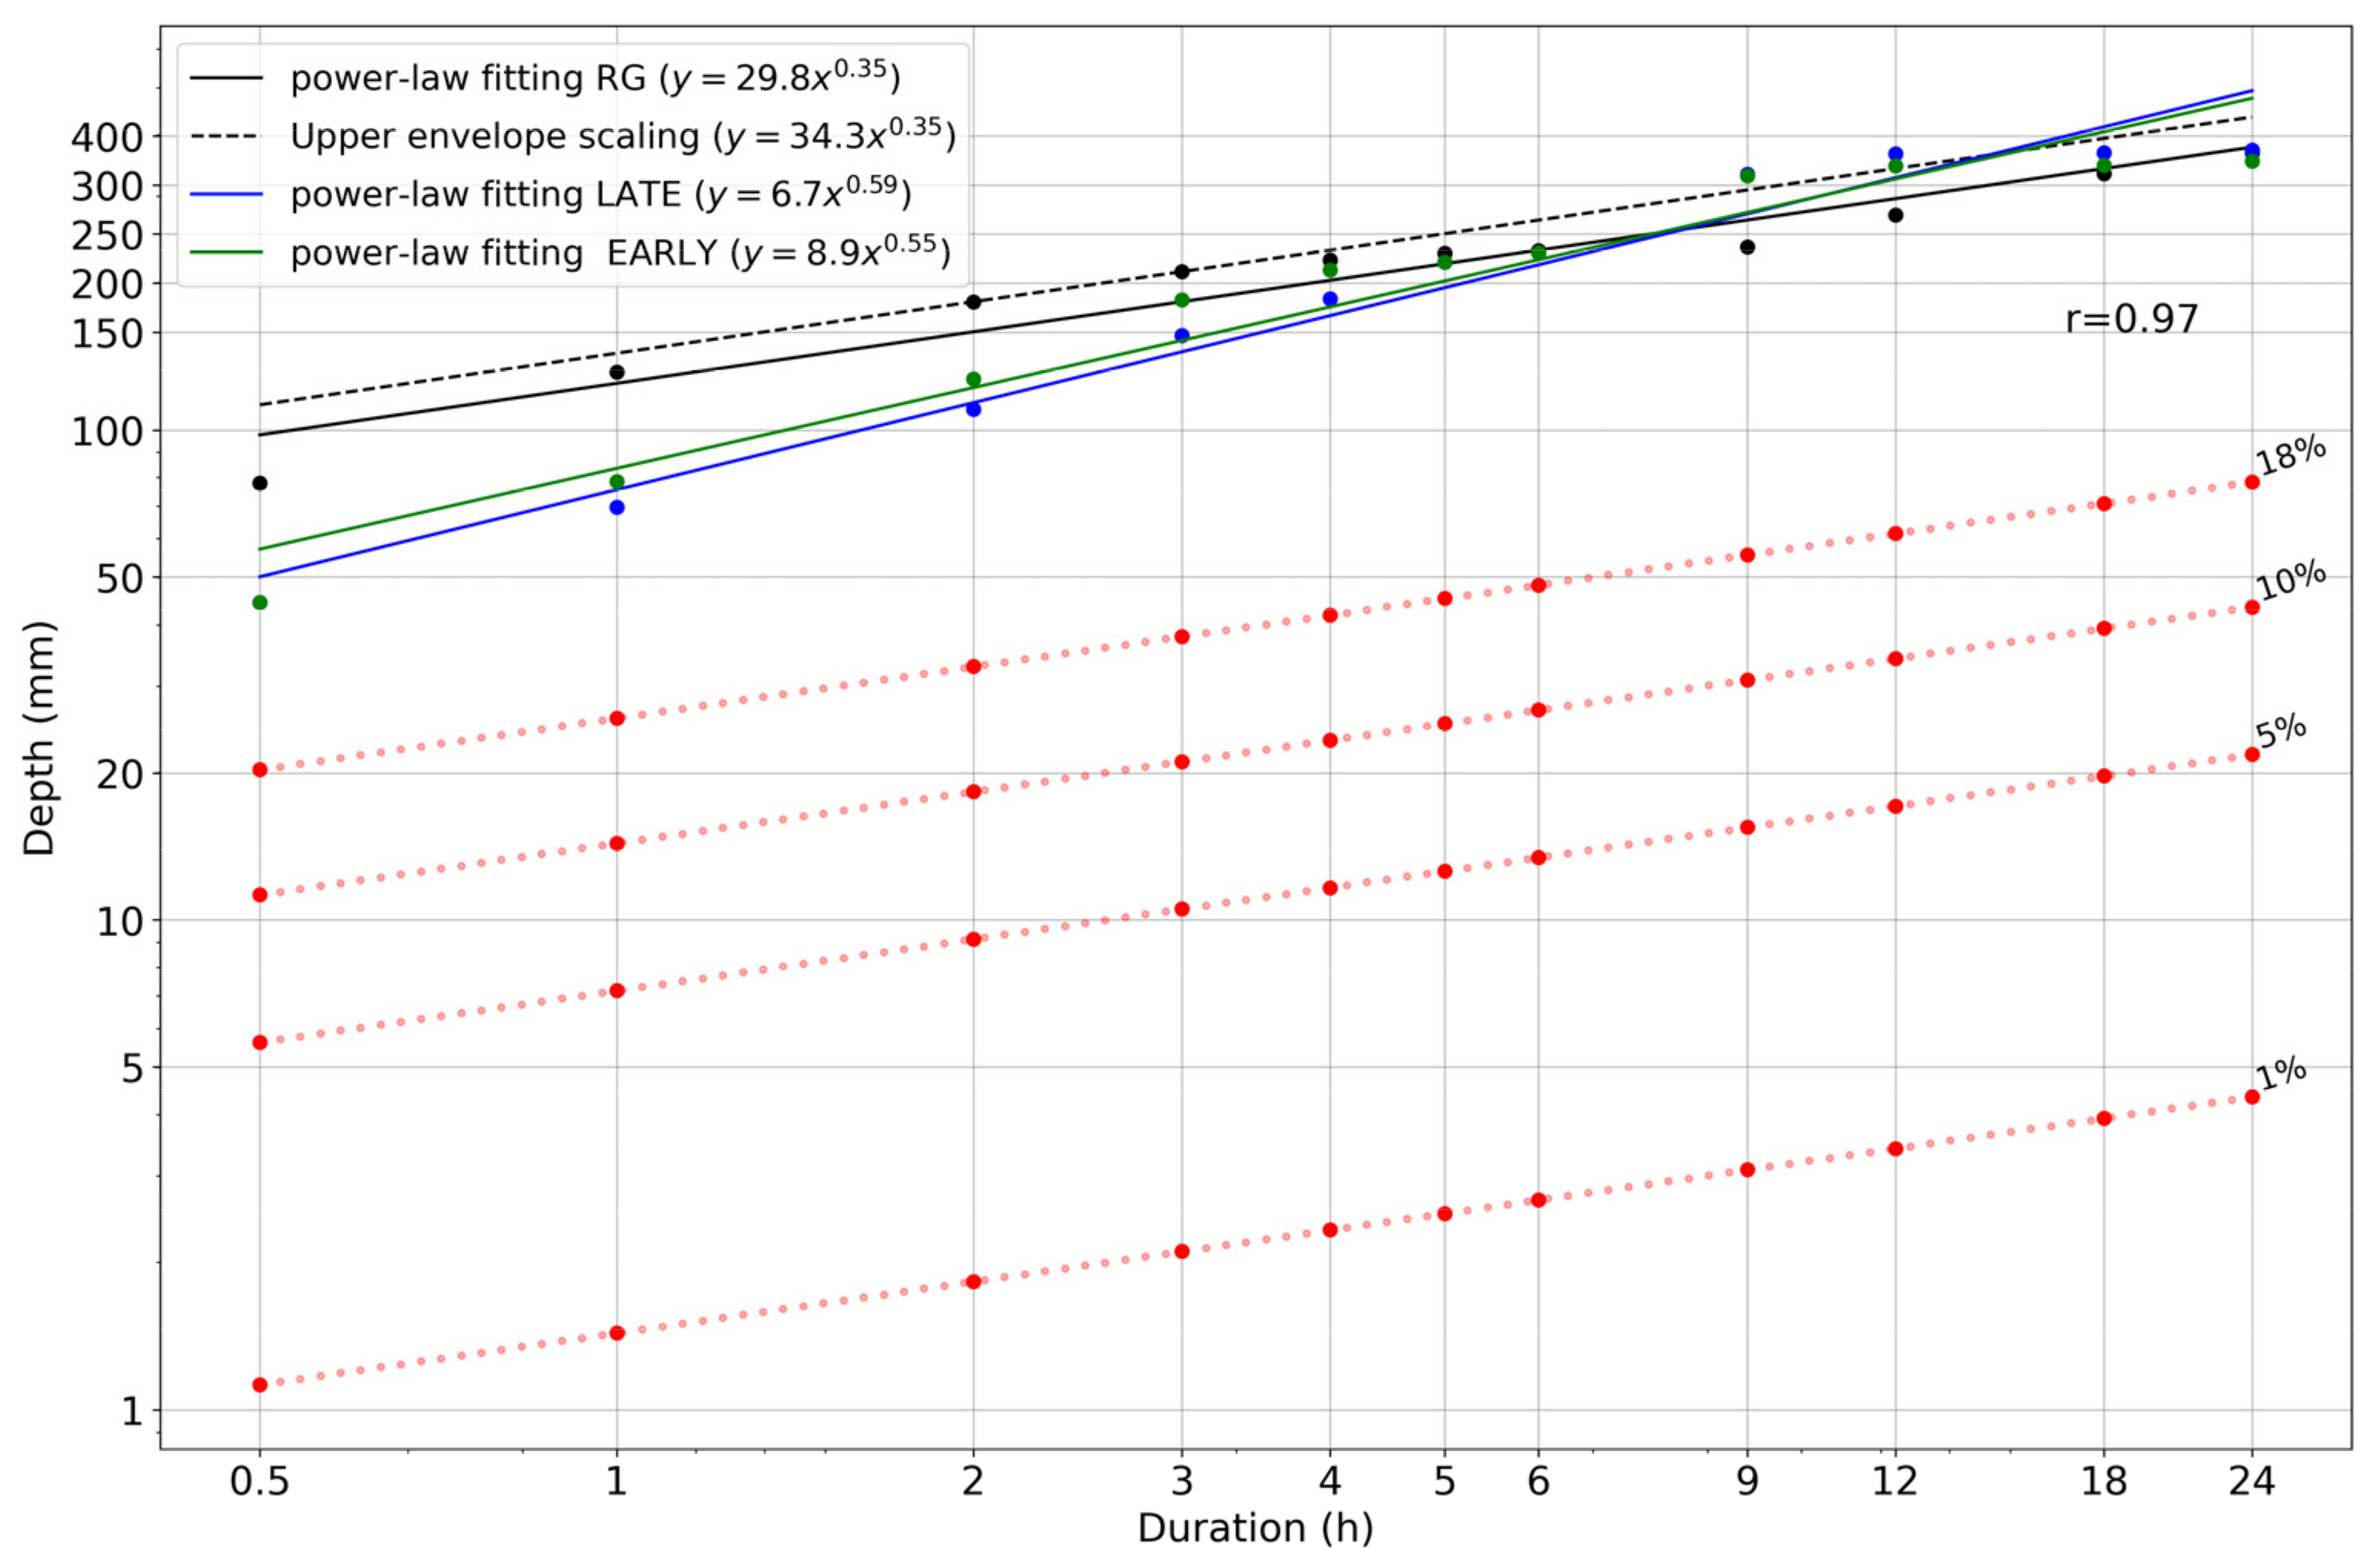
Figure 2 shows the log-log plot of the precipitation accumulations or depth (mm) versus duration (D) in minutes of the extreme precipitation records from 2014 to 2023 in Catalonia from both the RG and IMERG Early and Late runs taken at the grid points closest to the location of the rainfall events. In all three datasets, the linear fit (Equation (2)) was calculated by least-squares linear regression and expressed in the power law. Using the method described in
Section 2.3.1, the envelope curve for the RG records was also plotted.
A graphical inspection allows us to detect a great similarity between the maximum values estimated by IMERG Early and Late. Both products show a large underestimation of the maximum threshold detected by the RG in time aggregations below 6 h, which is more marked on the half-hourly scale. In fact, from 6 h to 18 h, IMERG showed a change in the trend of overestimating precipitation records compared to the upper envelope curve of RG. The higher exponent of
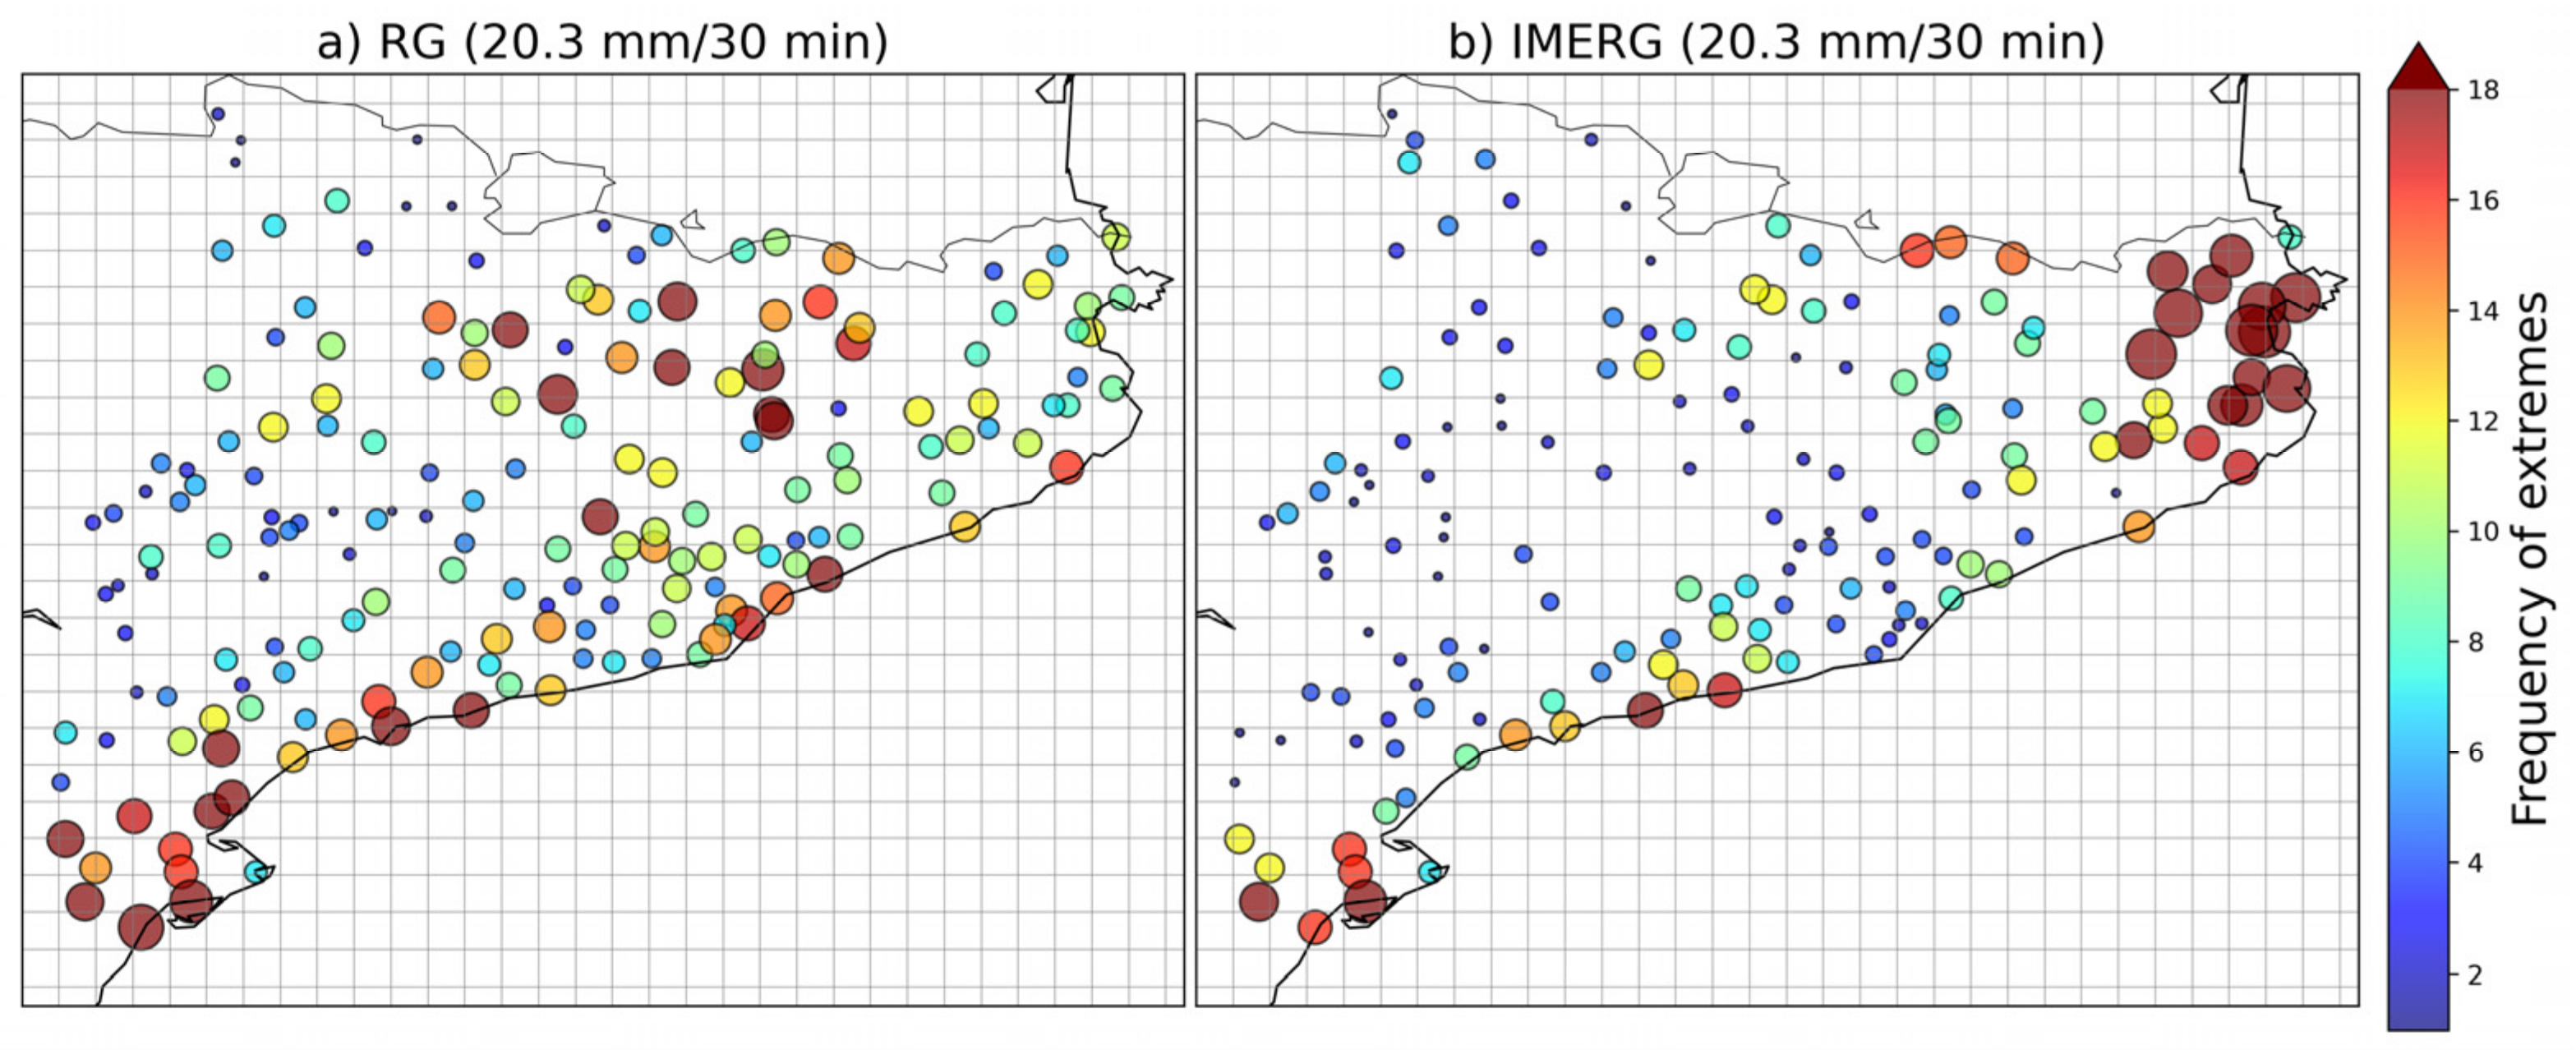
b in the fitting equation of the IMERG products suggests that satellite estimates of extreme rainfall increase at a higher rate with duration than RG extreme precipitation records. This is related to the higher frequency of extreme precipitation events (
Figure 3), especially in northeastern Catalonia. It should be mentioned that these IMERG extremes are only evaluated on the pixels closest to the location of RG rainfall events, discarding other IMERG values that can be higher.
Finally, 1%, 5%, 10%, and 18% of the envelope curve of the RG were considered to obtain the threshold values of the reference intensity in each temporal aggregation.
Table 4 lists the precipitation threshold values that were used as references for each temporal aggregation. Note that 18% of the envelope curve at the half-hourly scale represents an amount of 20 mm in 30 min, a considerable precipitation amount at this scale, and a value very close to the reference threshold for short-term heavy rainfall considered by the Meteorological Service of Catalonia [
48].
3.2. Evaluation of IMERG at Multiple Time Scales and Intensity Thresholds
The evaluation of IMERG Early and Late products compared with RG records was performed for selected sub-daily and daily time aggregations.
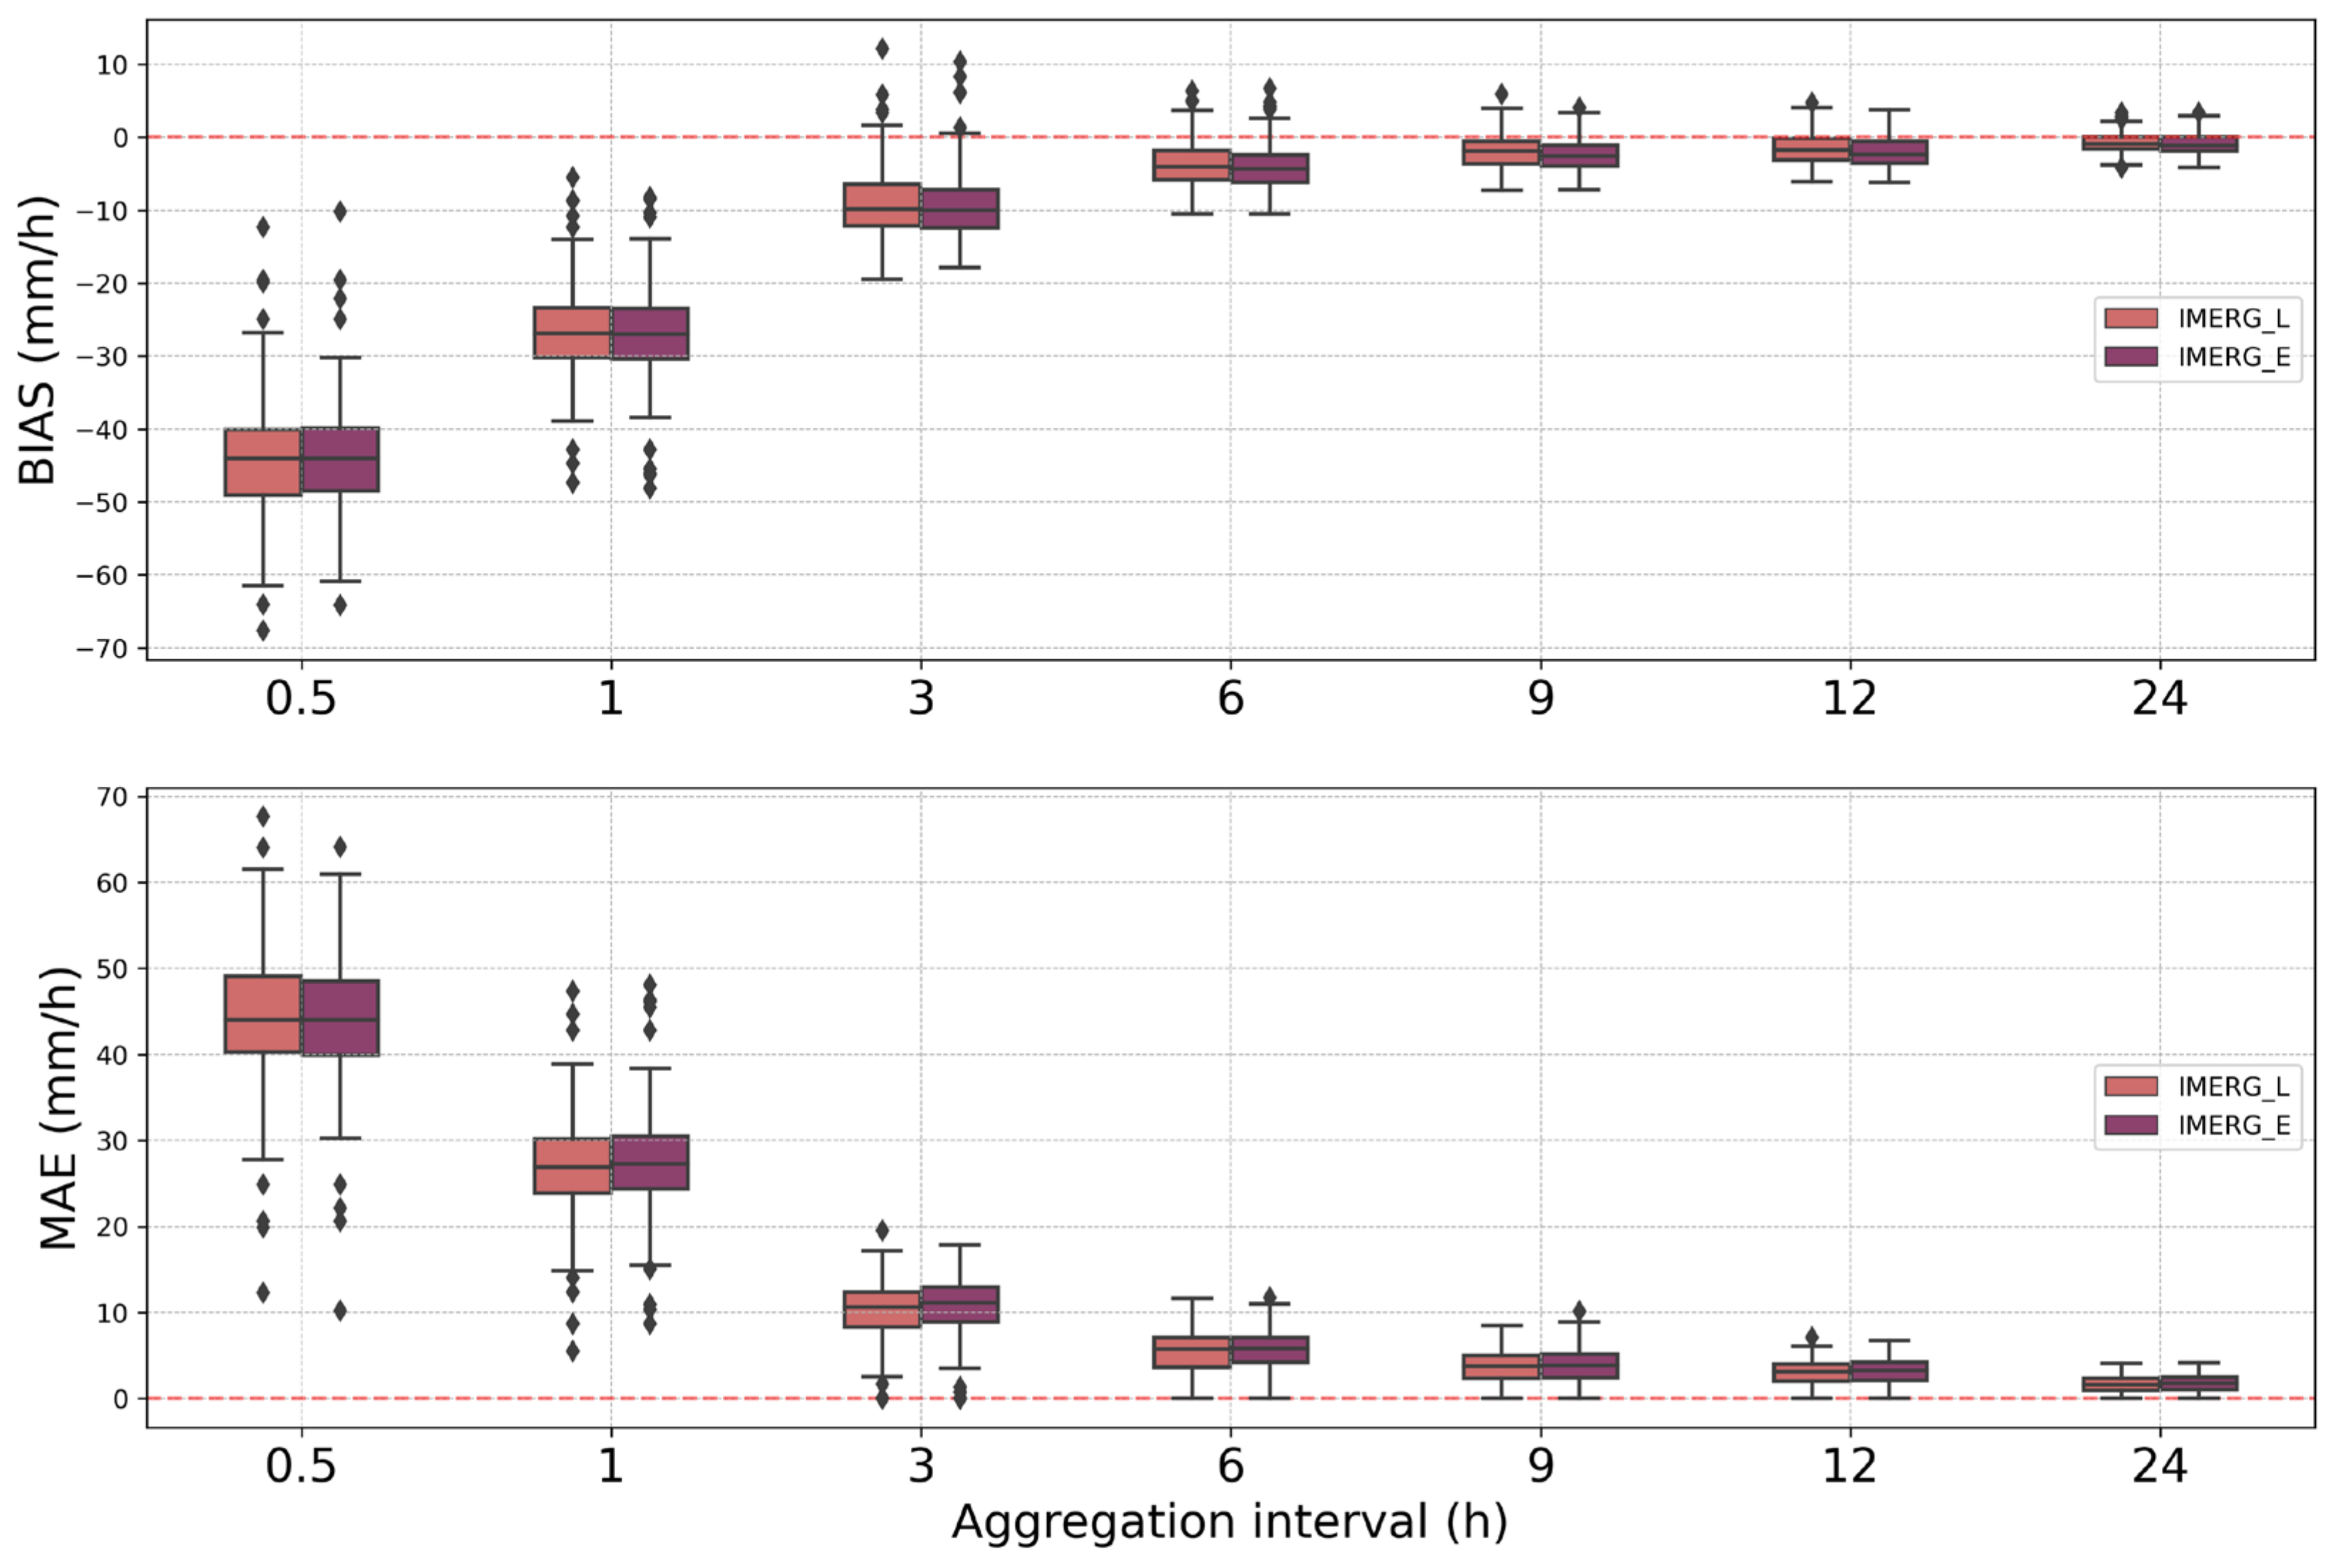
Figure 4 shows the boxplots of BIAS and MAE for both products, considering a precipitation intensity threshold of 18% of the envelope curve. In this figure, the first quartile, median, and third quartile of the distribution are identifiable considering errors calculated at all stations in the study region; boxplot whiskers extend to the 1.5 interquartile range and outliers extending further away are also plotted. For consistency between the aggregations, the results are shown in mm/h.
According to the BIAS, there was a tendency for IMERG rainfall values to be underestimated, decreasing for longer aggregation periods. Underestimation increased as the precipitation intensity threshold increased. The best results with values between −0.07 and −0.03 mm/h of BIAS and 0.74 mm/h of MAE are observed at daily scales for the lowest intensity threshold evaluated (1%) (see
Table 5). A similar result was found when examining the Rbias values, although the underestimation varied more (
Table A2,
Appendix B). On the other hand, the worst results were observed on a semi-hourly scale, which shows the deficiencies of IMERG in the quantification of extreme precipitation at the shortest time resolution available. This agrees with previous studies [
13,
19,
49,
50] where similar results were obtained.
A good approximation for the detection of heavy precipitation with near real-time application was obtained for aggregation intervals equal to or greater than 6 h, with an average error mean absolute of 1.36 mm/h for a 1% threshold and 5.44 mm/h for an 18% threshold. Although IMERG Late shows slight improvements over the Early version for most aggregations, it is not possible to identify a statistically significant difference. The use of one over the other would be conditioned to the advantages that the latency in which the data are generated may offer.
Additional analyses stratifying the results according to seasonality, the altitude of the stations, climatic regime, and terrain orography for each temporal aggregation (not shown) did not show remarkable differences.
Categorical Scores
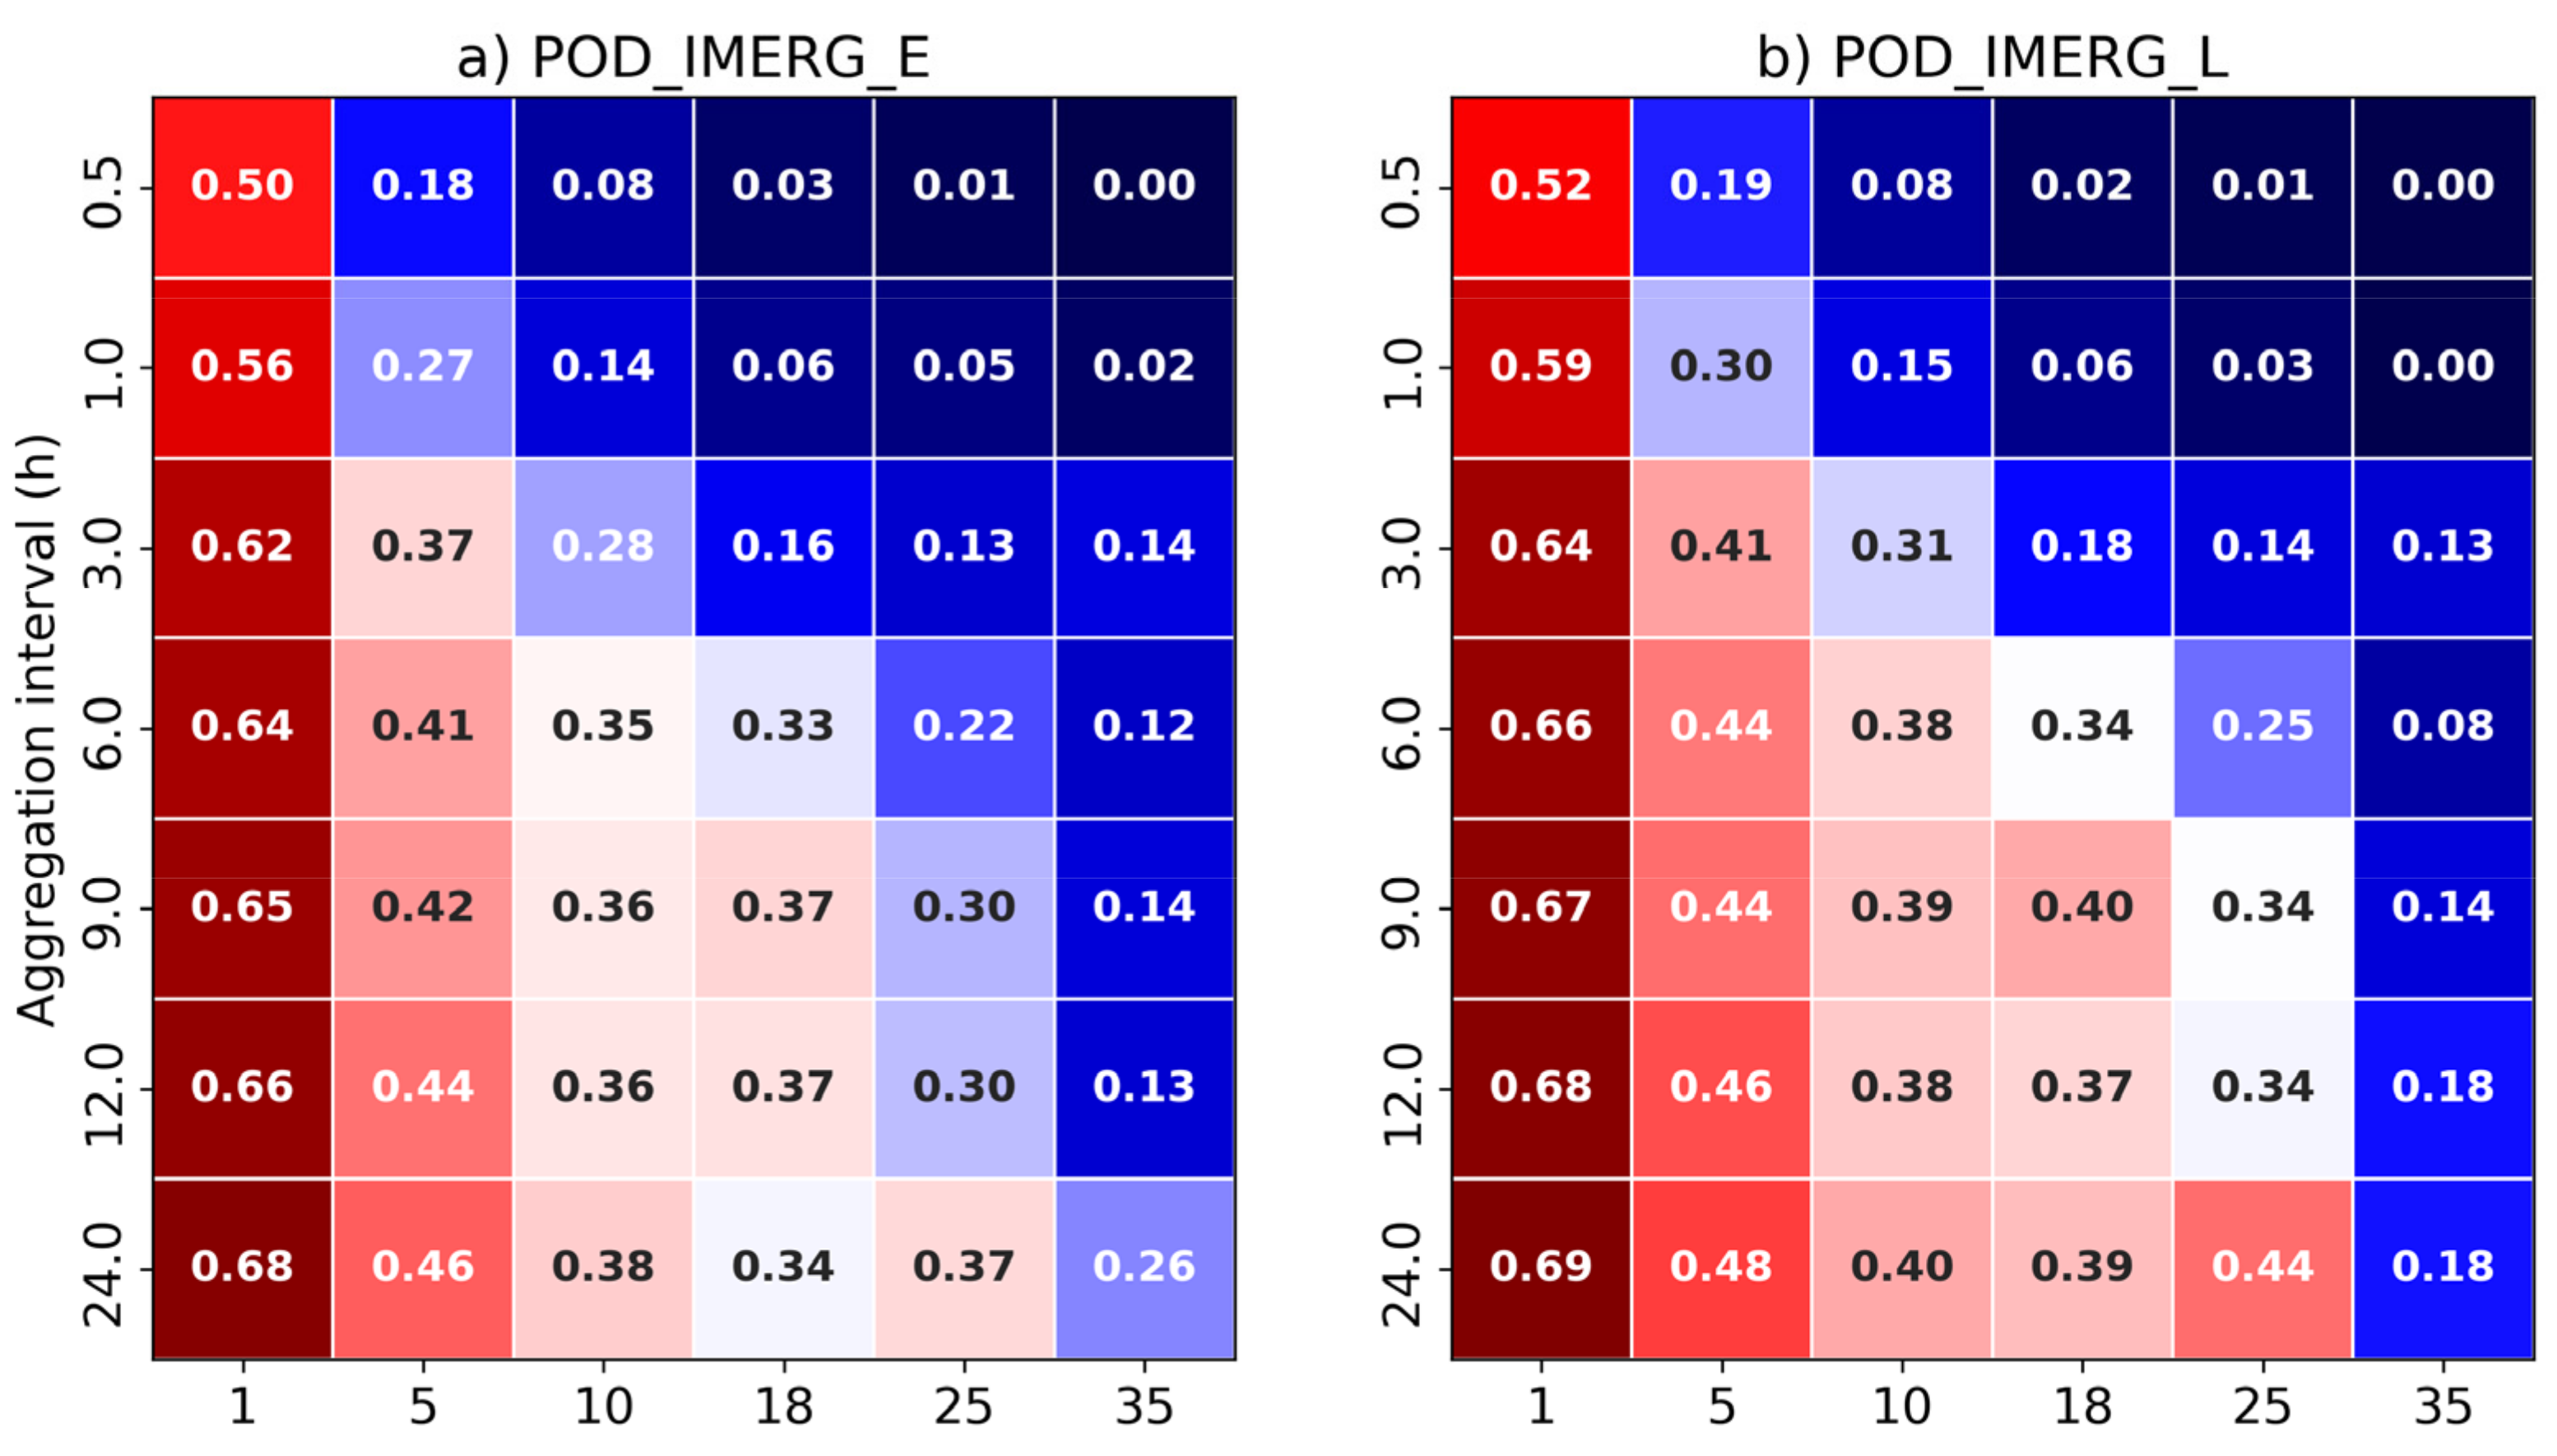
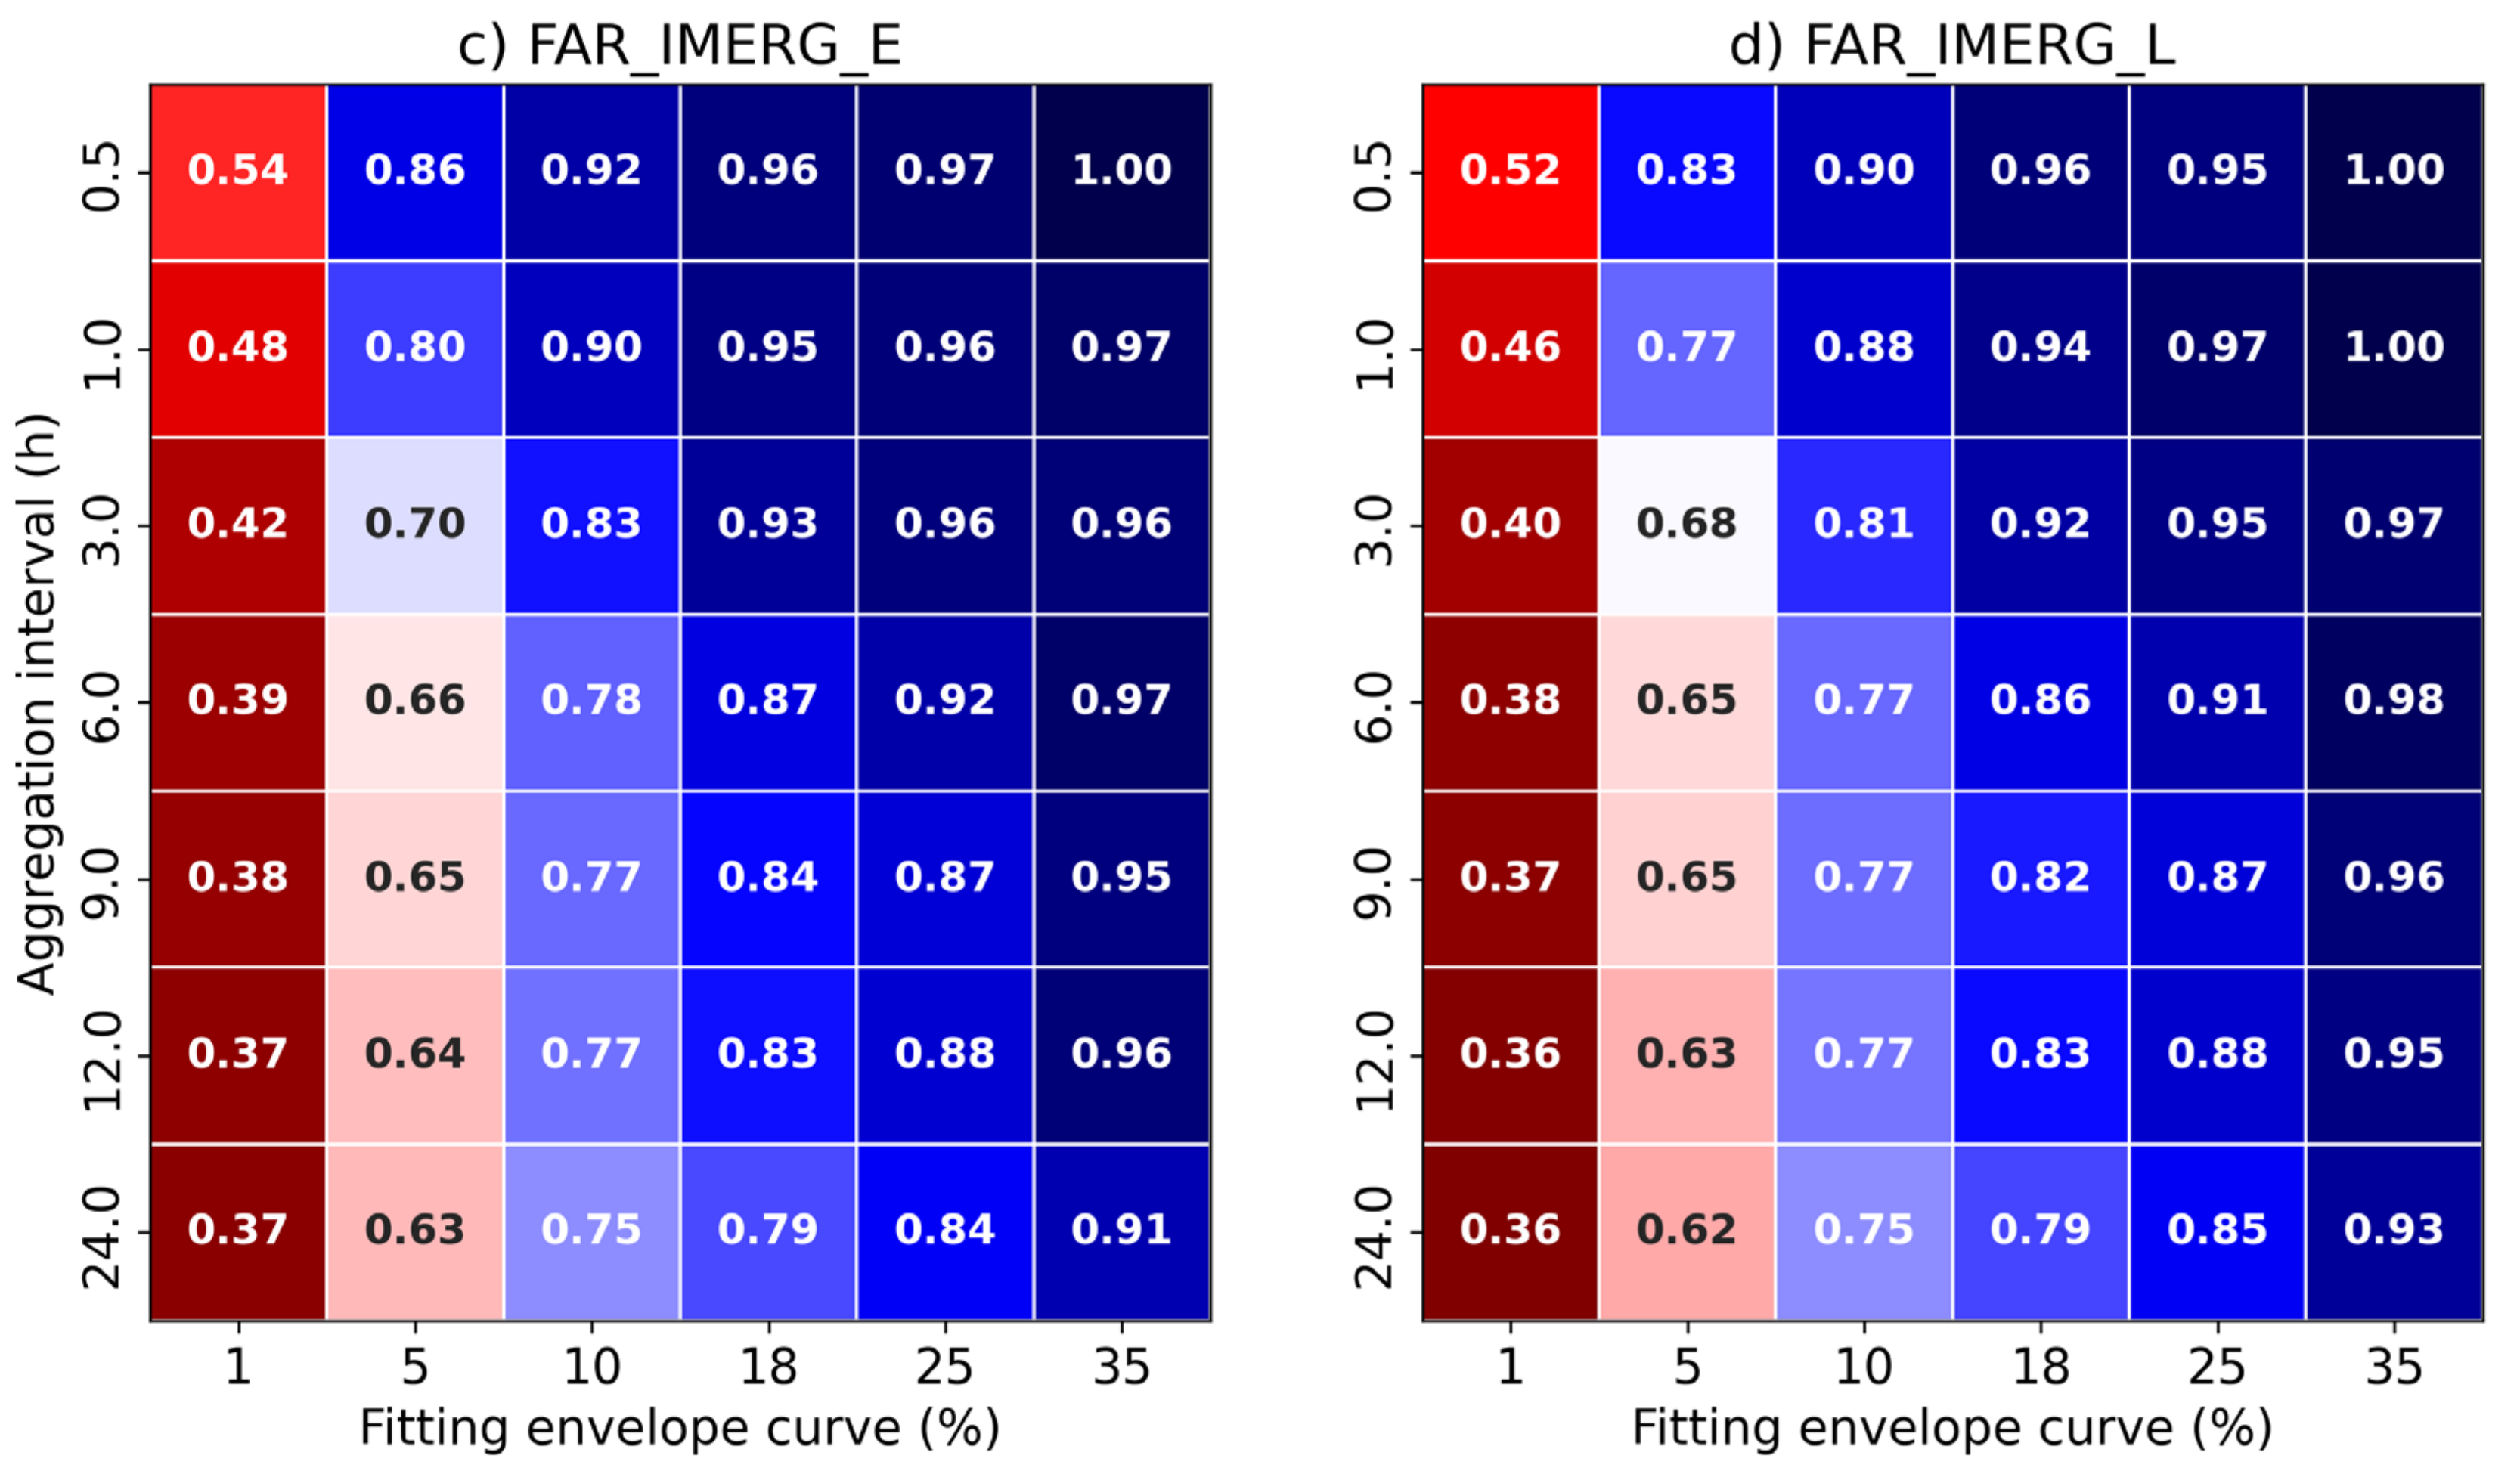
Figure 5 shows POD and FAR values based on the contingency table elements for each temporal aggregation, and according to the envelope curve-based precipitation intensities. The detection of precipitation events with acceptable skill (dark reddish-shaded colors in
Figure 5, that is, POD ≥ 0.5 and FAR ≤ 0.5) is limited in both products mostly for precipitation intensities greater than or equal to 1% and greater than 6 h of temporal aggregation. The ability of IMERG to identify extreme rainfall events decreased substantially with increasing rainfall intensity and temporal resolution. If we consider thresholds greater than or equal to 5% of the envelope curve, no temporal aggregation exceeds 50% of correctly detected cases. This behavior is more critical in the detection of events at 30 min and 1 h, where thresholds higher than 10% of the curve do not exceed 8% (30 min) and 15% in 1 h, respectively. According to these results, IMERG cannot detect events above or equal to 5% of the envelope curve.
While the event detection may be acceptable (greater or equal than 0.50) for 1% rainfall rate envelope thresholds, these values decrease rapidly for higher rainfall rates, reaching only 0.02 or 0.03 at 30 min for the 18% threshold: the SMC standard for heavy rainfall. IMERG products also exhibit significant deficiencies in the generation of false alarms. For both the Early and Late products, limitations were significant at all temporal aggregations with intensities above 5% of the envelope curve, and even at a half-hourly timescale at or above 1% of the envelope curve, FAR exceeded 0.50 values systematically.
For thresholds above 10% of the curve for time aggregations below 3 h, the false-alarm rates were close to 0.90 (1.0 at 30 min) and above 0.70 for lower resolutions, illustrating the low skill of IMERG products with heavy rainfall at a high temporal resolution.
3.3. Assessing the Contribution of Sensors on a Semi-Hourly Scale
To gain a better understanding of the limitations of the IMERG 30 min precipitation estimates, a deeper analysis using precipitation cloud microphysical characteristics was performed, considering 17 heavy rainfall days that occurred from 2021 to 2023. The analysis was performed with both IMERG Early and Late runs, but only the results based on Early runs are presented here, as they were very similar, and the shorter latency of the Early products compared to the Late runs (4 h instead of 14 h) makes them more useful for near-real-time applications. This is of particular interest to early warning systems devoted to the surveillance of extreme precipitation and subsequent flash floods.
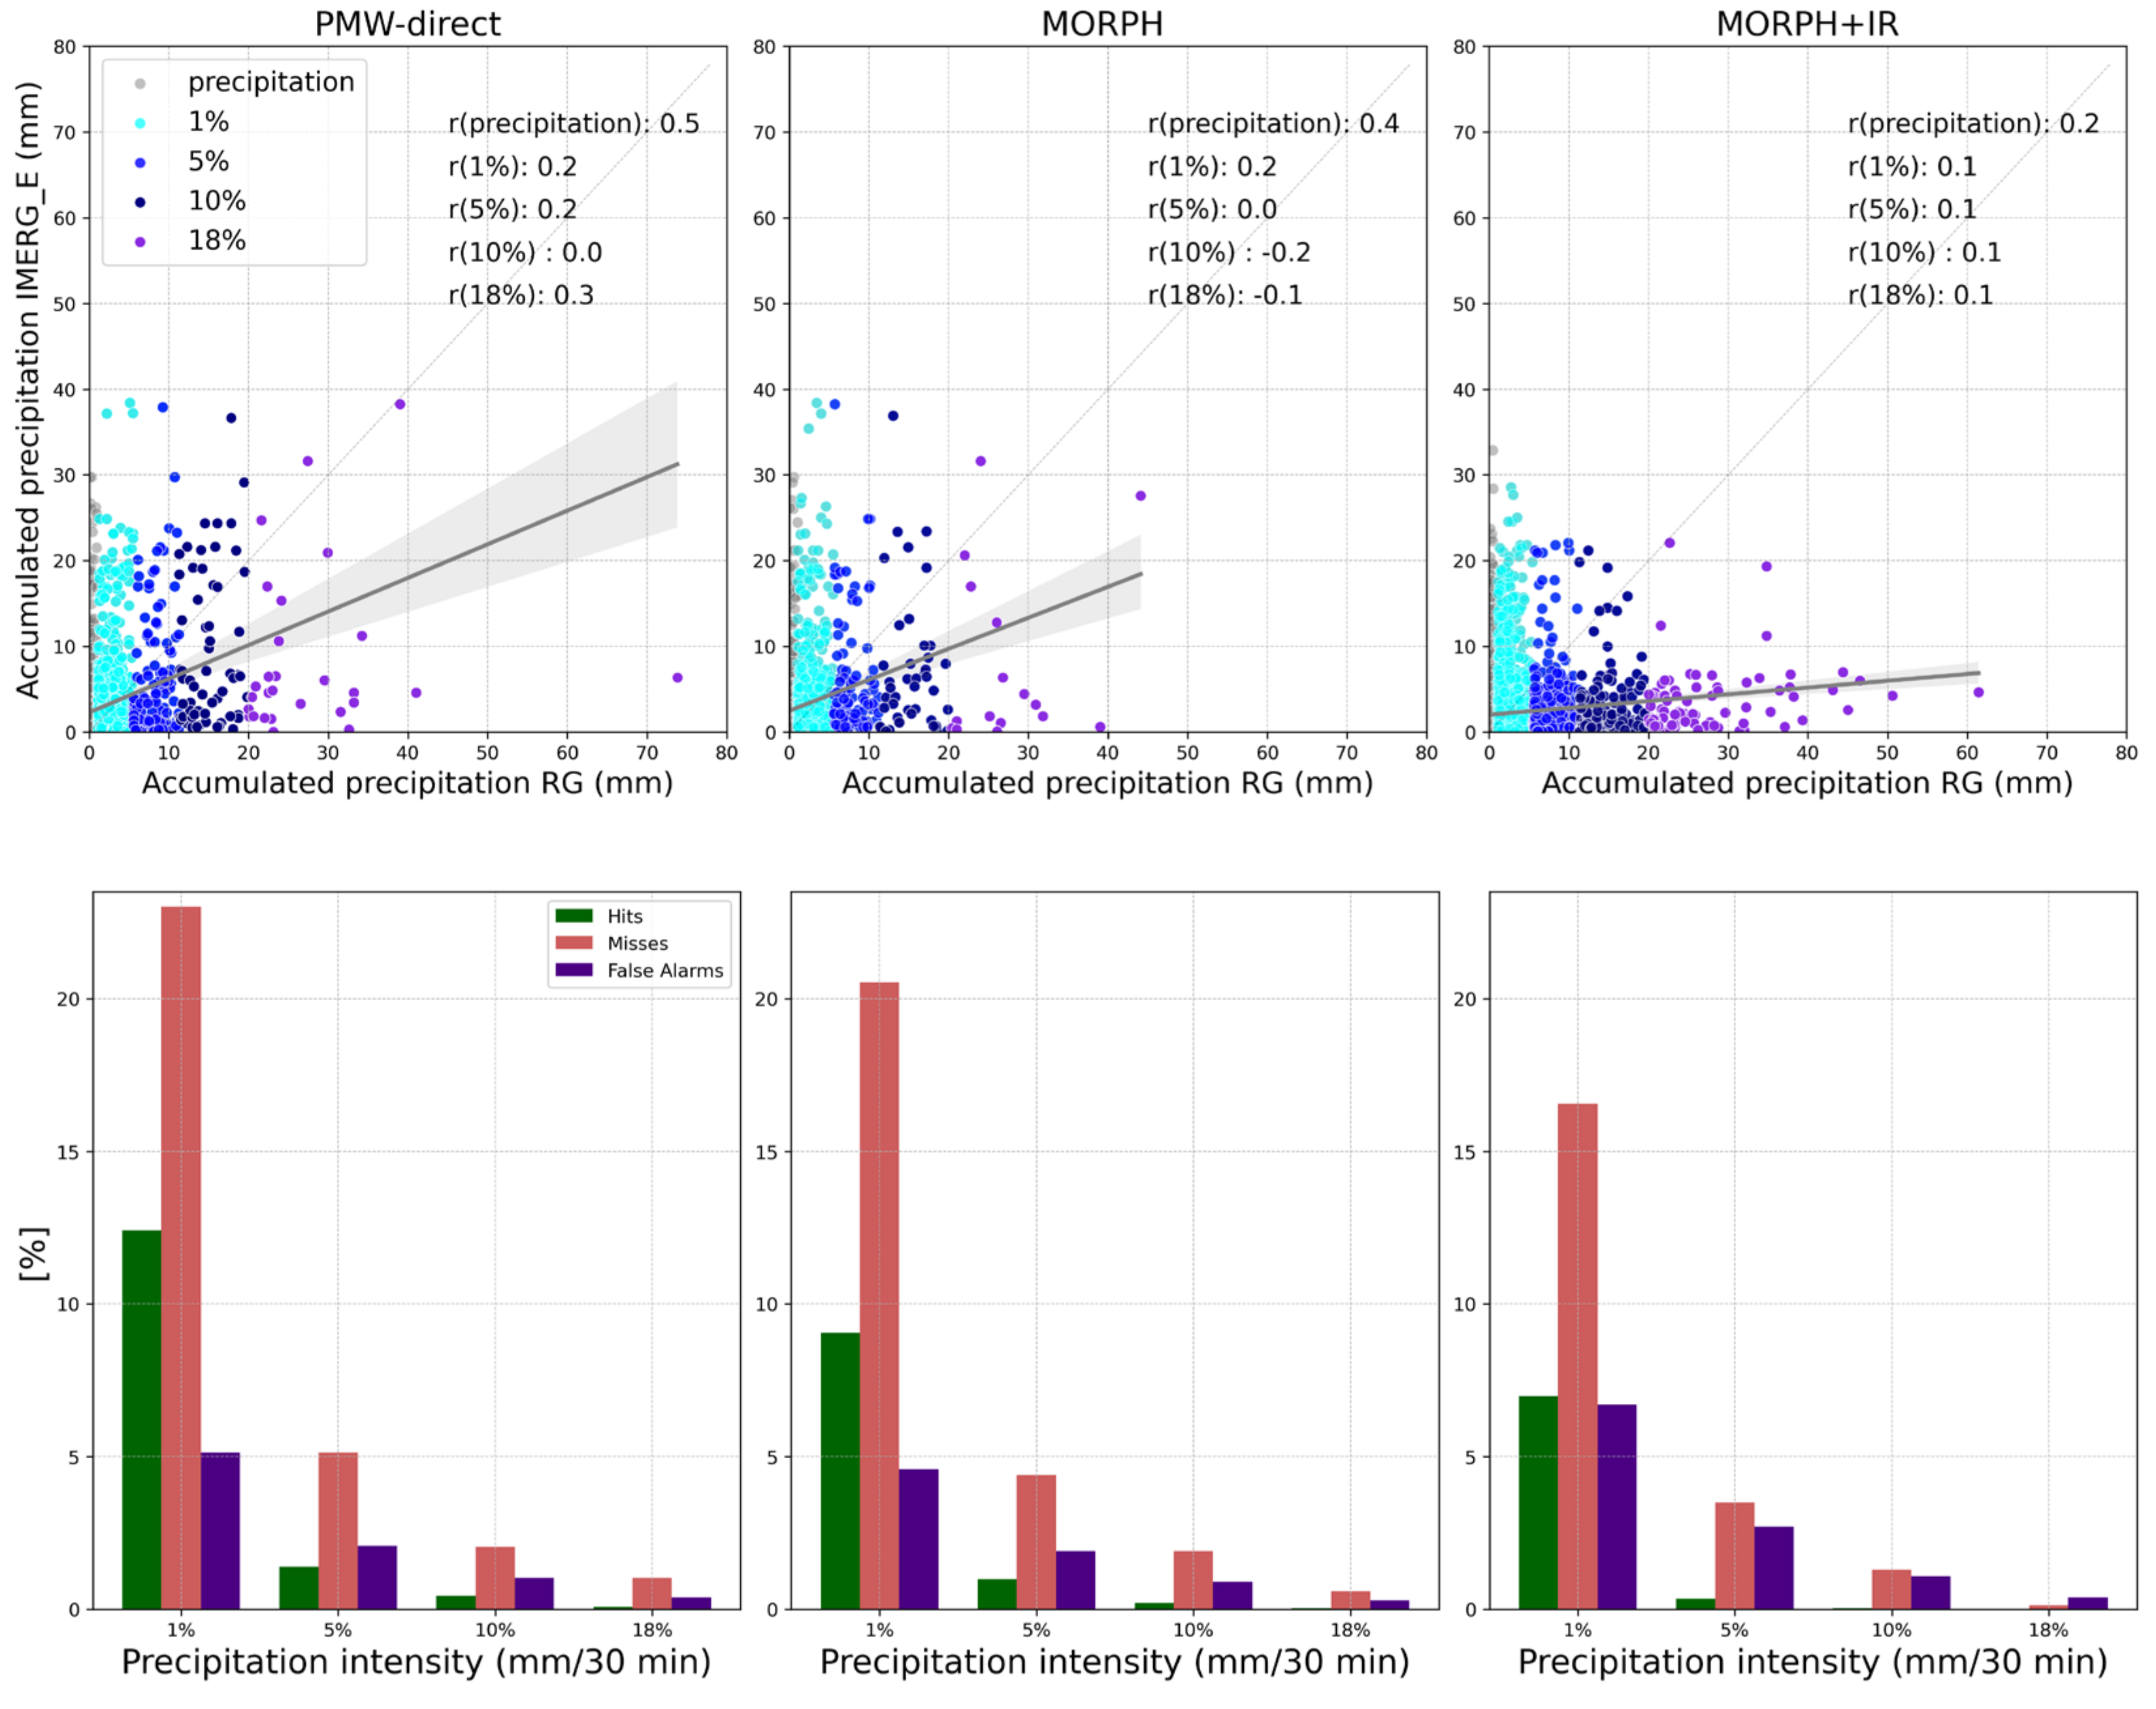
IMERG precipitation estimates are based on direct PMW overpasses (PMW-direct), spatiotemporal advected PMW information (MORPH), a combination of MORPH and IR (MORPH+IR), and observations based on IR information only. In the semi-hourly data for the 17 selected days, IMERG precipitation estimates from MORPH+IR sources dominated (61.6%), followed by PMW-direct (20.2%), and MORPH (16%). A small fraction was represented by IR-only sources (2.1%), which were not considered in the error analysis.
In
Figure 6 (top row), a clear underestimation for all IMERG sources is evident, as all fit lines and the associated 90% error areas are well below the diagonal of the scatter plot. This was even more marked in the case of MORPH+IR for higher rainfall intensity thresholds.
Figure 6 (bottom row) shows the elements of the contingency table for each source contributing to the IMERG estimate, according to the selected intensity threshold. Note that the correct negatives, which represent more than 90% of the cases, are not shown. As expected, the hit fraction degrades with increasing rainfall rate thresholds, and in all cases, the estimates showing the highest skill in event detection come from the direct PMW sensors, followed by MORPH. In fact, for thresholds greater than or equal to 20 mm/30 min, the few cases detected by IMERG are due to the PMW sensors. Previous studies [
14,
51,
52] have shown that PMW data generally represent precipitation rates better than IR data because PMW radiometers are sensitive to hydrometeor precipitation in the atmospheric column, unlike IR sensors, which are limited to cloud top measurements. In particular, the authors of [
12] mentioned that IR retrievals misjudge cold cloud features as rain and not precipitation anvils.
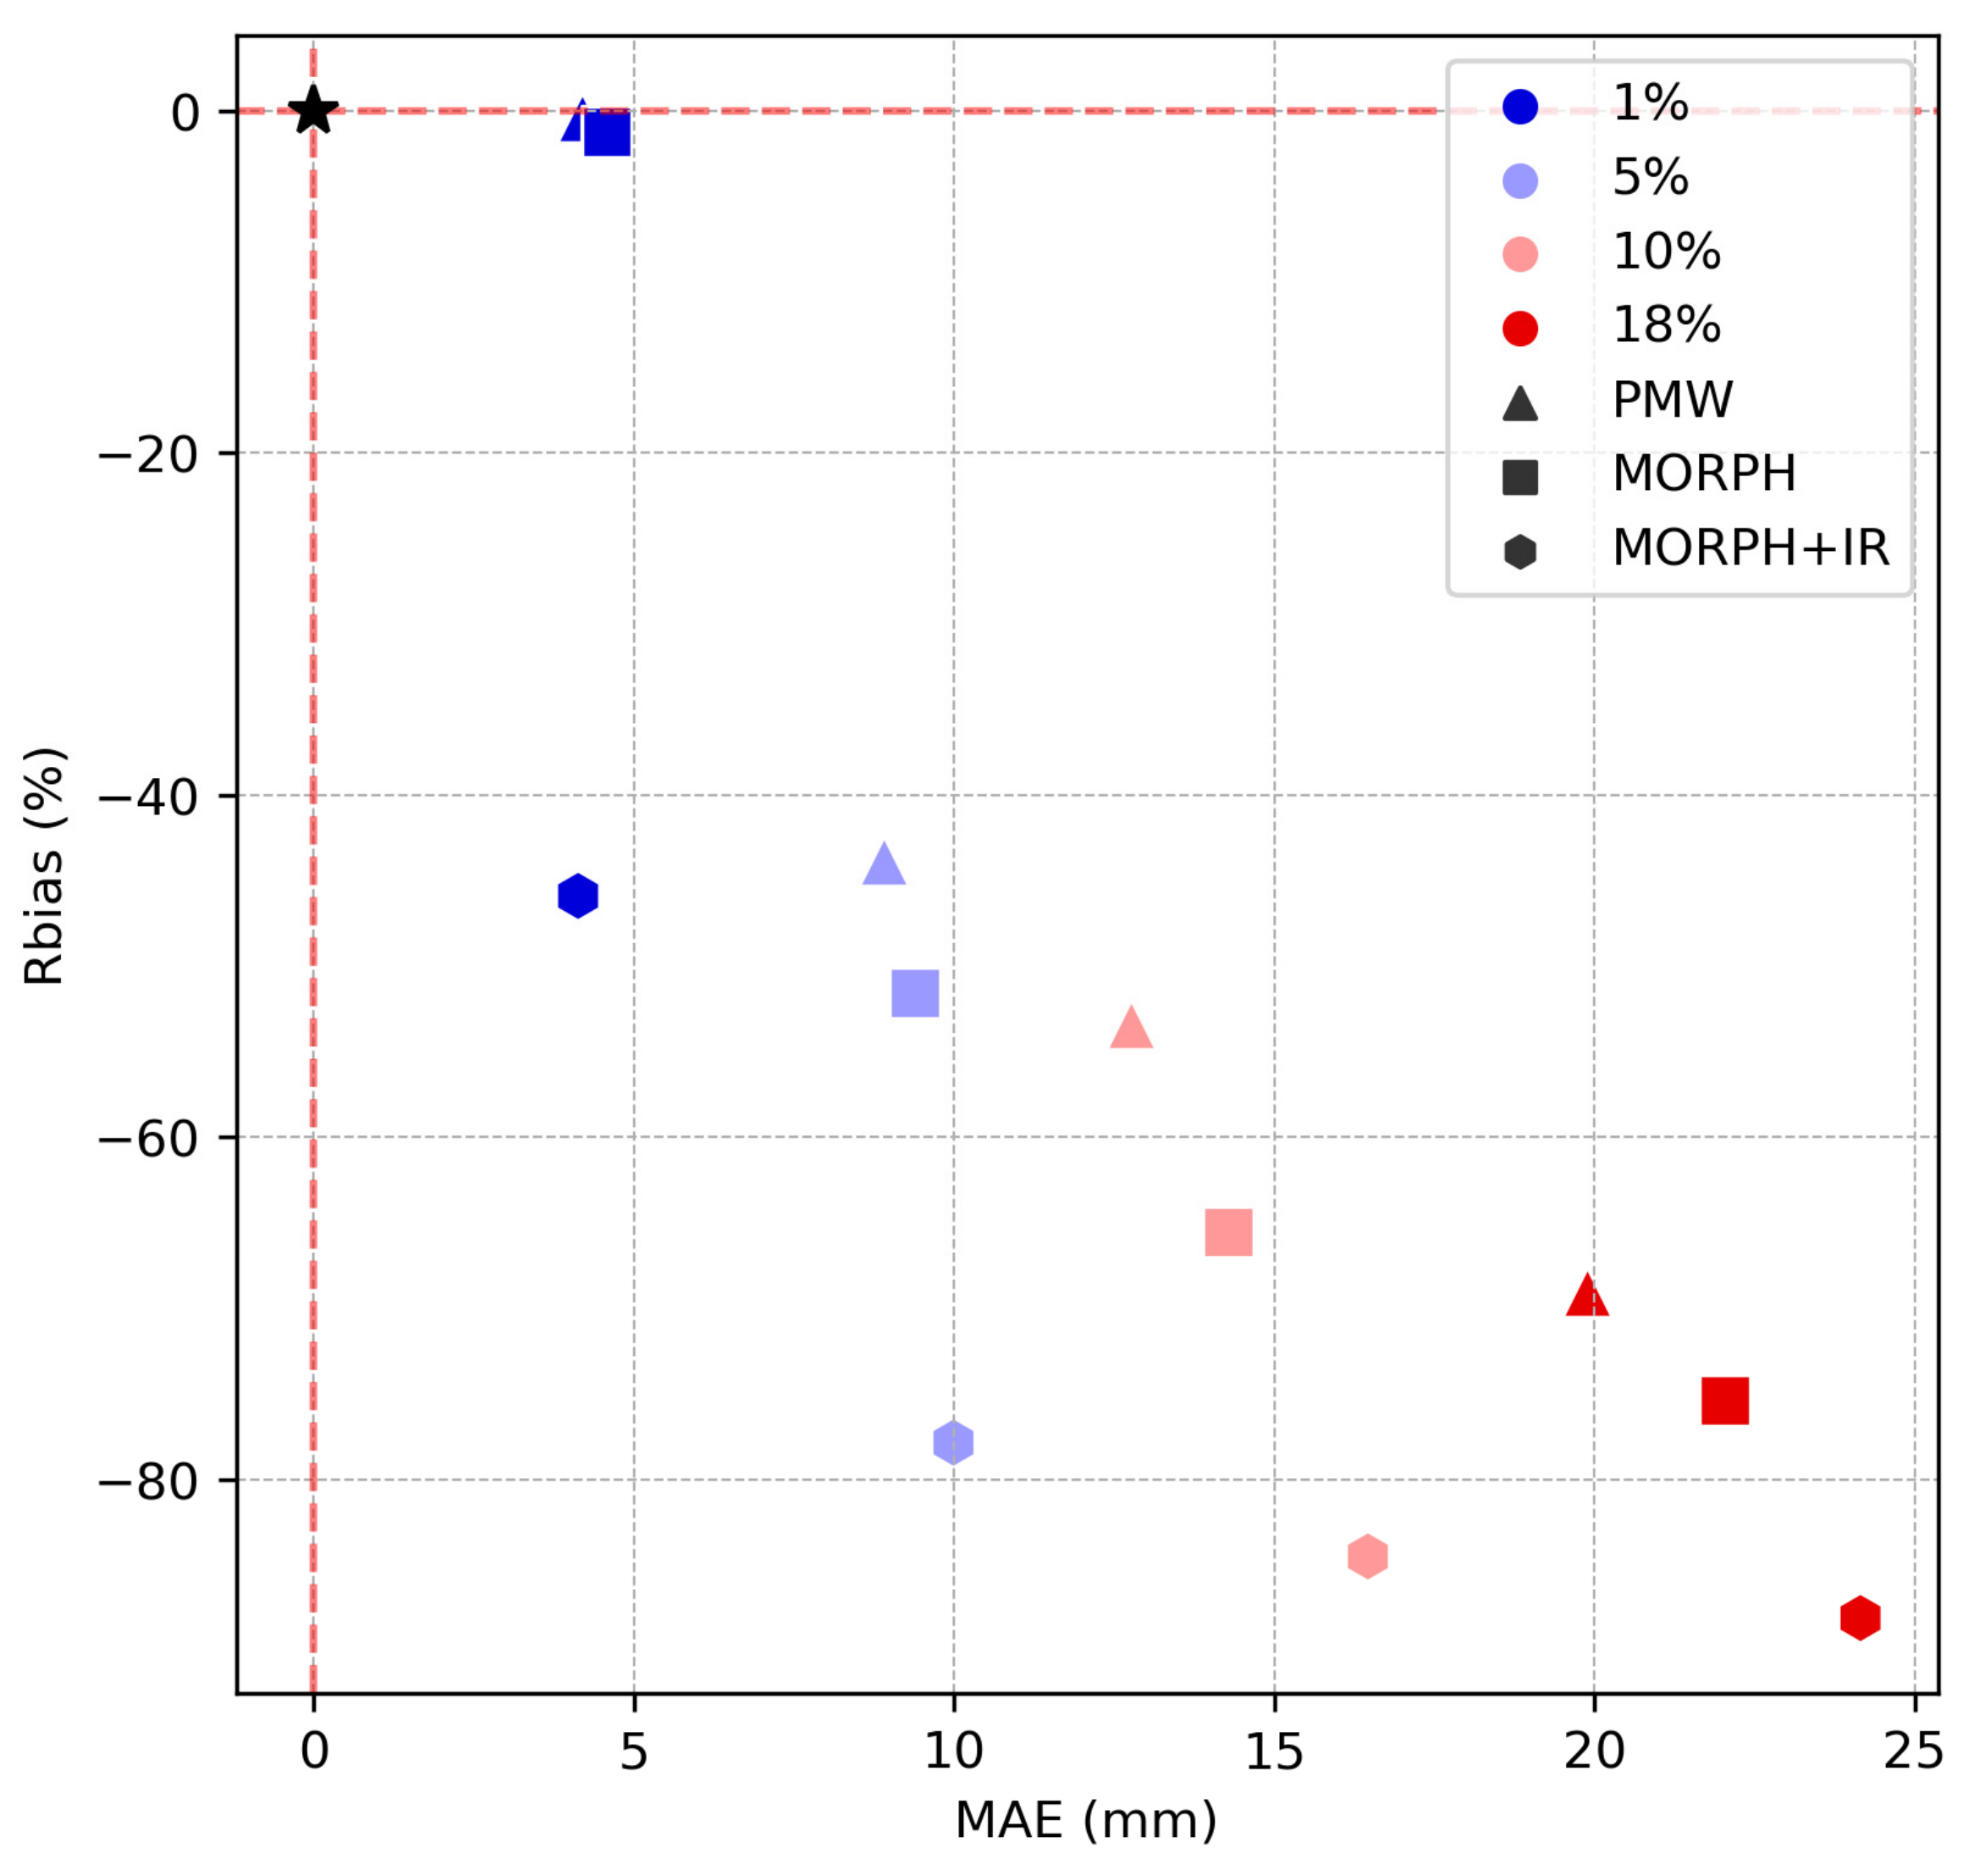
While the underestimation of high rainfall rates in IMERG comes from all sources, the negative bias is the lowest for the PMW-direct and low rainfall rate thresholds (i.e., 1% of the envelope curve, close to ideal top-left location of
Figure 7). However, this bias appears to be an inherent problem with the PMW algorithm, which is amplified by MORPH and IR data. In contrast, the worst results were obtained for MORPH+IR and the highest rainfall rate threshold considered (18%), located at the worst location (bottom right) of
Figure 7.
The benefits of filling the IMERG PMW gaps by including MORPH and IR information come at the expense of increasing Rbias and MAE for heavy rainfall rates. The above analysis of categorical variables agreed with the trend observed in the analysis of continuous errors. The BIAS errors for thresholds ≥18% of the curve are close to 20 mm, which indicates an almost null ability of IMERG to detect the amounts observed by the rain gauges. Note that a few IMERG estimates based on PMW detected values exceeding the 18% threshold; however, they were false alarms corresponding to lower rain gauge records.
3.4. Relationship between IMERG Sources and Microphysical Properties of the Clouds
In this section, the IMERG comparison with rain gauges is broken down according to the cloud phases and the different microphysical properties of the precipitating clouds. The incorporation of high-resolution cloud top information from CMIC NWC SAF provides additional and independent information that allows us to better understand the behavior of IMERG and its data sources under different RG rainfall intensity thresholds.
Table 6 shows the error and skill measures from IMERG and its sources stratified by warm, ice, or mixed heavy precipitation clouds. In our study area, as expected, the highest number of heavy precipitation events occurred under ice clouds in the order of 4601:117:275 (ice, liquid, mixed), where the numbers indicate the individual 30 min records.
The cases of heavy precipitation associated with warm clouds showed the worst results, similar to those with clouds in the mixed phase. In the latter cases, the BIAS and Rbias values were greater than twice the errors reported in ice cases in all sources simultaneously, with the PMW-direct records showing the largest differences between one class and the other. For intensities greater than or equal to 1%, the PMW sources in ice conditions were the only ones that overestimated precipitation, thus cutting the underestimation trend of the rest of the IMERG data sources. The MAE and RMSE values are higher in ice clouds precisely because heavy rainfall is mainly associated with deep moist convection; however, it should be noted that they also present lower BIAS and Rbias values.
Similarly, POD values were much higher for glaciated clouds, especially at lower precipitation intensities. In observations from PMW-direct and MORPH sources in the ice phase, POD values reflect a hit rate of 0.76 and 0.69 compared to only 0.11 and 0.24 in the liquid phase. Although false-alarm rates also increase from ice-phase to liquid-phase clouds, they follow the same pattern of the best scores for PMW-based estimates compared with those where IR sources are considered.
For events above 5% precipitation thresholds, the cases under liquid and mixed clouds provided poor results. For events above the 18% threshold, the ability of IMERG was almost null under all cloud phases, but specifically in the liquid and mixed phases (with two cases each), it was totally null.
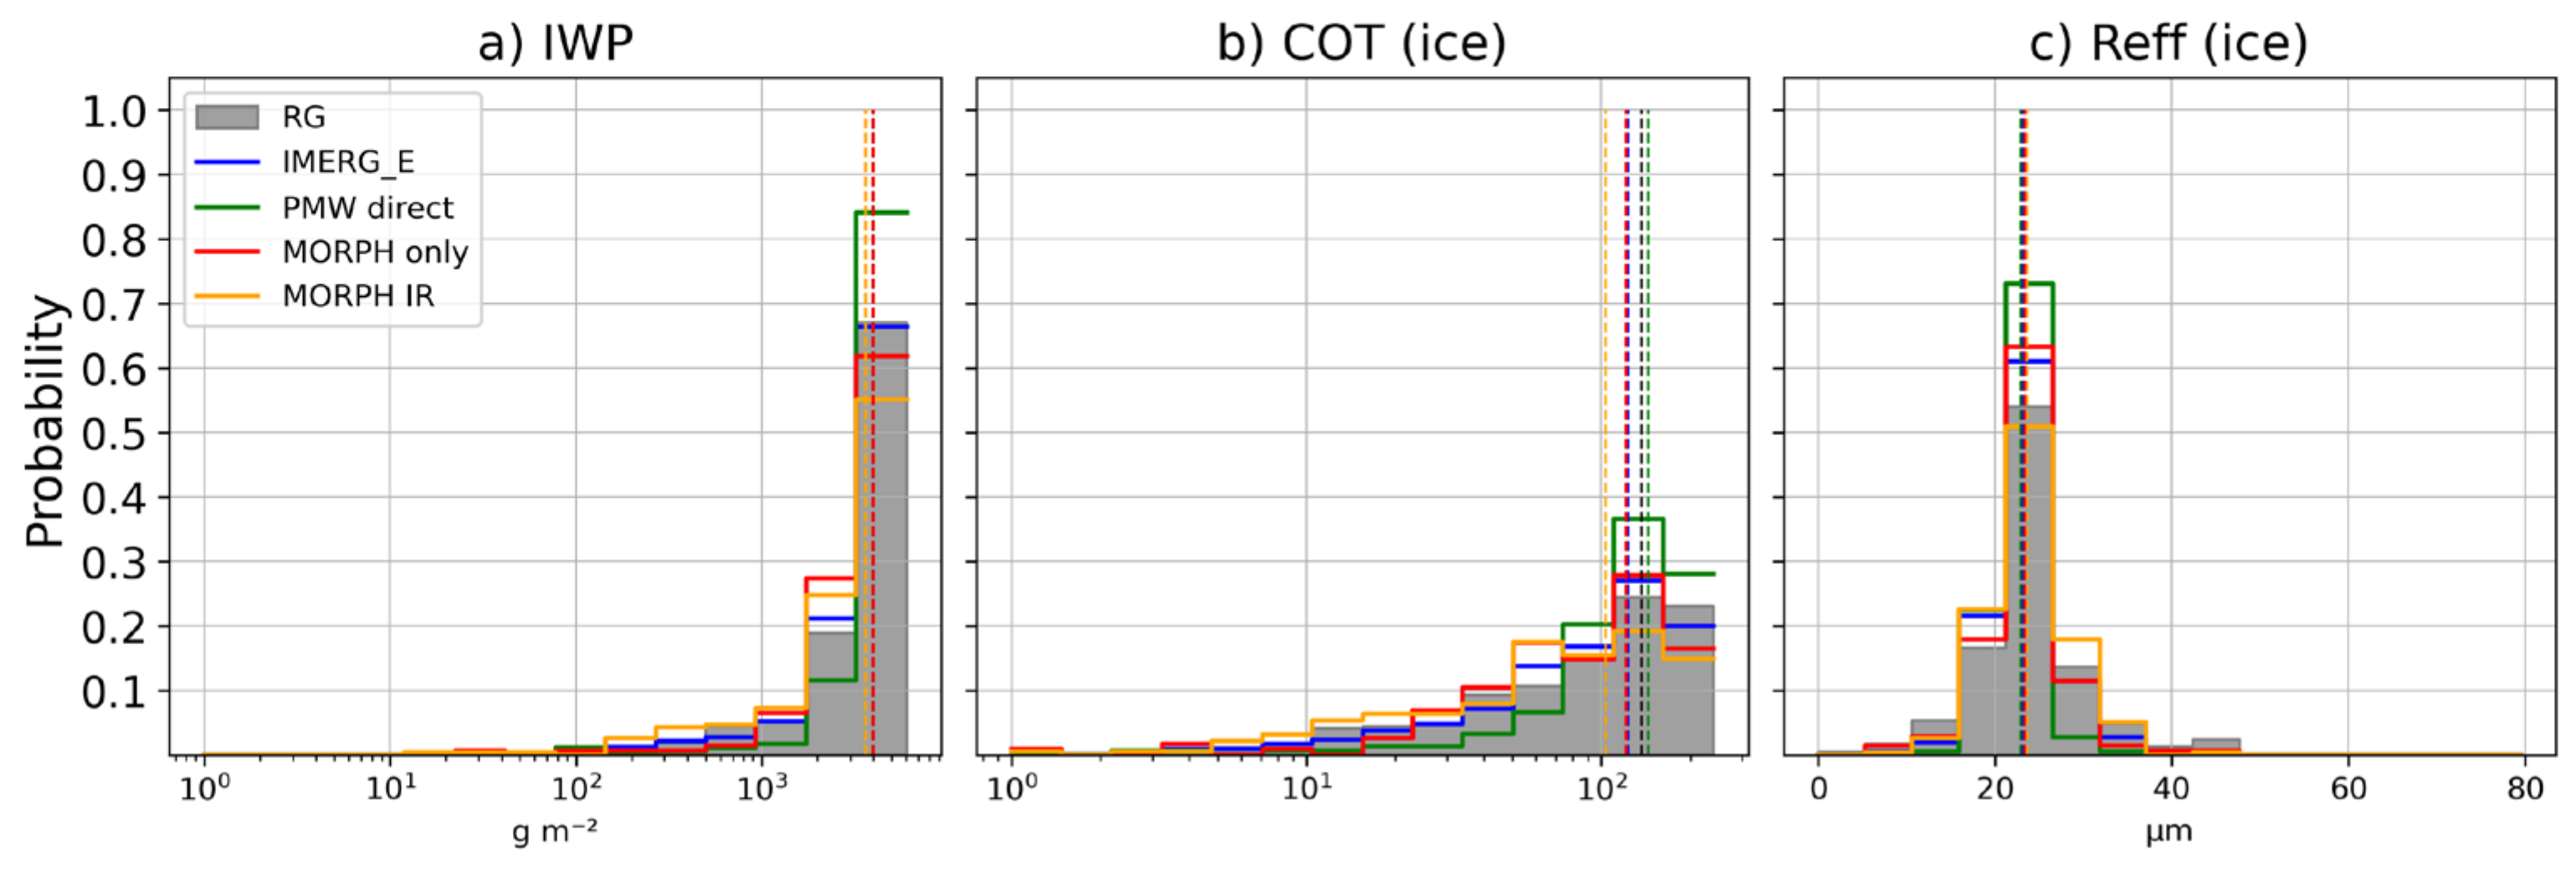
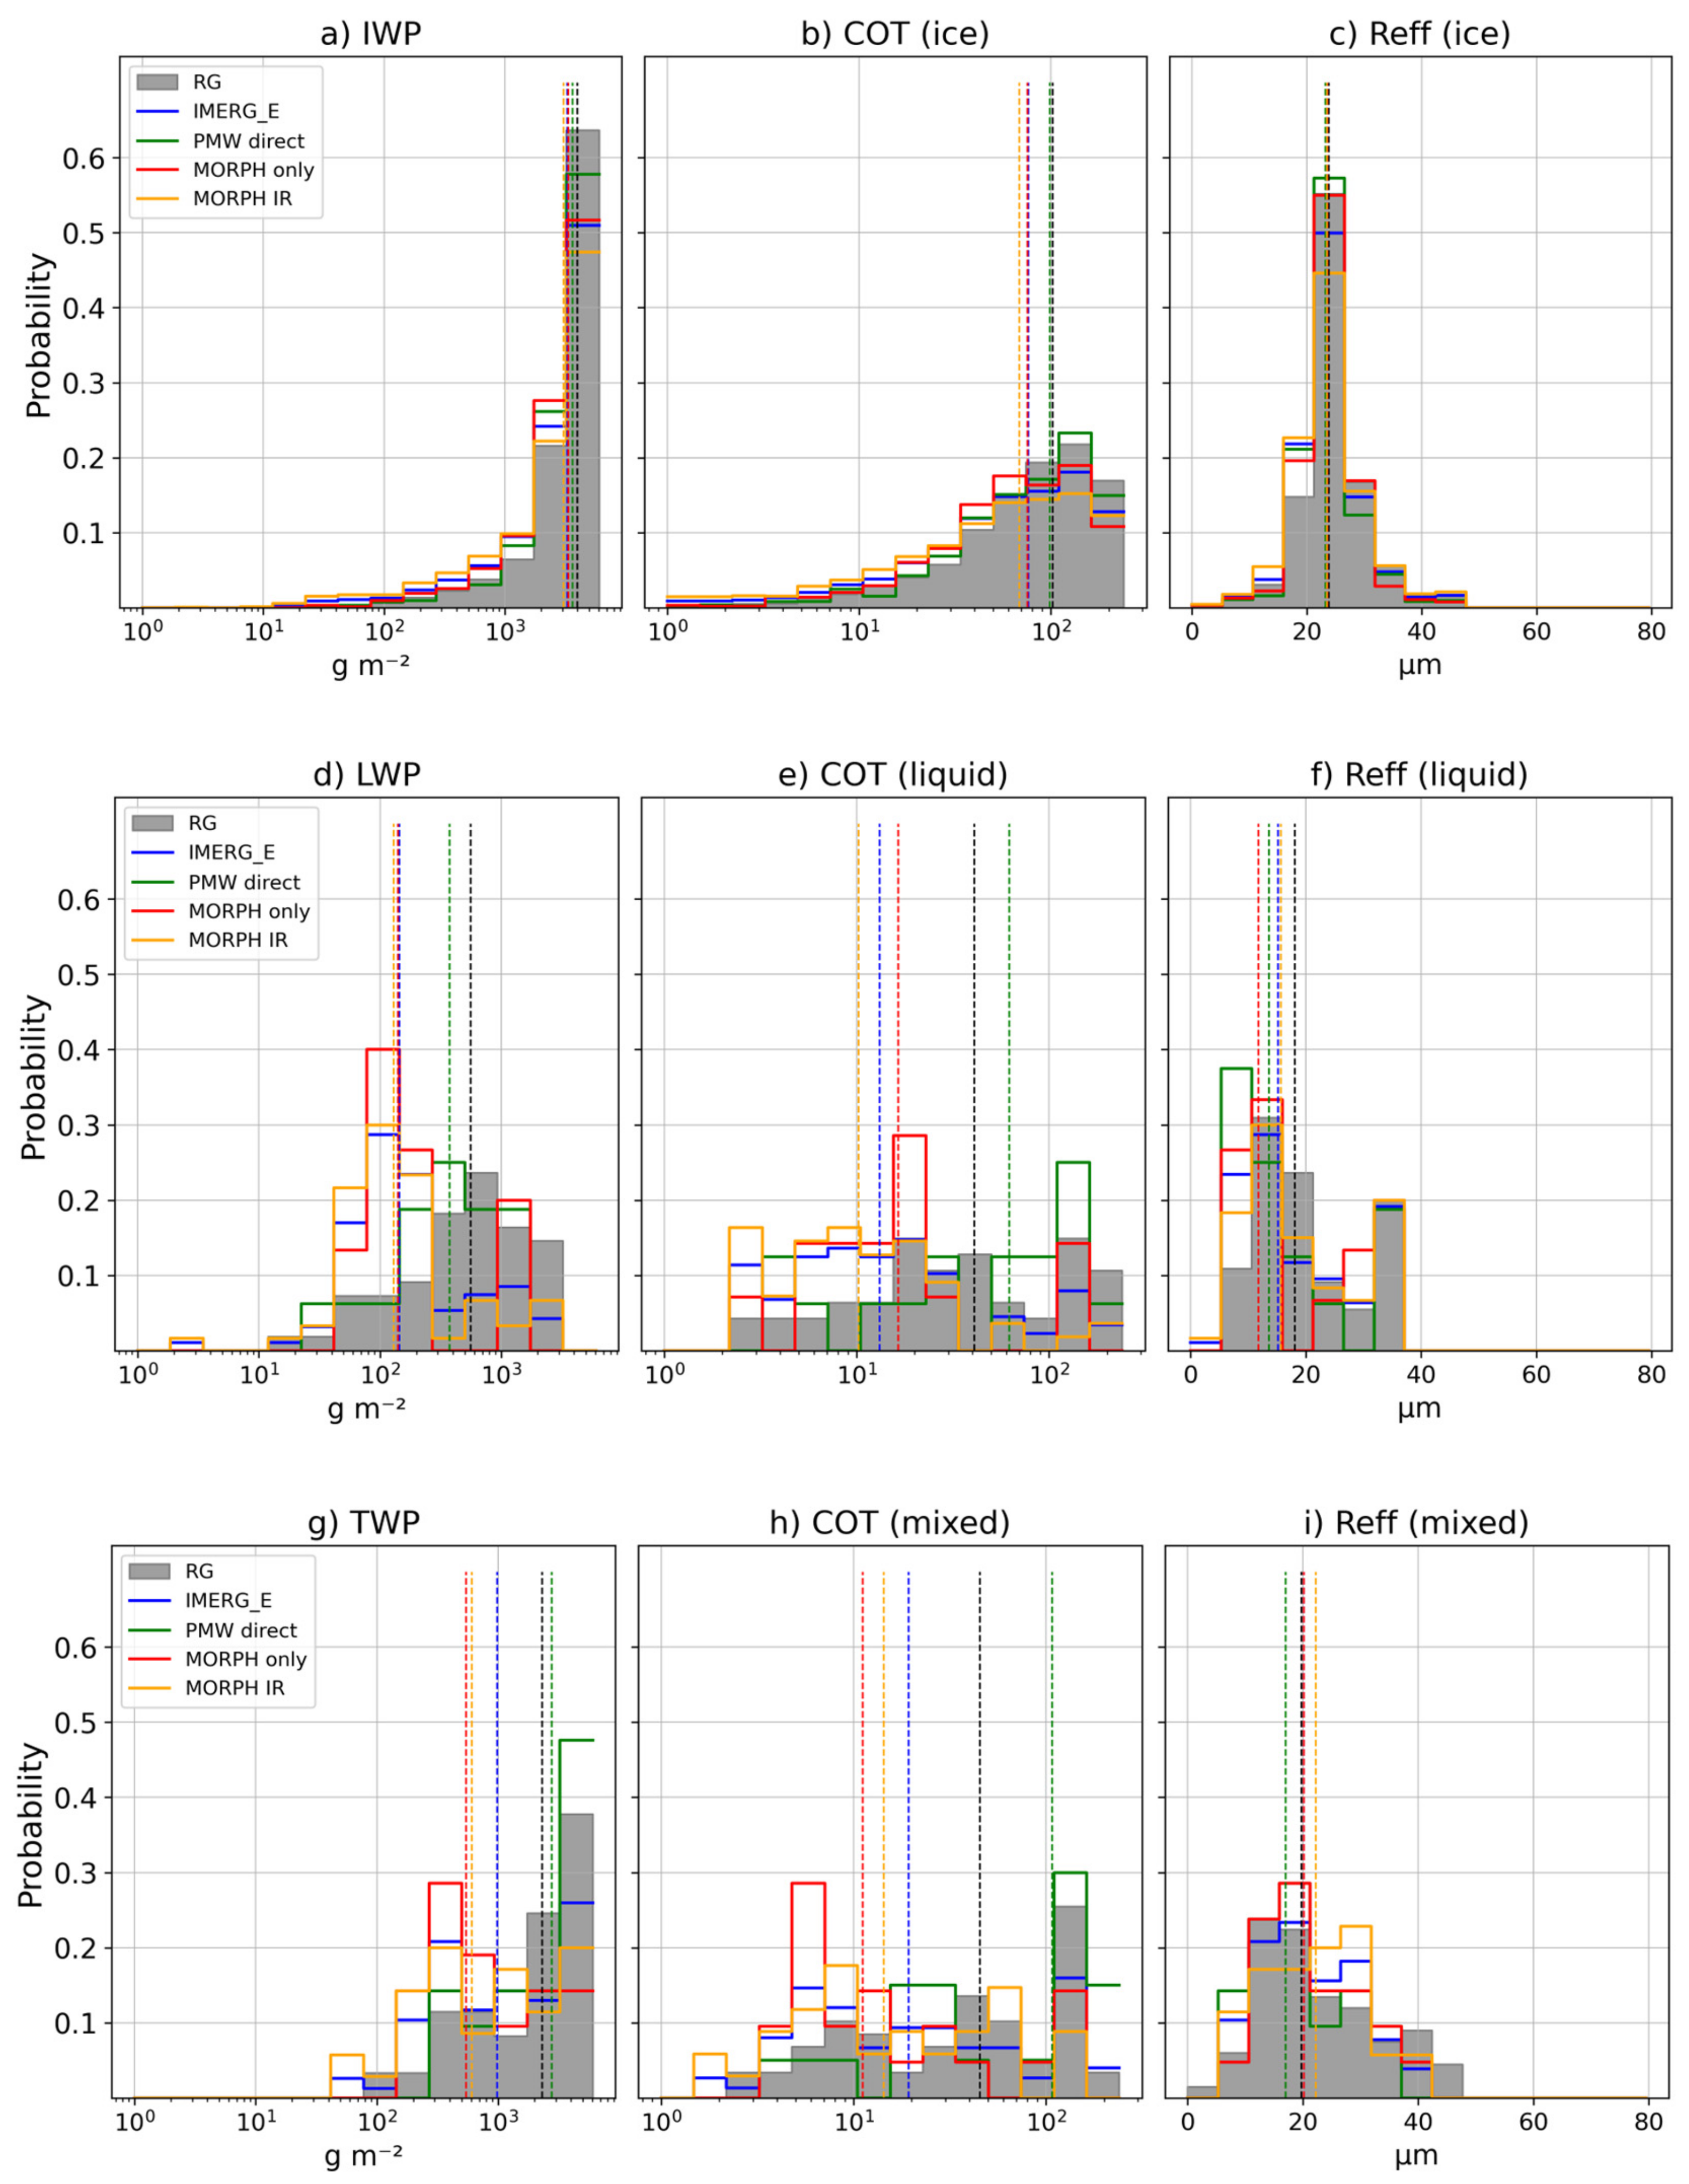
Figure 8 compares the probability distribution of cloud top properties around all time steps of intense precipitation greater than or equal to 1%. IMERG Early estimates and different sources were considered for comparison with RG. Only daytime precipitation samples were represented, as COT and
retrievals were not available during the night. Although available, IWP, LWP, and TWP are limited to the same time set for consistency.
It should be noted that the case studies selected for the analysis were chosen precisely because of the occurrence of heavy rainfall. This behavior is reflected in the high probability of occurrence of high IWP, LWP, and TWP values. IMERG and its sources overestimated the precipitation related to IWP values below 500 g m−2 and underestimated the precipitation rates related to higher IWP values compared with RG. This oversensitivity was also evident for lower COT values. The estimates generated by PMW-direct were the closest to the RG distribution, and their median values were very similar. The distributions of sensors related to warm clouds was much more pronounced. A high overestimation is observed for all sources related to TWP values < 1000 g m−2, and for higher values, an underestimation is observed, especially for IMERG MORPH+IR. Although once again, this behavior is reflected in the lower COT values, overestimation is observed for higher values.
Regarding , IMERG and its sources do quite well for ice clouds but show significant overestimates, particularly below 10 µm, and underestimates when is equal to or higher than the median of the observations. In the mixed phase, although there was an overestimation related to low TWP values, it is worth noting that the PMW-direct estimates maintained this overestimation directly related to a marked sensitivity to high COT values.
The PMW-direct sources, although the most accurate, are often the most sensitive to different cloud phases. While uncertainties in rainfall occurrence associated with ice and mixed clouds are directly related to COT characteristics during the liquid phase, they are also related to COT and behavior.
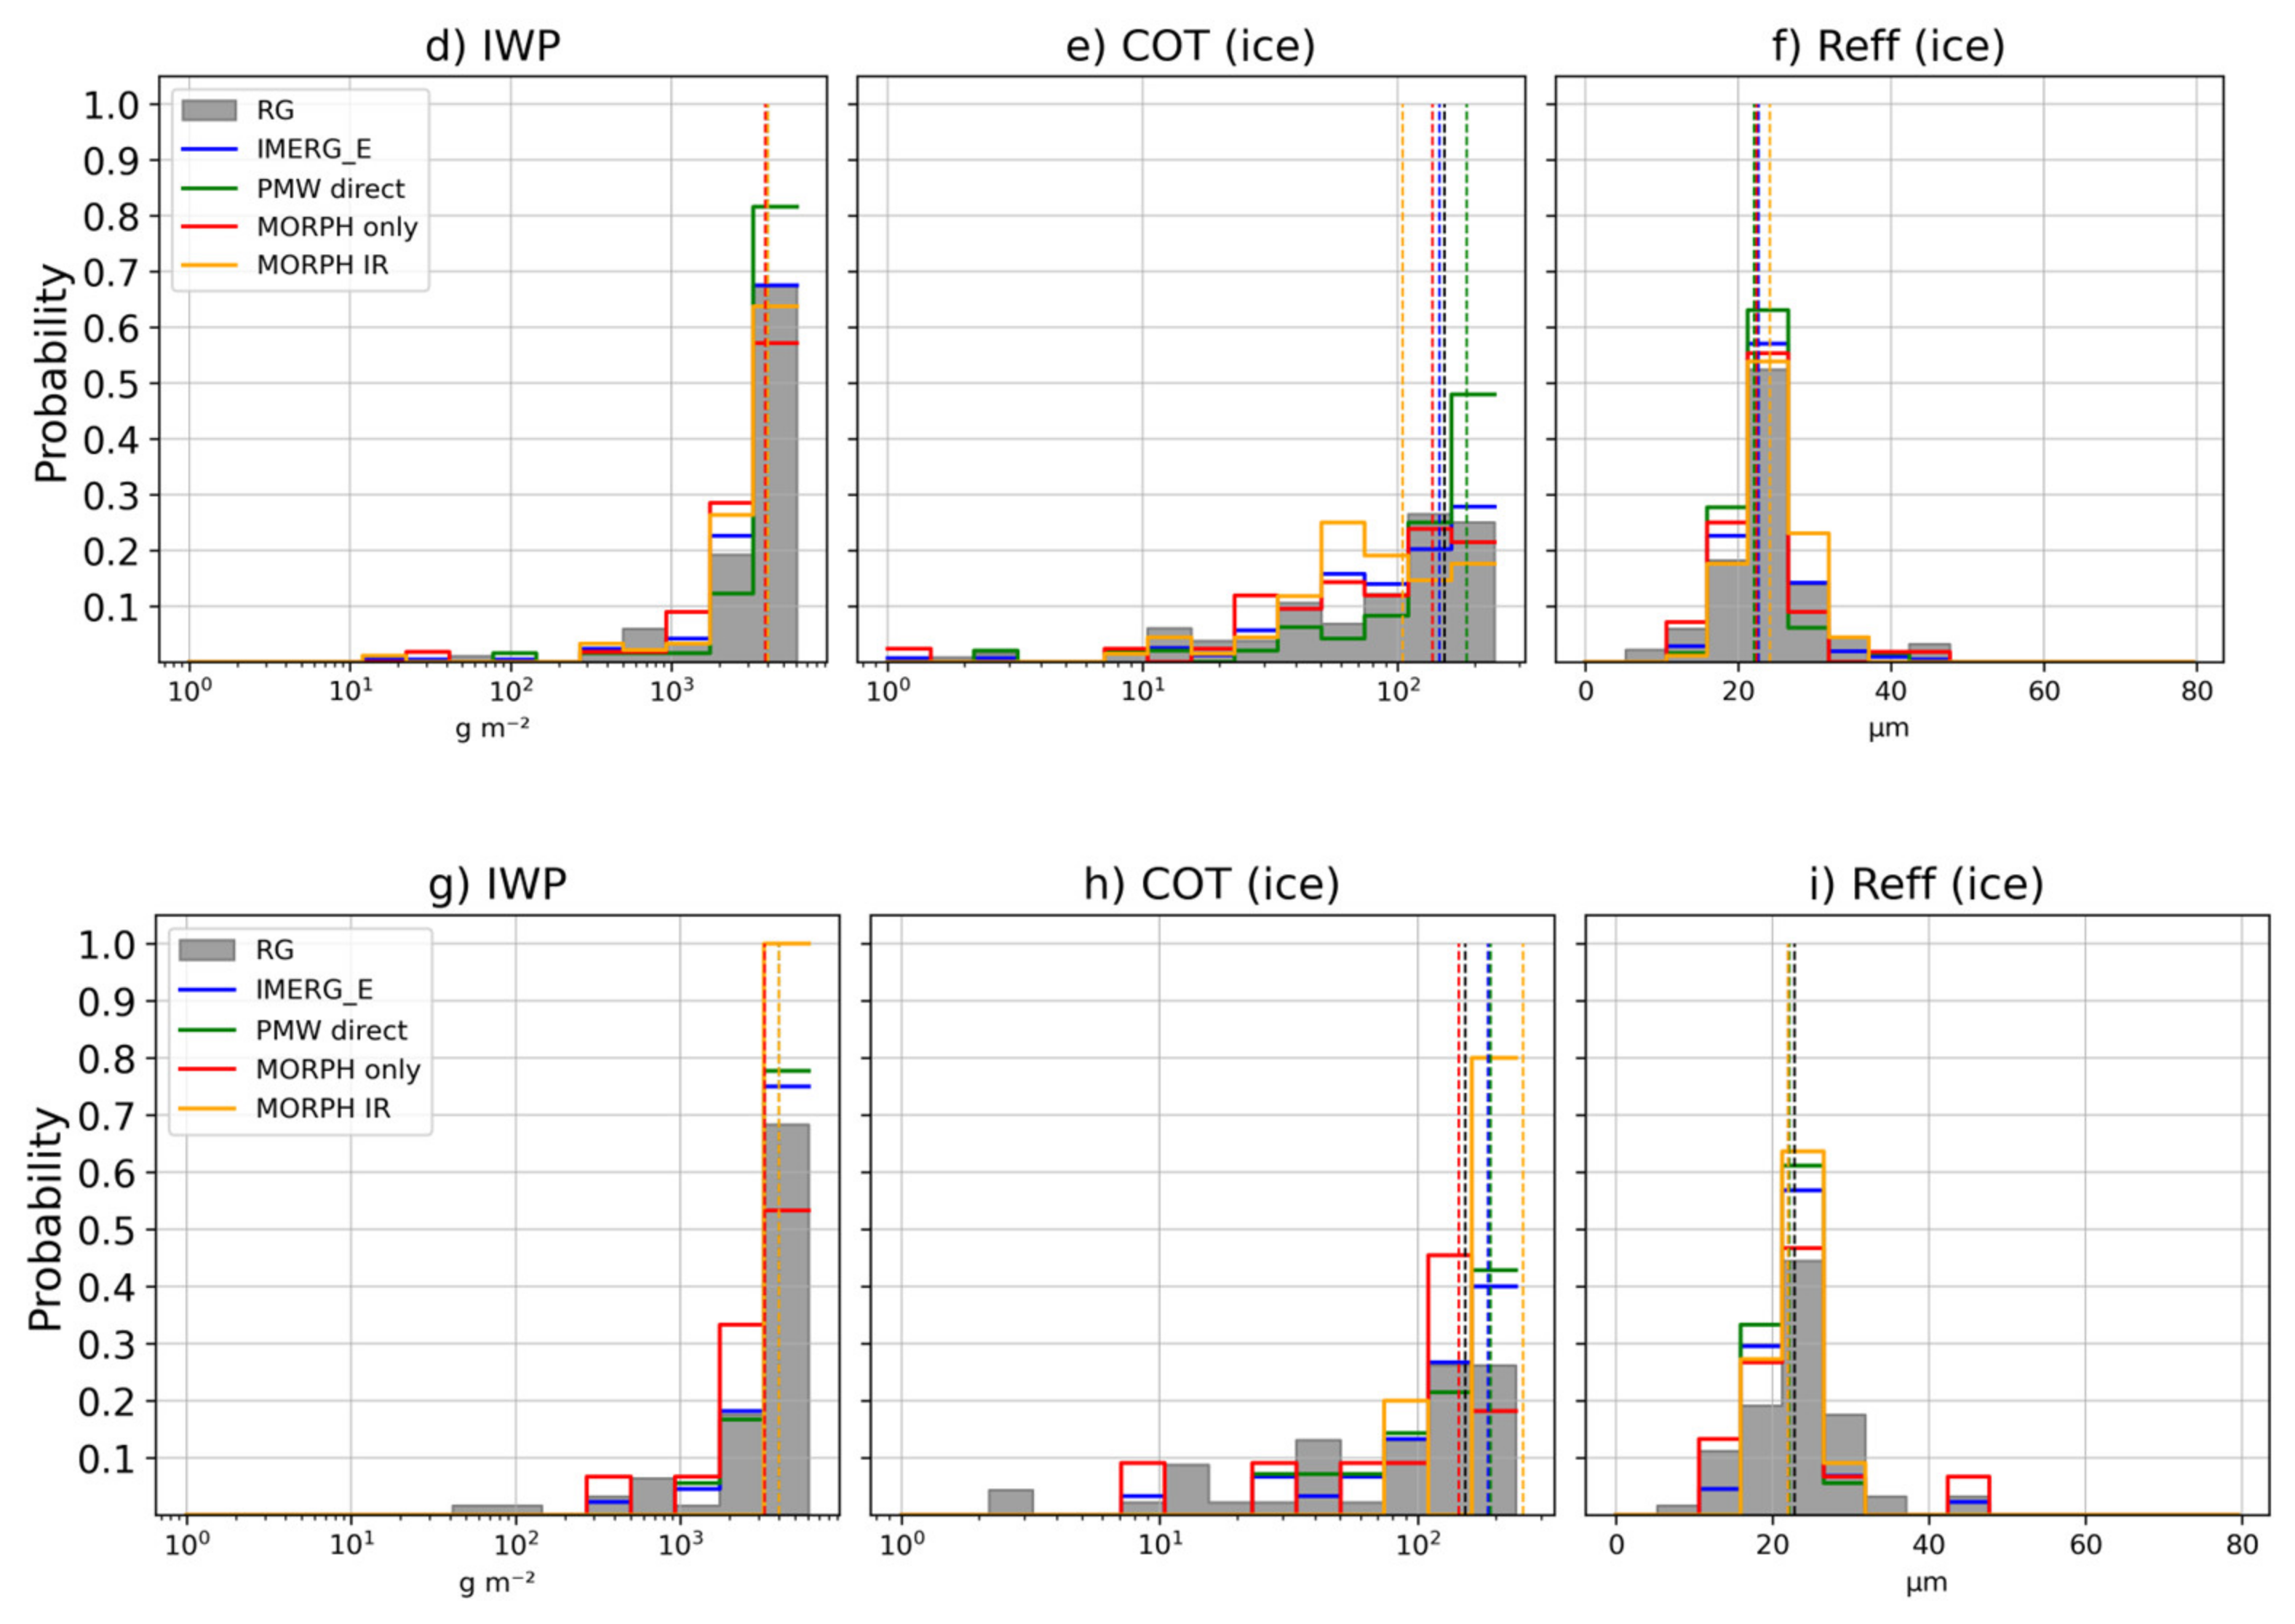
In the context of more intense precipitation (5%, 10%, and 18%) (see
Figure A1,
Appendix C) associated with ice clouds, a large oversensitivity related to high IWP and COT values, especially by PMW-direct, can be noted. In all cases, extreme precipitation was overestimated, with
values close to the median of those recorded by RG. While observations associated with PMW-direct played a key role for intensities of 5% and 10%, MORPH+IR sources played a key role for intensities ≥ 18%.
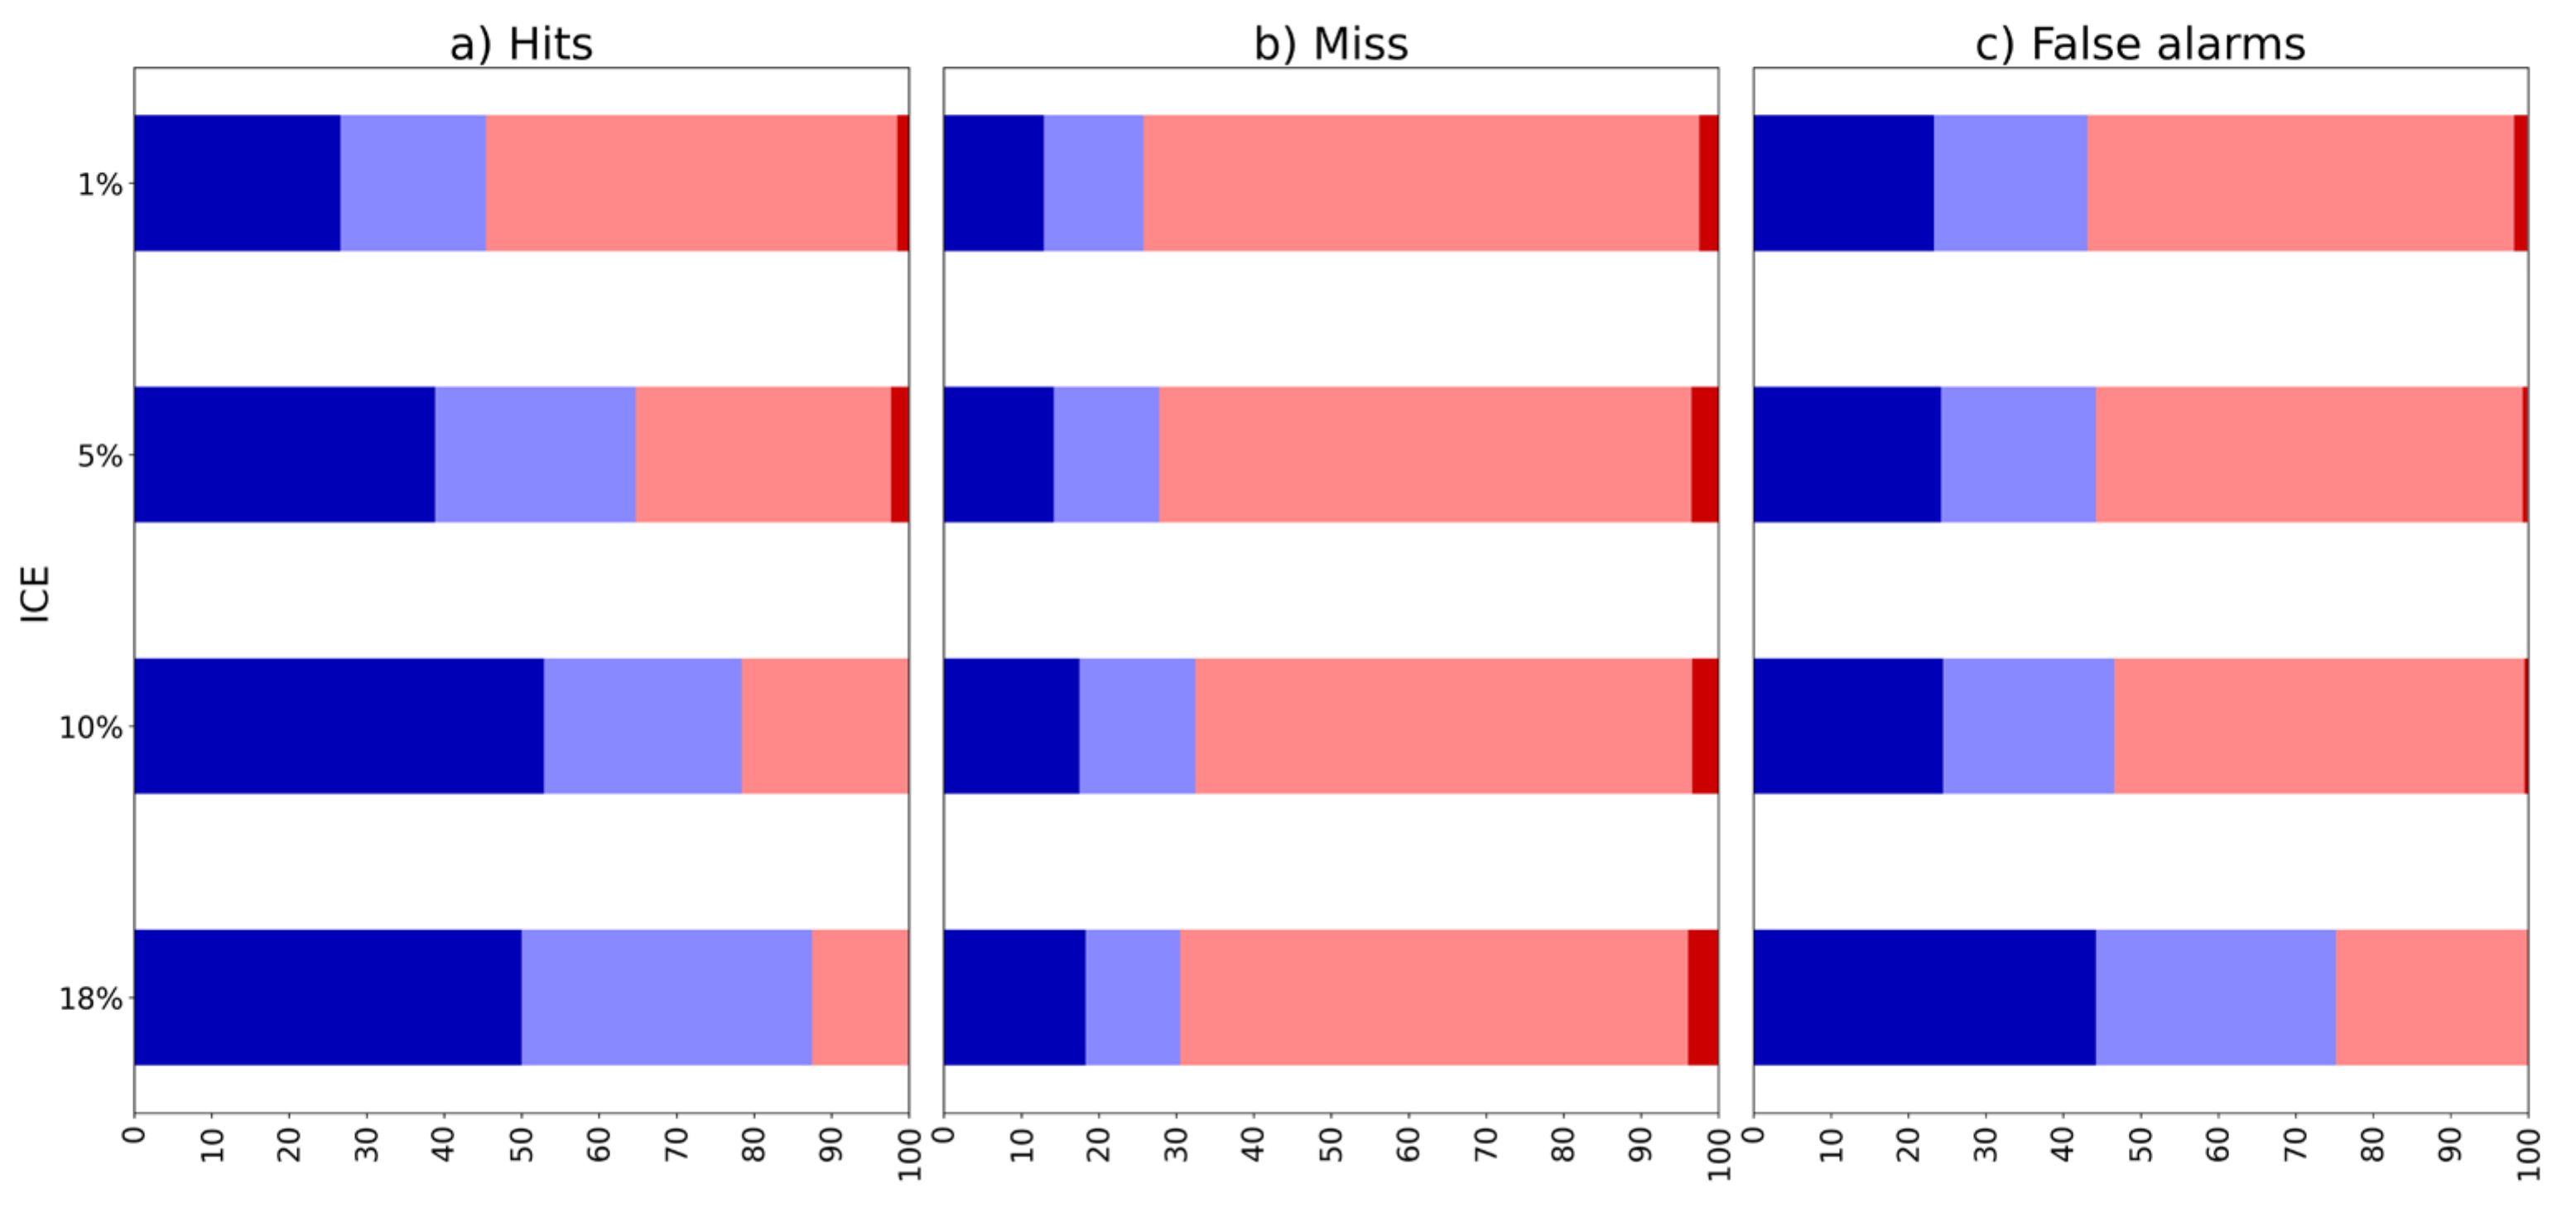
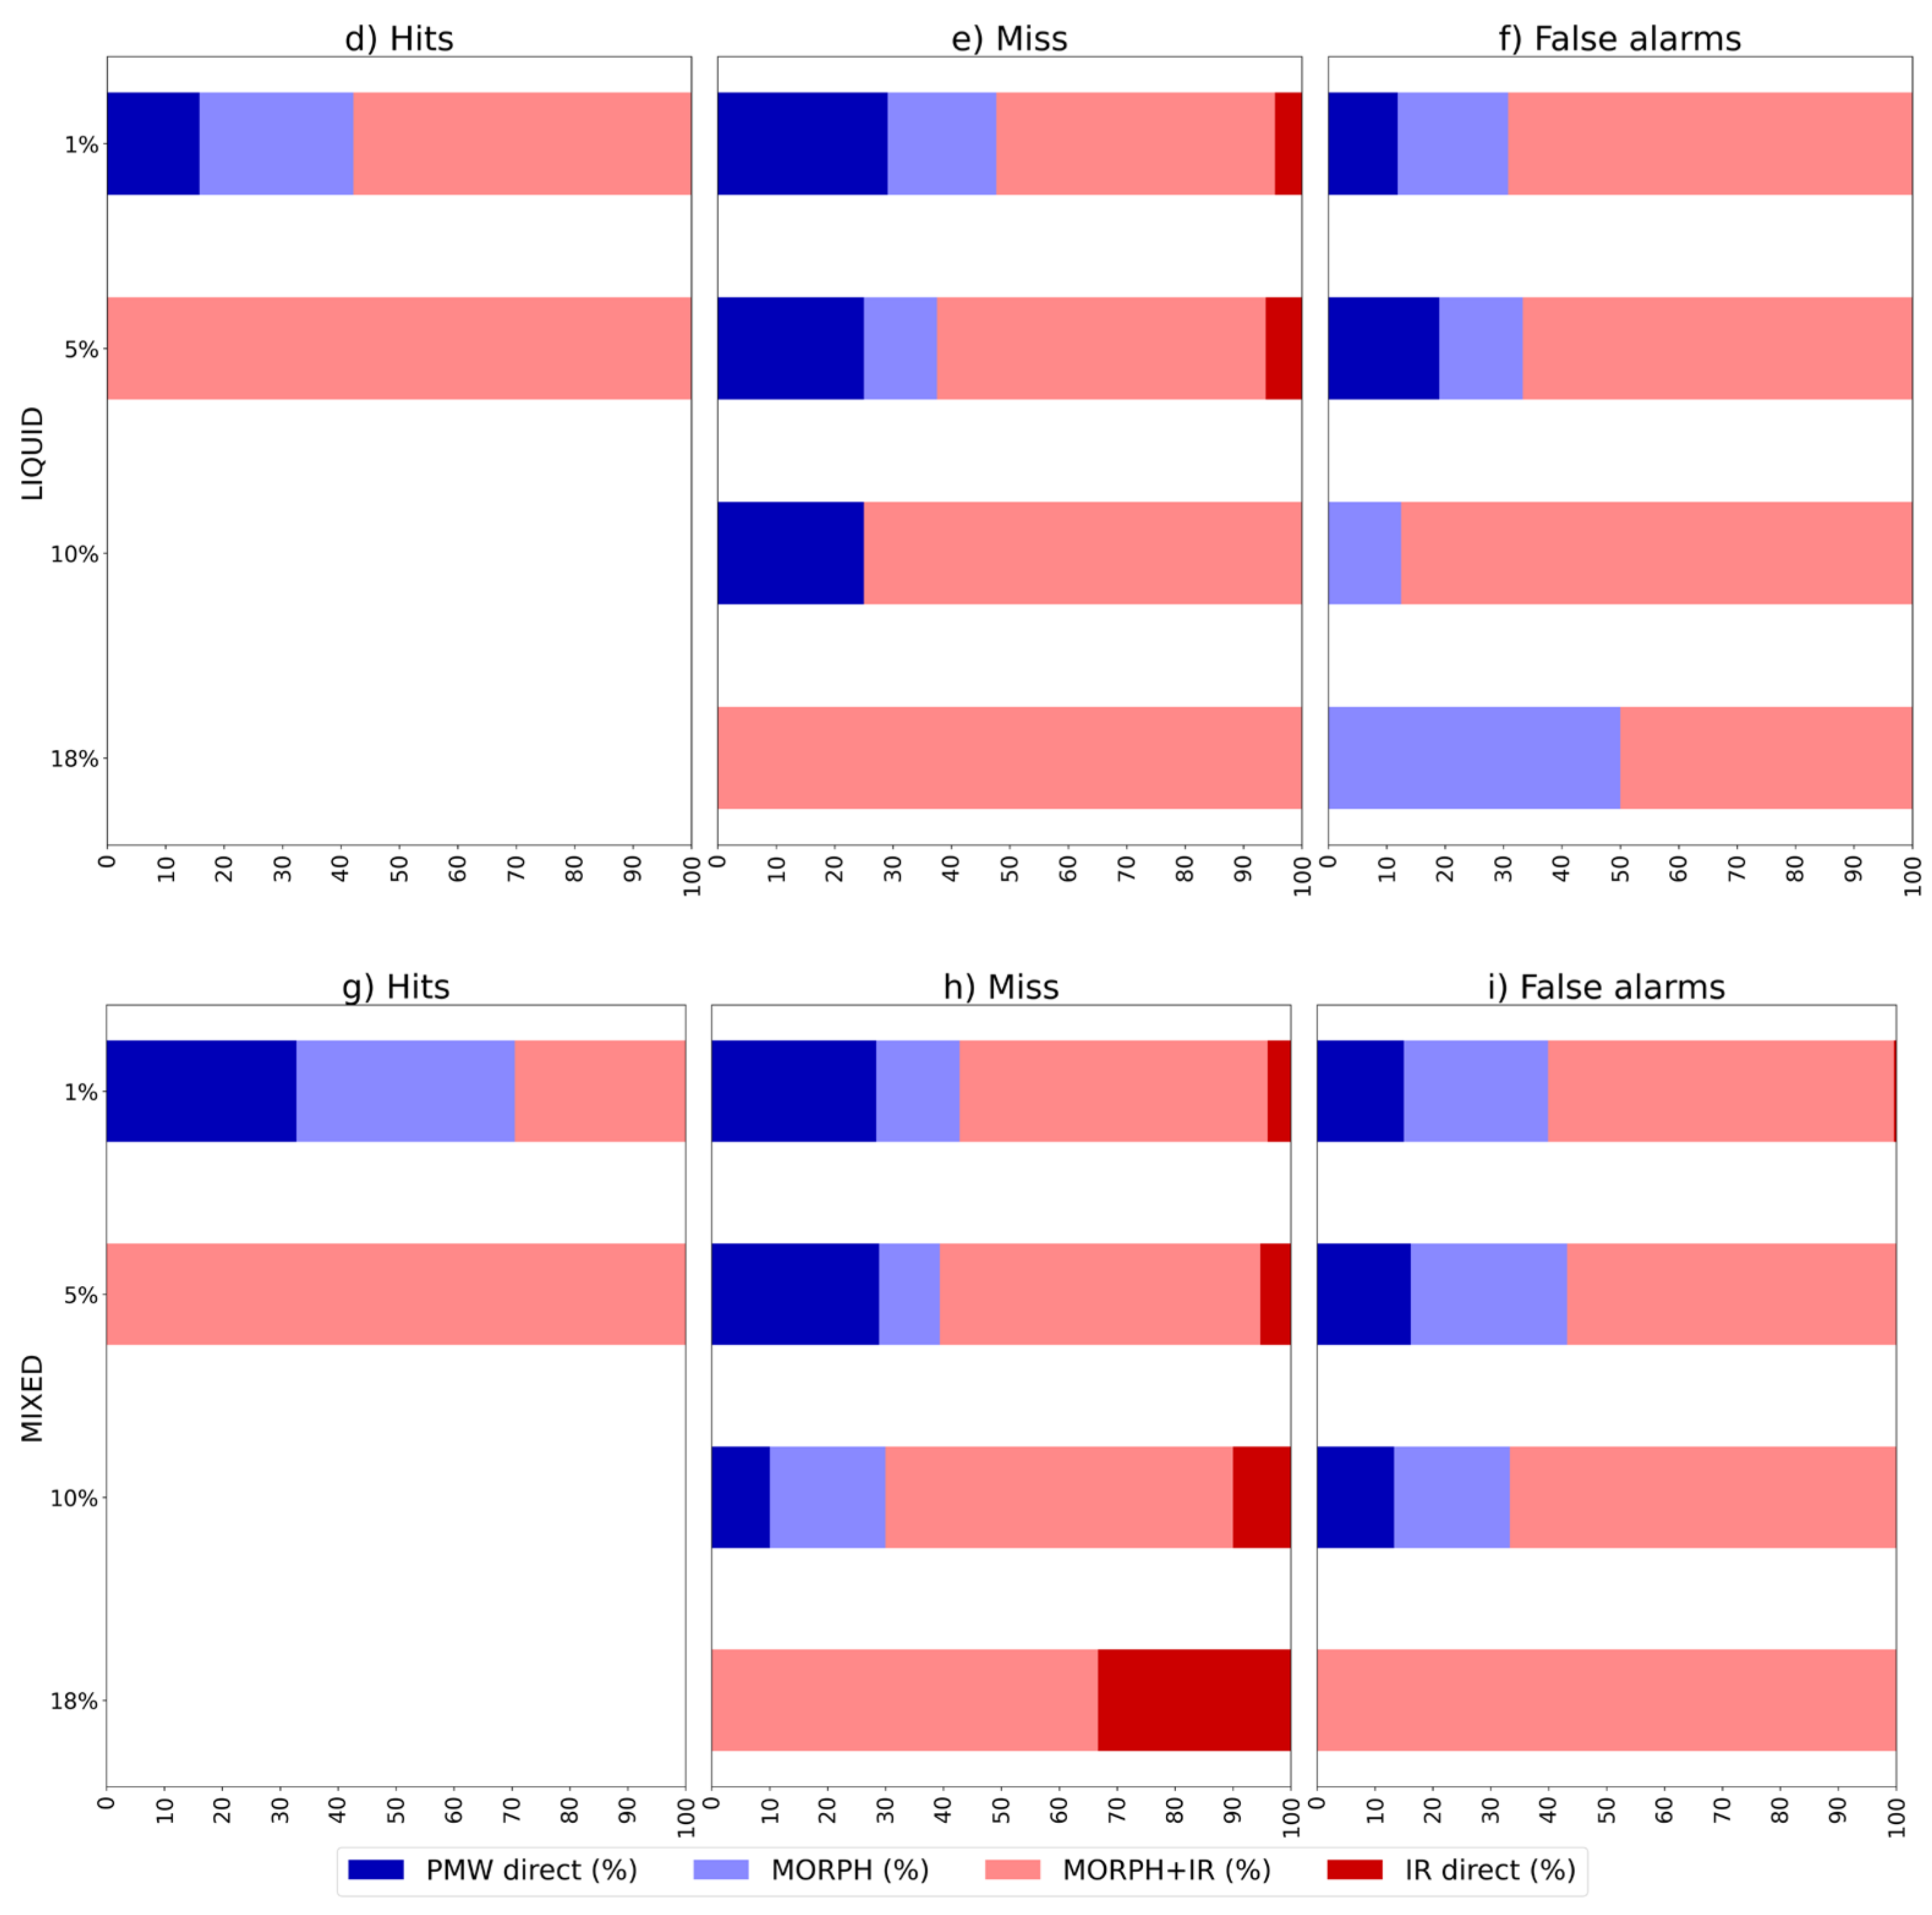
Origin of Hits, Misses, and False Alarms
Figure 9 shows the distributions of the percentages of each IMERG source causing hits, false alarms, and misses compared to RG. This analysis was also performed considering various precipitation intensity thresholds according to all case study data and divided according to the phase of the precipitating cloud.
For intensity thresholds above 1%, there are no clear differences between the IMERG sources that contribute the most to the hits; this behavior changes for the strongest intensity extremes (above 5%). The PMW-direct source was responsible for the detection of these more intense precipitation events coupled with MORPH. In fact, extremes greater than or equal to 18% represent 100% of the detected cases. However, just as they contribute to the hits, they are responsible for the generation of high false-alarm rates, especially in the ice phase.
As far as the miss rate is concerned, it is the MORPH+IR sensors, even IR direct (although in very few cases), that have the most influence. This is evident for cases related to ice clouds from thresholds ≥ 1% and is rather clear for liquid and mixed phases with thresholds ≥ 5%. The missing of extreme events ≥20 mm/30 min is entirely associated with sensors with IR information.
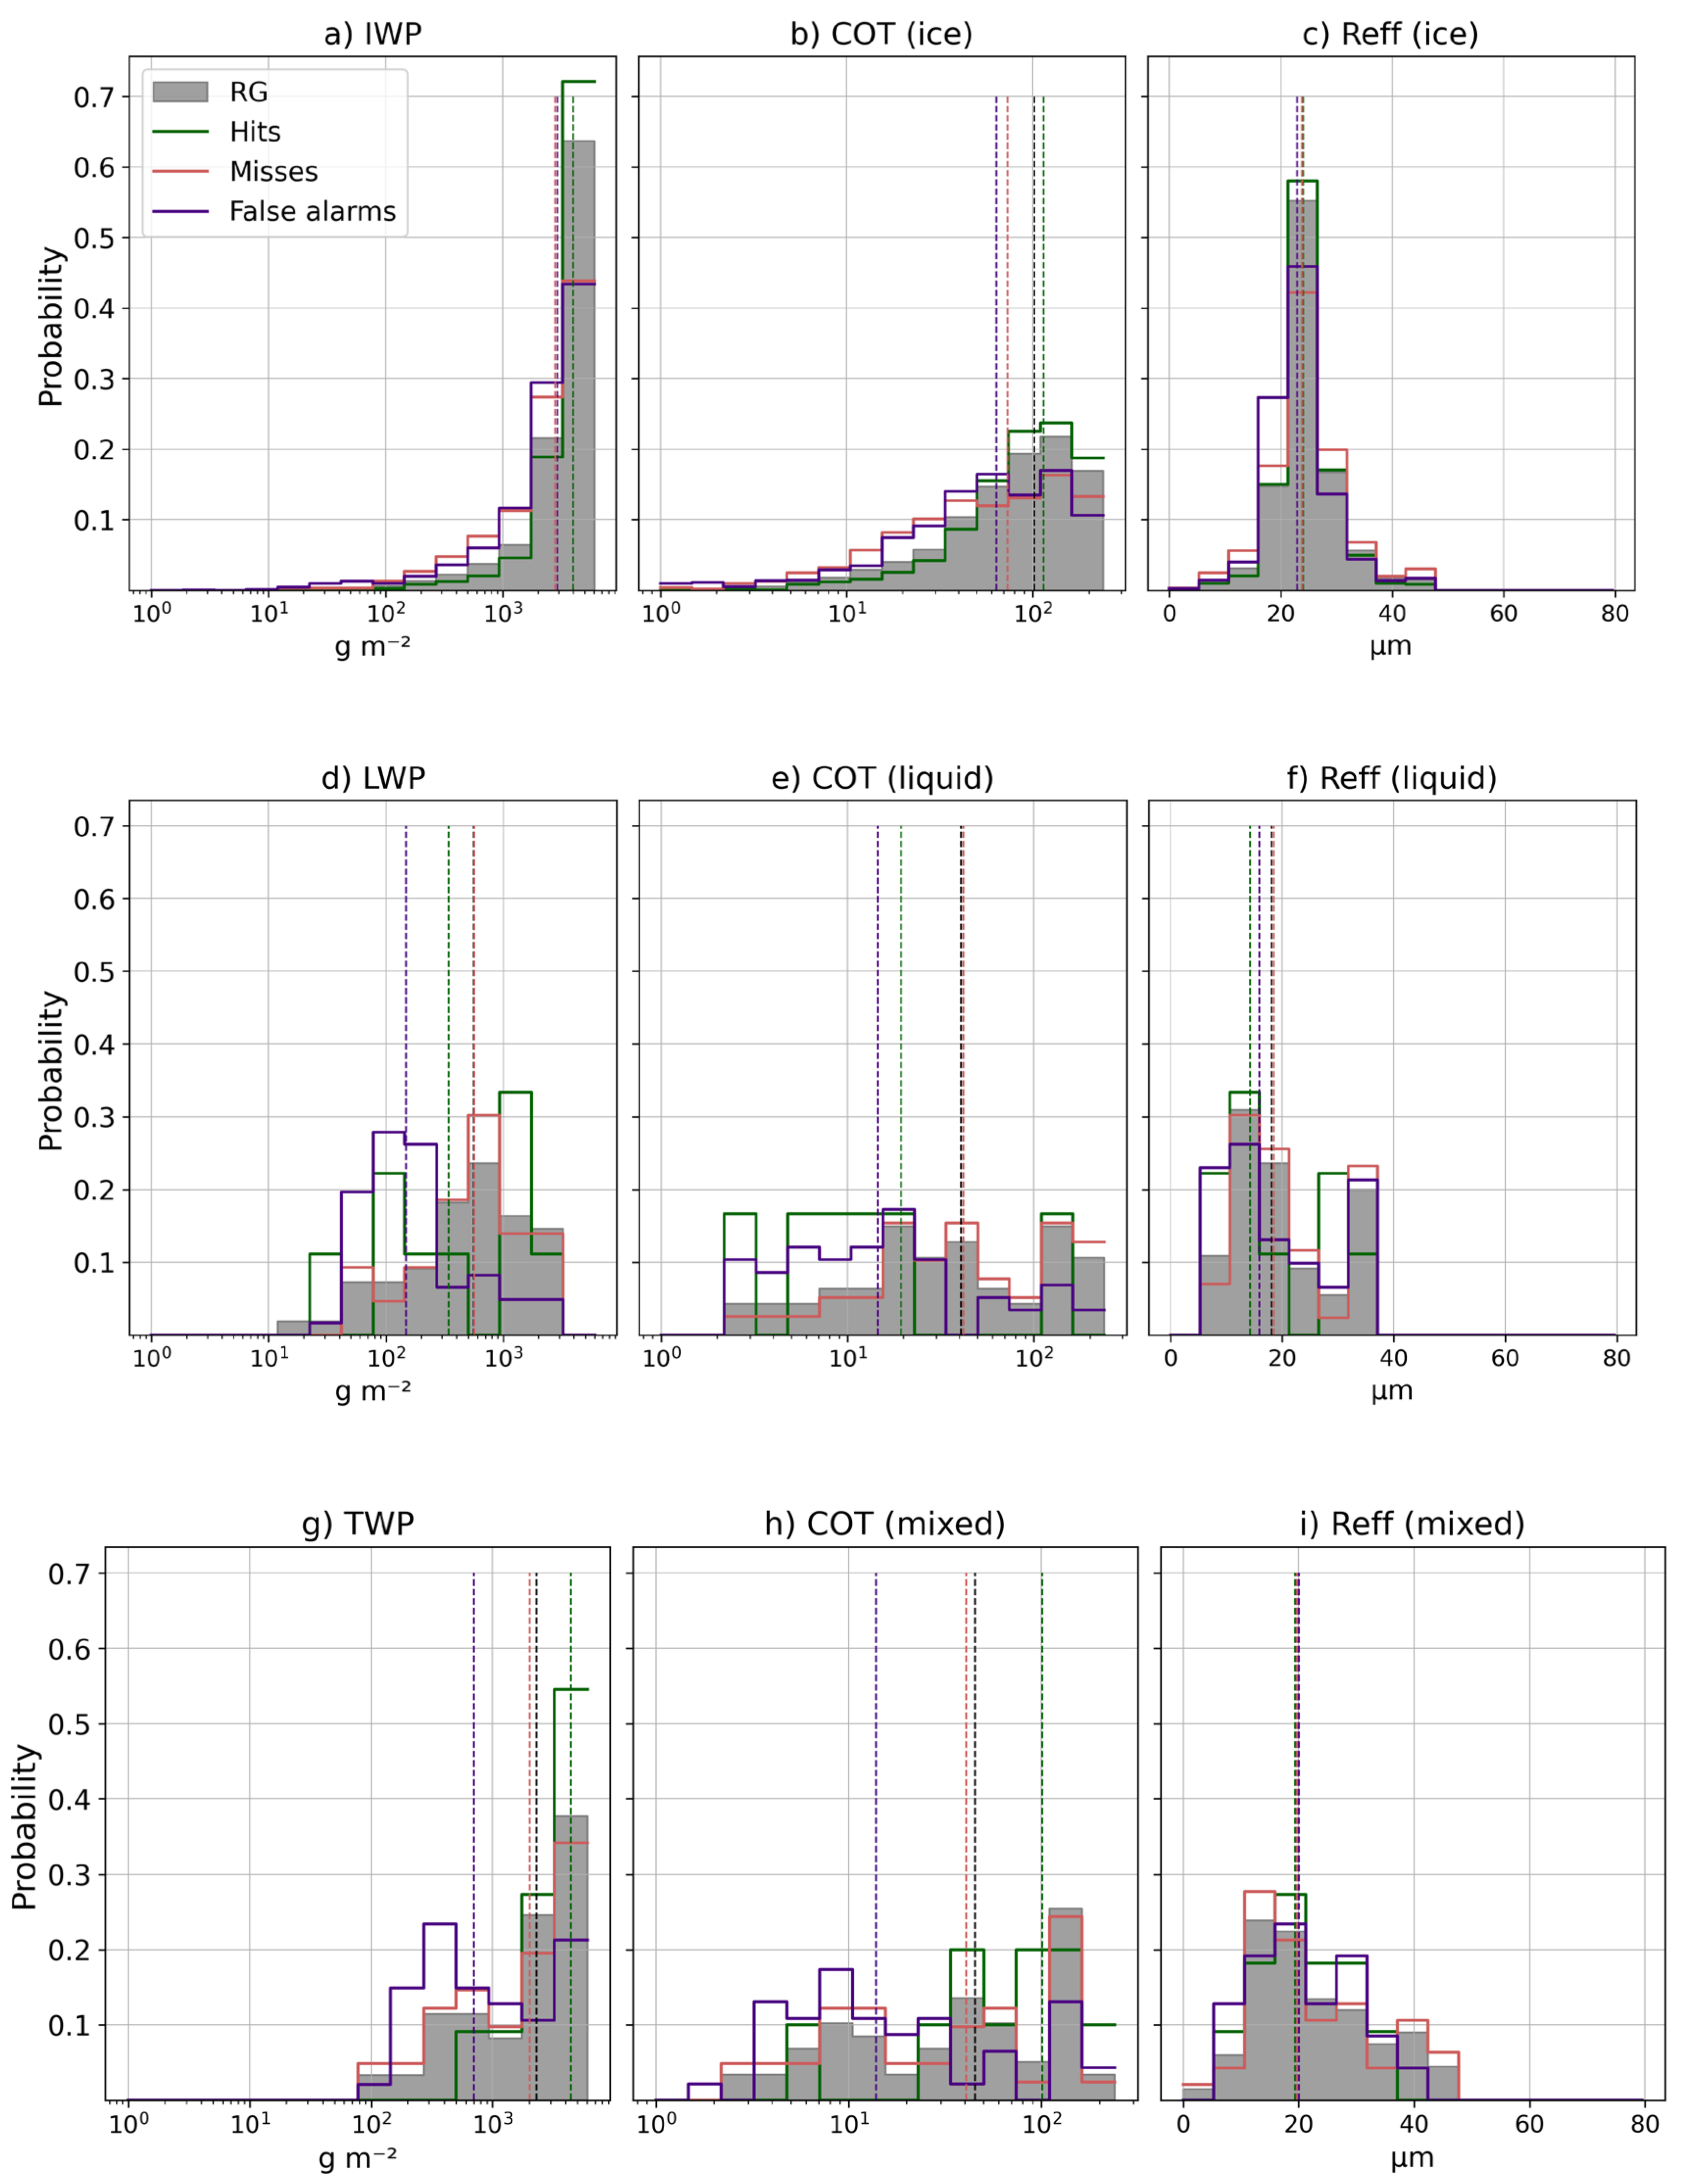
A similar analysis to that performed in the previous section is shown in
Figure 10, which focuses on the distribution of the elements of the contingency table for IMERG based on precipitation events above 1%.
The distribution of hits was very similar to that of RG. This implies that by taking the IWP as a reference, especially for high values, IMERG can detect precipitation events measured by RG. It is also evident that for lower values of IWP, the rate of false alarms and misses increases dramatically, which is directly related to the COT detection behavior. Although very similar to [
12] in this case, hits, false alarms, and misses can hardly be predicted using
Reff.
In the case of liquid and mixed-phase clouds, as indicated by the low POD and high FAR values in
Table 6, the IMERG performance decreases dramatically. Taking LWP as a reference, there are predominantly false alarms towards low LWP values, and many losses are associated with higher values. The fact that the median of the distribution of losses in the COT and
Reff is almost identical to the distribution of the RG suggests that during this phase, IMERG misinterprets the results. In the mixed phase, false alarms were associated with low TWP and COT values. In contrast, the highest frequency of hits occurred when TWP values were quite high.
4. Discussion
The errors found in IMERG at the daily and sub-daily temporal aggregations and under different precipitation intensity thresholds for heavy rainfall show several limitations that should be considered by users of these products. There is a clear underestimation of the precipitation rain gauge records, which becomes much more marked as the precipitation intensity threshold increases and as the temporal aggregation becomes shorter. The best performance in terms of the ability to detect precipitation events by IMERG is limited to relatively moderate rainfall rates (1% of the extreme rain gauge envelope curve). The errors measuring the accuracy of the estimates indicate that for temporal aggregations greater than 6 h, they start to become acceptable in terms of standard criteria (that is, POD > FAR, POD ≥ 0.5, FAR ≤ 0.5). The authors in [
13] showed similar results when defining an unacceptable probability of detection for aggregation intervals of less than 12 h. Similarly, works such as [
13,
53] show that with decreasing temporal resolution, the ratio between observations and satellite estimates improves due to the balancing effect of the temporal aggregation of rainfall over a longer period. According to the results shown in this work, for intensity thresholds higher than the 5% envelope curve, a high underestimation of IMERG, lack of detection, and the manifestation of high false-alarm rates start to be inherent in all temporal aggregations.
Another important aspect to consider is related to the fact that IMERG Late shows little improvement and, in some cases, no improvement over IMERG Early. This means that IMERG_E, because of its shorter latency, is the most reliable source in a near-real-time rainfall detection system. This strongly suggests that the negative BIAS in the identification of heavy rainfall events is not solved by increasing the amount of satellite data available later, but it is intrinsic to the algorithm used for the detection and estimation of these events.
Understanding the relationship and contribution of the different data sources used in IMERG estimates is essential for understanding their limitations. Information from direct microwave sensors (PMW-direct) provides the best results in the estimation of rainfall extremes, while those that rely more on IR information are linked to the poorest verification scores. This is directly related to the fact that microwave estimates are often better at representing precipitation than IR retrievals [
51,
52], because they are more sensitive to hydrometeor precipitation in the atmospheric column, unlike IR sensors, which are mostly limited to cloud top measurements [
14].
Despite the advantages of direct microwave sources in event detection, they are associated with the highest false-alarm rate, which is higher than the miss rate under all intensity thresholds. This means that, using these sources, IMERG can detect high precipitation intensity values, but they do not generally coincide with the time and space of rain gauge records. In this sense, it should be noted that in addition to the instrumental limitations, the results of this study must be understood from the perspective of pixel-to-point evaluation. By comparing area-averaged rainfall data within a 0.1° grid with a point measurement within this area, we assume that each rain gauge represents the average rainfall of this area with sufficient accuracy, which entails certain limitations [
54,
55,
56] much more dominant at sub-daily scales [
14].
Considering the microphysical characteristics of precipitating clouds, IMERG sources, especially PMW-direct data, are sensitive to different cloud phases and other cloud characteristics. The worst results were often related to warm and mixed clouds. This reflects the dependence of IMERG on the time at which the ice particles finally form within a convective cloud. The results reported here, although representative of a semiarid climate area in the Western Mediterranean, are largely in agreement with those of [
12] carried out in a forested area of West Africa. Although there were slight differences, the biases found in this study, especially for higher intensities, seem to be related to the IMERG processing algorithm and not to the dynamic mechanisms that originate from precipitation in each region.
5. Conclusions
The present study focused on the evaluation of IMERG Early and Late in the estimation of extreme precipitation. Based on information from 186 meteorological stations located in the Western Mediterranean region (Catalonia), several intensity thresholds derived from rain gauge records were used as a reference. The evaluation also considered different temporal aggregations, from the original GPM maximum temporal resolution to a daily scale, between 2014 and 2023. A selection of cases with semi-hourly episodes of extreme precipitation was considered to evaluate the dependencies of IMERG retrievals and their sources on cloud microphysical properties and rain gauge observations. The main conclusions of this study are as follows.
IMERG shows a marked tendency to underestimate precipitation as the rainfall intensity threshold increases and the temporal resolution increases. IMERG_L does not offer relevant advantages over the IMERG_E product in the detection of extreme events.
Although the underestimate of intense precipitation in IMERG is found for all source types, the negative bias is weaker when recoveries are due to PMW-direct data and increases when information from IR sensors is incorporated.
PMW-direct sensors generate high false-alarm rates, while the recovery algorithm with MORPH+IR sources is associated with the highest miss rates of precipitation events.
IMERG performs dramatically better in the presence of precipitating ice clouds than in warm and mixed clouds. Uncertainties in the occurrence of extreme precipitation associated with ice clouds are related to COT characteristics, as in the mixed phase. However, the estimation of intense precipitation associated with warm clouds shows the worst results and is related to other microphysical characteristics, such as COT and .
The assessment presented here is made during the changeover from IMERG 06 to 07, which includes significant changes, such as the introduction of the SHARPEN scheme. Therefore, this study contributes to the understanding of the mechanisms of extreme precipitation satellite estimates and their relationship to cloud microphysical features. This is one of the few works that considers a semi-hourly resolution to study this type of event in the Mediterranean and mid-latitudes in general. Future studies will focus, on the one hand, on the evaluation of the V07 version and check if the updates to the algorithm improve its performance regarding V06. On the other, it will also be a priority to focus on the validation of GPM core satellite observations, such as DPR and GMI, in the estimation of heavy rainfall events.


