Review

A Review of Ocean Color Algorithms to Detect Trichodesmium Oceanic Blooms and Quantify Chlorophyll Concentration in Shallow Coral Lagoons of South Pacific Archipelagos

1
Aix-Marseille Université, Université de Toulon, IRD, CNRS/INSU, Mediterranean Institute of Oceanography, MIO UM 110, 13288 Marseille, France
2
Pacific Centre for Environment and Sustainable Development (PaCE-SD), The University of the South Pacific, Laucala Campus, Suva, Fiji
3
Scripps Institution of Oceanography, University of California San Diego, 8810 Shellback Way, La Jolla, CA 92093, USA
4
Interdisciplinary Laboratory for Research in Education, EA 7483, University of New Caledonia, Avenue James Cook, Nouméa 98800, New Caledonia
5
Japan Aerospace Exploration Agency, Tsukuba 305-8505, Ibaraki, Japan
6
Bluecham SAS, Nouméa 98848, New Caledonia
7
ENTROPIE, Centre IRD de Nouméa, BP A5, Nouméa 98848, New Caledonia
8
Institute of Carbon Cycles, Helmholtz-Zentrum HEREON, Max-Planck-Str. 1, Building 70, D-21502 Geesthacht, Germany
*
Author to whom correspondence should be addressed.
Remote Sens. 2023, 15(21), 5194; https://doi.org/10.3390/rs15215194
Submission received: 6 July 2023 / Revised: 11 October 2023 / Accepted: 20 October 2023 / Published: 31 October 2023
(This article belongs to the Special Issue Oceans from Space V)

Abstract

:
The oceanic waters of the Southwest Tropical Pacific occupy a vast region including multiple Pacific Island Countries. The state of these waters is determinant for fisheries and the blue economy. Ocean color remote sensing is the main tool to survey the variability and long-term evolution of these large areas that are important for economic development but are affected by climate change. Unlike vast oligotrophic gyres, tropical waters are characterized by numerous archipelagos and islands, with deep and shallow lagoons subjected to the large impacts of the land. Strikingly large dendritic phytoplankton (Trichodesmium) blooms with high levels of chlorophyll, developing within archipelagos, as well as coastal enrichments from various origins may be observed. Algorithms to detect the presence of Trichodesmium have been developed or adapted, as well as algorithms to estimate the chlorophyll concentration ([Chl-a)]. Adapting existing [Chl-a] algorithms does not always yield high, i.e., sufficient, accuracy. A review of published regional bio-optical algorithms developed taking into account the specific phytoplankton composition and minimizing the adverse impacts of particles and the seabed bottom on [Chl-a] determination is presented, as well the bio-optical database that allowed their development. The interest of such algorithms for a variety of applications and scientific accomplishments is highlighted, with a view to further addressing the main biology and biogeochemistry questions, e.g., to determine the true impact of diazotrophs and assess lagoon [Chl-a] variability with the highest confidence. This work anticipates the use of future coarse and high-spatial-resolution and multi- and hyper-spectral satellite imagery in the Pacific.

1. Introduction

The ecological status of the seas of the archipelagos of the Southwest Tropical Pacific (SWTP) is vital for the economy of Pacific Island Countries [1,2]. The Pacific waters at 15°S in the tropical band are dominated by oligotrophic conditions with a generalized deep chlorophyll-a concentration [Chl-a] maximum, nitrate (NO3)-depleted surface waters, and surface [Chl-a] < 0.1 mg.m−3 ([3,4]). It is an N-limited, oligotrophic area characterized by a permanent deep thermocline and nutricline (up to 130 m) [5,6,7]. This defines the tropical waters as Case 1, whose inherent optical properties (IOPs) are dominated by phytoplankton (e.g., most open ocean waters). However, summer dentritic blooms develop around the archipelagos (Figure 1) with higher [Chl-a] values (Solomon Islands, New Caledonia, Vanuatu, and Fiji–Tonga), while never appearing in winter. A hypothesis in [8] is that Trichodesmium, a major colonial cyanobacterial nitrogen fixer, can form large blooms in NO3-depleted tropical oceans, as often observed from satellites [9,10,11,12,13], supported by cruise observations [14,15,16,17,18,19]. Empirical algorithms have been developed for these blooms based on the specific water reflectance of Trichodesmium [20,21]. Applications have been successful with SeaWiFS [22], though the resulting distribution of Trichodesmium in the SWTP differed from what had been expected [23]. The first attempt to discriminate surface slicks at a large scale in the open ocean of the SWTP was made using SeaWiFS reflectance at 30 km resolution, based on anomalies in the visible spectrum [24]. Another successful application in the SWTP was using MERIS and the maximum chlorophyll index (MCI) [25]. This last application succeeded in discriminating Trichodesmium in summer, where it was expected (around New Caledonia and Vanuatu: Figure 1 left and right). As reviewed by [26], in the SWTP open ocean, the condition that the near-infrared (NIR) signal is above the threshold required for discrimination is rarely observed. Inside the Great Barrier Reef, application of the MCI was successful due to the high concentration of Trichodesmium and the associated strong signal [27].
In enclosed lagoon ecosystems (e.g., coral reefs, seagrasses), like the one of New Caledonia or Fiji, optical complexity is linked to the influence of colored dissolved organic matter (CDOM) and particulate inorganic material, which implies the use of specific bio-optical algorithms [28,29]. In such Case 2 environments, the ocean color is not only influenced by other light-absorbing and light-scattering components than phytoplankton, but also by bathymetry or the “bottom effect”. In the Great Barrier Reef, the bottom effect can be huge and preponderant, and developing algorithms to reduce its impact on the retrieval of water properties from satellite imagery has been the main objective in many studies [30,31,32,33,34]. Similar to the Great Barrier Reef are the lagoons of New Caledonia, the second-longest continuous coral reefs in the world, and the Fijian lagoons that surround the two main islands. They both show large summer chlorophyll-a enrichments, possibly caused by Trichodesmium and/or large runoffs (Figure 2a,b). There, brown surface areas correspond to shallow waters, where algorithms have to be adapted (New Caledonia lagoon and south of Fiji) before applying regional algorithms for [Chl-a] or turbidity (Figure 2a,b).
Discriminating Trichodesmium as well as mapping bio-optical components from space in such shallow settings as the New Caledonia or Fiji lagoons remains challenging. In order to adapt or develop regional or local algorithms, it appears necessary for us to complete international databases with regional and local data in Case 1 and Case 2 waters, sufficiently representative of the variability of the optical environments encountered in the SWTP.
The objective of this paper is to review the work accomplished in order to answer these questions. The first part will present the in situ data set of inherent optical properties (IOPs) and remote sensing reflectance (Rrs) that was used to develop [Chl-a] algorithms for Case 1 and Case 2 waters and the satellite data selected for applications. The second part will summarize ocean color methods and algorithms in the SWTP region to assess lagoon [Chl-a], turbidity, or seabed color. The third part will highlight their effectiveness and limitations and will give an overview of the interest of such results for the understanding of the biogeochemistry of waters in the tropics and to open perspectives.

2. Data and Methods

2.1. Data

2.1.1. In Situ Reflectance and IOPs Collected in the SWTP

In order to validate our algorithms, we collected a comprehensive data set of in situ bio-optical data representative of optical variability in Case 1 and Case 2 waters in various regions and over more than 20 years. This data basis had also the advantage of being the result of validated methodologies and obtained by the same operators and instruments during that period. This set was gathered from 2000 to 2023 from New Caledonia to Fiji during oceanic and lagoon cruises and at the MOISE OSU PYTHEAS observing station. Remote sensing reflectance, Rrs, and IOPs were measured during different cruises in the SWTP and are listed in Table 1. Note that the 2000–2010 data set was already presented in [35,36].
Hyperspectral Rrs was measured by a TriOS radiometer system consisting of radiance and irradiance sensors with a spectral range of 320 nm to 950 nm, a spectral resolution of about 10 nm (sampled by every 3.3 nm), and a 7-degree field-of-view for the radiance sensor. The method developed by [37] was used to determine Rrs, i.e., the radiance sensor was mounted on a small raft to measure water-leaving radiance just below the surface, and Rrs was calculated by normalizing the water-leaving radiance with the downward solar irradiance measured on the ship [38]. [Chl-a] was measured by fluorimetry and only at a few cruises by HPLC (NASA laboratory). Turbidity was estimated from CTD Seabird profiles or from dry weights. All IOP measurements followed NASA protocols described in [35,36,39,40,41,42].
Table 1. Optical data gathered in the Southwestern Tropical Pacific from different cruises (see Reference/DOI).
CruiseYearSituationap, adg
(m−1)
bb-H6
(m−1)
Rrs
(sr−1)
Chl-a
(mg m−3)
DW
(g m−3)
Reference/DOI
FLUPAC1994Equatorial Upwellingx xx[43]
ZONAL FLUX1996Equatorial Upwellingx xx[44,45]
EBENE1996Equatorial Upwellingx xx[46]
TRICHONESIA 11998NC Vanuatu Fiji Tongaxxxxx[9,16]
TRICHONESIA 21999North Australia (Arafura Sea)xxxxxDupouy, unpub. Res.
DIAPALIS (1 to 9)2001–2004NC Loyalty Isl.xxxxx[19,36]; 10.18142/85
BISSECOTE2006NC West. lagoonxxxxx[38]; 10.17600/6100010
ECHOLAG2007NC West. lagoonxxxxx[47]; 10.17600/7100010
VALHYBIO2008NC West. lagoonxxxxx[42]; 10.17600/8100020
Lagoon surveys2001–2013NC West. lagoonxxxxx[48]; 10.17600/3100080
SPOT (1 to 14)2013–2018Vanuatu trench (6000 m)xxxxx10.18142/237
COMEVA 1,22015–2016Vanuatuxxxxx10.17600/16003500; 10.17600/16004100
OUTPACE2015NC Vanuatu Fiji Tonga Niuexxxxx[39]; 10.17600/15000900
MOANAMATY 1,22018French Polynesia xxx10.17600/18000580; 10.17600/18000887
CALIOPE 12011NC East. lagoonxxxxx[42]; 10.17600/14000900
CALIOPE 22014NC East. lagoonxxxxx[49]; 10.17600/14003900
CALIOPE 32016NC East. lagoonxxxxx[50,51]; 10.17600/16003400
MOISE station2012–2018NC West. lagoonxxxxx[52]
BULA (1 to 5)2000–2004Laucala Bay Fijixxxx [53]; 10.18142/71
Laucala Bay (1 to 4)2015–2017Laucala Bay Fijixx xx[54]
SOKOWASA2022Viti Levu-Kadavuxxxxx10.17600/18002025

2.1.2. Satellite Data Used for Our Studies

Ocean color sensors have been used for Trichodesmium algorithms (SeaWiFS: 2000–2004, MODIS on Aqua and OLCI on Sentinel 3). For coastal lagoon waters, algorithms were developed from in situ reflectance and then tested on Level 1b imagery at a 500 m resolution issued from standard MODIS processing [55]. We had the opportunity to use AVNIR-2 images with a 30 m spatial resolution and four bands in the southwest tropical lagoon of New Caledonia [56]. For these data, atmospheric and water reflectance were corrected iteratively through the retrieval of IOPs and after additional correction of the sea floor reflectance. The seabed color inversion was obtained from one of the clearest images of the MERIS sensor acquired over New Caledonia. The development of the support vector machine (SVM) algorithm for turbidity was achieved from the clearest images of MODIS providing the maximum number of match-ups. The development of the seabed color inversion in the small shallow lagoon of Voh-Kone-Pouembout, north of New Caledonia, was achieved from the clearest image of Sentinel 2 (THEIA). The application of C2RCC was performed on the Laucala Bay lagoon with Sentinel 2 data (Copernicus).

2.2. Algorithms

2.2.1. Trichodesmium Detection

To address the limitation whereby the Trichodesmium concentrations in the open ocean of the SWTP are never high and the NIR signal as measured in [22,35] is rarely above the threshold required, existing algorithms had to be refined. The algorithms all failed to detect only Trichodesmium slicks as they also captured all pixels around unmasked clouds. An adaptation of the McKinna algorithm allowed us to eliminate such ring pixels [26].

2.2.2. Estimation of [Chl-a] and Turbidity

In the deeper waters of the east coast of New Caledonia (CALIOPE cruises, Table 1), IOPs, i.e., the absorption coefficients of phytoplankton and dissolved substances + detritus (aph and adg, respectively), and the particulate backscattering coefficient (bbp) were estimated from hyperspectral Rrs data by applying linear matrix inversion [57]. Local characteristics of the IOP spectra at 45 stations were used for the candidate spectra. The [Chl-a] and IOP inversion algorithm was adapted to MODIS data and applied to Level 1b imagery at a 500 m resolution [57]. The use of a constant bottom reflectance helped in retrieving IOPs after minimizing the influence of the bathymetry. For the estimation of [Chl-a] and turbidity, we used quasi-analytical (GSM, QAA, GIOP, LMI) algorithms from satellite reflectance [49]. The retrieval of IOPs and [Chl-a] was also investigated for AVNIR-2 images with a 30 m spatial resolution and four bands [56].
Algorithms based on statistical analysis (of the support vector regression (SVR) (or support vector machine (SVM) type) were proposed to estimate [Chl-a] in the optically complex waters of the New Caledonian lagoon from MODIS-derived Rrs [58]. The algorithm was developed via supervised learning on match-ups of [Chl-a] measurements crossed with MODIS reflectance available from cruises conducted between 2002 and 2010. The best performance was obtained by combining two models, selected according to the ratio of Rrs in spectral bands centered at 488 and 555 nm used to discriminate low vs. high [Chl-a]: a log-linear model for low [Chl-a] (AFLC) developed based on support vector regression (SVR) analysis and a classic model (OC3) for high [Chl-a]. This approach outperformed the classical OC3 approach, especially in shallow waters, with the root mean squared error being about 30% lower.
For turbidity in deep waters (>20 m), a specific algorithm [38] was developed for New Caledonia waters, based on the best fits between in situ turbidity data (in FTU) and reflectance from MODIS imagery. Finally, the Case 2 Regional CoastColour (C2RCC) atmospheric correction algorithm for suspended particulate matter (in g.m−3) on Sentinel 2 imagery was applied to the deep Eastern coastal lagoon of Hienghène.
For turbidity in the oligotrophic and shallower waters of tropical lagoons, the bottom reflection of downwelling light usually hampers the use of classical optical algorithms. In order to address this issue, an SVR model was developed and tested on a large training sample of in situ turbidity values representative of the annual variability in the Voh-Koné-Pouembout lagoon (lagoon surveys; Table 1) and on the coincident water reflectance from MODIS. The SVR was trained with reflectance and two other explanatory parameters—bathymetry and bottom color. Our approach converged with a 3-parameter model that included Rrs(555), Rrs(645), and Rrs(667) as optical parameters, with bathymetry and bottom color added as explanatory variables [59].

2.2.3. Extraction of Bathymetry and Seabed Color in Shallow Lagoon Waters

As previously highlighted, both bathymetry and seabed reflectance greatly influence remotely sensed biogeochemical parameter retrievals. Many attempts were made to retrieve the bottom reflectance influence [30,33,34]. In the optically complex lagoon of New Caledonia, a test was performed from MERIS multispectral satellite images to test the influence of [Chl-a] on the depth estimation [60,61]. The variation in [Chl-a] on the image chosen, correlated with the variation in diffuse attenuation, explained the error of the depth estimation map.
In order to estimate the bottom color, an unsupervised clustering approach was applied to a clear Sentinel 2 image of the small Voh-Koné-Pouembout lagoon in New Caledonia with a complex bathymetry and bottom environments [62]. Data processing included Lyzenga’s correction for the estimation of the water column reflectance, optical spectra standardization for the attenuation of water absorption effects, and clustering using the unsupervised k-means method. This methodological approach was applied to the 497, 560, 664, and 704 nm optical bands [62].

3. Results

3.1. Variability of the Water Reflectance in the SWTP

The variability of Rrs, with values ranging from 0.003 to 0.015 sr−1 at 400 nm and reaching 0.021 sr−1 at 550 nm, was measured in waters deeper than 20 m around New Caledonia (the VALHYBIO cruise, Table 1; Figure 3a). The variability of the IOPs, i.e., the absorption coefficients of phytoplankton (ap), dissolved substances (ag, m−1 or acdom, m−1), and the particulate backscattering coefficient issued from Hydroscat-6 in situ (bb-H6, m−1), was also measured during the same cruise (Figure 3b–d; Table 1). Ocean color variability is caused by [Chl-a], turbidity, CDOM absorption [36,50,51], and the presence of the seabed (old reefs, grey bottom, or sands) as this was found in the southwestern lagoon, by comparison with open ocean waters at a sufficient distance from the barrier reefs of New Caledonia.
Specific cases of reflectance spectra near a small islet, with a peak in the green (500–600 nm) channel, were measured above sand and coral reefs of different colors, at different depths and times, with variable water attenuation due to phytoplankton and/or other (inorganic) particles and/or CDOM (Figure 3e). The Rrs, with values ranging from 0.005 sr−1 to 0.021 sr−1 at 550 nm without an evident distinction possible between corals and sands, illustrates that the remote sensing of [Chl-a], turbidity, the CDOM absorption coefficient, and, generally, IOPs above coral reefs or sandy bottoms is difficult as bottom reflectance is the major component of satellite reflectance (and the atmospheric correction schemes have to be adapted).
Spectra measured with a drifting TriOS radiometer above Trichodesmium slicks (Figure 3f) indicate that when the colony concentration is sufficiently high to be visible to the naked eye, a red and NIR signal can be detected [20,22], similar to the spectra of colonies above a filter in the laboratory [26]. The reflectance of Trichodesmium slicks between 550 and 600 nm is not easily distinguishable from the blooms of other phytoplankton species. The surface signal in the red and NIR (600–800 nm) is increasing with the thickness of the surface slick (Figure 3f). Unfortunately, this effect is never observed in radiometric vertical profiles because colonies are not concentrated enough, except in the upper 15 m, where the measurement is impacted by large light variations. Additional absorption in the UV (330 nm) from mycosporine-like amino acids (MAAs), a UV-protective pigment contained in the colony sheet, can be observed [20,26,39] but is not easily measurable by radiometers due to the generally high absorption of the water in this range. Such dense surface slicks are easily observable in closed seas and lagoons (New Caledonia, Great Barrier Reef), but remain exceptional in the open ocean, as they are rapidly dispersed by currents and winds and detectable by satellites only during extremely calm meteorological conditions.
In Laucala Bay of Suva, Fiji, Rrs is strongly influenced by the bottom and highly turbid waters issued from the large Rewa river after strong rains, and therefore reflectance is higher by an order of magnitude [38].

3.2. Trichodesmium Blooms in the SWTP

By using an adapted algorithm allowing the elimination of unmasked pixels corresponding to cloud rings, the empirical algorithms based on the ratios of NIR and red channel reflectance [63] successfully detected Trichodesmium slicks that had been observed during the 2015 OUTPACE campaign. A new, striking example of successful discrimination on MODIS and Sentinel 3 images from 6 November 2020 in open waters at the east of New Caledonia and at the south of Fiji is shown (Figure 4a–d). Even if Rrs678 nm is not so high in the slicks in Figure 3f, it may become slightly higher due to the large backscatter of large colonies and therefore be detectable at this channel. Rrs678 nm can be used to delineate thick accumulations at the surface (Figure 4a–d). Indeed, this corresponded to a period when slicks were concentrated due to exceptionally calm weather and where discrimination was successful thanks to a clear sly.

3.3. [Chl-a], IOPs, and Turbidity in New Caledonia Waters

The use of a constant sea floor reflectance helped in retrieving IOPs after minimizing the influence of the bathymetry (Figure 5a,b). The effect of such a correction of the sea floor reduces the impact of the complex bathymetry and various seabed colors on the IOP’s distributions (which appear then to be more homogeneous than with classical OC3, where all shallow waters saturate the optical signal). Numerical results show that the correction allows a decrease in the uncertainty in the scatter diagrams (Figure 6). A similar amelioration of the retrieval of inherent optical properties (IOPs) and [Chl-a] distributions from AVNIR-2 images in the southwest tropical lagoon of New Caledonia [56] is achieved after a similar correction of the sea floor reflectance (Figure 7a–e).
The results of our statistical algorithm applied on the MODIS-derived Rrs provided more accurate assessments of [Chl-a] within the whole [Chl-a] range encountered from shallow coastal waters and nearby reefs to deeper waters of the open ocean (Figure 8a–d).
The results of our statistical algorithms for turbidity also performed well. For deep waters (>20 m), the specific algorithm for New Caledonia allowed the mapping of extensive plumes of turbid waters after a tropical storm in December 2011, with turbidity values in the order of those measured during the CALIOPE 1 cruise (Table 1) (Figure 9a). Similarly, the mapping of a large-turbidity plume after a strong rain event in the Hienghène lagoon was validated by data collected during the CALIOPE 3 cruise in 2016 (Table 1) (Figure 9b).
For shallower waters <10 m, such as those of the north lagoon of Voh Koné Pouembout, the best candidate was a three-parameter model that included Rrs(555), Rrs(645), and Rrs(667) as optical parameters and two other explanatory parameters, i.e., bathymetry and bottom color. Figure 10a–d illustrate the drastic reduction in the range of the retrieved turbidity values (0 to 1 NTU, instead of 1 to 30 NTU). This approach significantly improved the model’s capacity for retrieving the in situ turbidity range from MODIS images, as compared with algorithms dedicated to deep oligotrophic or turbid waters, which were shown to be totally inadequate ([38]) (Figure 10a–d).

3.4. Bathymetry and Bottom Classification of the New Caledonia Lagoon

The estimation of the bathymetry from the MERIS image remained valid under a low (<1 mg.m−3) and constant [Chl-a] (<10% of variation). This allowed us to limit the variation in the root-mean-square error (RMSE) on the estimation of the bathymetry (15.5%) (Figure 11a). The non-linear effect of the light attenuation of the water column was corrected to obtain the absolute reflectance of the seabed. The automated supervised classification applied to the MERIS image is shown in Figure 11b,c. The two different mapped features of the seafloor (Figure 11b,c) provided the best overall accuracy (79%), as compared to in situ known seabed colors [61].
On the shallow Voh Koné Pouembout lagoon, the methodological approach applied to the 497, 560, 664, and 704 nm optical bands of a clear Sentinel 2 image (Figure 12a) allowed different bottom types (see [62]). When applied to non-standardized data, our unsupervised classification retrieved three seafloor bottom types (named clusters 1–3 in Figure 12), whereas five bottom types (named clusters 1–5 in Figure 12) could be retrieved using standardized data (standardized Rrs whose average is 0 and standard deviation is 1). For each of these two trials, the computed membership values explained more than 75% of the inertia in each Sentinel 2 wavelength band used for the clustering. The accuracy of the method was slightly improved when applied to data corrected for attenuation (Figure 12b,c).

4. Discussion

4.1. Performance and Limitations of Our Algorithms for the SWTP

4.1.1. Trichodesmium Algorithms

Many gaps are found in the identification of Trichodesmium from satellite remote sensing. Algorithms developed for the discrimination of surface blooms [20,22,24,26] are successful when atmospheric corrections are used appropriately above surface mats of Trichodesmium (i.e., keeping the NIR reflectance) and when Trichodesmium is dominant [39]. As observed during many cruises, the total [Chl-a] in the upper surface layer reflects not only Trichodesmium colonies but also the phytoplankton associated with it (symbiotic diatoms [14,16] and/or non-diazotroph species such as picoplankton [15,19,39]). The ability to positively discriminate and quantify low background concentrations of Trichodesmium (e.g., <3200 trichomes L−1), dispersed within the water column, has been described as a difficult task [26]. Moreover, slick formation is strongly governed by highly unstable, dynamic, fine-scale physical structures [65]. Discriminating Trichodesmium in such cases was not successful, even in summer in the SWTP, as thick slicks form preferentially in warmer and stable waters. One example was during the Diapalis 07 cruise in February 2003, where a dendritic bloom with high [Chl-a] seen by MODIS corresponded to observed slicks and high Trichodesmium concentrations (>3000 trichomes/L [19]) but where the algorithm did not detect the specific spectral signature (Figure 13). Another gap in assessing the spatiotemporal distribution of Trichodesmium [19] is the rapid temporal succession between this main diazotroph species and other phytoplankton fueling it or fueled by it, which is yet to be analyzed. In order to validate Trichodesmium detection algorithms at a large scale, the global data basis should include their main pigment (phycoerythrin). The phycoerythrin pigment is not detectable by HPLC and almost never measured during cruises. The global data basis should also contain information on size-fractionated pigments [Chl-a] (>10 µm). To conclude, the spectral and spatial resolutions of current ocean-color sensors are a limiting factor for quantitative Trichodesmium remote sensing at a large scale. Future efforts with ocean color will concern the estimation of the contribution of Trichodesmium to SWTP carbon and nitrogen fixation by diazotrophs, and the understanding of their seasonal and interannual variability in the SWTP.

4.1.2. Coastal Algorithms

For [Chl-a], regionally tuned algorithms may potentially improve the retrievals, but better parameterization schemes that consider the spatiotemporal variability of the specific IOPs are still needed. Supervised learning methods provided a regional optimal estimation of IOPs and [Chl-a], with better accuracy (<20% for [Chl-a]) and an improvement by a factor of 10 for turbidity in the shallowest lagoons of New Caledonia. Local optimal estimations of IOPs have been successful for low- and high-resolution imagery for the target areas. Our results pointed out that not only the bathymetry but also the seabed color influence had to be determined in order to be injected as an additional variable in the SVRs. The limitation of the incomplete knowledge of the seabed influence to improve the remote sensing of biogeochemical indicators such as [Chl-a] and turbidity in fragile coastal environments was corrected by different methods. Inversion procedures and unsupervised clustering have provided the seabed color at different scales and for some test areas of the New Caledonia lagoon. The estimation of the seabed reflectance from unsupervised classification in the whole lagoon area from high-resolution data will allow us to definitively address the problem and account for the bottom effect (bathymetry + seabed color) in the next SVRs. Indeed, when the seabed reflectance is too high and waters too shallow, no estimate of the water column property is possible. Moreover, uncertainty exists in extremely turbid waters such as those of Laucala Bay (with shallow bottoms and turbidity of an order of magnitude higher than in New Caledonia) [38]. For these extremely turbid waters in enclosed bays, adapted algorithms using the NIR bands of sensors are still in test [66]. As soon as they propagate in oceans, particles and phytoplankton show dynamic coupling and decoupling patterns according to time and space, which are being explored in order to characterize the real impacts on coral reefs (Figure 14) [66].

4.2. Scientific Accomplishments and Perspectives from Ocean Color Remote Sensing in the SWTP

Ocean color has greatly helped to address questions about mesotrophy in the archipelagos of the SWTP through the identification of Trichodesmium blooms and tools adapted to the survey of tremendous variations in coastal areas around islands.

4.2.1. Novel Collection and Utilization of In Situ Optical Signatures

Long-term observation stations allowing bio-optical measurements are scarce in the SWTP (except on the Great Barrier Reef). Even Bio-Argo floats equipped with backscattering and fluorescence sensors are not numerous. Cruises have allowed gliders equipped with CDOM fluorometers, and many research cruises including bio-optical measurements together with carbon and nitrogen fluxes have provided an unprecedented view of mesotrophy in the SWTP. Linking in situ reflectance and IOP data is still a challenge due to the small amount of data. It is crucial to complete and archive data sets of Rrs and IOPs. An observation station was launched in 2012 in the southwestern lagoon of New Caledonia (MOISE, MOoring bIogeochemical Survey [52]), which could offer a means of observing trends in bio-optical parameters at 21°S together with coral reef surveys. The collection of Trichodesmium spectra should be multiplied to try to understand the link between abundances and spectral signatures and be able to better characterize their spatial patterns with new ocean color sensors.

4.2.2. Algal Blooms and the Detection of Trichodesmium

Algal blooms are indicators of the health of marine ecosystems, making their monitoring crucial for the effective management of coastal and oceanic resources. Although the maximal biomass of algal blooms in the SWTP is significantly lower than that in the Northern Hemisphere, their impact on carbon fixation in the ocean can still be substantial. Despite previous efforts, there remains a lack of comprehensive sampling of diazotrophs and assessment of nitrogen fixation levels in the ocean. Recent estimates indicate a significant increase in global oceanic nitrogen fixation, primarily driven by the Indian Ocean and the South Pacific Ocean, which contribute approximately 42% of the global nitrogen fixation. The South Pacific Ocean has been identified as a “hot spot” for diazotrophy due to iron and phosphate fertilization [67,68,69,70,71]. Trichodesmium blooms, detected through ocean color remote sensing, can introduce a substantial amount of nitrogen into the water column, and their impact should be further explored in comparison to monthly, seasonal, and yearly rates. Previous studies have successfully attributed large dendritic mesotrophic areas in the SWTP to Trichodesmium [9,10,11,12,13] and algorithms have been developed to retrieve their surface accumulations [20,26,63]. Additionally, satellite ocean color data and analyses of atmospheric dust could potentially explain large dendritic cross-tropical area blooms, especially if they are associated with the widespread transport of volcanic ash [72]. Volcanic eruptions in the Tonga trench may also contribute to the mesotrophy of the whole SWTP as, indeed, although the impact was minimal on [Chl-a] at the time of eruption [73,74], subsequent chlorophyll-a enrichment occurred with a significant temporal lag, and as eruptions are regular, this effect could provide nutrients usable by phytoplankton to the west of the Pacific region. The drift of material, including phytoplankton or Trichodesmium colonies, entrained by the rafts to the west, could act as a future source of productivity in more favorable zones around Fiji and other archipelagos [73]. Other physical environment changes favoring the supply of essential nutrients [75,76,77] or leading to deep trench degassing [78] and cyclones [79] could also be invoked.

4.2.3. Following Biogeochemistry of Pacific Island Lagoons

Ocean color remote sensing is the only means to estimate seasonal variability and responses to episodic events, as well as to assess trends in the health of tropical lagoon waters amidst global climate change and increasing anthropization [31,32]. These aspects can be better captured in the future with ocean color sensors providing more frequent coverage. Among the factors that significantly contribute to increased mesotrophy in archipelagos are intense runoffs resulting from tropical storms and cyclonic activity that modify the upper layer structure [80,81,82]. This mesotrophy is likely more pronounced in high islands, such as Vanuatu and New Caledonia (Figure 8). These effects have been observed extending from the rivers off Hienghène (Figure 9) or reef passages near the Rewa river south of Fiji, reaching hundreds of kilometers into the ocean [30]. As soon as they propagate in oceans, particles and phytoplankton show dynamic coupling and decoupling patterns according to time and space, which are being explored in order to characterize the real impacts on coral reefs (Figure 14) [66]. Runoffs impact not only [Chl-a] but also CDOM, which has been shown to contribute significantly to light absorption in lagoons after rainfall [50,51,52,83]. Large amounts of high [Chl-a] and other materials, such as mineral particles, can be transported effectively, transferring contaminants and nutrients far from the land. These phenomena should be monitored using ocean color sensors with better temporal resolutions. The understanding of river impacts on the pristine lagoons of the northeastern coast of New Caledonia, which are classified by UNESCO as World Heritage Sites, is of great value. Moreover, these findings reinforce the potential utility of OC-CCI products and satellite-based ocean color remote sensing in general for the monitoring of phytoplankton dynamics in all Pacific Island coasts. In a major way, [Chl-a] will be useful in validating 3D coupled physical–biogeochemical models, which are now able to reproduce the complex ocean–lagoon interface [84,85,86]. New empirical evidence has indicated that spatial gradients in nearshore primary production (PP) around reef islands can directly influence the nutritional status of corals on shallow reefs [87]. This hypothesis suggests that corals living in mesotrophic waters, which are relatively enriched with nutrients and plankton compared to oligotrophic waters, are more resilient to bleaching, as they can survive for longer periods without their symbionts [88]. As PP is strongly correlated with satellite-derived estimates of [Chl-a], monitoring [Chl-a] will help to test whether corals can compensate by relying on heterotrophic feeding until the environmental conditions improve and symbiont stability is reestablished [88]. Trichodesmium may be, in some tropical lagoons, a major component of phytoplankton composition (as in the ones of New Caledonia and Fiji), with slicks observed in summer [89,90,91,92], which should be followed with high-resolution sensors.

4.2.4. Long-Term Changes in the Ocean with Climate Change

One question arising is whether chlorophyll-a, diazotrophs, or runoffs will increase or decrease with climate change (sea surface temperature increase, salinity decrease, acidification) in the SWTP. The analysis of CMEMS data from the past two decades indicates an unexplained increasing trend in [Chl-a] in the Fiji–Tonga region, contrasting with a decreasing trend observed in the New Caledonia–Vanuatu region. It remains unclear whether these trends are associated with changes in phytoplankton composition [93], as satellite ocean color data have not yet provided documentation on this aspect. [Chl-a] in the Western Tropical Pacific Ocean appears to be sensitive to the Multivariate ENSO index and the Modoki El Nino index, although the effects in tropical regions and archipelagos are hardly detectable [94]. Reflectance anomaly approaches [95,96,97] applied on hyperspectral sensor reflectance will help in predicting the whole food chain changes in the ocean.

5. Conclusions

To address the questions of what governs chlorophyll variability in the southwest tropical archipelagos and lagoons and what are the predicted trends with climate change, it is necessary to look at [Chl-a] time series issued from satellite ocean color remote sensing as a function of environmental parameters and climatic indices, in addition to genetic analysis. These analyses require the discrimination of Trichodesmium, the major nitrogen-fixing species, from other phytoplankton, and applying regionally adapted algorithms to coastal ocean and coral lagoons including reefs.
Algorithms for the detection of Trichodesmium, as well as for the estimation of chlorophyll concentrations in tropical lagoons, have been developed or adapted for the oligo- to meso- South Pacific tropical waters, principally over New Caledonia and South Fiji. In order to validate them, we used a comprehensive data set of in situ bio-optical data representative of optical variability in Case 1 and Case 2 waters collected in various regions and over more than 20 years. This database has also the advantage of being the result of validated methodologies and obtained by the same operators and instruments during that period. The algorithms developed for Trichodesmium have been tested on different sensors with different spatial resolutions and the main improvement concerns the discrimination of Trichodesmium slicks from other phytoplankton patches in pixels obtained after atmospheric corrections, which was the main limitation for automatic detection. These promising results provide hope that future next-generation sensors, offering higher spectral resolutions and increased repetitiveness, both in low-Earth and geostationary orbits, will enhance efforts to remotely sense global Trichodesmium and other phytoplankton’s abundance in the SWTP.
The algorithms developed for the better estimation of [Chl-a] in tropical lagoons result from a wide range of approaches, including quasi-empirical regression and classical optical inversion. The use of SVM was particularly well adapted to tropical lagoons, where in situ data were available, even if these are still restricted in number, compared to European waters. The non-parametric algorithms, although a priori adapted only to the studied areas where in situ measurements are available, may be tested for the same types of limitations encountered in other Pacific Island coastal areas. They proved to greatly improve the estimations of [Chla] and turbidity in shallower areas. Unsupervised clustering provided the seabed color at different scales and for some test areas of the New Caledonia lagoon. These methods are promising and will allow one to account effectively for the bottom effect (bathymetry + seabed color) in the next SVMs that will be used on other tropical lagoons and high-resolution sensors.
Both oceanic and coastal oceans are vital for the economy of Small Island Developing states, and multivariate correlative analysis will help to quantify ecosystem changes over spatial and temporal scales relevant to human activity and how they respond to natural and anthropogenic disturbances.

Author Contributions

Conceptualization, C.D. and R.F.; methodology, H.M., R.R., J.L., G.W., A.W. and H.M.; software, G.W. and H.M.; validation, C.D. and R.F.; formal analysis, G.W. and H.M.; investigation, C.D. and R.F.; resources, C.D., R.F. and G.W.; data curation, G.W., H.M. and J.L.; writing—original draft preparation, C.D. and J.T.; writing—review and editing, C.D., J.T. and R.F.; visualization, G.W. and R.A.; supervision, C.D. and R.F.; project administration, C.D. and A.S.; funding acquisition, C.D. All authors have read and agreed to the published version of the manuscript.

Funding

Projects were funded by PROOF FLUPAC, GOPS, ANR OUTPACE, INSU PNTS, INSU EC2CO, and LEFE CYBER GLI-FI GLIder in FIji, ReefTEMPS, OSU PYTHEAS, and IRD. Part of this research received external funding by the Centre de Recherche pour le Nickel et son Environment (CNRT) as a part of CNRT.IRD/DYNAMINE). The project benefited from the Fonds Pacifique Colour of the Ocean by Satellite Methods Exchanges in the Tropical Environment project (COMETE). R.F. and J.T. were supported by the National Aeronautics and Space Administration under various grants.

Data Availability Statement

The in-situ optical dataset presented in the study is available from the corresponding author upon reasonable request.

Acknowledgments

We thank all contributors for the in situ bio-optical cruise data in the Southwestern Tropical Pacific South Ocean as well in lagoons in New Caledonia and Fiji (during cruises Flupac, Zonal Flux, Ebene, Trichonesia—1998–1999, Valhybio—2008; Diapalis—2000–2001–2002–2003, Caliope—2011–2014–2016, Outpace—2015, Sokowasa—2022 South of Fiji, and the MOISE observation station). We thank the Flotte Océanographique Française (FOF) and particularly the crews of the R/V Alis and IRD UAR IMAGO. We gratefully acknowledge the NASA Ocean Biology Processing Group (OBPG) for making the MODIS ocean color imagery and products available, as well as the European Spatial Agency (ESA), the Centre National d’Etudes Spatiales (CNES), and Theia, which produce and provide Sentinel 2 images and satellite products. We thank the Japan Aerospace Exploration Agency (JAXA) for making available the TriOS radiometers.

Conflicts of Interest

The authors declare no conflict of interest.

References

  1. Holland, E.; von Schuckmann, K.; Monier, M.; Legeais, J.-F.; Prado, S.; Sathyendranath, S.; Dupouy, C. Copernicus Marine Service Ocean State Report, Issue 3. J. Oper. Oceanogr. 2019, 12 (Suppl. S1), s43–s48. [Google Scholar] [CrossRef]
  2. Ganachaud, A.; von Schuckmann, K.; Whiteside, A.; Dupouy, C.; Le Meur, P.-Y.; Monier, M.; van Wynsberge, S.; De Ramon N’Yeurt, A.; Costa, M.; Aucan, J.; et al. CMEMS SST and Chl-a Indicators for Two Pacific Islands: A Co-Construction Monitoring Framework for an Integrated, Transdisciplinary, Multi-Scale Approach. J. Oper. Oceanogr. 2022, 16, 1–15. [Google Scholar]
  3. Dandonneau, Y.; Gohin, F. Meridional and Seasonal Variations of the Sea Surface Chlorophyll Concentration in the Southwestern Tropical Pacific (14 to 32° S, 160 to 175° E). Deep Sea Res. 1984, 31, 1377–1393. [Google Scholar] [CrossRef]
  4. Dandonneau, Y.; Lemasson, L. Water-Column Chlorophyll in an Oligotrophic Environment: Correction for the Sampling Depths and Variations of the Vertical Structure of Density, and Observation of a Growth Period. J. Plankton Res. 1987, 9, 215–234. [Google Scholar] [CrossRef]
  5. Blanchot, J.; Rodier, M. Picophytoplankton Abundance and Biomass in the Western Tropical Pacific Ocean during the 1992 El Niño Year: Results from Flow Cytometry. Deep Sea Res. 1996, 43, 877–895. [Google Scholar] [CrossRef]
  6. Le Bouteiller, A.; Blanchot, J.; Rodier, M. Size Distribution Patterns of Phytoplankton in the Western Pacific: Towards a Generalization for the Tropical Open Ocean. Deep Sea Res. 1992, 39, 805–823. [Google Scholar] [CrossRef]
  7. Ceccarelli, D.M.; McKinnon, A.D.; Andréfouët, S.; Allain, V.; Young, J.; Gledhill, D.C.; Flynn, A.; Bax, N.J.; Beaman, R.; Borsa, P.; et al. Chapter Four—The Coral Sea: Physical Environment, Ecosystem Status and Biodiversity Assets. In Advances in Marine Biology; Lesser, M., Ed.; Academic Press: Cambridge, MA, USA, 2013; Volume 66, pp. 213–290. [Google Scholar]
  8. Wilson, C.; Qiu, X. Global Distribution of Summer Chlorophyll Blooms in the Oligotrophic Gyres. Prog. Oceanogr. 2008, 78, 107–134. [Google Scholar] [CrossRef]
  9. Dupouy, C.; Petit, M.; Dandonneau, Y. Satellite Detected Cyanobacteria Bloom in the Southwestern Tropical Pacific Implication for Oceanic Nitrogen Fixation. Int. J. Remote Sens. 1988, 9, 389–396. [Google Scholar] [CrossRef]
  10. Dupouy, C. La chlorophylle de surface observée par le satellite NIMBUS-7 CZCS autour de la Nouvelle Calédonie et de ses dépendances. Une première analyse. Bull. L’institut Océanographique Monaco 1990, 6, 125–148. [Google Scholar]
  11. Dupouy, C. Discoloured Waters in the Melanesian Archipelago (New Caledonia and Vanuatu). The Value of the Nimbus-7 Coastal Zone Colour Scanner Observations. In Marine Pelagic Cyanobacteria: Trichodesmium and other Diazotrophs; Carpenter, E.J., Capone, D.G., Rueter, J.G., Eds.; NATO ASI Series; Springer: Dordrecht, The Netherlands, 1992; pp. 177–191. ISBN 978-94-015-7977-3. [Google Scholar]
  12. Dupouy, C.; Neveux, J.; Subramaniam, A.; Mulholland, M.R.; Montoya, J.P.; Campbell, L.; Carpenter, E.J.; Capone, D.G. Satellite Captures Trichodesmium Blooms in the Southwestern Tropical Pacific. Eos Trans. Am. Geophys. Union 2000, 81, 13–16. [Google Scholar] [CrossRef]
  13. Dupouy, C.; Neveux, J.; Le Bouteiller, A. Spatial and temporal analysis of SeaWIFS sea surface chlorophyll, temperature, winds and sea level anomalies in the South Tropical Pacific Ocean (10° S–25° S, 150° E–180° E). In Proceedings of the 6ème Conférence PORSEC, Pan Ocean Remote Sensing Conference, Gayana, Conception, Chili, 29 November–3 December 2004; Gayana, Conception (Chili). Gayana 68(2) Suppl. I. Proc.. pp. 161–166. [Google Scholar] [CrossRef]
  14. Dupouy, C.; Dirgerg, G.; Tenório, M.M.B.; Neveux, J.; Le Bouteiller, A. Surveillance des Trichodesmium autour de la Nouvelle-Calédonie, du Vanuatu, de Fidji et de Tonga 1998–2004. Arch. Sci. Mer. 2004, 7, 51. Available online: https://horizon.documentation.ird.fr/exl-doc/pleins_textes/divers14-03/010049853.pdf (accessed on 19 October 2023).
  15. Campbell, L.; Carpenter, E.; Montoya, J.P.; Kutska, A.B.; Capone, D. Picoplankton community structure within and outside a Trichodesmium bloom in the Southwestern Pacific Ocean. Vie Milieu 2005, 55, 185–195. [Google Scholar]
  16. Neveux, J.; Tenório, M.M.B.; Dupouy, C.; Villareal, T.A. Spectral diversity of phycoerythrins and diazotrophs abundance in tropical South Pacific. Limnol. Oceanogr. 2006, 51, 1689–1698. [Google Scholar] [CrossRef]
  17. Moisander, P.H.; Beinart, R.A.; Hewson, I.; White, A.E.; Johnson, K.S.; Carlson, C.A.; Montoya, J.P.; Zehr, J.P. Unicellular Cyanobacterial Distributions Broaden the Oceanic N2 Fixation Domain. Science 2010, 327, 1512–1514. [Google Scholar] [CrossRef] [PubMed]
  18. Shiozaki, T.; Kodama, T.; Furuya, K. Large-Scale Impact of the Island Mass Effect through Nitrogen Fixation in the Western South Pacific Ocean. Geophy. Res. Lett. 2014, 41, 2907–2913. [Google Scholar] [CrossRef]
  19. Tenório, M.; Dupouy, C.; Rodier, M.; Neveux, J. Trichodesmium and other Filamentous Cyanobacteria in New Caledonian waters (South West Tropical Pacific) during an El Niño Episode. Aquat. Microb. Ecol. 2018, 81, 219–241. [Google Scholar] [CrossRef]
  20. Subramaniam, A.; Carpenter, E.J.; Karentz, D.; Falkowski, P.G. Bio-Optical Properties of the Marine Diazotrophic Cyanobacteria Trichodesmium spp. I. Absorption and Photosynthetic Action Spectra. Limnol. Oceanogr. 1999, 44, 608–617. [Google Scholar] [CrossRef]
  21. Subramaniam, A.; Brown, C.W.; Hood, R.R.; Carpenter, E.J.; Capone, D.G. Detecting Trichodesmium Blooms in SeaWiFS Imagery. Deep Sea Res. 2001, 49, 107–121. [Google Scholar] [CrossRef]
  22. Hu, C.; Cannizzaro, J.; Carder, K.L.; Muller-Karger, F.E.; Hardy, R. Remote Detection of Trichodesmium Blooms in Optically Complex Coastal Waters: Examples with MODIS Full-Spectral Data. Remote Sens. Environ. 2010, 114, 2048–2058. [Google Scholar] [CrossRef]
  23. Westberry, T.K.; Siegel, D.A.; Subramaniam, A. An Improved Bio-Optical Model for the Remote Sensing of Trichodesmium spp. Blooms. J. Geophys. Res. Oceans 2005, 110, C06012. [Google Scholar] [CrossRef]
  24. Gower, J.; King, S.; Young, E. Global remote sensing of Trichodesmium. Int. J. Remote Sens. 2014, 35, 5459–5466. [Google Scholar] [CrossRef]
  25. Dupouy, C.; Benielli-Gary, D.; Neveux, J.; Dandonneau, Y.; Westberry, T.K. An Algorithm for Detecting Trichodesmium Surface Blooms in the South Western Tropical Pacific. Biogeosciences 2011, 8, 3631–3647. [Google Scholar] [CrossRef]
  26. McKinna, L.I.W. Three Decades of Ocean-Color Remote-Sensing Trichodesmium spp. in the World’s Oceans: A Review. Prog. Oceanogr. 2015, 131, 177–199. [Google Scholar] [CrossRef]
  27. Blondeau-Patissier, D.; Brando, V.E.; Lønborg, C.; Leahy, S.M.; Dekker, A.G. Phenology of Trichodesmium spp. Blooms in the Great Barrier Reef Lagoon, Australia, from the ESA-MERIS 10-Year Mission. PLoS ONE 2018, 13, e0208010. [Google Scholar] [CrossRef]
  28. IOCCG. Remote Sensing of Ocean Color in Coastal, and Other Optically-Complex Waters; International Ocean-Colour Coordinating Group (IOCCG): Dartmouth, NS, Canada, 2000. [Google Scholar]
  29. IOCCG. Remote Sensing of Inherent Optical Properties: Fundamentals, Tests of Algorithms, and Applications; International Ocean-Colour Coordinating Group (IOCCG): Dartmouth, NS, Canada, 2006. [Google Scholar]
  30. Dekker, A.G.; Phinn, S.R.; Anstee, J.; Bissett, P.; Brando, V.E.; Casey, B.; Fearns, P.; Hedley, J.; Klonowski, W.; Lee, Z.P.; et al. Intercomparison of Shallow Water Bathymetry, Hydro-Optics, and Benthos Mapping Techniques in Australian and Caribbean Coastal Environments. Limnol. Oceanogr. Methods 2011, 9, 396–425. [Google Scholar] [CrossRef]
  31. Blondeau-Patissier, D.; Gower, J.F.R.; Dekker, A.G.; Phinn, S.R.; Brando, V.E. A Review of Ocean Color Remote Sensing Methods and Statistical Techniques for the Detection, Mapping and Analysis of Phytoplankton Blooms in Coastal and Open Oceans. Prog. Oceanogr. 2014, 123, 123–144. [Google Scholar] [CrossRef]
  32. Blondeau-Patissier, D.; Schroeder, T.; Brando, V.E.; Maier, S.W.; Dekker, A.G.; Phinn, S. ESA-MERIS 10-Year Mission Reveals Contrasting Phytoplankton Bloom Dynamics in Two Tropical Regions of Northern Australia. Remote Sens. 2014, 6, 2963–2988. [Google Scholar] [CrossRef]
  33. Hedley, J.D.; Roelfsema, C.; Brando, V.; Giardino, C.; Kutser, T.; Phinn, S.; Mumby, P.J.; Barrilero, O.; Laporte, J.; Koetz, B. Coral Reef Applications of Sentinel-2: Coverage, Characteristics, Bathymetry and Benthic Mapping with Comparison to Landsat 8. Remote Sens. Environ. 2018, 216, 598–614. [Google Scholar] [CrossRef]
  34. Zoffoli, M.L.; Frouin, R.; Kampel, M. Water Column Correction for Coral Reef Studies by Remote Sensing. Sensors 2014, 14, 16881–16931. [Google Scholar] [CrossRef]
  35. Dupouy, C.; Neveux, J.; Dirberg, G.; Röttgers, R.; Tenório, M.M.B.; Ouillon, S. Bio-optical properties of the marine cyanobacteria Trichodesmium spp. J. Appl. Remote Sens. 2008, 2, 023503. [Google Scholar] [CrossRef]
  36. Dupouy, C.; Neveux, J.; Ouillon, S.; Frouin, R.; Murakami, H.; Hochard, S.; Dirberg, G. Inherent Optical Properties and Satellite Retrieval of Chlorophyll Concentration in the Lagoon and Open Ocean Waters of New Caledonia. Mar. Pollut. Bull. 2010, 61, 503–518. [Google Scholar] [CrossRef]
  37. Froidefond, J.-M.; Ouillon, S. Introducing a Mini-Catamaran to Perform Reflectance Measurements above and below the Water Surface. Opt. Express 2005, 13, 926–936. [Google Scholar] [CrossRef] [PubMed]
  38. Ouillon, S.; Douillet, P.; Petrenko, A.; Neveux, J.; Dupouy, C.; Froidefond, J.-M.; Andréfouët, S.; Muñoz-Caravaca, A. Optical Algorithms at Satellite Wavelengths for Total Suspended Matter in Tropical Coastal Waters. Sensors 2008, 8, 4165–4185. [Google Scholar] [CrossRef] [PubMed]
  39. Dupouy, C.; Frouin, R.; Tedetti, M.; Maillard, M.; Rodier, M.; Lombard, F.; Guidi, L.; Picheral, M.; Neveux, J.; Duhamel, S.; et al. Diazotrophic Trichodesmium Impact on UV–Vis Radiance and Pigment Composition in the Western Tropical South Pacific. Biogeosciences 2018, 15, 5249–5269. [Google Scholar] [CrossRef]
  40. Ouillon, S.; Douillet, P.; Lefebvre, J.P.; Le Gendre, R.; Jouon, A.; Bonneton, P.; Fernandez, J.M.; Chevillon, C.; Magand, O.; Lefèvre, J.; et al. Circulation and Suspended Sediment Transport in a Coral Reef Lagoon: The South-West Lagoon of New Caledonia. Mar. Pollut. Bull. 2010, 61, 269–296. [Google Scholar] [CrossRef]
  41. Röttgers, R.; Dupouy, C.; Taylor, B.B.; Bracher, A.; Woźniak, S.B. Mass-Specific Light Absorption Coefficients of Natural Aquatic Particles in the near-Infrared Spectral Region. Limnol. Oceanogr. 2014, 59, 1449–1460. [Google Scholar] [CrossRef]
  42. Röttgers, R.; Doxaran, D.; Dupouy, C. Quantitative Filter Technique Measurements of Spectral Light Absorption by Aquatic Particles Using a Portable Integrating Cavity Absorption Meter (QFT-ICAM). Opt. Express 2016, 24, A1–A20. [Google Scholar] [CrossRef]
  43. Dupouy, C.; Neveux, J.; Andre’, J.M. Spectral Absorption Coefficient of Photosynthetically Active Pigments in the Equatorial Pacific Ocean (165°11–150° W). Deep. Sea Res. Part II Top. Stud. Oceanogr. 1997, 44, 1881–1906. [Google Scholar] [CrossRef]
  44. Simeon, J.; Roesler, C.; Pegau, W.S.; Dupouy, C. Sources of Spatial Variability in Light Absorbing Components along an Equatorial Transect from 165° E to 150° W. J. Geophys. Res. Oceans 2003, 108, 3333. [Google Scholar] [CrossRef]
  45. Gross, L.; Frouin, R.; Dupouy, C.; André, J.M.; Thiria, S. Reducing Variability That Is Due to Secondary Pigments in the Retrieval of Chlorophyll a Concentration from Marine Reflectance: A Case Study in the Western Equatorial Pacific Ocean. Appl. Opt. 2004, 43, 4041–4054. [Google Scholar] [CrossRef]
  46. Dupouy, C.; Loisel, H.; Neveux, J.; Brown, S.L.; Moulin, C.; Blanchot, J.; Le Bouteiller, A.; Landry, M.R. Microbial Absorption and Backscattering Coefficients from in Situ and POLDER Satellite Data during an El Niño–Southern Oscillation Cold Phase in the Equatorial Pacific (180°). J. Geophys. Res. Oceans 2003, 108, 8138. [Google Scholar] [CrossRef]
  47. Neveux, J.; Lefebvre, J.-P.; Le Gendre, R.; Dupouy, C.; Gallois, F.; Courties, C.; Gérard, P.; Fernandez, J.-M.; Ouillon, S. Phytoplankton Dynamics in the Southern New Caledonian Lagoon during a Southeast Trade Winds Event. J. Mar. Syst. 2010, 82, 230–244. [Google Scholar] [CrossRef]
  48. Neveux, J.; Tenório, M.M.B.; Jacquet, S.; Torréton, J.-P.; Douillet, P.; Ouillon, S.; Dupouy, C. Chlorophylls and Phycoerythrins as Markers of Environmental Forcings Including Cyclone Erica Effect (March 2003) on Phytoplankton in the Southwest Lagoon of New Caledonia and Oceanic Adjacent Area. Int. J. Oceanogr. 2009, 2009, e232513. [Google Scholar] [CrossRef]
  49. Favareto, L.R.; Rudorff, N.; Kampel, M.; Frouin, R.; Röttgers, R.; Doxaran, D.; Murakami, H.; Dupouy, C. Bio-Optical Characterization and Ocean Colour Inversion in the Eastern Lagoon of New Caledonia, South Tropical Pacific. Remote Sens. 2018, 10, 1043. [Google Scholar] [CrossRef]
  50. Martias, C.; Tedetti, M.; Lantoine, F.; Jamet, L.; Dupouy, C. Characterization and Sources of Colored Dissolved Organic Matter in a Coral Reef Ecosystem Subject to Ultramafic Erosion Pressure (New Caledonia, Southwest Pacific). Sci. Total Environ. 2018, 616–617, 438–452. [Google Scholar] [CrossRef] [PubMed]
  51. Dupouy, C.; Röttgers, R.; Tedetti, M.; Frouin, R.; Lantoine, F.; Rodier, M.; Martias, C.; Goutx, M. Impact of Contrasted Weather Conditions on CDOM Absorption/Fluorescence and Biogeochemistry in the Eastern Lagoon of New Caledonia. Front. Earth Sci. 2020, 8, 54. [Google Scholar] [CrossRef]
  52. Dupouy, C.; Rodier, M. MOISE Observing Station; OSU PYTHEAS Report; OSU PYTHEAS: Marseille, France, 2014. [Google Scholar]
  53. Fichez, R.D.P.; Chevillon, C.; Torreton, J.P.; Aung, T.H.; Chifflet, S.; Fernandez, J.M.; Gangaiya, P.; Garimella, S.; Gerard, P.; Ouillon, S.; et al. The Suva Lagoon Enviroment: An overview of a joint IRD Camelia Research Unit and USP Study. In At the Cross Roads: Science and Management of the Suva Lagoon; Morrison, R.J., Aalbersberg, W., Eds.; Institute of the Applied Sciences Press, University of the South Pacific: Suva, Fiji, 2006; Volume 1, pp. 93–105. [Google Scholar]
  54. Koliyavu, T.; Martias, C.; Singh, A.; Mounier, S.; Gérard, P.; Dupouy, C. In-Situ Variability of DOM in Relation with Biogeochemical and Physical Parameters in December 2017 in Laucala Bay (Fiji Islands) after a Strong Rain Event. J. Mar. Sci. Eng. 2021, 9, 241. [Google Scholar] [CrossRef]
  55. Lefèvre, J. The MODIS Data Processing Chain; Technical Document of the VALidation of Hyperspectral SATellite Data the Valhysat Project; IRD Nouméa: Nouméa, Nouvelle-Calédonie, 2010. [Google Scholar]
  56. Murakami, H.; Dupouy, C. Coastal ocean atmospheric correction for AVNIR-2 high resolution images. In Proceedings of the SPIE, Remote Sensing of the Coastal Ocean, Land, and Atmosphere Environment, Incheon, Republic of Korea, 11–14 October 2010; Volume 7858, p. 785802. [Google Scholar] [CrossRef]
  57. Murakami, H.; Dupouy, C.; Röttgers, R.; Frouin, R.J. Estimation of Inherent Optical Properties Using In Situ Hyperspectral Radiometer and MODIS Data along the East Coast of New Caledonia. In Proceedings of the SPIE, Remote Sensing of the Marine Environment II, Kyoto, Japan, 29 October–1 November 2012; Volume 8525, pp. 47–55. [Google Scholar]
  58. Wattelez, G.; Dupouy, C.; Mangeas, M.; Lefèvre, J.; Touraivane; Frouin, R. A Statistical Algorithm for Estimating Chlorophyll Concentration in the New Caledonian Lagoon. Remote Sens. 2016, 8, 45. [Google Scholar] [CrossRef]
  59. Wattelez, G.; Dupouy, C.; Lefèvre, J.; Ouillon, S.; Fernandez, J.-M.; Juillot, F. Application of the Support Vector Regression Method for Turbidity Assessment with MODIS on a Shallow Coral Reef Lagoon (Voh-Koné-Pouembout, New Caledonia). Water 2017, 9, 737. [Google Scholar] [CrossRef]
  60. Minghelli-Roman, A.; Dupouy, C. Influence of Water Column Chlorophyll Concentration on Bathymetric Estimations in the Lagoon of New Caledonia, Using Several MERIS Images. IEEE J. Sel. Top. Appl. Earth Obs. Remote Sens. 2013, 6, 739–745. [Google Scholar] [CrossRef]
  61. Minghelli-Roman, A.; Dupouy, C. Correction of the Water Column Attenuation: Application to the Seabed Mapping of the Lagoon of New Caledonia Using MERIS Images. IEEE J. Sel. Top. Appl. Earth Obs. Remote Sens. 2014, 7, 2619–2629. [Google Scholar] [CrossRef]
  62. Wattelez, G.; Dupouy, C.; Juillot, F. Unsupervised Optical Classification of the Seabed Color in Shallow Oligotrophic Waters from Sentinel-2 Images: A Case Study in the Voh-Koné-Pouembout Lagoon (New Caledonia). Remote Sens. 2022, 14, 836. [Google Scholar] [CrossRef]
  63. Rousset, G.; De Boissieu, F.; Menkes, C.E.; Lefèvre, J.; Frouin, R.; Rodier, M.; Ridoux, V.; Laran, S.; Bonnet, S.; Dupouy, C. Remote Sensing of Trichodesmium spp. Mats in the Western Tropical South Pacific. Biogeosciences 2018, 15, 5203–5219. [Google Scholar] [CrossRef]
  64. Bazader, J.-F. Personal communication. 2023. [Google Scholar]
  65. Benavides, M.; Conradt, L.; Bonnet, S.; Berman-Frank, I.; Barrillon, S.; Petrenko, A.; Doglioli, A. Fine-Scale Sampling Unveils Diazotroph Patchiness in the South Pacific Ocean. ISME Commun. 2021, 1, 3. [Google Scholar] [CrossRef]
  66. Whiteside, A. Ocean Color Plume Monitoring around the Fiji Islands from Remote Sensing through Anthropogenic and Climatic Influences. Estimation of the Impact of the Cyanobacteria Trichodesmium, Thèse de 3eme Cycle; Aix-Marseille Université: Marseille, France, 7 November 2023. [Google Scholar]
  67. Bonnet, S.; Caffin, M.; Berthelot, H.; Moutin, T. Hot Spot of N2 Fixation in the Western Tropical South Pacific Pleads for a Spatial Decoupling between N2 Fixation and Denitrification. Proc. Natl. Acad. Sci. USA 2017, 114, E2800. [Google Scholar] [CrossRef]
  68. Messer, L.F.; Mahaffey, C.; M Robinson, C.; Jeffries, T.C.; Baker, K.G.; Bibiloni Isaksson, J.; Ostrowski, M.; Doblin, M.A.; Brown, M.V.; Seymour, J.R. High Levels of Heterogeneity in Diazotroph Diversity and Activity within a Putative Hotspot for Marine Nitrogen Fixation. ISME J. 2016, 10, 1499–1513. [Google Scholar] [CrossRef]
  69. Bonnet, S.; Caffin, M.; Berthelot, H.; Grosso, O.; Benavides, M.; Helias-Nunige, S.; Guieu, C.; Stenegren, M.; Foster, R.A. In-Depth Characterization of Diazotroph Activity across the Western Tropical South Pacific Hotspot of N2 Fixation (OUTPACE Cruise). Biogeosciences 2018, 15, 4215–4232. [Google Scholar] [CrossRef]
  70. Moutin, T.; Karl, D.M.; Duhamel, S.; Rimmelin, P.; Raimbault, P.; Van Mooy, B.A.S.; Claustre, H. Phosphate Availability and the Ultimate Control of New Nitrogen Input by Nitrogen Fixation in the Tropical Pacific Ocean. Biogeosciences 2008, 5, 95–109. [Google Scholar] [CrossRef]
  71. Bonnet, S.; Benavides, M.; Le Moigne, F.A.C.; Camps, M.; Torremocha, A.; Grosso, O.; Dimier, C.; Spungin, D.; Berman-Frank, I.; Garczarek, L.; et al. Diazotrophs Are Overlooked Contributors to Carbon and Nitrogen Export to the Deep Ocean. ISME J. 2023, 17, 47–58. [Google Scholar] [CrossRef]
  72. Yoon, J.-E.; King, D.; Longman, J.; Cronin, S.J. Differential Response of Chlorophyll-a Concentrations to Explosive Volcanism in the Western South Pacific. Front. Mar. Sci. 2023, 10, 1072610. [Google Scholar] [CrossRef]
  73. Whiteside, A.; Dupouy, C.; Singh, A.; Frouin, R.; Menkes, C.; Lefèvre, J. Automatic Detection of Optical Signatures within and around Floating Tonga-Fiji Pumice Rafts Using MODIS, VIIRS, and OLCI Satellite Sensors. Remote Sens. 2021, 13, 501. [Google Scholar] [CrossRef]
  74. Whiteside, A.; Dupouy, C.; Singh, A.; Bani, P.; Tan, J.; Frouin, R. Impact of Ashes from the 2022 Tonga Volcanic Eruption on Satellite Ocean Color Signatures. Front. Mar. Sci. 2023, 9, 1028022. [Google Scholar] [CrossRef]
  75. Martinez, E.; Antoine, D.; D’Ortenzio, F.; Gentili, B. Climate-Driven Basin-Scale Decadal Oscillations of Oceanic Phytoplankton. Science 2009, 326, 1253–1256. [Google Scholar] [CrossRef]
  76. Messié, M.; Petrenko, A.; Doglioli, A.M.; Aldebert, C.; Martinez, E.; Koenig, G.; Bonnet, S.; Moutin, T. The Delayed Island Mass Effect: How Islands Can Remotely Trigger Blooms in the Oligotrophic Ocean. Geophys. Res. Lett. 2020, 47, e2019GL085282. [Google Scholar] [CrossRef]
  77. Messié, M.; Petrenko, A.; Doglioli, A.M.; Martinez, E.; Alvain, S. Basin-Scale Biogeochemical and Ecological Impacts of Islands in the Tropical Pacific Ocean. Nat. Geosci. 2022, 15, 469–474. [Google Scholar] [CrossRef]
  78. Bonnet, S.; Guieu, C.; Taillandier, V.; Boulart, C.; Bouruet-Aubertot, P.; Gazeau, F.; Scalabrin, C.; Bressac, M.; Knapp, A.N.; Cuypers, Y.; et al. Natural Iron Fertilization by Shallow Hydrothermal Sources Fuels Diazotroph Blooms in the Ocean. Science 2023, 380, 812–817. [Google Scholar] [CrossRef] [PubMed]
  79. Russell, P.; Horvat, C. Extreme South Pacific Phytoplankton Blooms Induced by Tropical Cyclones. Geophys. Res. Lett. 2023, 50, e2022GL100821. [Google Scholar] [CrossRef]
  80. Andrews, J.; Gentien, P. Upwelling as a Source of Nutrients for the Great Barrier Reef Ecosystems: A Solution to Darwin’s Question? Mar. Ecol. Prog. Ser. 1982, 8, 257–269. [Google Scholar] [CrossRef]
  81. Brodie, J.E.; Kroon, F.J.; Schaffelke, B.; Wolanski, E.C.; Lewis, S.E.; Devlin, M.J.; Bohnet, I.C.; Bainbridge, Z.T.; Waterhouse, J.; Davis, A.M. Terrestrial Pollutant Runoff to the Great Barrier Reef: An Update of Issues, Priorities and Management Responses. Mar. Pollut. Bull. 2012, 65, 81–100. [Google Scholar] [CrossRef]
  82. Oubelkheir, K.; Ford, P.W.; Cherukuru, N.; Clementson, L.A.; Petus, C.; Devlin, M.; Schroeder, T.; Steven, A.D.L. Impact of a Tropical Cyclone on Terrestrial Inputs and Bio-Optical Properties in Princess Charlotte Bay (Great Barrier Reef Lagoon). Remote Sens. 2023, 15, 652. [Google Scholar] [CrossRef]
  83. Fabricius, K.E.; Logan, M.; Weeks, S.; Brodie, J. The Effects of River Run-off on Water Clarity across the Central Great Barrier Reef. Mar. Pollut. Bull. 2014, 84, 191–200. [Google Scholar] [CrossRef]
  84. Fuchs, R.; Dupouy, C.; Douillet, P.; Caillaud, M.; Mangin, A.; Pinazo, C. Modelling the Impact of a La Niña Event on a South West Pacific Lagoon. Mar. Pollut. Bull. 2012, 64, 1596–1613. [Google Scholar] [CrossRef]
  85. Fuchs, R.; Pinazo, C.; Douillet, P.; Fraysse, M.; Grenz, C.; Mangin, A.; Dupouy, C. Modelling Ocean–Lagoon Interaction during Upwelling Processes in the Southwest of New Caledonia. Estuar. Coast. Shelf Sci. 2013, 135, 5–17. [Google Scholar] [CrossRef]
  86. Chevalier, C.; Sous, D.; Devenon, J.-L.; Pagano, M.; Rougier, G.; Blanchot, J. Impact of Cross-Reef Water Fluxes on Lagoon Dynamics: A Simple Parameterization for Coral Lagoon Circulation Model, with Application to the Ouano Lagoon, New Caledonia. Ocean Dyn. 2015, 65, 1509–1534. [Google Scholar] [CrossRef]
  87. Roche, R.C.; Heenan, A.; Taylor, B.M.; Schwarz, J.N.; Fox, M.D.; Southworth, L.K.; Williams, G.J.; Turner, J.R. Linking Variation in Planktonic Primary Production to Coral Reef Fish Growth and Condition. R. Soc. Open Sci. 2022, 9, 201012. [Google Scholar] [CrossRef]
  88. Houlbrèque, F.; Ferrier-Pagès, C. Heterotrophy in Tropical Scleractinian Corals. Biol. Rev. Camb. Philos. Soc. 2009, 84, 1–17. [Google Scholar] [CrossRef] [PubMed]
  89. Rodier, M.; Le Borgne, R. Population dynamics and environmental conditions affecting Trichodesmium spp. (filamentous cyanobacteria) blooms in the south-west lagoon of New Caledonia. J. Exp. Mar. Biol. Ecol. 2008, 358, 20–32. [Google Scholar] [CrossRef]
  90. Rodier, M.; Le Borgne, R. Population and Trophic Dynamics of Trichodesmium Thiebautii in the SE Lagoon of New Caledonia. Comparison with T. Erythraeum in the SW Lagoon. Mar. Pollut. Bull. 2010, 61, 349–359. [Google Scholar] [CrossRef] [PubMed]
  91. Saulia, E.; Benavides, M.; Henke, B.; Turk-Kubo, K.; Cooperguard, H.; Grosso, O.; Desnues, A.; Rodier, M.; Dupouy, C.; Riemann, L.; et al. Seasonal Shifts in Diazotrophs Players: Patterns Observed Over a Two-Year Time Series in the New Caledonian Lagoon (Western Tropical South Pacific Ocean). Front. Mar. Sci. 2020, 7, 581755. [Google Scholar] [CrossRef]
  92. Boatman, T.G.; Upton, G.J.G.; Lawson, T.; Geider, R.J. Projected Expansion of Trichodesmium’s Geographical Distribution and Increase in Growth Potential in Response to Climate Change. Glob. Chang. Biol. 2020, 26, 6445–6456. [Google Scholar] [CrossRef]
  93. De Monte, S.; Soccodato, A.; Alvain, S.; d’Ovidio, F. Can We Detect Oceanic Biodiversity Hotspots from Space? ISME J. 2013, 7, 2054–2056. [Google Scholar] [CrossRef] [PubMed]
  94. Sharma, P.; Marinov, I.; Cabre, A.; Kostadinov, T.; Singh, A. Increasing Biomass in the Warm Oceans: Unexpected New Insights from SeaWiFS. Geophys. Res. Lett. 2019, 46, 3900–3910. [Google Scholar] [CrossRef]
  95. Alvain, S.; Moulin, C.; Dandonneau, Y.; Bréon, F.M. Remote Sensing of Phytoplankton Groups in Case 1 Waters from Global SeaWiFS Imagery. Deep Sea Res. 2005, 52, 1989–2004. [Google Scholar] [CrossRef]
  96. Alvain, S.; Moulin, C.; Dandonneau, Y.; Loisel, H. Seasonal Distribution and Succession of Dominant Phytoplankton Groups in the Global Ocean: A Satellite View. Glob. Biogeochem. Cycles 2008, 22, GB3001. [Google Scholar] [CrossRef]
  97. De Boissieu, F.; Menkes, C.; Dupouy, C.; Rodier, M.; Bonnet, S.; Mangeas, M.; Frouin, R.J. Phytoplankton Global Mapping from Space with a Support Vector Machine Algorithm. In Proceedings of the SPIE, Ocean Remote Sensing and Monitoring from Space, Beijing, China, 13–16 October 2014; Volume 9261, pp. 354–367. [Google Scholar]
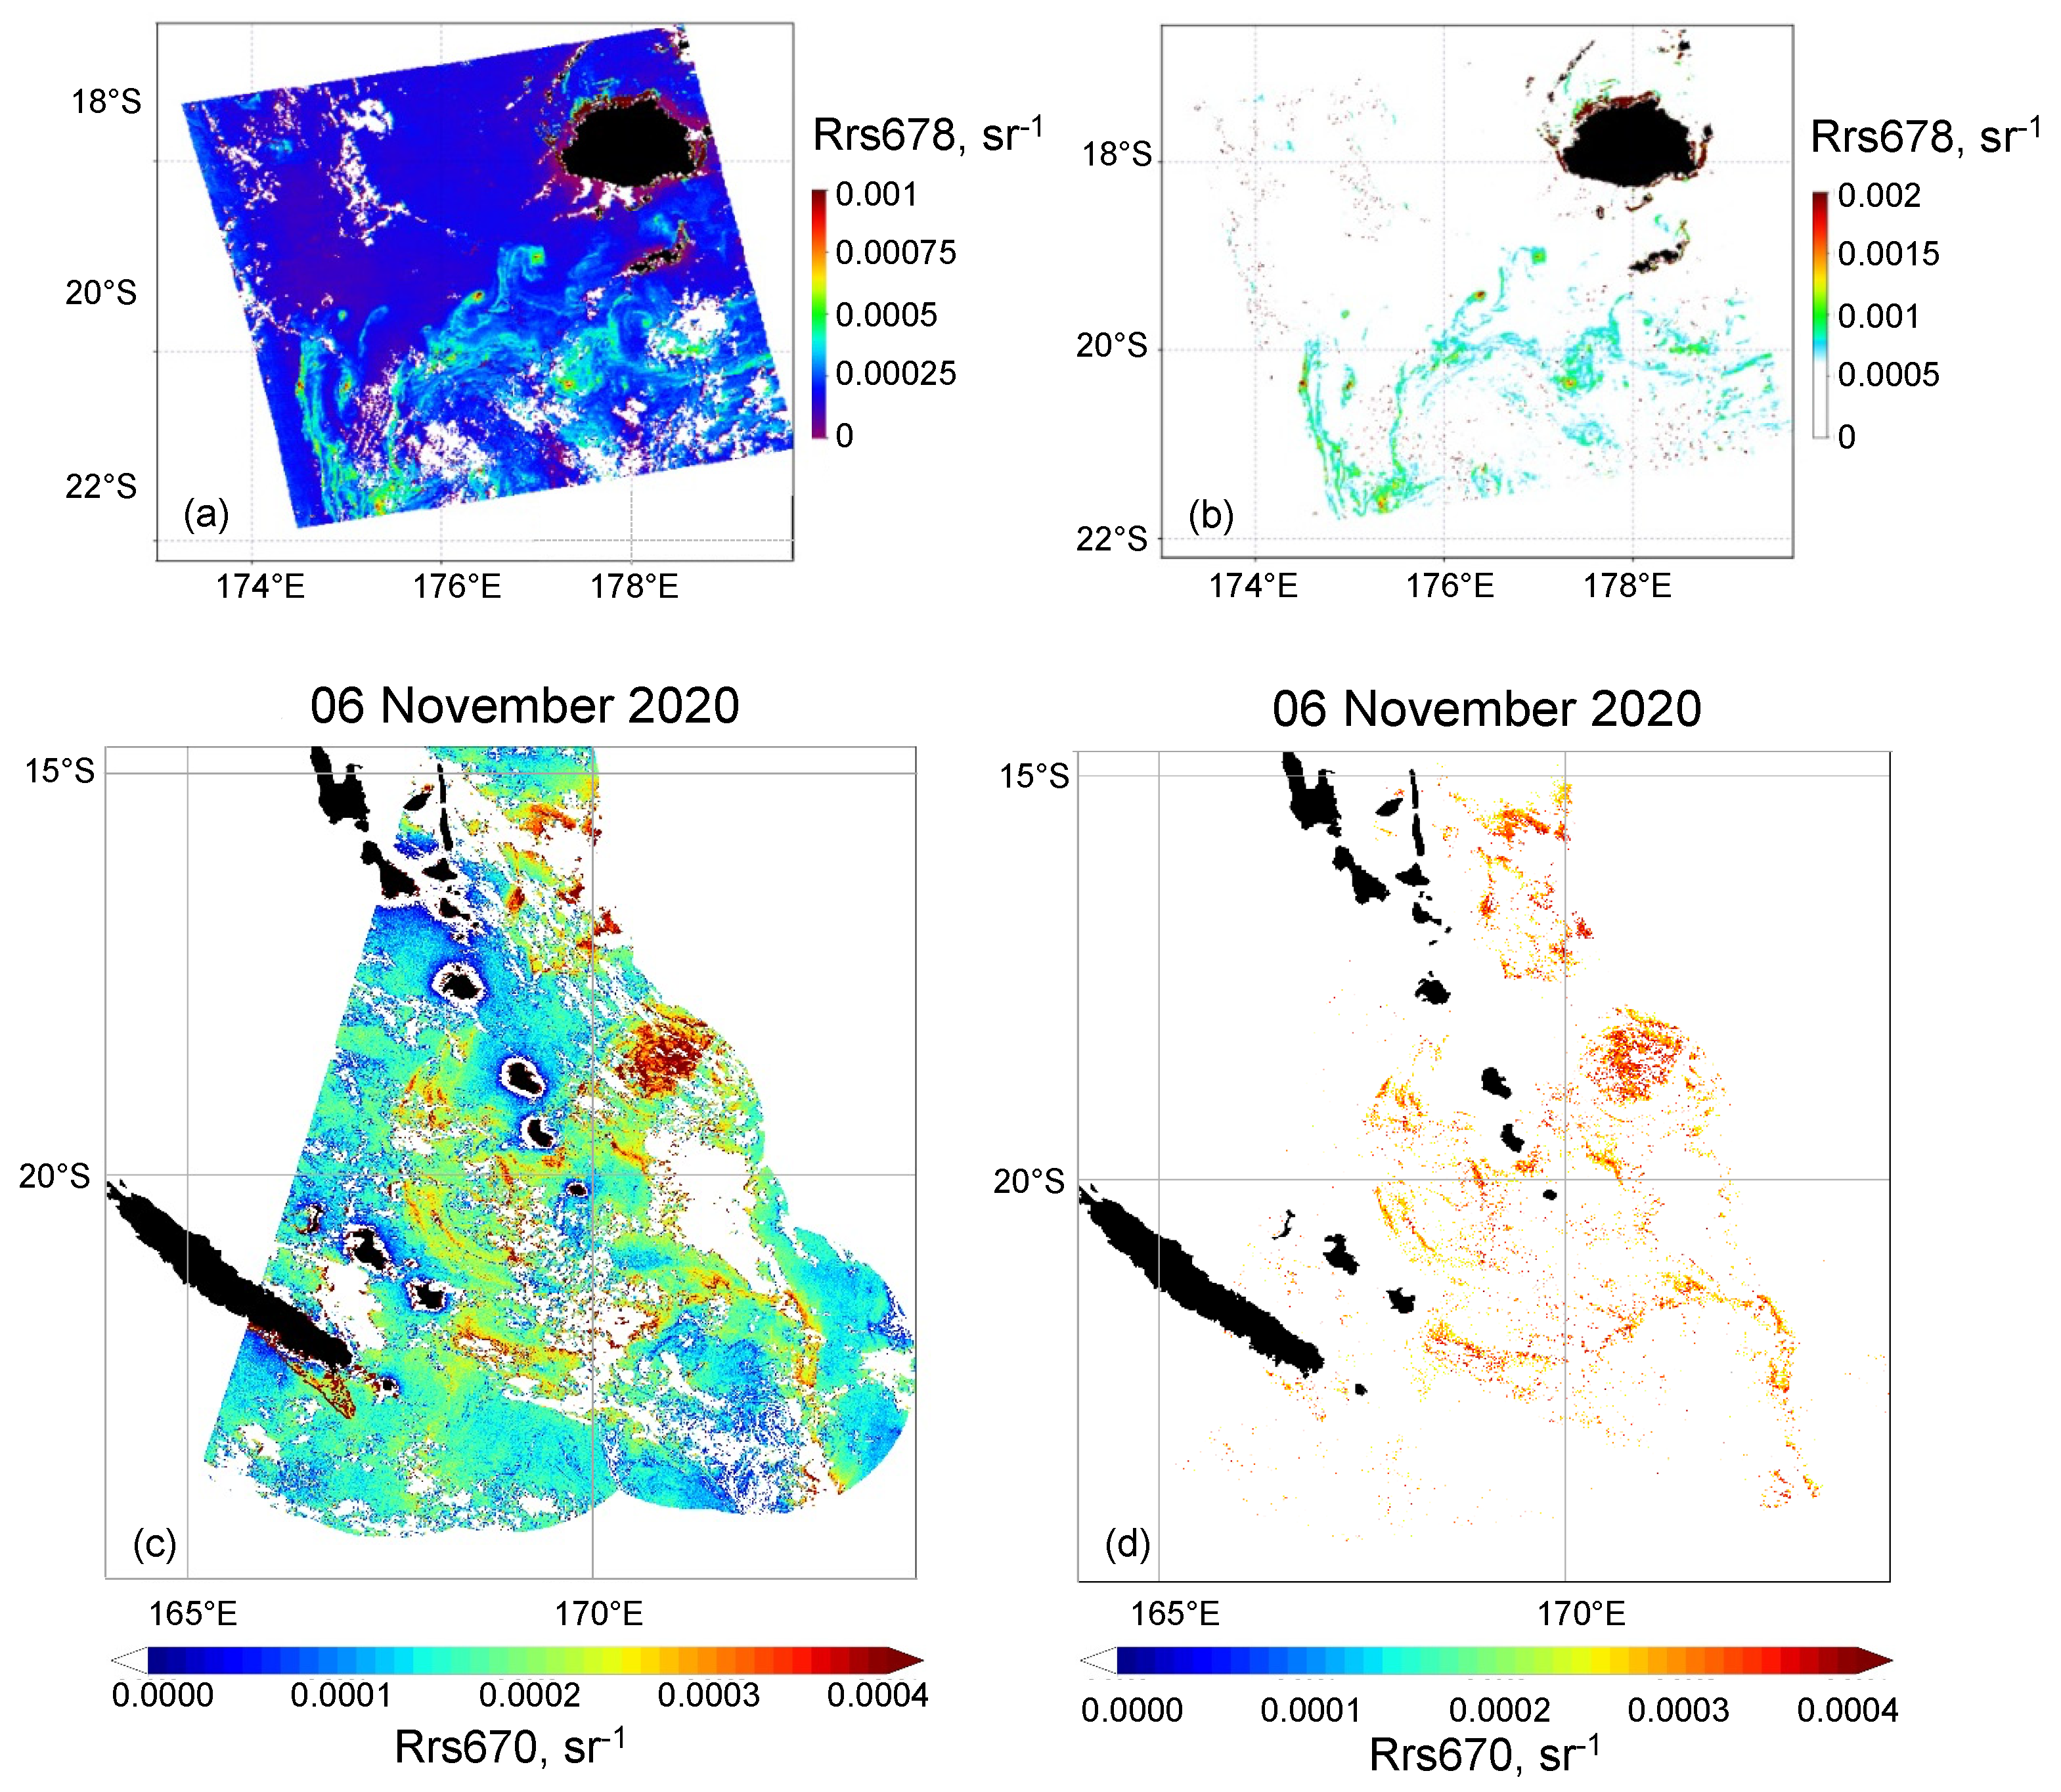
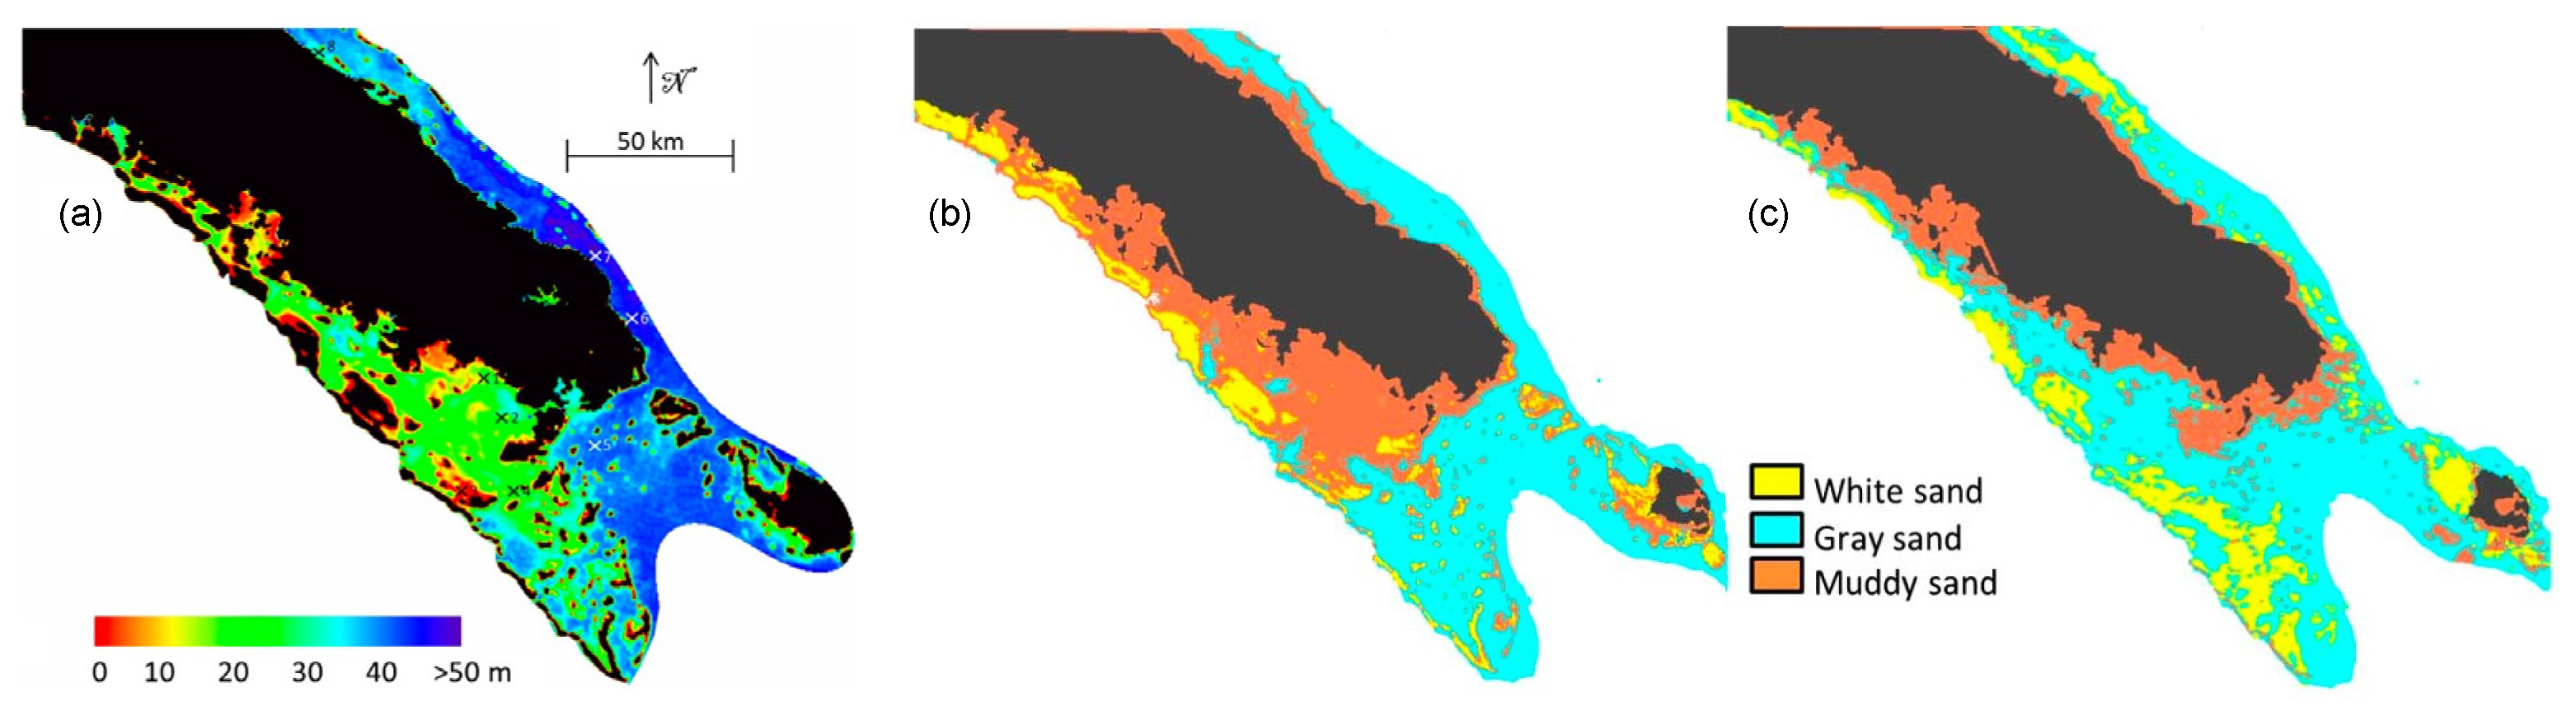
Figure 1. Seasonal variability of phytoplankton in Southwestern Tropical Pacific, shown for winter (left) and summer (right), as 5-year averages from SeaWiFS data. Extracted as in [13].
Remotesensing 15 05194 g001
Figure 2. (a) A Second-Generation Global Imager (SGLI), JAXA image of 6 March 2022 mapping a large dendritic bloom east of the Loyalty Islands (New Caledonia archipelago). (b) An SGLI image of 17 February 2022 showing high chlorophyll concentrations around the main islands of Fiji.
Remotesensing 15 05194 g002
Figure 3. TriOS and IOP radiometric measurements of ocean color spectra collected in the Southwestern Tropical Pacific Ocean showing the variability of ocean color signatures in inshore (influenced by bathymetry, seabed reflectance, [Chl-a], and CDOM absorption and particle backscattering) in comparison to offshore waters. (ad) for waters > 20 m in New Caledonia during the VALHYBIO cruise (unpublished data), with (a) Rrs (sr−1), (b) bb-H6 (m−1) from Hydroscat-6, (c) absorption ap (m−1) from PSICAM measurements, (d) acdom (m−1) from PSICAM measurements. (e) TriOS spectra of Rrs obtained over white sand and coral reefs of different in situ colors and at different dates. (f) TriOS spectra of Rrs (shown until 800 nm) taken on Trichodesmium slicks in the lagoon (in February 2013; light pink and showing variability during 30 min at low concentrations without the red and NIR signal), and on thick slicks at different times (in December 2010; dashed dark brown) indicating the strong red and NIR signal between 650 and 800 nm.
Remotesensing 15 05194 g003
Figure 4. Example of detection of surface slicks with the Rrs678 nm channel indicating high concentrations of Trichodesmium on 6 November 2020. (a) Rrs678 nm image from MODIS around Fiji; (b) pixels discriminated from a high value of Rrs678 nm (>a threshold of 0.0007 sr−1); (c) Rrs670 nm image OLCI Sentinel 3 of New Caledonia and Vanuatu; (d) pixels discriminated from a high value of Rrs670 nm (>a threshold of 0.0003 sr−1). For this last image, sea truth observations of a dense slick across hundreds of miles on 8 November 2020 coincides with the highest Rrs678 nm signal at the east of New Caledonia [64].
Remotesensing 15 05194 g004
Figure 5. Examples of maps of IOPs at 442 nm on 8 October 2011 estimated from MODIS 500 m data (with the bottom correction). (a) apg (m−1). (b) bbp (m−1). (Adapted from [57]).
Remotesensing 15 05194 g005
Figure 6. Scatter diagrams between in situ Chl-a and MODIS standard Level 2 Chl-a, or issued from apg from NOMAD or CALIOPE databases. MODIS OC2M algorithm was applied to our Rrs estimates from MODIS 500 m L1B data with the bottom reflectance correction. (Adapted from [57]).
Remotesensing 15 05194 g006
Figure 7. (a) AVNIR2 color composite on 3 September 2009 of the southwestern lagoon of New Caledonia area used for validation of different inversion algorithms presented in this paper. (b,c) Estimations of apg at 442 nm and bbp at 555 nm, respectively, without bottom reflection correction (upper row). (d,e) Same as (b,c) but with bottom correction (lower row). Bottom reflection was considered as constant in this study, and bathymetry was known at each pixel. (Adapted from [56]).
Remotesensing 15 05194 g007
Figure 8. (a) MODIS [Chl-a] image of the whole lagoon of New Caledonia. (b) Regression between SVM-issued [Chl-a] and in situ [Chl-a]. (c,d) Maps of Chl-a from OC4 compared with the SVM result showing differences in coastal parts of the lagoon. (Adapted from [58]).
Remotesensing 15 05194 g008
Figure 9. (a) Turbidity as calculated from the algorithm from [36] in New Caledonia adapted to deep waters (>20 m) and applied to a MODIS image off the east coast after the tropical storm in December 2011. (b) Total suspended matter (TSM) concentration generated from Sentinel 2 immediately after a heavy rain event in the northeastern part of the Caledonia lagoon. Result of CR2CC processing (see details in the text). Coral barriers of the eastern north lagoon are indicated.
Remotesensing 15 05194 g009
Figure 10. Turbidity estimated in the Voh-Kone-Pouembout (VKP) lagoon area on 21 April 2014 (redrawn from literature cited in the text). (a) Sentinel 2 image of the VKP lagoon showing a mosaic of different seabed colors and bathymetry. (b) Log-linear regression between in situ turbidity (in NTU) and MODIS remote sensing turbidity retrieved with the SVR model. The red line is the 1:1 line. Only the high turbidity values (corresponding to stations with a brown bottom color) are not well retrieved by the SVR model. Point colors correspond to Remotesensing 15 05194 i001: white bottom; Remotesensing 15 05194 i002: grey bottom; Remotesensing 15 05194 i003
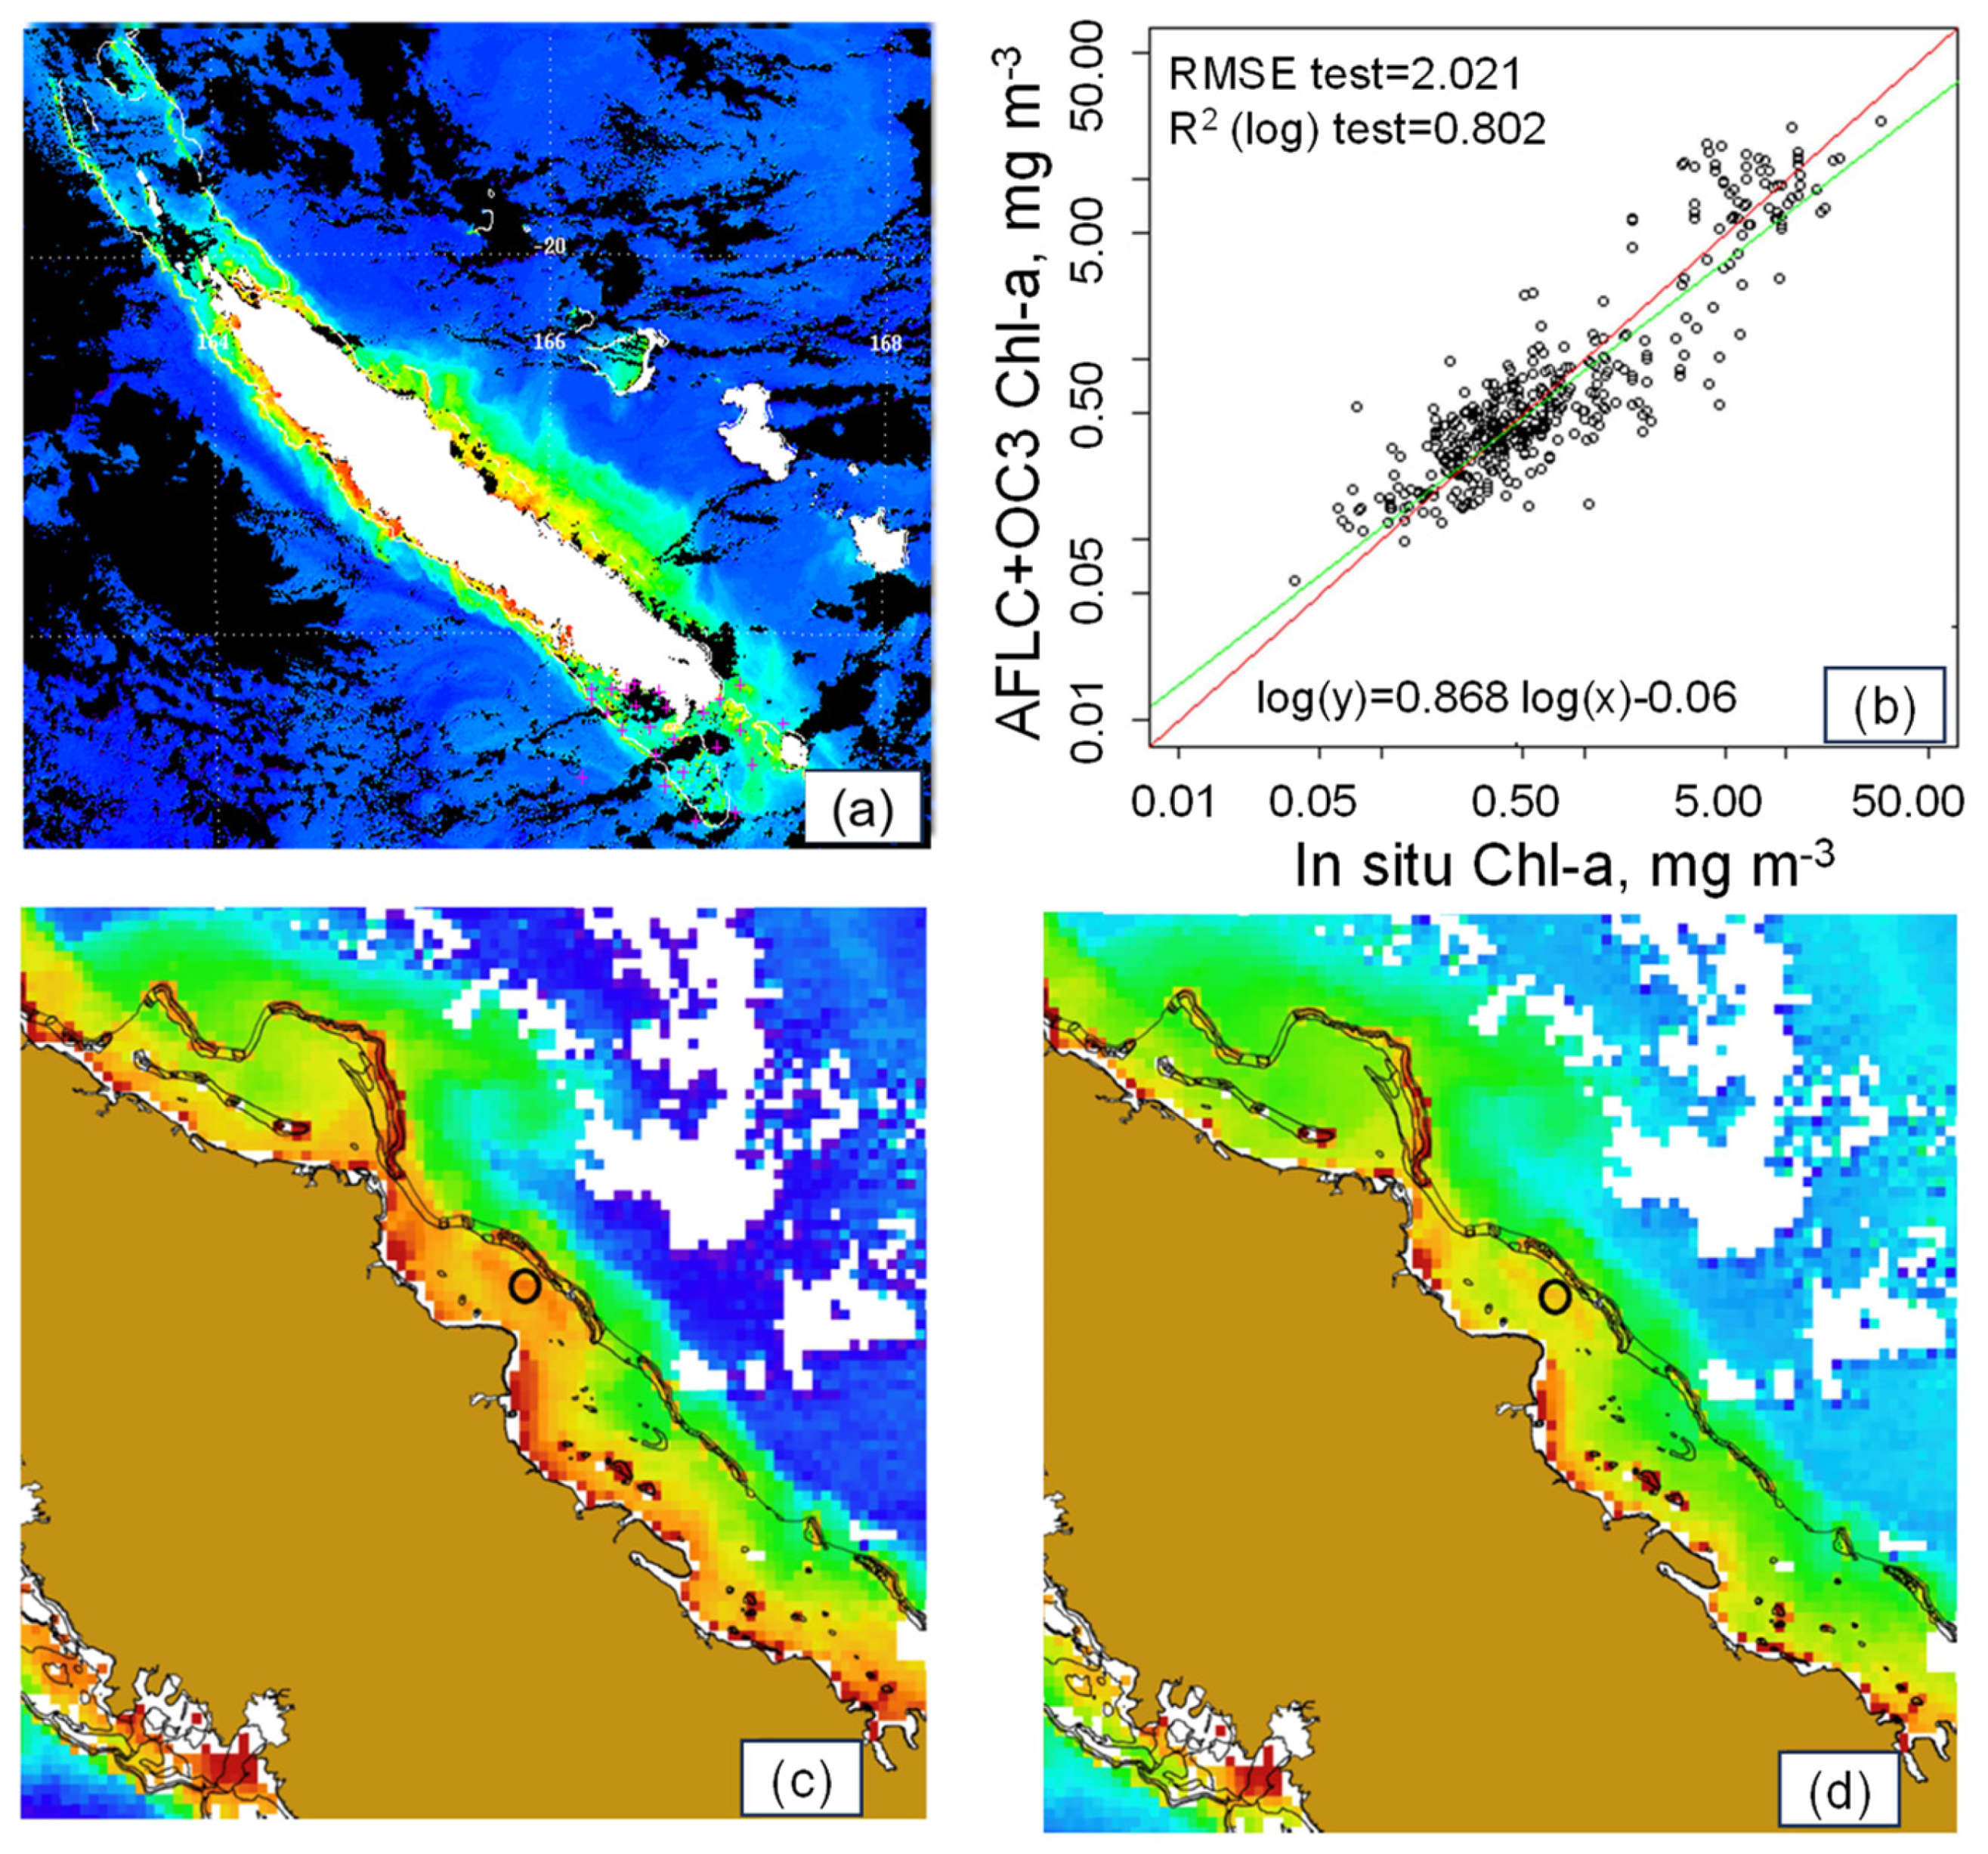
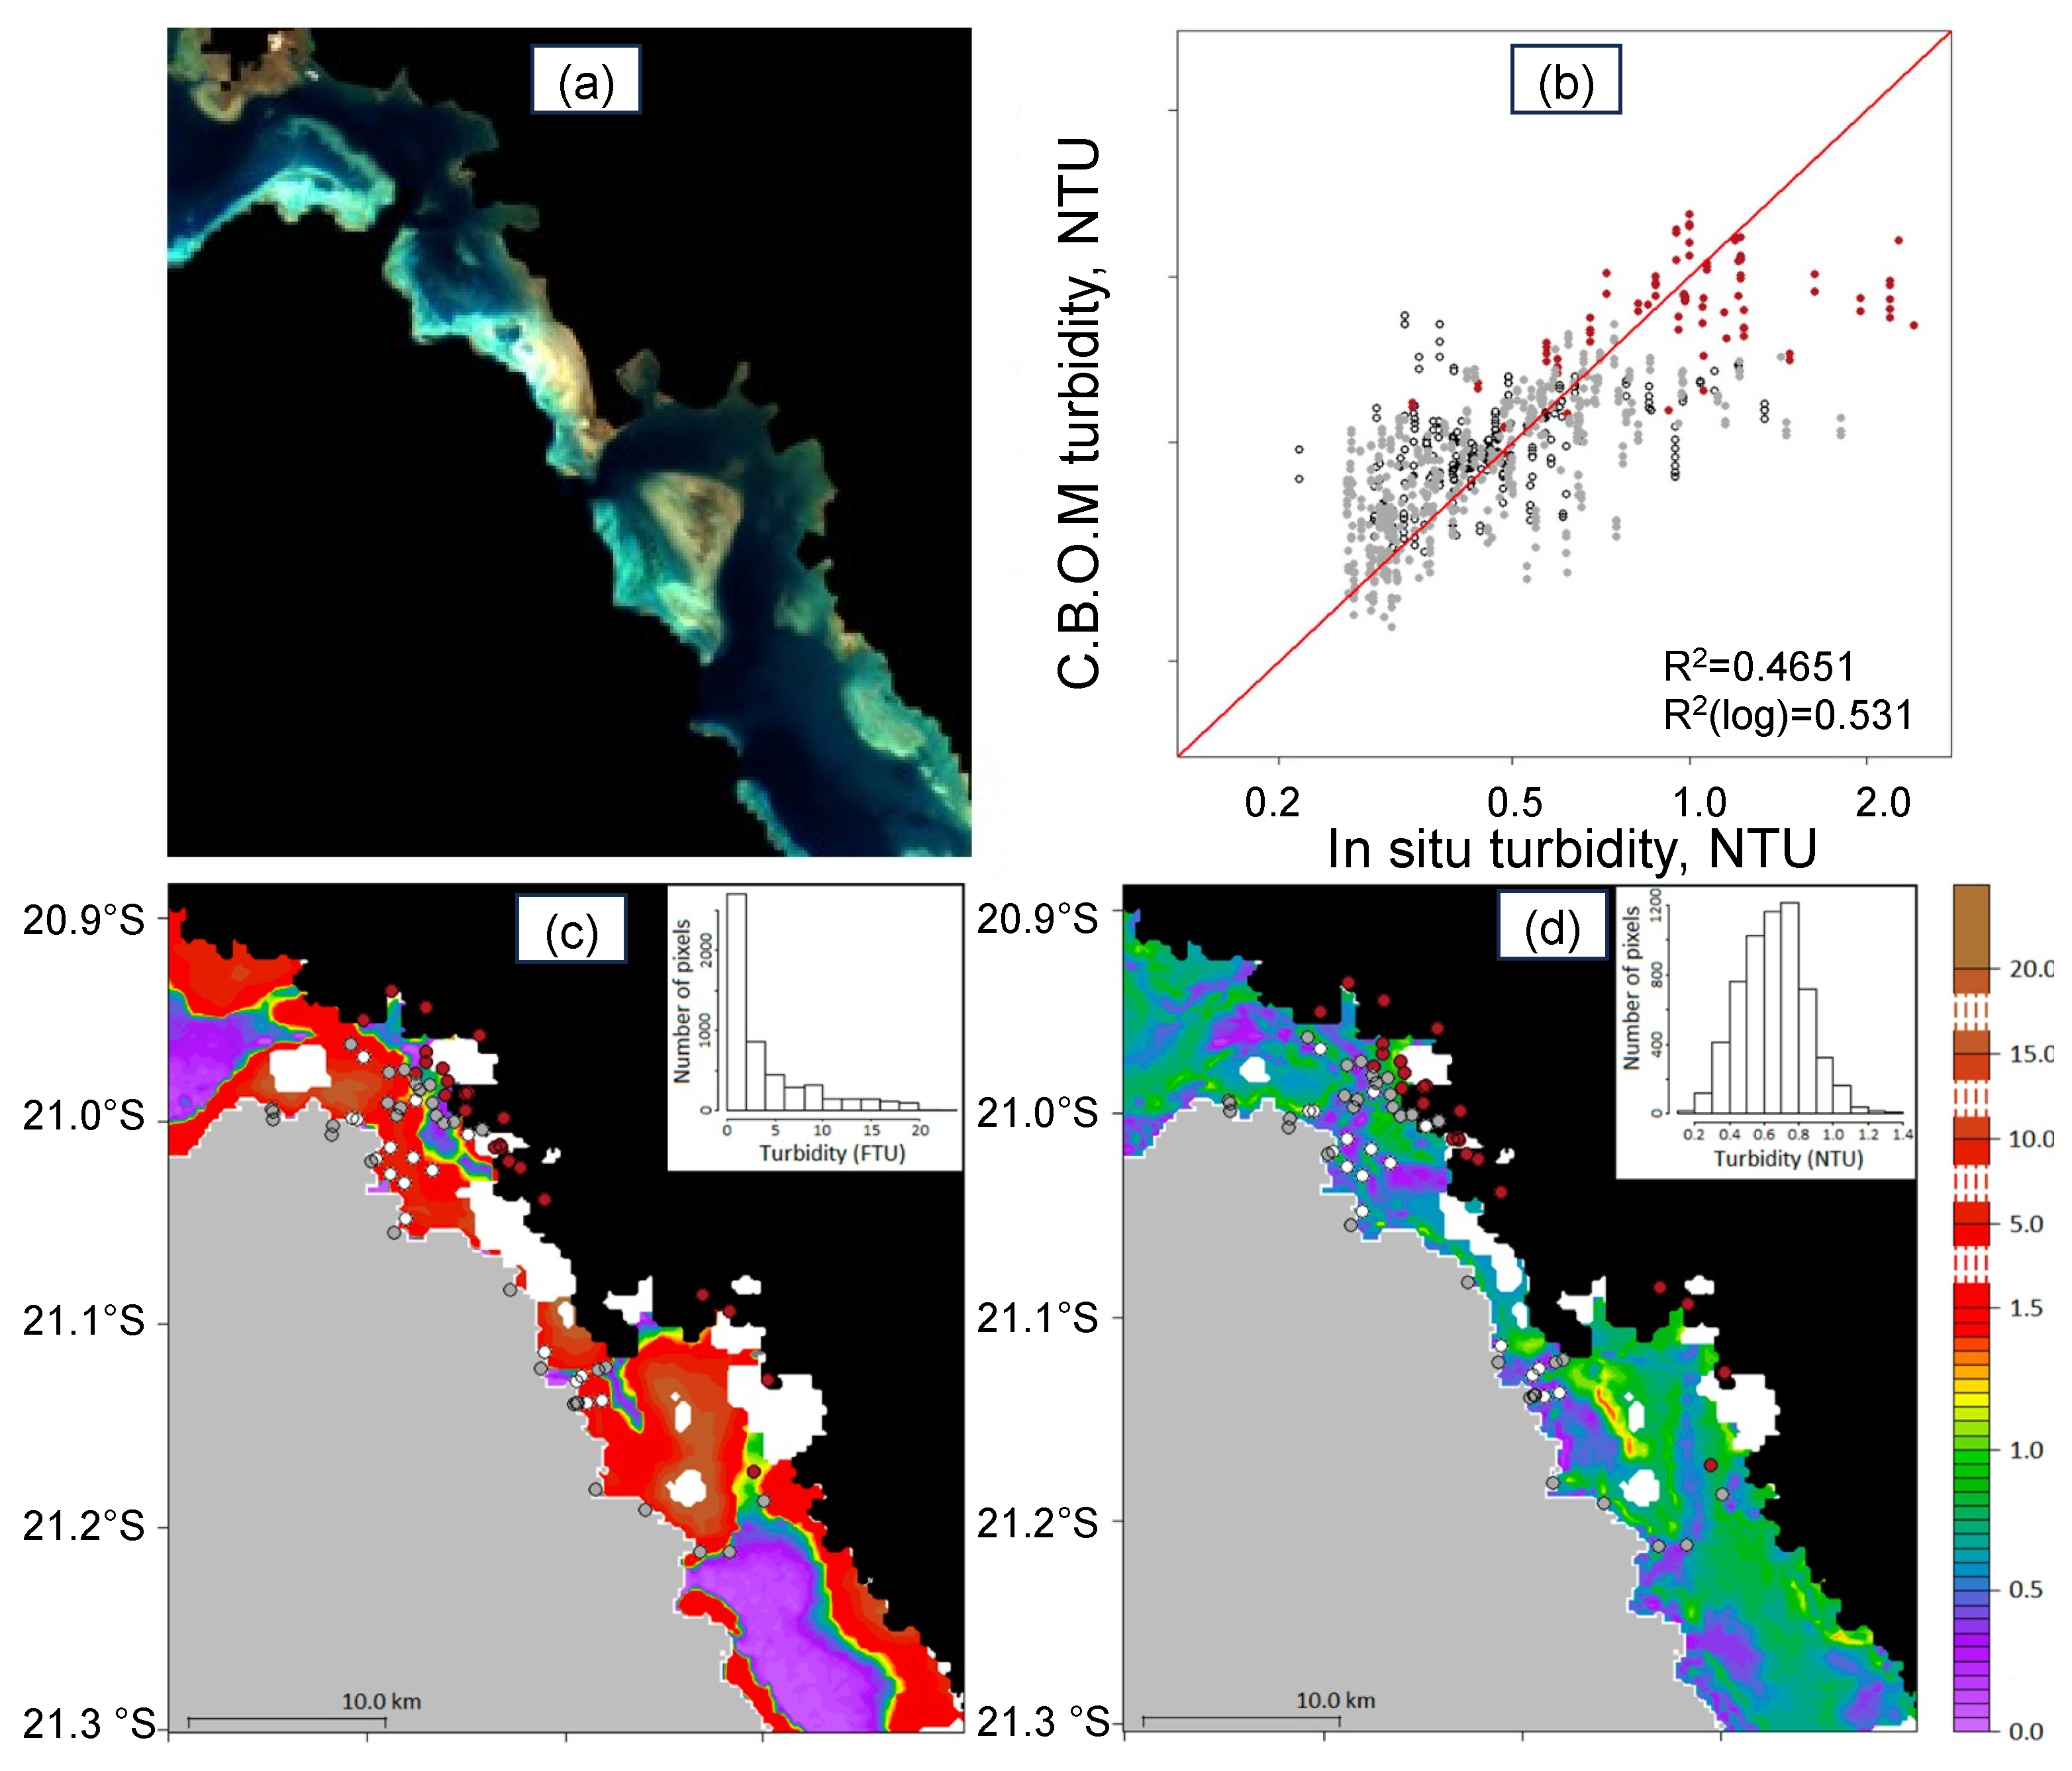
: brown bottom. (c,d) Turbidity maps (in FTU) retrieved from the MODIS image with the [38] New Caledonia turbidity algorithm compared with one from the SVR algorithm (using bathymetry and reflectance combination (see text for details)). (Adapted from [59]).
Remotesensing 15 05194 g010
Figure 11. (a) The bathymetry of the southern New Caledonia lagoon resulting from Lyzenga’s methodology using a MERIS image acquired on 7 December 2008. (b) Classification of the seafloor type using the reflectance and SAM distance. (c) Classification of the seafloor when the reflectance was corrected for the water attenuation and using SAM distance (see text for details). (Adapted from [60,61]).
Remotesensing 15 05194 g011
Figure 12. Seafloor classification results of a case study in the Voh-Koné-Pouembout lagoon (New Caledonia) using a clear Sentinel 2 image of 31 July 2017. (a) Seafloor spectral signal after applying Lyzenga’s correction. Results of an unsupervised classification and clustering of the seabed color in shallow oligotrophic coastal waters. (b) Without standardization of Sentinel 2 reflectance spectra in the near-infrared. (c) With standardization of Sentinel 2 reflectance spectra in the near-infrared. (Adapted from [62]).
Remotesensing 15 05194 g012
Figure 13. Series of MODIS images acquired during Diapalis cruises in October 2001, April 2002, May 2002, and February 2003. Vertical profiles of Trichodesmium colonies counted off Lifou Island during each cruise, showing Trichodesmium colony numbers [19] being exceptional in February 2003 compared to October 2001 or April and May 2002. Slicks were numerous but not easily detected by any algorithm, for reasons explained in the text.
Remotesensing 15 05194 g013
Figure 14. Maps of Sentinel 2 of Laucala Bay’s (a) backscattering coefficient bbp and (b) [Chl-a] after a sediment stirring event linked to the tropical cyclone Yasa, showing the plume extending to the ocean south of Fiji and the extent of the influence of land to the sea. Outputs were generated from Sentinel 2 immediately after tropical cyclone Yasa, which hit Fiji on 17 December 2020, and are a result of OC-SMART processing. Coral reefs and coral barriers south of Fiji and around the Beqa island are indicated. (Adapted from [66]).
Remotesensing 15 05194 g014
Disclaimer/Publisher’s Note: The statements, opinions and data contained in all publications are solely those of the individual author(s) and contributor(s) and not of MDPI and/or the editor(s). MDPI and/or the editor(s) disclaim responsibility for any injury to people or property resulting from any ideas, methods, instructions or products referred to in the content.

