Article

Preliminary Assessment of BDS Radio Occultation Retrieval Quality and Coverage Using FY-3E GNOS II Measurements

by
Congliang Liu
1,2,3,4,
Mi Liao
5,*,
Yueqiang Sun
1,2,3,
Xi Wang
1,2,3,4,
Jiahui Liang
1,2,3,
Xiuqing Hu
5,
Peng Zhang
5,
Guanglin Yang
5,
Yan Liu
5,
Jinsong Wang
5,
Weihua Bai
1,2,3,
Qifei Du
1,2,3,
Xiangguang Meng
1,2,3,
Peng Hu
1,2,
Guangyuan Tan
1,2,
Xianyi Wang
1,2,3,
Junming Xia
1,2,3,
Feixiong Huang
1,2,
Cong Yin
1,2,
Yuerong Cai
1,2,3,
Wei Li
1,2,
Peixian Li
4 and
Gottfried Kirchengast
2,6
add Show full author list remove Hide full author list
1
Beijing Key Laboratory of Space Environment Exploration, National Space Science Center, Chinese Academy of Sciences (NSSC/CAS), Beijing 100190, China
2
International Laboratory on Climate and Atmosphere Research with Occultation & Reflectometry Observing Systems (ICAROS) of NSSC/CAS, German Research Centre for Geosciences (GFZ), University of Graz, 8010 Graz, Austria
3
School of Astronomy and Space Science, University of Chinese Academy of Sciences, Beijing 100049, China
4
School of Geoscience and Surveying Engineering, China University of Mining and Technology-Beijing, Beijing 100083, China
5
National Satellite Meteorological Center, China Meteorological Administration (NSMC/CMA), Beijing 100081, China
6
Wegener Center for Climate and Global Change (WEGC) and Institute of Physics, University of Graz, 8010 Graz, Austria
*
Author to whom correspondence should be addressed.
Remote Sens. 2023, 15(20), 5011; https://doi.org/10.3390/rs15205011
Submission received: 10 September 2023 / Revised: 5 October 2023 / Accepted: 13 October 2023 / Published: 18 October 2023

Abstract

:
The FengYun-3E Global Navigation Satellite System (GNSS) occultation sounder II (FY-3E GNOS II) was launched on 5 July 2021. For the first time, based on the new GNOS II sensor, this mission realizes radio occultation (RO) and reflectometry observations using the navigation signals from the third-generation BeiDou System (BDS-3), and it is hence important to assess and analyze the BDS-3 remote sensing performances relative to other systems. Here, we assessed FY-3E GNOS II RO atmospheric retrievals by inter-comparing with corresponding data from the NCEP FNL global atmospheric analysis and FY-3D GNOS mission. The GNOS RO data quality and consistency of the different FY-3 meteorological satellites, i.e., FY-3D and FY-3E, as well as different GNSS systems (GPS, BDS-2, BDS-3) were analyzed. We find that the FY-3E GNOS II RO data exhibit better quality than FY-3D GNOS, particularly in the number, penetration height toward surface, and global coverage by BDS RO profiles, due to the integration of BDS-2 and BDS-3. Additionally, comparing with co-located NCEP FNL analysis profiles, the mean difference (and standard deviation) of the FY-3E GNOS II RO atmospheric refractivity profile retrievals is found to be smaller than 0.2% (and 1%), in the upper troposphere and lower stratosphere, from 5 to 30 km, and remains consistent at this accuracy and precision level with the FY-3D GNOS RO data. These features provide clear evidence for a high utility of the new GNOS II RO data for weather and climate research and applications.

1. Introduction

The Global Navigation Satellite System (GNSS) radio occultation (RO) has become a major remote sensing technique to study the Earth’s atmosphere, with unique properties of high vertical resolution, high accuracy, all-weather capability, global coverage, long-term stability, and a consistency of different RO mission observations [1,2,3,4,5]. Thus, GNSS RO data products have been widely used for numerical weather prediction (NWP) [6,7,8,9] and global climate monitoring (GCM) [5,7,10,11,12,13,14] applications.
With the emergence of the Global Positioning System (GPS), the GNSS RO technique was first demonstrated by the proof-of-concept GPS/Meteorology (GPS/MET) mission launched in 1995 [15,16]. Subsequently, many GNSS RO missions have been launched, e.g., CHAllenging Minisatellite Payload (CHAMP) [17,18,19], Gravity Recovery and Climate Experiment-A (GRACE-A) [19], and Meteorological Operational Satellite-A/-B/-C (MetOp-A/-B/-C) [20], and the Constellation Observing System for Meteorology, Ionosphere, and Climate (COSMIC), which is the first GNSS RO constellation with six low-Earth-orbit (LEO) satellites [10,21,22].
In recent years, with the development of GNSSs, e.g., the Chinese BeiDou Global Navigation Satellite System (BDS) [23,24], the European Galileo navigation satellite system (Galileo), and the Russian GLObal NAvigation Satellite System (GLONASS) [25,26], the new GNSS RO missions are commonly equipped with multi-GNSS RO receivers, e.g., the FengYun-3C/-3D GNSS Occultation Sounder (FY-3C/-3D GNOS) [9,27,28,29,30], the COSMIC-2 constellation [31], and the Spire weather constellation [32,33].
Meanwhile, another GNSS remote sensing technique named GNSS reflectometry (GNSS-R) for observing the Earth’s ocean wind, ice cover, soil moisture, and some other geophysical parameters, has been gradually demonstrated by several space-borne missions, e.g., the U.K.’s Disaster Monitoring Constellation (DMC) [34,35], TechDemoSat-1 [36,37], and the U.S.’s CYclone Navigation Satellite System (CYGNSS) [38,39].
In China, the BDS-3 constellation was fully established in July 2020 and has since then officially provided services for global users. So far, the BDS-2 constellation is composed of 15 satellites, including five geostationary-Earth-orbit (GEO), seven inclined-geosynchronous-orbit (IGSO), and three medium-Earth-orbit (MEO) satellites, while the BDS-3 constellation has a total number of 30 satellites, including three GEO, three IGSO, and 24 MEO satellites [24]. In addition, there are four BDS-3 experimental satellites (BDS-3e) available, including two IGSO and two MEO satellites [26]. On the other hand, the FY-3E GNOS II mission, which has both the GNSS RO and GNSS-R functions to probe the atmosphere, ionosphere, and ocean wind simultaneously, was launched in July 2021 [40,41,42,43,44].
The FY-3E GNOS II mission provides the GPS/BDS RO data product for global users; therefore, it is important to assess and analyze the GNOS II RO performance, especially the performance of the new BDS-3 RO relative to the other systems.
The study is organized as follows. Section 2 briefly overviews the status and progress of FY-3C/-3D/-3E/-3F/-3G GNOS missions. Section 3 describes the datasets and methods used in the FY-3E GNOS II BDS radio occultation quality and coverage performance assessment. The assessment results are described and analyzed in Section 4. The FY-3E GNOS II BDS radio occultation performances are summarized, and some conclusions are drawn in Section 5.

2. Overview of FY-3 GNOS Missions

FY-3 series satellites are the second-generation polar-orbiting meteorological satellites in China, which include eight LEO satellites and were scheduled to be launched in three batches [45,46]. The GNOS instruments were designed and developed for the second batch of FY-3 satellites, i.e., FY-3C/-3D satellites [30,47,48,49,50]. FY-3C/-3D GNOS instruments were successfully launched on 23 September 2013 and 15 November 2017, respectively, for sounding the Earth’s neutral atmosphere and ionosphere by using both the BDS-2 and GPS signals [27,28,48,51].
FY-3C GNOS is the first multi-GNSS (i.e., BDS-2/GPS) RO sounder in space, which has been successfully running in orbit for more than ten years now. So far, large amounts of FY-3C GNOS RO atmospheric measurements have been accumulated and evaluated by different institutions. Regarding the FY-3C GNOS atmospheric product, compared with the co-located European Centre for Medium-Range Weather Forecasts (ECMWF) analysis data, the mean bias/standard deviation of the atmospheric refractivity is less than 1%/2% in the upper troposphere and lower stratosphere [45]; meanwhile, the consistency of BDS-2 and GPS RO products has been successfully validated [30].
Comparing with the FY-3C GNOS, FY-3D GNOS has more frequency channels, a higher gain antenna and a better satellite selection algorithm; therefore, it observes more RO events per day than that of FY-3C GNOS [52]. It has proven the utilities of the GNOS RO data for applications in NWP, GCM, and space weather research [30].
Due to the positive performance of the FY-3C/-3D GNOS instruments, the third batch of FY-3 satellites, i.e., FY-3E/-3F/-3R/-3G satellites, continue to carry GNOS as one of the major payloads [30,40]. In order to integrate the capabilities of GNSS RO and GNSS-R remote sensing techniques and to help save the satellite’s space, power, and mass, the second-generation GNOS instrument named GNOS II has been designed and developed for the third batch of FY-3 satellites [40,41,42,43,44].
The FY-3 GNOS II instrument was designed and developed based on the GNOS instrument by enhancing its original occultation detection capability, and adding a GNSS-R functional module [40,41]. The FY-3E/-3G/-3F GNOS II were launched on 5 July 2021, 16 April 2023 and 3 August 2023, respectively. So far, the FY-3E GNOS II has obtained a high amount of atmosphere, ionosphere, and wind field data products by using BDS-2/-3 and GPS signals [44].
Figure 1 shows the structure [40] of the FY-3E GNOS II instrument. It involves three main modules, each for navigation, occultation, and reflection. The navigation module receives GNSS direct signals by a precise orbit determination (POD) antenna installed on the zenith side of the satellite; the occultation module predicts and tracks the ionospheric and neutral atmospheric occultation signals received from ionospheric and neutral atmospheric antennas. There are front- and back-viewing ionospheric and atmospheric antennas installed for observing rising and setting RO signals, respectively; the reflection module receives GNSS reflection signals by a reflection antenna installed on the bottom side of the satellite.
FY-3E GNOS II comprises a choke-ring POD antenna, a 10-element front-viewing and a 10-element back-viewing occultation antennas, a four-element down-viewing reflection antenna, four radio frequency toolboxes, and an electronic toolbox. Nine elements of the 10-element occultation antenna are used for receiving atmospheric occultation signals while one element is used for receiving ionospheric occultation signals. A wide coverage of the atmospheric occultation could be achieved by using this newly developed nine-element array antenna. In order to increase the received signal power of atmosphere occultation signals, the gain pattern with shaped beams at a 45° azimuth angle provides up to 10 dBi. The reflection module generates waveform by cross-correlating signal and replica during an integration time and uses Fast Fourier Transformation (FFT) to calculate the 2D delay and Doppler correlation results [40,41], and the preliminary GNSS-R observation and wind product have been validated and analyzed [44], which indicated that the FY-3E GNOS II GNSS-R technique performs well.
This paper mainly focuses on the FY-3E GNOS II RO atmospheric product assessment and analyses by comparing with FY-3D GNOS RO data. Table 1 shows the main parameters of FY-3C/-3D/3E GNOS (II) instruments for navigation and occultation modules [43].

3. Datasets and Assessment Methods

In this study, the FY-3E GNOS II RO atmospheric product performances of occultation event number and spatiotemporal coverage, bias and quality consistency with other GNOS RO data, and with co-located National Centers for Environmental Prediction (NCEP) Final (FNL) global atmospheric analysis data, will be assessed.

3.1. GNOS RO and Reference Datasets

To analyze the performance of FY-3E GNOS II RO atmospheric products, we have selected the FY-3E GNOS II and FY-3D GNOS atmPrf RO datasets over the six months from September 2022 to February 2023. These datasets can be downloaded from the website http://data.nsmc.org.cn/portalsite/default.aspx?currentculture=en-US (accessed on 21 May 2023).
In general, the quality and accuracy of GNSS RO atmospheric products are assessed by comparing them with independent reference datasets. In this study, we have chosen the NCEP FNL global analysis as the atmospheric reference data. The NCEP FNL global analysis is a widely used atmospheric dataset that provides comprehensive information on global atmospheric conditions, including temperature, humidity, air pressure, wind, and other related variables. The NCEP FNL analysis dataset can be obtained from the website https://rda.ucar.edu/datasets/ds083.2/dataaccess/ (accessed on 21 May 2023).

3.2. FY-3E GNOS II RO Data Assessment Methods

3.2.1. RO Event Numbers and Spatiotemporal Coverage

In this study, we aim to analyze the detection capabilities of FY-3E GNOS II Radio RO data by comparing it with FY-3D GNOS datasets. Additionally, we compare and analyze the detection capabilities for GPS and BDS RO measurements.
In order to visualize the GNSS RO events and assess the detection capabilities, we employ histogram to display the daily GNSS RO event numbers, create global distribution maps to show the spatial coverage of GNSS RO measurements, overlay information such as profile lowest penetration height to understand the vertical extent of the measurements, and calculate the global coverage fraction (GCF) [53] to assess their coverage capabilities quantitatively.
To calculate the GCF in this study, we first divide the Earth’s surface into uniform grid cells of size 400 × 400 km2, with a reference origin at (0°, 0°). We then sequentially allocate the recorded GNSS RO events into their corresponding grid cells using equal-area mapping, ensures that each grid cell covers an equal spatial area. By doing so, we obtain the GNSS RO spatiotemporal datasets, which represent the distribution and coverage of GNSS RO measurements across different spatial grids and time intervals. Specifically, the events’ allocation procedure and GCF computation include three steps, as follows:
(1)
Time normalization to the period of interest through
t = t R O t 0 ,
where t R O is the RO event time and t 0 is the start time of the analysis period.
(2)
Allocation of the RO events based on their geographic location into corresponding equal-area grid cells, according to the description of equal-area projection in [54].
(3)
Calculation of the global coverage fraction in the form of time series [53]:
G C F = S o c c / S t o t × 100 % ,
where GCF is the global coverage fraction of RO events, S o c c is the accumulated area of the grid cells visited by RO events, and S t o t is the total grid area, i.e., the entire Earth’s surface area in the given case of a global coverage fraction.
By employing these grid-sampling and visualization methods and by analyzing the GNSS RO event locations, occultation number histograms, global distribution maps, and the coverage through GCF graphs, we can thoroughly evaluate the FY-3E GNOS II GPS and BDS capabilities in comparison with FY-3D GNOS datasets.

3.2.2. Refractivity Profiles Retrieval Performance

This study aims to assess the quality of FY-3E GNOS II RO data by comparing it with the NCEP FNL global analysis dataset, specifically focusing on refractivity. Refractivity is a crucial variable in the GNSS RO retrieval chain and is also used as an input parameter for NWP assimilation. It is hence a good choice for a first evaluation of retrieval quality.
To estimate the FY-3E GNOS II RO refractivity mean difference and standard deviation relative to the NCEP FNL analysis, we then proceeded as follows.
Firstly, we prepared the sets of RO refractivity profile data and co-located NCEP FNL analysis data. Then, the refractivity difference profile ΔNi between each corresponding pair of RO-observed profile and co-located NCEP FNL profile was calculated. Finally, the statistical profiles of mean difference Δ N ¯   and standard deviation σ Δ N were obtained from the ensemble of difference profiles according to Equations (3) and (4):
Δ N ¯ = 1 n i = 1 n Δ N i ,
σ Δ N = 1 n 1 i = 1 n Δ N i Δ N ¯ 2 ,
where n is the total number of occultation events (difference profiles) and i is the index of individual events. We note that, in this data processing, any gross anomalies in the RO observations were identified and removed as outliers.

3.2.3. Evaluation of Consistency with FY-3D GNOS RO Data

The consistency between the FY-3E GNOS II RO atmospheric refractivity retrievals and those from the previous FY-3D GNOS mission is assessed by comparing their observations across different GNSS systems and over varying time periods.

4. Results and Analysis

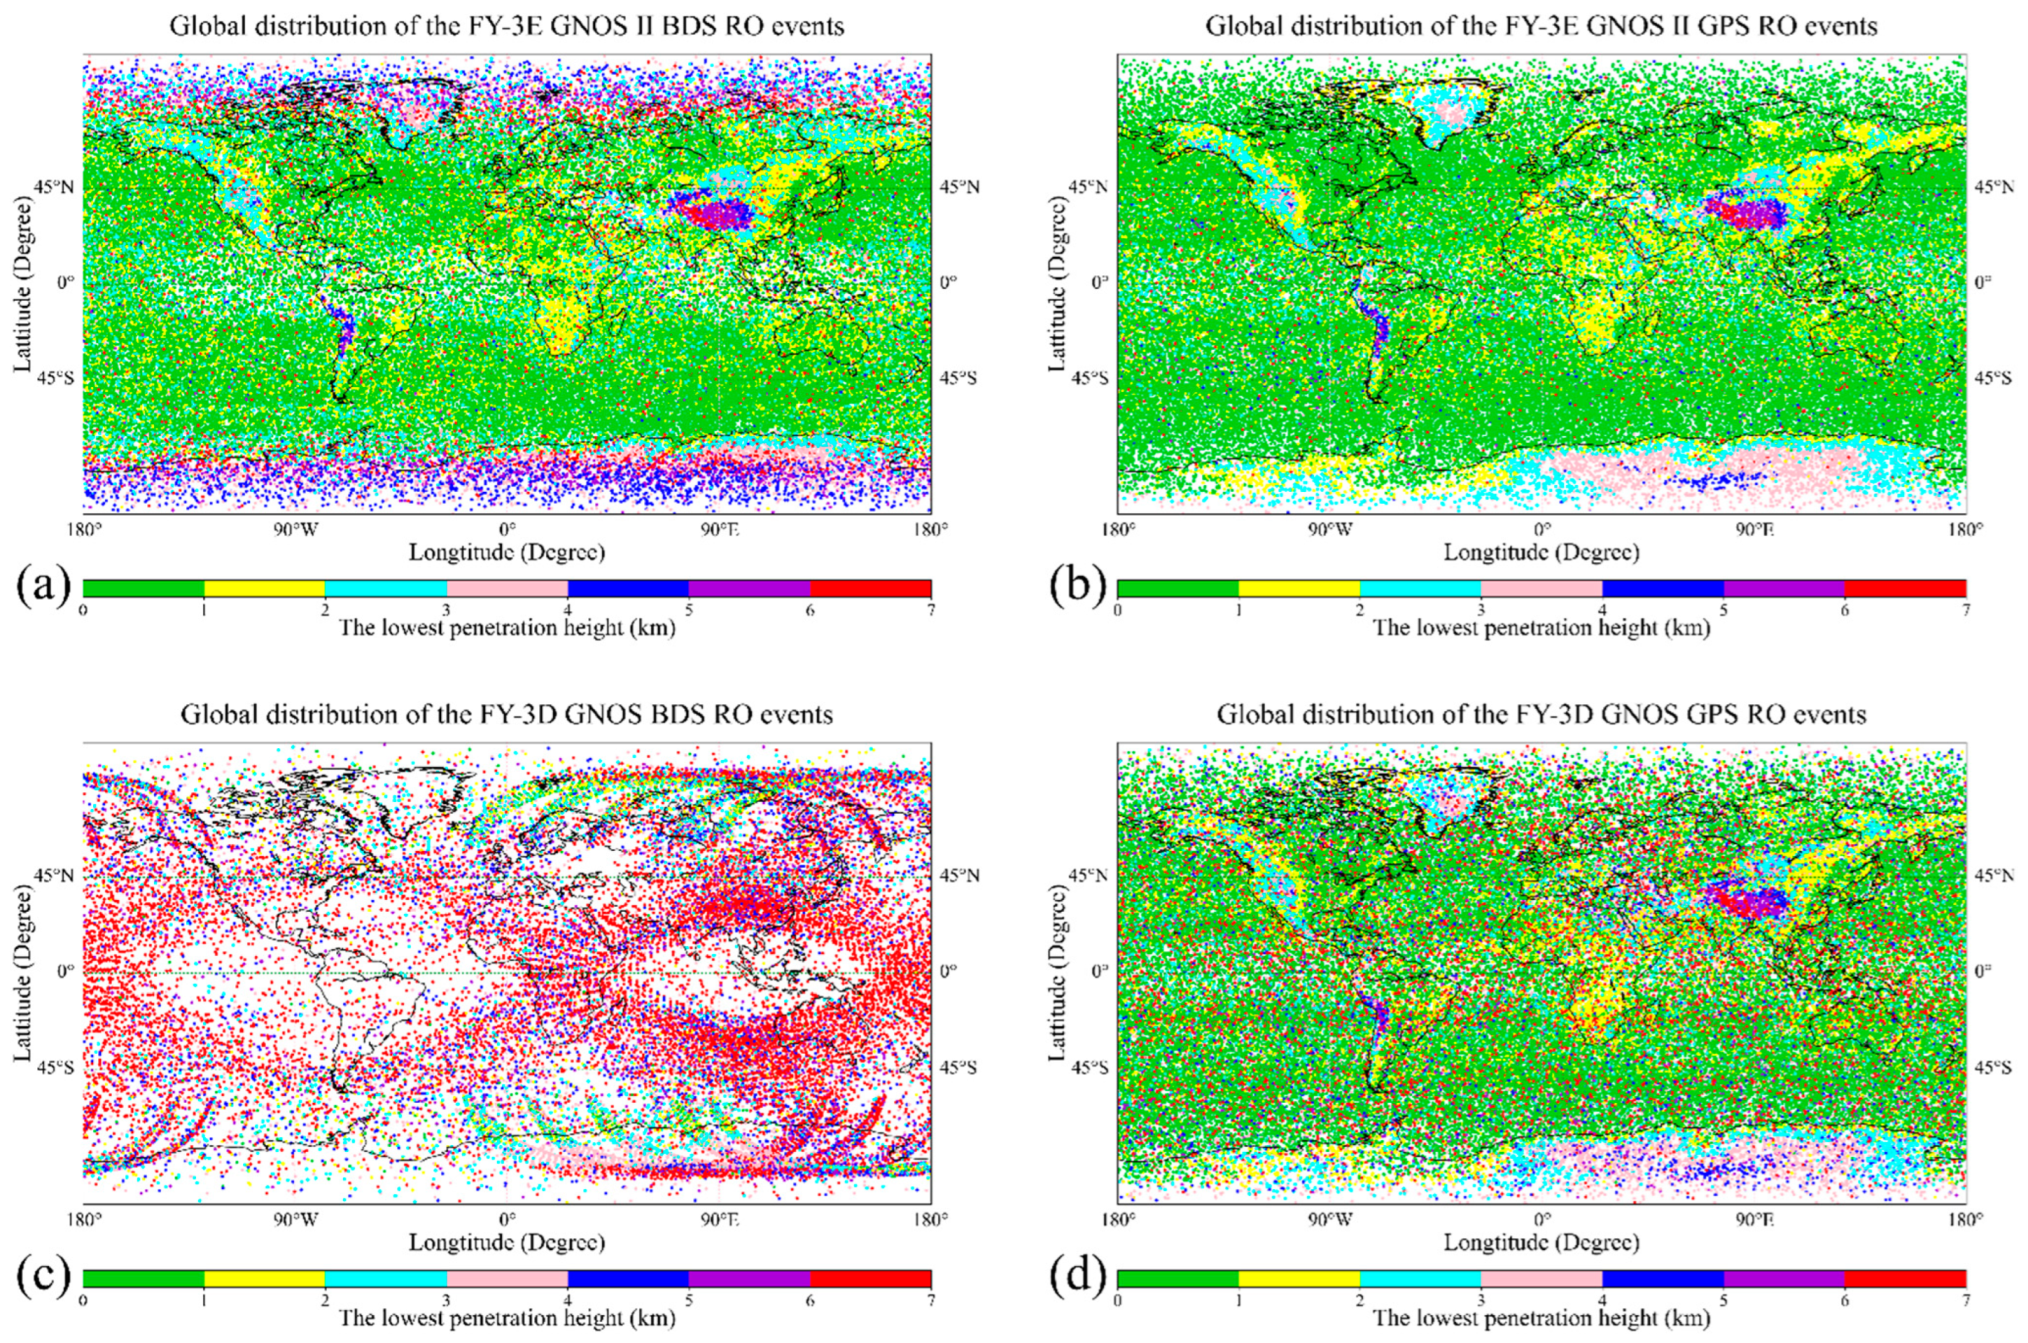
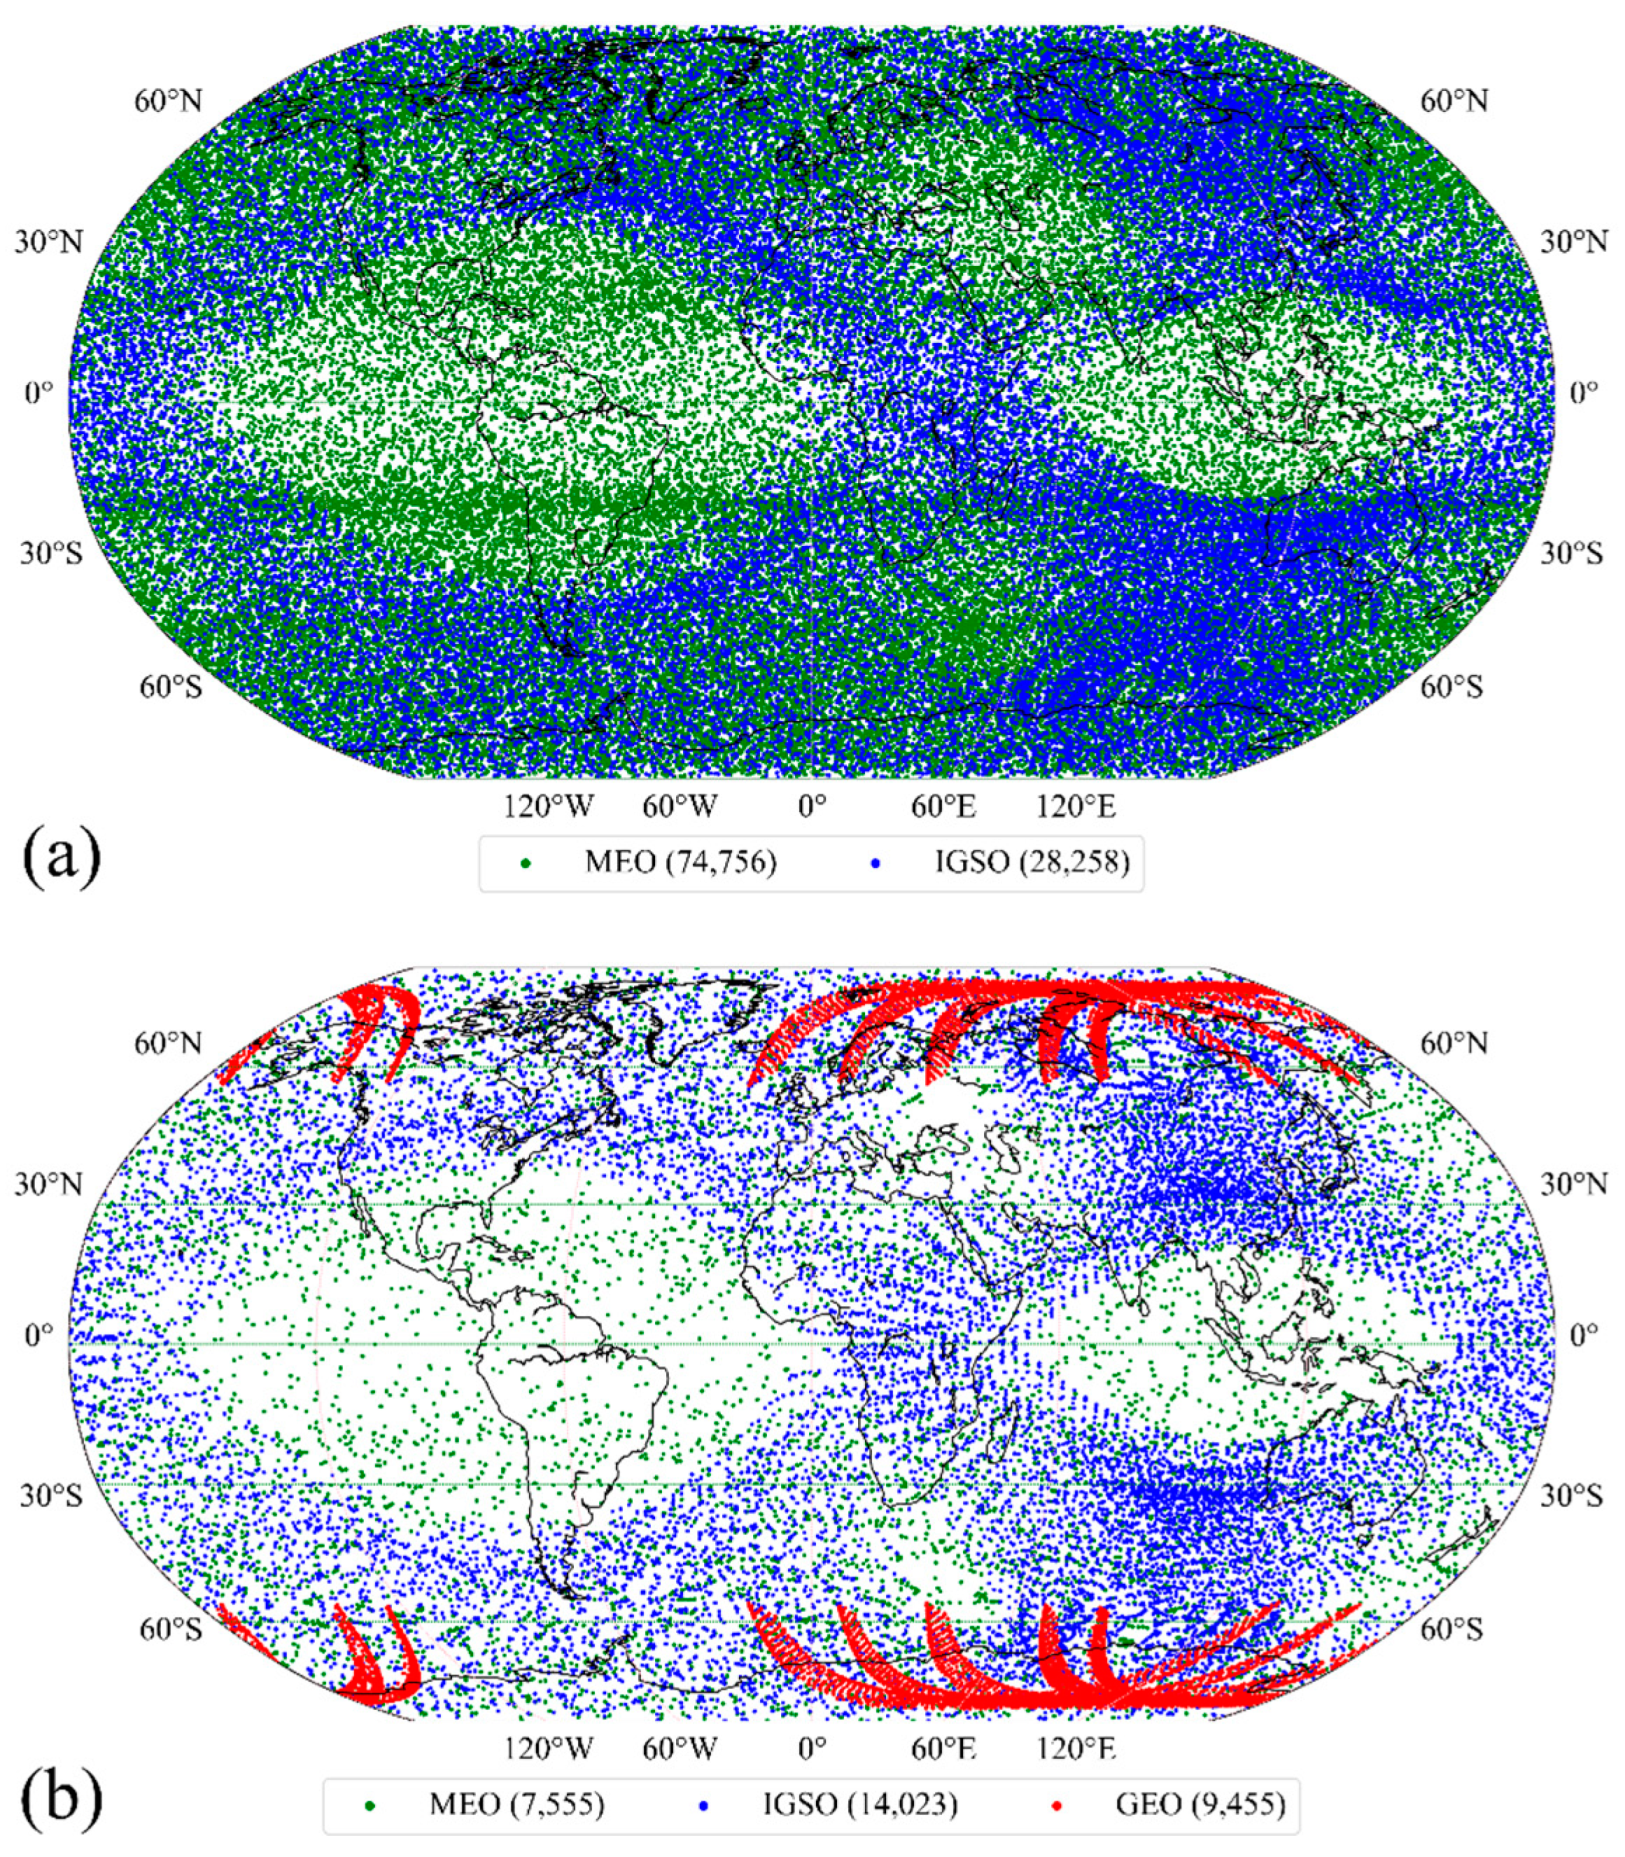
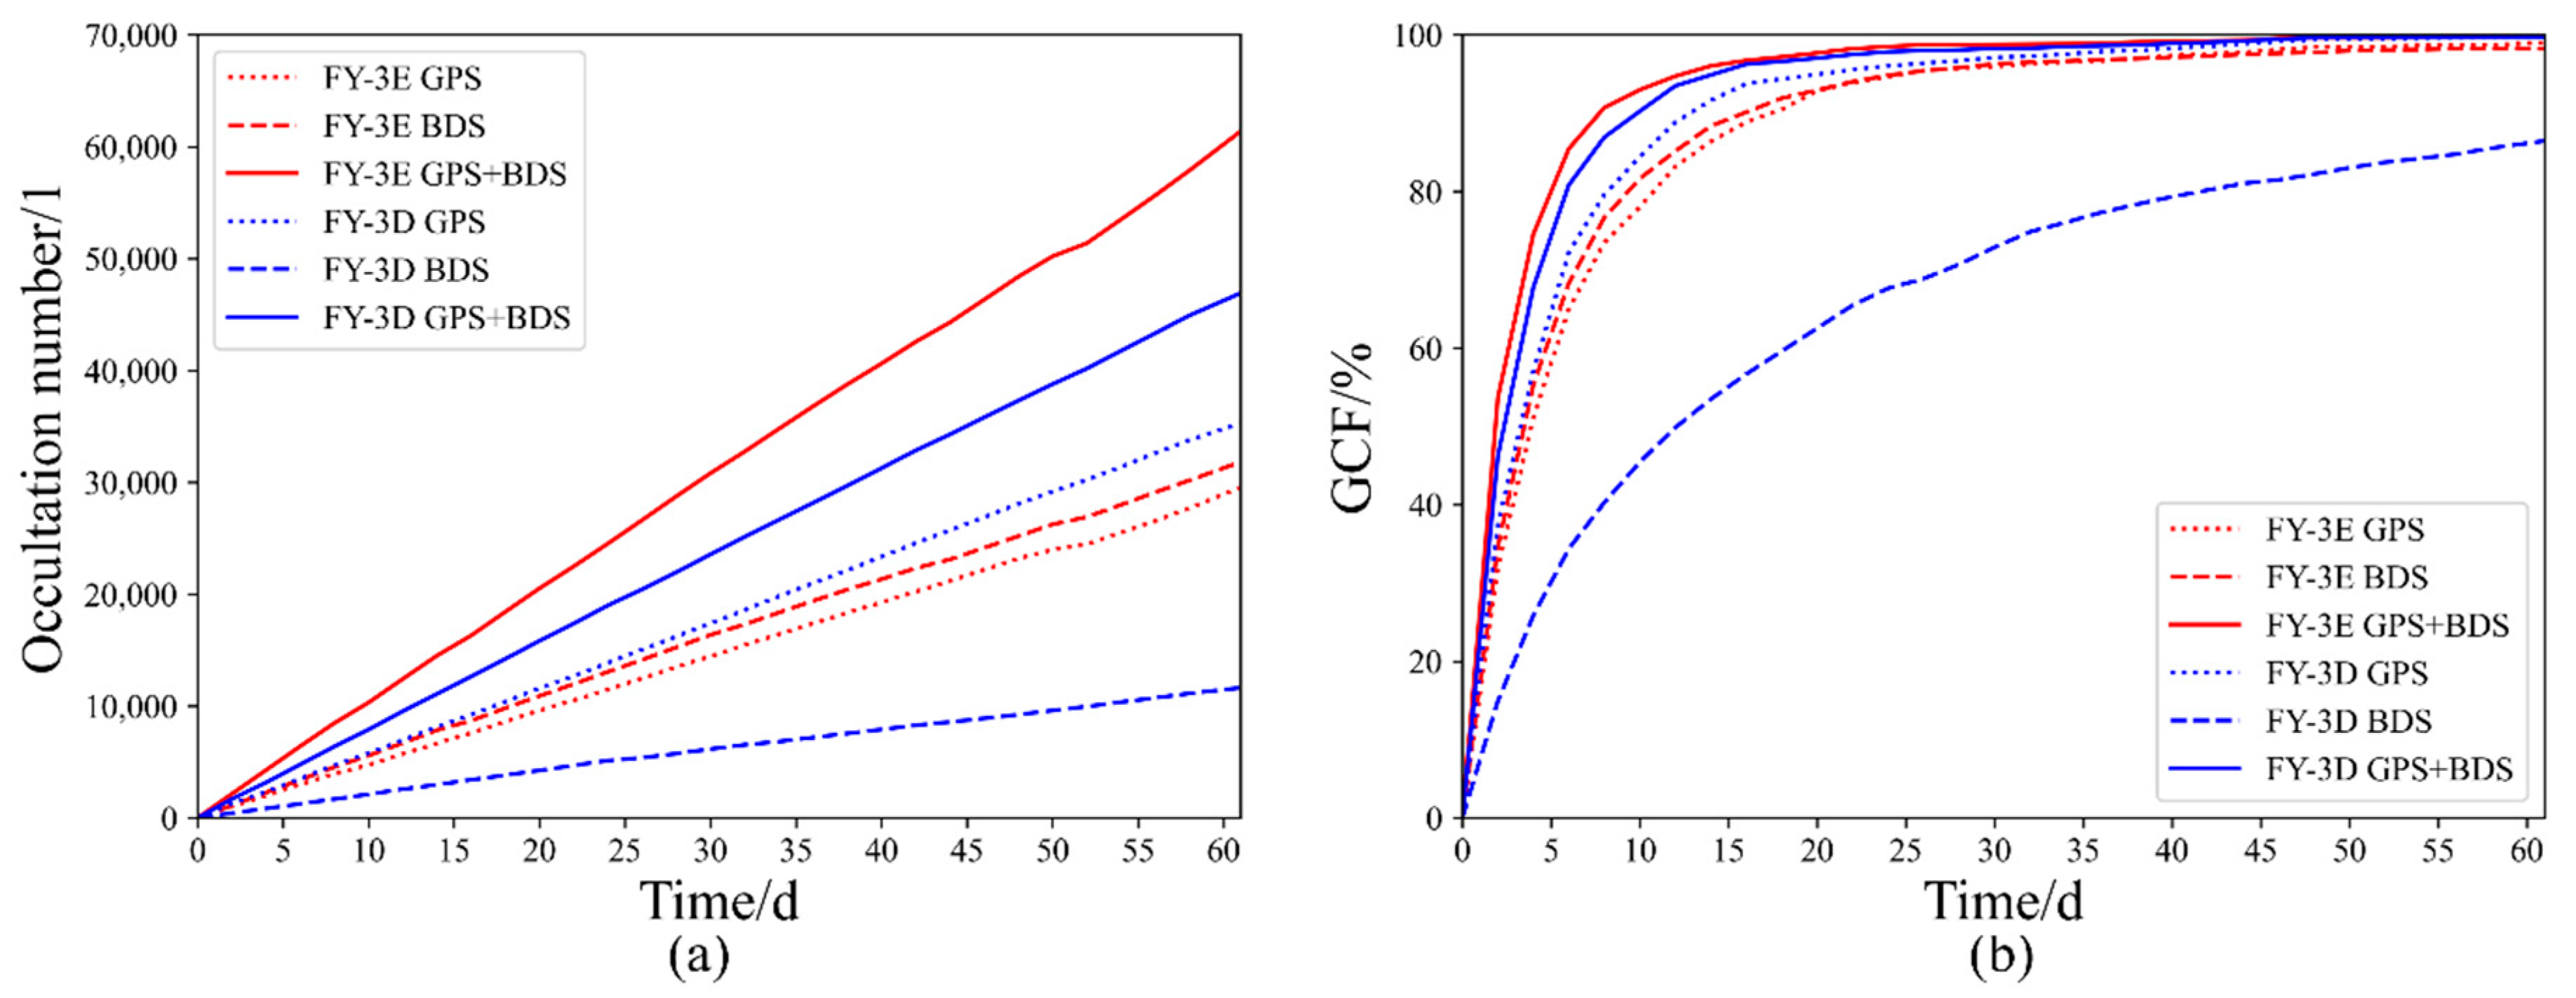
4.1. RO Event Numbers and Spatiotemporal Coverage

To assess the enhancement in the RO detection capability of FY-3E GNOS II compared to FY-3D GNOS, Figure 2 illustrates the geographical distribution of RO events over the six-month period from 1 September 2022 to 28 February 2023. The four panels (a to d) correspond to the global distribution of RO events detected by FY-3E GNOS II BDS, FY-3E GNOS II GPS, FY-3D GNOS BDS, and FY-3D GNOS GPS, respectively.
Comparing panel 2 (a) with (c), it is evident that the FY-3E GNOS II BDS RO events show a significant advantage over the FY-3D GNOS BDS in terms of the number of events, global coverage, and atmospheric penetration. This is because the FY-3E GNOS II system receives BDS signals from a larger number of satellites, incorporating both BDS-2 and BDS-3 constellations, and utilizes open-loop observations in data processing. In panel 2 (c), the coverage of BDS-IGSO RO events exhibits a quasi-global pattern, resembling the shape of the numeral “8”. The larger oval covers areas such as South America and the Pacific and Atlantic Oceans, while a relatively smaller oval covers the regions of Southeast Asia, Northwestern Australia, and the Pacific and the Indian Oceans. This distribution is similar to that observed in the FY-3C GNOS BDS RO events [29].
Comparing panel 2 (b) with (d), it becomes clear that the FY-3E GNOS II GPS RO events exhibit similar characteristics in terms of number and global coverage to the FY-3D GNOS BDS RO events, with slightly deeper penetration into the lower troposphere.
Comparing panel 2 (a) with (b and d), we can observe that the FY-3E GNOS II BDS RO events demonstrate similar numbers and global coverage as the GPS RO events. Furthermore, the lowest penetration heights of the BDS RO events in the low- and middle-latitude regions are similar to those of the GPS RO events. However, the BDS RO events show higher penetration heights in the polar zones. Additionally, panel 2 (a, b, and d) highlights the fact that RO events in the Qinghai–Tibet Plateau and Andes Mountain regions exhibit notably higher penetration heights compared to other areas.
To quantitatively inspect the number of FY-3E GNOS II BDS, FY-3E GNOS II GPS, FY-3D GNOS BDS, and FY-3D GNOS GPS RO events from 1 September 2022 to 28 February 2023, Figure 3 presents a histogram showing the daily number of RO events.
It is evident from Figure 3 that there are approximately 550 FY-3E GNOS II BDS, FY-3E GNOS II GPS, and FY-3D GNOS GPS RO events per day at the atmPrf data level. In contrast, there are approximately 190 FY-3D GNOS BDS RO events per day. These data showcase the notable advantage of FY-3E GNOS II BDS RO events compared to FY-3D GNOS BDS in terms of event numbers.
To perform a quantitative analysis of the spatial and temporal distribution of FY-3E GNOS II BDS data compared to GPS GNOS, we prepared Figure 4, which displays the number of RO events for each grid cell during the revisit times as noted in the panels. A 5° × 5° latitudinal and longitudinal grid coordinate system is used, i.e., the map is divided into grid cells with each cell spanning 5° × 5°.
In Figure 4, panels (a–c) depict the global coverage situation for the FY-3E/GPS RO system, panels (d–f) for the FY-3E/BDS RO system, and panels (g–i) for the FY-3D/GPS RO system, respectively, indicating also the corresponding GCF in each panel. It is seen that the GCF of RO events gradually increases with the length of revisit time. Specifically, the GCF values of FY-3E/BDS RO events occurring in 10 days, 20 days, and 30 days are 83%, 93%, and 96%, respectively. Similarly, the GCF values of FY-3E/GPS RO events occurring in the same time intervals are 80%, 93%, and 96%, respectively. Furthermore, the GCF values of FY-3D/GPS RO events occurring in 10 days, 20 days, and 30 days are 85%, 95%, and 97%, respectively.
Comparing the performance of the FY-3E/BDS RO system with the FY-3E/GPS and FY-3D/GPS RO systems reveals that the GCFs of FY-3E/BDS RO events in 10 days, 20 days, and 30 days are similar to those of the FY-3E/GPS RO events, although slightly smaller than the GCFs observed in the FY-3D/GPS RO events. This suggests that the spatial and temporal detection capability of BDS RO events is equivalent to that of GPS RO events.
On the other hand, in panels 4 (d–f), there is also a noticeable shape resembling the numeral “8” in each image. This shape represents the higher revisit times of the FY-3E/BDS RO events along the “8” region compared to other regions. In fact, in the mid-latitude zones, the number of RO event revisits for a single-grid cell can exceed 18. However, the GPS RO events do not exhibit such performance.
In order to further inspect the geographic distribution characteristics of the BDS RO events, Figure 5 illustrates the RO event distributions for FY-3E GNOS II BDS and FY-3D GNOS BDS for the investigated time period for the GNSS subsystems in medium Earth orbits (MEOs), inclined geosynchronous orbits (IGSOs), and geostationary orbits (GEOs), respectively. For complementary information, Table 2 provides a summary of the BDS satellite PRN numbers for the RO events shown in Figure 5.
As depicted in Figure 5, the GEO RO events are primarily concentrated in the polar regions, resulting in an increased number of revisits in these areas. However, there were very few GEO RO events observed in the middle- and low-latitude zones. The distribution of IGSO RO events was uneven in both the latitudinal and longitudinal directions, which forms a shape resembling the number “8”. There are more BDS IGSO RO events located at the Asia Pacific and Oceania Indian Ocean regions, while the global distribution of MEO RO events appeared more uniform, which also explains why GPS RO events are evenly distributed.
Figure 6 illustrates the accumulated RO event numbers and GCFs trend of the FY-3E GNOS II GPS, FY-3E GNOS II BDS, FY-3E GNOS II GPS + BDS, and FY-3D GNOS GPS, FY-3D GNOS BDS, and FY-3D GNOS GPS + BDS datasets. As can be seen, the accumulated RO event numbers increase proportionally with time for all datasets. The growth rates of FY-3E GNOS II GPS + BDS and FY-3D GNOS GPS + BDS are approximately 1100 and 750 RO events per day, respectively. On the other hand, the growth rates of FY-3E GNOS II BDS and FY-3D GNOS BDS are about 550 and 190 RO events per day, respectively. The GCFs also increased with accumulation time: the 61-day cumulative RO event GCFs were about 83% for the FY-3D GNOS BDS dataset and about 99% for the new FY-3E datasets. This shows that the integration of BDS-2 and BDS-3 significantly enhanced the number of RO events and the GCFs for a single-polar-orbit LEO satellite like FY-3E. Overall, these results demonstrate the notable advantage of FY-3E GNOS II BDS RO events compared to FY-3D GNOS BDS in terms of event numbers and GCFs.

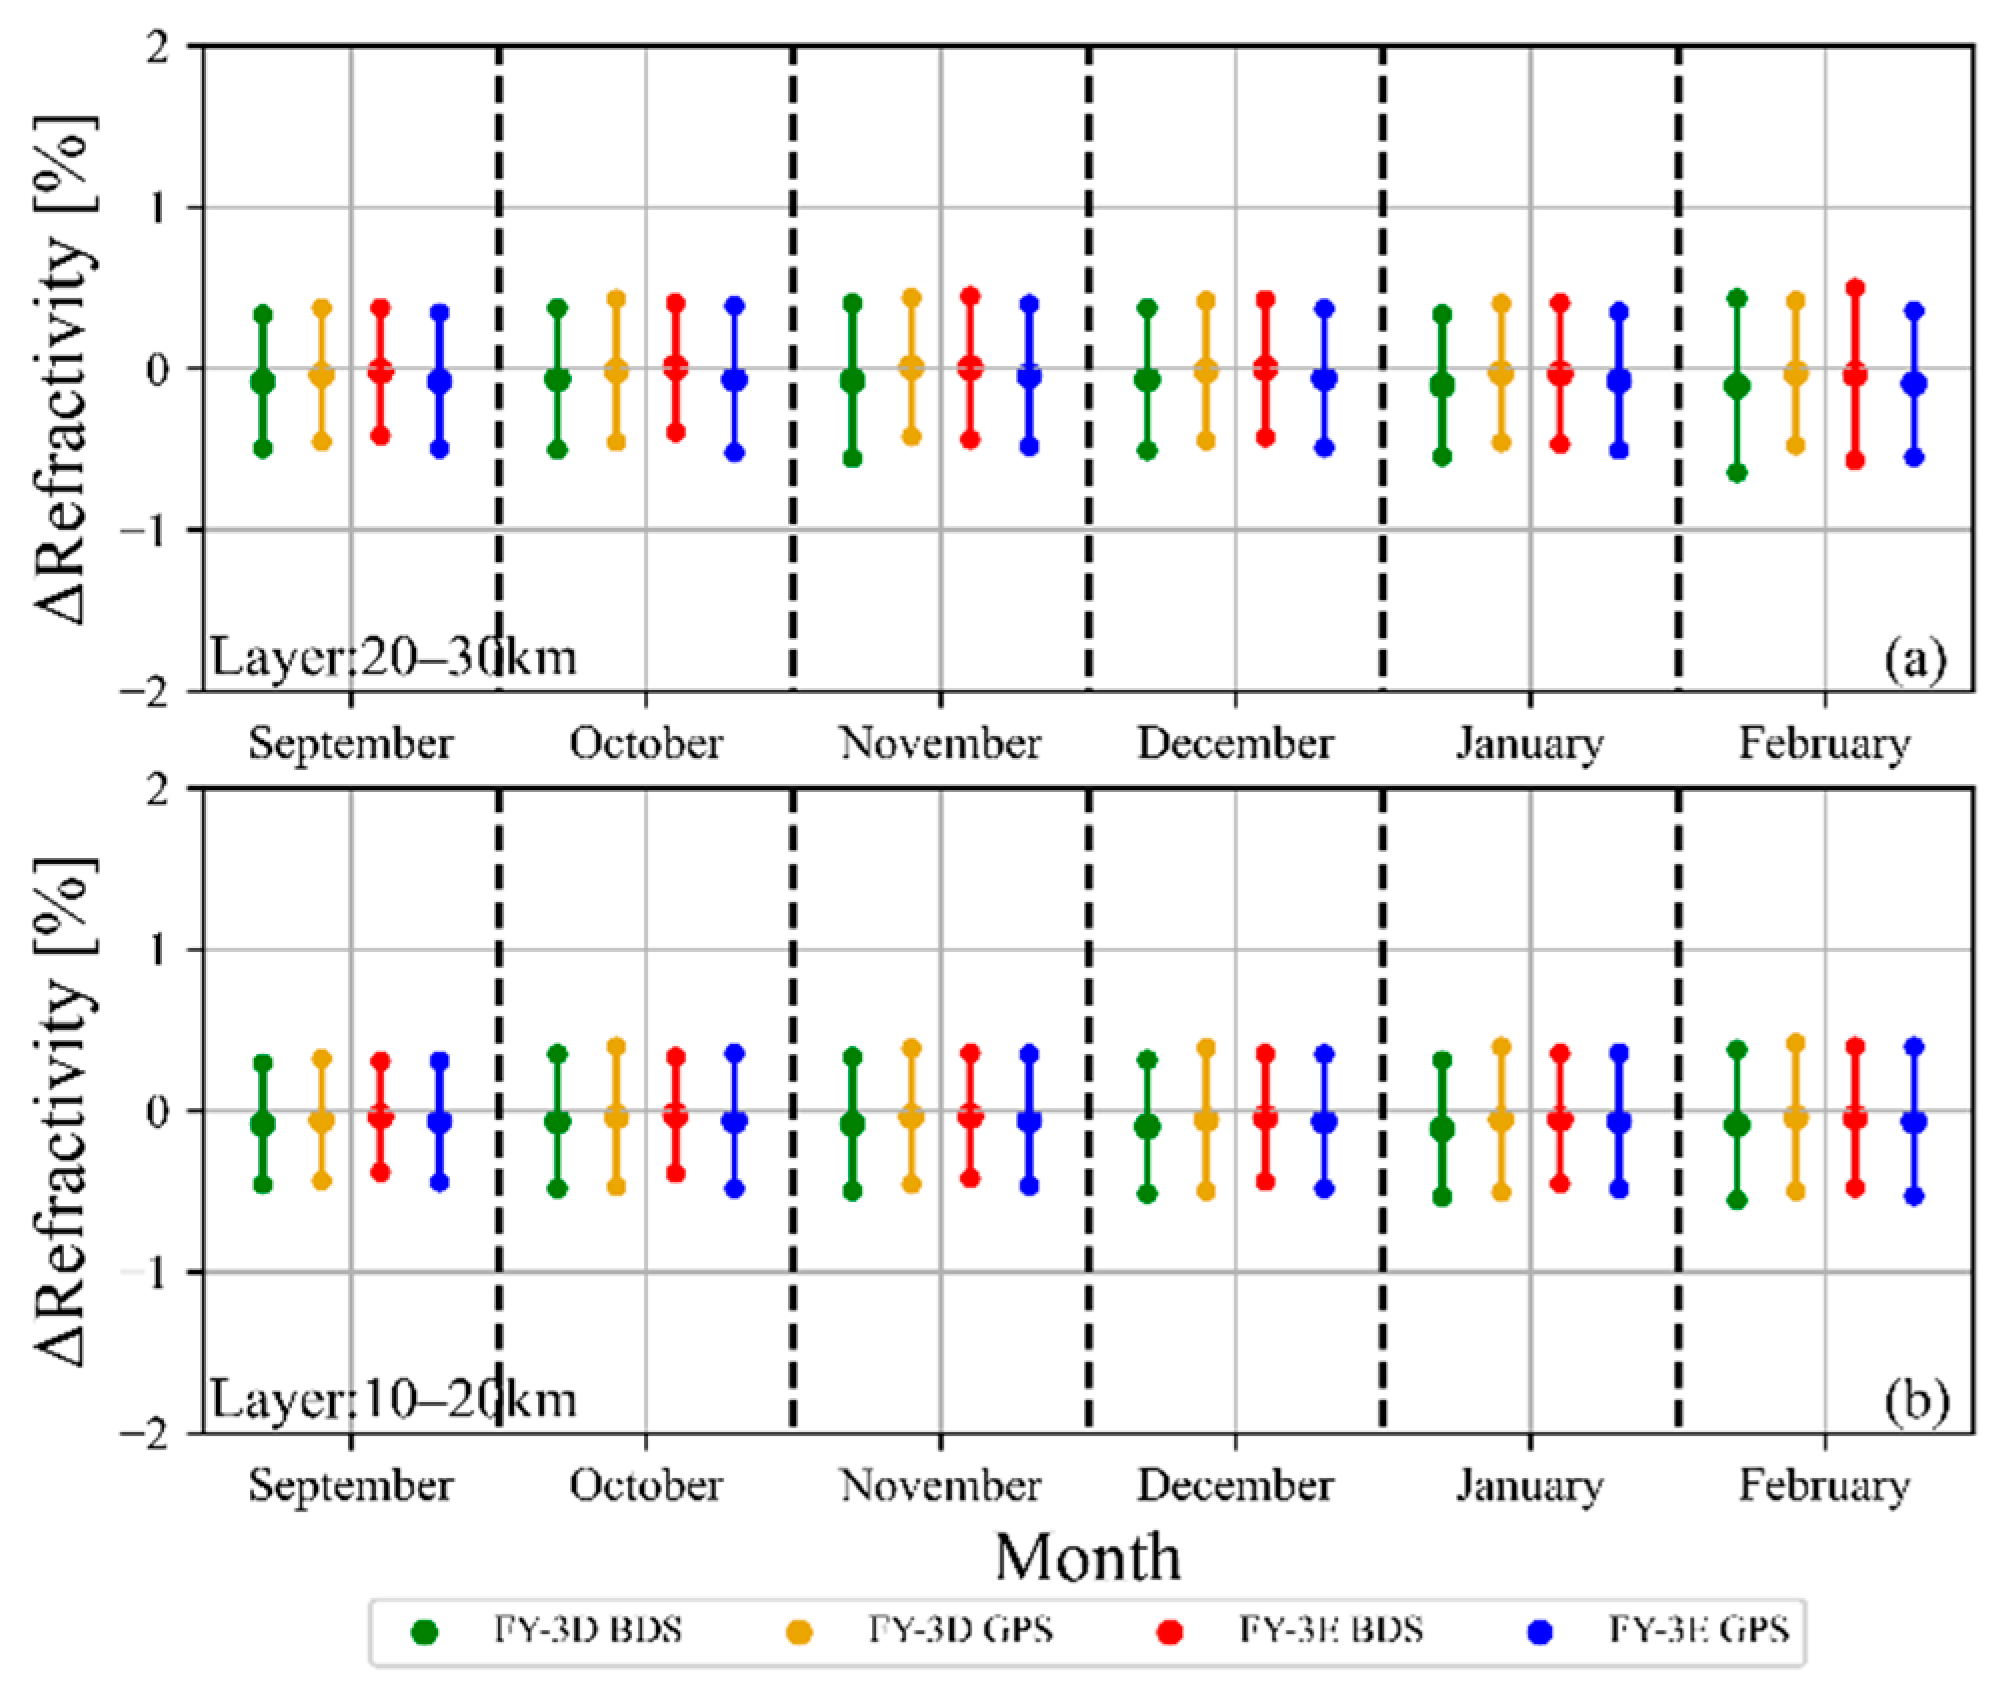
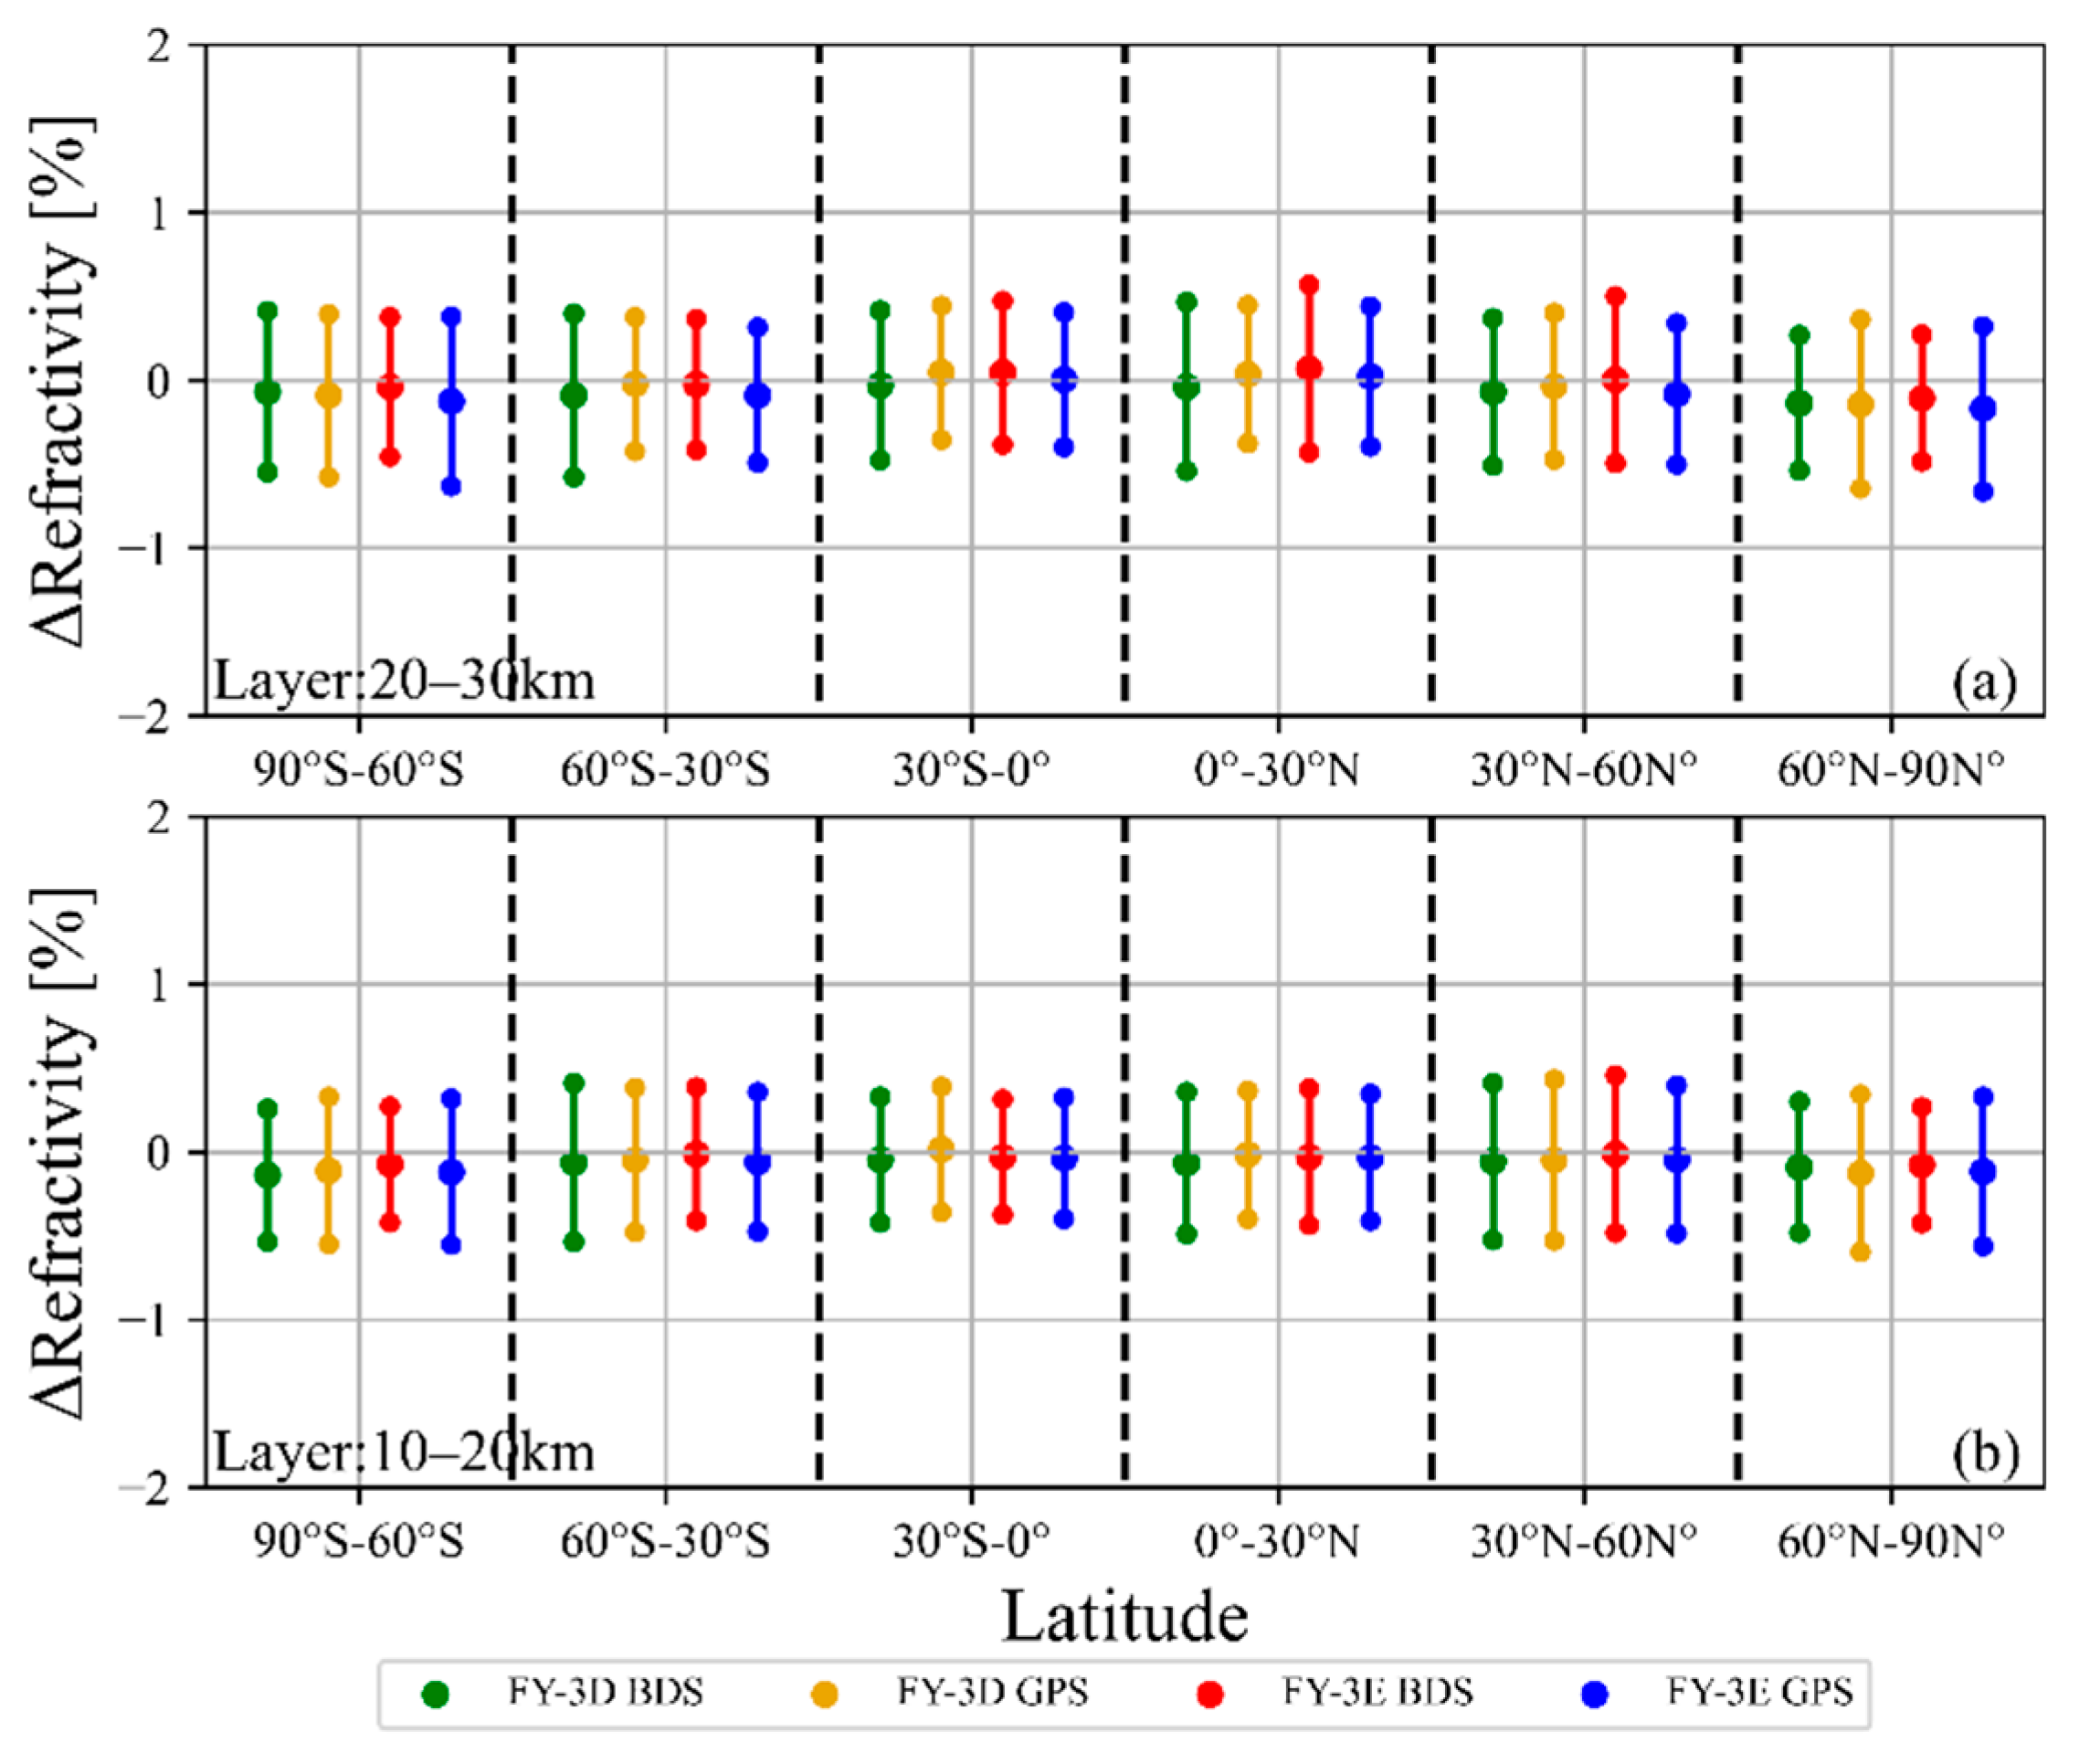
4.2. Refractivity Retrieval Performance and Evaluation of Consistency with FY-3D

Figure 7 illustrates the results of a statistical comparison between the FY-3E GNOS II and FY-3D GNOS RO refractivity profiles, using the NCEP FNL analysis data as reference, which did not assimilate the GNOS/GNOS II data during this period. We also note that, in the statistical analysis at each height level, the 15% largest refractivity difference values were dropped out as outliers, which is a quality control measure similar to what has been performed in previous studies (e.g., [29,45]). These results clearly demonstrate a significant improvement in the quality of BDS data from FY-3D GNOS (panel b) to FY-3E GNOS II (panel a), both in terms of event numbers and penetration height toward the surface as well as in terms of accuracy.
The mean refractivity difference, measured here in percentage units, is found to be smaller than 0.2% from 5 to 30 km, indicating a strong agreement with the NCEP FNL analysis data. This indicates that the FY-3E GNOS II and FY-3D GNOS data exhibit high accuracy. Some more difference is noticed above 30 km and below 5 km, where it is known that achieving such a 0.1% level of consistency and accuracy is challenging (e.g., [4,7,11,16]).
Regarding standard deviation, the highest precision is as well observed in the 5 to 30 km range, with values smaller than 1%. However, above 30 km, the standard deviation starts to increase with height, which can be attributed partly to the analysis data and to the RO observations themselves (e.g., [7,9,16,21]).
To visually summarize the data quality and stability of the FY-3D GNOS BDS, FY-3D GNOS GPS, FY-3E GNOS II BDS, and FY-3E GNOS II GPS RO systems along the full half-year time range of data, Figure 8 shows a six-month-series of monthly layer mean differences and standard deviations for the 10–20 km and 20–30 km altitude layers.
From Figure 8, one can see that the monthly layer mean differences are stable over time and remain consistent for the four RO systems in both the 10–20 km and 20–30 km altitude layers, and are robustly smaller than 0.2%. The monthly layer mean standard deviations are also robustly consistent for the four RO systems, with values smaller than 1% and the 20–30 km layer exhibiting slightly higher values than the 10–20 km layer.
Similarly, to visually summarize the statistical error characteristics of the FY-3D GNOS BDS, FY-3D GNOS GPS, FY-3E GNOS II BDS, and FY-3E GNOS II GPS RO systems at different latitudes, Figure 9 depicts six latitude bands of the six-month-mean layer mean differences and standard deviations for the chosen altitude layers.
Figure 9 demonstrates that these differences remain stable across the six latitude bands and are consistent for the four RO systems, both in the altitude layers of 10–20 km and 20–30 km. These layer mean differences are consistently smaller than 0.2%, although indicating slightly negative means in the two polar bands (90°S-60°S and 60°N-90°N). Additionally, the six month’s standard deviations show robust consistency across the RO systems and latitude bands, with standard deviation values lower than 1%, whereby the 20–30 km layer exhibits slightly higher values than the 10–20 km layer.

5. Summary and Conclusions

The FY-3E GNOS II is a GPS/BDS/Galileo-capable GNSS remote sensing instrument in space, which can monitor the neutral atmosphere, ionosphere, and wind speed by using the GNSS RO and GNSS-R techniques. It has been operational in orbit for over 2 years. So far, a large dataset of FY-3E GNOS II GPS/BDS RO observations has been published online (http://data.nsmc.org.cn/portalsite/default.aspx?currentculture=en-US accessed on 21 May 2023). Here, we assessed the data quality and accuracy of the FY-3E GNOS II RO atmospheric data by comparing their retrieved refractivity profiles with co-located NCEP FNL analysis data as well as against the earlier-started FY-3D GNOS RO data. Furthermore, the quality and reliability of FY-3E GNOS II RO data in terms of RO event numbers over time, spatiotemporal coverage, and penetration height toward the Earth surface were analyzed by comparing with the FY-3D GNOS RO data and across different GNSS subsystems and over varying (revisit) time periods. The main conclusions are as follows:
(1)
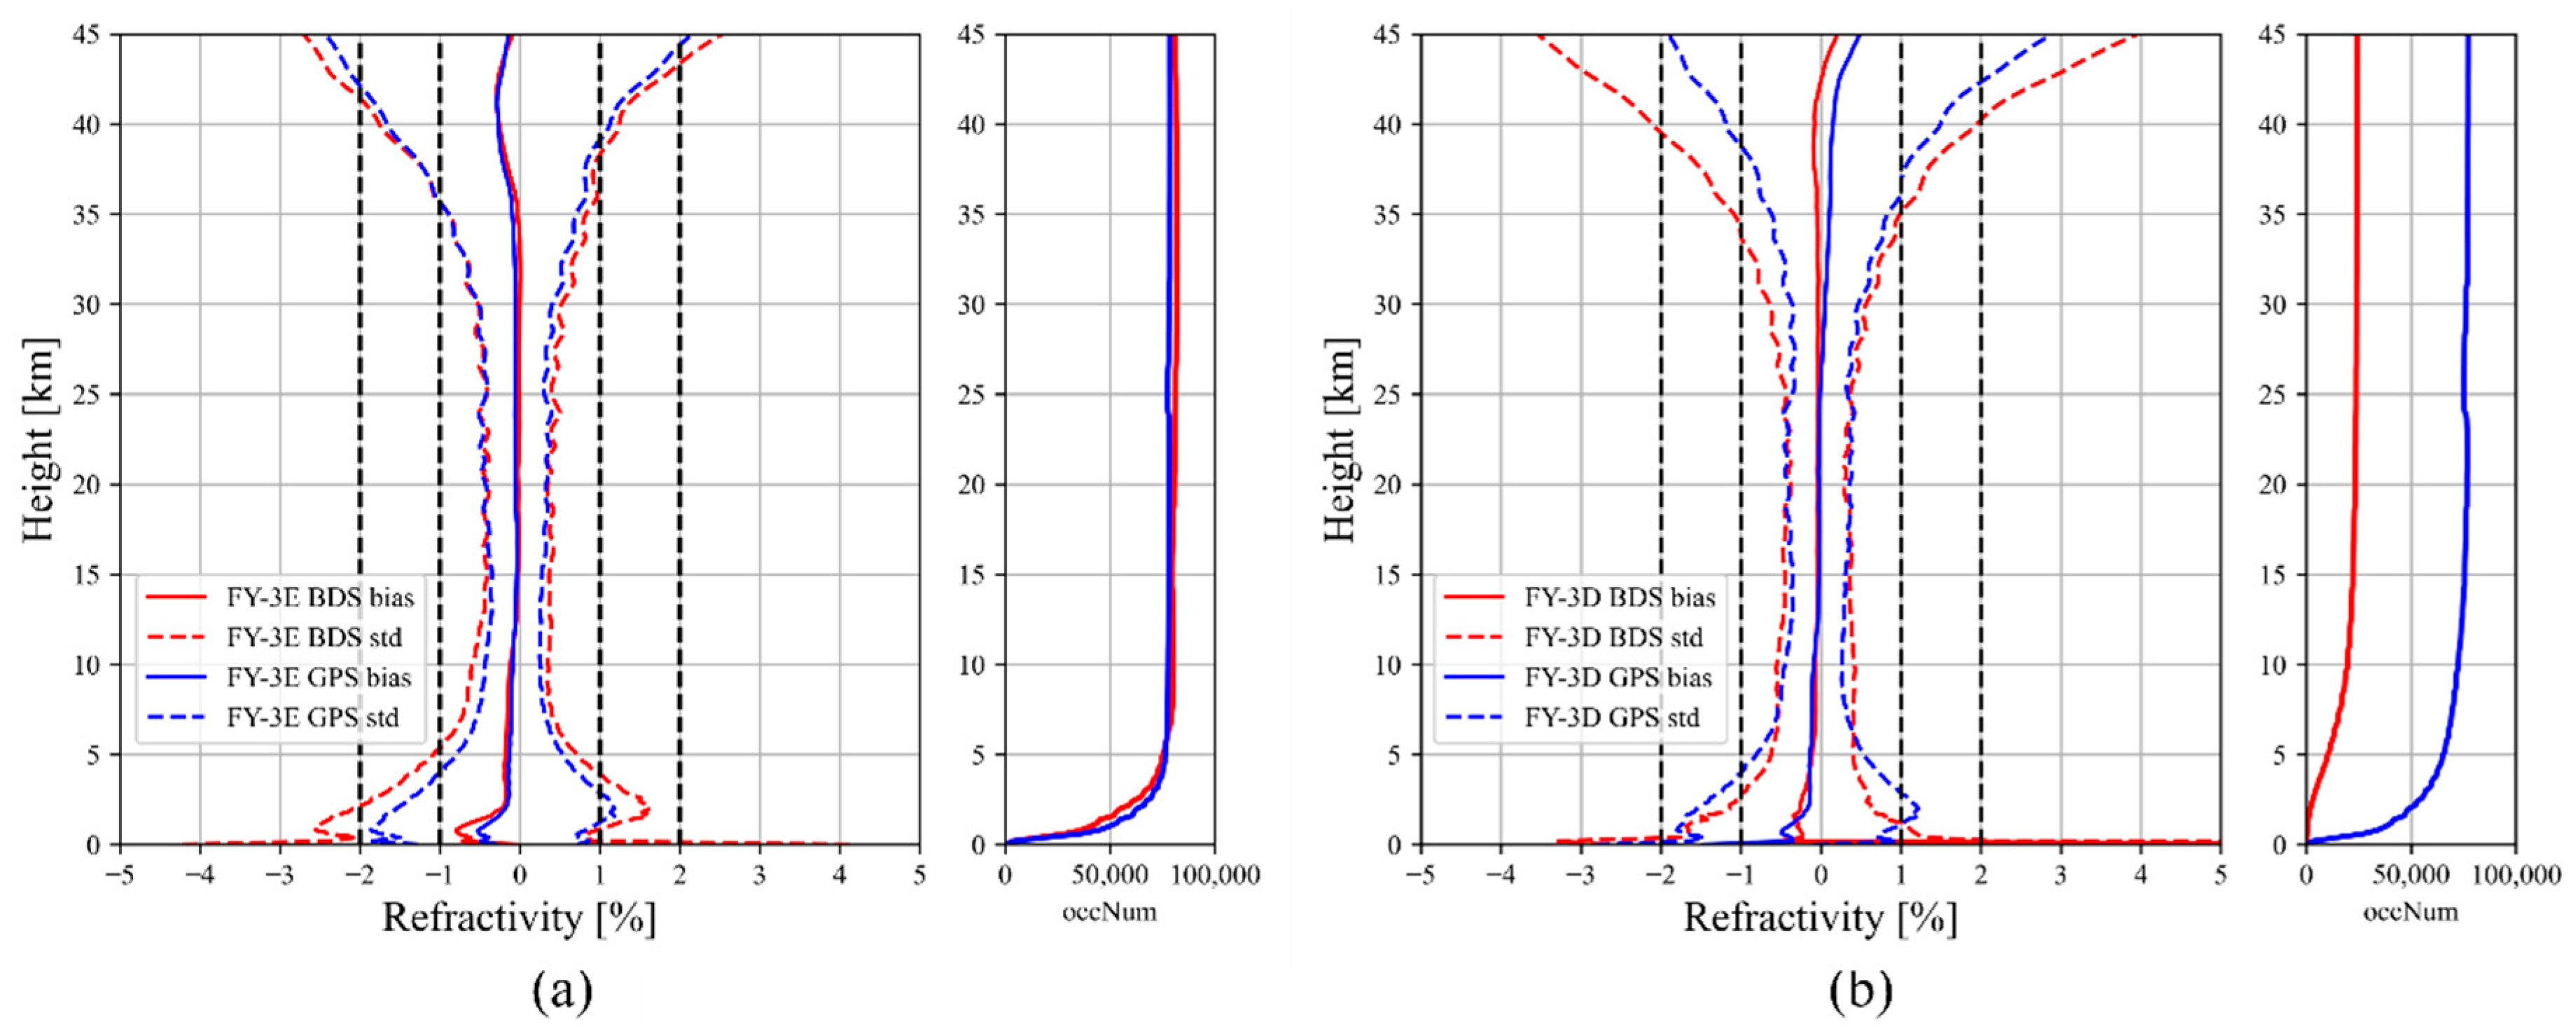
Comparing with co-located NCEP FNL analysis data, the mean difference (and standard deviation) of the FY-3E GNOS II RO atmospheric refractivity retrievals is smaller than 0.2% (and 1%), in the upper troposphere and lower stratosphere, and remains consistent at this accuracy and precision level with the FY-3D GNOS RO data.
(2)
The RO event numbers and the spatiotemporal coverage of the FY-3E GNOS II GPS RO system is similar to the FY-3D GNOS GPS RO system, showing its basic reliability in this respect. Moreover, these characteristics are significantly enlarged and improved for the FY-3E GNOS II BDS RO system compared to the FY-3D GNOS BDS RO system, due to the on-top capacity to also use the BDS-3 system.
(3)
The penetration height toward the surface of the FY-3E GNOS II BDS RO profiles is deeper than that of FY-3D GNOS BDS RO profiles, due to the availability of improved open-loop data tracking and processing.
(4)
The refractivity retrieval intercomparisons also demonstrated robust stability and accuracy along time (multi months), in different latitude bands and across all transmitter subsystems (GPS, BDS) for both the FY-3E GNOS II RO and FY-3D GNOS RO data, with mean consistencies within 0.2% and standard deviations well within 1%, in the altitude layers of 10–20 km and 20–30 km.
Overall, the FY-3E GNOS II RO data exhibits better performance compared to FY-3D GNOS RO, particularly in the number, penetration height toward surface, and global coverage with BDS RO profiles, due to the integration of the BDS-2 and BDS-3 constellations. In terms of the quality of the atmospheric profiles, both the FY-3E and FY-3D RO systems show high accuracy and consistency, indicating the reliability of RO data across the FY-3 GNOS missions. These features provide clear evidence for the high utility of the new GNOS II RO instrument and its retrieved data products for numerical weather prediction, climate monitoring and research, and further atmosphere and climate applications.

Author Contributions

Conceptualization, C.L., M.L., Y.S., P.Z., X.H. and G.K.; methodology, C.L., M.L., X.W. (Xi Wang), W.B., Q.D. and X.M.; software, C.L., X.W. (Xi Wang), G.T. and P.H.; validation, C.L., M.L., J.L., Y.C., W.L., X.W. (Xianyi Wang) and C.Y.; formal analysis, C.L., X.W. (Xianyi Wang), J.L. and J.W.; investigation, C.L., G.K., J.X., P.L. and F.H.; resources, Y.S., P.Z., X.H., G.Y. and Y.L.; writing—original draft preparation, C.L.; writing—review and editing, M.L., J.L. and G.K.; visualization, C.L. and X.W. (Xi Wang); supervision, Y.S., J.W., P.Z., X.H. and G.K.; project administration, G.Y., Q.D., M.L., W.L. and Y.L. All authors have read and agreed to the published version of the manuscript.

Funding

This research was partially funded by the Youth Innovation Promotion Association of the Chinese Academy of Sciences (grant no. 2019151), the FengYun-3 (FY-3) Global Navigation Satellite System Occultation Sounder (GNOS) development and manufacture project led by NSSC, CAS, Youth Cross Team Scientific Research Project of the Chinese Academy of Sciences (JCTD-2021-10), the National Natural Science Foundation of China (grant nos. 41775034, 41405039, 42074042, 42104032 and 41606206), the Strategic Priority Research Program of the Chinese Academy of Sciences (grant no. XDA15021002), and the Youth Talents Program Foundation of the Beijing Organization Department (grant no. 2018000097607G380). The work at University of Graz was supported by the Radio Occultation Meteorology Satellite Application Facility Fourth-Phase Partnership and Climate Research and Monitoring Project (ROMSAF4P/ROMSAF4CLIM) funded by EUMETSAT (ROMSAF4P; proj. no. PO4500023609/UG-WEGC) and by the Austrian Research Promotion Agency (FFG) through the Austrian Space Applications Programme (ROMSAF4CLIM; proj. no. 892287) endowed by the Federal Ministry for Climate Action, Environment, Energy, Mobility, Innovation and Technology (BMK).

Data Availability Statement

The FY-3D GNOS and FY-3E GNOS II RO datasets used in this study can be downloaded from http://data.nsmc.org.cn/portalsite/default.aspx?currentculture=en-US (accessed on 21 May 2023), and the NCEP FNL analysis data from https://rda.ucar.edu/datasets/ds083.2/dataaccess/ (accessed on 21 May 2023).

Acknowledgments

The authors thank NCEP and UCAR for making available the NCEP FNL global atmospheric analysis datasets (https://rda.ucar.edu/datasets/ds083.2/dataaccess/ accessed on 21 May 2023) used in this study. The authors are also grateful to the National Satellite Meteorological Center of the China Meteorological Administration (NSMC/CMA) for operating the FY-3 satellites and providing the raw-level GNOS and GNOS II instrument data for further data processing and applications.

Conflicts of Interest

The authors declare no conflict of interest.

References

  1. Hajj, G.A.; Kursinski, E.R. Analysis of errors in the vertical temperature profiles recovered from GPS occultation observations. Eos Trans. AGU 1991, 72, 372. [Google Scholar]
  2. Melbourne, W.G.; Davis, E.S.; Duncan, C.B.; Hajj, G.A.; Hardy, K.R.; Kursinski, E.R.; Meehan, T.K.; Yong, L.E.; Yunck, T.P. The Application of Spaceborne GPS to Atmospheric Limb Sounding and Global Change Monitoring; JPL Publucation 94–18; NASA: Washington, DC, USA, 1994.
  3. Kursinski, E.R.; Hajj, G.A.; Bertiger, W.I.; Leroy, S.S.; Meehan, T.K.; Romans, L.J.; Schofield, J.T.; McCleese, D.J.; Melbourne, W.G.; Thornton, C.L.; et al. Initial results of radio occultation observations of Earth’s atmosphere using the global positioning system. Science 1996, 271, 1107–1110. [Google Scholar] [CrossRef]
  4. Kursinski, E.R.; Hajj, G.A.; Schofield, J.T.; Linfield, R.P.; Hardy, K.R. Observing Earth’s atmosphere with radio occultation measurements using the global positioning system. J. Geophys. Res. 1997, 102, 23429–23465. [Google Scholar] [CrossRef]
  5. Kirchengast, G.; Schweitzer, S. Climate benchmark profiling of greenhouse gases and thermodynamic structure and wind from space. Geophys. Res. Lett. 2011, 38, L13701. [Google Scholar] [CrossRef]
  6. Harnisch, F.; Healy, S.B.; Bauer, P.; English, S.J. Scaling of GNSS radio occultation impact with observation number using an ensemble of data assimilations. Mon. Weather Rev. 2013, 141, 4395–4413. [Google Scholar] [CrossRef]
  7. Anthes, R.A. Exploring Earth’s atmosphere with radio occultation: Contributions to weather, climate and space weather. Atmos. Meas. Tech. 2011, 4, 1077–1103. [Google Scholar] [CrossRef]
  8. Bauer, P.; Radnóti, G.; Healy, S.; Cardinali, C. GNSS radio occultation constellation observing system experiments. Mon. Weather Rev. 2014, 142, 555–572. [Google Scholar] [CrossRef]
  9. Liao, M.; Healy, S.; Zhang, P. Processing and quality control of FY-3C GNOS data used in numerical weather prediction applications. Atmos. Meas. Tech. 2019, 12, 2679–2692. [Google Scholar] [CrossRef]
  10. Foelsche, U.; Pirscher, B.; Borsche, M.; Kirchengast, G.; Wickert, J. Assessing the climate monitoring utility of radio occultation data: From CHAMP to FORMOSAT-3/COSMIC. Terr. Atmos. Ocean. Sci. 2009, 20, 155–170. [Google Scholar] [CrossRef]
  11. Foelsche, U.; Scherllin-Pirscher, B.; Ladstädter, F.; Steiner, A.K.; Kirchengast, G. Refractivity and temperature climate records from multiple radio occultation satellites consistent within 0.05%. Atmos. Meas. Tech. 2011, 4, 2007–2018. [Google Scholar] [CrossRef]
  12. Lackner, B.C.; Steiner, A.K.; Hegerl, G.C.; Kirchengast, G. Atmospheric climate change detection by radio occultation data using a fingerprinting method. J. Clim. 2011, 24, 5275–5291. [Google Scholar] [CrossRef]
  13. Ladstädter, F.; Steiner, A.K.; Schwärz, M.; Kirchengast, G. Climate intercomparison of GPS radio occultation, RS90/92 radiosondes and GRUAN from 2002 to 2013. Atmos. Meas. Tech. 2015, 8, 1819–1834. [Google Scholar] [CrossRef]
  14. Innerkofler, J.; Kirchengast, G.; Schwärz, M.; Pock, C.; Jäggi, A.; Andres, Y.; Marquardt, C. Precise orbit determination for climate applications of GNSS radio occultation including uncertainty estimation. Remote Sens. 2020, 12, 1180. [Google Scholar] [CrossRef]
  15. Rocken, C.; Anthes, R.; Exner, M.; Hunt, D.; Sokolovskiy, S.; Ware, R.; Gorbunov, M.; Schreiner, W.; Feng, D.; Herman, B.; et al. Analysis and validation of GPS/MET data in the neutral atmosphere. J. Geophys. Res. Atmos. 1997, 102, 29849–29866. [Google Scholar] [CrossRef]
  16. Steiner, A.K.; Kirchengast, G.; Ladreiter, H.-P. Inversion, error analysis, and validation of GPS/MET occultaiton data. Ann. Geophys. 1999, 17, 122–138. [Google Scholar] [CrossRef]
  17. Jakowski, N.; Wehrenpfennig, A.; Heise, S.; Reigber, C.; Lühr, H.; Grunwaldt, L.; Meehan, T.K. GPS radio occultation measurements of the ionosphere from CHAMP: Early results. Geophys. Res. Lett. 2002, 29, 91–94. [Google Scholar] [CrossRef]
  18. Hajj, G.A.; Ao, C.O.; Iijima, B.A.; Kuang, D.; Kursinski, E.R.; Mannucci, A.J.; Meehan, T.K.; Romans, L.J.; Juarez, M.D.; Yunck, T.P. CHAMP and SAC-C atmospheric occultation results and intercomparisons. J. Geophys. Res. Atmos. 2004, 109, D06109. [Google Scholar] [CrossRef]
  19. Healy, S.B.; Wickert, J.; Michalak, G.; Schmidt, T.; Beyerle, G. Combined forecast impact of GRACE-A and CHAMP GPS radio occultation bending angle profiles. Atmos. Sci. Lett. 2007, 8, 43–50. [Google Scholar] [CrossRef]
  20. Luntama, J.-P.; Kirchengast, G.; Borsche, M.; Foelsche, U.; Steiner, A.K.; Healy, S.; von Engeln, A.; O’Clerigh, E.; Marquardt, C. Prospects of the EPS GRAS mission for operational atmospheric applications. Bull. Am. Meteorol. Soc. 2008, 89, 1863–1875. [Google Scholar] [CrossRef]
  21. Anthes, R.A.; Ector, D.; Hunt, D.C.; Kuo, Y.H.; Rocken, C.; Schreiner, W.S.; Sokolovskiy, S.V.; Syndergaard, S.; Wee, T.K.; Zeng, Z.; et al. The COSMIC/FORMOSAT-3 mission: Early results. Bull. Am. Meteorol. Soc. 2008, 89, 313–333. [Google Scholar] [CrossRef]
  22. Brahmanandam, P.S.; Uma, G.; Liu, J.Y.; Chu, Y.H.; Latha Devi, N.S.M.P.; Kakinami, Y. Global S4 index variations observed using FORMOSAT-3/ COSMIC GPS ro technique during a solar minimum year. J. Geophys. Res. Space Phys. 2012, 117, A09322. [Google Scholar] [CrossRef]
  23. Li, M.; Li, W.W.; Shi, C.; Jiang, K.C.; Guo, X.; Dai, X.L.; Meng, X.G.; Yang, Z.D.; Yang, G.L.; Liao, M. Precise orbit determination of the FengYun-3C satellite using onboard GPS and bds observations. J. Geod. 2017, 91, 1313–1327. [Google Scholar] [CrossRef]
  24. Yang, Y.X.; Liu, L.; Li, J.L.; Yang, Y.F.; Zhang, T.Q.; Mao, Y.; Sun, B.J.; Ren, X. Featured services and performance of BDS-3. Sci. Bull. 2021, 66, 2135–2143. [Google Scholar] [CrossRef] [PubMed]
  25. Hong, C.-K.; Bae, T.-S.; Kwon, J.H. An overview of a special issue on upcoming positioning, navigation, and timing: GPS, GLONASS, Galileo and BeiDou. Remote Sens. 2022, 14, 1982. [Google Scholar] [CrossRef]
  26. Zhang, Z.H.; Pan, L. Current performance of open position service with almost fully deployed multi-GNSS constellations: GPS, GLONASS, Galileo, BDS-2, and BDS-3. Adv. Space Res. 2022, 69, 1994–2019. [Google Scholar] [CrossRef]
  27. Bai, W.H.; Sun, Y.Q.; Xia, J.M.; Tan, G.Y.; Cheng, C.; Yang, G.L.; Du, Q.F.; Wang, X.Y.; Zhao, D.Y.; Tian, Y.S.; et al. Validation results of maximum S4 index in f-layer derived from GNOS on FY3C satellite. GPS Solut. 2018, 23, 1–14. [Google Scholar] [CrossRef]
  28. Yang, G.L.; Sun, Y.Q.; Bai, W.H.; Zhang, X.X.; Liu, C.L.; Meng, X.G.; Bi, Y.M.; Wang, D.W.; Zhao, D.Y. Validation results of NMF2 and HMF2 derived from ionospheric density profiles of GNOS on FY3C satellite. Sci. China Technol. Sci. 2018, 61, 1372–1383. [Google Scholar] [CrossRef]
  29. Bai, W.H.; Liu, C.L.; Meng, X.G.; Sun, Y.Q.; Kirchengast, G.; Du, Q.F.; Wang, X.Y.; Yang, G.L.; Liao, M.; Yang, Z.D.; et al. Evaluation of atmospheric profiles derived from single- and zero-difference excess phase processing of BeiDou radio occultation data from the FY3C GNOS mission. Atmos. Meas. Tech. 2018, 11, 819–833. [Google Scholar] [CrossRef]
  30. Sun, Y.Q.; Bai, W.H.; Liu, C.L.; Liu, Y.; Du, Q.F.; Wang, X.Y.; Yang, G.L.; Liao, M.; Yang, Z.D.; Zhang, X.X.; et al. The FengYun-3C radio occultation sounder GNOS: A review of the mission and its early results and science applications. Atmos. Meas. Tech. 2018, 11, 5797–5811. [Google Scholar] [CrossRef]
  31. Schreiner, W.S.; Weiss, J.P.; Anthes, R.A.; Braun, J.; Chu, V.; Fong, J.; Hunt, D.; Kuo, Y.H.; Meehan, T.; Serafino, W.; et al. COSMIC-2 radio occultation constellation: First results. Geophys. Res. Lett. 2020, 47, e2019GL086841. [Google Scholar] [CrossRef]
  32. Bowler, N.E. An assessment of GNSS radio occultation data produced by Spire. Q. J. R. Meteorol. Soc. 2020, 146, 3772–3788. [Google Scholar] [CrossRef]
  33. Forsythe, V.V.; Duly, T.; Hampton, D.; Nguyen, V. Validation of ionospheric electron density measurements derived from Spire cubesat constellation. Radio Sci. 2020, 55, e2019RS006953. [Google Scholar] [CrossRef]
  34. da Silva Curiel, A.; Boland, L.; Cooksley, J.; Bekhti, M.; Stephens, P.; Sun, W.; Sweeting, M. First results from the disaster monitoring constellation (DMC). Acta Astronaut. 2005, 56, 261–271. [Google Scholar] [CrossRef]
  35. Clarizia, M.P.; Gommenginger, C.P.; Gleason, S.T.; Srokosz, M.A.; Galdi, C.; Di Bisceglie, M. Analysis of GNSS-R delay-Doppler maps from the UK-DMC satellite over the ocean. Geophys. Res. Lett. 2009, 36, L02608. [Google Scholar] [CrossRef]
  36. Unwin, M.; Jales, P.; Tye, J.; Gommenginger, C.; Foti, G.; Rosello, J. Spaceborne GNSS-reflectometry on TechDemoSat-1: Early mission operations and exploitation. IEEE J. Sel. Top. Appl. Earth Obs. Remote Sens. 2016, 9, 4525–4539. [Google Scholar] [CrossRef]
  37. Li, W.Q.; Cardellach, E.; Fabra, F.; Rius, A.; Ribó, S.; Martín-Neira, M. First spaceborne phase altimetry over sea ice using TechDemoSat-1 GNSS-R signals. Geophys. Res. Lett. 2017, 44, 8369–8376. [Google Scholar] [CrossRef]
  38. Ruf, C.; Gleason, S.; Jelenak, Z.; Katzberg, S.; Ridley, A.; Rose, R.; Scherrer, J.; Zavorotny, V. The NASA EV-2 cyclone global navigation satellite system (CYGNSS) mission. In Proceedings of the IEEE Conference on Aerospace, Big Sky, MT, USA, 2–9 March 2013; pp. 1–7. [Google Scholar]
  39. Clarizia, M.P.; Pierdicca, N.; Costantini, F.; Floury, N. Analysis of CYGNSS data for soil moisture retrieval. IEEE J. Sel. Top. Appl. Earth Obs. Remote Sens. 2019, 12, 2227–2235. [Google Scholar] [CrossRef]
  40. Sun, Y.Q.; Liu, C.L.; Du, Q.F.; Wang, X.Y.; Bai, W.H.; Kirchengast, G.; Xia, J.M.; Meng, X.G.; Wang, D.W.; Cai, Y.R.; et al. Global navigation satellite system occultation sounder II (GNOS II). In Proceedings of the 2017 IGARSS International Geoscience and Remote Sensing Symposium, Fort Worth, TX, USA, 23–28 July 2017; pp. 1189–1192. [Google Scholar]
  41. Du, Q.F.; Sun, Y.Q.; Bai, W.H.; Wang, X.Y.; Wang, D.W.; Meng, X.G.; Cai, Y.R.; Xia, J.M.; Wu, C.J.; Liu, C.L.; et al. The advancements in research of FY-3 GNOS II and instrument performance. In Proceedings of the 2018 IGARSS International Geoscience and Remote Sensing Symposium, Valencia, Spain, 22–27 July 2018; pp. 3347–3350. [Google Scholar]
  42. Wang, X.Y.; Tian, Y.S.; Sun, Y.Q.; Wang, D.W.; Wu, C.J.; Du, Q.F.; Cai, Y.R.; Bai, W.H.; Xia, J.M.; Li, W.; et al. Software design of GNOS II’s GNSS-R module. In Proceedings of the 2018 IGARSS International Geoscience and Remote Sensing Symposium, Valencia, Spain, 22–27 July 2018; pp. 1075–1077. [Google Scholar]
  43. Sun, Y.Q.; Wang, X.Y.; Du, Q.F.; Bai, W.H.; Xia, J.M.; Cai, Y.R.; Wang, D.W.; Wu, C.J.; Meng, X.G.; Liu, C.L.; et al. The status and progress of FengYun-3E GNOS II mission for GNSS remote sensing. In Proceedings of the 2018 IGARSS International Geoscience and Remote Sensing Symposium, Valencia, Spain, 22–27 July 2018; pp. 5181–5184. [Google Scholar]
  44. Yang, G.L.; Bai, W.H.; Wang, J.S.; Hu, X.Q.; Zhang, P.; Sun, Y.Q.; Xu, N.; Zhai, X.C.; Xiao, X.J.; Xia, J.M.; et al. FY3E GNOS II GNSS reflectometry: Mission review and first results. Remote Sens. 2022, 14, 988. [Google Scholar] [CrossRef]
  45. Liao, M.; Zhang, P.; Yang, G.L.; Bi, Y.M.; Liu, Y.; Bai, W.H.; Meng, X.G.; Du, Q.F.; Sun, Y.Q. Preliminary validation of the refractivity from the new radio occultation sounder GNOS/FY-3C. Atmos. Meas. Tech. 2016, 9, 781–792. [Google Scholar] [CrossRef]
  46. Hou, X.Y.; Han, Y.; Hu, X.Q.; Weng, F.Z. Verification of FengYun-3D MWTS and MWHS calibration accuracy using GPS radio occultation data. J. Meteorol. Res. 2019, 33, 695–704. [Google Scholar] [CrossRef]
  47. Bai, W.H.; Sun, Y.Q.; Du, Q.F.; Yang, G.L.; Yang, Z.D.; Zhang, P.; Bi, Y.M.; Wang, X.Y.; Cheng, C.; Han, Y. An introduction to the FY3 GNOS instrument and mountain-top tests. Atmos. Meas. Tech. 2014, 7, 1817–1823. [Google Scholar] [CrossRef]
  48. Mao, T.; Sun, L.F.; Yang, G.L.; Yue, X.A.; Yu, T.; Huang, C.; Zeng, Z.C.; Wang, Y.G.; Wang, J.S. First ionospheric radio-occultation measurements from GNSS occultation sounder on the chinese Feng-Yun 3C satellite. IEEE Trans. Geosci. Remote Sens. 2016, 54, 5044–5053. [Google Scholar] [CrossRef]
  49. Cai, Y.R.; Bai, W.H.; Wang, X.Y.; Sun, Y.Q.; Du, Q.F.; Zhao, D.Y.; Meng, X.G.; Liu, C.L.; Xia, J.M.; Wang, D.W.; et al. In-orbit performance of GNOS on-board FY3-C and the enhancements for FY3-D satellite. Adv. Space Res. 2017, 60, 2812–2821. [Google Scholar] [CrossRef]
  50. Wang, D.W.; Tian, Y.S.; Sun, Y.Q.; Du, Q.F.; Wang, X.Y.; Bai, W.H.; Cai, Y.R.; Wu, C.J.; Liu, C.; Xia, J.M.; et al. Preliminary in-orbit evaluation of GNOS on FY3D satellite. In Proceedings of the 2018 IGARSS International Geoscience and Remote Sensing Symposium, Valencia, Spain, 22–27 July 2018; pp. 9161–9163. [Google Scholar]
  51. Wang, S.Z.; Zhu, G.W.; Bai, W.H.; Liu, C.L. For the first time FengYun3 C satellite-global navigation satellite system occultation sounder achieved spaceborne bei dou system radio occultation. Physics 2015, 64, 408–415. [Google Scholar]
  52. Du, Q.F.; Sun, Y.Q.; Bai, W.H.; Wang, X.Y.; Wang, D.W.; Meng, X.G.; Cai, Y.R.; Xia, J.M.; Wu, C.J.; Liu, C.L.; et al. The on-orbit performance of FY-3D GNOS. In Proceedings of the 2018 IGARSS International Geoscience and Remote Sensing Symposium, Valencia, Spain, 22–27 July 2018; pp. 7669–7671. [Google Scholar]
  53. Liu, C.L.; Kirchengast, G.; Sun, Y.Q.; Proschek, V.; Wang, X.; Tian, L.F.; Du, Q.F.; Bai, W.H.; Wu, C.J.; Hu, P.; et al. Impacts of orbital and constellation parameters on the number and spatiotemporal coverage of LEO-LEO occultation events. Remote Sens. 2021, 13, 4849. [Google Scholar] [CrossRef]
  54. Brodzik, M.J.; Billingsley, B.; Haran, T.; Raup, B.; Savoie, M.H. Ease-grid 2.0: Incremental but significant improvements for Earth-gridded data sets. ISPRS Int. J. Geo-Inf. 2012, 1, 32–45. [Google Scholar] [CrossRef]
Figure 1. FY-3E GNOS II instrument structure, including navigation, occultation, and reflection modules.
Remotesensing 15 05011 g001
Figure 2. Global distribution of FY-3E GNOS II BDS (a), FY-3E GNOS II GPS (b), FY-3D GNOS BDS (c), and FY-3D GNOS GPS (d) RO events from 1 September 2022 to 28 February 2023. The dots represent the RO event locations and the color of the dots indicates the lowest penetration height toward surface observed during each event.
Remotesensing 15 05011 g002
Figure 3. Histogram of the daily number of FY-3E GNOS II (a) and FY-3D GNOS (b) RO events from 1 September 2022 to 28 February 2023, in which the blue bars represent the number of GPS RO events and the red bars represent the number of BDS RO events.
Remotesensing 15 05011 g003
Figure 4. Global coverage of the RO events for FY-3E GNOS II GPS (a–c), FY-3E GNOS II BDS (d–f), and FY-3D GNOS GPS (g–i) in 10 days (left), 20 days (middle), and 30 days (right), illustrating the RO event numbers per 5° × 5° latitude x longitude grid cell (color bar) within these times. The GCFs were computed using grid cell areas according to the description in Section 3.2.1.
Remotesensing 15 05011 g004
Figure 5. Global distribution of the RO events for FY-3E GNOS II BDS (a) and FY-3D GNOS BDS (b) from 1 September 2022 to 28 February 2023, illustrating the RO event locations for the different GNSS transmitter subsystems in GEO (red), IGSO (blue), and MEO (green), respectively.
Remotesensing 15 05011 g005
Figure 6. The accumulated time dependence of RO event numbers (a) and GCFs (b) for the FY-3E GNOS II GPS, FY-3E GNOS II BDS, FY-3E GNOS II GPS + BDS, and FY-3D GNOS GPS, FY-3D GNOS BDS, FY-3D GNOS GPS + BDS (see legend for colors and line styles) during the two months from 1 September 2022 (day 1) to 31 October 2022 (day 61).
Remotesensing 15 05011 g006
Figure 7. Statistical comparison between RO refractivity profiles retrieved from FY-3E GNOS II (a) and FY-3D GNOS (b) data, respectively, taking co-located NCEP FNL analysis data as reference dataset. The ensemble of data span from 1 September 2022 to 28 February 2023 and the statistics include the mean difference (“bias”; blue-solid GPS RO, red-solid BDS RO) and the standard deviation (“std”; blue-dotted GPS RO, red-dotted BDS RO), respectively, also showing alongside the corresponding occultation event numbers (“occNum”) as a function of height.
Remotesensing 15 05011 g007
Figure 8. Refractivity layer mean retrieval performance (20–30 km layer (a); 10–20 km layer (b)) for the FY-3D GNOS BDS (green), FY-3D GNOS GPS (orange), FY-3E GNOS II BDS (red), and FY-3E GNOS II GPS RO (blue)) events along the 6 months of data (left to right). Each individual “error bar” depicts the mean difference (center dot of bar) and the standard deviation range around it (lower- and upper-end dots of bar).
Remotesensing 15 05011 g008
Figure 9. Refractivity 6-month-mean layer mean retrieval performance (20–30 km layer (a); 10–20 km layer (b)) for the FY-3D GNOS BDS (green), FY-3D GNOS GPS (orange), FY-3E GNOS II BDS (red), and FY-3E GNOS II GPS RO (blue) events in six different latitude bands (southern polar to northern polar; left to right). Each individual “error bar” depicts the mean difference (center dot of bar) and the standard deviation range around it (lower- and upper-end dots of bar).
Remotesensing 15 05011 g009
Table 1. Main parameters of FY-3C/-3D/-3E GNOS (II) instruments, for the navigation and occultation modules.
FY-3C GNOSFY-3D GNOSFY-3E GNOS II
FrequenciesGPS: L1, L2C, L2P
BDS-2: B1, B2
GPS: L1, L2C, L2P
BDS-2: B1, B2
GPS: L1, L2C, L2P
BDS-2/-3: B1, B3
Navigation channelsGPS: 8
BDS-2: 4
GPS: 9
BDS-2: 6
GPS: 12
BDS-2/-3: 12
Occultation channelsGPS: 6
BDS-2: 4
GPS: 8
BDS-2: 6
GPS: 14
BDS-2/-3: 8
POD antennaPatch antennaPatch antennaChoke-ring antenna
Atmosphere antenna4-element patch antenna
7.0 dBi@45° azimuth
5-element patch antenna
8.5 dBi@45° azimuth
9-element patch antenna
10 dBi@45° azimuth
Sampling rateNavigation data and ionosphere occultation: 1 Hz
Atmosphere occultation: 50 Hz @close loop, 100 Hz @open loop
ObservablesPseudo-range, carrier phase, amplitude (SNR)
Table 2. Summary of FY-3D GNOS and FY-3E GNOS II BDS occultation satellite PRN numbers per transmitter subsystem.
FY-3D GNOS BDSFY-3E GNOS II BDS
MEOC11, C12, C14C11, C12, C14, C16, C19, C20, C21, C22, C23, C24, C25, C26, C27, C28, C29, C30, C32, C33, C34, C35, C36, C37, C41, C42, C43, C44, C45, C46
IGSOC06, C07, C08, C09, C10, C13C06, C07, C08, C09, C10, C13, C38, C39, C40
GEOC01, C02, C03, C04, C05/
Disclaimer/Publisher’s Note: The statements, opinions and data contained in all publications are solely those of the individual author(s) and contributor(s) and not of MDPI and/or the editor(s). MDPI and/or the editor(s) disclaim responsibility for any injury to people or property resulting from any ideas, methods, instructions or products referred to in the content.

