1. Introduction
The Global Navigation Satellite System (GNSS) radio occultation (RO) has been validated as a very effective technique for meteorology and weather forecasting. On the RO retrieval, atmospheric properties can be reflected through the bending and delaying effects of occulted signals due to the atmospheric refraction [
1,
2,
3]. The initial observations, i.e., phase and amplitude of the GNSS signals traversing through the Earth’s atmosphere, are first converted into the bending angle as a function of impact parameter by different inversion methods [
4,
5,
6,
7,
8]. And subsequently, the refractivity, temperature, pressure, and water vapor profiles can be retrieved [
9].
Sounding Earth’s atmosphere utilizing the GNSS RO technique was first demonstrated by the Global Positioning System/Meteorology (GPS/MET) experiment in 1995 [
1,
10]. Since then, various satellites for RO sounding were launched including the Challenging Minisatellite Payload (CHAMP) [
11,
12], the Satellite de Aplicaciones Cientificas-C (SAC-C) [
13], the Gravity Recovery and Climate Experiment (GRACE) [
14], the Constellation Observing System for Meteorology, Ionosphere, and Climate (COSMIC) [
15,
16], the Meteorological Operations Platform (METOP) [
17,
18], and the COSMIC-2, which could track both GPS and Global Navigation Satellite System (GLONASS) RO signals [
19]. Among the Chinese FengYun-3 (FY-3) series of meteorological satellites, FengYun-3C (FY-3C) launched on 23 September 2013, is a polar-orbiting satellite carrying the first Chinese BeiDou Navigation Satellite System (BDS)/GPS compatible RO sounder named GNSS Occultation Sounder (GNOS) [
20,
21]. Two following FY-3 series satellites, FY-3D and FY-3E, also carried the GNOS instrument, while FY-3E was equipped with the latest upgraded GNOS-II payload with open access to both BDS and GPS RO products.
Validations and assessments of the accuracy about early RO missions have been covered extensively in previous research. Kursinski et al. (1996) [
1] compared the RO data with radiosonde observations and reanalysis data from the European Centre for Medium-Range Weather Forecasts (ECMWF), which verified the great potential application value of the RO technique in the field of numerical weather prediction (NWP). Schreiner et al. (2007) [
15] investigated the root mean square (RMS) difference of the refractivity derived from COSMIC, finding that the maximal RMS was about 0.8% in the lower troposphere and the difference was less than 0.2% on altitudes between 10 to 20 km. Schreiner et al. (2020) [
19] showed the retrievals from both GPS and GLONASS of the COSMIC-2 constellation provided unprecedented quality information on temperature and water vapor in the tropics. It is noted the COSMIC-2 is the first constellation with open access to RO data from two different GNSS systems. For the FY-3 series RO missions, Bai et al. (2018) [
22] evaluated the bending angle and refractivity profiles and validated the accuracy and precision of the BDS RO profiles from FY-3C. Furthermore, Shi et al. (2022) [
23] evaluated FY-3D RO wet profiles with radiosonde measurements, showing the FY-3D had reached a higher precision in temperature and a comparable quality in specific humidity against FY-3C.
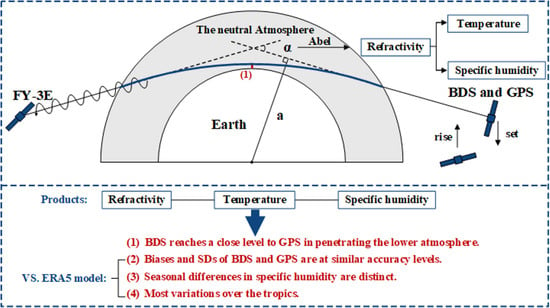
This research focused on assessing the neutral atmospheric profiles, including refractivity, temperature, and specific humidity originating from FY-3E BDS and GPS RO products with the data of co-located ECMWF reanalysis v5 (ERA5).
After this
Section 1, the neutral atmospheric profiles from FY-3E RO and the comparative ERA5 are introduced in
Section 2. The method of assessment and the quality control of the data are presented in
Section 3, along with the analysis of signal tracking model of BDS RO. In
Section 4, performances of FY-3E BDS and GPS occultations are assessed in four aspects: penetration depth, the comparative analysis of RO profiles with ERA5, seasonal differences, and latitudinal characteristics. The discussion of results is given in
Section 5 and the final
Section 6 is the conclusions.
2. Materials
2.1. Neutral Atmospheric Profiles from FY-3E/GNOS-II
FY-3E, launched on 5 July 2021, is the world’s first civilian early-morning orbiting meteorological satellite and also the fifth satellite in the second generation of the Chinese polar-orbiting meteorological satellites [
24]. Based on ensuring global imaging and atmospheric vertical sounding, FY-3E focuses on the application of NWP, with unique advantages in climate monitoring, space weather observation, and meteorological disaster warning. Collaborating with FY-3C and FY-3D satellites, the three LEO satellites have the capability of providing global data coverage every 6 h for NWP, which would play a crucial role in perfecting the global earth observing system [
25].
The improved version based on the first generation GNOS payload, GNOS-II, mounted on FY-3E, uses the 10-element array antenna for tracking wider coverage GNSS RO signals, and the RO module can receive dual-frequency signals of BDS and GPS. Further information about the GNOS-II structure and performance was introduced by Sun et al. (2017) [
26]. The implementation of FY-3E RO mission is a milestone for the operationalization of the BDS RO sounding.
Products of FY-3E/GNOS-II RO are released on the National Satellite Meteorological Centre (NSMC,
http://www.nsmc.org.cn, accessed on 17 February 2023). Refractivity profiles are provided in the dry atmospheric profile (ATP), along with the bending angle, mean sea level (MSL) altitude, and other parameters. The specific humidity and temperature, including contributions of moisture, are contained in the wet atmospheric profile (WAP) products. A one-dimensional variational process was used for retrieving the temperature and specific humidity in moist air condition, with the initial information provided from the Global/Regional Assimilation and Prediction Enhanced System [
27]. Over 12 months of the FY-3E/GNOS-II RO products from 1 September 2022 to 31 August 2023 were evaluated in this study.
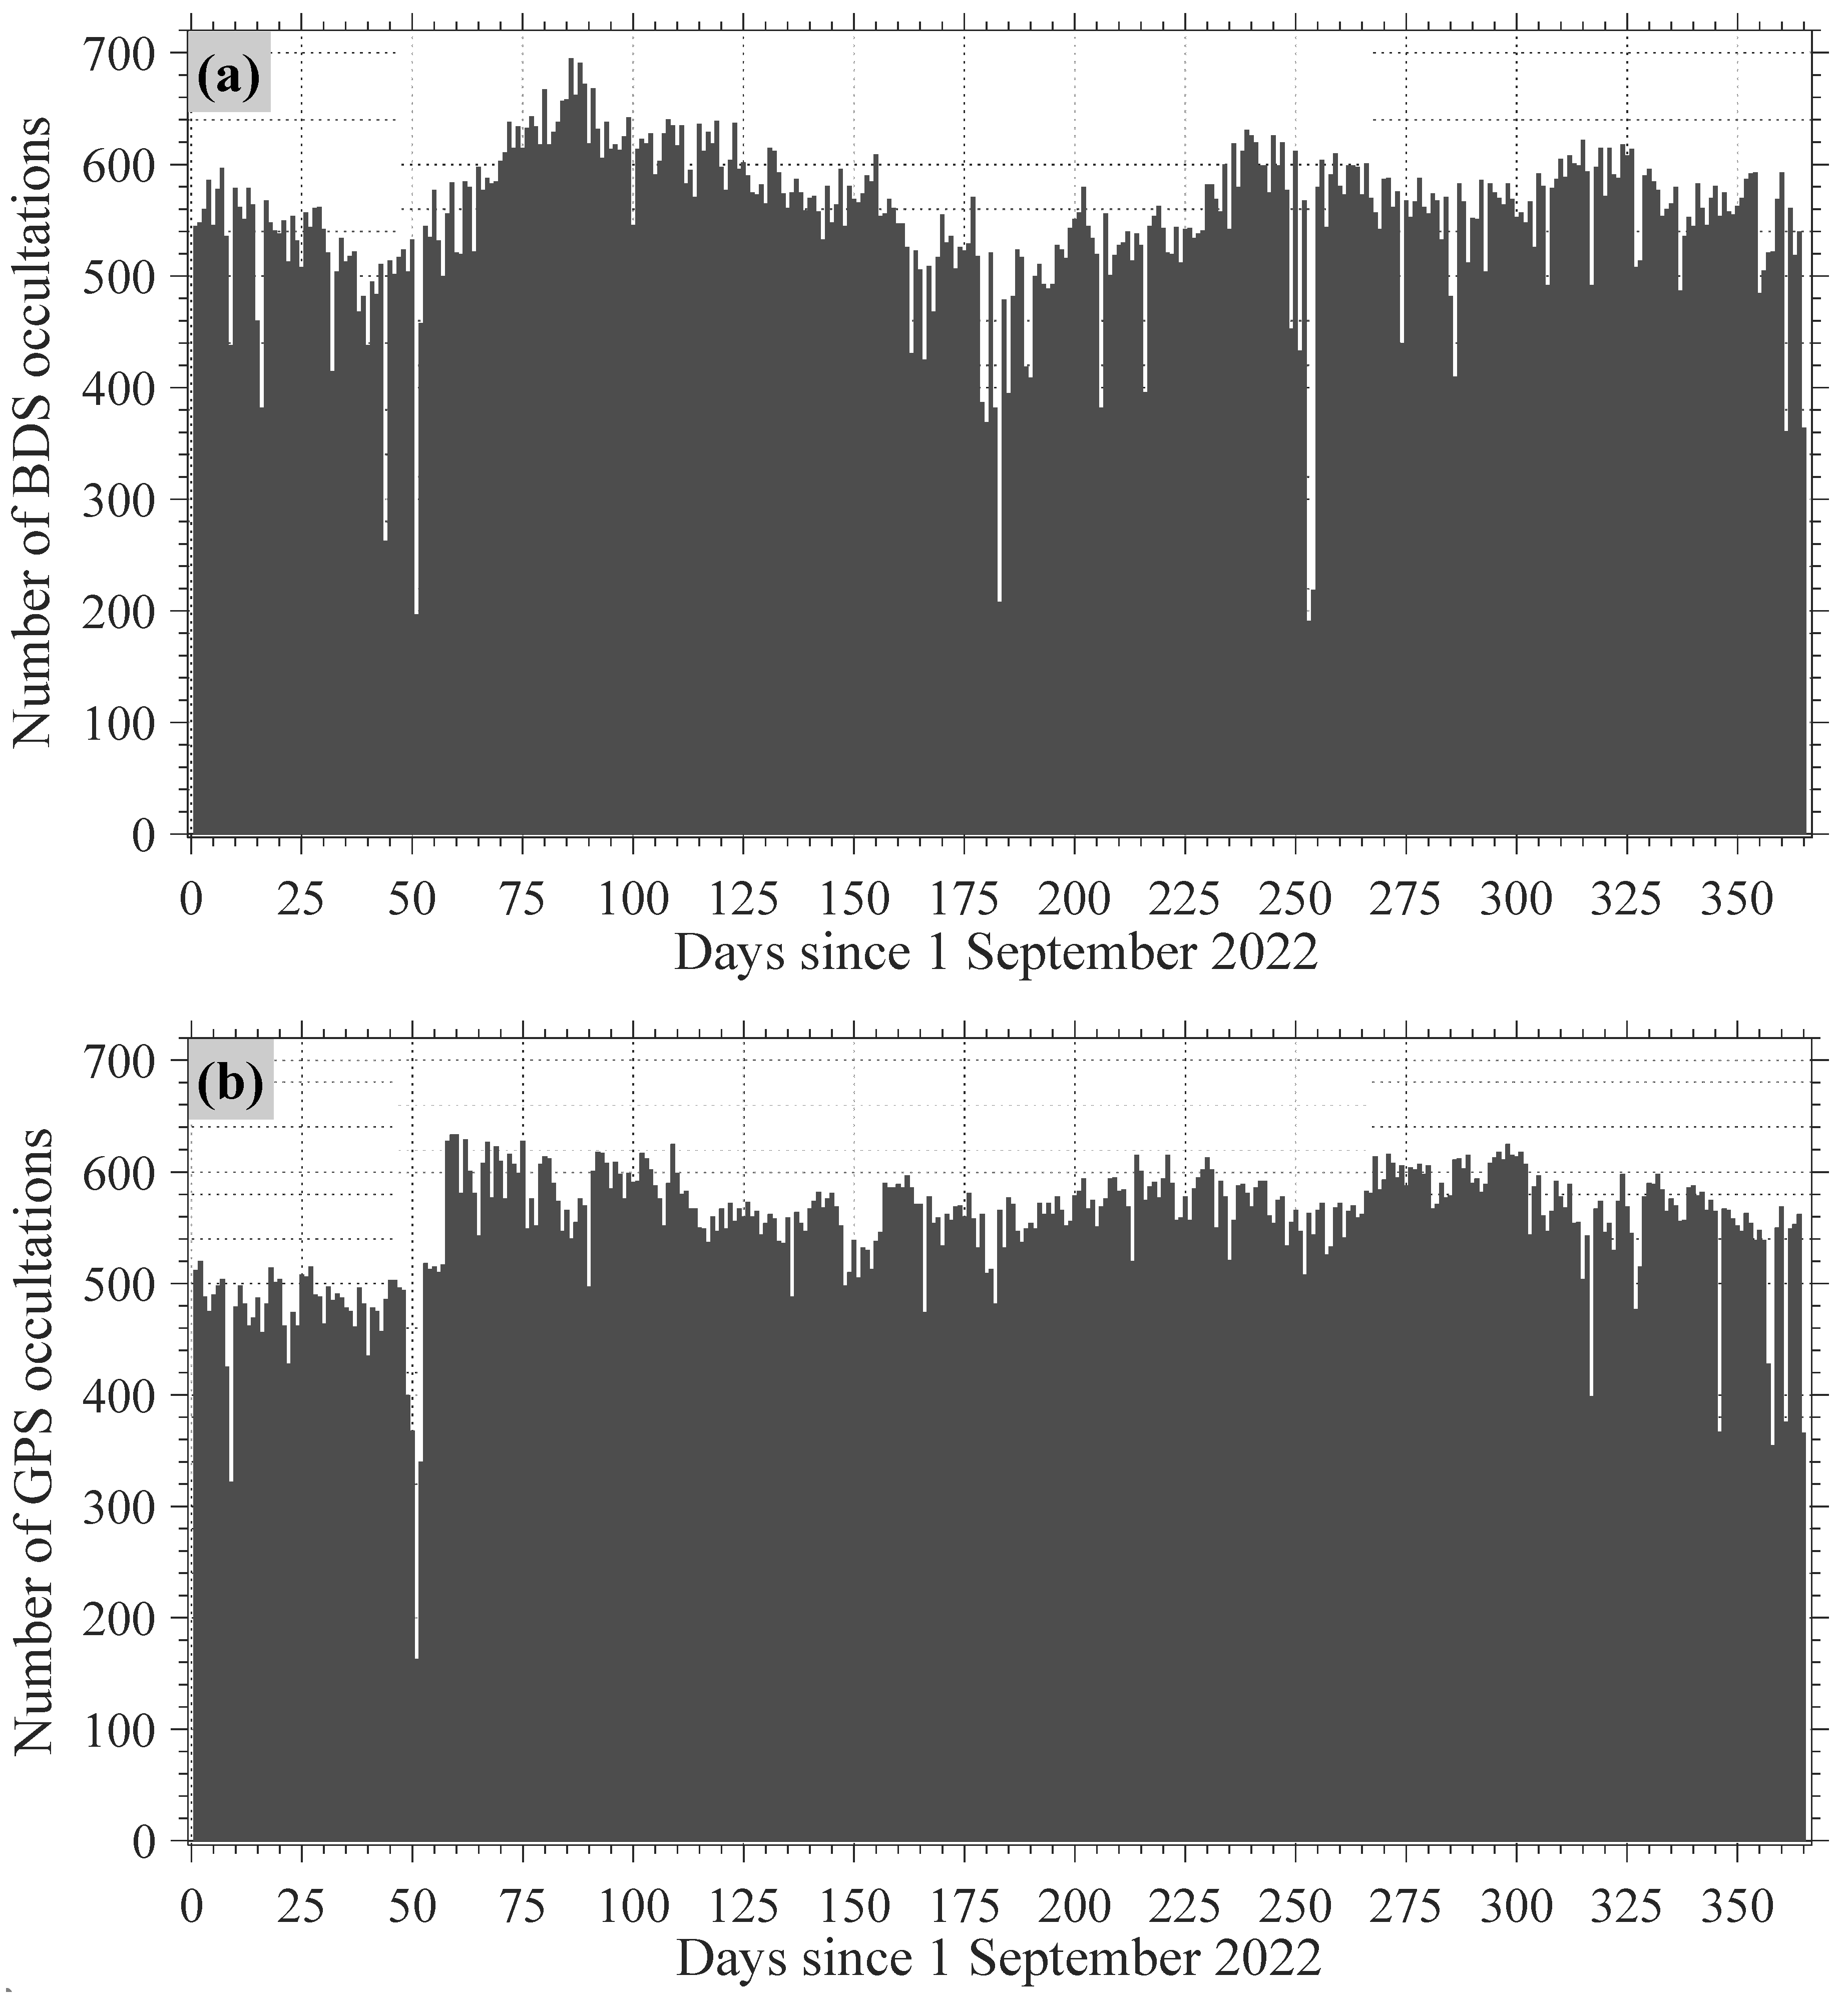
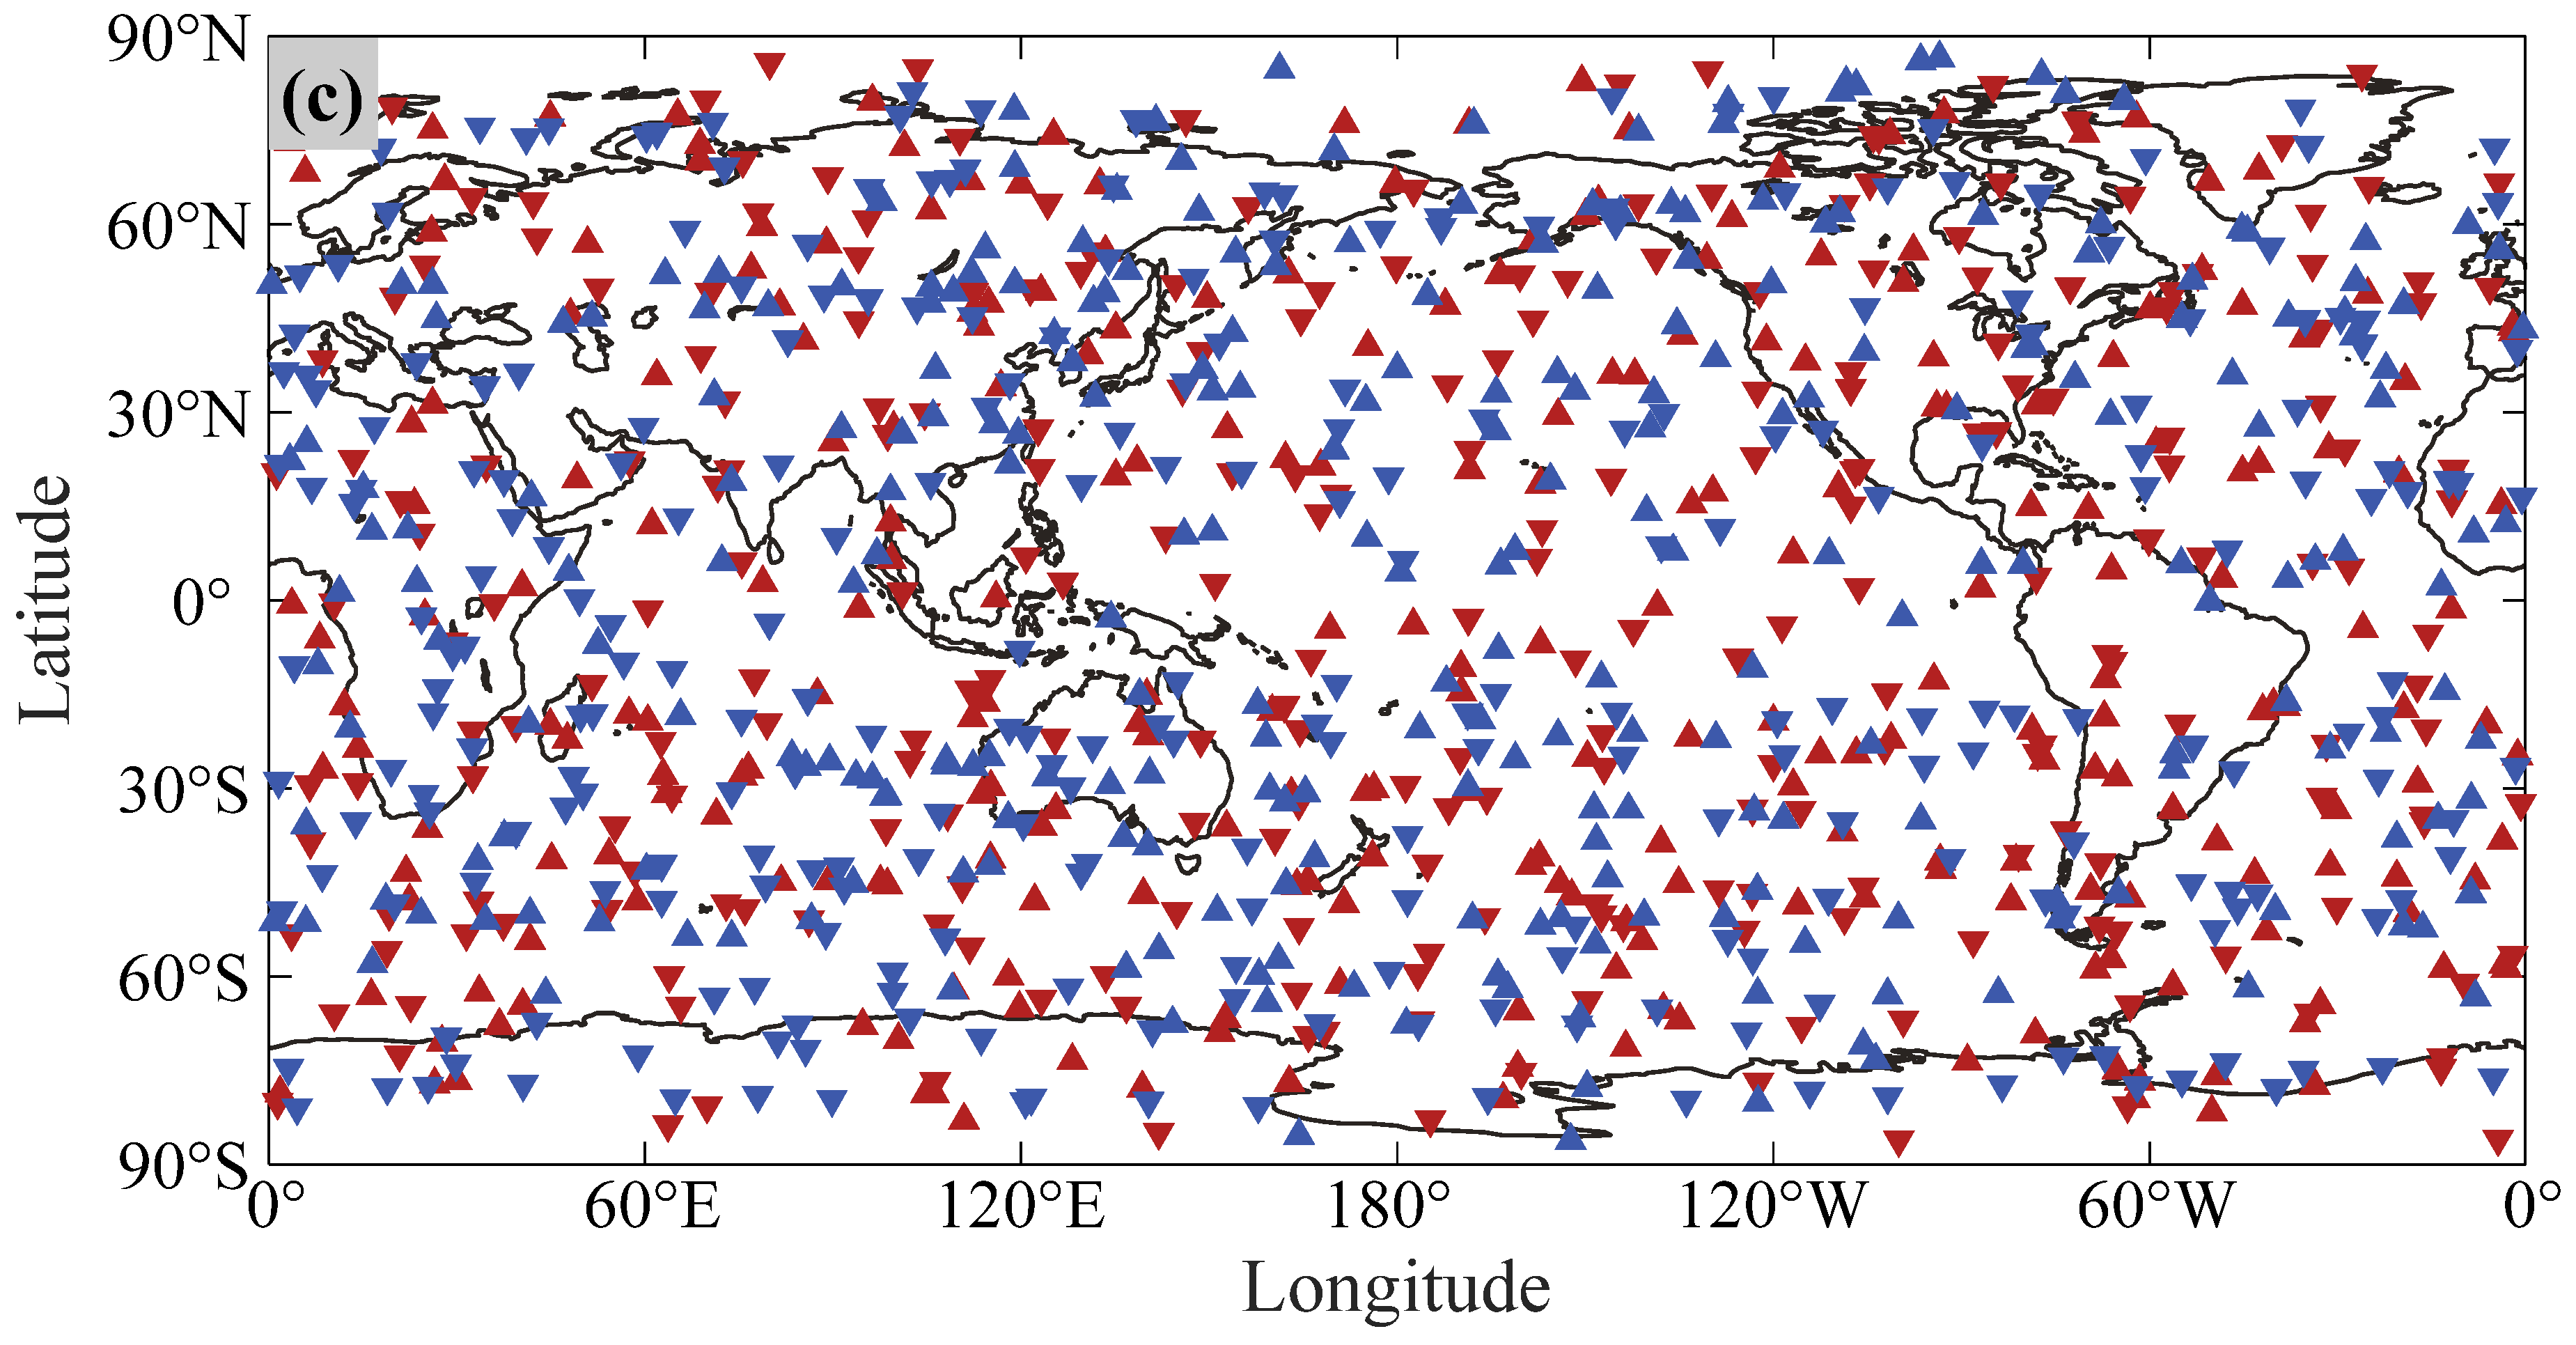
Figure 1a,b show the daily number variation of BDS and GPS occultation events, respectively. The BDS and GPS RO tracking can daily provide an average of over 1100 occultation events. And, the
Figure 1c shows the full-day BDS and GPS RO events received on 1 September 2022, which are evenly distributed across the globe.
2.2. Reference Profiles from ERA5 Model
ERA5 data, as the reference for evaluation, are produced from four-dimensional variational data assimilation and model forecasts of the ECMWF integrated forecast system, covering datasets from 1940 to the present. This global reanalysis on pressure levels used in this paper has the spatial resolution with 37 standard pressure levels from 1000 to 1 hPa vertically and 0.25° × 0.25° latitude-longitude grid resolution horizontally, supporting climate and weather analysis products worldwide on an hourly basis (
https://cds.climate.copernicus.eu, accessed on 22 February 2023).
The ERA5 data were interpolated into each RO sounding location, with the vertical intervals of 0.1 km on the MSL altitude and temporal match within 1 h. The inverse distance weighting method is used for interpolation on the horizontal scale of the ERA5, and the cubic spline interpolation method is used for interpolation on the vertical scale.
The refractivity profiles derived from the ERA5 were calculated by the Smith-Weintraub formula Equation (1) [
2,
28], in the neutral atmosphere, where the free electrons and liquid water droplets terms were ignored.
where
is the atmospheric pressure;
represents the pressure of water vapor;
is the temperature; and
is refractivity which involves the contribution with dry air and water vapor individually.
The specific humidity was obtained in accordance with the connection Equation (2) between pressure and water vapor calculated in advance through relative humidity and temperature.
where the specific humidity
can be calculated through that equation.
3. Methods
3.1. Evaluation Method
Statistical comparison between GNOS-II RO soundings and the co-located ERA5 profiles was used for assessing the performance of FY-3E occultations. The relative deviation as Equation (3) in terms of percentage was taken to evaluate the accuracy of refractivity profiles, and the absolute deviation as Equation (4) was used for temperature and specific humidity accuracy evaluation.
where
is the refractivity retrieved from RO observations and
is the refractivity collocated from the ERA5;
is the relative deviation of refractivity;
represents a variable of either temperature or specific humidity, and
and
represent the RO and ERA5 variable, respectively;
is the absolute deviation.
For a given altitude, mean deviations of refractivity, temperature, and specific humidity were calculated from the profiles after the quality control. Noticeably, the mean deviation mentioned is represented by bias hereafter, which is the average of all samples at each altitude. And, a standard deviation (SD) was calculated on the basis of the deviations and bias.
3.2. Quality Control
Quality control processing was employed to remove the unreliable profiles that deviated significantly from the ERA5. The screening conditions were based on the fractional difference of refractivity and the absolute deviation of temperature and specific humidity. For refractivity quality control, the refractivity profiles with negative values were firstly rejected [
29]; then profiles with the absolute differences over 100% were also rejected [
30]; the last screening condition was the absolute differences of refractivity more than 15% between 5 and 35 km. And for temperature quality control, the profiles with absolute deviations of more than 60 K over the whole altitude and larger than 10 K below 30 km were rejected [
13]. Lastly, occultations with the absolute deviations in specific humidity exceeding 3 g/kg and accounting for more than 5% on the whole altitude were also rejected.
The overall proportions of excluded occultation events from BDS and GPS were 15.7% and 15.0%, respectively, remaining over 341,700 occultation events in total.
3.3. Open-Loop Tracking Model for BDS RO
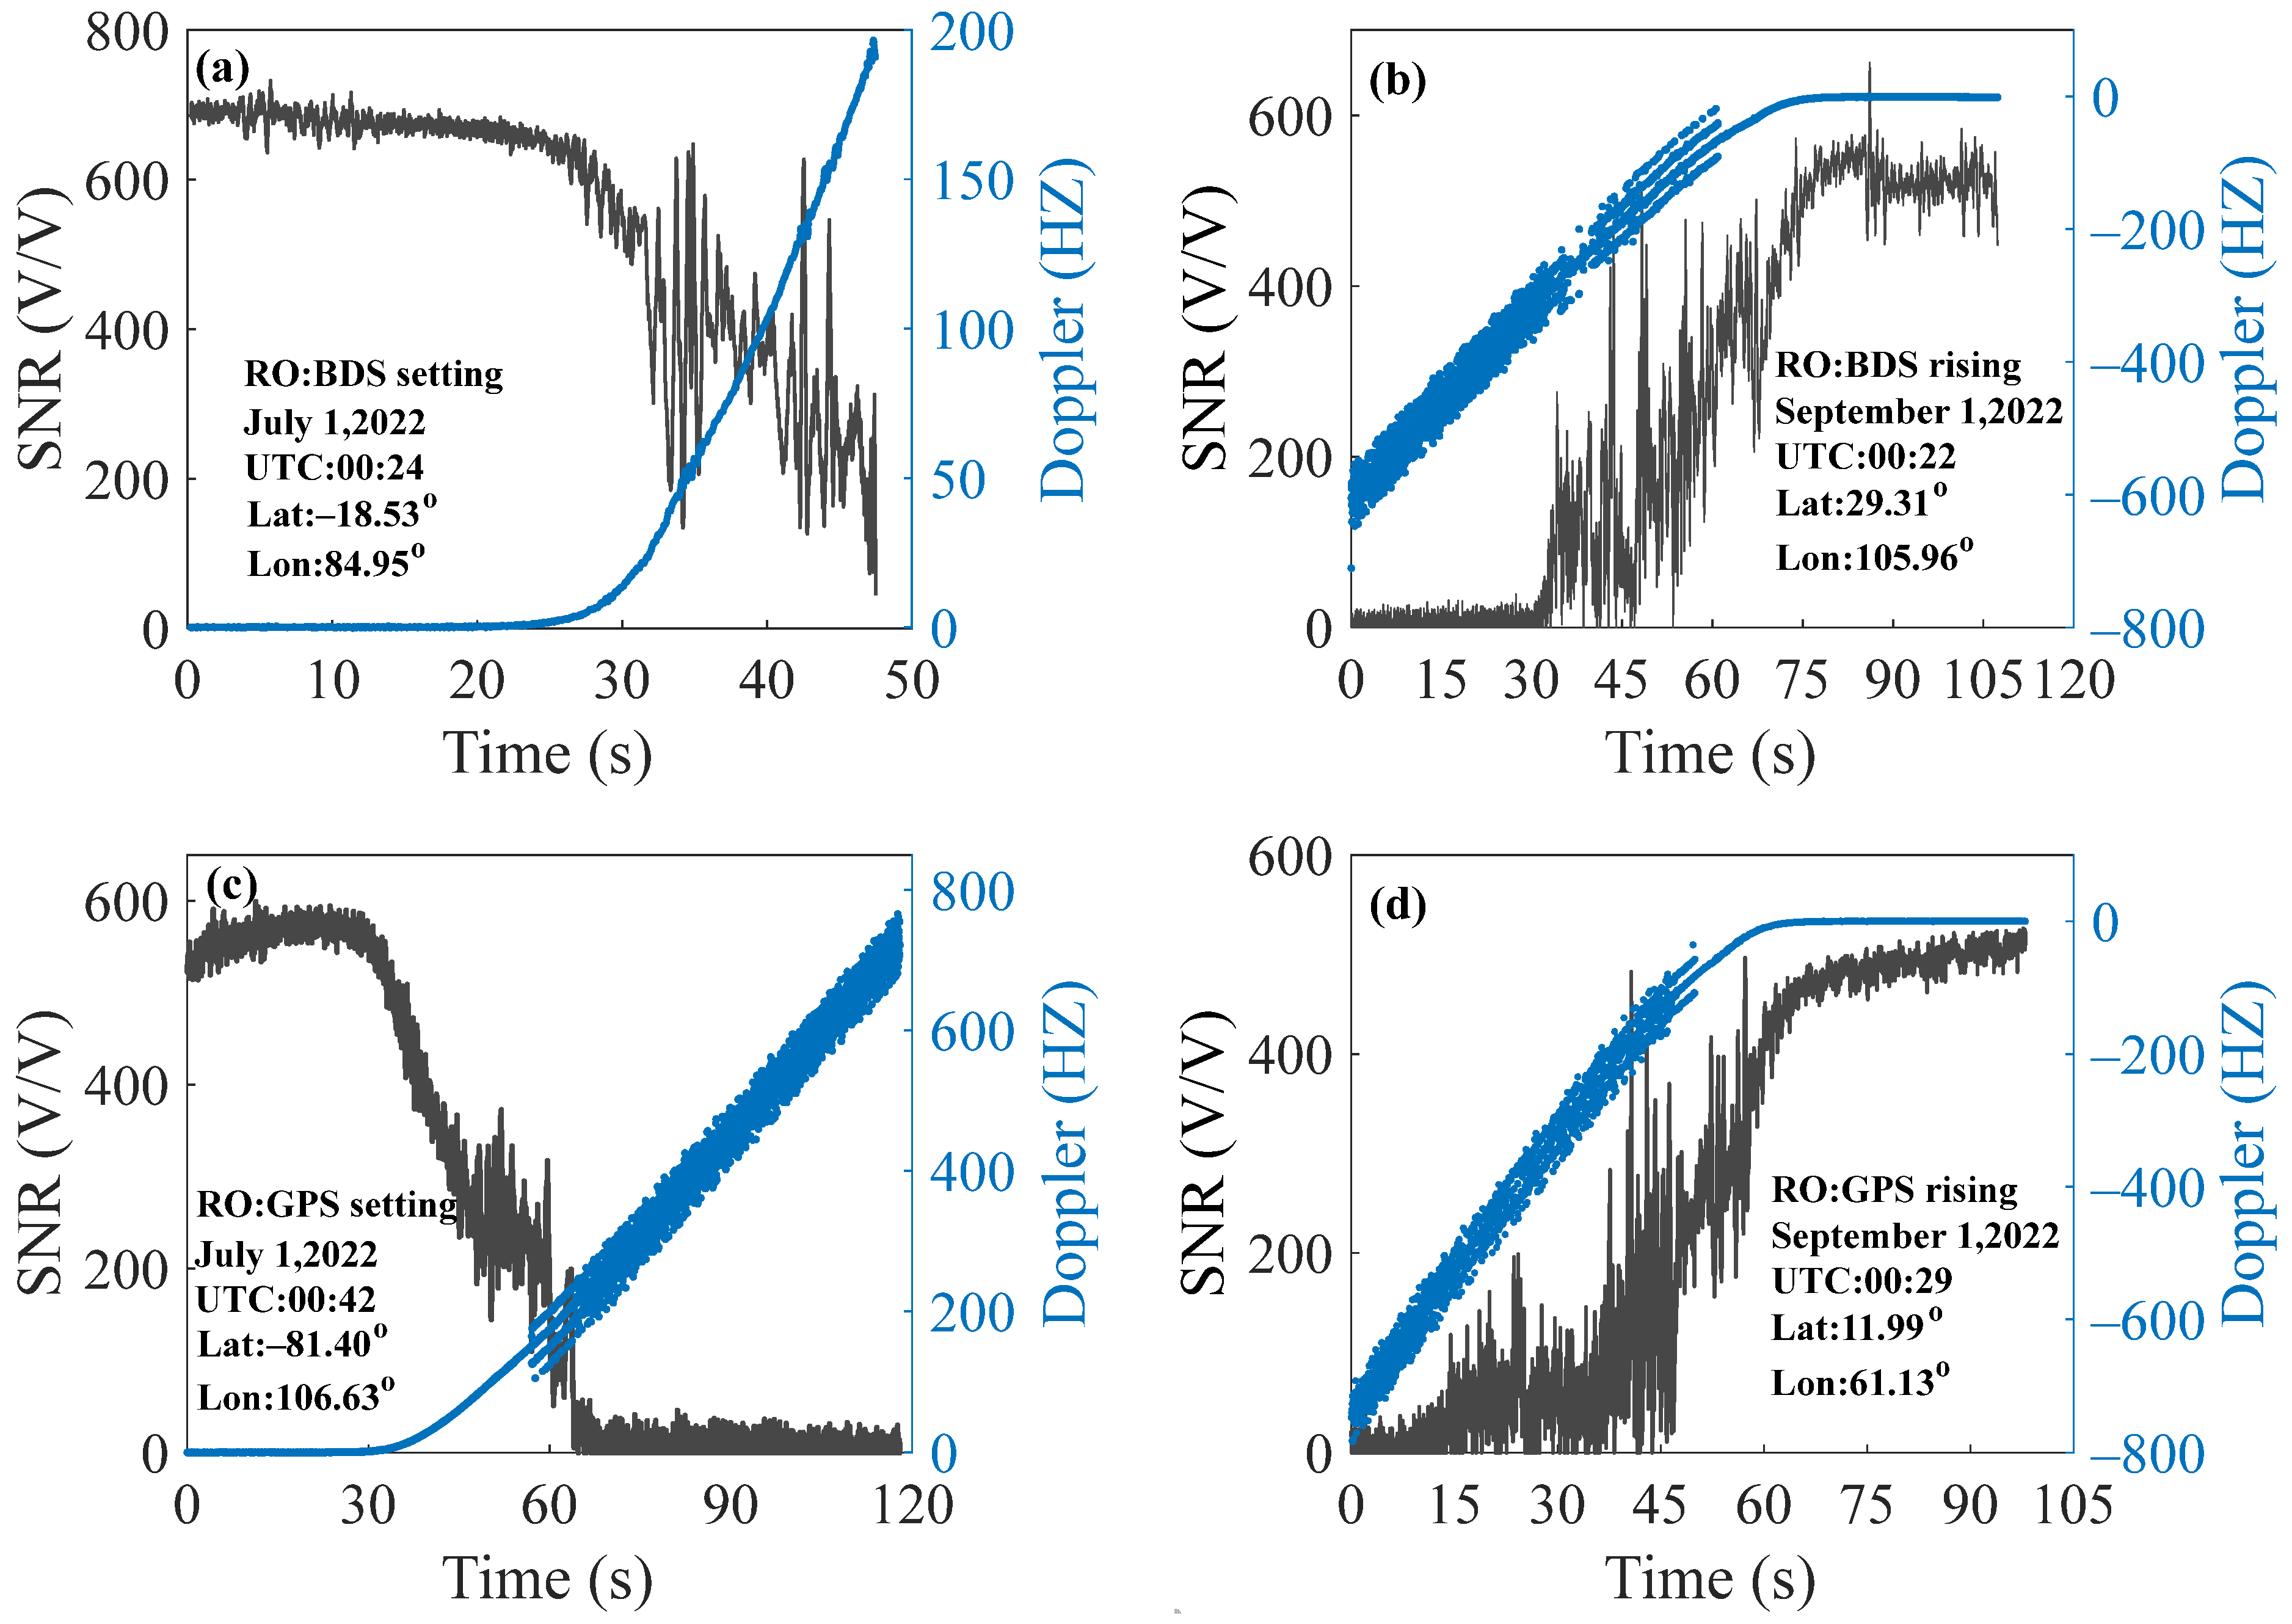
As the implementation of the open-loop (OL) tracking model could significantly improve the RO lower-tropospheric sounding capability, FY-3E/GNOS-II RO took the OL tracking on the BDS B1 signals [
31,
32]. To substantiate the BDS OL tracking has entered operational stream, the signal-to-noise ratio (SNR) and Doppler shift from two typical BDS occultations, one setting occultation event in July and one rising occultation event in September, were compared as in
Figure 2a,b. As a clear contrast, two corresponding GPS occultation events for the same period were also demonstrated in
Figure 2c,d.
The setting BDS occultation event in
Figure 2a lasted 47 s, and terminated with the SNR decreased to about 100 V/V. The Doppler shift did not show an abrupt shift due to the loss of lock on the signal as illustrated by Ao et al. [
33], nor the transition to the OL tracking as mentioned by Xu et al. [
34]. The rising BDS occultation event in
Figure 2b lasted 107 s, with the SNR fluctuating in the range of 0–20
v/
v and gradually increasing. On the first 60 s, there were frequent half-cycle and cycle clips in the Doppler shift, which is the typical feature of OL tracking model [
35]. For comparison, the transition from closed-loop (CL) to OL tracking was clearly presented in the setting GPS occultation event in
Figure 2c, and the rising GPS occultation event in
Figure 2d showed almost the same characteristics as its counterpart in
Figure 2b.
On radio occultation tracking, setting occultations normally have longer durations and lower SNR when the signal neared the Earth’s surface, which means lower penetration depth, than rising occultations. However, the setting occultation performed worse than the rising occultation in the comparison between
Figure 2a,b. Hence, we speculated that the BDS OL tracking algorithm had been optimized during July to September. To further verify this,
Table 1 and
Table 2 show the statistics of BDS and GPS occultation events over five penetration depth ranges from July to December 2022.
As in
Table 1, the fraction of BDS occultations penetrating below 4 km in July was much smaller than in following months. We found most of the BDS occultations in July showed similar characteristics as in
Figure 2a, where early termination of sounding happened and contributed to the signal not reaching near the surface [
36]. From July to September, there was an optimization of the OL data processing [
32], which was completed around mid-August 2022 as implied in
Table 1. A significant fraction of BDS occultations, more than 88% penetrating below 4 km, started from September, representing the stability of the OL data processing. It is noted the GPS soundings in
Table 2 kept high values from the beginning for the maturity of GPS OL tracking model.
4. Results
4.1. Penetration Depth
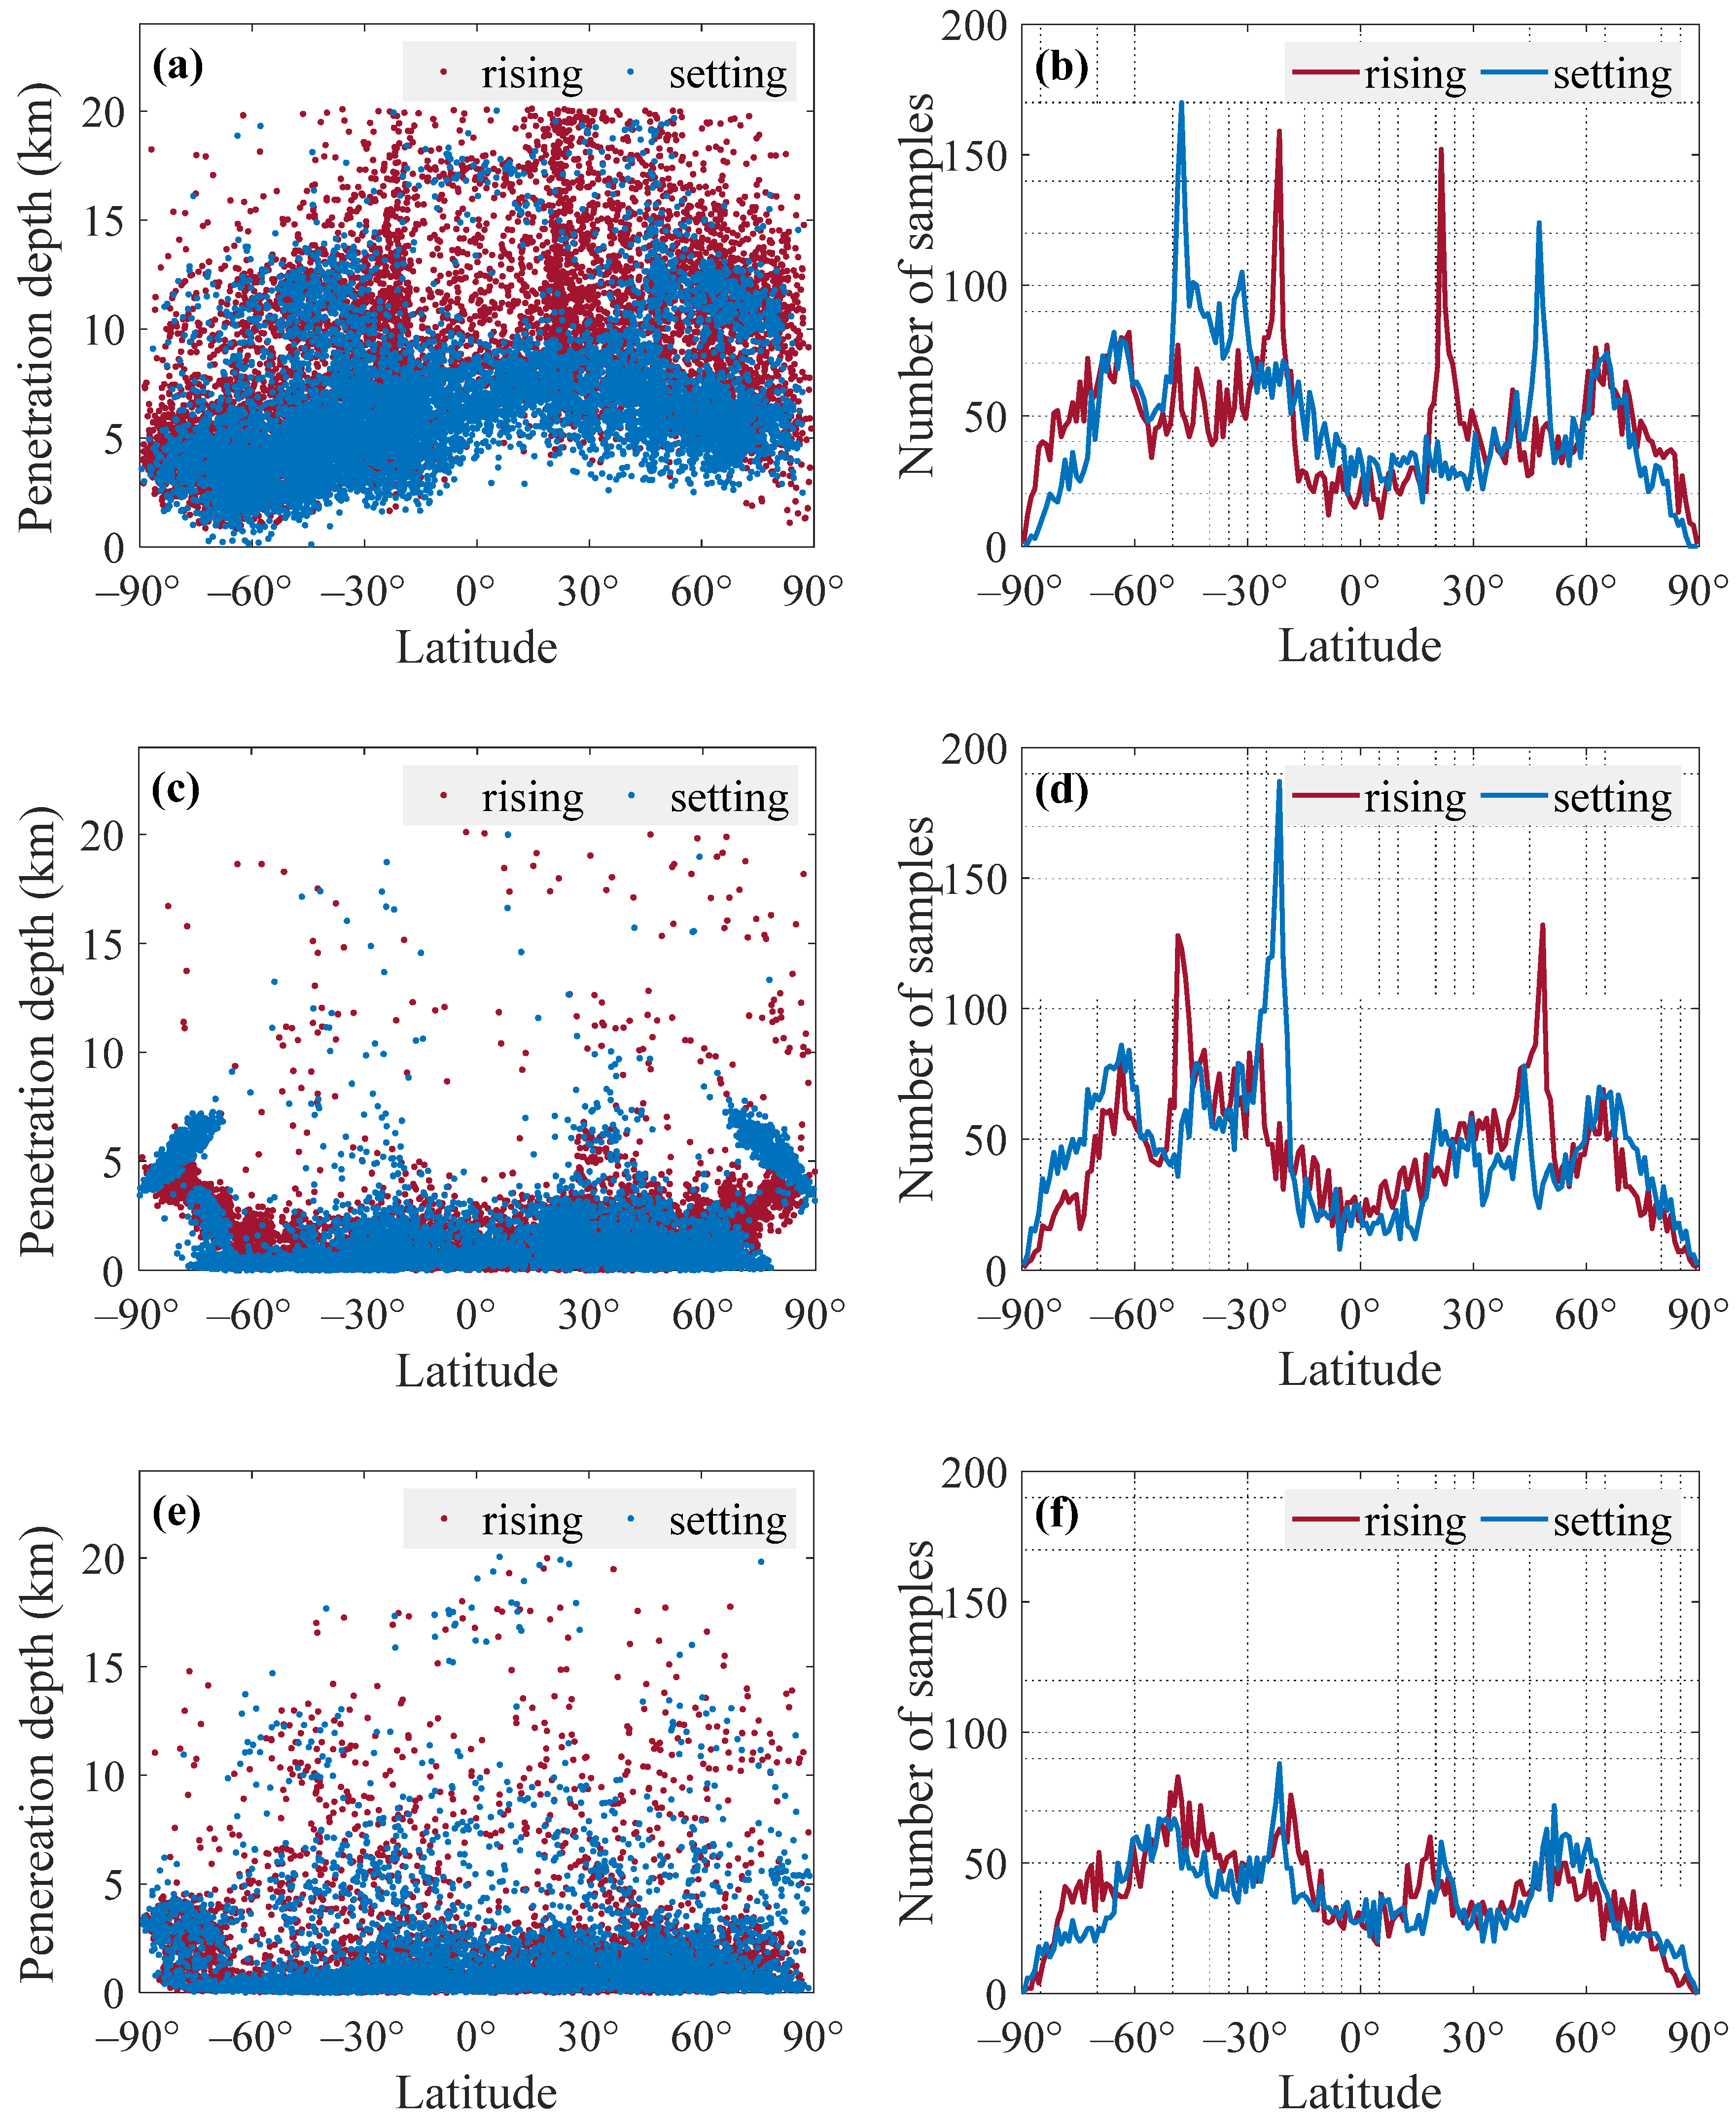
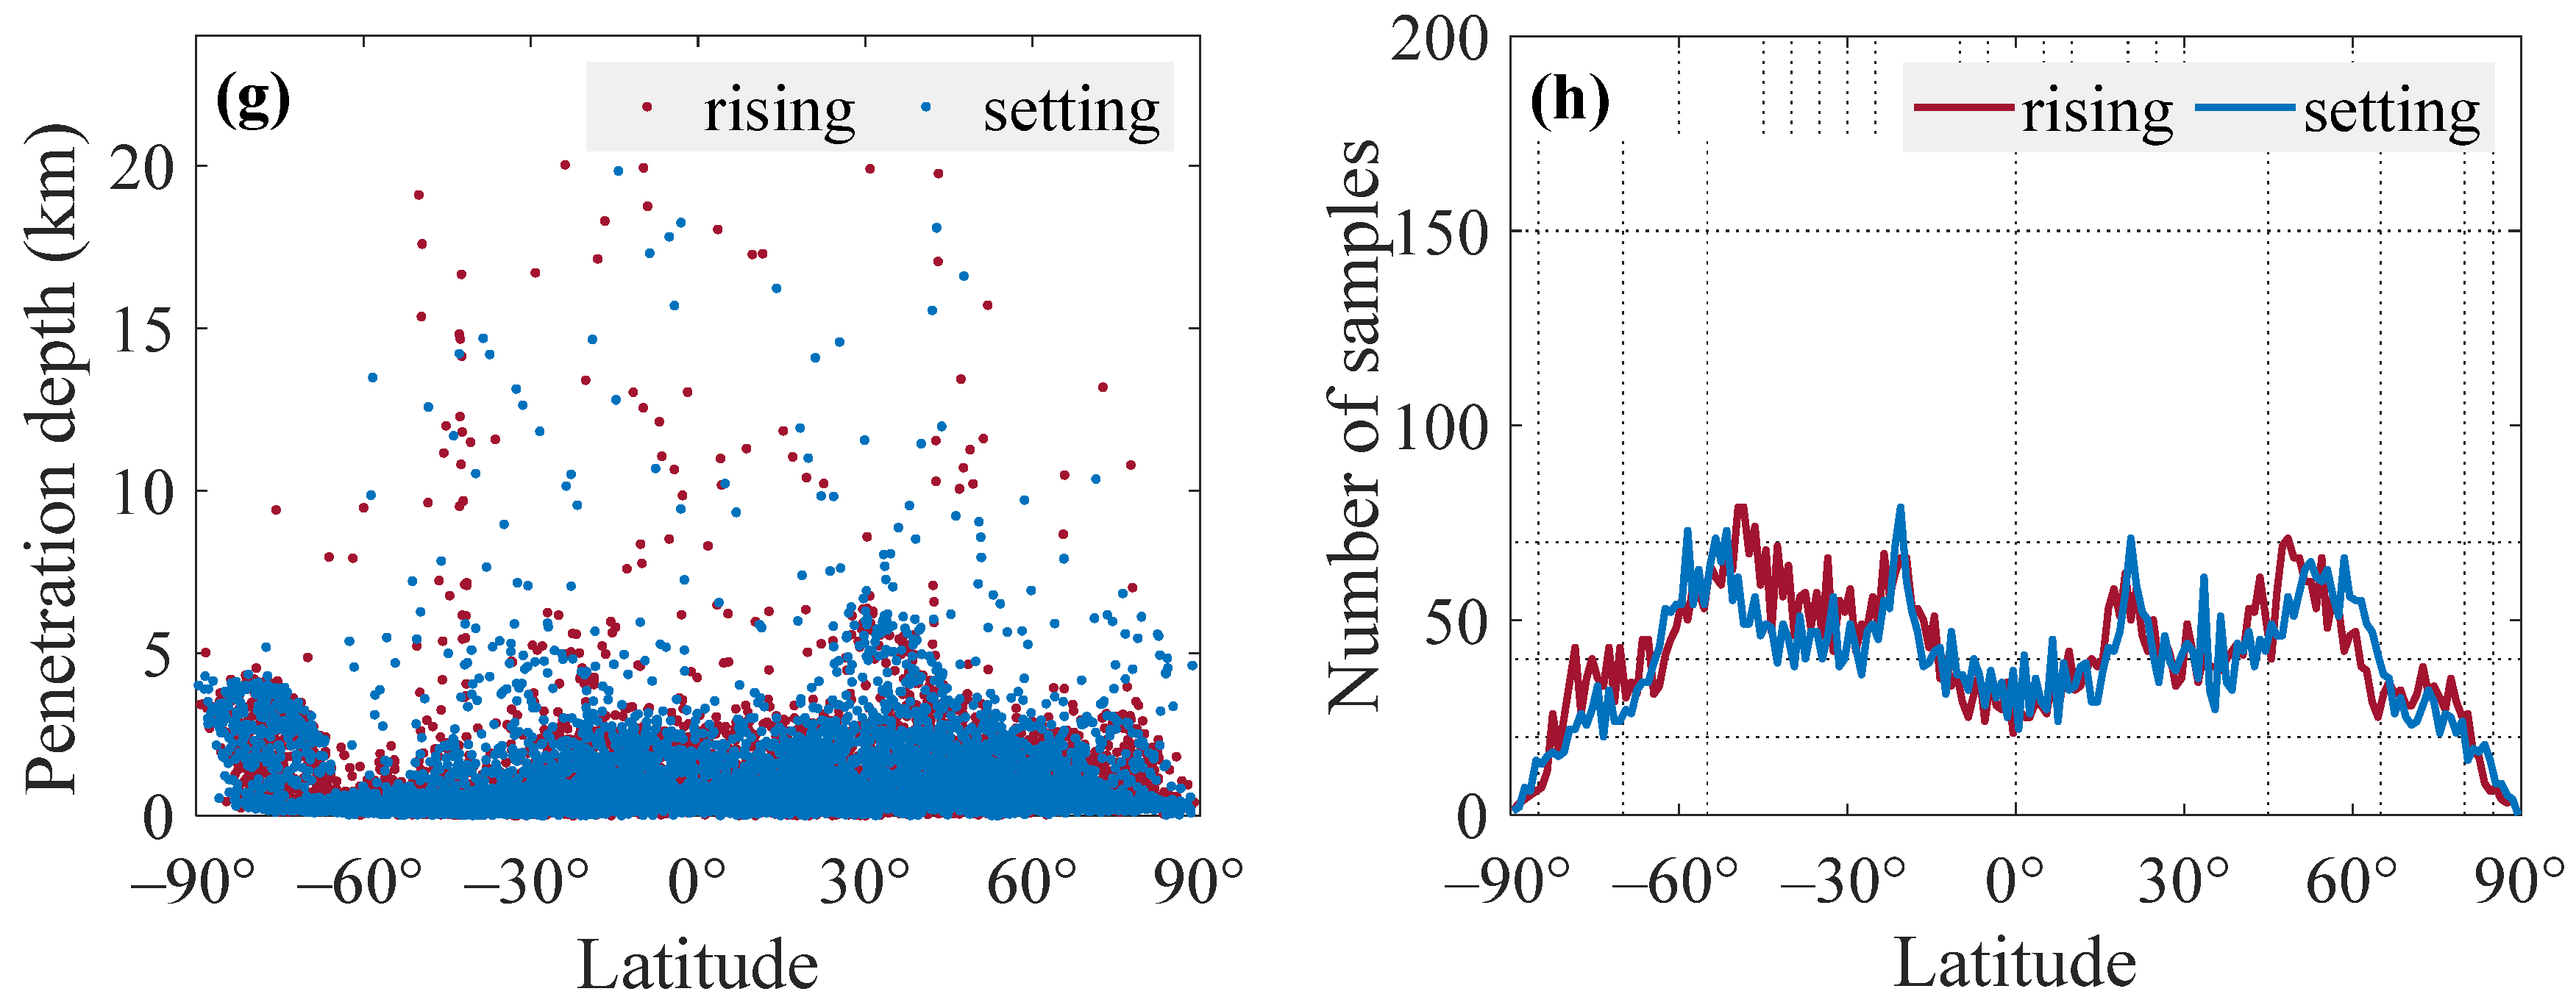
In order to investigate the impact of optimizing BDS OL tracking on its detection of the lower atmosphere,
Figure 3 compares the BDS and GPS penetration depths versus latitude. Here, the minimum MSL altitude on each occultation event is defined as the penetration depth.
Figure 3a,c show the penetration depths of BDS occultations in July and September 2022, respectively. The penetration depth of BDS occultations shifted from dispersed over the range of 0–20 km to centralized below 5 km. It confirms the remarkable optimization of the BDS OL tracking.
Figure 3b,d present the corresponding number of samples for rising and setting BDS occultations versus latitudes. The number of rising occultation events was similar to that of setting occultation events, and a relatively large number of RO samples were observed in mid-and high-latitude regions. The peak values in the number of BDS RO samples formed at mid-latitudes could be related to the distribution characteristics of the BDS inclined geosynchronous orbit (BDS-IGSO) satellites’ RO events [
22].
Figure 3e,g show the penetration depths of GPS occultations during the same period. The variations of the GPS penetration depths were not obvious. And, except for the peak features, the trend of GPS and BDS RO sample curves was basically consistent.
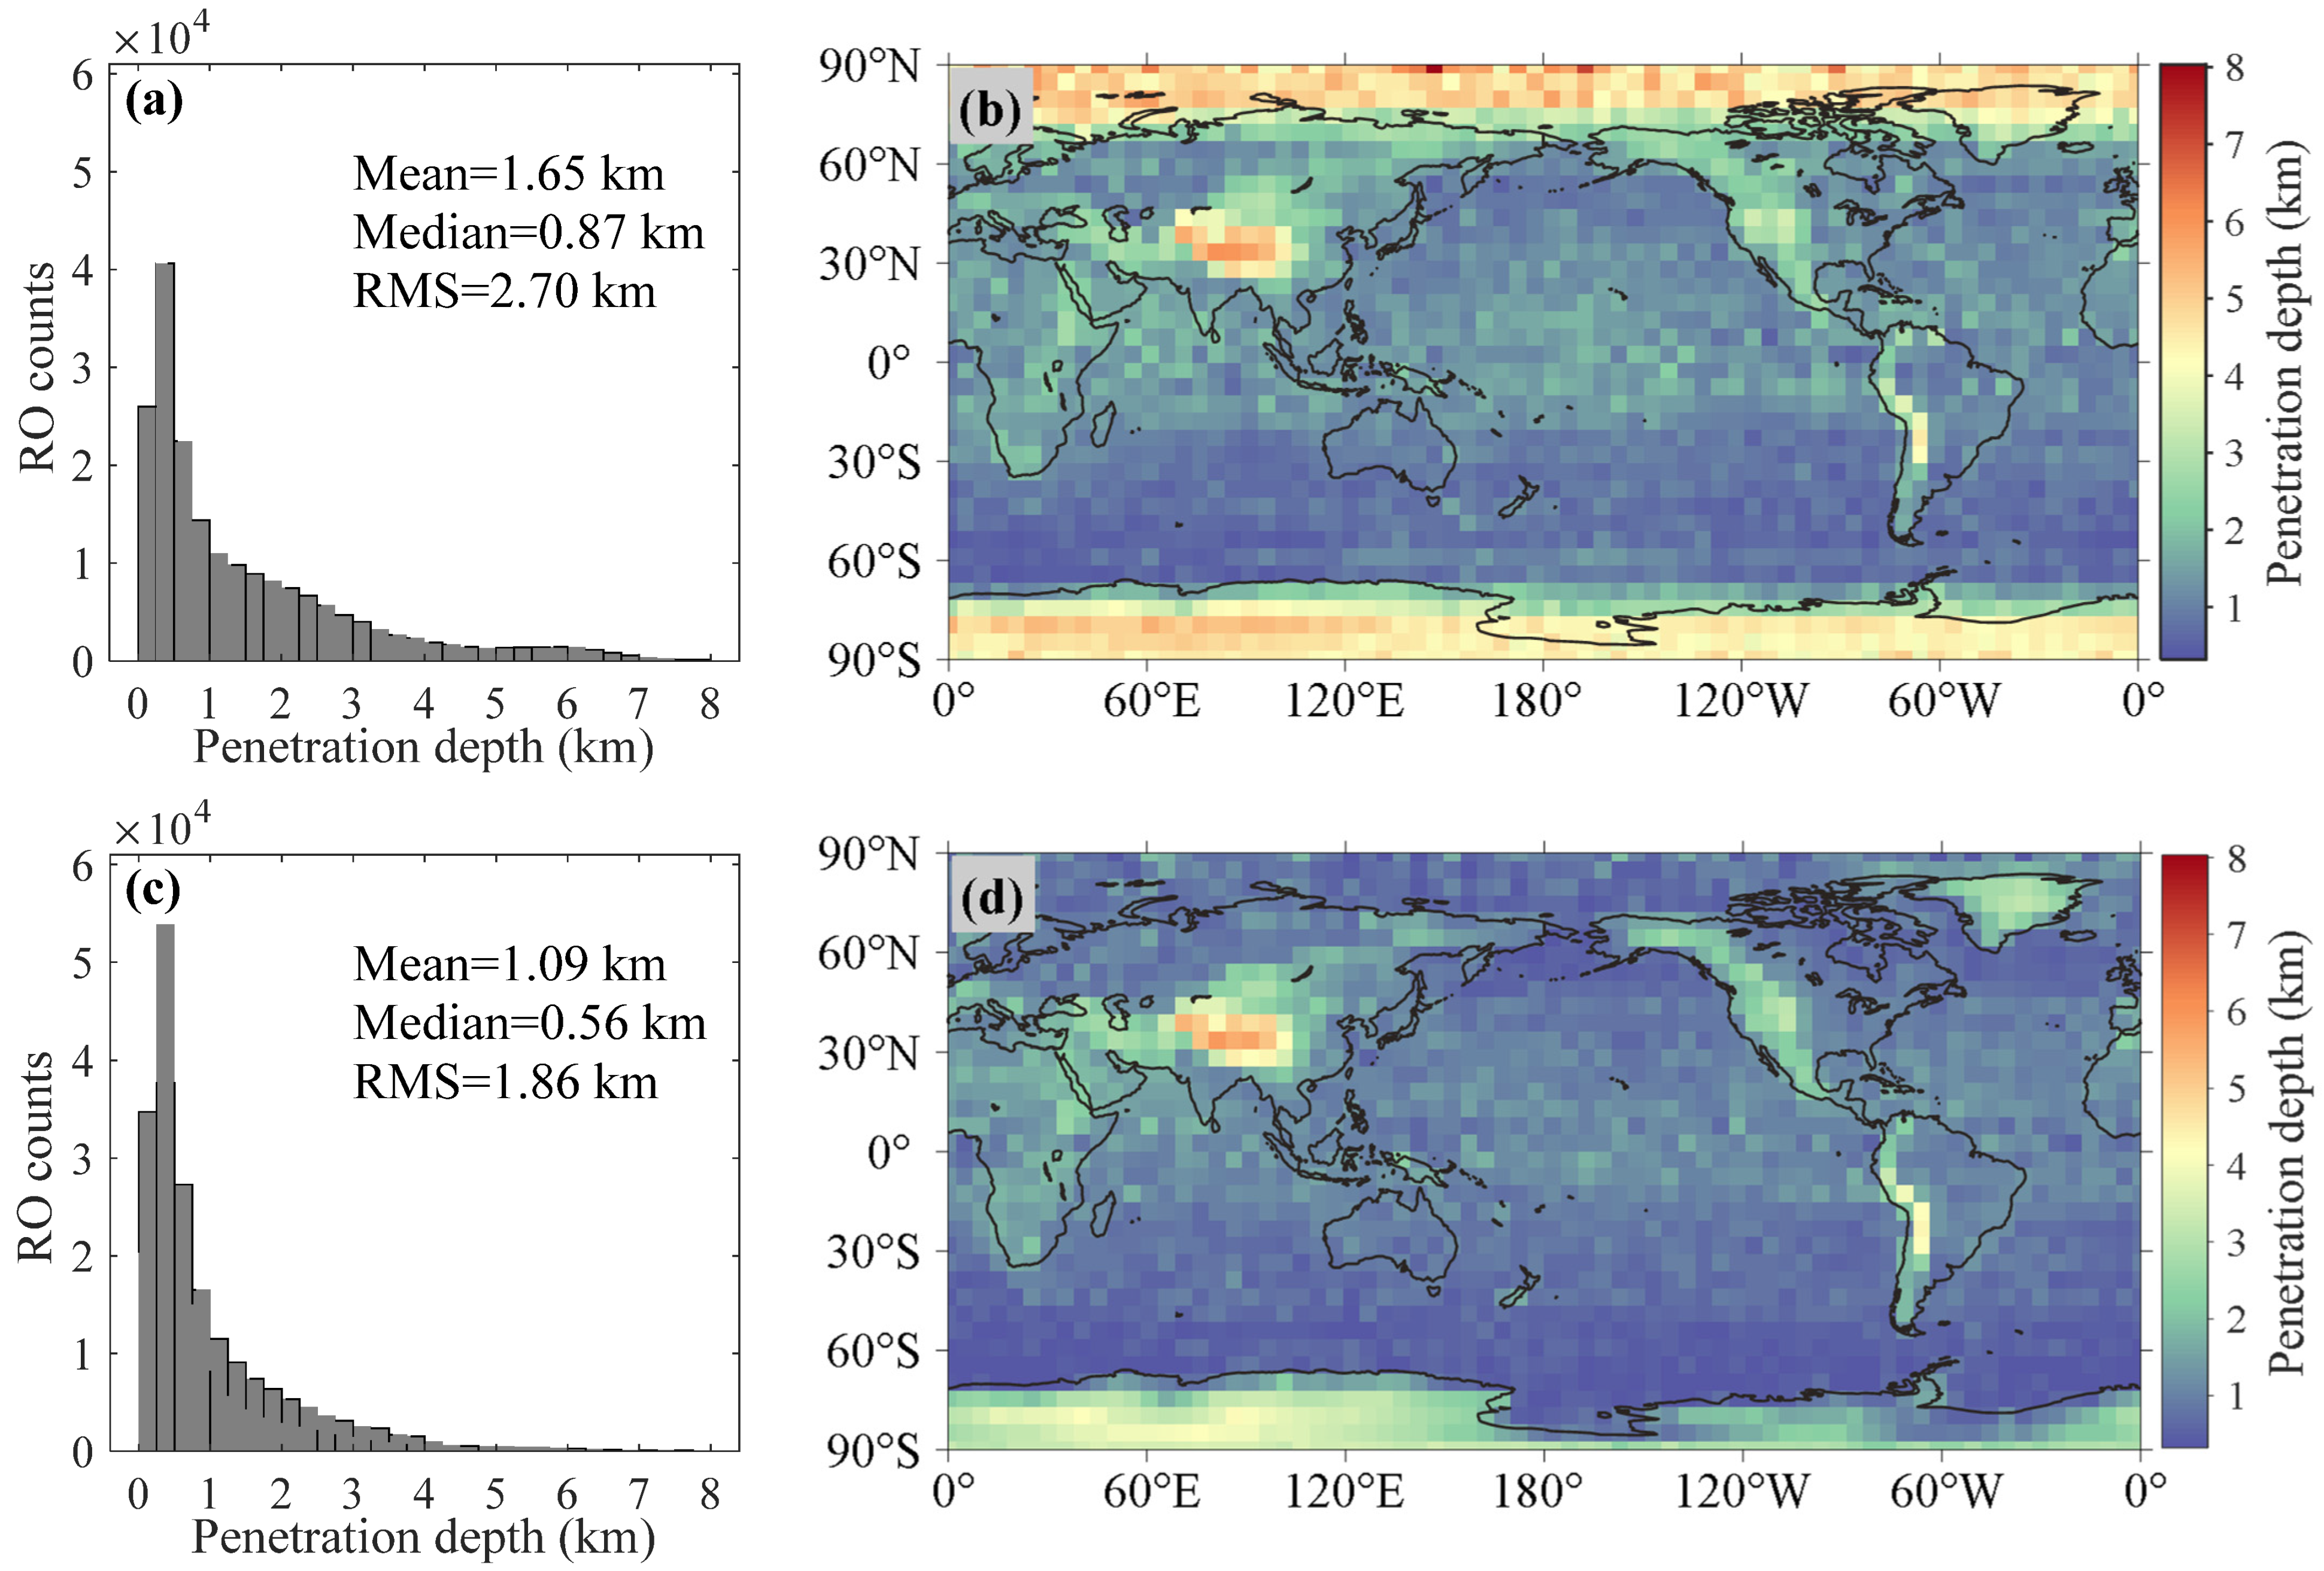
To further investigate the global performance of the BDS and GPS penetration depths, their statistics penetrating down to different depths and the global maps of average values in each 5°
5° latitude and longitude grid are shown in
Figure 4.
As visible in
Figure 4a,c, the mean penetration depths of BDS and GPS occultations reached 1.65 km and 1.09 km, respectively. The mean, median, RMS values, and the number of events penetrating below 1 km of BDS occultations were comparable to the GPS, suggesting that the ability to probe deeper into the lower troposphere of BDS RO reached a close level to the GPS RO.
In
Figure 4b,d, the contour maps of BDS and GPS RO penetration depths were highly consistent with the global digital elevation model. For example, the Tibetan Plateau (other such regions as the Cordillera Mountains, glacial plateau of Greenland, and the Ethiopian highlands, etc.) distinctly presented poorer penetration, because the high-altitude topography could block the RO signals from the GNSS satellites to LEO receivers, which was a factor of the early termination of the RO sounding. Conversely, regions with relatively flat terrain (e.g., large tracts of sea areas) essentially penetrated down to or less than 1 km. These global terrain features at different latitudes were also correlated with the differences in penetration depths versus latitudes in
Figure 3. Additionally, the penetration depths of BDS and GPS RO soundings in the global distribution were highly consistent. However, the BDS occultations also showed higher penetration depths over the polar regions, which we consider may be due to a problem with the BDS RO tracking algorithm.
4.2. Deviations of the FY-3E/GNOS-II RO Profiles
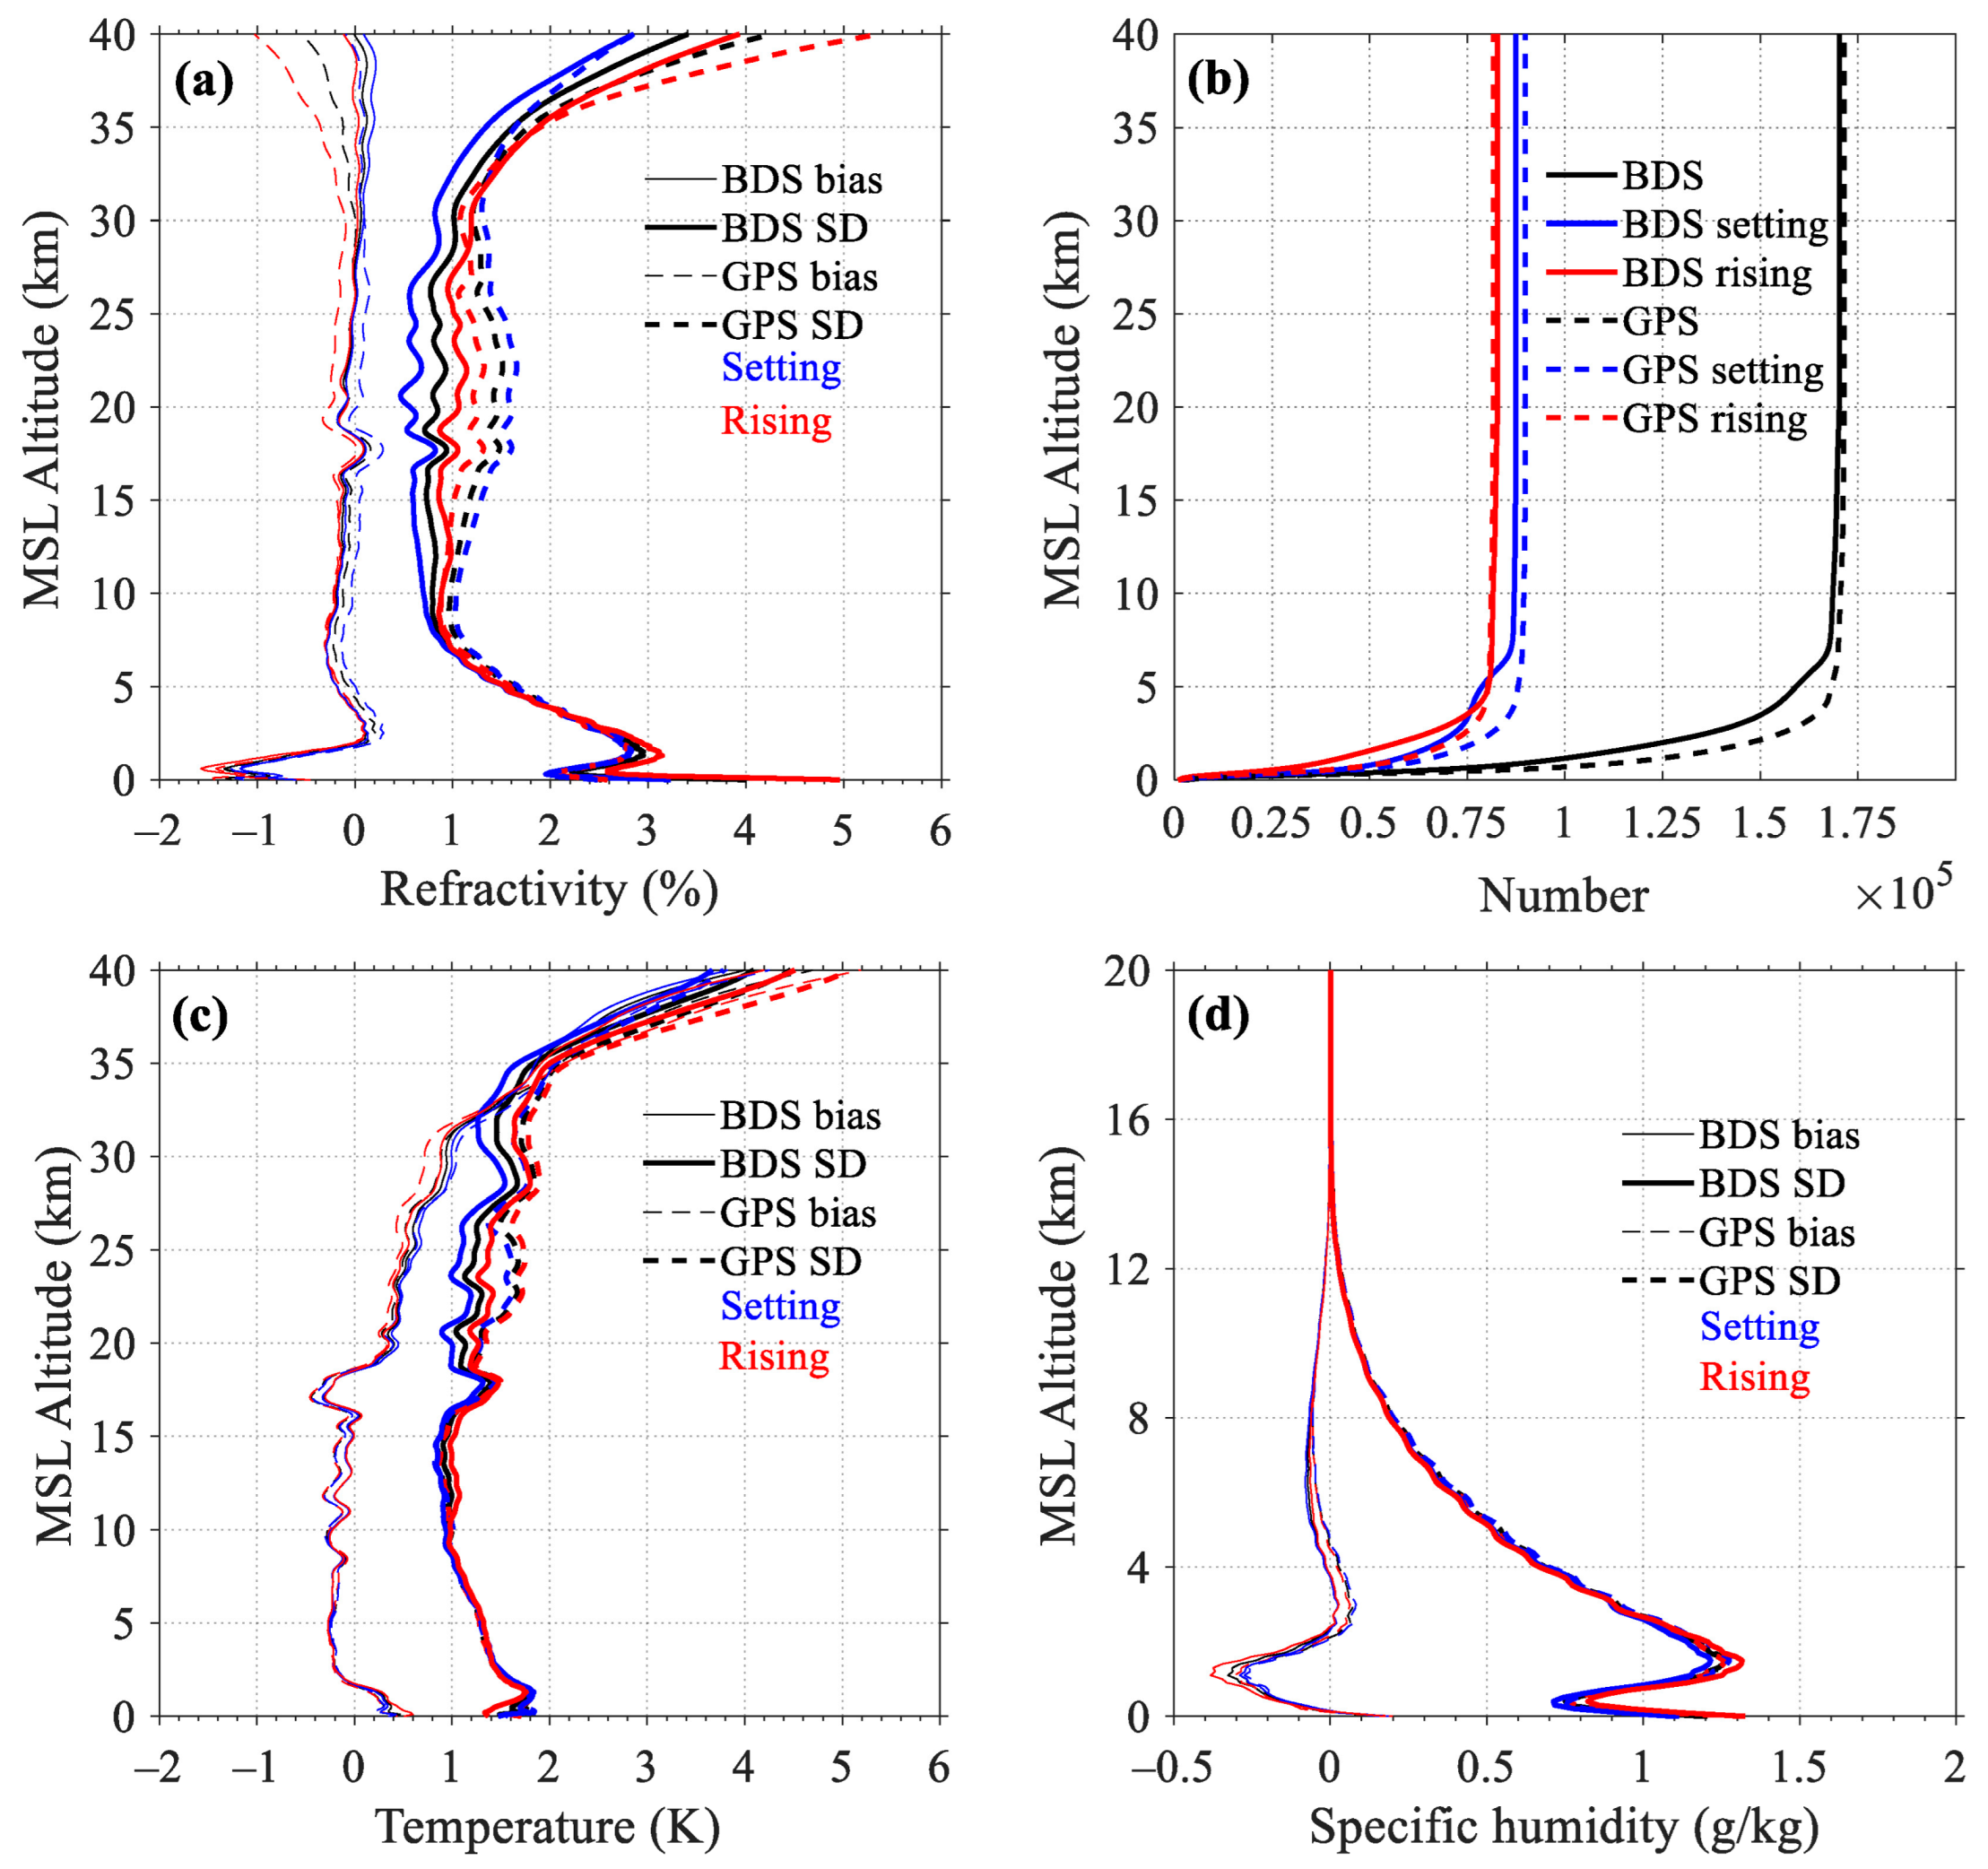
FY3E/GNOS-II BDS and GPS RO soundings were compared with the co-located ERA5 profiles in
Figure 5, containing the biases and SDs of BDS, GPS, rising, and setting occultations after integrating one year of data. The biases and SDs of refractivity, temperature, and specific humidity were first assessed on different altitude ranges.
Figure 5a shows the biases and SDs of refractivity profiles. The negative bias below 2 km is related to the atmospheric ducting effects (also mentioned as superrefraction by Sokolovskiy, 2003) associated with the top of the planetary boundary layer, and the lower-tropospheric bias is also related to the multipath effect caused by a large amount of water vapor [
37,
38,
39]. The fluctuation in the range of 15–20 km is influenced by the tropical tropopause [
21]. Specifically, the structure of these fluctuations may be ascribed to the lower vertical resolution of the ERA5 model used in this research, leaving the interpolated results near the top of the tropical troposphere at variance with the RO data. Basically, FY-3E RO data with higher resolution have more detailed information in the altitude range of the tropopause than 37 pressure-level ERA5 data [
21]. And, deviations above 35 km are mainly attributed to ionospheric residual errors and the systematic deviations of the ERA5 data [
27].
Overall, the biases and SDs of BDS and GPS refractivity were on a comparable accuracy level. At the altitude of 5–25 km, the mean BDS refractivity bias and corresponding SD were −0.14% and 1.11%, while the mean bias and corresponding SD of GPS were 0.01% and 1.52%, respectively. The GPS refractivity bias arose distinct negative values above 30 km, reaching a maximum value of −0.48% at 40 km, and from 5 km upwards, the GPS refractivity SD was consistently larger than BDS. In addition, the mean BDS and GPS refractivity biases were almost identical below 40 km, but the mean SD of GPS was 0.31% larger than that of BDS.
Figure 5b compares the number of refractivity samples from BDS and GPS occultations. The numbers of samples for BDS and GPS were quite close to each other, and the numbers of samples for their setting and rising occultations were also similar.
Figure 5c represents the biases and SDs of temperature profiles. Temperature biases with negative values were appeared at 2–18 km and they grew rapidly towards positive above 18 km. And, the deviations above 30 km may be influenced by a combination of RO observations, background information, and other factors [
27].
BDS temperature biases and SDs were slightly smaller than those of GPS. From 5 to 25 km, mean temperature biases of BDS and GPS were within ±0.1 K, with corresponding SDs of 1.1 K and 1.2 K, respectively. It is rather remarkable that a major discrepancy was found at about 23 km where the SD of GPS exceeded BDS by about 0.5 K. Below 40 km, furthermore, the mean bias and SD of BDS temperature profiles were both smaller than those of GPS.
Figure 5d illustrates that the differences between BDS and GPS specific humidity profiles are negligible. BDS/GPS specific humidity bias was mostly negative with a maximum value of −0.3 g/kg at 1 km, along with the SD being less than 1.3 g/kg at 1.5 km.
To further analyze the differences between setting and rising occultations, their biases and SDs from BDS and GPS were also compared in
Figure 5a–d.
Table 3 and
Table 4 list the mean refractivity and temperature biases and SDs of setting and rising occultations (The magnitude of the specific humidity difference was exceptionally small; therefore, it was not listed), with altitudes from 0 to 40 km and the segment with highest accuracy of 5–25 km [
40].
In
Table 3, the setting BDS occultations exhibit smaller mean biases and SDs than rising occultations in both altitude ranges. For GPS RO soundings, setting occultations had smaller mean biases and larger SDs compared with rising occultations at 0–40 km, and at 5–25 km, setting occultations had a larger mean SD.
Table 4 reveals the differences between setting and rising occultations on temperature profiles. The differences of mean biases were less than 0.1 K, and generally, setting occultations had smaller mean SDs than rising occultations.
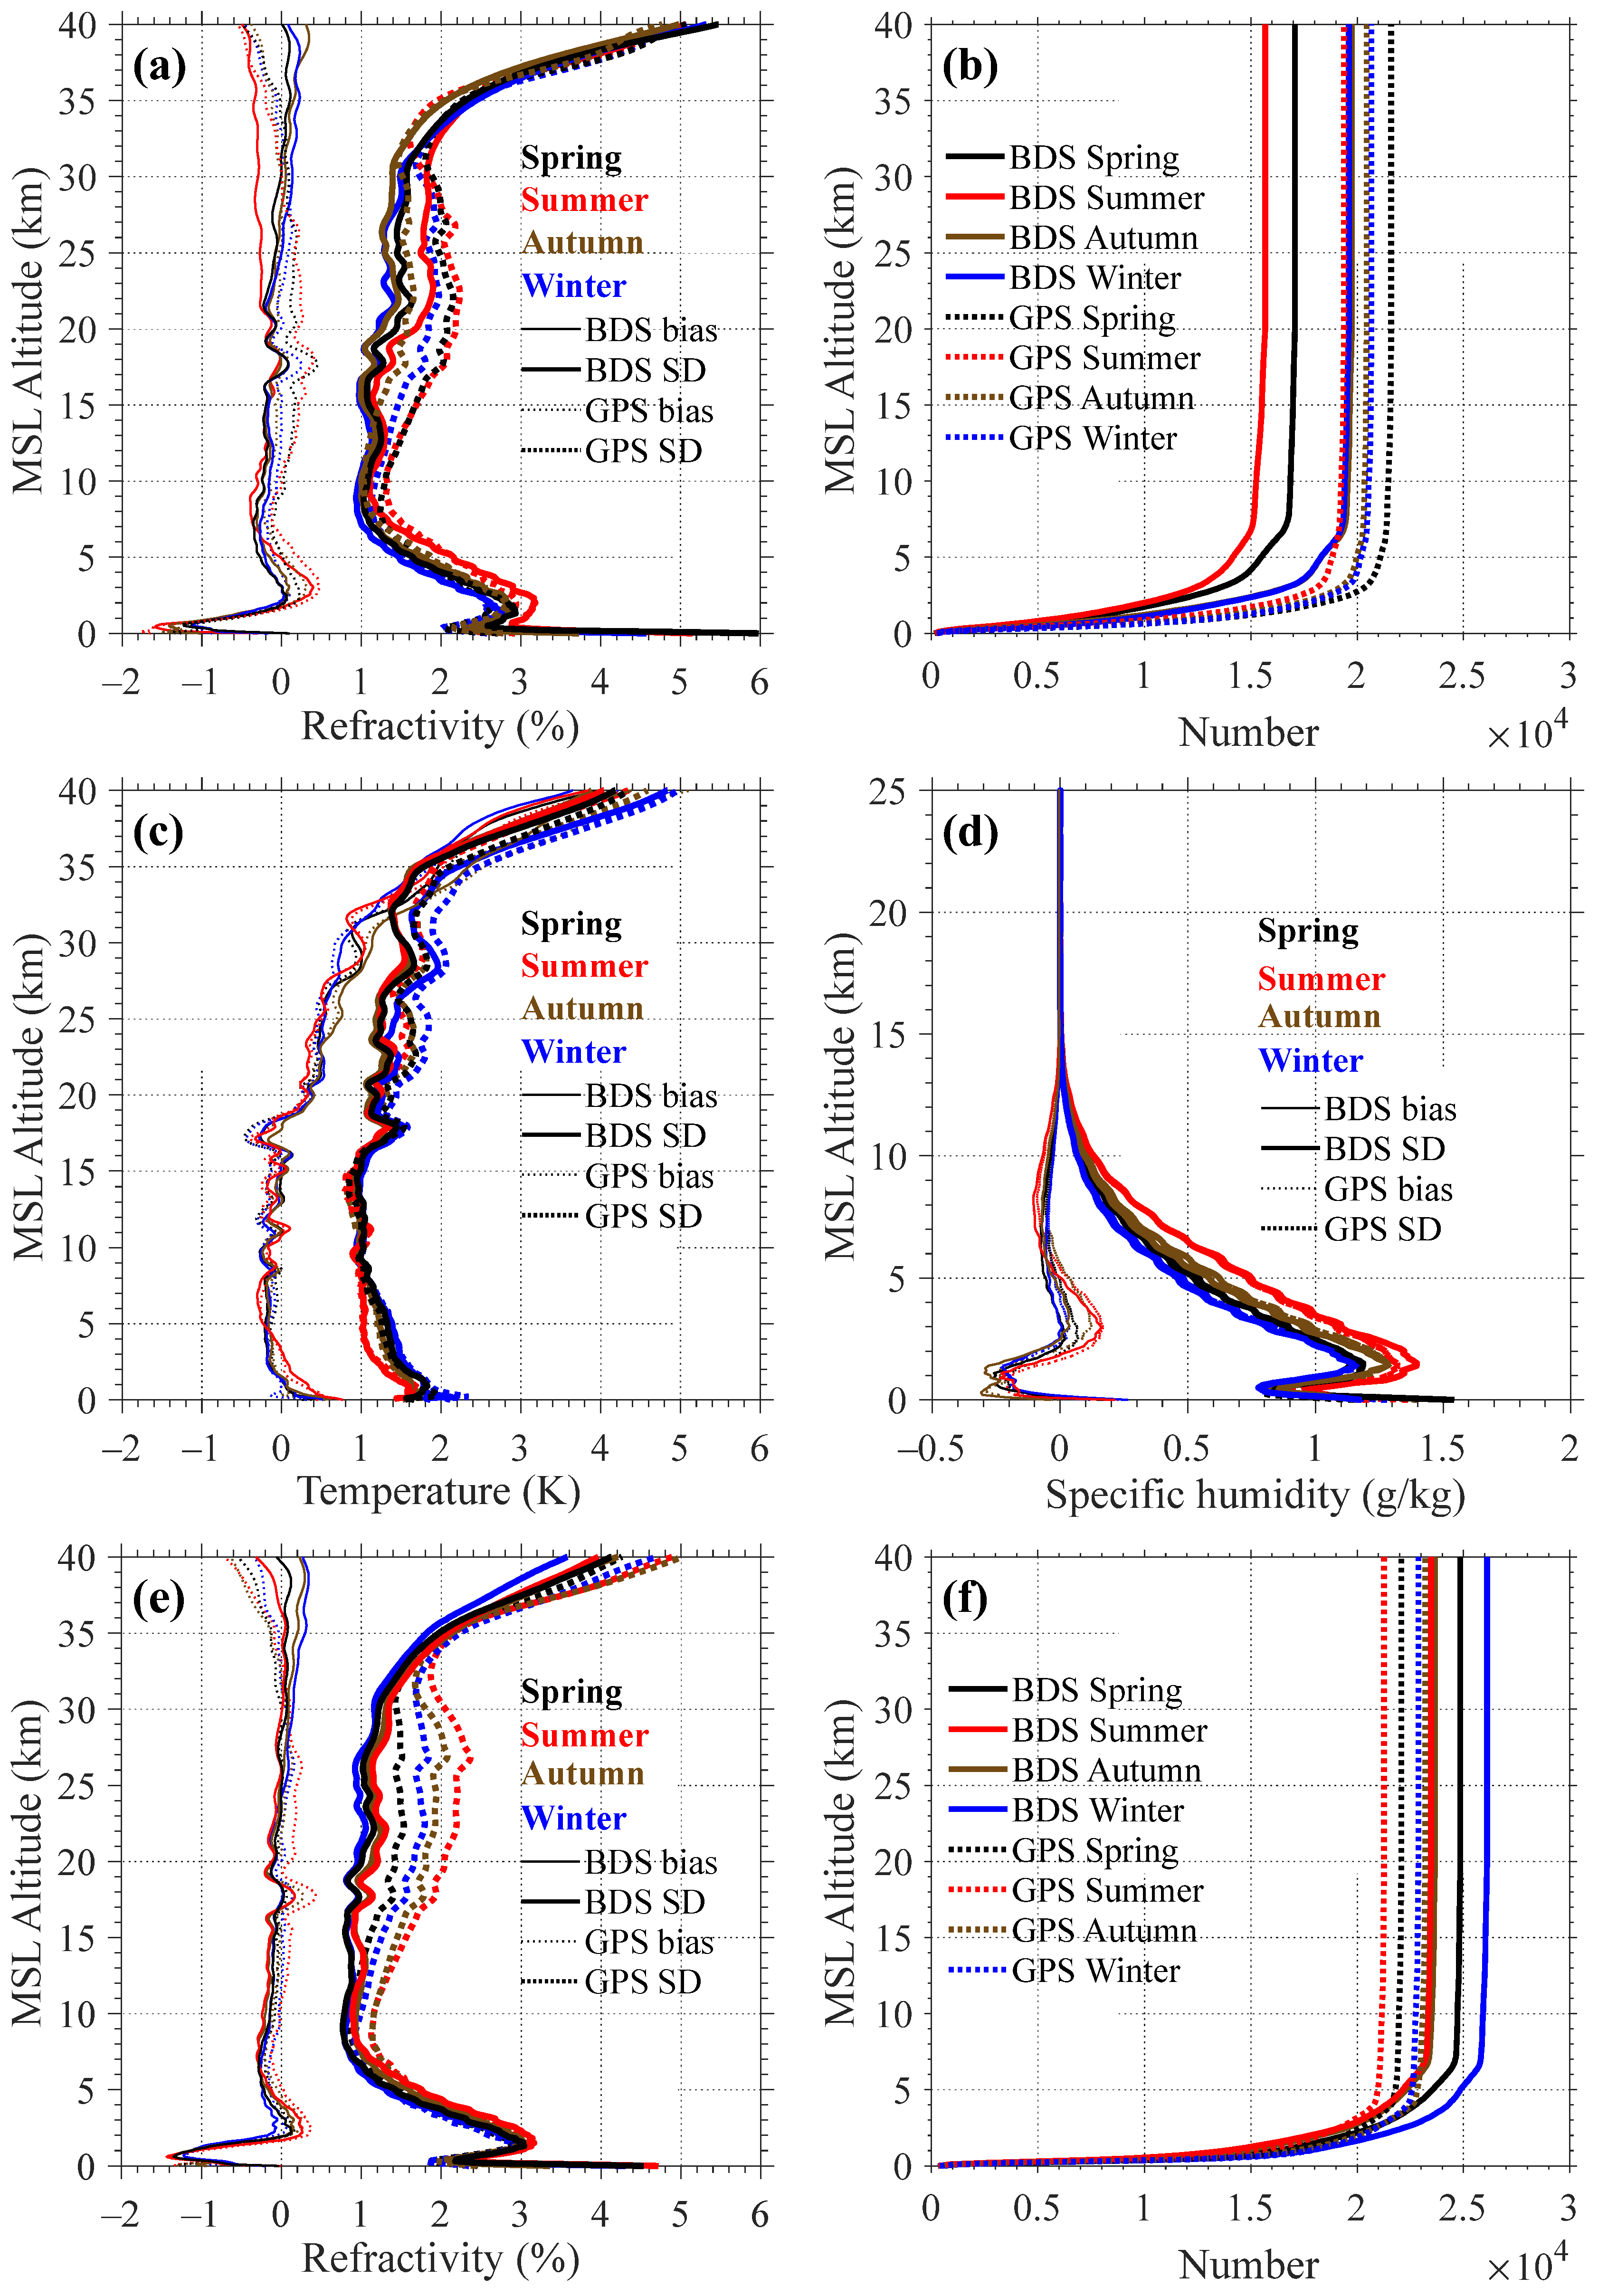
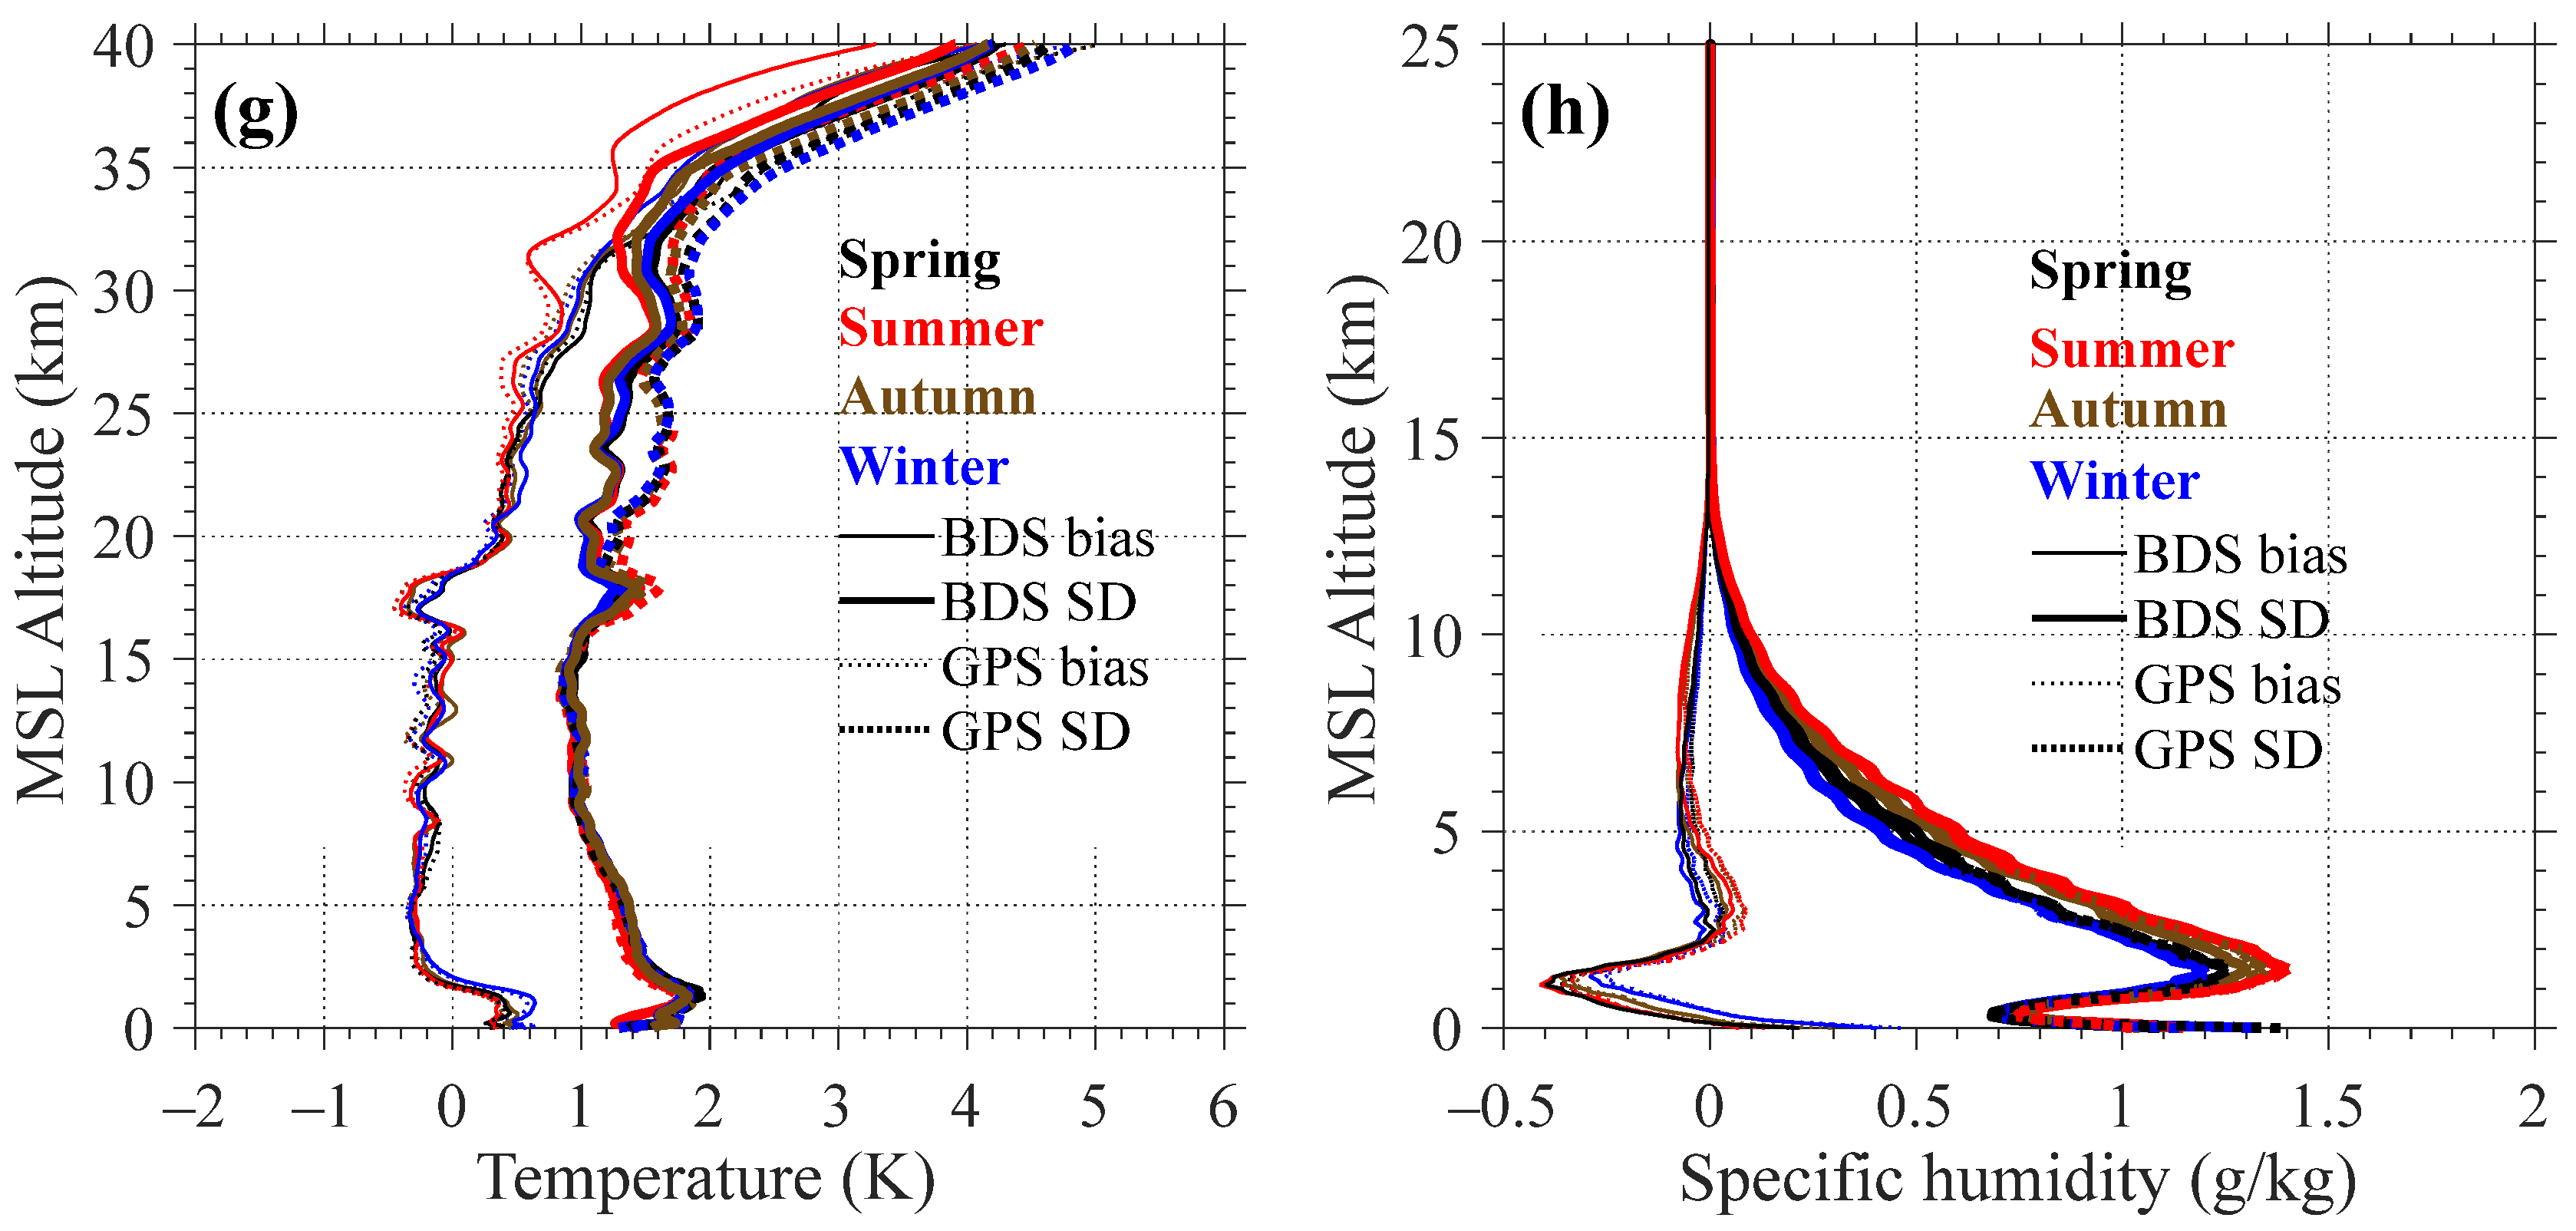
4.3. Seasonal Differences
To investigate the seasonal differences of FY-3E/GNOS-II RO profiles, BDS and GPS soundings from 1 September 2022 to 31 August 2023 were grouped into four seasons, with spring (March, April, and May), summer (June, July, and August), autumn (September, October, and November), and winter (December, January, and February) over the northern hemisphere. Note the corresponding months over the southern hemisphere are autumn, winter, spring, and summer, respectively. The results are presented throughout
Figure 6.
As depicted in
Figure 6a,e, almost no regular seasonal differences were found in BDS refractivity profiles, considering inherent differences existed across seasons. For BDS occultations, the biases and SDs curves almost overlapped in spring, autumn, and winter. It is special that, over the northern hemisphere, the bias and SD in summer slightly deviated from the other three categories. For GPS occultations, SD differences in different seasons were visually represented in the range of 5–35 km, and the summer season had the largest SD.
Figure 6b,f show the number of refractivity samples. As apparent, more occultations were analyzed over the southern hemisphere.
Figure 6c,g reveal the seasonal comparison on temperature profiles. Below 25 km, the differences in biases and SDs in seasons were almost indiscernible. At the range of 25–40 km, SDs were slightly larger in winter and smaller in summer; however, these differences even did not exceed 1 K compared to ~3.7 K in the research of Fan et al. [
41]. It suggests seasonal differences in temperature are not obvious.
Figure 6d,h present the seasonal comparison of specific humidity profiles. The bias and SD were largest in summer, ascribed to the lower-tropospheric water vapor during the warmer season. And conversely, the bias and SD were smallest in winter.
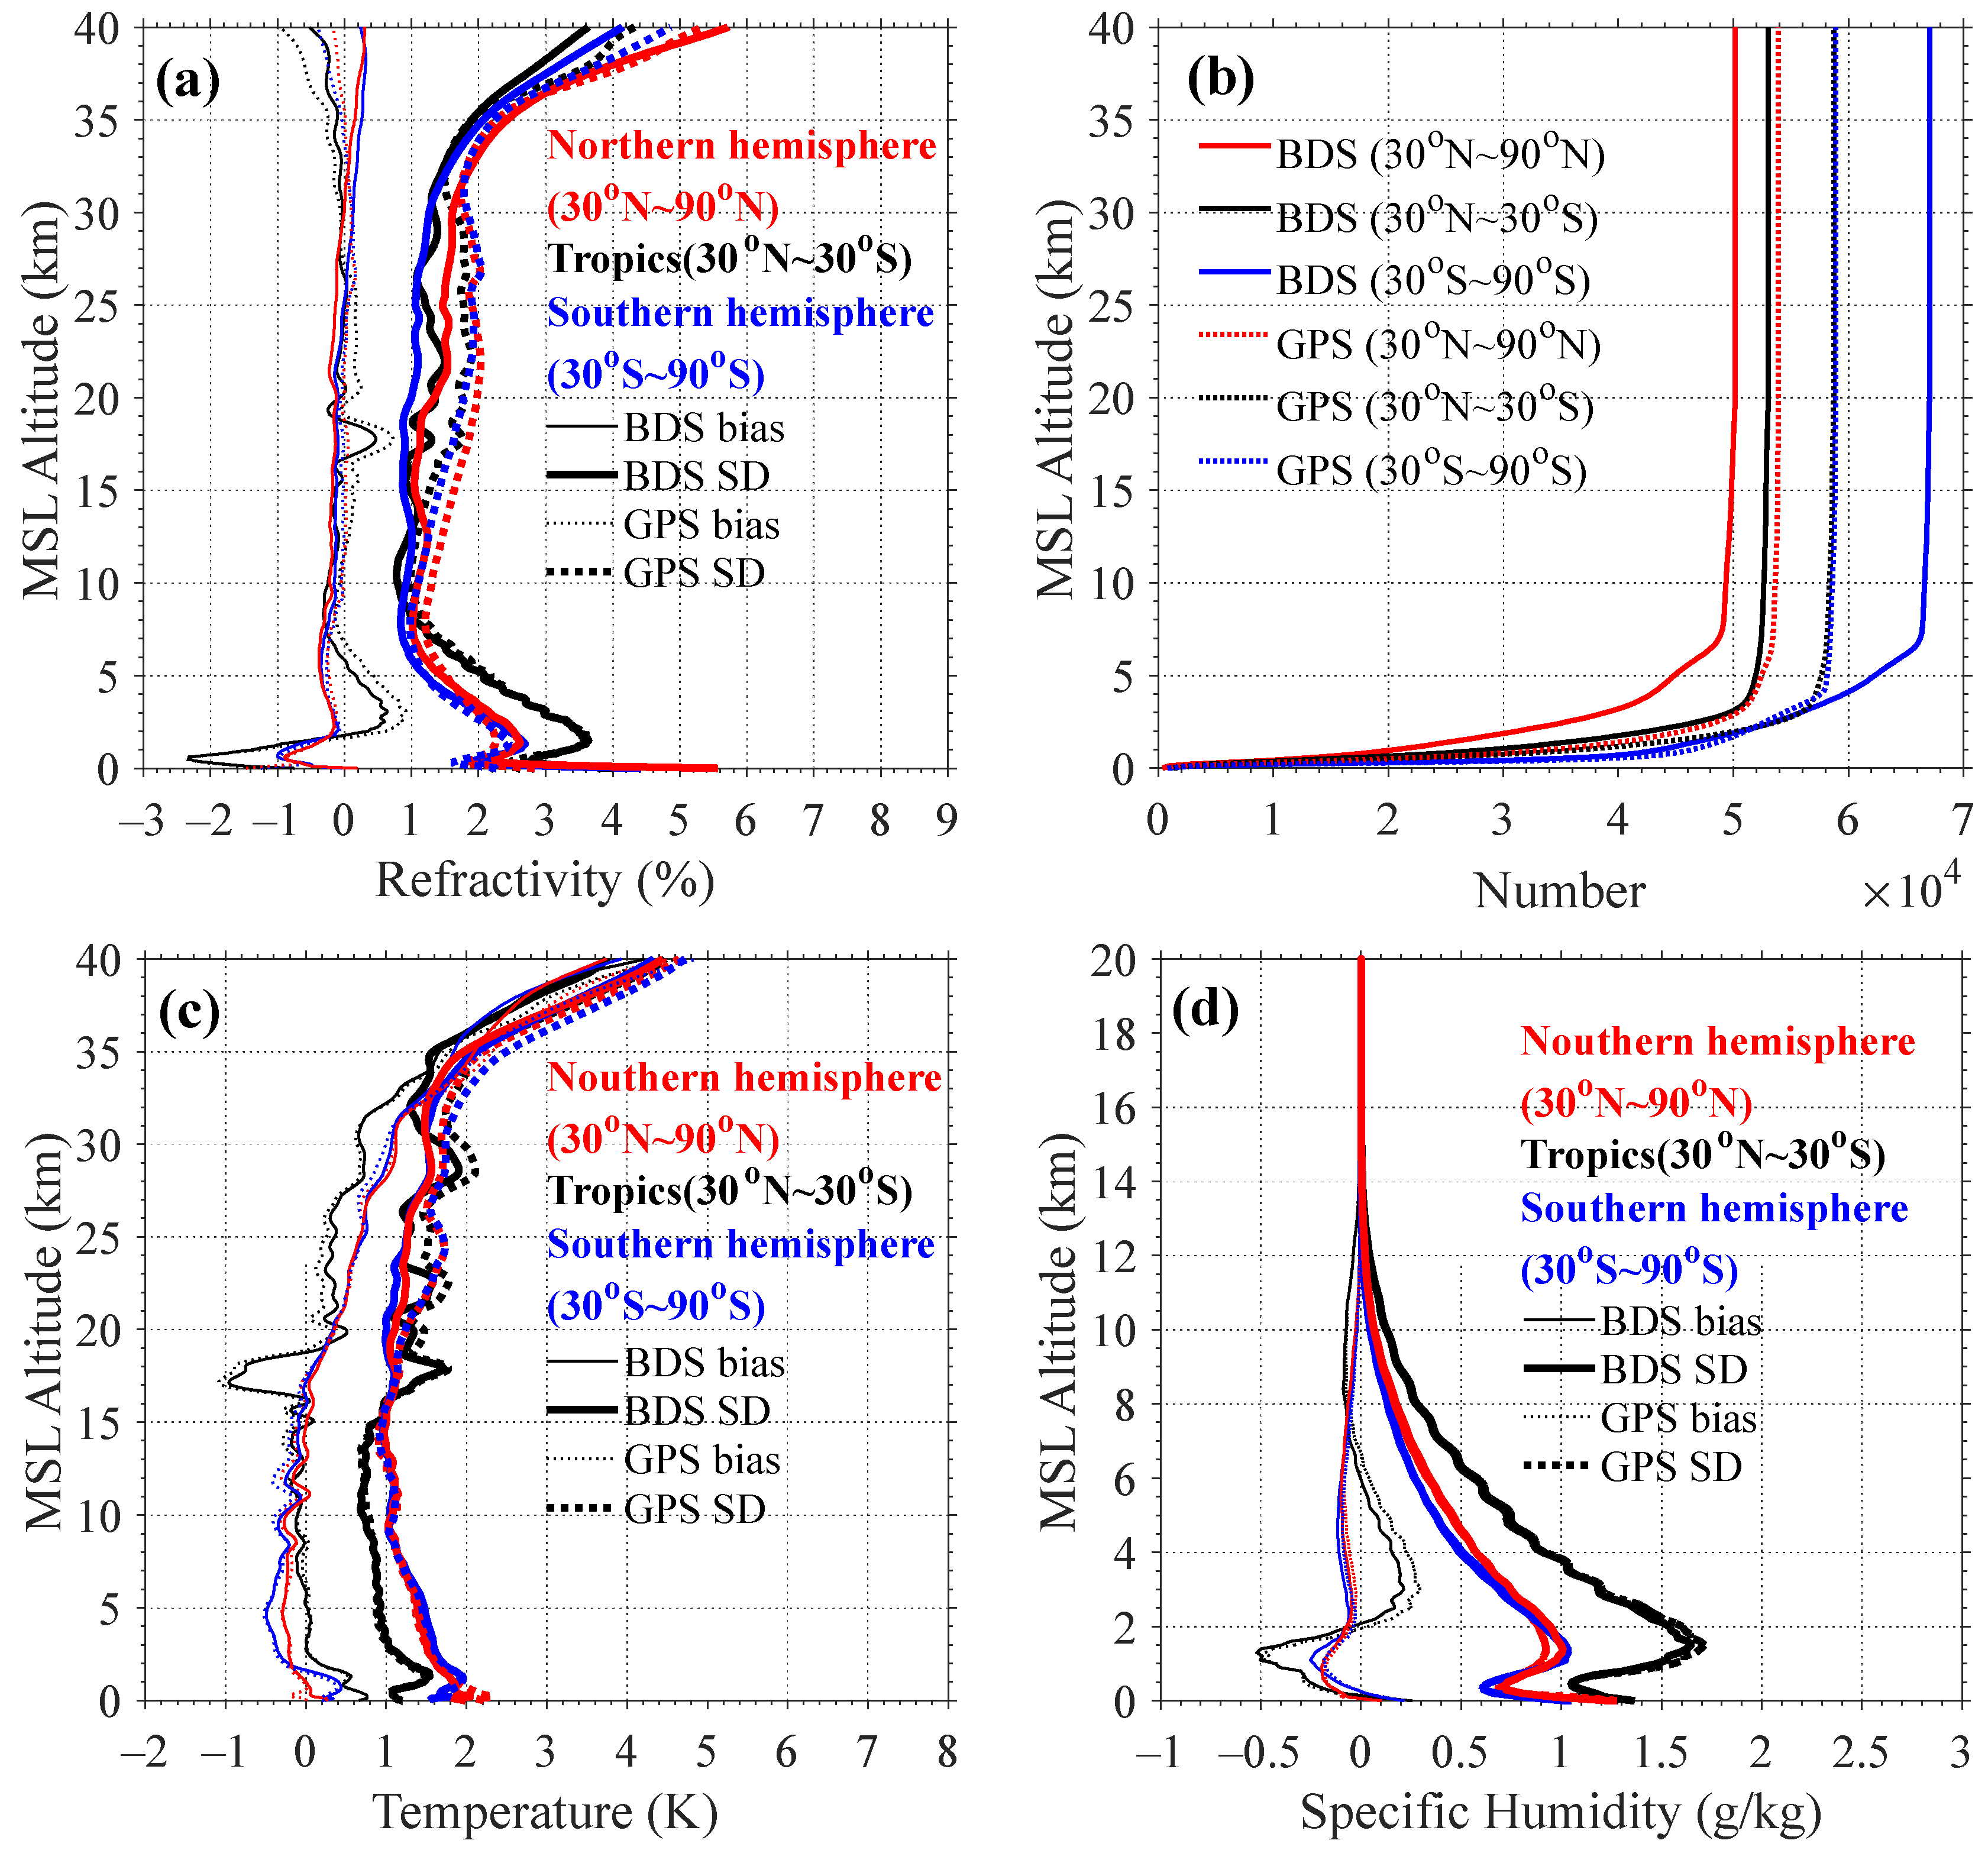
4.4. Latitudinal Characteristics
To explore the latitudinal characteristics of FY-3E/GNOS-II RO profiles, data were divided into three categories including high latitudes (30°N~90°N and 30°S~90°S) and tropical regions (30°N~30°S). The results are visually displayed in
Figure 7.
Figure 7a shows the biases and SDs of refractivity profiles. Tropical differences were particularly evident below 10 km, where the effects of multipath propagation were significant [
42,
43], and severe fluctuations were observed in the tropics. BDS/GPS bias reached −2.34% at 0.6 km, with the SD up to 3.65% at 1.5 km, indicating the ducting effect was salient over the tropics. By contrast, tropospheric biases and SDs were within ±1% and 3% over the northern and southern hemispheres. Notably, a pronounced discrepancy could be seen over the tropics, which approximately appeared at the tropopause. By comparison, uniform and smooth biases and SDs were displayed over the northern and southern hemispheres. To summarize, the larger biases and SDs from the warmer tropics demonstrated the degradation of RO retrieval compared to other regions.
Figure 7b shows the number of BDS and GPS refractivity samples. More occultations were analyzed over the southern hemisphere, as mentioned in
Section 4.3.
Figure 7c illustrates the biases and SDs of temperature profiles. As more information from the background was used below 15 km, the tropical temperature profiles seemed to be more consistent with the ERA5 [
44]. Between 15–20 km, larger biases and SDs of temperature in the moist tropics were seen, with their values reaching −1.0 K and 1.7 K, respectively. Above 20 km, biases and SDs in high latitudes were also smoother.
Figure 7d represents the biases and SDs of specific humidity profiles. The specific humidity was essentially the most sensitive to the warmer and moister environment. As evident from the graph, the bias and SD were largest over the tropics.
5. Discussion
This research corresponds to previous literatures on FY-3C and FY-3D [
21,
30,
44,
45]. Distinct from the earlier satellites, two main improvements are demonstrated by the FY-3E/GNOS-II: RO support with BDS-3 satellites [
46], and the OL tracking on BDS RO signals. This work extends the research on FY-3 series satellites’ RO missions by analyzing the atmospheric profiles from FY-3E.
The optimization of OL tracking data processing on BDS RO has significantly improved the occultation’s ability to probe the lowest part of the atmosphere, which can offer wider prospects for the lower-tropospheric application. And, the BDS RO tracking shows comparable penetrating capability with GPS RO tracking, except BDS RO penetration depth is higher in the two polar regions.
Comparison of BDS and GPS refractivity biases and SDs indicates insignificant differences between each other. And the biases of both setting and rising BDS and GPS occultations were less than 0.3% below 40 km and 0.2% at 5–25 km, respectively, implying the OL tracking algorithm was mature enough to satisfy both setting and rising occultations tracking.
BDS and GPS seasonal differences on refractivity profiles are inconsistent. Particularly, the SD difference seems to indicate the GPS refractivity profiles are more variational in seasons.
In
Section 4.4, the tropics with their abundant rainfall and violent and repeated changes in air vapor throughout the day, combined with the inherently challenging nature of exploring the atmosphere, give rise to noticeable deviations in RO soundings. Notably, most of the fluctuations in the bias and SD are likely from the tropical contributions, and the rest is connected to sampling errors caused by temporal and spatial interpolation.
Some limitations remain: for example, the influence of the climatic background field and the NWP field on the accuracy analysis is uncertain. Therefore, further work could focus on the correlation between the background and RO observations or the proportion of the influence. And beneficially, the study scrupulously assesses BDS RO profiles in a new context, which will facilitate its deeper research and widespread use.
6. Conclusions
The aim of this study is to evaluate the quality of the FY-3E/GNOS-II RO profiles in the neutral atmosphere. Both BDS and GPS RO profiles, including refractivity, temperature, and specific humidity, were analyzed with the ERA5 atmospheric reanalysis data as the reference. Results indicate FY-3E/GNOS-II RO profiles coincide well with the ERA5 profiles.
Comparison of penetration depths demonstrates the poorer penetration of BDS RO than GPS RO, mainly over the polar regions. At 5–25 km, BDS and GPS refractivity biases were 0.14% and 0.01%, while the SDs were 1.11% and 1.52%, respectively; BDS and GPS temperature biases were within ±0.1 K, with SDs of 1.1 K and 1.2 K, respectively. Differences in specific humidity profiles on the two are almost indistinguishable. Setting BDS occultations had smaller biases and SDs than rising BDS occultations, and setting GPS occultations had smaller biases but larger SDs than rising GPS occultations.
Seasonal differences of BDS refractivity are small, but GPS refractivity SD is largest in summer. Temperature differences across seasons are unremarkable, while the biases and SDs of specific humidity are largest in summer and smallest in winter. Latitudinal characteristics of all three categories of profiles suggest RO observations show larger variations over the tropics.
High-quality BDS and GPS tracking capabilities for occultation signals are verified by FY-3E/GNOS-II, and the accuracy and precision of retrieved BDS profiles are comparable with those of the GPS profiles. The assimilation of the FY-3E neutral atmospheric profiles into NWP will be worth expecting.
Author Contributions
Conceptualization, S.Z. and Y.H.; methodology, S.Z. and S.G.; software, Y.H.; validation, S.Z., S.G. and Y.W.; formal analysis, Y.W.; investigation, S.Z.; writing—original draft preparation, Y.H and S.G.; writing—review and editing, S.Z.; project administration, Y.W. All authors have read and agreed to the published version of the manuscript.
Funding
This work was sponsored by the National Natural Science Foundation of China, grant Nos. 42174043, 42274111, 41974096 and 41931074.
Data Availability Statement
Acknowledgments
We acknowledge the NSMC, Chinese Meteorological Administration (CMA) for providing the FY-3E RO profile products, and ECMWF for providing the reanalysis data.
Conflicts of Interest
The authors declare no conflict of interest.
References
- Kursinski, E.R.; Hajj, G.A.; Bertiger, W.I.; Leroy, S.S.; Meehan, T.K.; Romans, L.J.; Schofield, J.T.; McCleese, D.J.; Melbourne, W.G.; Thornton, C.L.; et al. Initial results of radio occultation of Earth’s atmosphere using the global positioning system. Science 1996, 271, 1107–1110. [Google Scholar] [CrossRef]
- Kursinski, E.R.; Hajj, G.A.; Schofield, J.T.; Linfield, R.P.; Hardy, K.R. Observing Earth’s atmosphere with radio occultation measurements using the Global Positioning System. J. Geophys. Res. 1997, 102, 23429–23465. [Google Scholar] [CrossRef]
- Rocken, C.; Anthes, R.A.; Exner, M.; Hunt, D.; Sokolovskiy, S.V.; Ware, R.; Gorbunov, M.; Schreiner, W.; Feng, D.; Herman, B.; et al. Analysis and validation of GPS/MET data in the neutral atmosphere. J. Geophys. Res. 1997, 102, 29849–29866. [Google Scholar] [CrossRef]
- Ao, C.O.; Meehan, T.K.; Hajj, G.A.; Mannucci, A.J.; Beyerle, G. Lower troposphere refractivity bias in GPS occultation retrievals. J. Geophys. Res. 2003, 108, 4577. [Google Scholar] [CrossRef]
- Kuo, Y.H.; Wee, T.K.; Sokolovskiy, S.V.; Rocken, C.; Schreiner, W.; Hunt, D.; Anthes, R.A. Inversion and Error Estimation of GPS Radio Occultation Data. J. Meteorol. Soc. Japan Ser. II 2004, 82, 507–531. [Google Scholar] [CrossRef]
- Kursinski, E.R.; Hajj, G.A.; Leroy, S.S.; Herman, B. The GPS radio occultation technique. Terr. Atmos. Ocean. Sci. 2000, 11, 53–114. [Google Scholar] [CrossRef]
- Steiner, A.K.; Kirchengast, G.; Foelsche, U.; Kornblueh, L.; Manzini, E.; Bengtsson, L. GNSS occultation sounding for climate monitoring. Phys. Chem. Earth A 2001, 26, 113–124. [Google Scholar] [CrossRef]
- Gorbunov, M.E. Canonical transform method for processing radio occultation data in the lower troposphere. Radio Sci. 2002, 37, 1076. [Google Scholar] [CrossRef]
- Hajj, G.A.; Kursinski, E.R.; Romans, L.J.; Bertiger, W.I.; Leroy, S.S. A technical description of atmospheric sounding by GPS occultation. J. Atmos. Solar-Terr. Phys. 2002, 64, 451–469. [Google Scholar] [CrossRef]
- Ware, R.; Exner, M.; Feng, D.; Gorbunov, M.; Hardy, K.; Herman, B.; Kuo, Y.H.; Meehan, T.; Melbourne, W.; Rocken, C.; et al. GPS sounding of the atmosphere from lower Earth orbit: Preliminary results. Bull. Am. Meteorol. Soc. 1996, 77, 19–40. [Google Scholar] [CrossRef]
- Yunck, T.P.; Liu, C.H.; Ware, R. A history of GPS sounding. Terr. Atmos. Ocean. Sci. 2000, 11, 1–20. [Google Scholar] [CrossRef]
- Wickert, J.; Reigber, C.; Beyerle, G.; Konig, R.; Marquardt, C.; Schmidt, T.; Grunwaldt, L.; Galas, R.; Meehan, T.K.; Melbourne, W.G.; et al. Atmosphere sounding by GPS radio occultation: First results from CHAMP. Geophys. Res. Lett. 2001, 28, 3263–3266. [Google Scholar] [CrossRef]
- Hajj, G.A.; Ao, C.O.; Iijima, B.A.; Kuang, D.; Kursinski, E.R.; Mannucci, A.J.; Meehan, T.K.; Romans, L.J.; de la Torre Juarez, M.; Yunck, T.P. CHAMP and SAC-C atmospheric occultation results and intercomparisons. J. Geophys. Res. 2004, 109, D06109. [Google Scholar] [CrossRef]
- Beyerle, G.; Schmidt, T.; Michalak, G.; Heise, S.; Wickert, J.; Reigber, C. GPS radio occultation with GRACE: Atmospheric profiling utilizing the zero difference technique. Geophys. Res. Lett. 2005, 32, L13806. [Google Scholar] [CrossRef]
- Schreiner, W.; Rocken, C.; Sokolovskiy, S.V.; Syndergaard, S.; Hunt, D. Estimates of the precision of GPS radio occultations from the COSMIC/FORMOSAT-3 mission. Geophys. Res. Lett. 2007, 34, L04808. [Google Scholar] [CrossRef]
- Anthes, R.A.; Bernhardt, P.A.; Chen, Y.; Cucurull, L.; Dymond, K.F.; Ector, D.; Healy, S.B.; Ho, S.P.; Hunt, D.C.; Kuo, Y.H.; et al. The COSMIC/FORMOSAT-3 Mission: Early Results. Bull. Am. Meteorol. Soc. 2008, 89, 313–334. [Google Scholar] [CrossRef]
- Loiselet, M.; Strieker, N.; Menard, Y.; Luntama, J.P. GRAS—MetOp’s GPS-based atmospheric sounder. ESA Bull. 2000, 102, 38–44. [Google Scholar]
- Luntama, J.; Kirchengast, G.; Borsche, M.; Foelsche, U.; Steiner, A.; Healy, S.; von Engeln, A.; O’Clerigh, E.; Marquardt, C. Prospects of the EPS GRAS Mission for Operational Atmospheric Applications. Bull. Am. Meteorol. Soc. 2008, 89, 1863–1876. [Google Scholar] [CrossRef]
- Schreiner, W.S.; Weiss, J.P.; Anthes, R.A.; Braun, J.; Chu, V.; Fong, J.; Hunt, D.; Kou, Y.H.; Meehan, T.; Serafino, W.; et al. COSMIC-2 radio occultation constellation: First results. Geophys. Res. Lett. 2020, 47, e2019GL086841. [Google Scholar] [CrossRef]
- Bai, W.H.; Sun, Y.Q.; Du, Q.F.; Yang, G.L.; Yang, Z.D.; Zhang, P.; Bi, Y.M.; Wang, X.Y.; Cheng, C.; Han, Y. An introduction to the FY3 GNOS instrument and mountain-top tests. Atmos. Meas. Tech. 2014, 7, 1817–1823. [Google Scholar] [CrossRef]
- Liao, M.; Zhang, P.; Yang, G.L.; Bi, Y.M.; Liu, Y.; Bai, W.H.; Meng, X.G.; Du, Q.F.; Sun, Y.Q. Preliminary validation of the refractivity from the new radio occultation sounder GNOS/FY-3C. Atmos. Meas. Tech. 2016, 9, 781–792. [Google Scholar] [CrossRef]
- Bai, W.H.; Liu, C.L.; Meng, X.G.; Sun, Y.Q.; Kirchengast, G.; Du, Q.F.; Wang, X.Y.; Yang, G.L.; Liao, M.; Yang, Z.D.; et al. Evaluation of atmospheric profiles derived from single- and zero-difference excess phase processing of BeiDou radio occultation data from the FY-3C GNOS mission. Atmos. Meas. Tech. 2018, 11, 819–833. [Google Scholar] [CrossRef]
- Shi, J.Q.; Zhang, K.F.; Gao, W.L.; Tong, L.G.; Zhang, M.H. Evaluation of FY-3D Radio Occultation Wet Profiles with Radiosonde Measurements. In Proceedings of the China Satellite Navigation Conference (CSNC 2022), BeiJing, China, 7 May 2022. [Google Scholar] [CrossRef]
- Zhang, P.; Chen, L.; Xian, D.; Xu, Z. Recent progress of Fengyun meteorology satellites. Chin. J. Space Sci. 2018, 38, 788–796. [Google Scholar] [CrossRef]
- Zhang, P.; Hu, X.Q.; Lu, Q.F.; Zhu, A.J.; Lin, M.Y.; Sun, L.; Chen, L.; Xu, N. FY-3E: The first operational meteorological satellite mission in an early morning orbit. Adv. Atmos. Sci. 2022, 39, 1–8. [Google Scholar] [CrossRef]
- Sun, Y.Q.; Liu, C.L.; Du, Q.F.; Wang, X.Y.; Bai, W.H.; Kirchengast, G.; Xia, J.M.; Meng, X.G.; Wang, D.W.; Cai, Y.R.; et al. Global Navigation Satellite System Occultation Sounder II (GNOS II). In Proceedings of the 2017 IEEE International Geoscience and Remote Sensing Symposium (IGARSS), Fort Worth, TX, USA, 23 July 2017. [Google Scholar] [CrossRef]
- National Satellite Meteorological Centre. Document: Guidelines for Use. Available online: http://satellite.nsmc.org.cn/PortalSite/StaticContent/FileDownload.aspx?CategoryID=1&LinkID=667 (accessed on 2 June 2023).
- Smith, E.K.; Weintraub, S. The constants in the equation for atmospheric refractive index at radio frequencies. Proc. IRE 1953, 41, 1035–1037. [Google Scholar] [CrossRef]
- Xu, X.; Zou, X. Comparison of MetOp-A/-B GRAS radio occultation data processed by CDAAC and ROM. GPS Solut. 2022, 24, 34. [Google Scholar] [CrossRef]
- Liu, Y.; Meng, X.G.; Bai, W.H.; Sun, Y.Q.; Liao, M.; Han, Y. Analysis of Beidou Radio Occultation Data from FY-3D Satellite. Chin. J. Space Sci. 2022, 42, 476–484. [Google Scholar] [CrossRef]
- Sun, Y.Q.; Wang, X.Y.; Du, Q.F.; Bai, W.H.; Xia, J.M.; Cai, Y.R.; Wang, D.W.; Wu, C.J.; Meng, X.G.; Tian, Y.S.; et al. The Status and Progress of Fengyun-3e GNOS II Mission for GNSS Remote Sensing. In Proceedings of the IEEE International Geoscience and Remote Sensing Symposium, Yokohama, Japan, 28 July–2 August 2019; pp. 5181–5184. [Google Scholar] [CrossRef]
- National Satellite Meteorological Centre. FY-3E Data Product Launch: Introduction to Atmospheric Temperature Profile (ATP) Products. Available online: https://img.nsmc.org.cn/PORTAL/NSMC/VIDEO/FY3E/20220615/07_RO.PDF (accessed on 21 February 2023).
- Ao, C.O.; Hajj, G.A.; Meehan, T.K.; Dong, D.; Iijima, B.A.; Mannucci, A.J.; Kursinski, E.R. Rising and setting GPS occultations by use of open-loop tracking. J. Geophys. Res. 2009, 114, D04101. [Google Scholar] [CrossRef]
- Xu, X.S.; Guo, P.; Xu, T.L.; Hong, Z.J. Processing of GPS/LEO radio occultation recorded in open-loop mode. Acta Phys. Sin. 2012, 61, 535–542. [Google Scholar] [CrossRef]
- Hu, X.; Liou, Y.A.; Gong, X.Y.; Chiu, T.C.; Yeh, W.H.; Wang, X.; Wu, X.C.; Xiao, C.Y.; Xu, L. Inversion of COSMIC atmospheric open-loop radio occultation data. Chin. J. Geophys. 2009, 52, 2195–2200. [Google Scholar] [CrossRef]
- Yu, X.; Xie, F.Q.; Ao, C.O. Evaluating the lower-tropospheric COSMIC GPS radio occultation sounding quality over the Arctic. Atmos. Meas. Tech. 2018, 11, 2051–2066. [Google Scholar] [CrossRef]
- Ao, C.O. Effect of ducting on radio occultation measurements: An assessment based on high-resolution radiosonde soundings. Radio Sci. 2007, 42, RS200. [Google Scholar] [CrossRef]
- Sokolovskiy, S.V. Effect of superrefraction on inversions of radio occultation signals in the lower troposphere. Radio Sci. 2003, 38, 1058. [Google Scholar] [CrossRef]
- Kursinski, E.R.; Hajj, G.A.; Hardy, K.R.; Romans, L.J.; Schofield, J.T. Observing tropospheric water vapor by radio occultation using the Global Positioning System. Geophys. Res. Lett. 1995, 22, 2365–2368. [Google Scholar] [CrossRef]
- Kuo, Y.H.; Schreiner, W.S.; Wang, J.; Rossiter, D.L.; Zhang, Y. Comparison of GPS radio occultation soundings with radiosondes. Geophys. Res. Lett. 2005, 32, L05817. [Google Scholar] [CrossRef]
- Fan, Z.Q.; Sheng, Z.; Shi, H.Q.; Yi, X.; Jiang, Y.; Zhu, E.Z. Comparative Assessment of COSMIC Radio Occultation Data and TIMED/SABER Satellite Data over China. J. Appl. Meteorol. Climatol. 2015, 54, 1931–1943. [Google Scholar] [CrossRef]
- Gorbunov, M.E. Analysis and validation of Challenging Minisatellite Payload (CHAMP) radio occultation data. J. Geophys. Res. 2003, 108, 4584. [Google Scholar] [CrossRef]
- Beyerle, G.; Gorbunov, M.E.; Ao, C.O. Simulation studies of GPS radio occultation measurements. Radio Sci. 2003, 38, 1084. [Google Scholar] [CrossRef]
- Wei, J.D.; Li, Y.; Zhang, K.F.; Liao, M.; Bai, W.H.; Liu, C.L.; Liu, Y.; Wang, X.M. An Evaluation of Fengyun-3C Radio Occultation Atmospheric Profiles Over 2015–2018. Remote Sens. 2020, 12, 2116. [Google Scholar] [CrossRef]
- Sun, Y.Q.; Bai, W.H.; Liu, C.L.; Liu, Y.; Du, Q.F.; Wang, X.Y.; Yang, G.L.; Liao, M.; Yang, Z.D.; Zhang, X.X.; et al. The FengYun-3C radio occultation sounder GNOS: A review of the mission and its early results and science applications. Atmos. Meas. Tech. 2018, 11, 5797–5811. [Google Scholar] [CrossRef]
- National Satellite Meteorological Centre. FY-3E Data Product Launch: Global Navigation Satellite System Radio Occultation Sounder-II (GNOS-II) Instrument and L1 Product Introduction. Available online: http://img.nsmc.org.cn/PORTAL/NSMC/VIDEO/FY3E/20220107/08_GNOS.PDF (accessed on 18 May 2023).
Figure 1.
The daily number of the FY-3E/GNOS-II occultation events and its global distribution: (a) the daily number of BDS occultation events in 12 months from 1 September 2022 to 31 August 2023; (b) same as (a), but for GPS; (c) the distribution of occultation events on 1 September 2022, which were 268 rising BDS RO events (upward-pointing blue triangle), 277 setting BDS RO events (downward-pointing blue triangle), 263 rising GPS RO events (upward-pointing red triangle), and 249 setting GPS RO events (downward-pointing red triangle).
Figure 2.
The SNR (gray) and the Doppler shift (blue) of BDS and GPS RO events: (a) a setting BDS occultation event in July 2022; (b) a rising BDS occultation event in September 2022; (c,d) two setting and rising GPS occultation events in corresponding months, with OL signal tracking model.
Figure 2.
The SNR (gray) and the Doppler shift (blue) of BDS and GPS RO events: (a) a setting BDS occultation event in July 2022; (b) a rising BDS occultation event in September 2022; (c,d) two setting and rising GPS occultation events in corresponding months, with OL signal tracking model.
Figure 3.
FY-3E RO penetration depths and the number of samples versus latitudes: (a) penetration depths of rising and setting BDS occultations versus latitudes in July 2022; (b) the number of samples for rising and setting BDS occultations versus latitudes in July 2022; (c,d) same as (a,b), but in September 2022; (e–h) same as (a–d), but for GPS occultations.
Figure 4.
Statistics and global maps of the penetration depths for FY-3E RO events from 1 September 2022 to 31 August 2023: (a,b) mean, median, and RMS values of the BDS RO penetration depth and its global map in a latitude-longitude grid; (c,d) same as (a,b), but for GPS RO.
Figure 4.
Statistics and global maps of the penetration depths for FY-3E RO events from 1 September 2022 to 31 August 2023: (a,b) mean, median, and RMS values of the BDS RO penetration depth and its global map in a latitude-longitude grid; (c,d) same as (a,b), but for GPS RO.
Figure 5.
Biases and SDs of FY-3E BDS and GPS RO profiles from 1 September 2022 to 31 August 2023: (a) biases and SDs of refractivity including rising and setting occultations; (b) number of samples corresponding to the refractivity profiles; (c,d) same as (a), but for temperature and specific humidity, respectively.
Figure 6.
Seasonal differences of the FY-3E RO profiles compared with the co-located ERA5 data between 1 September 2022 and 31 August 2023: (a–d) biases and SDs of BDS and GPS occultations refractivity, number of samples corresponding to the refractivity profiles, biases and SDs of BDS and GPS occultations temperature, and biases and SDs of BDS and GPS occultations specific humidity over the northern hemisphere; (e–h) same as (a–d), but over the southern hemisphere.
Figure 7.
Biases and SDs between the FY-3E RO profiles with the co-located ERA5 data over the northern hemisphere (30°N~90°N), tropics (30°N~30°S), and the southern hemisphere (30°S~90°S): (a) biases and SDs of the refractivity in three different latitude bands; (b) number of samples corresponding to the refractivity profiles; (c) same as (a), but for temperature; (d) same as (a), but for specific humidity.
Table 1.
Statistic of BDS occultations penetrating depths from July to November in 2022.
Table 1.
Statistic of BDS occultations penetrating depths from July to November in 2022.
| BDS | <4 km | 4–8 km | 8–12 km | 12–16 km | >16 km |
|---|
| July | 16.6% | 44.7% | 23.6% | 9.6% | 5.5% |
| August | 50.5% | 25.8% | 13.6% | 5.3% | 4.3% |
| September | 88.3% | 8.4% | 0.6% | 0.2% | 1.1% |
| October | 89.4% | 7.1% | 0.4% | 0.2% | 1.3% |
| November | 88.2% | 7.8% | 0.5% | 0.3% | 1.3% |
Table 2.
Statistic of GPS occultations penetrating depths from July to November in 2022.
Table 2.
Statistic of GPS occultations penetrating depths from July to November in 2022.
| GPS | <4 km | 4–8 km | 8–12 km | 12–16 km | >16 km |
|---|
| July | 88.7% | 5.7% | 2.3% | 0.7% | 1.2% |
| August | 92.8% | 3.6% | 1.0% | 0.4% | 0.9% |
| September | 94.8% | 2.4% | 0.4% | 0.2% | 0.8% |
| October | 95.6% | 1.8% | 0.3% | 0.1% | 0.7% |
| November | 94.5% | 2.5% | 0.3% | 0.2% | 0.8% |
Table 3.
Mean biases and SDs of refractivity with respect to ERA5 profiles for FY-3E RO from 1 September 2022 to 31 August 2023.
Table 3.
Mean biases and SDs of refractivity with respect to ERA5 profiles for FY-3E RO from 1 September 2022 to 31 August 2023.
| Refractivity (%) | 0–40 km | 5–25 km |
|---|
| Mean Bias | Mean SD | Mean Bias | Mean SD |
|---|
| BDS setting | −0.04 | 1.24 | −0.11 | 0.75 |
| BDS rising | −0.14 | 1.97 | −0.18 | 1.38 |
| GPS setting | 0.16 | 1.94 | 0.19 | 1.73 |
| GPS rising | −0.29 | 1.87 | −0.19 | 1.21 |
Table 4.
Mean biases and SDs of temperature with respect to ERA5 profiles for FY-3E RO from 1 September 2022 to 31 August 2023.
Table 4.
Mean biases and SDs of temperature with respect to ERA5 profiles for FY-3E RO from 1 September 2022 to 31 August 2023.
| Temperature (K) | 0–40 km | 5–25 km |
|---|
| Mean Bias | Mean SD | Mean Bias | Mean SD |
|---|
| BDS setting | 0.6 | 1.4 | 0.04 | 1.0 |
| BDS rising | 0.6 | 1.6 | 0.02 | 1.2 |
| GPS setting | 0.6 | 1.6 | 0.003 | 1.2 |
| GPS rising | 0.6 | 1.8 | −0.03 | 1.2 |
| Disclaimer/Publisher’s Note: The statements, opinions and data contained in all publications are solely those of the individual author(s) and contributor(s) and not of MDPI and/or the editor(s). MDPI and/or the editor(s) disclaim responsibility for any injury to people or property resulting from any ideas, methods, instructions or products referred to in the content. |
© 2023 by the authors. Licensee MDPI, Basel, Switzerland. This article is an open access article distributed under the terms and conditions of the Creative Commons Attribution (CC BY) license (https://creativecommons.org/licenses/by/4.0/).


