Article

Remote Sensing-Based Simulation of Snow Grain Size and Spatial–Temporal Variation Characteristics of Northeast China from 2001 to 2019

1
Key Laboratory of Land Surface Pattern and Simulation, Institute of Geographic Sciences and Natural Resources Research, CAS, Beijing 100101, China
2
Heilongjiang Province Key Laboratory of Geographical Environment Monitoring and Spatial Information Service in Cold Regions, Harbin Normal University, Harbin 150025, China
3
Jiangsu Key Laboratory of Agricultural Meteorology, School of Applied Meteorology, Nanjing University of Information Science and Technology, Nanjing 210044, China
*
Author to whom correspondence should be addressed.
Remote Sens. 2023, 15(20), 4970; https://doi.org/10.3390/rs15204970
Submission received: 25 July 2023 / Revised: 29 September 2023 / Accepted: 5 October 2023 / Published: 15 October 2023
(This article belongs to the Special Issue Monitoring Cold-Region Water Cycles Using Remote Sensing Big Data)

Abstract

:
The size of snow grains is an important parameter in cryosphere studies. It is the main parameter affecting snow albedo and can have a feedback effect on regional climate change, the water cycle and ecological security. Larger snow grains increase the likelihood of light absorption and are important for passive microwave remote sensing, snow physics and hydrological modelling. Snow models would benefit from more observations of surface grain size. This paper uses an asymptotic radiative transfer model (ART model) based on MOD09GA ground reflectance data. A simulation of snow grain size (SGS) in northeast China from 2001 to 2019 was carried out using a two-channel algorithm. We verified the accuracy of the inversion results by using ground-based observations to obtain stratified snow grain sizes at 48 collection sites in northeastern China. Furthermore, we analysed the spatial and temporal trends of snow grain size in Northeastern China. The results show that the ART model has good accuracy in inverting snow grain size, with an RMSD of 65 μm, which showed a non-significant increasing trend from 2001 to 2019 in northeast China. The annual average SGS distribution ranged from 430.83 to 452.38 μm in northeast China, 2001–2019. The mean value was 441.78 μm, with an annual increase of 0.26 μm/a, showing a non-significant increasing trend and a coefficient of variation of 0.014. The simulations show that there is also intermonth variation in SGS, with December having the largest snow grain size with a mean value of 453.92 μm, followed by January and February with 450.77 μm and 417.78 μm, respectively. The overall spatial distribution of SGS in the northeastern region shows the characteristics of being high in the north and low in the south, with values ranging from 380.248 μm to 497.141 μm. Overall, we clarified the size and distribution of snow grains over a long time series in the northeast. The results are key to an accurate evaluation of their effect on snow–ice albedo and their radiative forcing effect.

1. Introduction

Snow cover is a widespread type of surface coverage on the Earth and has a significant impact on the global energy balance through its high albedo [1]. Snow grain size, density, snow surface impurities and snow moisture content are the main factors affecting snow reflectivity, of which SGS is an important parameter causing changes in snow reflectivity, and SGS has an important influence on the reflectivity characteristics of snow in the near-infrared band [2,3,4,5,6]. Changes in SGS can cause changes in the absorption of solar radiation by snow cover, which in turn can have a feedback effect on regional climate change, the hydrological cycle and ecological security [7,8,9]. The sixth IPCC’s Assessment Report notes that the northern hemisphere snowpack has been shrinking since the mid-20th century, with shorter snow cover periods and significantly earlier snowmelt, particularly in the mid- and high-latitude regions [10]. Variations in SGS play a key role in regulating the reflectance of snow in the visible band, which in turn affects the duration of seasonal snow accumulation [11,12,13]. In addition, SGS is important for passive microwave remote sensing, radar and laser altimetry, as well as the physical and hydrological modelling of snow cover [14,15]. The spatial–temporal variation in SGS production in urban areas, which are areas subject to greater anthropogenic disturbance, has attracted widespread scholarly attention in the context of climate change.
At present, the observation of SGS at home and abroad is mainly based on manual sampling and observation in the field, which, due to the geographical environment and the limitations of the observation instruments, has not formed a periodic observation [16]. In addition, due to the diversity and complexity of snow grain shapes in snow cover, SGS is ambiguous and difficult to determine from field observations [15,17]. The macroscopic, rapid, all-day, all-weather periodicity of remote sensing provides the best way to obtain SGS parameters [18,19,20]. Establishing a relationship between snow grain size and its spectrum is at the heart of snow grain size inversion, which has been studied by scientists since the 1980s [21]. A large number of SGS inversion models have been developed over the last 30 years, and as remote sensing techniques have evolved, the algorithms and techniques for inversion have become increasingly fast, efficient and accurate [22,23,24]. The retrievals of SGS from spaceborne multispectral observations usually rely on snow radiative transfer models [25]. In the early period, Wiscombe et al. (1980) used the Wiscombe–Warren model and NOAA-6 Very High Resolution Radiometer (AVHRR) data to derive the potential for using remote sensing data to estimate snow grain size [26]. Nolin et al. (1993) developed a new SGS inversion algorithm (Nolin–Dozier model) based on Airborne Visible Infrared Imaging Spectrometer (AVIRIS) data, and subsequently some scholars used Hyperion data combined with a Discrete Radiative Transfer Model (DISORT) to invert SGS with good results [27]. Subsequently, some scholars have used TM remote sensing data to invert the snow grain size, but the accuracy of the inversion is not very high due to the small number of wavelengths of satellite sensors and their lack of sensitivity to snow grain size [28,29,30]. With the advent of hyperspectral imagery and improvements in radiometric asymptotic models, more accurate snow grain size inversion models have emerged [31,32,33,34,35]. Based on the WW and DISORT models, many improved models and algorithms have been derived, such as the single-channel inversion algorithm, the scaling band algorithm and the MODSCAG model [36,37].
However, both the WW and DISORT models treat snow grain sizes as equivalent spheres and use the Mie scattering theory to calculate the scattering characteristics of individual snow grains. In reality, the snow grains are irregular, and this simulation differs from the actual snow field [38,39,40]. Therefore, the development of a radiative transfer model for non-spherical SGS and, therefore, the development of an inversion algorithm for non-spherical SGS have arisen [41,42,43]. Kokhanovsky and Zege (2004) developed the Asymptotic Radiative Transfer (ART) model, which takes into account both snow grain shape and snow contamination, to address the weak absorption properties of a snow layer [44]. They see a snow layer as a multiple scattering dense medium made up of irregularly shaped non-uniform grains. The inversion based on non-spherical grains has proven to be highly accurate [45].
In summary, the existing remote sensing inversion studies of SGS are mainly focused on the polar regions, the Qinghai–Tibetan plateau and the northern border of China [46,47]; these natural areas are less disturbed by anthropogenic activities, and all the comparison results show that the order of magnitude is basically the same. The northeast is the second-largest stable snow area in China, with a large and long-lasting snow cover [48]. In addition, the northeast is a heavy industrial base in China, with a high population density and a high impact from coal-fired heating in winter, making it one of the more polluted areas in winter and spring. Therefore, this paper focuses on urban areas that are disturbed by human activities and attempts to invert the large-scale snow grain size distribution based on remote sensing information. In this paper, we simulate and analyse the spatial and temporal distribution of SGS and its variation in northeast China by using the progressive radiative transfer model (ART model), remote sensing image data, ArcGIS and other spatial analysis methods. This acts as a basis for the study of early snowmelt and increased spring drought in the northeast, especially in the Sanjiang and Songneng plains.

2. Materials and Methods

2.1. Study Area

The study area includes the provinces of Heilongjiang, Jilin and Liaoning and is located in northeastern China (excluding the four cities of Mengdong), between 37 and 53°N and 115 and 135°E (Figure 1). It has a temperate monsoon climate, but due to its high latitude, its winters are cold and long, snow falls in winter, evaporation is low and the climate is humid. The northeast is the second largest stable snow area in China, with the largest range of stable snow areas and average snow depths, with snow periods ranging from 30 to 190 d from south to north. The annual accumulated snow depth in the northeast is 498 cm, distinguishing it from other snow areas by its large average annual snow storage capacity and the most pronounced interannual variability [49]. The north-eastern part of the region is dominated by forests and grasslands, with the Daxinganling in the northwestern part of Heilongjiang, the Xiaoxinganling in the north, the Changbai Mountains in the northwestern part of Heilongjiang, Jilin and Liaoning, and the fertile Songnun Plain, the Sanjiang Plain and the Liaohe Plain in the middle, which are important food-producing areas in China [50]. It is an important grain-producing region in China. In addition, the northeast is one of the most polluted regions in China in winter, as it is a heavy industrial base and densely populated [51].

2.2. Remote Sensing Data

MODIS is an important sensor on board the Terra and Aqua satellites, providing 36 channels of observations from the visible (0.4 μm) to the thermal infrared (14.4 μm) band. The MODIS data used in this study include the MOD09GA Day-By-Day Surface Reflectance product data. The MOD09GA (L2G Collection6) Terra Global Day-by-Day Surface Reflectance product is provided by NASA (https://search.earthdata.nasa.gov, accessed on 9 July 2022) [52]. The time frame used is from January 2001 to December 2019 (1 October–31 March of each year). The track numbers are h25v03, h26v03, h26v04, h27v04 and h27v05. The data format is the HDF.Cloud-based geospatial data processing platform, and the data are uniformly projected from the sinusoidal projection to the WGS84 projection. The MOD09GA (V6) data pre-processing process includes data format conversion, resampling, reprojection, stitching and cropping. The dataset was corrected by atmospheric bidirectional reflection and solar altitude angle.

2.3. Field Measurement Data

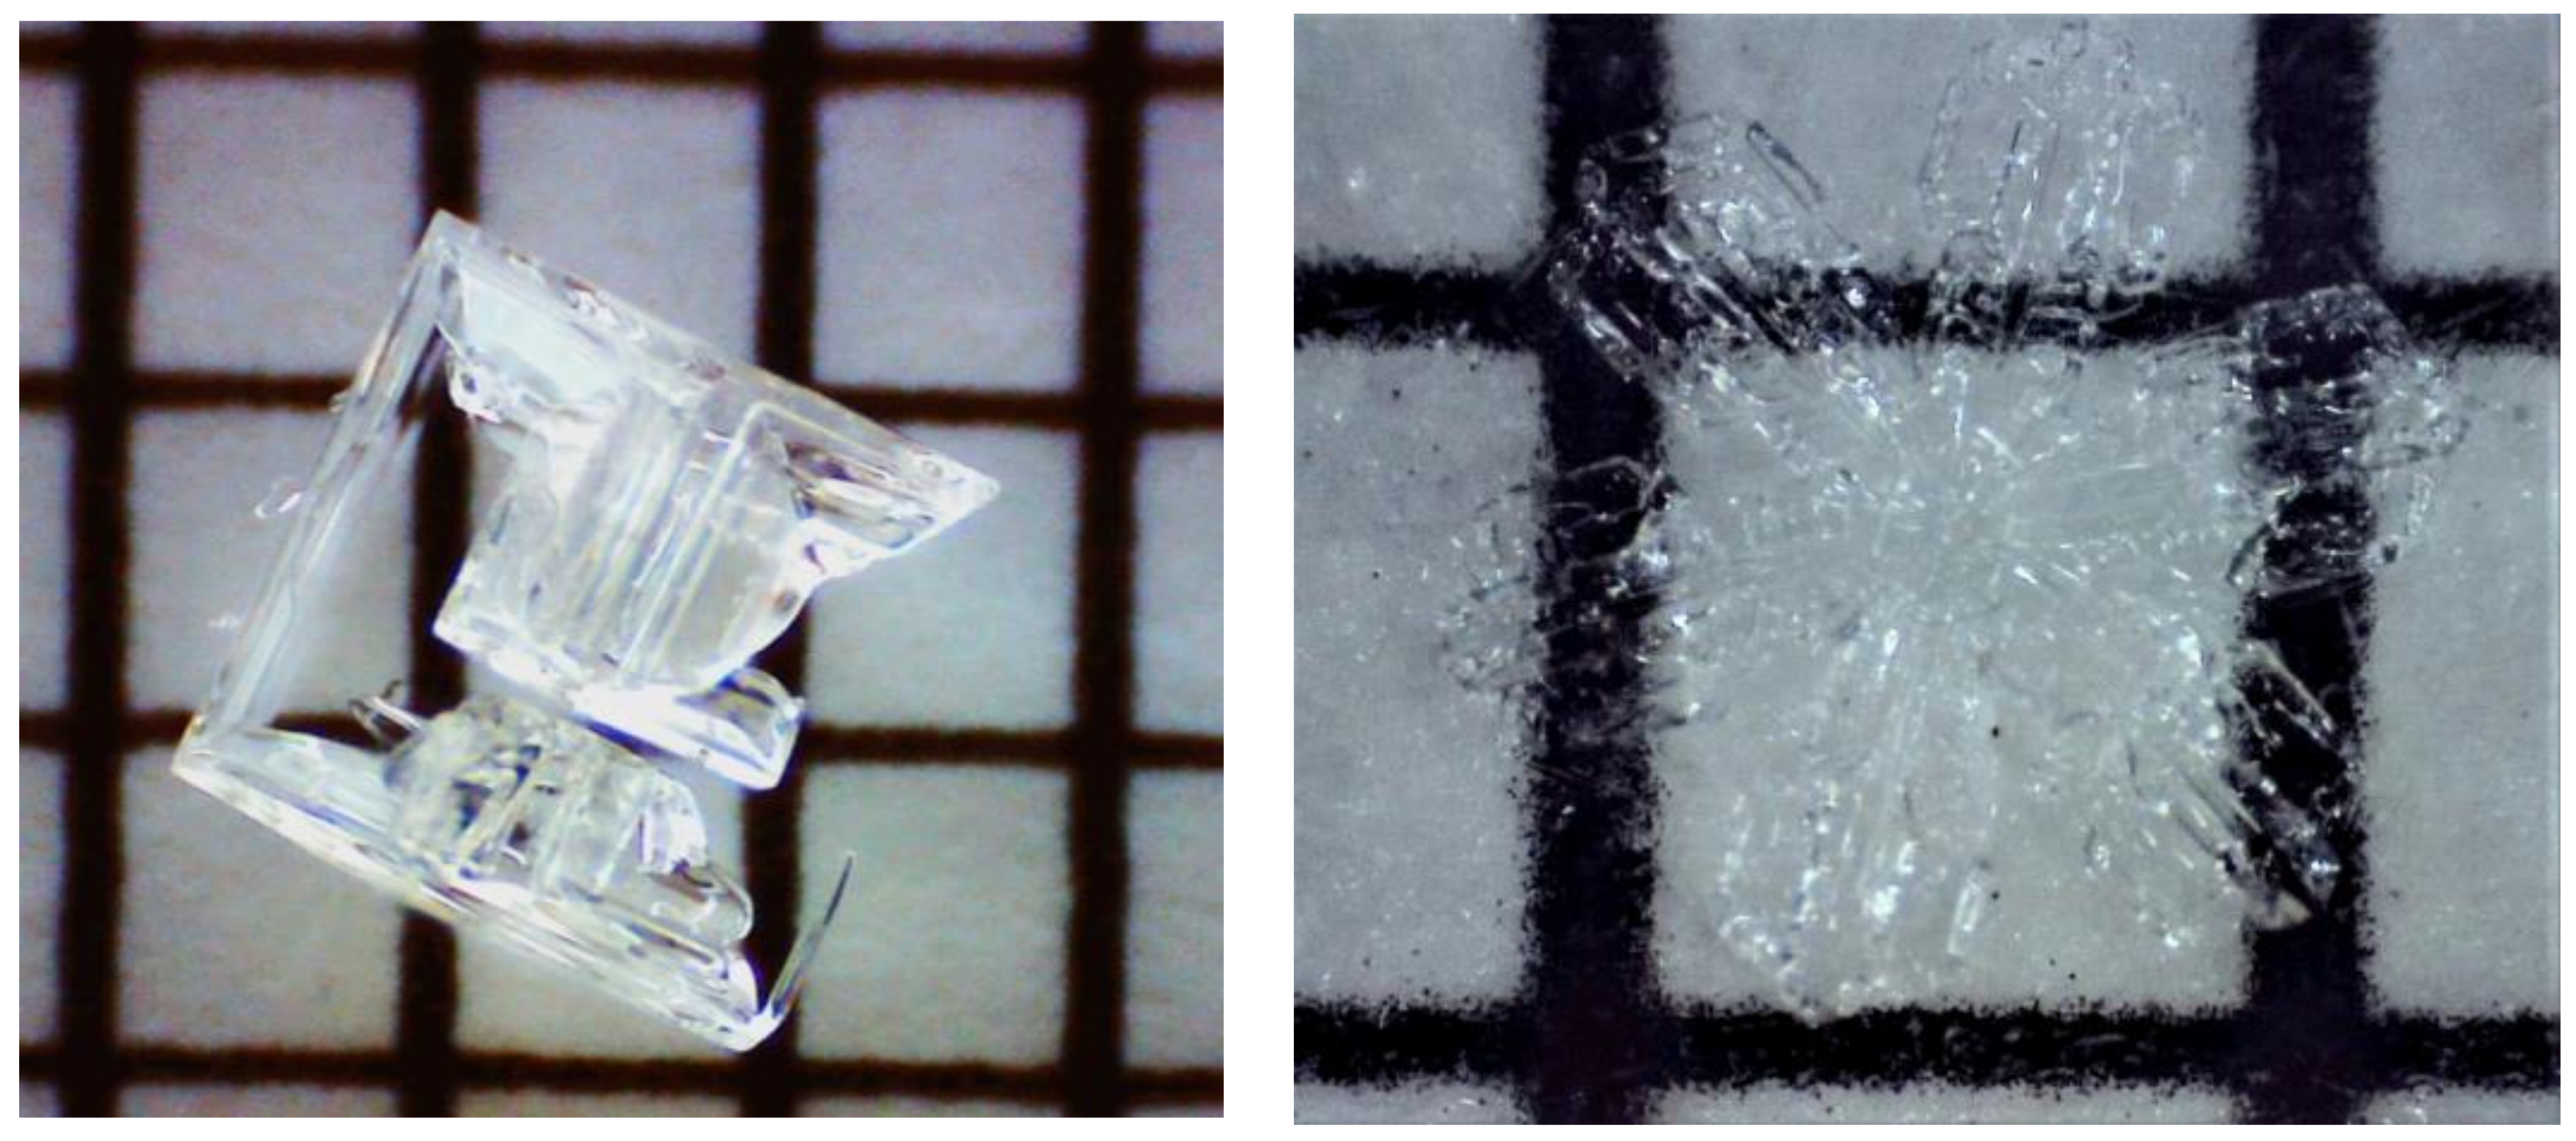
The ground validation data are mainly field observations of snow grain size (Figure 2 and Figure 3). To validate the model, three field fixations were conducted in January 2014 and December and February 2018, with a total of 48 sampling points, including 28 points in 2014 and 20 points in 2018. The average depth of snow observed in the field was 165 cm, and the average density was 243 g/cm3. Clean shovels were used to collect snow samples (5 cm depth) from the snow surface. In addition, attention was paid to not collect debris such as leaves when sampling. Due to the aging nature of the snowpack, there are obvious differences in the SGS between different snow layers, and we carried out stratified sampling based on the natural stratification boundary between old and new snow in the snowpack profile. The physical characteristics of each layer of snow, such as its depth and density, were also recorded. Snow grain size increases with depth and decreases with density. The snow grain size was determined using a high-power photographic microscope (Anyty, Tianjin, China) and a snow grain size plate (manufactured by the Institute of Cold and Drought, Chinese Academy of Sciences). The measurement accuracy was 0.1 mm. After the observation, the index values were recorded.

2.4. Snow Image Element Discrimination

This paper calculates the normalised difference snow index NDSI based on MODIS ground albedo data and uses the SNOWMAP method to extract the snow image elements from the MODIS data. Snow has high reflectance in the visible and near-infrared bands, with reflectance above 80% at around 0.2 μm, while the reflectance of other features is generally below 30%, so it is relatively easy to distinguish snow from most features. Clouds have similar spectral characteristics to snow in the visible band, while in the near-infrared band they are more different. The normalised difference snow index (NDSI), based on reflectance characteristics, is the best technique for extracting snow information because it is universally applicable and has the advantages of high accuracy and reasonable classification. The NDSI is similar to the NDVI in that it is insensitive to a wide range of light conditions, locally normalised to atmospheric effects and does not depend on a single channel. Hall et al. give a complete definition of the NDSI applied to MODIS to identify snow [53], which is calculated as shown in Equation (1):
N D S I = R ( b 4 ) R ( b 6 ) R ( b 4 ) + R ( b 6 )
where NDSI is the normalised difference snow accumulation index, R(b4) and R(b6) represent the ground reflectance in the 4th band (0.545–0.565 μm visible band) and 6th band (1.628–1.652 μm near-infrared band) of the MODIS data, respectively.
Hao et al. (2008) analysed the NDSI threshold and found that the larger the snow area the closer the NDSI threshold was to 0.4. Since the study area chosen for this study is the northeast China region [54], which has a more stable snow-covered area, the NDSI threshold is chosen here to be 0.4. If the conditions of NDSI ≧ 0.4 and MODIS band 2 (0.841–0.876 μm) ≧ 0.11 are also met, then the image elements in the region are judged to be snow-covered. This threshold discrimination method prevents areas of clear water, dense vegetation, shadows and low-light conditions from being misclassified as snow. The principle is that clear water has an NDSI greater than 0.4, but it only reflects radiant energy in the visible band and absorbs radiant energy in other bands, so the MODIS band 2 value can be used to distinguish between snow and clear water. Snow in MODIS band 2 has a value of ≧0.11, but water absorbs radiant energy in this band and its value in band 2 will not be greater than 0.11.
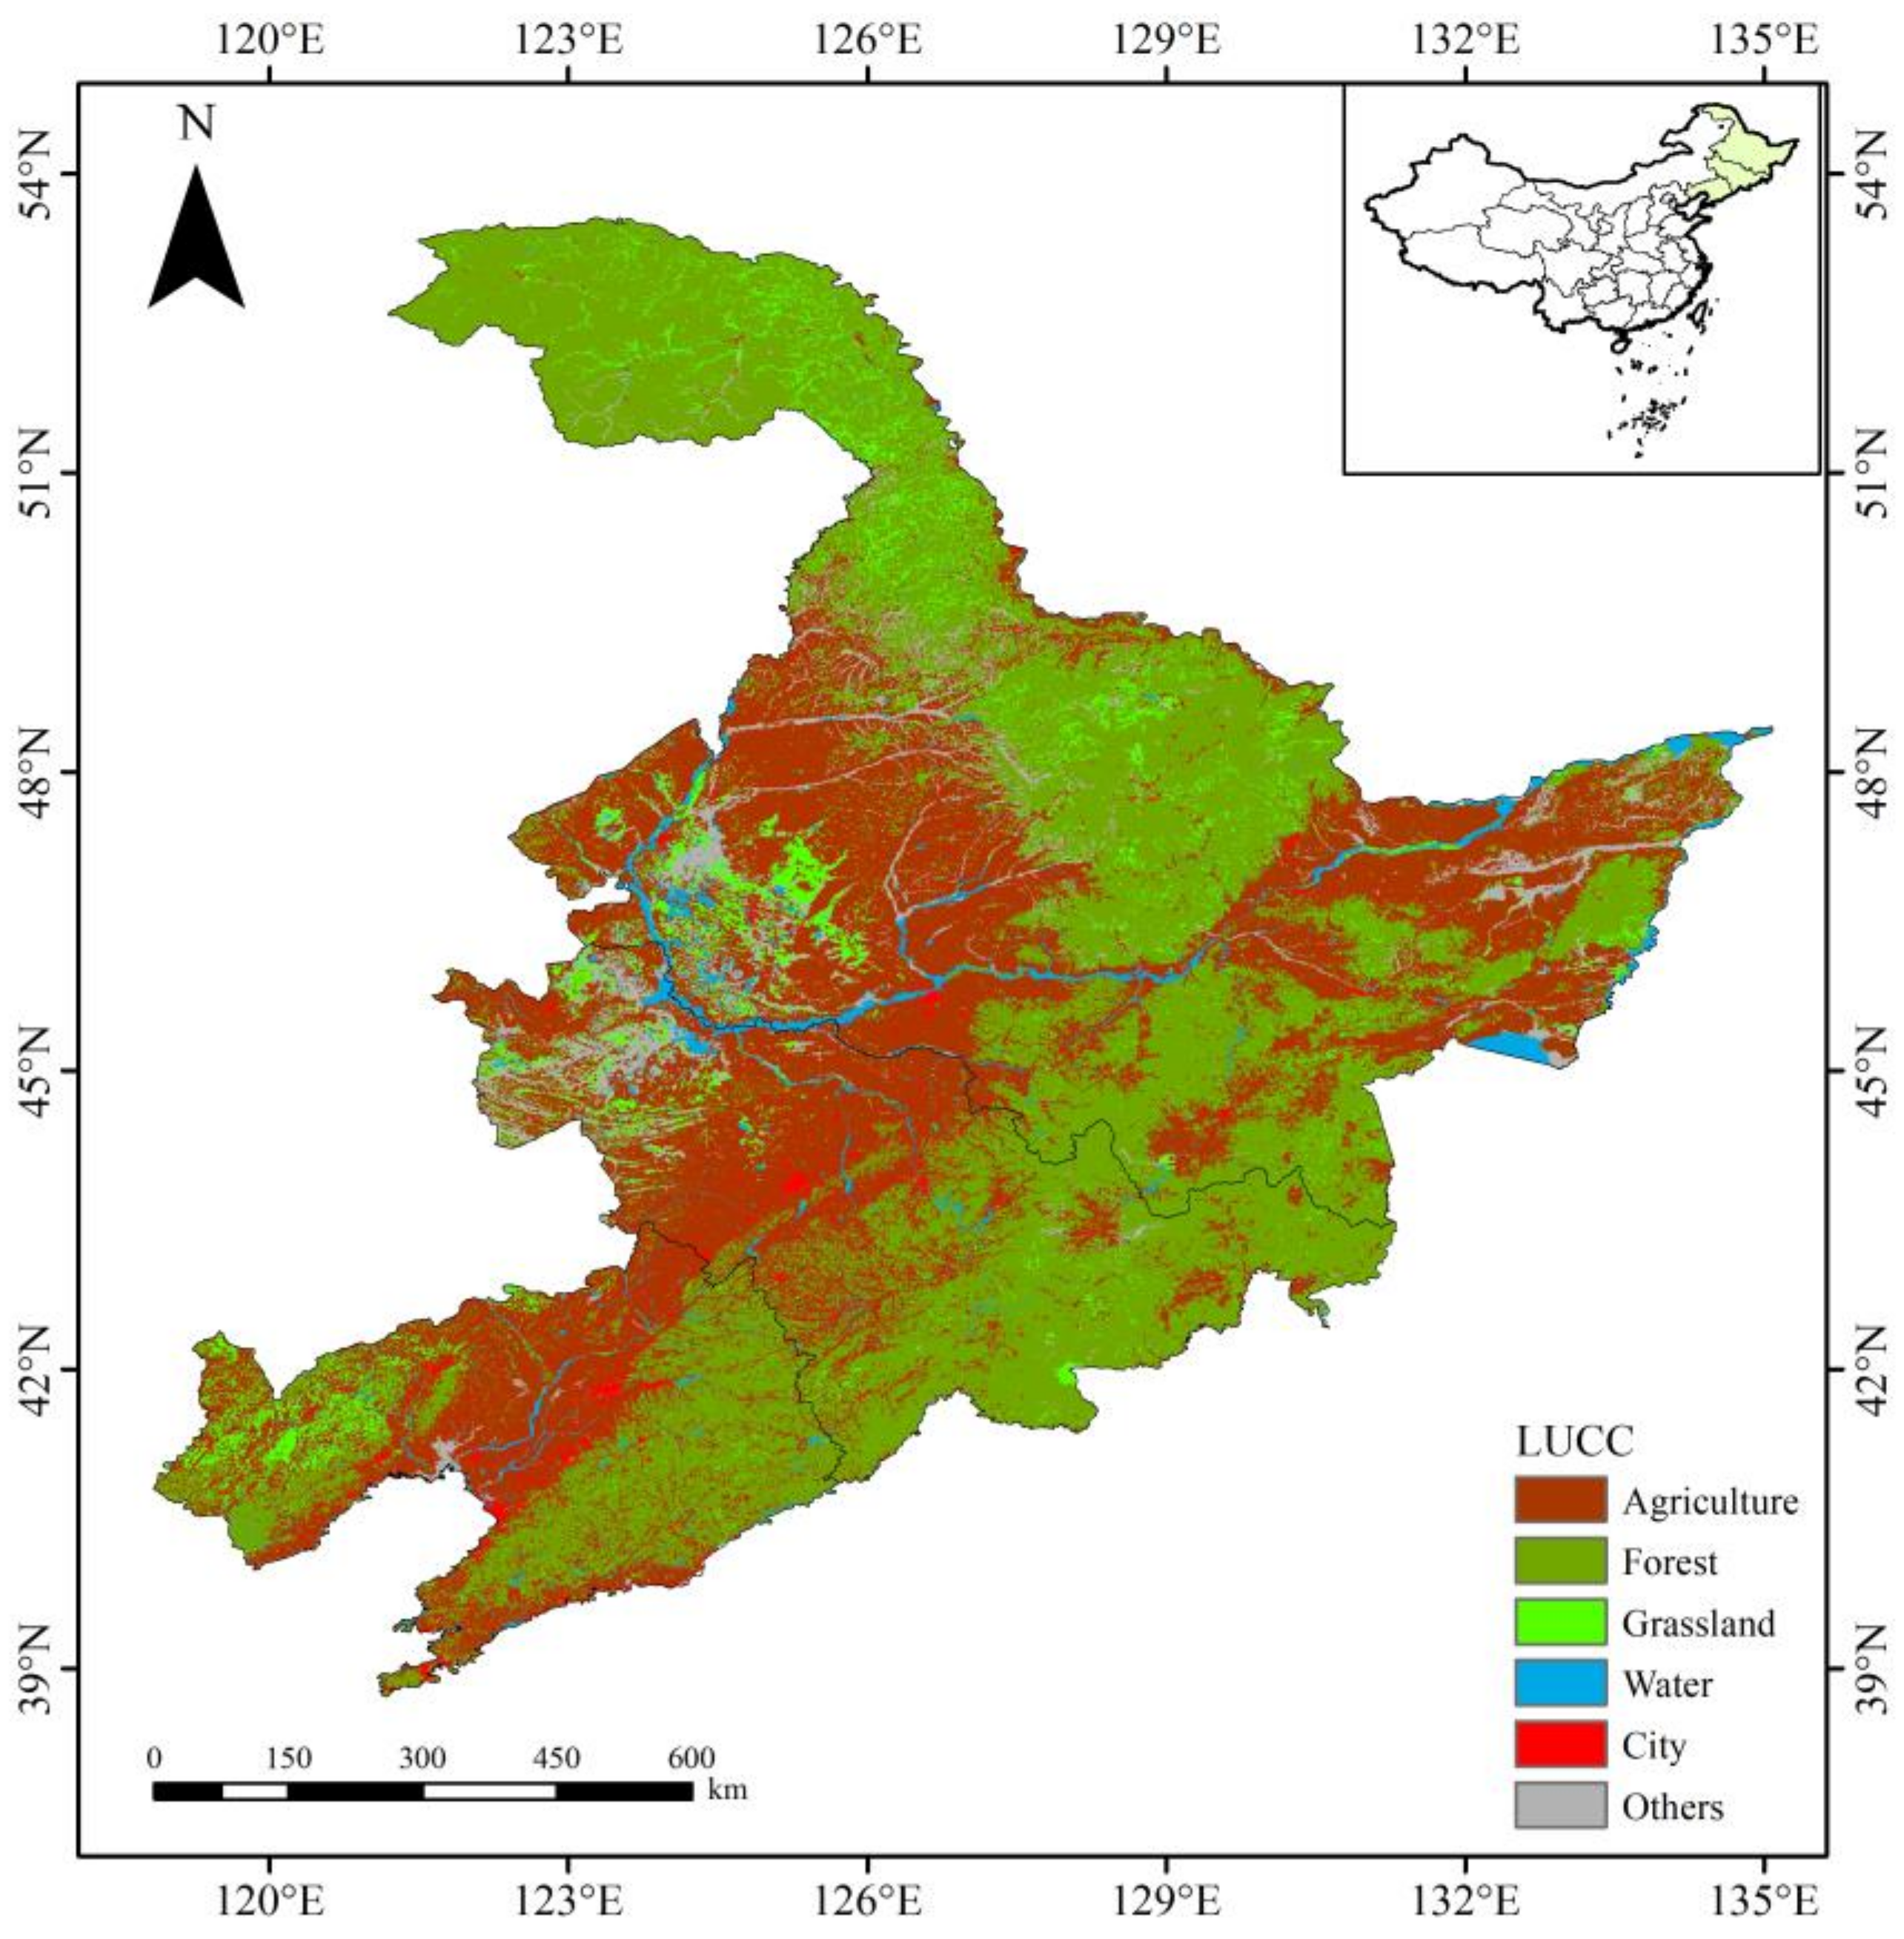
Vegetation distribution and possible topographic features have an important influence on the inversion of SGS. Tree cover and low-level vegetation protrusions in snowpacks can significantly alter surface reflectance in all optical bands, and thus can complicate remote sensing-based estimates of snowpack optical and physical properties. For dense vegetation, shadows and low-light condition areas (referred to as dark targets), their reflectance of visible light is very low; MODIS band 4 is the visible band, so the value of dark targets in this band is much less than 0.1, the denominator of the NDSI formula is very small and if the value of band 4 increases slightly, the value of NDSI will be much greater than 0.4 and these dark targets will be misjudged as snow. However, the value of the dark target in band 4 is much less than 0.1 and does not satisfy the discrimination condition, so it will not be misclassified as snow. We combined the MCD12C1 surface-cover-type data (Figure 4) to mask the dark targets, such as forests, in northeast China, and also mask the water bodies to maximize the removal of feature targets that affect the albedo of snow to ensure the accuracy of the inversion. The SNCIAR model was used to simulate continuous spectral albedo for several sets of different conditions, which was compared with the SGS inverted from MODIS data. The MODIS data used are geometrically, radiometrically and atmospherically corrected.
For MODIS data, the NIR band used in the SNOWMAP algorithm to remove the effects of water bodies is band 2, and the snow accumulation image element discriminant formula is as follows:
N D S I 0.4 b 2 0.1 b 4 0.1

2.5. ART Model Algorithm and Parameters

The ART model is a simplified radiative transfer model developed by Kokhanovsky and Zege [55], driven by data mainly on visible and near-infrared ground reflectance, solar zenith angle, observed zenith angle and relative azimuth [40]. The model enables an estimation of snowpack properties on regional and global scales, i.e., effective snowpack grain size. Kokhanovsky and Zege have performed several validations and parameter corrections through the ART model and have successfully applied it on point and regional scales such as the Arctic, Greenland, the Alps, Japan, the Himalayas, and the Chinese region. The model is concise, efficient and flexible as it uses geometric optical equations to calculate the optical characteristics of individual grains and then uses an asymptotic analysis to obtain an asymptotic analytical solution to the radiative transfer model. For each grid, the ART model utilises a two-channel (channel 1, 0.443 μm; channel 2, 0.865 μm) algorithm to simultaneously calculate the daily values of c in mm and ng/g using the formula.
R 1 = R 0 exp 4 f ( μ , μ 0 , φ ) 3 ( 1 g ) 2 3 B α s , 1 c α e f
R 2 = R 0 exp 4 f ( μ , μ 0 , φ ) 3 ( 1 g ) α i , 2 β K α e f + 2 3 B α s , 2 c α e f
The significance and units of the parameters in Equations (3) to (4) are shown in Table 1. R is snow reflectivity in channel 2 semi-infinite space.
(1)
Semi-infinite space snow layer reflectivity function
R 0 ( μ , μ 0 , ϕ ) is the snow reflectance factor of a weakly absorbing surface, which can be calculated from the Fourier component of the visible band assuming that its single scattering albedo is equal to 1 and that the snow grains are second-generation Koch fractal grains (Table 2). The approximate analytical formula given analytically by Kokhanovsky et al., is as follows:
R 0 ( μ , μ 0 , φ ) = A + B ( μ + μ 0 ) + C μ μ 0 + p ( θ ) 4 ( μ + μ 0 )
Of these, the phase function, P(θ), determines the semi-infinite weakly absorbing snow layer reflectivity, which is strongly influenced by the single scattering, especially at oblique incidence (solar zenith angles greater than 70°). The phase function, in turn, strongly depends on the grain shape. In the framework of geometrical optics, when the grain is much larger than the wavelength, the phase function is completely bounded by the grain shape and the real part of the refractive index. Since the real part of the ice refractive index has a weak spectral dependence in the visible and near-infrared spectra, the spectral variation in the phase function and its resulting spectral variation in the function R 0 ( μ , μ 0 , ϕ ) is negligible, i.e., the phase function does not depend on the wavelength and therefore the function R 0 ( μ , μ 0 , ϕ ) is the same over the entire spectral range. The phase function P(θ) is calculated as follows:
P ( θ ) = 11.1 exp ( 0.087 θ ) + 1.1 exp ( 0.014 θ )
where θ is defined as
θ = a cos ( μ μ 0 + s s 0 cos φ ) ,   s = sin ( ϑ ) ,   s 0 = sin ( ϑ 0 ) . μ 0 = C O S ( ϑ 0 ) ,   μ = C O S ( ϑ ) .
(2)
Parameter f ( μ , μ 0 , φ ) of the calculation
The parameter f is determined by both the escape function and the semi-infinite space snow reflectivity function, which is calculated as follows:
f ( μ , μ 0 , φ ) = u ( μ 0 ) u ( μ ) R 0 ( μ , μ 0 , φ )
u ( μ 0 ) is called the escape function in the radiative transfer model and represents the angular distribution of light escaping from non-absorbing matter in semi-infinite space in the framework of the Milne problem. The asymptotic radiative transfer model is solved according to the following empirical formula:
u ( μ 0 ) = 3 7 ( 1 + 2 μ 0 ) , u ( μ ) = 3 7 ( 1 + 2 μ ) .
(3)
Absorption coefficients of ice crystals
Kokhanovsky and Zege et al., suggest that light absorption by the snow layer in the visible band (i.e., channel 1) is mainly due to light absorption by pollutants (mainly black carbon); in the near-infrared band (i.e., channel 2), light absorption by the snow layer is mainly due to light absorption by ice crystal snow grains and black carbon [53].
The expression for the light absorption coefficient, α i , 2 , of an ice crystal is
α i c e , 2 = 4 χ i c e ( λ ) / λ
where χ i c e ( λ ) is the imaginary part of the complex refraction index of ice as a function of wavelength; here, we use measurements by Warren et al., (Warren, 1984).
(4)
Asymmetry factor
The asymmetry factor is the average cosine of the phase function of the medium with a value range of [−1,1], which depends on the grain shape. For very strong forward scattering, the asymmetry factor is close to +1. The asymmetry factor does not depend on the imaginary part of the SGS and refractive index but on the real part of its shape and refractive index. For dry snow, the effect of wavelength on the asymmetry parameter is very small, so that g is considered to be independent of wavelength by Zege et al. Kokhanovsky found that the assumption of the shape of non-spherical snow grains (columnar, fractal, Koch) does not have a significant effect on the snow layer reflectivity simulations, so that the asymmetry factor can be viewed as a single value for all non-spherical snow grains. In the ART model, the asymmetry parameter g (g = 0.76) for fractal grains in the visible region was used as a constant in the calculations.

2.6. Spatial Interpolation Analysis Method

Through the ArcGIS 10.8 (Environmental Systems Research Institute, Inc., Esri, San Francisco, CA, USA) grid module and spatial analyst module, the spatial distribution characteristics of BC in study area were statistically calculated. In this paper, we used the kriging interpolation method to analyse the spatial distribution. Kriging is a regression algorithm for the spatial modelling and prediction (interpolation) of random processes/random fields based on covariance functions.
Z x 0 = n i = 0 λ i Z x i
where Z x 0 is the unknown sample point value, Z x i is the known sample point value around the unknown sample point, λ i is the weight of the i th known sample point on the unknown sample point, and n is the number of known sample points. Kriging is based on the data of several known sample points in a finite proximity to the sample point to be estimated and takes into account the size, shape and spatial location of the sample points, as well as the structural information provided by the variation function, making maximum use of the information provided by spatial sampling. It is therefore more accurate and realistic than other methods.

3. Result

3.1. Model Verification

We verified the accuracy of the simulated values by comparing the simulated SGSs with the measured values. Since the measured value had an uncertain range, as long as the simulated value was distributed within the range of the measured value, we could consider the simulation result credible. The modelled snow grain sizes were 430.83–452.384 μm, while the range of the snow grain sizes obtained from in situ measurements in the field was 105–560 μm. The snow grain size inversion results were, on average, 26 μm larger than the in situ measurements. The deviation of the analogue value from the measured value was less than 10%. Depending on the year, the measurements and simulations showed a linear correlation between Pearson’s correlation (r) between 0.65 and 0.77 (Table 3). We further added a portion of secondary data for model validation. Xin W et al. (2020) modelled the snow grain size (SGS) of the snowpack in northern China, and the results of the study showed that the mean value of the SGS in the whole northern region was 241.38 μm, and the maximum value was 381.2 μm. In this paper, the average value of simulated snow particle size is in the same order of magnitude, and the difference is not significant, so the simulation results are considered to be credible.

3.2. Temporal Distribution and Variation Characteristics of SGS in Northeastern China

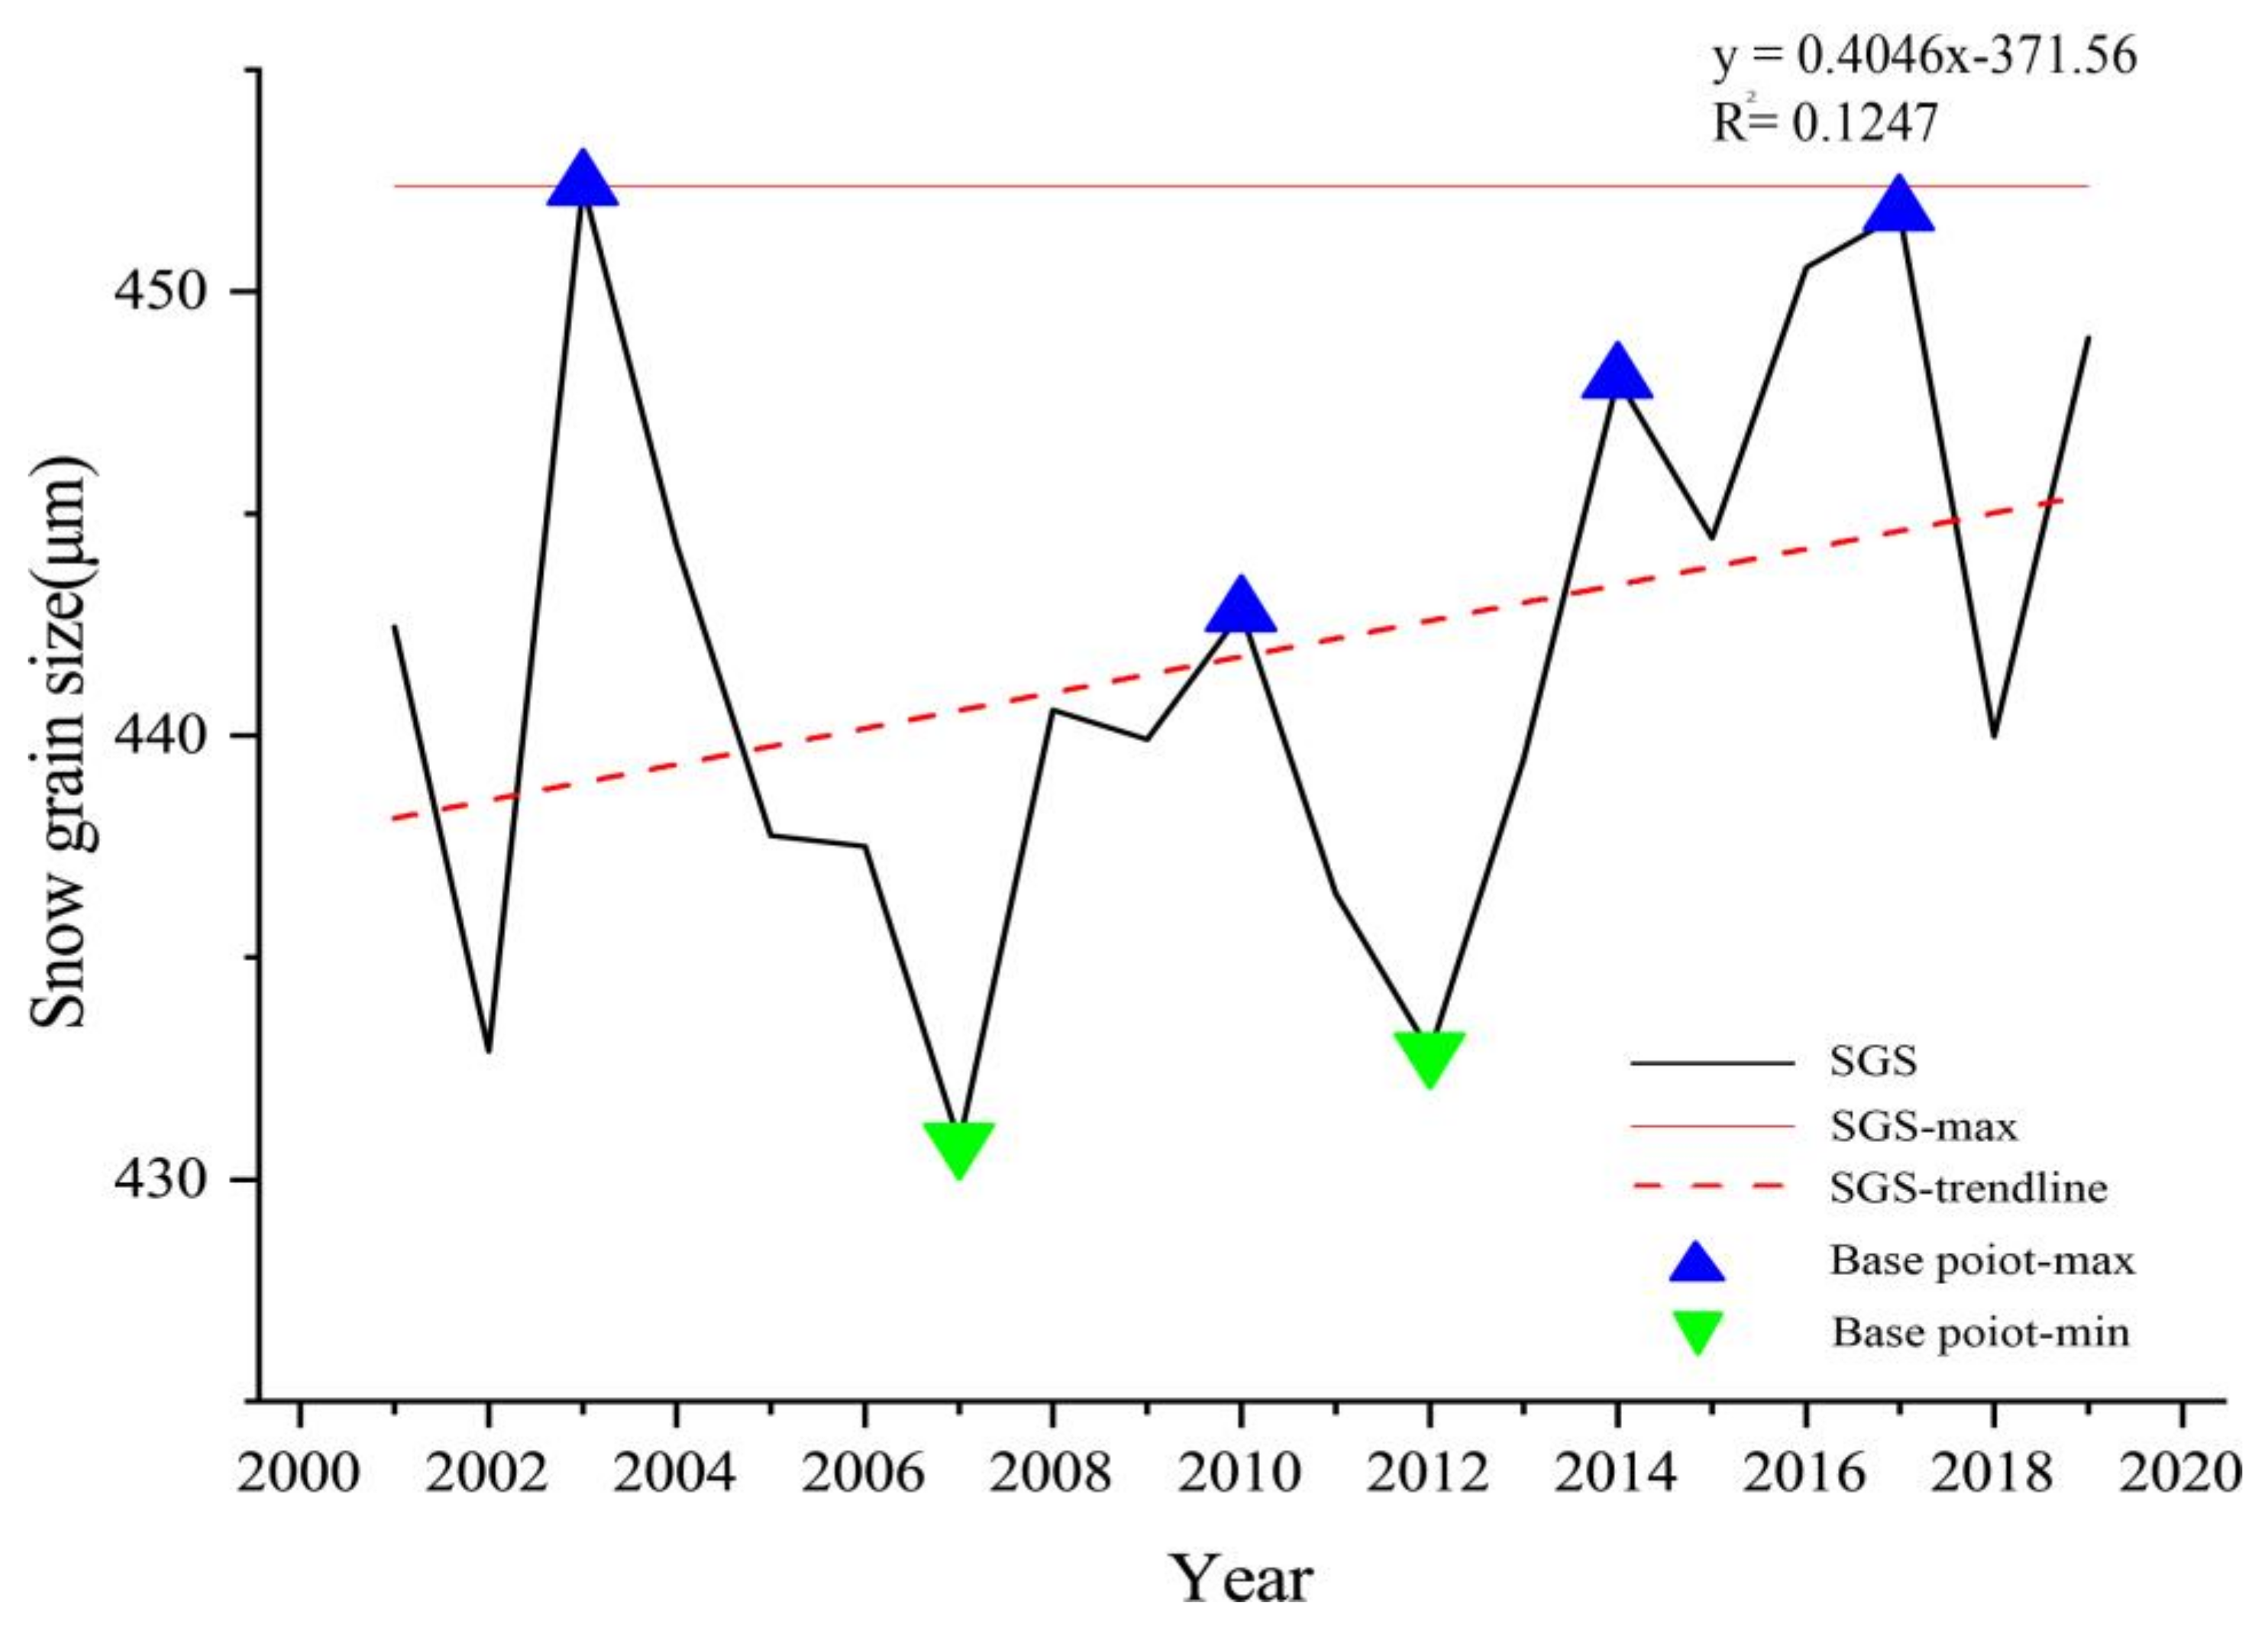
The MODIS second and third band ground reflectance and solar zenith angle data were input into the ART model to calculate the snow grain size in northeast China from 2001 to 2019 (Figure 5). The SGS here is the optically effective grain size. The 2001–2019 annual mean SGS distribution in northeast China fluctuated up and down between 430.830 μm and 452.384 μm, with a mean value of 441.783 and an annual increase of 0.405 μm, showing a non-significant increasing trend, indicating that the annual mean SGS in northeast China did not change significantly. The maximum value occurred in 2003, and the minimum value occurred in 2007. The coefficient of variation of the annual mean SGS in northeast China from 2001 to 2019 was 0.014, indicating that the overall SGS in northeast China is relatively stable.

3.3. Characteristics of Changes in the Spatial Distribution of SGS in Northeast China from 2001 to 2019

3.3.1. General Characteristics of the Spatial Distribution of SGS

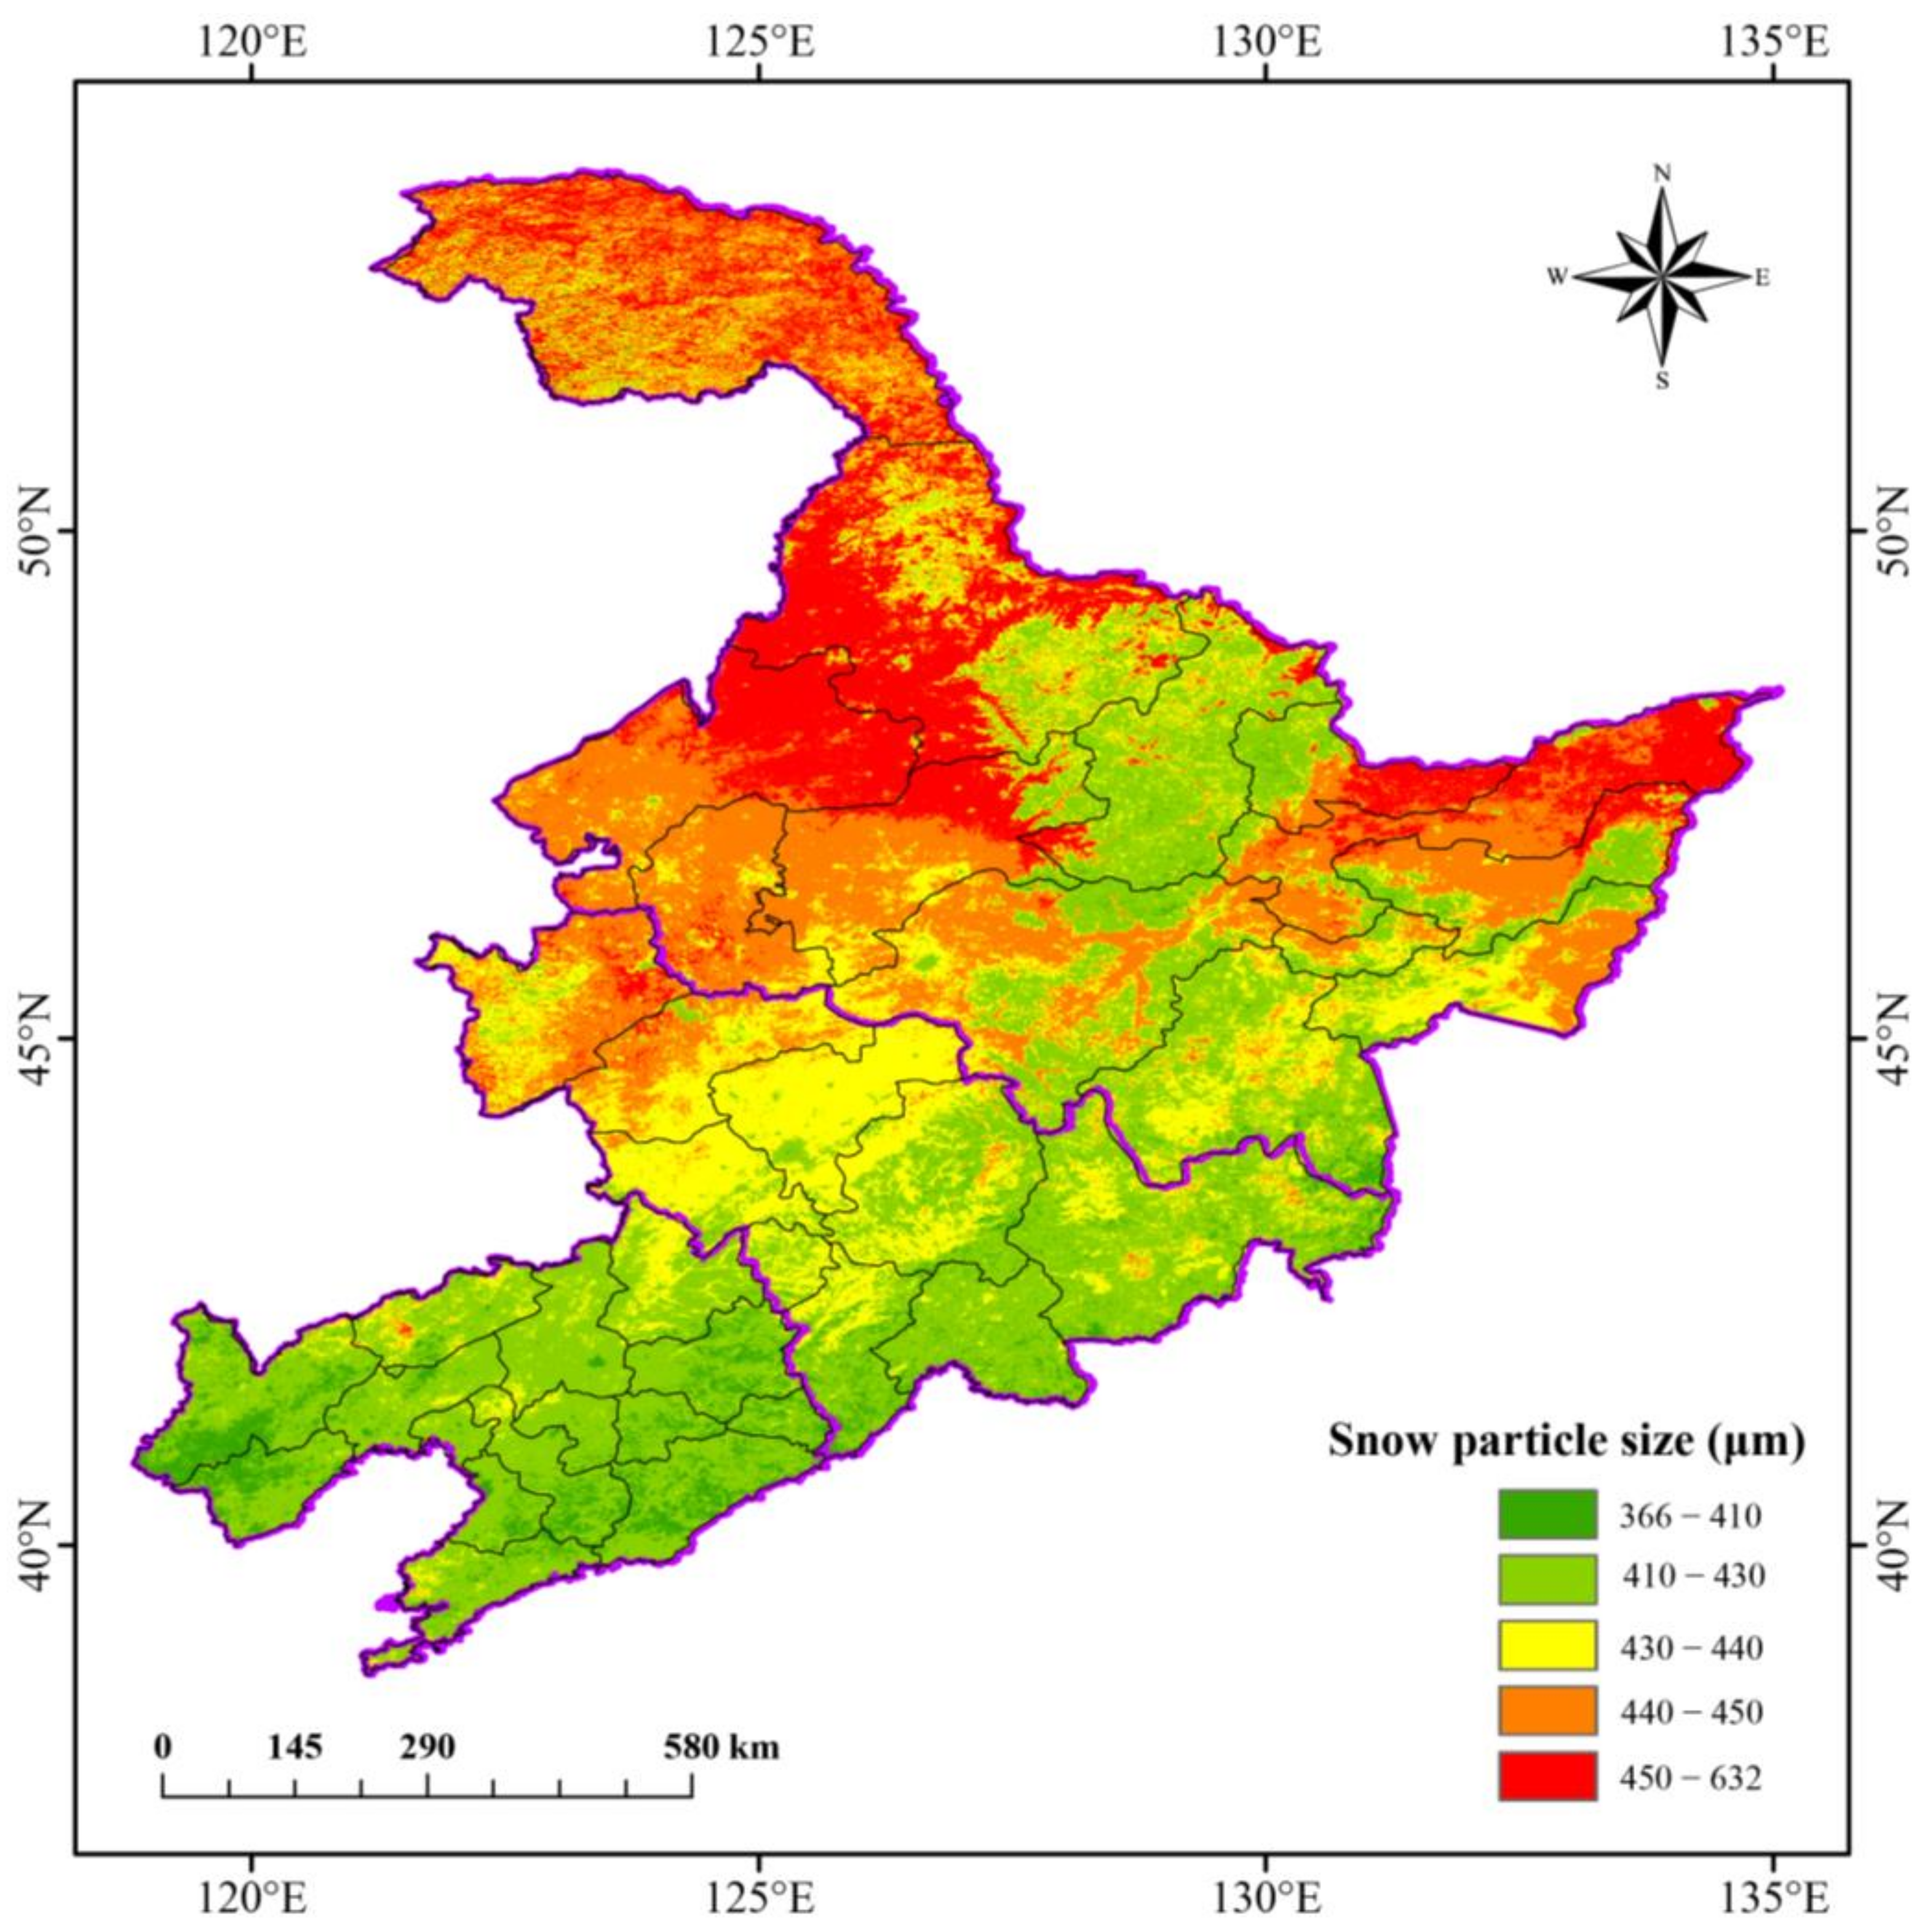
The annual mean SGS distribution in the northeast snowpack from 2001–2019 shows significant spatial variability (Figure 6). The overall spatial distribution is high in the north and low in the south, with values ranging from 380 to 497 μm. The mean SGS in the Liaoning, Jilin and Heilongjiang provinces were 417.552 μm, 428.713 μm and 439.941 μm, respectively. The southern part of Heihe, the northern part of Qiqihar and Suihua, and the eastern part of the Sanjiang Plain in Northeast China are areas with high values of SGS. Among them, the industrial corridor, consisting of Daqing, Qiqihar and Heihe, and the coal industrial region, consisting of Hegang, Jiamusi and Shuangyashan, are the areas with the largest SGS in northeast China, with an SGS above 450 μm. Snow grain size is relatively low in the Xiaoxinganling and Changbai Mountain areas and most of Liaoning Province, averaging below 430 μm.
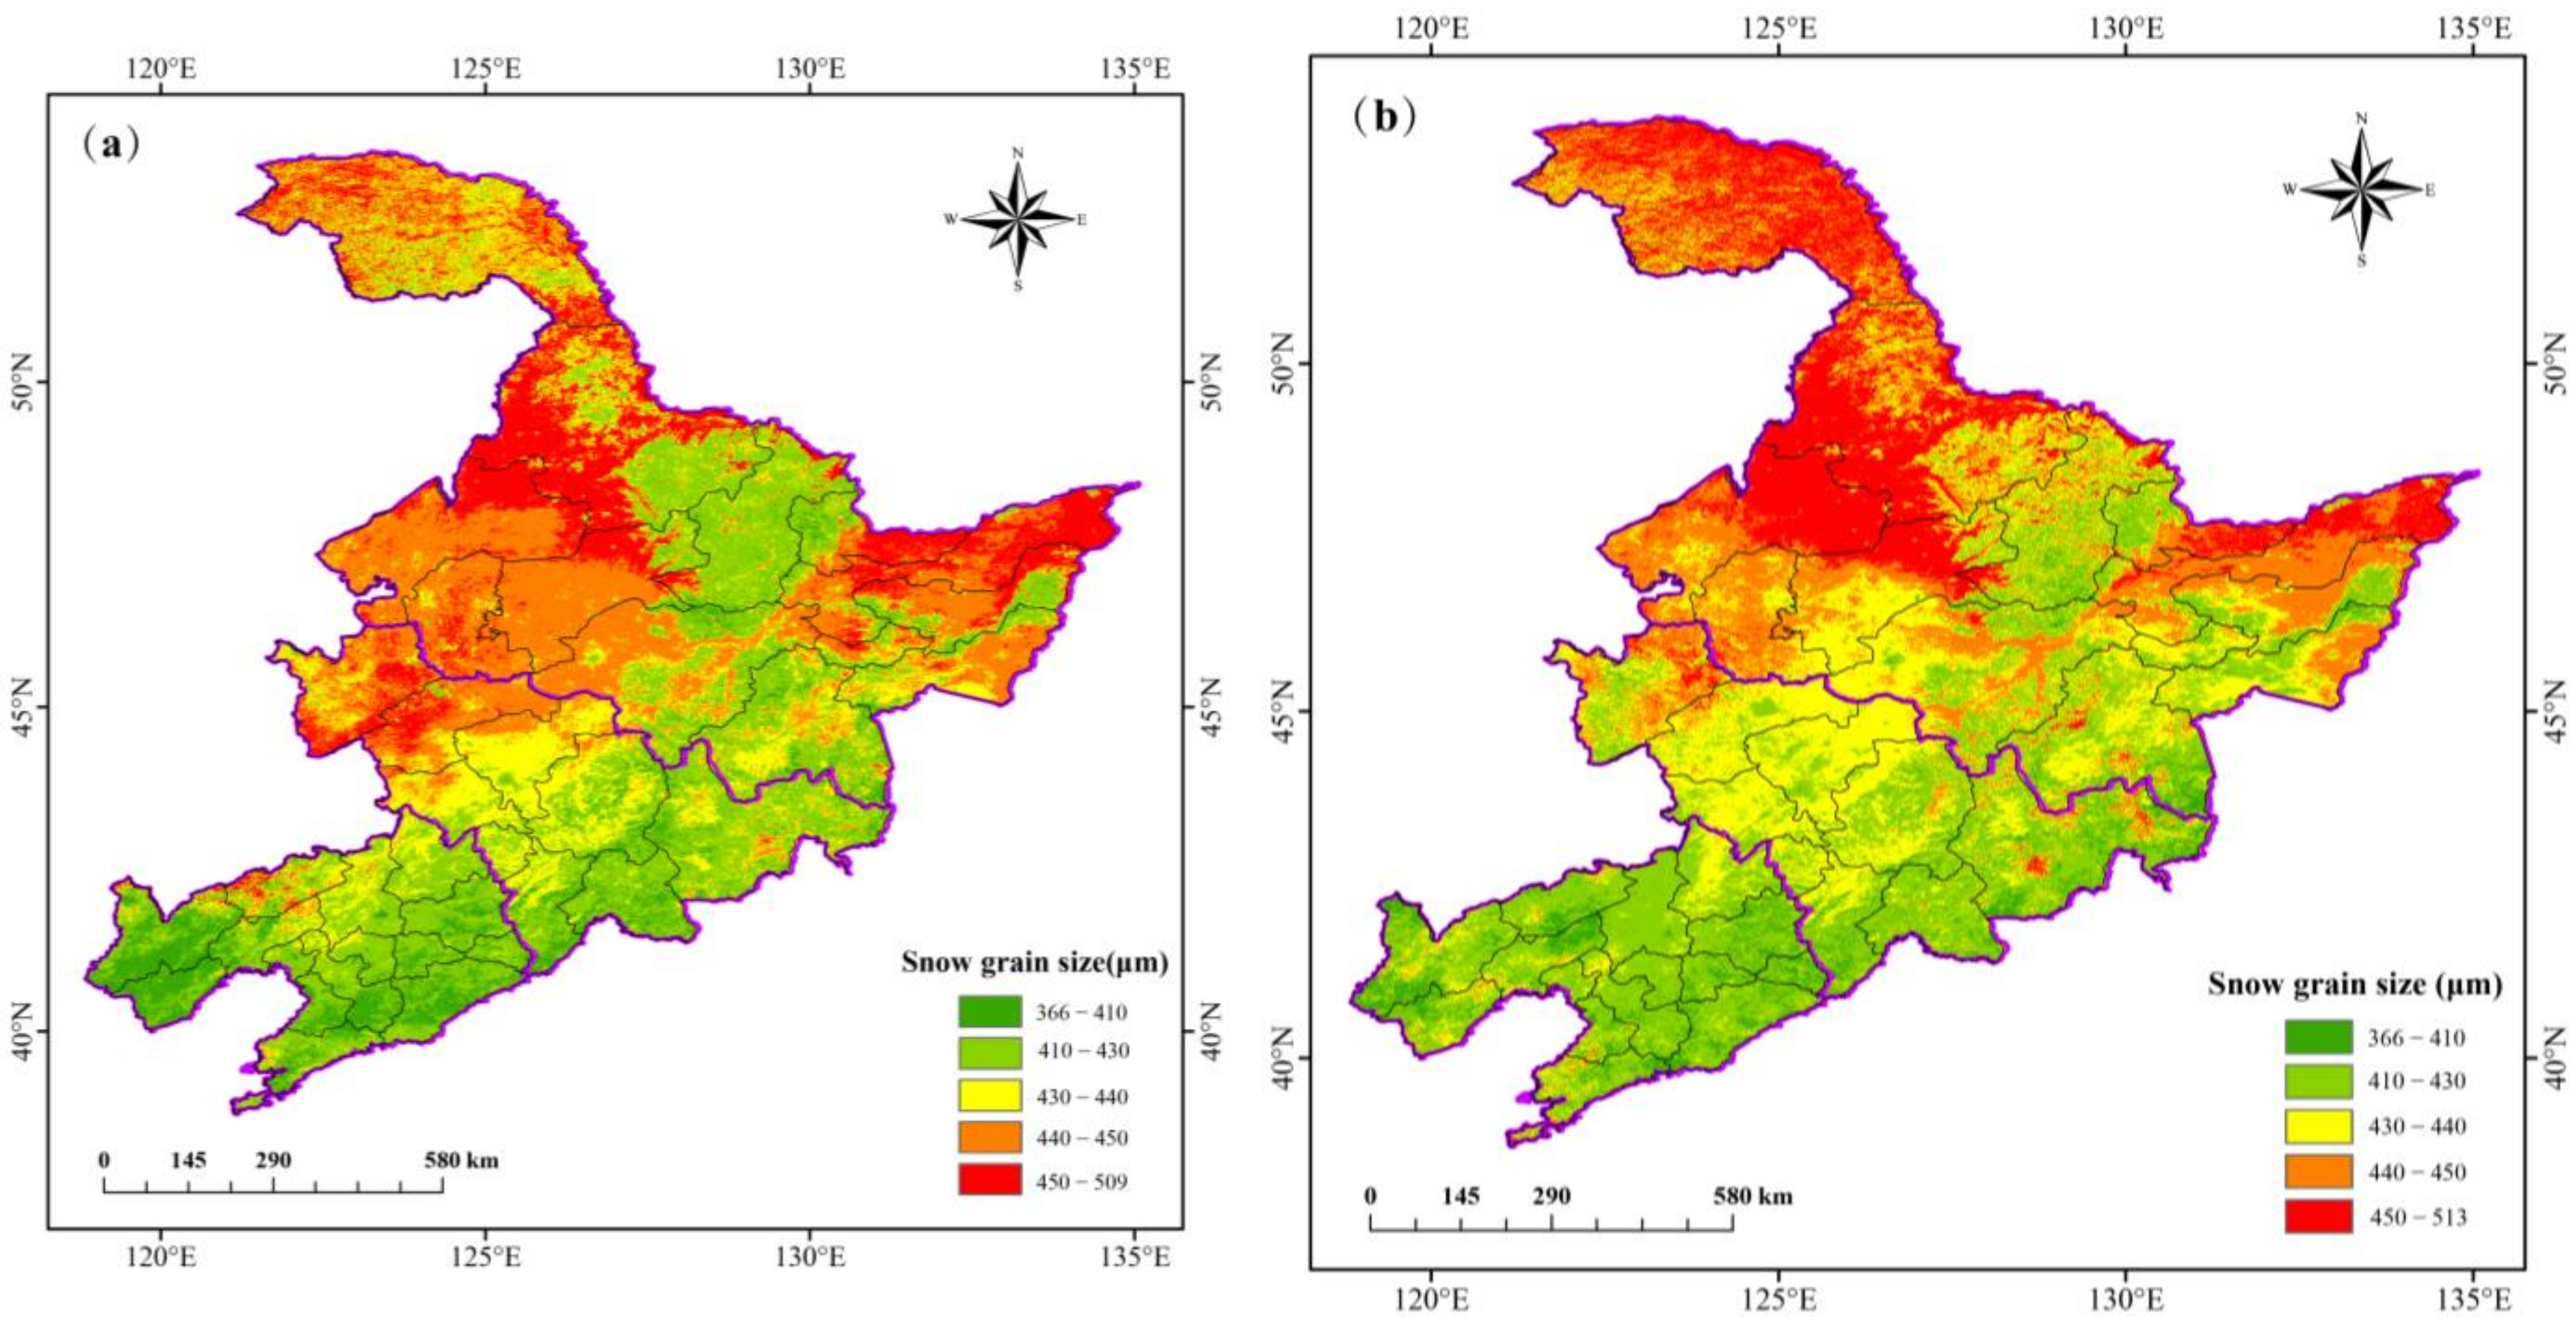
The annual averages of SGS in northeast China from 2001 to 2008 and 2009 to 2019 were averaged over 8 years, respectively (Figure 7). The results show that high values occur in the eastern and western Heilongjiang Province. Overall, the northeastern SGS from 2001 to 2019 showed an overall trend of increasing range in the high-value zone, decreasing range in the medium-value zone and increasing size in the low-value zone. In comparison, the spatial distribution of SGS in the last 8 years shows a decrease in SGS in the Songnen Plain. The range of the secondary high-value centres (440 μm–450 μm interval) in Harbin, Suihua, Daqing and Songyuan shrinks sharply, and the snow grain size increases in the Daxinganling region, the Xiaoxinganling region, the Changbai Mountain region and southeastern and southwestern Liaoning Province.

3.3.2. Spatial Distribution of Interannual Variation of SGS

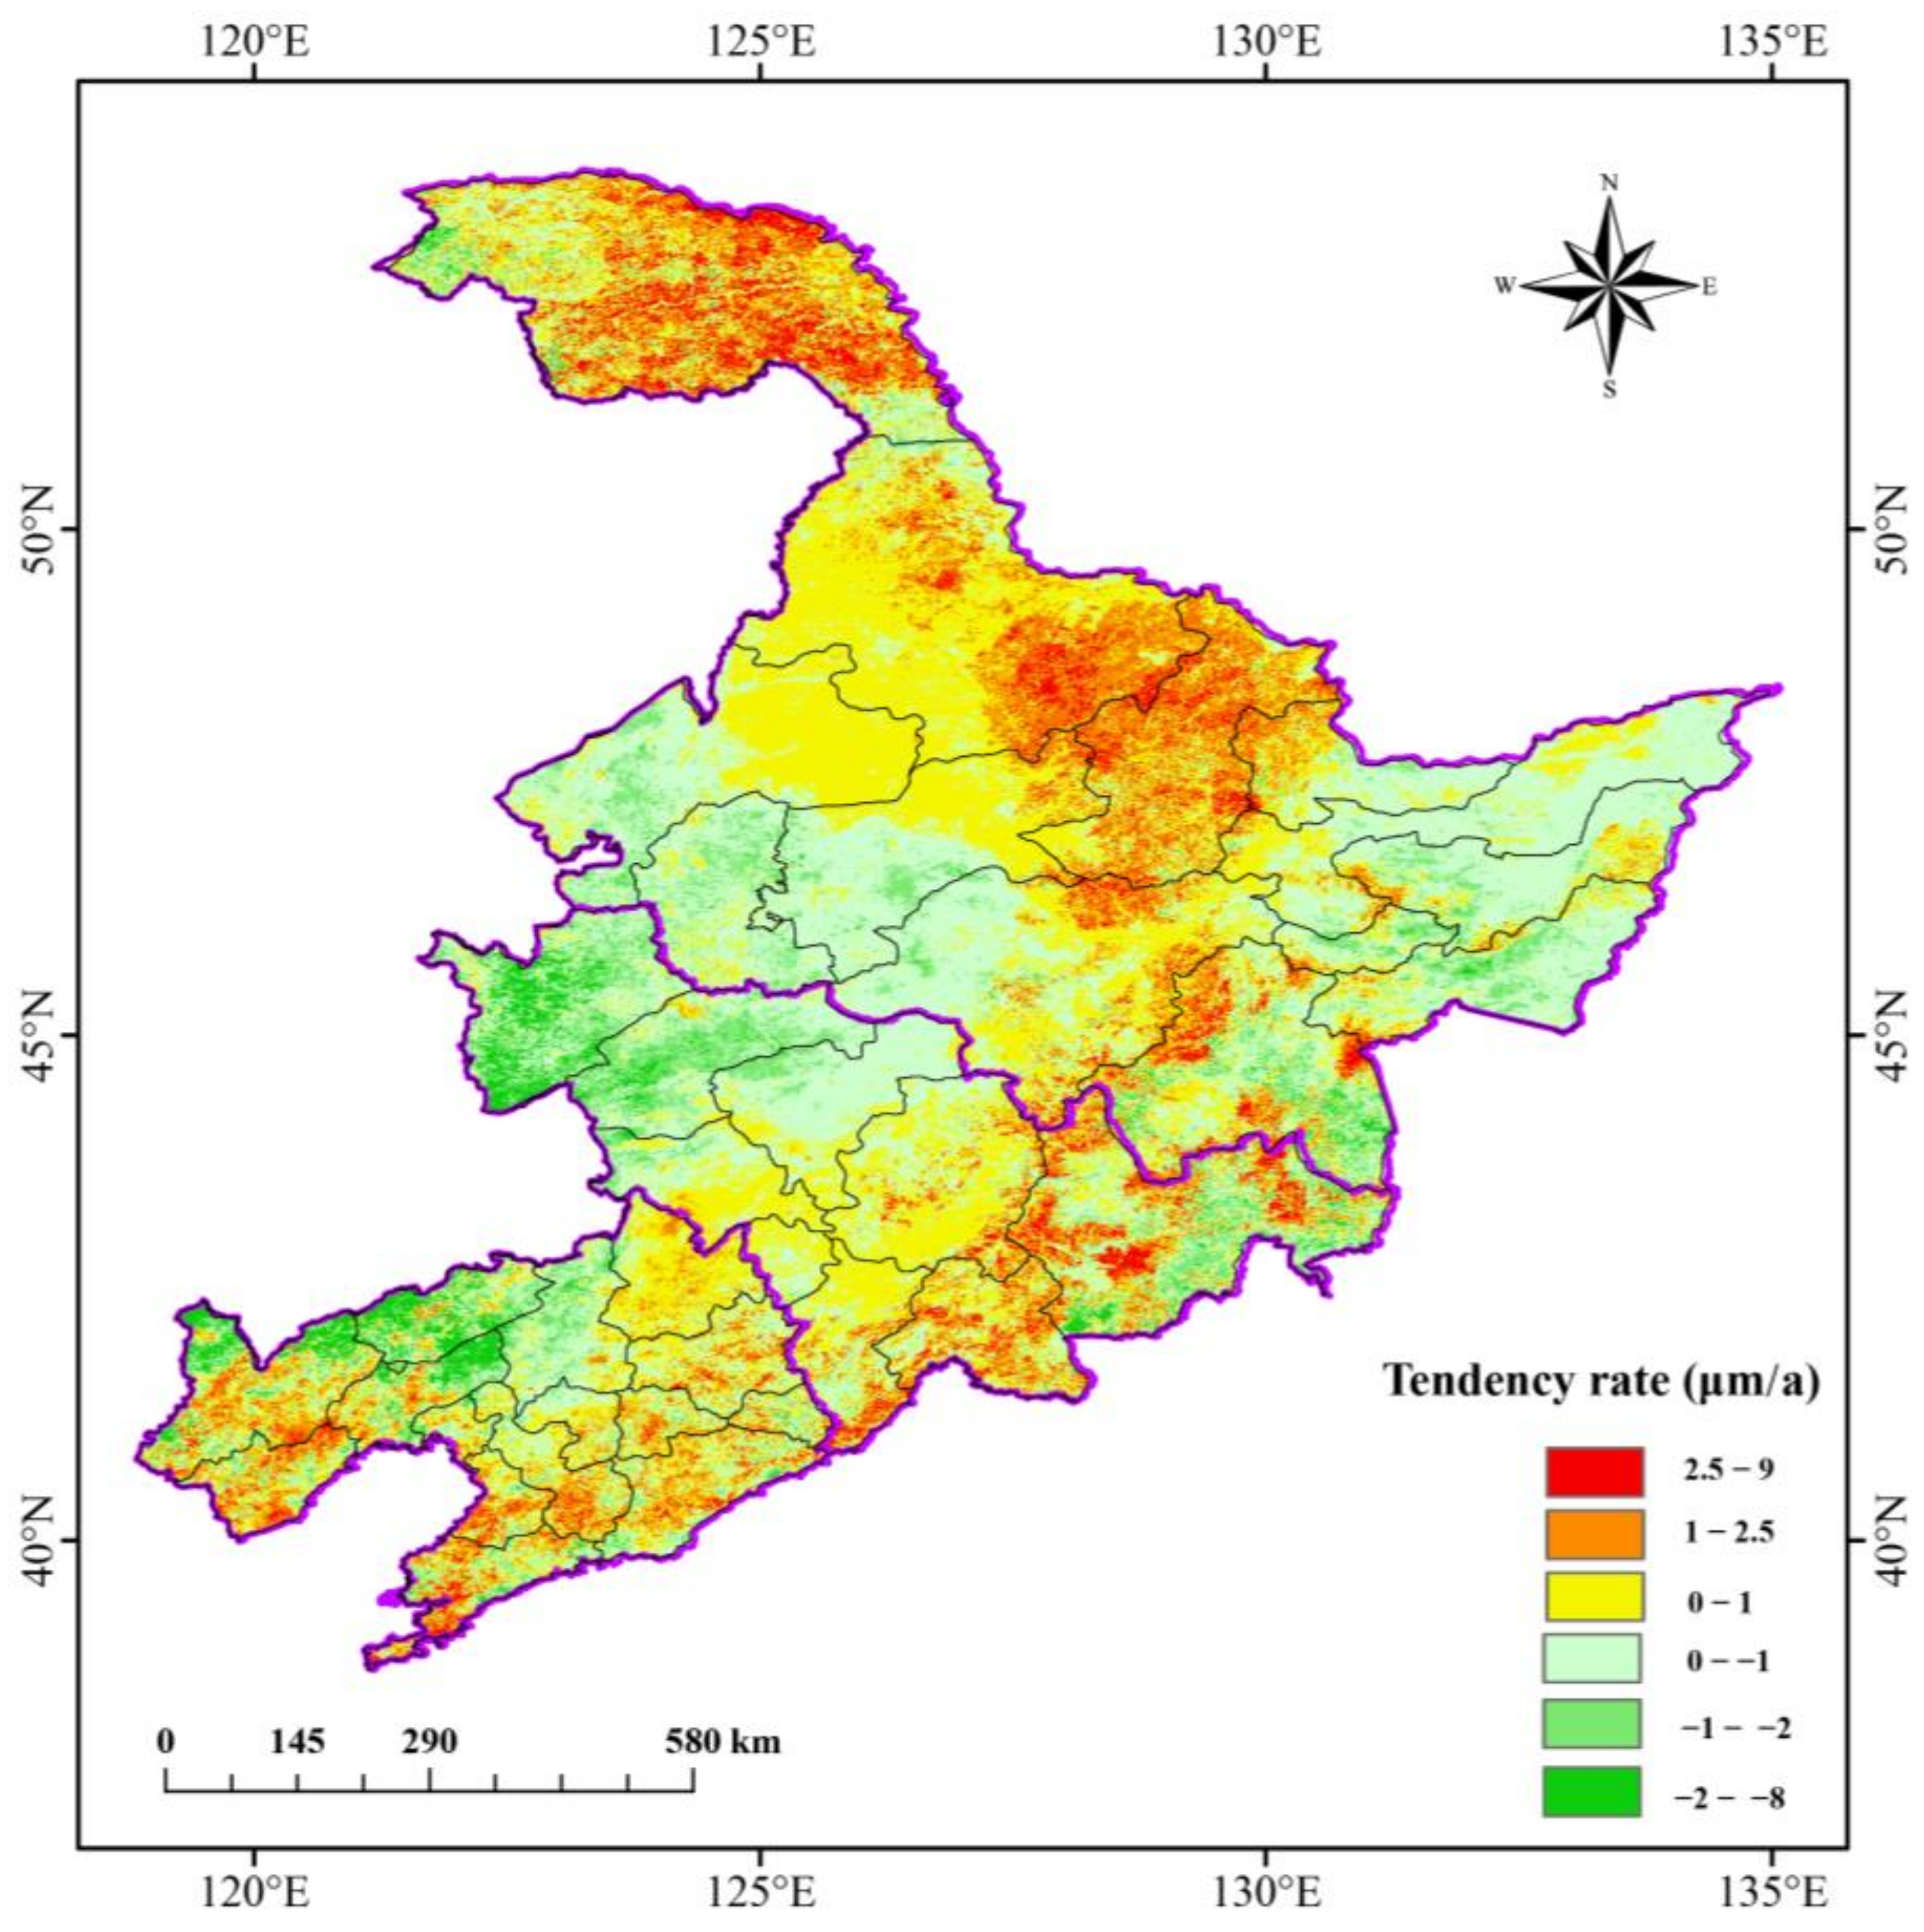
The trend of the rate of change in northeast SGS from 2001 to 2019 is shown in Figure 8, with both increasing and decreasing trends in northeast SGS. Overall, 49.98% of the northeastern area has an increasing trend and 50.02% has a decreasing trend, i.e., the area of increasing and decreasing SGS is equally divided. Among them, the SGS increase area is mainly concentrated in the two intervals of 0–1 μm and 1–2.5 μm, accounting for 31.95% and 14.16% of the whole northeast area, respectively. This indicates that the overall increase in SGS in northeast China from 2001 to 2019 was not significant, mainly in Heihe, northern Qiqihar, northern Suihua, Yichun, eastern Harbin, Jilin, Mudanjiang, Siping, Liaoyuan, Tonghua and Tieling. The greatest increase in SGS is found in the Daxinganling region, eastern Heihe, Yichun, northern and eastern Harbin, western Mudanjiang, Yanbian Korean Autonomous Prefecture, Baishan, southeastern Tonghua, Fuxin, Chaoyang and Huludao, where the rate of increase ranges from 2.5 to 9 μm/a. The northeast SGS reduction areas are mainly concentrated in the −1–0 μm and −2–−1 μm intervals, accounting for 37.21% and 9.95% of the total northeast area, respectively. This indicates that the overall decrease in snow grain size in northeast China from 2001 to 2019 is not significant and is concentrated in the Songneng Plain, Sanjiang Plain, central Mudanjiang and eastern Yanbian Korean Autonomous Prefecture in northeast China. The greatest reduction in SGS was observed in Baicheng, Songyuan, Chaoyang, Fuxin and northwestern Jinzhou cities, with reductions ranging from −8 to −2 μm/a.
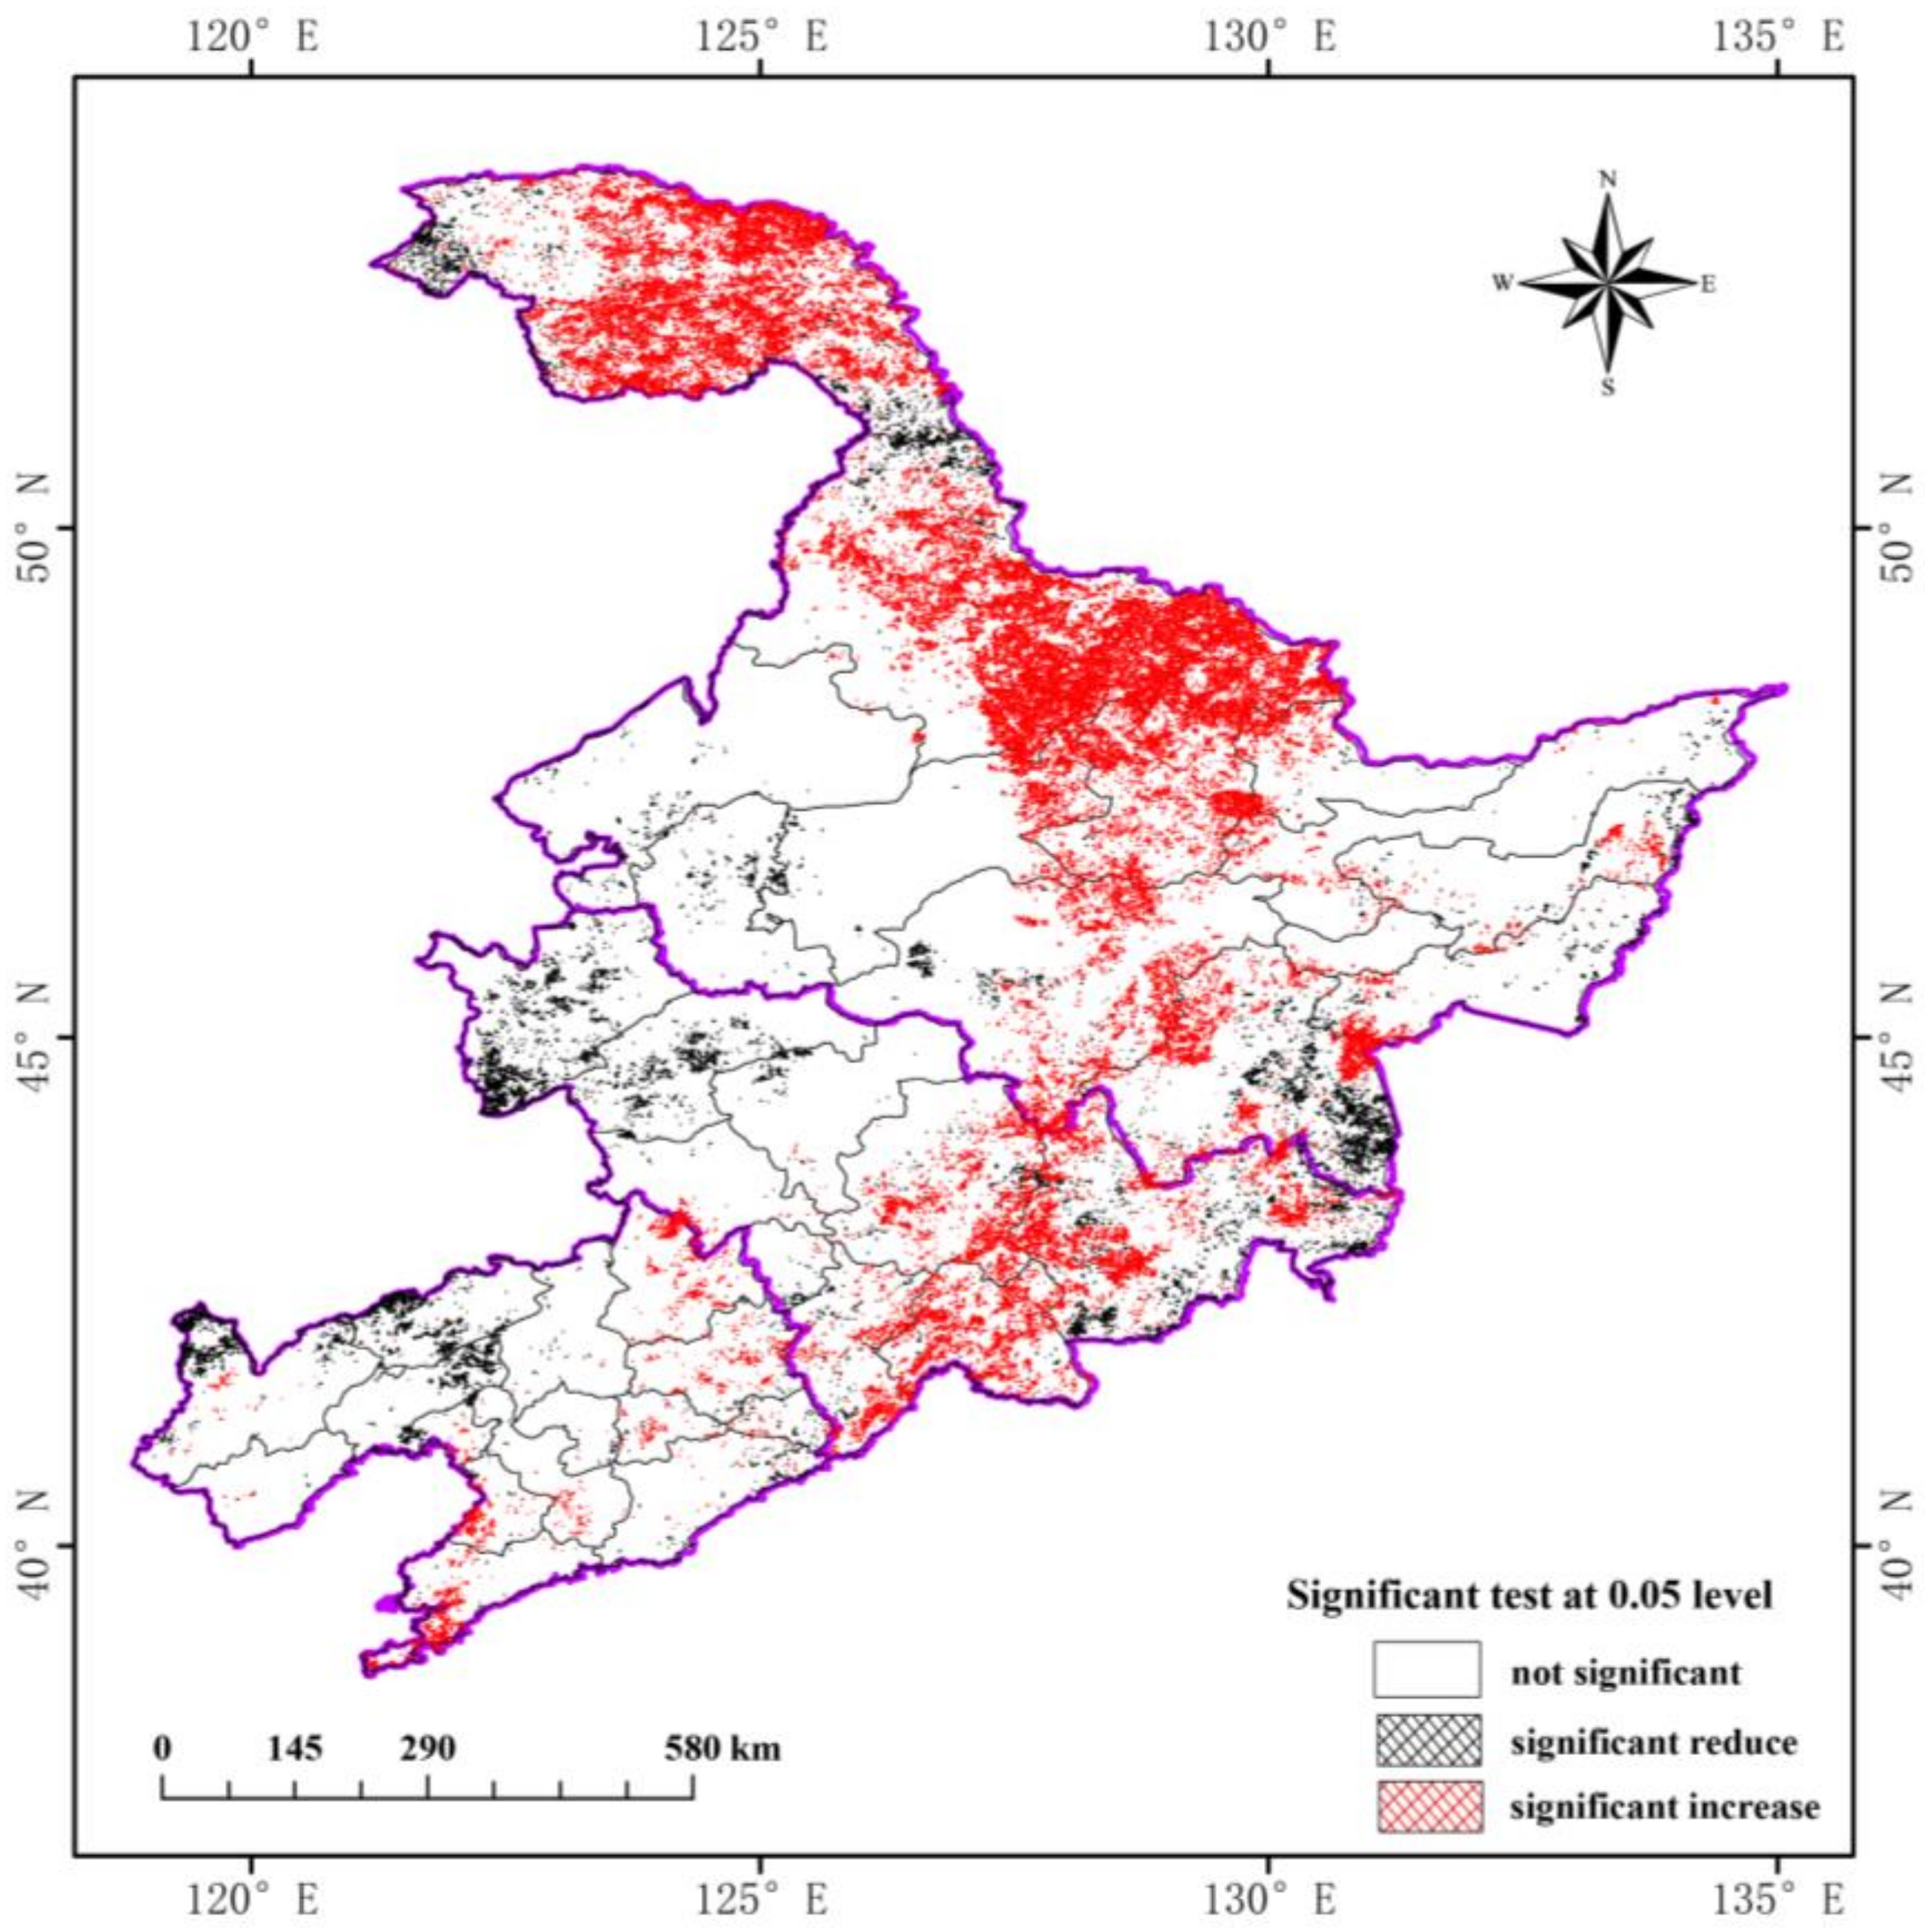
The spatial distribution of sig values of SGS in northeast China from 2001 to 2019 is shown in Figure 9. Only 4.49% of the whole of northeast China area passed the probability test at a 0.05 significance level. The change was significant. Among which, the area with significantly increasing SGS accounted for 3.76% of the northeast China area, and the area with significantly decreasing SGS was smaller, only 0.74% of the northeast China area. The significantly increasing areas were mainly located in the Daxinganling region, Heihe, Yichun, northern and southern Harbin, western and northeastern Mudanjiang, central Jilin, western Yanbian Korean Autonomous Prefecture and Baishan City. The significantly decreasing areas were sporadically distributed in Baicheng, Songyuan, northeastern Mudanjiang, Yanbian Korean Autonomous Prefecture, northern Chaoyang, Fuxin and northern Jinzhou.
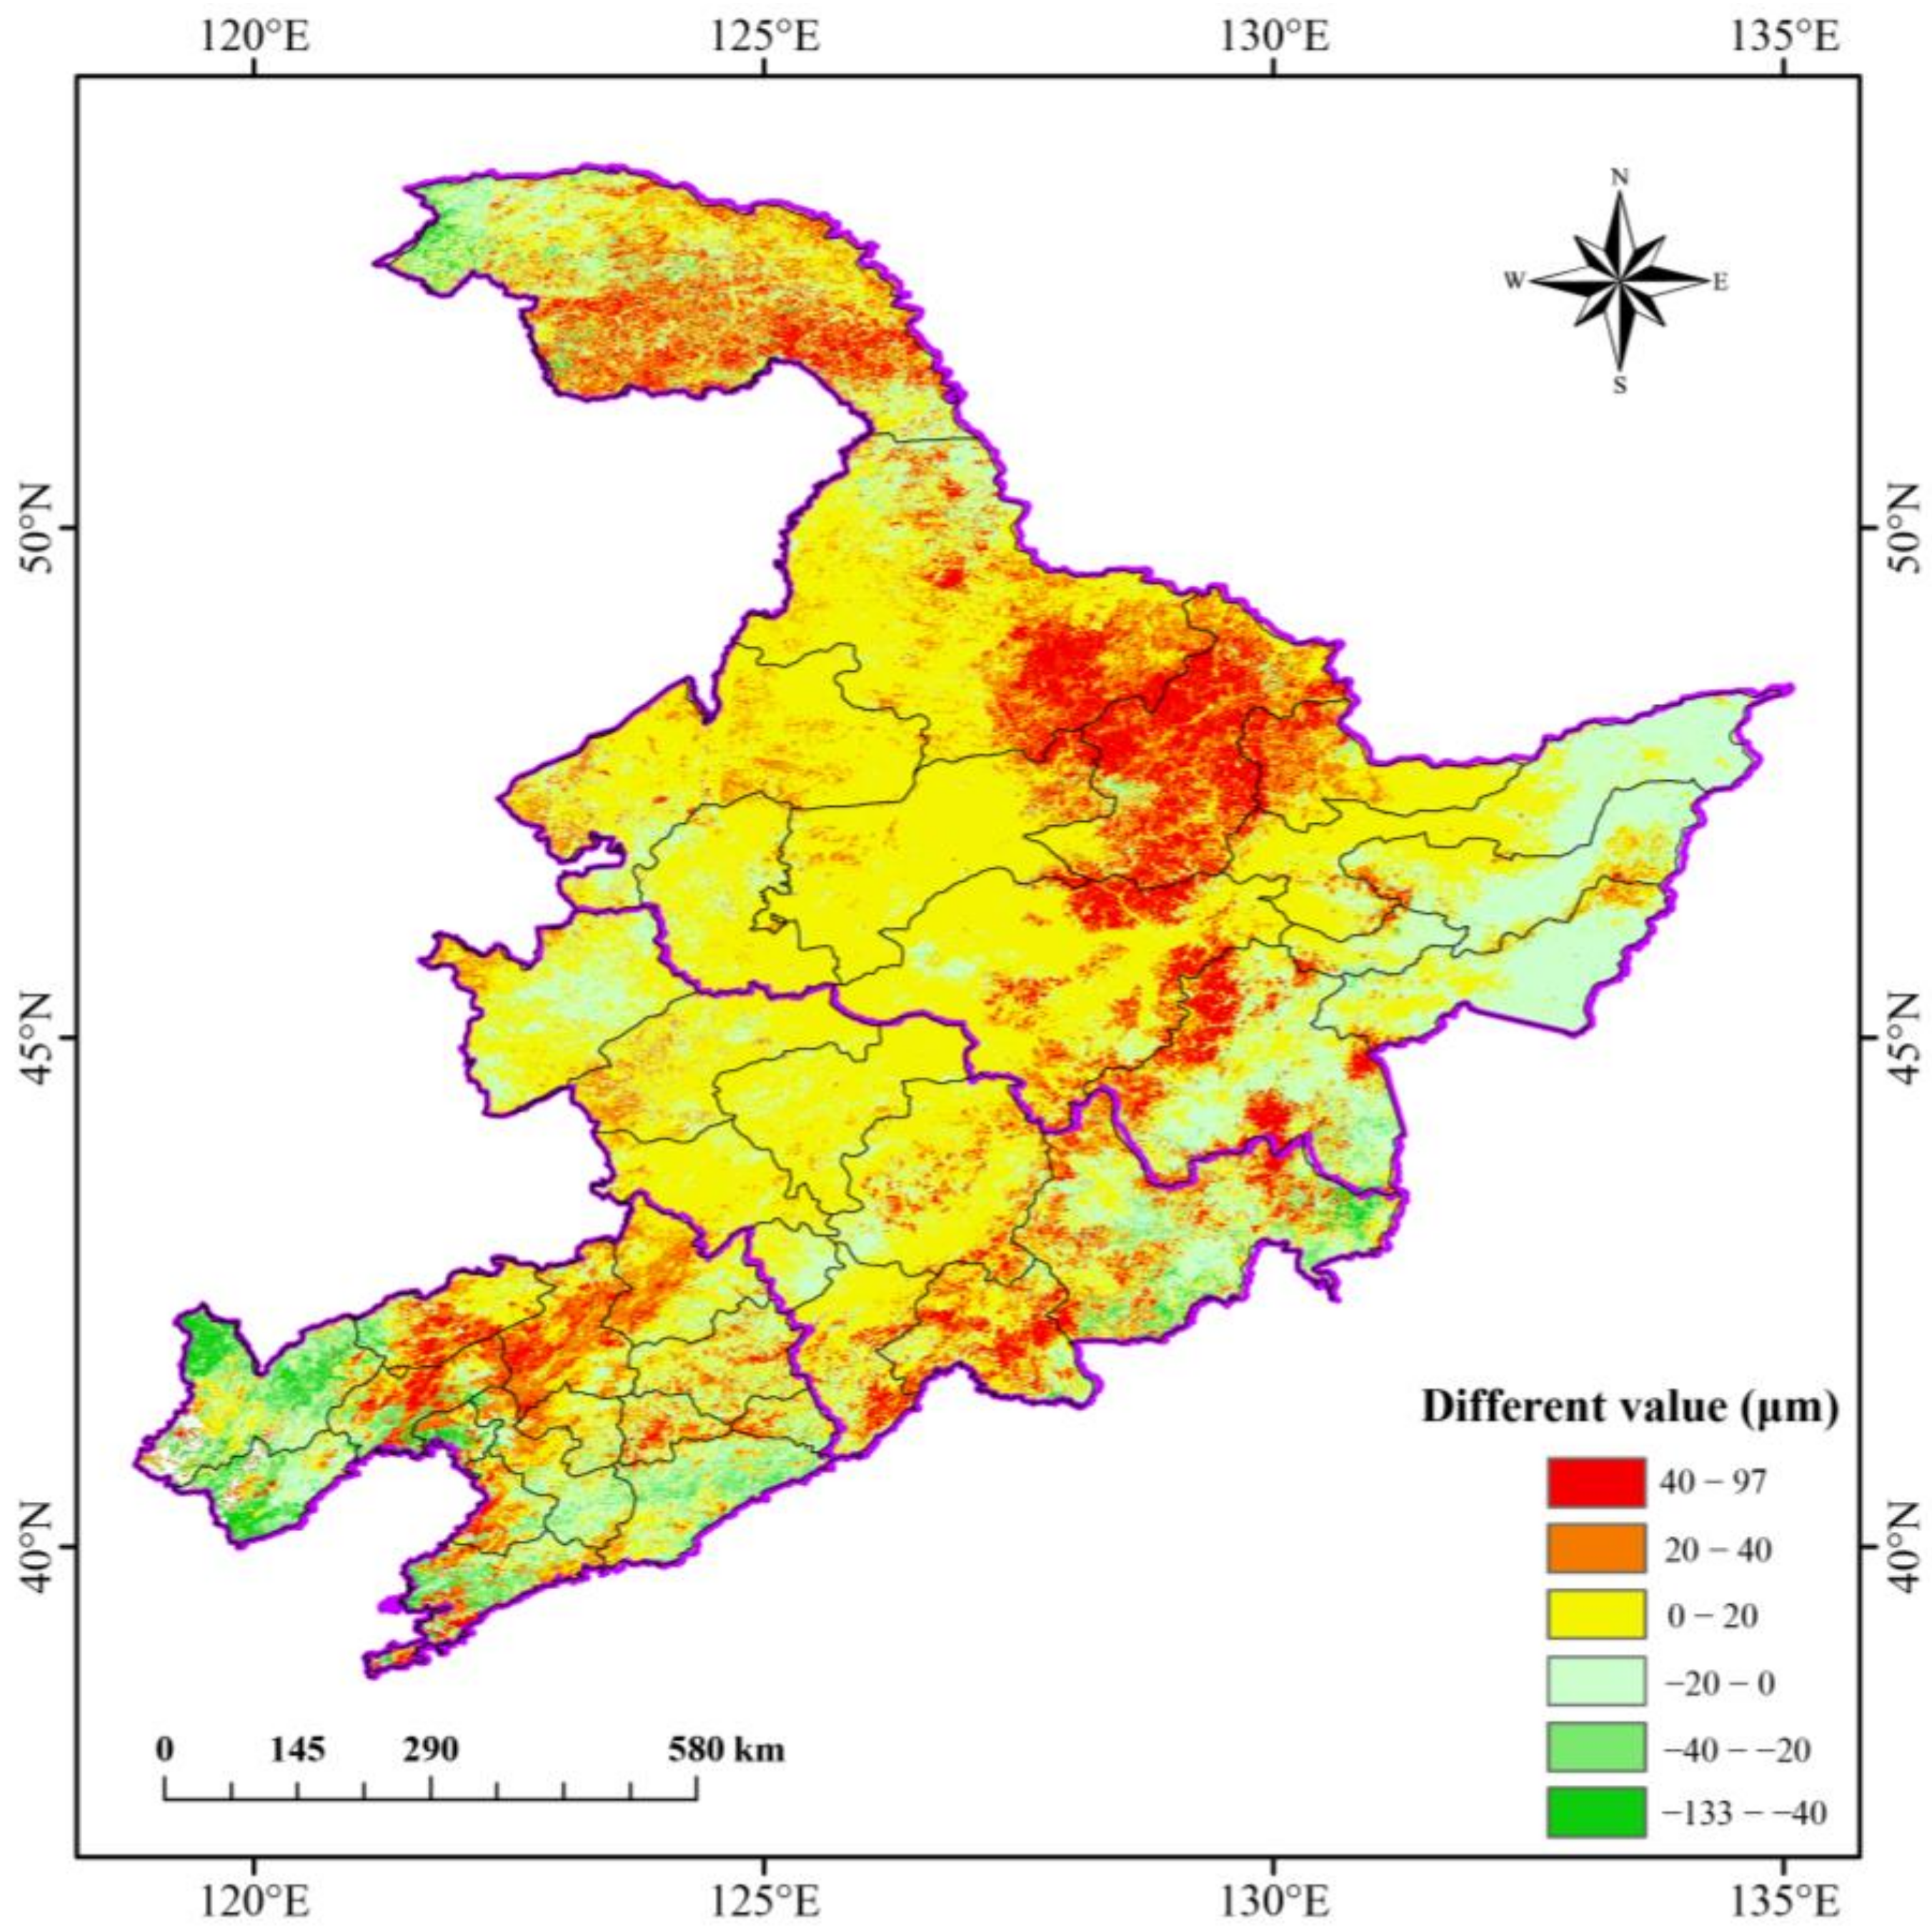
The spatial distribution of northeast SGS in 2019 is subtracted from the spatial distribution of northeast SGS in 2001 to obtain the spatial distribution of the amount of northeast SGS change from 2001 to 2019 (Figure 10). The spatial distribution of SGS variation from 2001 to 2019 is more obvious; the decreasing area and increasing area of SGS annual variation are distributed in the whole northeast; the increasing area and decreasing area are 71.75% and 28.25% of the northeast area, respectively, the largest area is 2.540 times the decreasing area. All cities in the northeast are represented. The annual SGS reduction areas are mainly located in the Daxinganling region, northern Qihehe, Yichun, eastern Jiamusi, Shuangyashan, Qitaihe, Mudanjiang, Yanbian Korean Autonomous Prefecture, Baicheng, Chaoyang, Huludao, Jinzhou, Panjin, Dandong, southern Anshan and Dalian. The amount of change in SGS in northeast China from 2001 to 2019 was mainly concentrated in the intervals of −20 to 0 μm and 0 to 20 μm, accounting for 23.27% and 49.41% of the entire northeast China area, respectively, for a total of 72.68%. The area of SGS change that increased by more than 40 μm and decreased by less than 40 μm only accounted for 9.87% of the entire northeast area, indicating that the overall SGS change in the northeast from 2001 to 2019 was not significant.

3.3.3. Spatial Distribution of Intraannual Variation of SGS

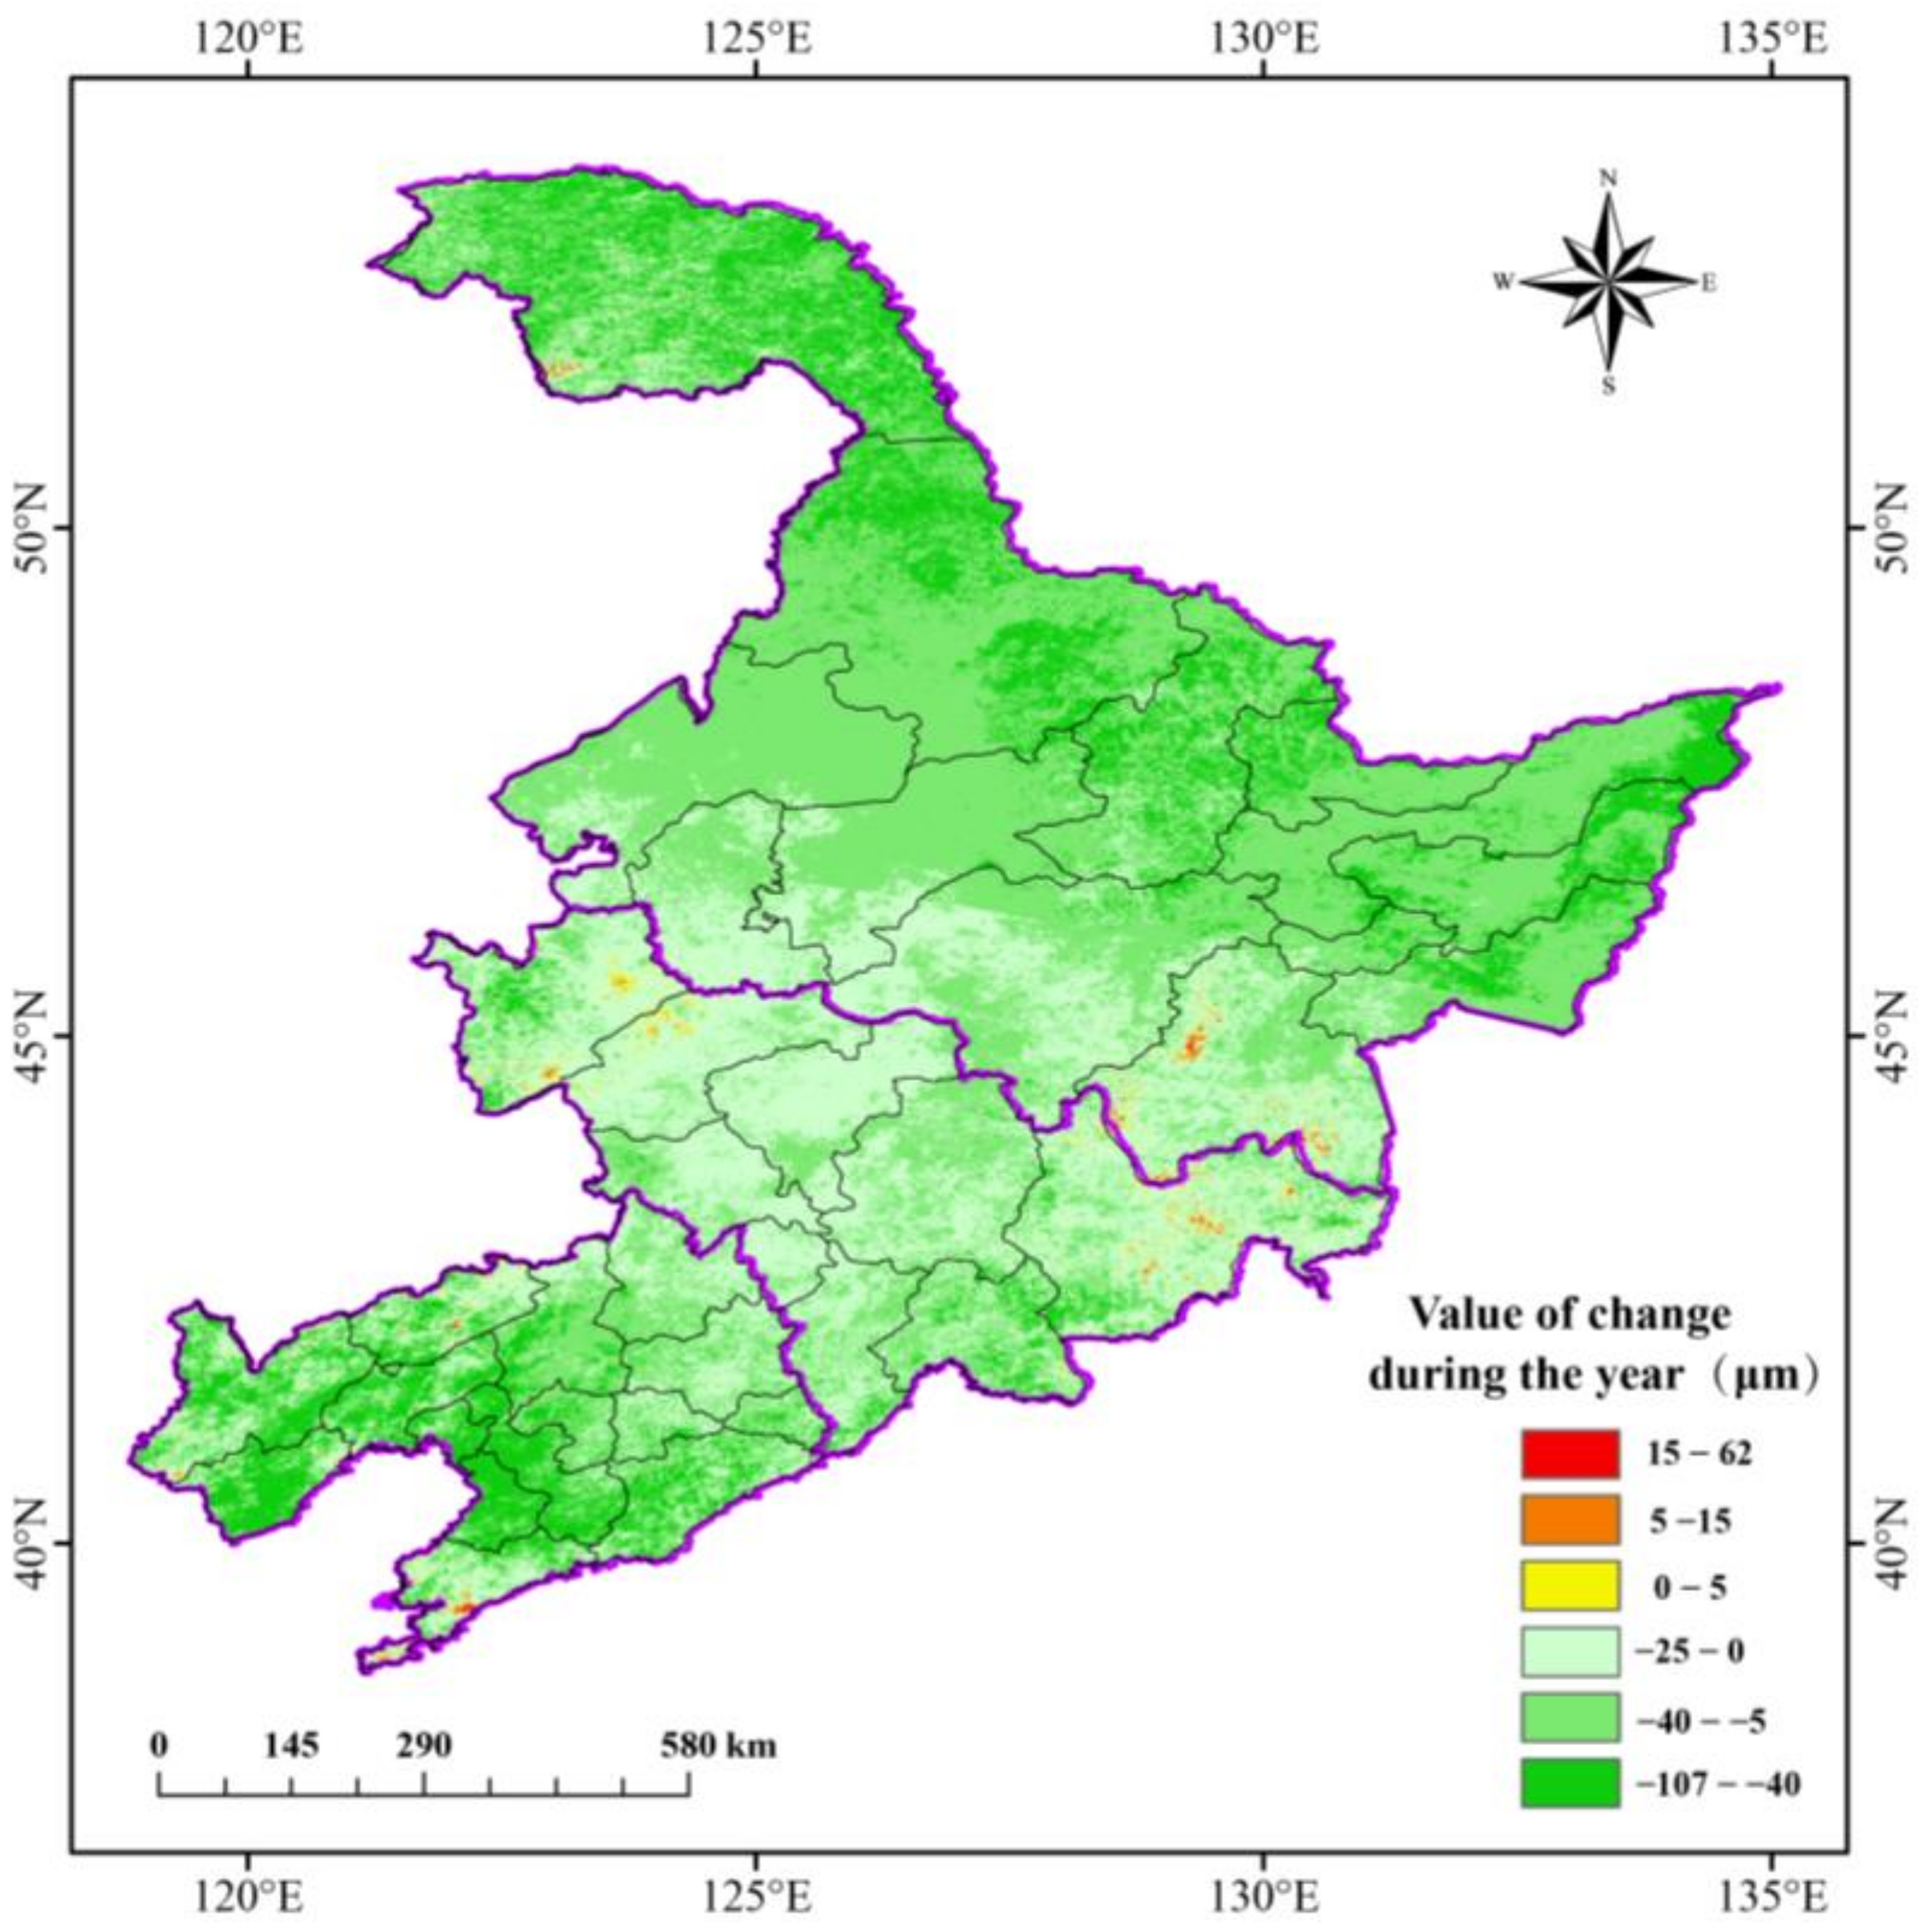
Considering December of the previous year and January and February of this year as snow seasons, the spatial distribution of the average monthly SGS in December is subtracted from the spatial distribution of the average monthly SGS in February from 2001 to 2019 to obtain the spatial distribution of SGS variation within a snow season (Figure 11). The results show that the spatial distribution of SGS variation during the snow season from 2001 to 2019 varies significantly, with both decreasing and increasing SGS areas distributed, with increasing and decreasing areas accounting for 0.86% and 99.14% of the total northeastern area. It can be seen that the area of the SGS reduction region is 115.48 times larger than the area of the increase region, with the vast majority of the northeast being the reduction region. The increasing areas are mainly in the cities of Mudanjiang, Baicheng, Songyuan and Yanbian Korean Autonomous Prefecture, with the remainder being decreasing areas. The snow grain size reduction during the 2001 to 2019 snow season was mainly concentrated in the intervals of 0 μm to −25 μm and −40 μm to −25 μm, accounting for 29.007% and 51.933% of the entire northeastern area, respectively, for a total of 80.94%. The areas with the greatest reduction in SGS (−107 to −40 μm) are concentrated in the Daxinganling region, northern and eastern Heihe, Yichun, eastern Jiamusi, western Baicheng, Huludao, Jinzhou, Panjin, Anshan, Yingkou and Dandong.

3.4. Analysis of Monthly Variation of Snow Grain Size in Northeast China

3.4.1. Analysis of Temporal Variation in SGS by Month

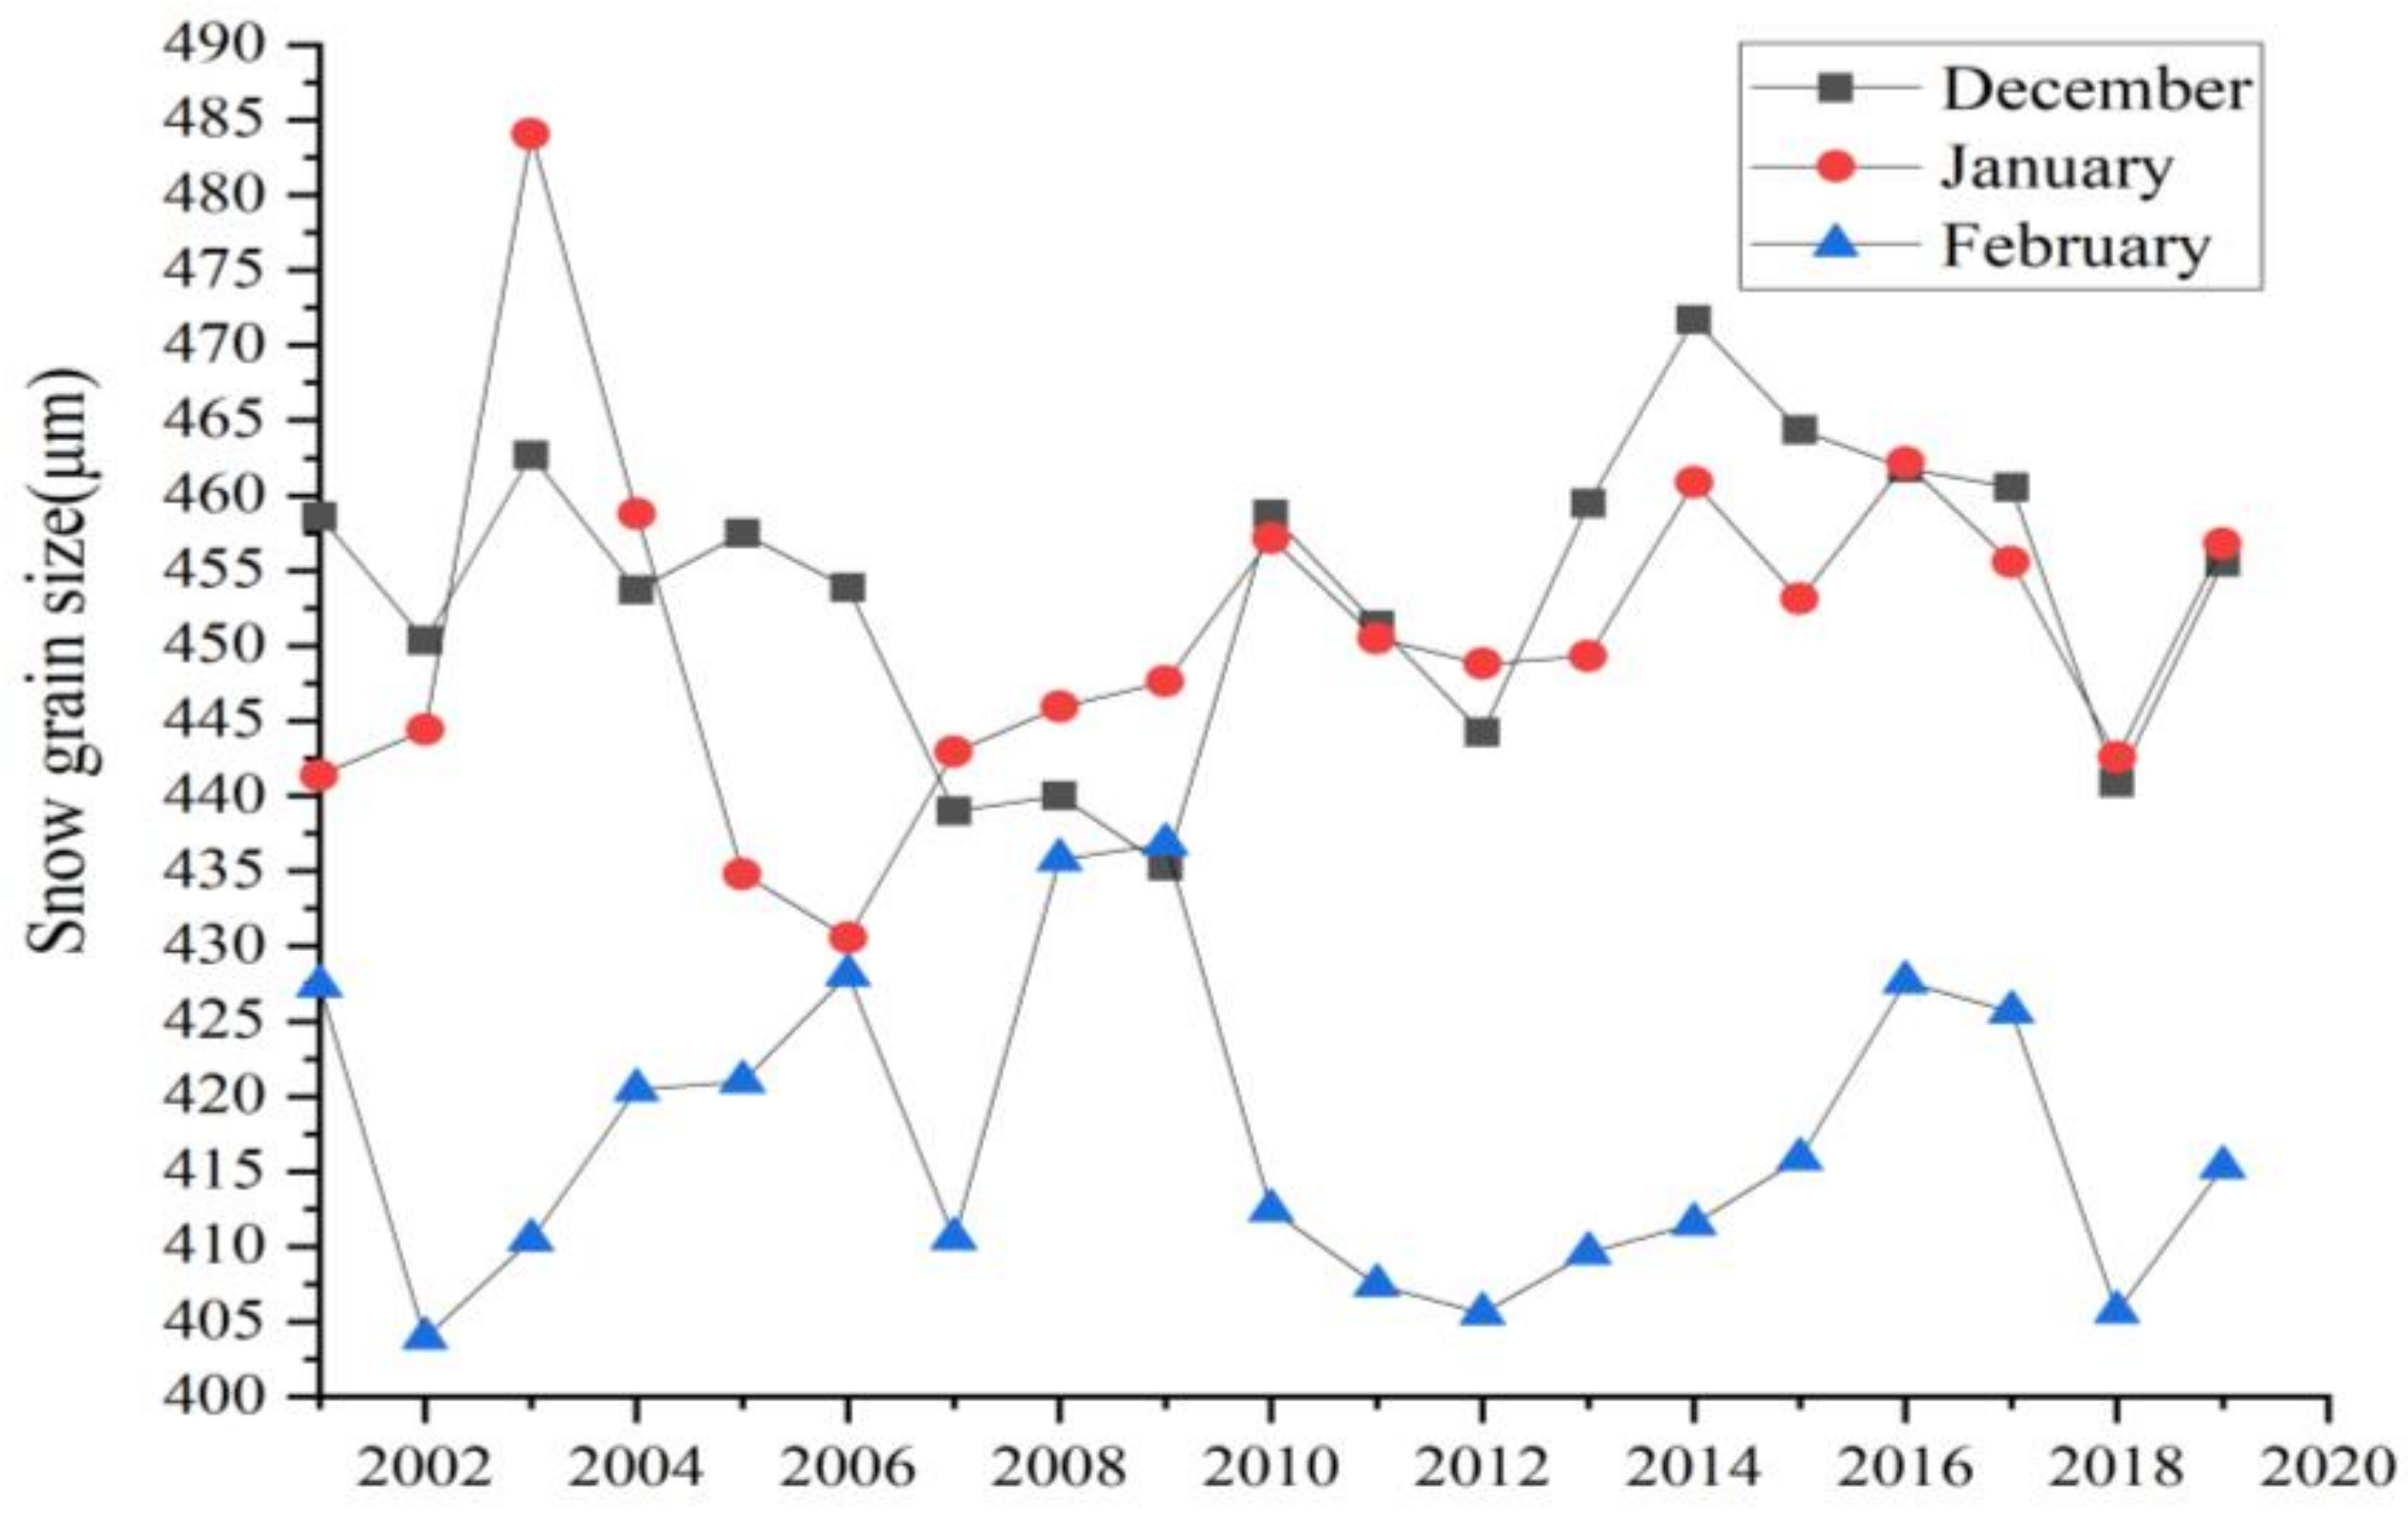
The daily values of SGS for each month (December, January and February) of winter in northeast China from 2001 to 2019 were summed and then averaged to obtain the monthly average values of SGS in December, January and February for 19 years in northeast China (Figure 12). The results show that inter-monthly snow grain size varies greatly in the Northeast. The largest SGS was 453.923 μm in December, decreasing in January and February to 450.768 μm and 417.777 μm, respectively. The interannual variation in SGS by month in the northeast from 2001 to 2019 is shown in Figure 9. The result shows an increasing trend in SGS in December and January in the northeast from 2001 to 2019, with annual increases of 0.488 μm/a and 0.481 μm/a, respectively. Snow grain size tends to decrease in February, with an annual decrease of 0.193μm/a. There was no significant trend of increasing or decreasing SGS in any of the three months. This indicates that there was no significant change in snow grain size from 2001 to 2019 in the northeast by month. The coefficients of variation for each month were 0.022 (December), 0.028 (January) and 0.025 (February). The coefficient of variation was smallest in December, indicating that snow grain size was generally more stable in December.

3.4.2. Analysis of Spatial Variation in SGS by Month

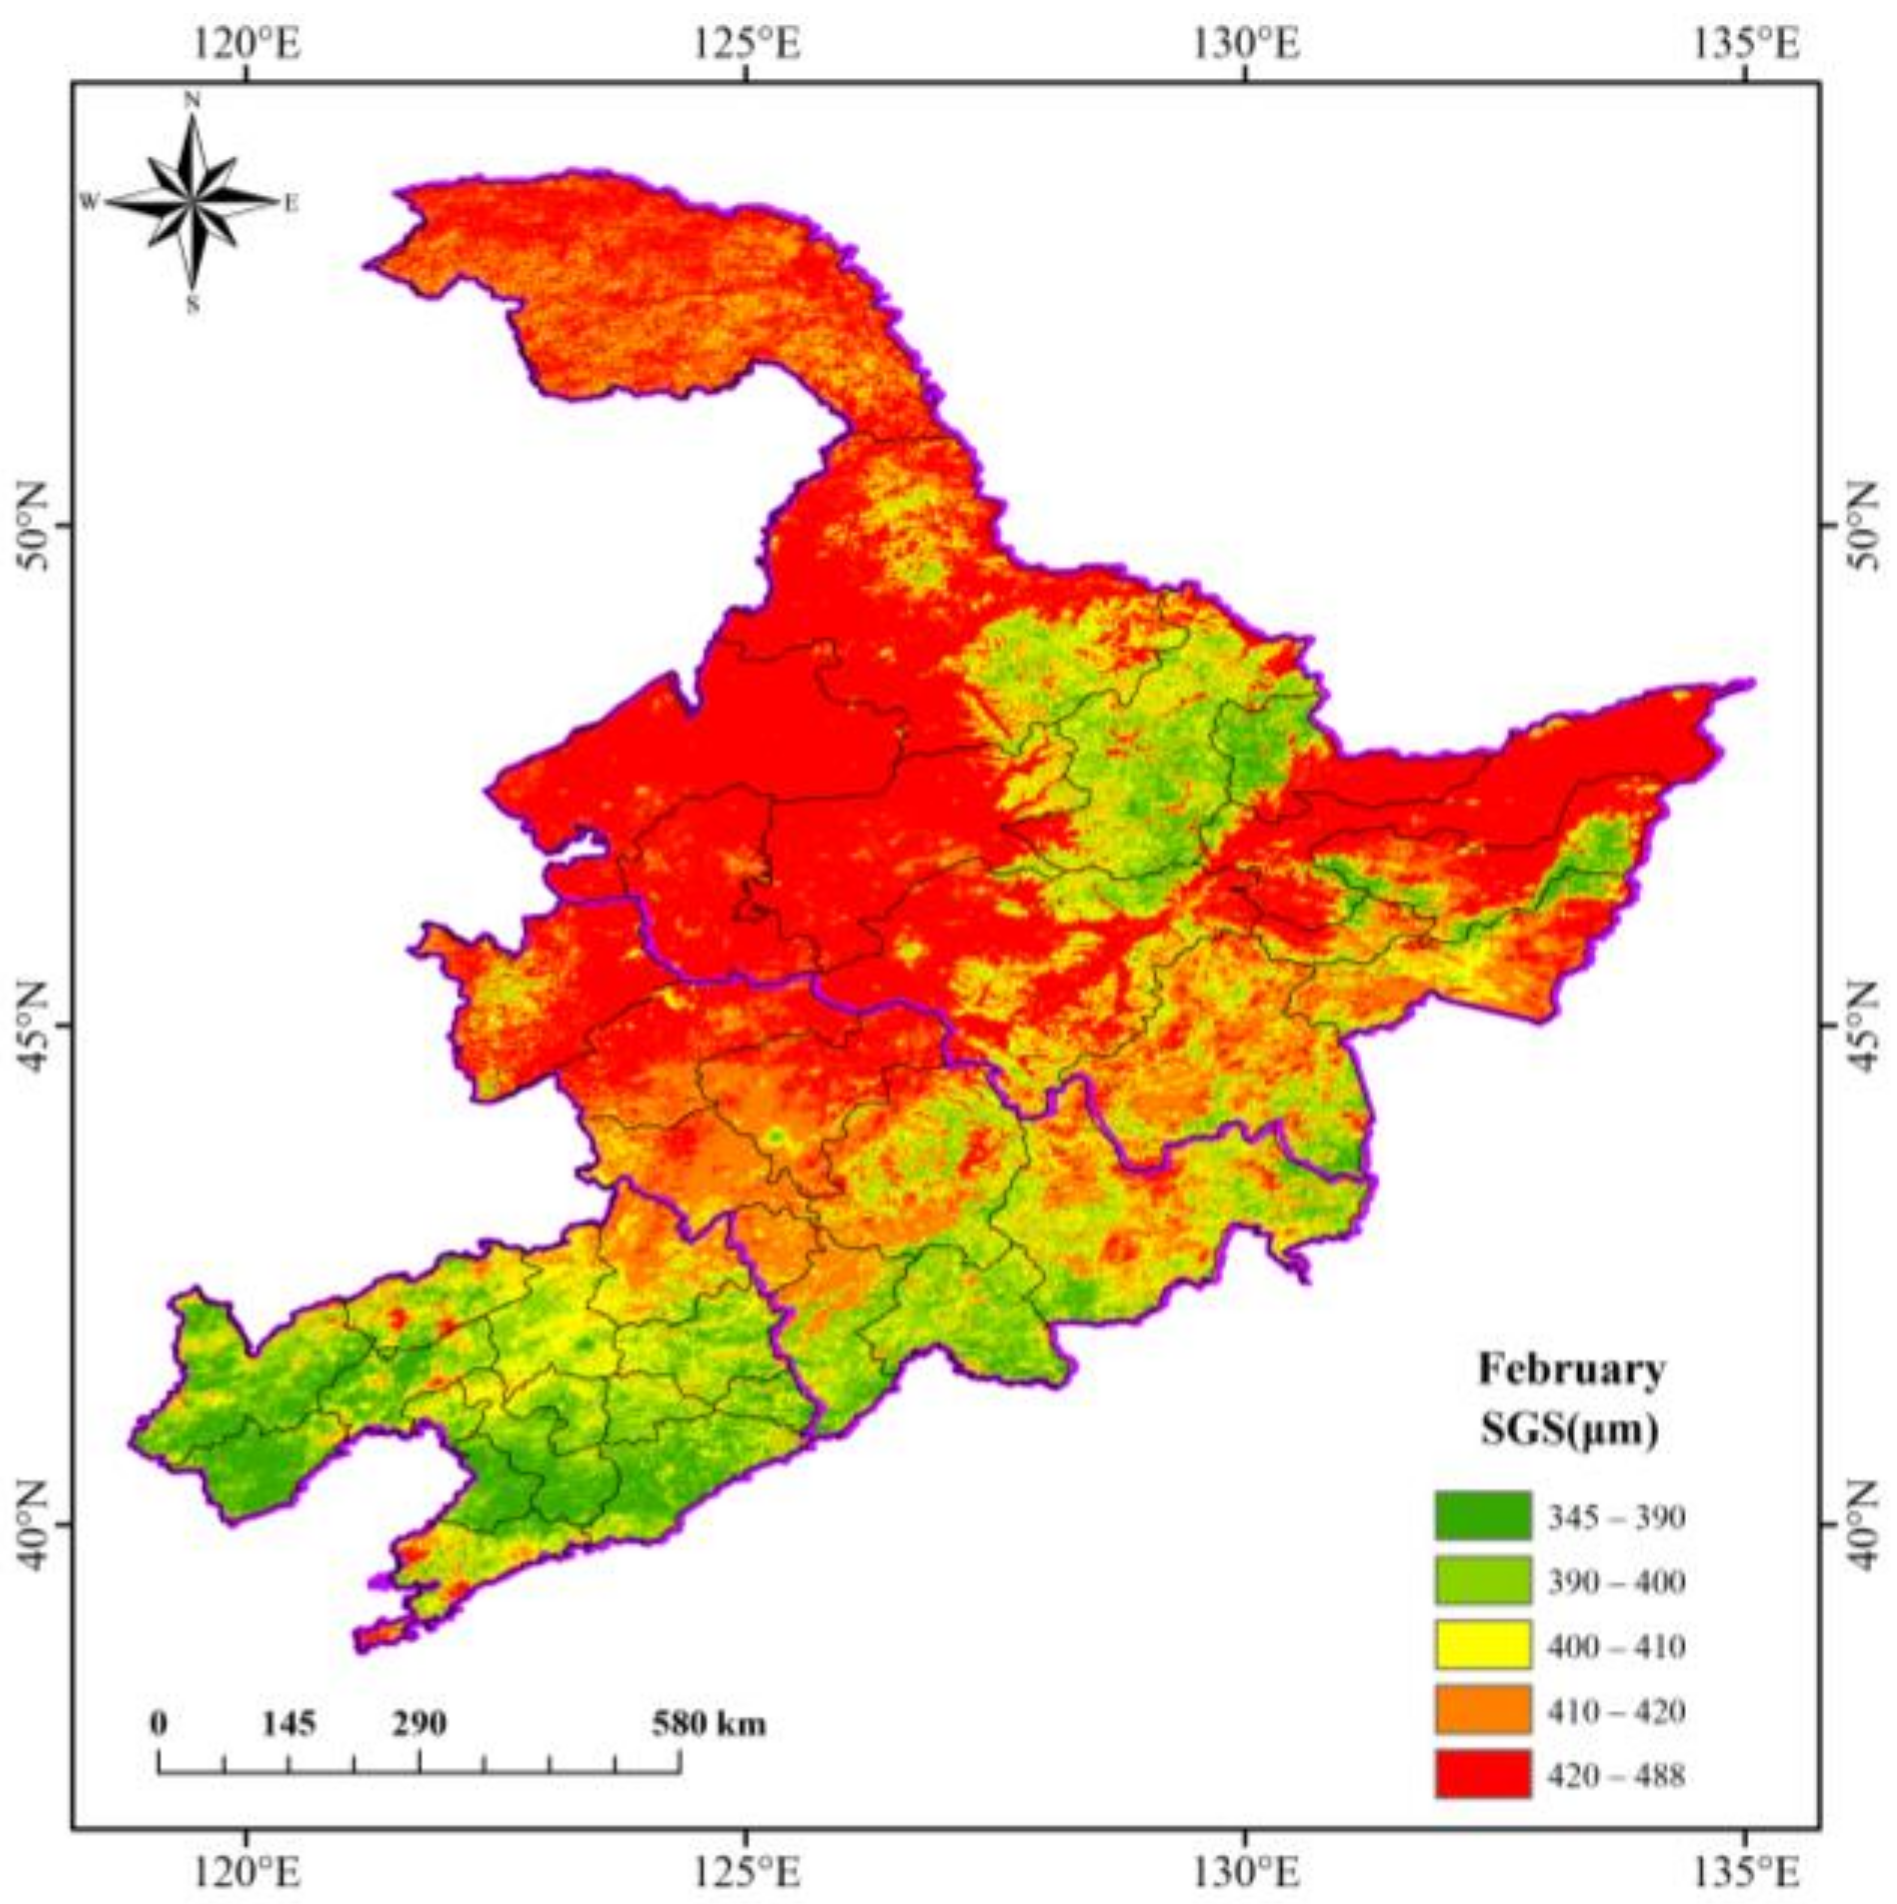
The spatial distribution of SGS in December, January and February of each year from 2000 to 2019 was superimposed and averaged to obtain the spatial distribution of SGS in northeast China in December, January and February from 2001 to 2019 (Figure 13). The spatial distribution of SGS in December, January and February in northeast China from 2001 to 2019 is characterised by being high in the north and low in the south, with three high centres of SGS in each month of winter in northeast China, namely the Daxinganling region, the northern part of Qiqihar, the southern part of Heihe and the Hegang and Jiamusi regions. All three high-value centres were present in December and January, with an SGS above 455 μm in the high-value centres. The range of the SGS sub-maximum centres (440–455 μm) in the areas of Songyuan, Changchun and Siping was extended in January. By February, there was an overall reduction in SGS. The range of high-value centres in the northern Qiqihar and southern Heihe regions continues to shrink in the north, and the range of high-value areas in the Daxinganling region is sharply reduced to a scattered distribution. Yichun, Baishan, Tonghua, Fushun, Benxi, Dandong, Huludao, Chaoyang, Fuxin and Dalian are always low-value areas, with a SGS always below 430 μm.
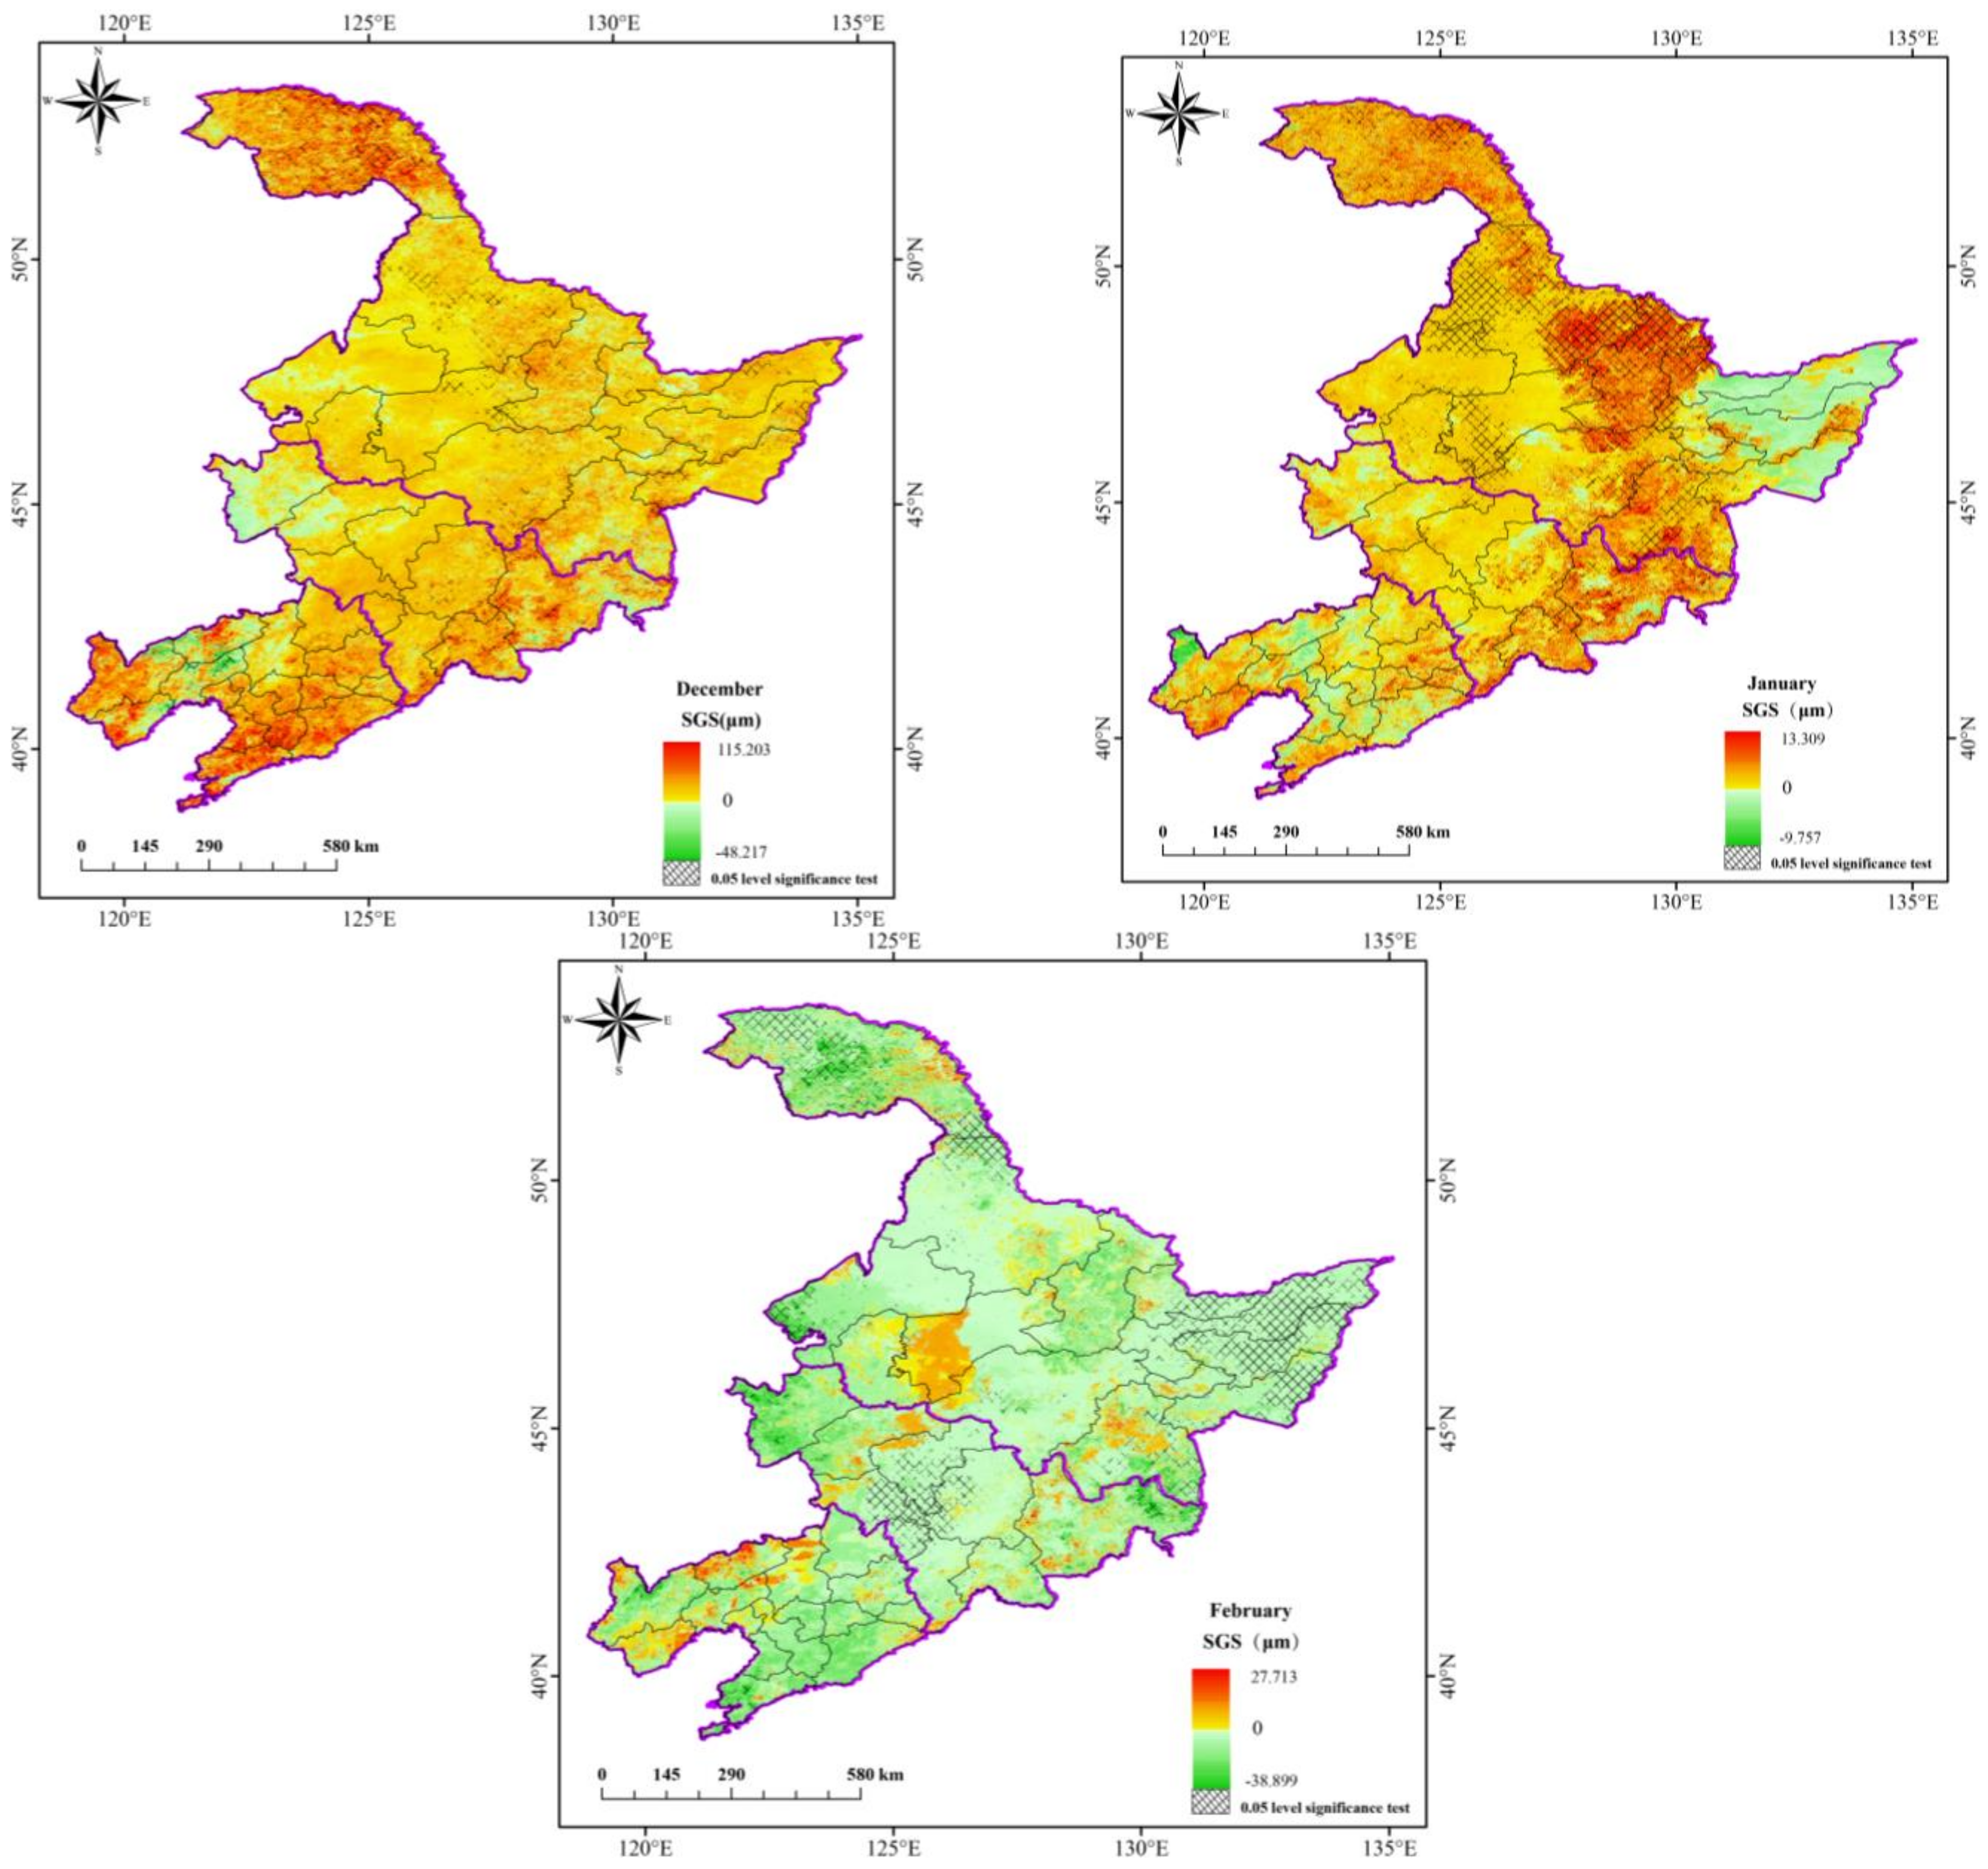
The trends in SGS variation by month in the northeast from 2001 to 2019 showed significant variability (Figure 14). The north, central and southeast of the northeast showed an increasing trend in December and January and a decreasing trend in February. The eastern Three Rivers Plain region shows a significant increasing trend in December and a decreasing trend in January and February. There is an increasing trend in all months in southern Suihua. There is an increasing trend in December and January in the southwest, showing a sporadic increasing trend in January.
The percentage of the area of increasing and decreasing snow grain size as a percentage of the northeast area from 2001 to December 2019 was 87.73% and 12.28%, respectively. The increasing area is 7.15 times larger than the decreasing area, indicating an absolute dominance of the increasing SGS area in December 2001 to 2019 in the northeast. Among them, the Daxinganling region, Chaoyang city, Yingkou city, Anshan city and Dalian city have the largest increase in SGS, above 39 μm/a; the Daxinganling region, Heihe city, Yichun city, northern Suihua, eastern Jiamusi, eastern and southern Shuangyashan, eastern Harbin city, southeastern Jilin city and western Yanbian are areas of significant increase, accounting for 5.21% of the whole northeast area. The significantly reduced areas are mainly located in the northwestern part of Jinzhou City and the southeastern part of Fuxin City, accounting for 0.17% of the total northeastern area. The percentage of the area of increasing and decreasing snow grain size as a percentage of the northeast area from 2001 to January 2019 was 82.93% and 17.07%, respectively. The enlarged area is 4.86 times larger than the reduced area, suggesting an overwhelming dominance of areas of increasing snow grain size in January in the northeast from 2001 to 2019. Among them, the northern part of the Daxinganling region, Heihe city, northern Qiqihar, northern and southern Suihua, Yichun city, eastern Harbin, Mudanjiang city and Yanbian Korean Autonomous Prefecture are significantly increased areas, and amount to 14.69% of the total northeast area. The decreasing areas are all non-significantly decreasing, concentrated in Hegang, Jiamusi, Shuangyashan and eastern Jixi, with a scattered distribution in the central and western Liaoning Province. The percentage of the area of increasing and decreasing snow grain size as a percentage of the northeast area from 2001 to February 2019 was 14.52% and 85.48%, respectively. The decreasing area is 5.89 times larger than the increasing area, suggesting an absolute dominance of areas of decreasing snow grain size in the northeast from February 2001 to 2019. The area of the significantly largest area is relatively small, accounting for only 0.03% of the northeast area, distributed in eastern Heihe and western Yanbian, southern Suihua, eastern Songyuan and Fuxin in areas with the largest snow grain size. The area of significantly reduced snow grain size was relatively large in February, accounting for 11.12% of the northeast area and mainly in northern Daxinganling, northern Heihe, eastern Hegang, Jiamusi, Shuangyashan, eastern Jixi, southeastern Mudanjiang, Changchun, Siping and northeastern Yanbian.

4. Discussion

The diameter of snow grains on the snow surface affects the energy uptake at the snow surface, which in turn affects snow melt [56]. In this study, the ART model combined with remote sensing data were used to simulate SGS in northeast China. We obtain a long-term sequence of SGS in the northeast, as well as the spatial distribution and year-to-year variation in SGS at high spatial resolution through simulations. Since the penetration of laser and radar signals in science depends on the grain size of the snow, ultimately, multilayer snow models are often combined with climate models to simulate surface meltwater and meltwater infiltration and runoff. These models require snow grain size as a boundary condition. Thus, snow models would benefit from more observations of surface grain size. The research results have important implications for snow albedo modelling studies, improving the accuracy of regional climate model simulations and snow pollution prevention.
The feasibility of the ART radiative transfer theory and the inversion of the snow grain size optimisation method has been verified in several literature studies [57]. The results of the study are basically consistent with this paper, indicating that the ART algorithm inverts the snow grain size with good accuracy. In this paper, we validate SGS values inverted by the ART algorithm using ground observations in the northeast region. The ART model takes into account the snow shape as a parameter, and both R and the RMSE are optimal and have the best accuracy when the snow is a non-spherical parameter. The RMSE and MAE of the measured and inverse snow size values were 72.89 μm and 58.34 μm, respectively, with an R2 of 0.81. It can be seen that the snow grain size obtained by the ART inversion correlates well with the observed values. However, due to the small number of actual observations and the 500 m spatial resolution of the MODIS data, the inversion results are still biased. Overall, the ART algorithm has high inversion accuracy. The comparisons between the ART inversion SGS and the measured snow grain size show some underestimation in both simulations, 23, 42, 165 and 236 μm lower from the surface downwards, respectively. In this paper, we obtain long time series of SGS data in Northeast China through snow surface SGS inversion, and analyse the characteristics of spatial and temporal distribution.
Among the optical properties of snow, the SGS directly affects the snow albedo and the amount of solar energy absorbed [58,59,60]. The larger grains increase the length of the incident light path within the ice crystal, making it more light absorbing [61,62]. As the SGS increases, the snow albedo gradually decreases [63,64]. This is mainly due to the fact that the increase in the SGS causes solar radiation to be scattered to the lower layers of the snow. The snow albedo decreases as the SGS increases [65]. Shi et al., (2022) showed that the albedo of non-spherical snow grains was 2% to 30% lower than that of spherical snow grains [66]. This study summarises the results of the SGS measurements and the corresponding albedo measurements to obtain a simple equation. Again, the results show an increase in the SGS and a decrease in the albedo. This article provides only a cursory analysis in this regard. Further in-depth research is needed to verify this.
The inversion process starts with the identification of the pure snow image elements, and how to extract them is the limitation of the study. Due to the complex surface type and the heterogeneity of snowfall, it is unlikely that the MODIS data will be completely snow-covered within the 500 m resolution, resulting in a single point inversion that is not representative of the regional average. In addition, the inversion results are only the instantaneous snow grain size at the MODIS transit under pure snow image conditions and are not representative of the daily average over the study period. In addition, the inversion results are influenced by factors such as snow layer temperature, snow density and snow water equivalent, all of which can affect the accuracy of the SGS inversion results. We divided the snow profile into four layers according to the natural stratification during the actual measurement and obtained data on snow depth, temperature, density and other characteristics. We then compared the modelled data for SGS with the field measurements. The results of the study confirm that the snowpack gradually increases in density and temperature from top to bottom, the SGS decreases, and the correlation coefficient between the modelled and observed values decreases from 0.81 to 0.39. We will further analyse the accuracy of the inversion of SGS for different snow depths and densities by tracking the variation of snow properties in time and space.
The inversion results of snow grain size are generally larger than the measured results, which may be due to the collection of snow samples, different observation instruments or other light-absorbing impurities in the snow samples, resulting in large inversion results. The bias in snow grain size is influenced by factors such as snow grain geometric optical properties and shape factor. Once, the ground measurements of the SGS have been conducted through a microscope, electronic backscattering and/or snow pit measurements are recorded, not at a single depth but throughout the pack at each layer. Then, they should be introduced in snow modelling studies. The extinction coefficients for different snow classes can be simulated using the grain size and backscattering temperature bands at 18 or 35 GHz (AMRS-E bands). The measured snow parameters are introduced into the selected model. The data assimilation scheme is followed to minimize the RMSE by comparing the differences between the model runs and ground measurements. In general, the ART algorithm has a high inversion accuracy, but due to the small number of actual observations and the non-uniform nature of snow, there are still mixed image elements in the pure snow image elements, resulting in errors. Therefore, future research will improve the accuracy of the SGS inversion results by considering the factors of SGS variation.

5. Conclusions

The average annual SGS distribution in the northeast from 2001 to 2019 varied up and down between 430.830 and 452.384 μm. The mean value was 440.823 μm, with an annual increase of 0.259 μm/a, showing a non-significant increasing trend and a coefficient of variation of 0.014. There are also differences in the SGS between winter months. The results of the 19-year simulation show that the SGS is largest in December, with a mean value of 453.923 μm, followed by January and February with 450.768 μm and 417.777 μm, respectively. The snow grain size in the Heilongjiang, Jilin and Liaoning provinces showed a non-significant increasing trend with rates of 0.312 μm/a, 0.198 μm/a and 0.201 μm/a, respectively.
The overall spatial distribution of SGS in the northeast is high in the north and low in the south, with values ranging from 380.248 μm to 497.141 μm. The mean SGS in the Liaoning, Jilin and Heilongjiang provinces was 418.201 μm, 429.193 μmg and 440.437 μm, respectively. The high-value SGS areas are located in Suihua, Qiqihar, Hehe and other areas, and in Hegang, Jiamusi, Shuangyashan and other areas, the SGSs are above 448.550 μm. The Xiaoxingan Mountains, Changbai Mountains, and eastern and western hilly areas of Liaoning Province are areas of relatively low SGS, with average values below 416 μm.
Overall, 49.98% of the northeast showed an increasing trend in SGS from 2001 to 2019. This increase is concentrated in the northern and central parts of Heilongjiang Province, the central-eastern part of Jilin Province and most of Liaoning Province. The regions with the largest increases are distributed in the Daxinganling region, eastern Heihe, Yichun, Yanbian Korean Autonomous Prefecture, Baishan, Huludao, southern Anshan, south-central Yingkou and Dalian, with growth rates ranging from 2.206 μm/a to 9.223 μm/a. The significantly increasing areas accounted for 4.49% of the total area, mainly in the northeastern part of the Daxinganling Region, eastern Heihe City, central and northern Mudanjiang. The northeast SGS reduction area accounted for 50.02% of the total area, concentrated in the eastern, central and western parts of northeast China. The largest reduction is distributed in Jixi City, Baicheng City, Songyuan City, Fuxin City and other areas between −1 μm/a and −8.232 μm/a. The significantly reduced areas were mainly in western Harbin, southern Baicheng, northern Jinzhou and central Fuxin.

Author Contributions

Writing—original draft preparation, F.Z.; writing—review and editing, L.Z.; data curation, Y.Z.; data analysis, S.W. and Y.H. All authors have read and agreed to the published version of the manuscript.

Funding

This research was funded by the China Postdoctoral Science Foundation (No. 2023M733470), the National Natural Science Foundation of China (Grant No. 42271136) and the Natural Science Foundation of Heilongjiang Province of China (No. ZD2020D002).

Data Availability Statement

The data presented in this study are available by request from the corresponding author. MOD09GA (L2G Collection6) Terra Global Day-by-Day Surface Reflectance product, provided by NASA (https://search.earthdata.nasa.gov, accessed on 9 July 2022).

Conflicts of Interest

All authors declare no conflict of interest.

References

  1. Skiles, S.M.; Flanner, M.; Cook, J.M.; Dumont, M.; Painter, T.H. Radiative forcing by light-absorbing particles in snow. Nat. Clim. Chang. 2018, 8, 964–971. [Google Scholar] [CrossRef]
  2. Dang, C.; Fu, Q.; Warren, S.G. Effect of Snow Grain Shape on Snow Albedo. J. Atmos. Sci. 2016, 73, 3573–3583. [Google Scholar] [CrossRef]
  3. Fan, C.Y.; Cheng, C.; Qi, P.; Liu, X.Y.; Wang, X.J.; Xu, Q.S. Retrieval of Snow Grain Size and Albedo Using Two Radiative Transfer Models. Acta Opt. Sin. 2020, 40, 0901002. [Google Scholar]
  4. Guo, Z.M.; Wang, N.L.; Wu, X.B.; Wu, H.B.; Wu, Y.W. Estimate the influence of snow grain size and black carbon on albedo. Sci. Cold Arid. Reg. 2015, 7, 111–120. [Google Scholar]
  5. He, C.; Flanner, M.G.; Chen, F.; Barlage, M.; Liou, K.-N.; Kang, S.; Ming, J.; Qian, Y. Black carbon-induced snow albedo reduction over the Tibetan Plateau: Uncertainties from snow grain shape and aerosol–snow mixing state based on an updated SNICAR model. Atmos. Chem. Phys. 2018, 18, 11507–11527. [Google Scholar] [CrossRef]
  6. Wang, J.-G.; Feng, X.-Z.; Xiao, P.-F.; Liang, J.; Li, Y.; Lin, J.-T.; Li, H. The influence of snow grain size on snow bidirectional reflectance. J. Infrared Millim. Waves 2013, 32, 283–288. [Google Scholar] [CrossRef]
  7. Hao, X.-H.; Wang, J.; Wang, J.; Zhang, P.; Huang, C.L. The measurement and retrieval of the spectral reflectance of different snow grain size on Northern Xinjiang, China (SCI). Guang Pu Xue Yu Guang Pu Fen Xi Guang Pu 2013, 33, 190–195. [Google Scholar]
  8. He, C.; Liou, K.; Takano, Y.; Yang, P.; Qi, L.; Chen, F. Impact of Grain Shape and Multiple Black Carbon Internal Mixing on Snow Albedo: Parameterization and Radiative Effect Analysis. J. Geophys. Res. Atmos. 2018, 123, 1253–1268. [Google Scholar] [CrossRef]
  9. Shi, T.; Cui, J.; Wu, D.; Xing, Y.; Chen, Y.; Zhou, Y.; Pu, W.; Wang, X. Snow albedo reductions induced by the internal/external mixing of black carbon and mineral dust, and different snow grain shapes across northern China. Environ. Res. 2022, 208, 112670. [Google Scholar] [CrossRef]
  10. IPCC. The Working Group I Contribution to the Sixth Assessment Report, Climate Change 2021: The Physical Science Basis; The Intergovernmental Panel on Climate Change: Geneva, Switzerland, 2021. [Google Scholar]
  11. Huang, C.; Margulis, S.A.; Durand, M.T.; Musselman, K.N. Assessment of Snow Grain-Size Model and Stratigraphy Representation Impacts on Snow Radiance Assimilation: Forward Modeling Evaluation. IEEE Trans. Geosci. Remote Sens. 2012, 50, 4551–4564. [Google Scholar] [CrossRef]
  12. Jafariserajehlou, S.; Rozanov, V.V.; Vountas, M.; Gatebe, C.K.; Burrows, J.P. Simulated reflectance above snow constrained by airborne measurements of solar radiation: Implications for the snow grain morphology in the Arctic. Atmos. Meas. Tech. 2021, 14, 369–389. [Google Scholar] [CrossRef]
  13. Kokhanovsky, A.; Rozanov, V.V.; Aoki, T.; Odermatt, D.; Brockmann, C.; Krüger, O.; Bouvet, M.; Drusch, M.; Hori, M. Sizing snow grains using backscattered solar light. Int. Remote Sens. 2011, 32, 6975–7008. [Google Scholar] [CrossRef]
  14. He, C.; Takano, Y.; Liou, K.-N.; Yang, P.; Li, Q.; Chen, F. Impact of Snow Grain Shape and Black Carbon–Snow Internal Mixing on Snow Optical Properties: Parameterizations for Climate Models. J. Clim. 2017, 30, 10019–10036. [Google Scholar] [CrossRef]
  15. Vandecrux, B.; Box, M.N.J.E.; Wehrlé, A.; Kokhanovsky, A.A.; Picard, G.; Niwano, M.; Hörhold, M.; Faber, A.-K.; Steen-Larsen, H.C. The Determination of the Snow Optical Grain Diameter and Snowmelt Area on the Greenland Ice Sheet Using Spaceborne Optical Observations. Remote Sens. 2022, 14, 932. [Google Scholar] [CrossRef]
  16. Berisford, D.F.; Molotch, N.P.; Durand, M.T.; Painter, T.H. Portable spectral profiler probe for rapid snow grain size stratigraphy. Cold Reg. Sci. Technol. 2013, 85, 183–190. [Google Scholar] [CrossRef]
  17. Carlsen, T.; Birnbaum, G.; Ehrlich, A.; Freitag, J.; Heygster, G.; Istomina, L.; Kipfstuhl, S.; Orsi, A.; Schäfer, M.; Wendisch, M. Comparison of different methods to retrieve optical-equivalent snow grain size in central Antarctica. Cryosphere 2017, 11, 2727–2741. [Google Scholar] [CrossRef]
  18. Chen, C.-T.; Tsang, L.; Wood, A.; Guo, J. Passive microwave remote sensing of snow parameters constrained by snow hydrology model and snow grain size growth. In Proceedings of the IEEE International Symposium on Geosci. Remote Sensing (IGARSS), Kuala Lampur, Malaysia, 17–22 July 2000; Volume 4, pp. 1522–1524. [Google Scholar] [CrossRef]
  19. Fair, Z.; Flanner, M.; Schneider, A.; Skiles, S.M. Sensitivity of modeled snow grain size retrievals to solar geometry, snow particle asphericity, and snowpack impurities. Cryosphere 2022, 16, 3801–3814. [Google Scholar] [CrossRef]
  20. Jalali, A.; Shukla, D.P. Snow grain size estimation of a site in the indian himalayan region using hyperspectral remote sensing: Aviris-NG data. In Proceedings of the IEEE International Symposium on Geoscience and Remote Sensing (IGARSS), Yokohama, Japan, 28 July–2 August 2019; pp. 4080–4083. [Google Scholar] [CrossRef]
  21. Colbeck, S. Grain clusters in wet snow. J. Colloid Interface Sci. 1979, 72, 371–384. [Google Scholar] [CrossRef]
  22. Donahue, C.; Skiles, S.M.; Hammonds, K. In situ effective snow grain size mapping using a compact hyperspectral imager. J. Glaciol. 2020, 67, 49–57. [Google Scholar] [CrossRef]
  23. Chen, T.; Pan, J.; Chang, S.; Xiong, C.; Shi, J.; Liu, M.; Che, T.; Wang, L.; Liu, H. Validation of the SNTHERM Model Applied for Snow Depth, Grain Size, and Brightness Temperature Simulation at Meteorological Stations in China. Remote Sens. 2020, 12, 507. [Google Scholar] [CrossRef]
  24. Constantin, J.G.; Ruiz, L.; Villarosa, G.; Outes, V.; Bajano, F.N.; He, C.; Bajano, H.; Dawidowski, L. Measurements and modeling of snow albedo at Alerce Glacier, Argentina: Effects of volcanic ash, snow grain size, and cloudiness. Cryosphere 2020, 14, 4581–4601. [Google Scholar] [CrossRef]
  25. Mary, A.; Dumont, M.; Dedieu, J.-P.; Durand, Y.; Sirguey, P.; Milhem, H.; Mestre, O.; Negi, H.S.; Kokhanovsky, A.A.; Lafaysse, M.; et al. Intercomparison of retrieval algorithms for the specific surface area of snow from near-infrared satellite data in mountainous terrain, and comparison with the output of a semi-distributed snowpack model. Cryosphere 2013, 7, 741–761. [Google Scholar] [CrossRef]
  26. Wiscombe, W.J.; Warren, S.G. A model for the Spectral albedo of snow. I: Pure Snow. J. Atmos. Sci. 1980, 37, 2712–2733. [Google Scholar] [CrossRef]
  27. Nolin, A.W.; Dozier, J. Estimating snow grain size using AVIRIS data. Remote Sens. Environ. 1993, 44, 231–238. [Google Scholar] [CrossRef]
  28. Brucker, L.; Picard, G.; Fily, M. Snow grain-size profiles deduced from microwave snow emissivities in Antarctica. J. Glaciol. 2010, 56, 514–526. [Google Scholar] [CrossRef]
  29. Golubev, V.N.; Sokratov, S.A. Regular packing of grains as a model of snow structure. Ann. Glaciol. 2004, 38, 25–29. [Google Scholar] [CrossRef]
  30. Green, R.O.; Dozier, J.; Roberts, D.; Painter, T. Spectral snow-reflectance models for grain-size and liquid-water fraction in melting snow for the solar-reflected spectrum. Ann. Glaciol. 2002, 34, 71–73. [Google Scholar] [CrossRef]
  31. Zhao, S.; Jiang, T.; Wang, Z. Snow Grain-Size Estimation Using Hyperion Imagery in a Typical Area of the Heihe River Basin, China. Remote Sens. 2013, 5, 238–253. [Google Scholar] [CrossRef]
  32. Yang, Y.; Marshak, A.; Han, M.; Palm, S.P.; Harding, D.J. Snow grain size retrieval over the polar ice sheets with the Ice, Cloud, and land Elevation Satellite (ICESat) observations. J. Quant. Spectrosc. Radiat. Transf. 2017, 188, 159–164. [Google Scholar] [CrossRef]
  33. Wu, L.; Li, X.; Zhao, K.; Zheng, X.; Jiang, T. Brightness temperature simulation of snow cover based on snow grain size evolution usingin situdata. J. Appl. Remote Sens. 2016, 10, 36016. [Google Scholar] [CrossRef]
  34. Wiebe, H.; Heygster, G.; Zege, E.; Aoki, T.; Hori, M. Snow grain size retrieval SGSP from optical satellite data: Validation with ground measurements and detection of snow fall events. Remote Sens. Environ. 2013, 128, 11–20. [Google Scholar] [CrossRef]
  35. Wang, X.; Shi, T.; Zhang, X.; Chen, Y. An Overview of Snow Albedo Sensitivity to Black Carbon Contamination and Snow Grain Properties Based on Experimental Datasets Across the Northern Hemisphere. Curr. Pollut. Rep. 2020, 6, 368–379. [Google Scholar] [CrossRef]
  36. Painter, T.H.; Dozier, J.; Roberts, D.A.; Davis, R.E.; Green, R.O. Retrieval of subpixel snow-covered area and grain size from imaging spectrometer data. Remote Sens. Environ. 2003, 85, 64–77. [Google Scholar] [CrossRef]
  37. Nolin, A.W.; Dozier, J. A Hyperspectral Method for Remotely Sensing the Grain Size of Snow. Remote Sens. Environ. 2000, 74, 207–216. [Google Scholar] [CrossRef]
  38. De Biagi, V.; Chiaia, B.; Frigo, B. Fractal grain distribution in snow avalanche deposits. J. Glaciol. 2012, 58, 340–346. [Google Scholar] [CrossRef]
  39. Fierz, C.; Baunach, T. Quantifying grain-shape changes in snow subjected to large temperature gradients. Ann. Glaciol. 2000, 31, 439–444. [Google Scholar] [CrossRef]
  40. Kokhanovsky, A.A. Optical sizing of irregular snow grains. Atti Accad. Peloritana Pericolanti Cl. Sci. Fis. Mat. Nat. 2011, 89, 000216371300051. [Google Scholar] [CrossRef]
  41. Jäkel, E.; Carlsen, T.; Ehrlich, A.; Wendisch, M.; Schäfer, M.; Rosenburg, S.; Nakoudi, K.; Zanatta, M.; Birnbaum, G.; Helm, V.; et al. Measurements and Modeling of Optical-Equivalent Snow Grain Sizes under Arctic Low-Sun Conditions. Remote Sens. 2021, 13, 4904. [Google Scholar] [CrossRef]
  42. Tanikawa, T.; Kuchiki, K.; Aoki, T.; Ishimoto, H.; Hachikubo, A.; Niwano, M.; Hosaka, M.; Matoba, S.; Kodama, Y.; Iwata, Y.; et al. Effects of Snow Grain Shape and Mixing State of Snow Impurity on Retrieval of Snow Physical Parameters from Ground-Based Optical Instrument. J. Geophys. Res. Atmos. 2020, 125, e2019JD031858. [Google Scholar] [CrossRef]
  43. Räisänen, P.; Makkonen, R.; Kirkevåg, A.; Debernard, J.B. Effects of snow grain shape on climate simulations: Sensitivity tests with the Norwegian Earth System Model. Cryosphere 2017, 11, 2919–2942. [Google Scholar] [CrossRef]
  44. Zheng, Y.; Zhang, L.; Li, W.; Zhang, F.; Zhong, X. Spatial-Temporal Variation of Snow Black Carbon Concentration in Snow Cover in Northeast China from 2001 to 2016 Based on Remote Sensing. Sustainability 2022, 14, 959. [Google Scholar] [CrossRef]
  45. Zhang, L.; Wang, C.; Li, Y.; Huang, Y.; Zhang, F.; Pan, T. High-latitude snowfall as a sensitive indicator of climate warming: A case study of Heilongjiang Province, China. Ecol. Indic. 2020, 122, 107249. [Google Scholar] [CrossRef]
  46. Venkataraman, G.; Singh, G.; Kumar, V.; Mohite, K.; Rao, Y.S. Snow grain size estimation in Himalayan snow covered region using advanced synthetic aperture radar data. Earth Obs. Syst. 2007, 6677, 667718. [Google Scholar] [CrossRef]
  47. Gay, M.; Fily, M.; Genthon, C.; Frezzotti, M.; Oerter, H.; Winther, J.-G. Snow grain-size measurements in Antarctica. J. Glaciol. 2002, 48, 527–535. [Google Scholar] [CrossRef]
  48. Ban, J.; Sun, M. Causality analysis of winter precipitation anomalies in Heilongjiang province in 2012. Heilongjiang Meteorol. 2013, 30, 1–4. (In Chinese) [Google Scholar]
  49. Jian, W.; Tao, C.; Zhen, L. Survey of snow characteristics and distribution in China. Prog. Earth Sci. 2018, 33, 426–635. (In Chinese) [Google Scholar]
  50. Fu, Q.; Hou, R.; Wang, Z.; Li, T. Soil moisture thermal interaction effects under snow cover during freezing and thawing period. Trans. Chin. Soc. Agric. Eng. 2021, 31, 101–107. [Google Scholar] [CrossRef]
  51. Zhang, F.; Zhang, L.; Pan, M.; Zhong, X.; Zhao, E.; Wang, Y.; Du, C. Black carbon and mineral dust in snow cover across a typical city of Northeast China. Sci. Total Environ. 2022, 807, 150397. [Google Scholar] [CrossRef]
  52. Wang, J.; Feng, X.; Xiao, P.; Ye, N.; Zhang, X.; Cheng, Y. Snow Grain-Size Estimation Over Mountainous Areas from MODIS Imagery. IEEE Geosci. Remote Sens. Lett. 2016, 15, 97–101. [Google Scholar] [CrossRef]
  53. Hall, D.K.; Riggs, G.A.; Salomonson, V.V. Development of methods for mapping global snow cover using moderate resolution imaging spectroradiometer data. Remote Sens. Environ. 1995, 54, 127–140. [Google Scholar] [CrossRef]
  54. Hao, X.H.; Wang, J.; Li, H.Y. Evaluation of the NDSI Threshold Value in Mapping Snow Cover of MODIS—A Case Study of Snow in the Middle Qilian Mountains. J. Glac. Geocryol. 2008, 30, 132–138. [Google Scholar]
  55. Kokhanovsky, A.A.; Zege, E.P. Scattering optics of snow. Appl. Opt. 2004, 43, 1589–1602. [Google Scholar] [CrossRef] [PubMed]
  56. Langlois, A.; Royer, A.; Montpetit, B.; Roy, A.; Durocher, M. Presenting Snow Grain Size and Shape Distributions in Northern Canada Using a New Photographic Device Allowing 2D and 3D Representation of Snow Grains. Front. Earth Sci. 2020, 7. [Google Scholar] [CrossRef]
  57. Seidel, F.C.; Rittger, K.; Skiles, S.M.; Molotch, N.P.; Painter, T.H. Case study of spatial and temporal variability of snow cover, grain size, albedo and radiative forcing in the Sierra Nevada and Rocky Mountain snowpack derived from imaging spectroscopy. Cryosphere 2016, 10, 1229–1244. [Google Scholar] [CrossRef]
  58. Wang, J.; Feng, X.-Z.; Xiao, P.-F.; Liang, J.; Zhang, X.-L.; Li, H.-X.; Li, Y. Hyperspectral Remote Sensing Estimation Models for Snow Grain Size. Spectrosc. Spectr. Anal. 2013, 33, 177–181. [Google Scholar]
  59. Painter, T.H.; Molotch, N.P.; Cassidy, M.; Flanner, M.; Steffen, K. Contact spectroscopy for determination of stratigraphy of snow optical grain size. J. Glaciol. 2007, 53, 121–127. [Google Scholar] [CrossRef]
  60. Libois, Q.; Picard, G.; France, J.L.; Arnaud, L.; Dumont, M.; Carmagnola, C.M.; King, M.D. Influence of grain shape on light penetration in snow. Cryosphere 2013, 7, 1803–1818. [Google Scholar] [CrossRef]
  61. Negi, H.S.; Kokhanovsky, A. Retrieval of snow albedo and grain size using reflectance measurements in Himalayan basin. Cryosphere 2011, 5, 203–217. [Google Scholar] [CrossRef]
  62. Painter, T.H.; Rittger, K.; McKenzie, C.; Slaughter, P.; Davis, R.E.; Dozier, J. Retrieval of subpixel snow covered area, grain size, and albedo from MODIS. Remote Sens. Environ. 2009, 113, 868–879. [Google Scholar] [CrossRef]
  63. Picard, G.; Löwe, H.; Domine, F.; Arnaud, L.; Larue, F.; Favier, V.; Le Meur, E.; Lefebvre, E.; Savarino, J.; Royer, A. The Microwave Snow Grain Size: A New Concept to Predict Satellite Observations Over Snow-Covered Regions. AGU Adv. 2022, 3, e2021AV000630. [Google Scholar] [CrossRef]
  64. Painter, T.H. Comment on Singh and others, ‘Hyperspectral analysis of snow reflectance to understand the effects of contamination and grain size’. J. Glaciol. 2011, 57, 183–185. [Google Scholar] [CrossRef]
  65. Cao, X.; Ding, X.; Chen, W.; Wang, X.; Cui, J.; Zhang, Z. Simulation of snow albedo and snow particle size for black carbon deposition in arid zones. China Environ. Sci. 2020, 40, 2345–2352. [Google Scholar]
  66. Shi, T.; Cui, J.; Chen, Y.; Zhou, Y.; Pu, W.; Xu, X.; Chen, Q.; Zhang, X.; Wang, X. Enhanced light absorption and reduced snow albedo due to internally mixed mineral dust in grains of snow. Atmos. Chem. Phys. 2021, 21, 6035–6051. [Google Scholar] [CrossRef]
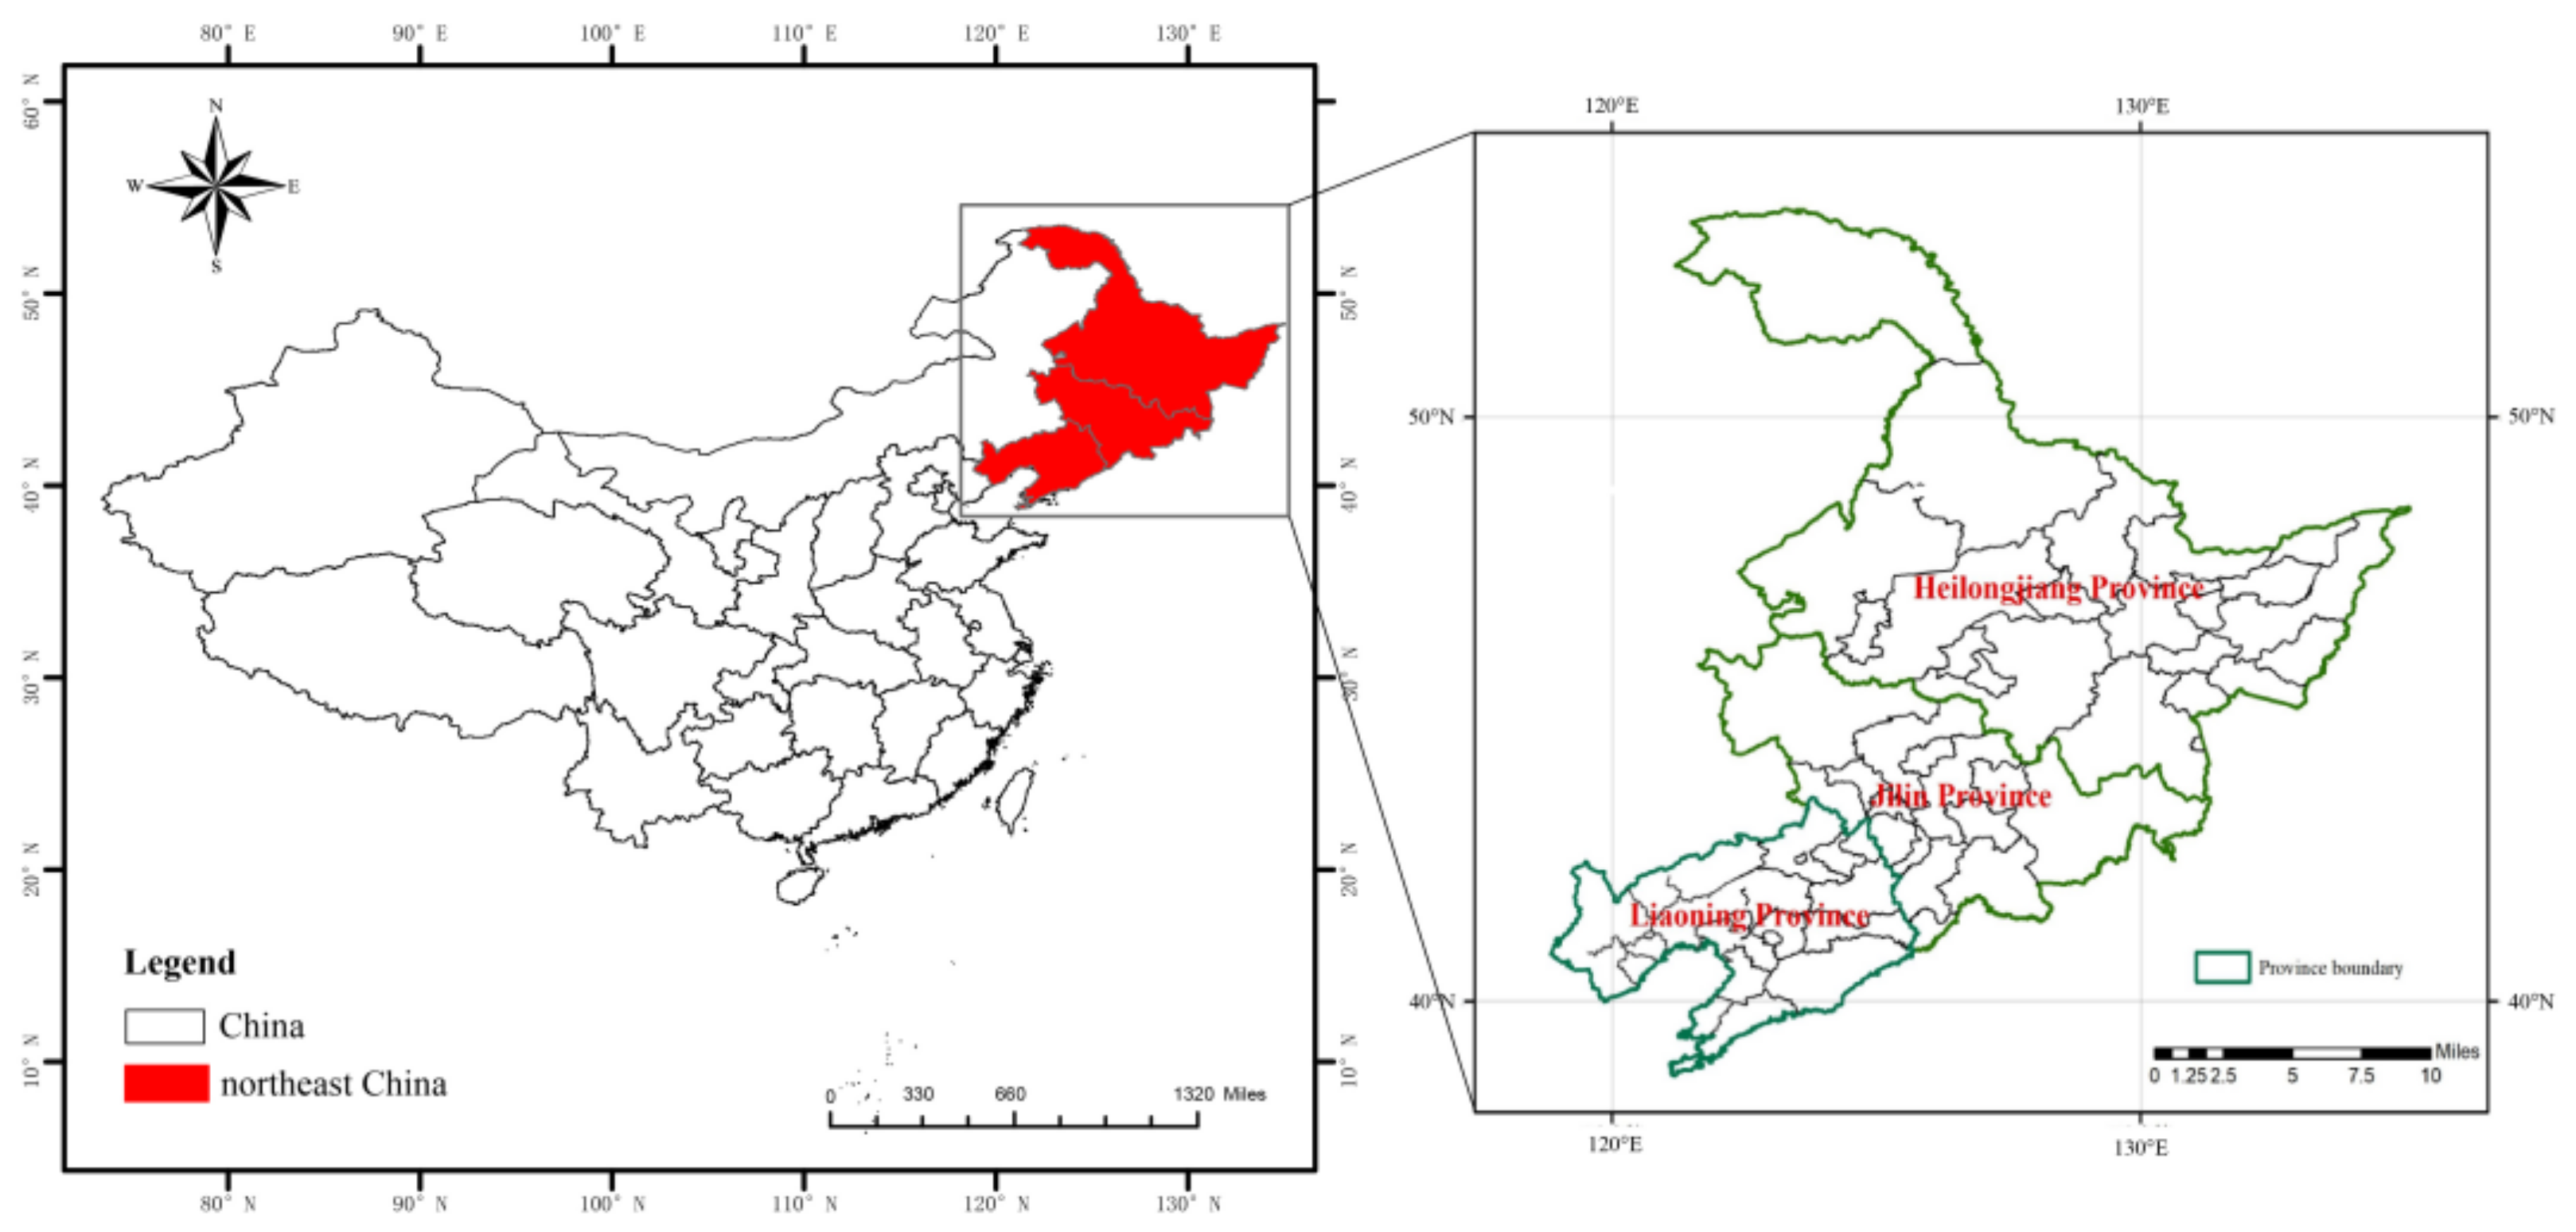
Figure 1. Study area.
Remotesensing 15 04970 g001
Figure 2. Field observation of snow grain size. Field observation sites and photographs of snow grain size observation equipment and field observations.
Remotesensing 15 04970 g002
Figure 3. Field measured snow grain size.
Remotesensing 15 04970 g003
Figure 4. Characteristics of vegetation cover in northeast China.
Remotesensing 15 04970 g004
Figure 5. Interannual variation in SGS in northeast China, 2001−2019.
Remotesensing 15 04970 g005
Figure 6. Spatial distribution of SGS in northeast China from 2001 to 2019.
Remotesensing 15 04970 g006
Figure 7. Average SGS in northeast China 2001–2019 (a), average value of 2009–2019 (b) spatial distribution.
Remotesensing 15 04970 g007
Figure 8. Spatial distribution of SGS tendency rate in northeast China from 2001 to 2019.
Remotesensing 15 04970 g008
Figure 9. Spatial distribution of sig value of SGS in Northeast China from 2001 to 2019.
Remotesensing 15 04970 g009
Figure 10. Spatial distribution of SGS difference of snow cover in northeast China from 2001 to 2019.
Remotesensing 15 04970 g010
Figure 11. Spatial distribution of SGS change in Northeast China from 2001 to 2019.
Remotesensing 15 04970 g011
Figure 12. Interannual variation in snow grain size in the snow in northeast China from 2001 to 2019.
Remotesensing 15 04970 g012
Figure 13. Monthly mean value of snow grain size in each month of northeast China from 2001 to 2019.
Remotesensing 15 04970 g013aRemotesensing 15 04970 g013b
Figure 14. Monthly snow grain size tendency rate of snow in each month of northeast China from 2001 to 2019.
Remotesensing 15 04970 g014
Table 1. Parameter list used in ART.
ParametersSignificanceUnit
R1Snow reflectivity in channel 1 semi-infinite space-
R2Snow reflectivity in channel 2 semi-infinite space-
R0Semi-infinite space snow layer reflectivity function-
f ( μ , μ 0 , φ ) Determined by escape function and semi-infinite space snow
layer reflectivity function
-
gAsymmetry factor0.76
BConstants0.84
αs,iAbsorption coefficient of BC-
cRelative concentrations of BCng/g
α e f Snow grain sizemm
α i , 2 Absorption coefficient of ice-
βPhoton absorption probability of ice crystals0.47
KConstants2.63
ϑ 0 Solar zenith angledegree
ϑ Observation of the zenith angledegree
φ Relative azimuthdegree
Table 2. Parameter list used in the temperature function, R0.
ParametersSignificanceValue
AConstants1.247
BConstants1.186
CConstants5.157
μObservation of the zenith angle cosine[-]
μ0Cosine of the solar zenith angle[-]
P(θ) Phase functions[-]
Table 3. Comparison of modelled and observed SGS.
YearMean Different (μm)RMSD (μm)Pearson’s Correlation Coefficient (r)Days (N)
January 201428620.7721
December 201831780.7126
February 201919530.6519
all26650.6966
Disclaimer/Publisher’s Note: The statements, opinions and data contained in all publications are solely those of the individual author(s) and contributor(s) and not of MDPI and/or the editor(s). MDPI and/or the editor(s) disclaim responsibility for any injury to people or property resulting from any ideas, methods, instructions or products referred to in the content.