

An On-Orbit Relative Sensor Normalization for Unbalance Images from the Ice Pathfinder Satellite (BNU-1)

Abstract
:
1. Introduction
2. Data and Methods
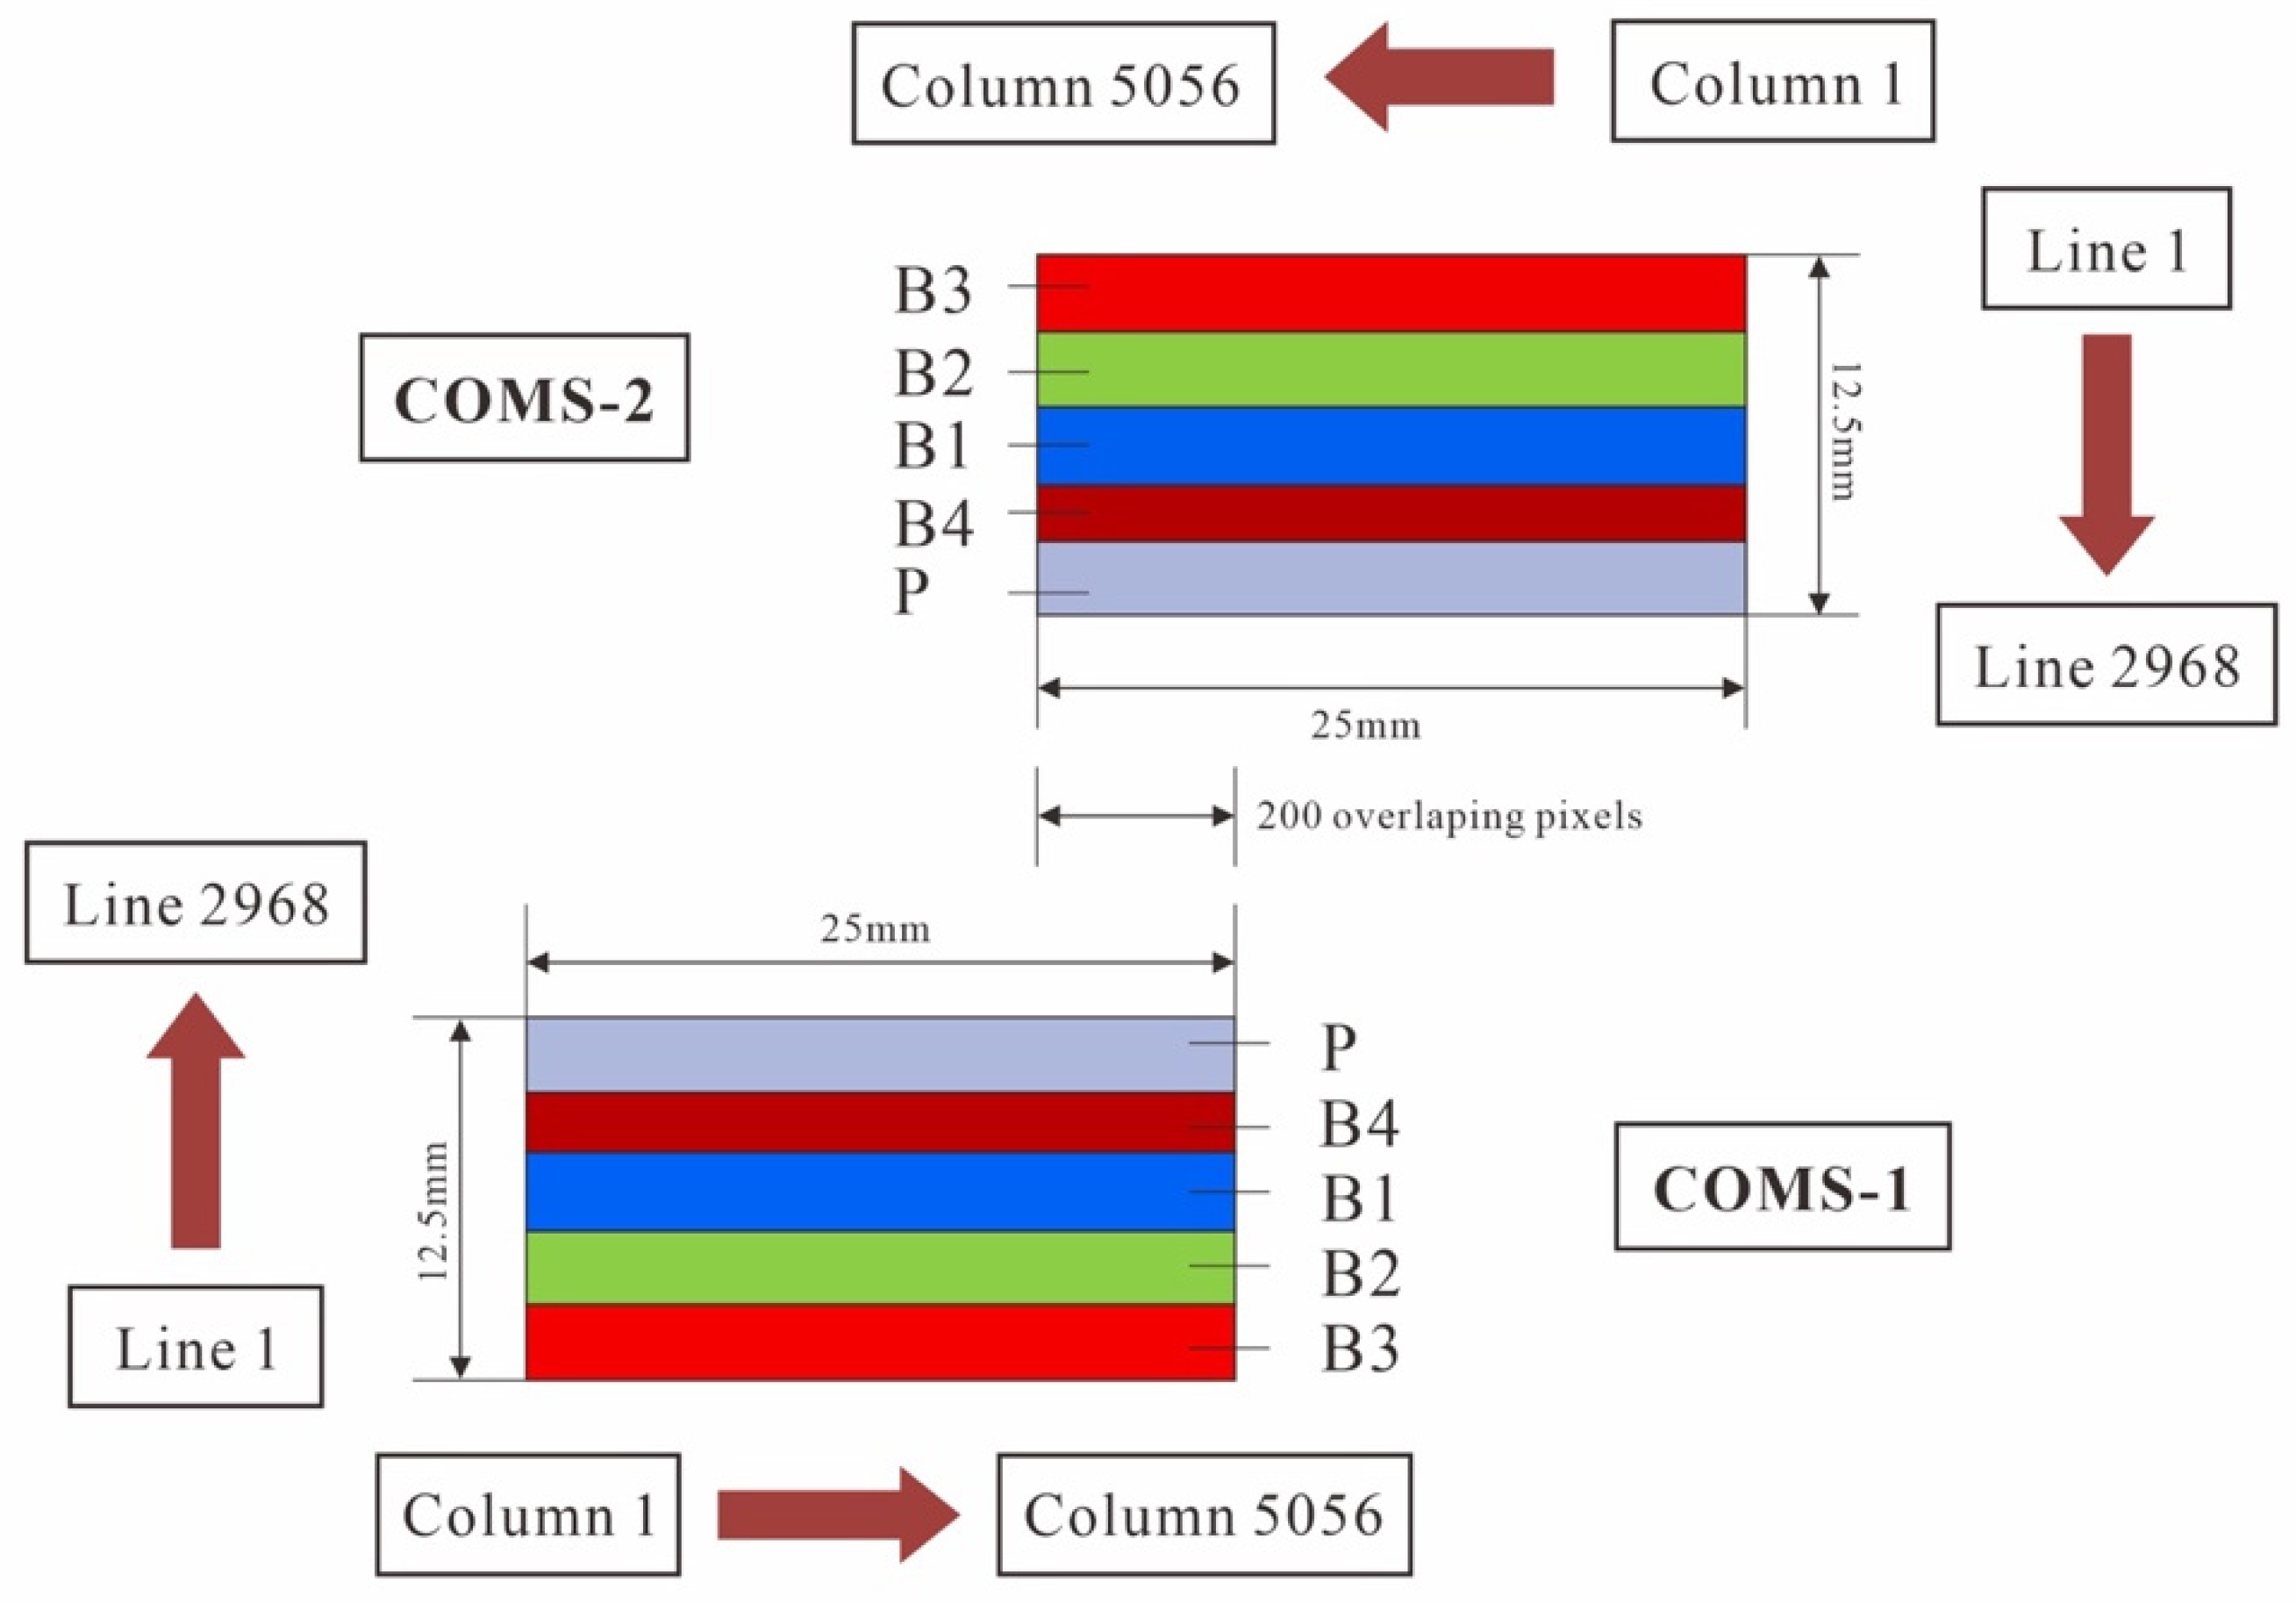
2.1. Introduction to the Wide-Field Camera Carried by BNU-1
2.2. BNU-1 Data
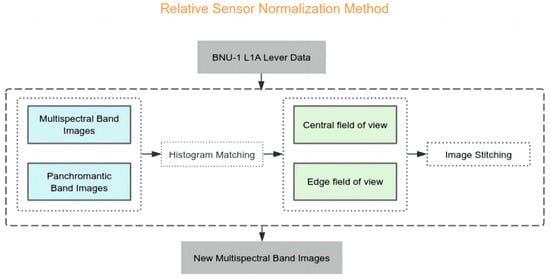
2.3. The Relative Radiometric Correction
- (1)
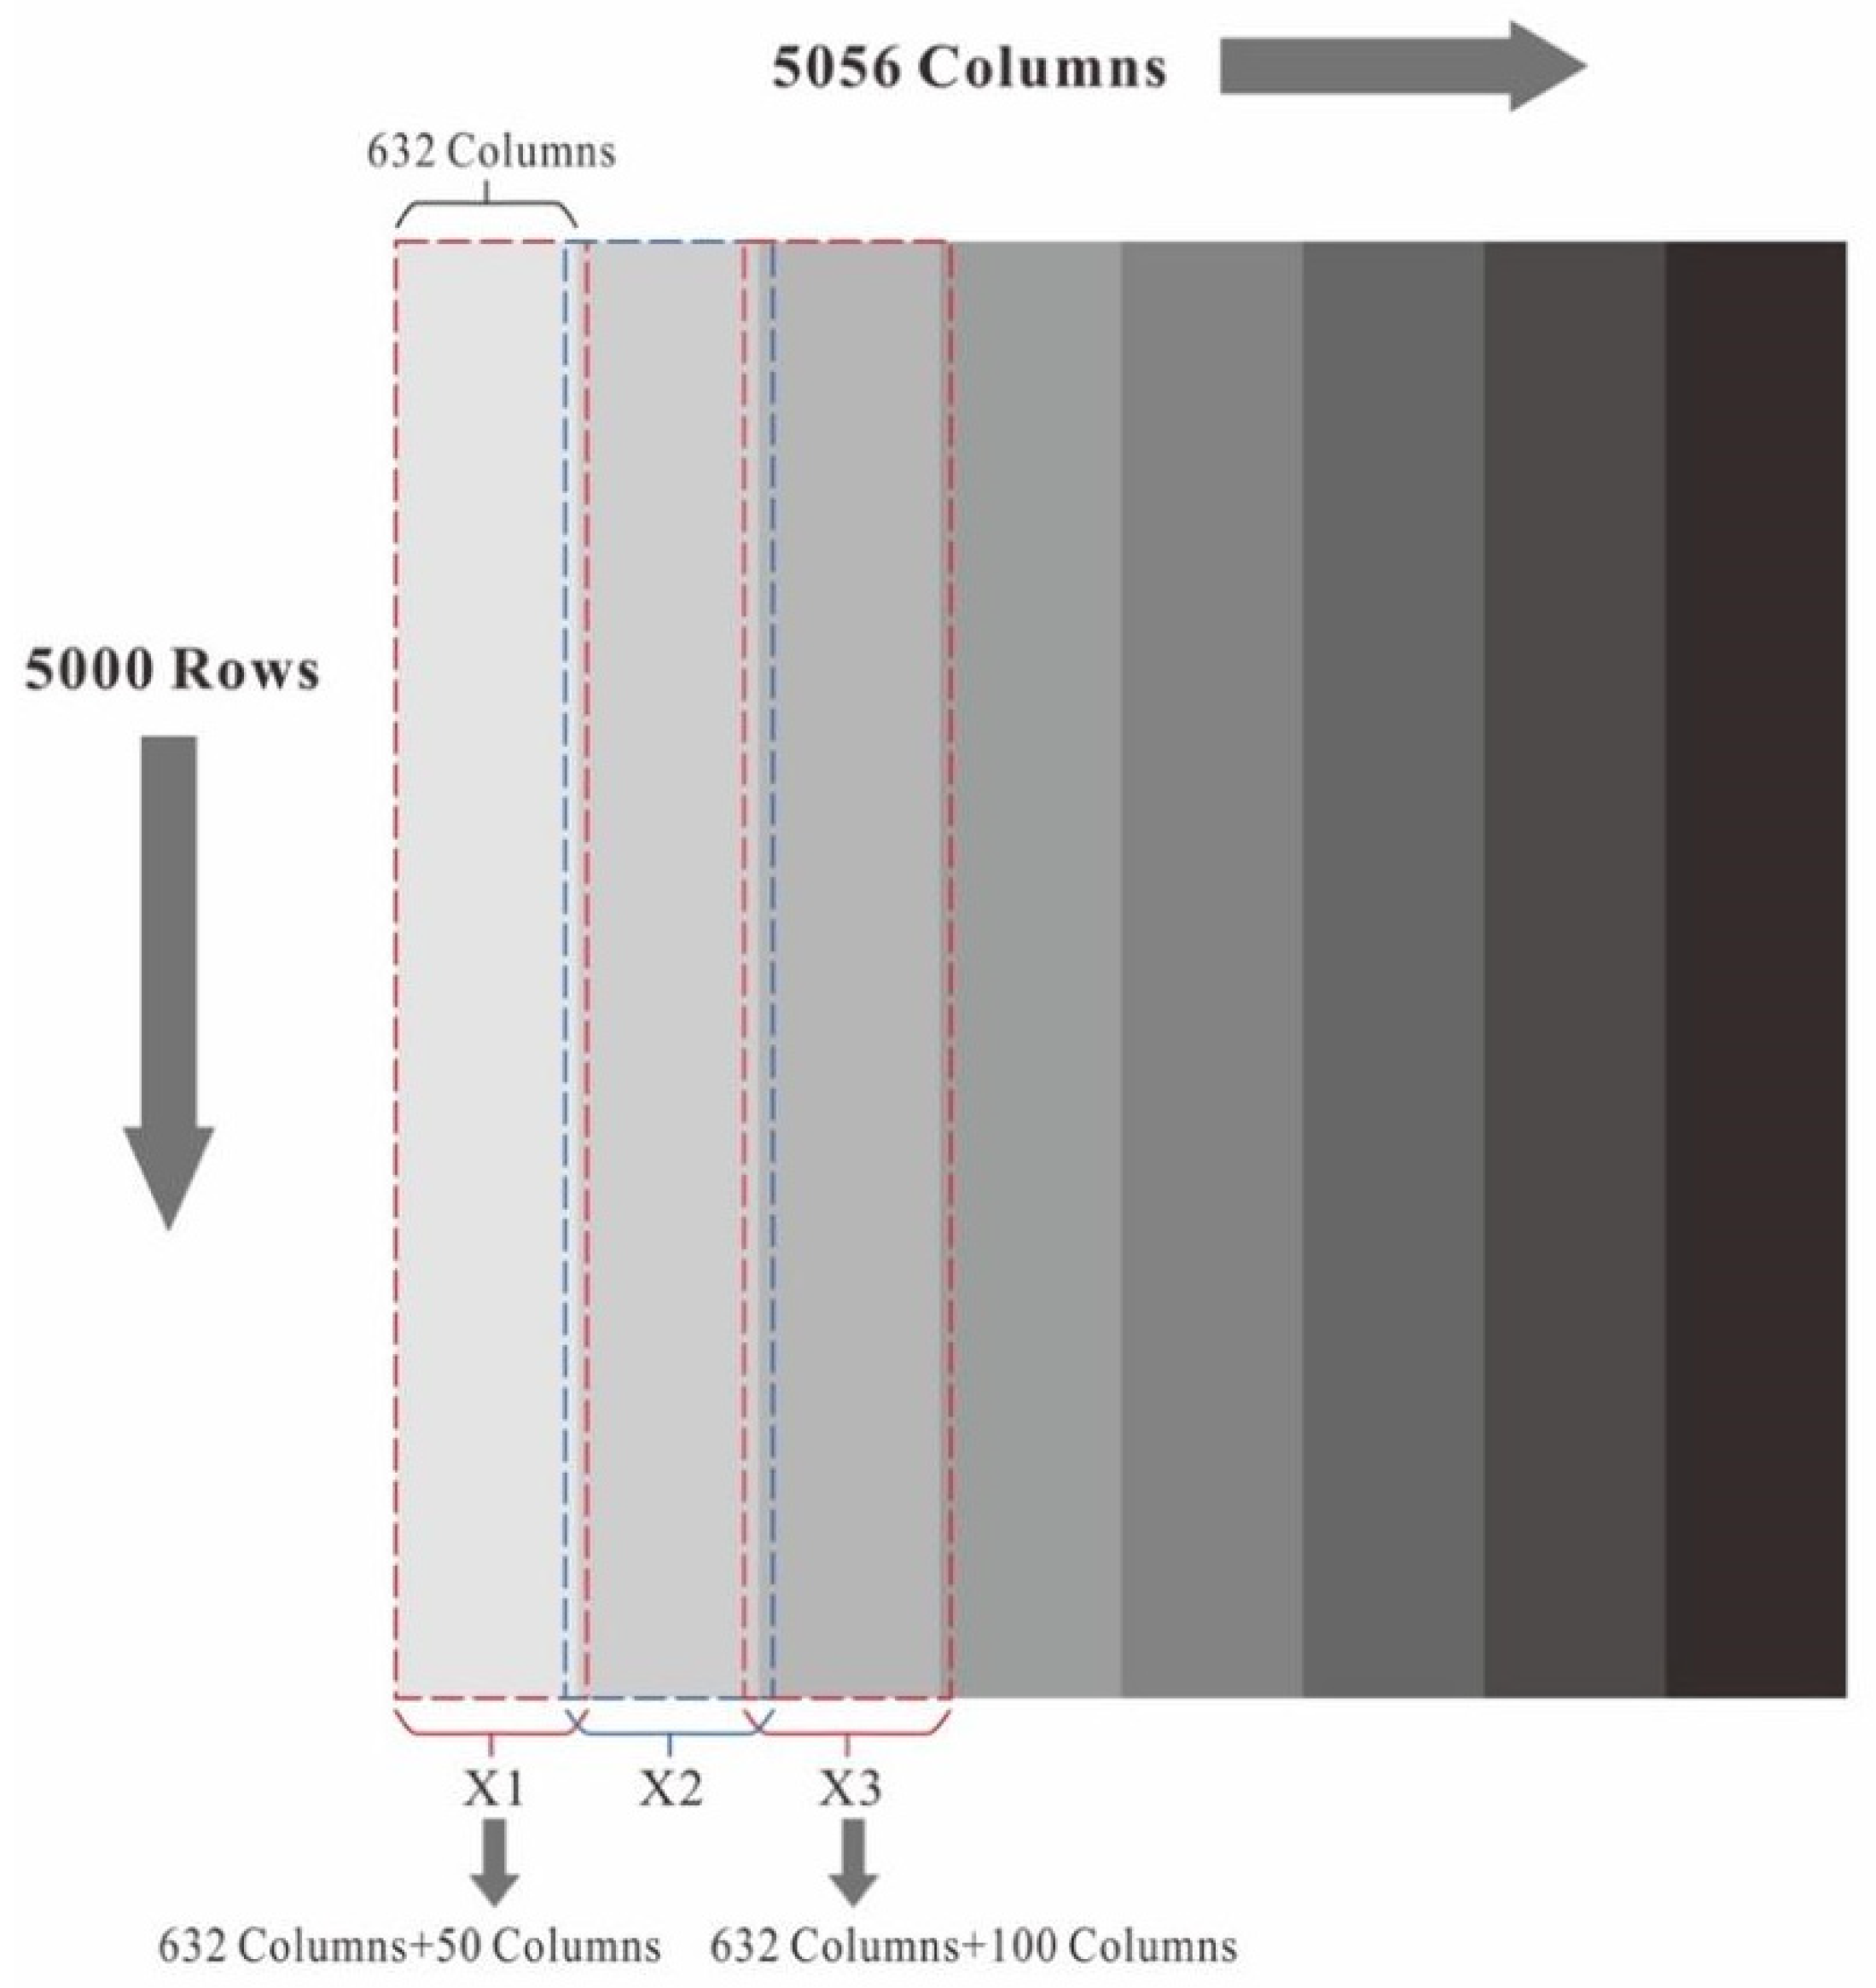
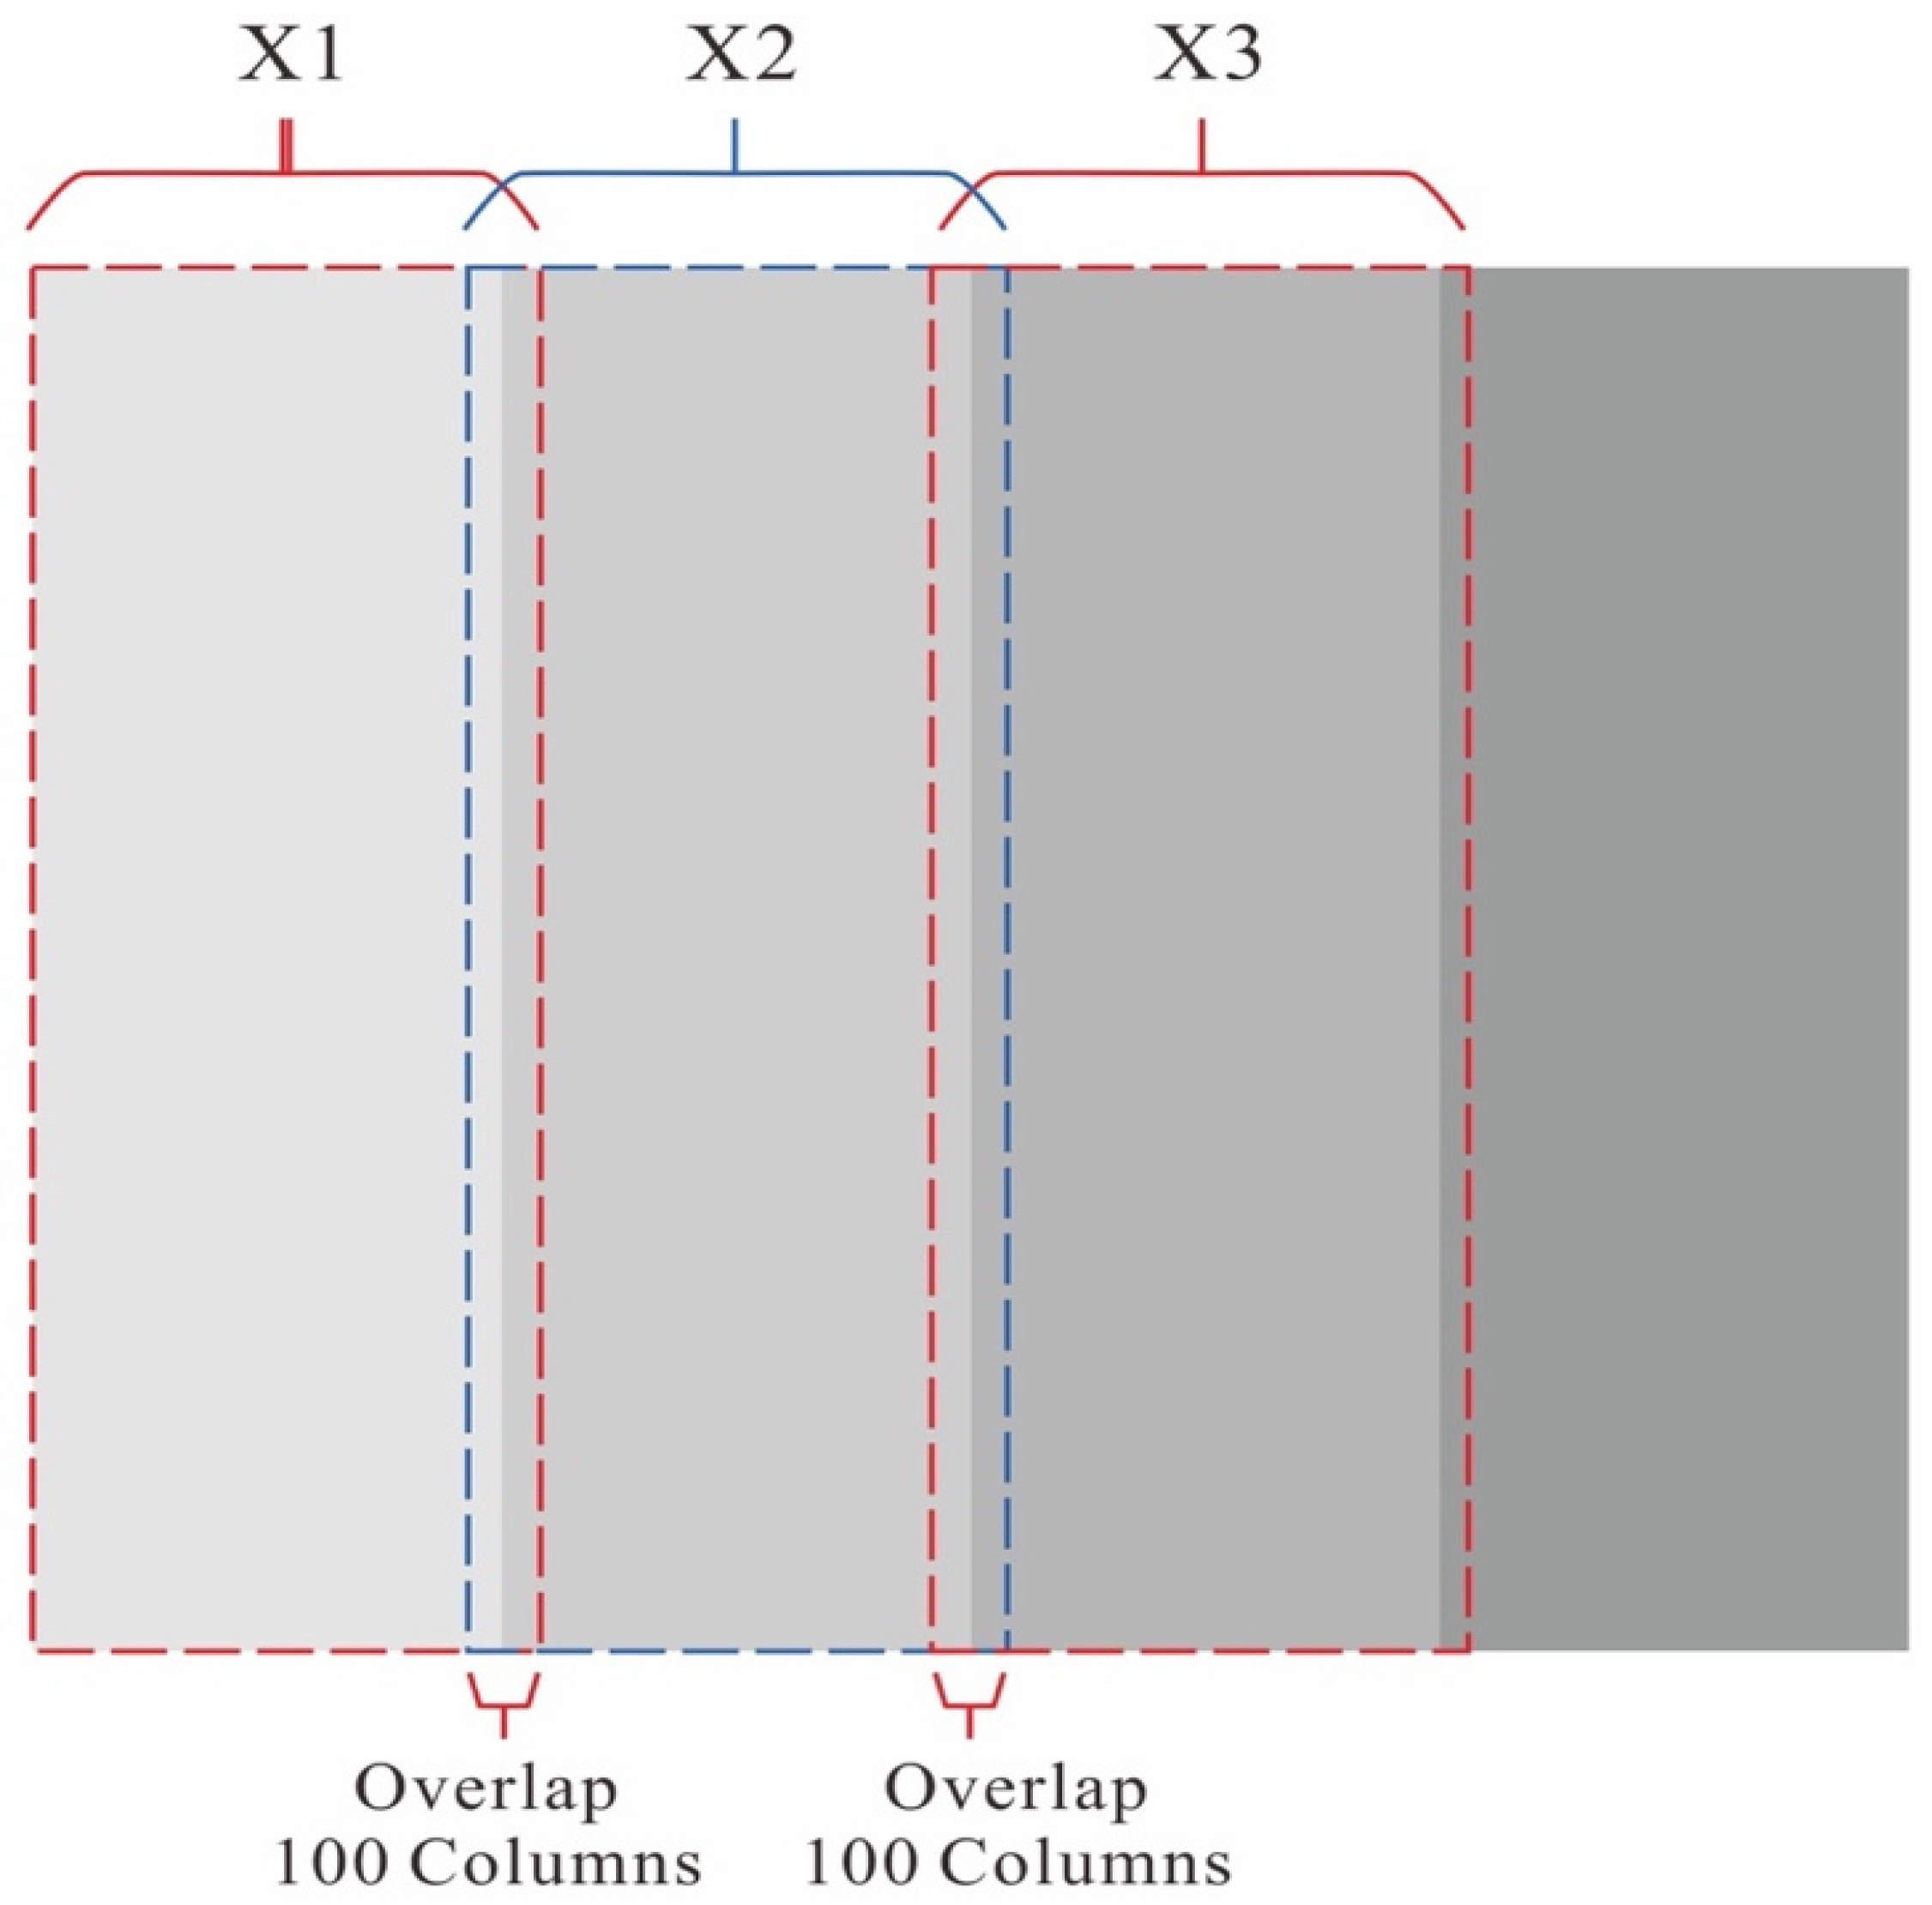
- Image cropping
- (2)
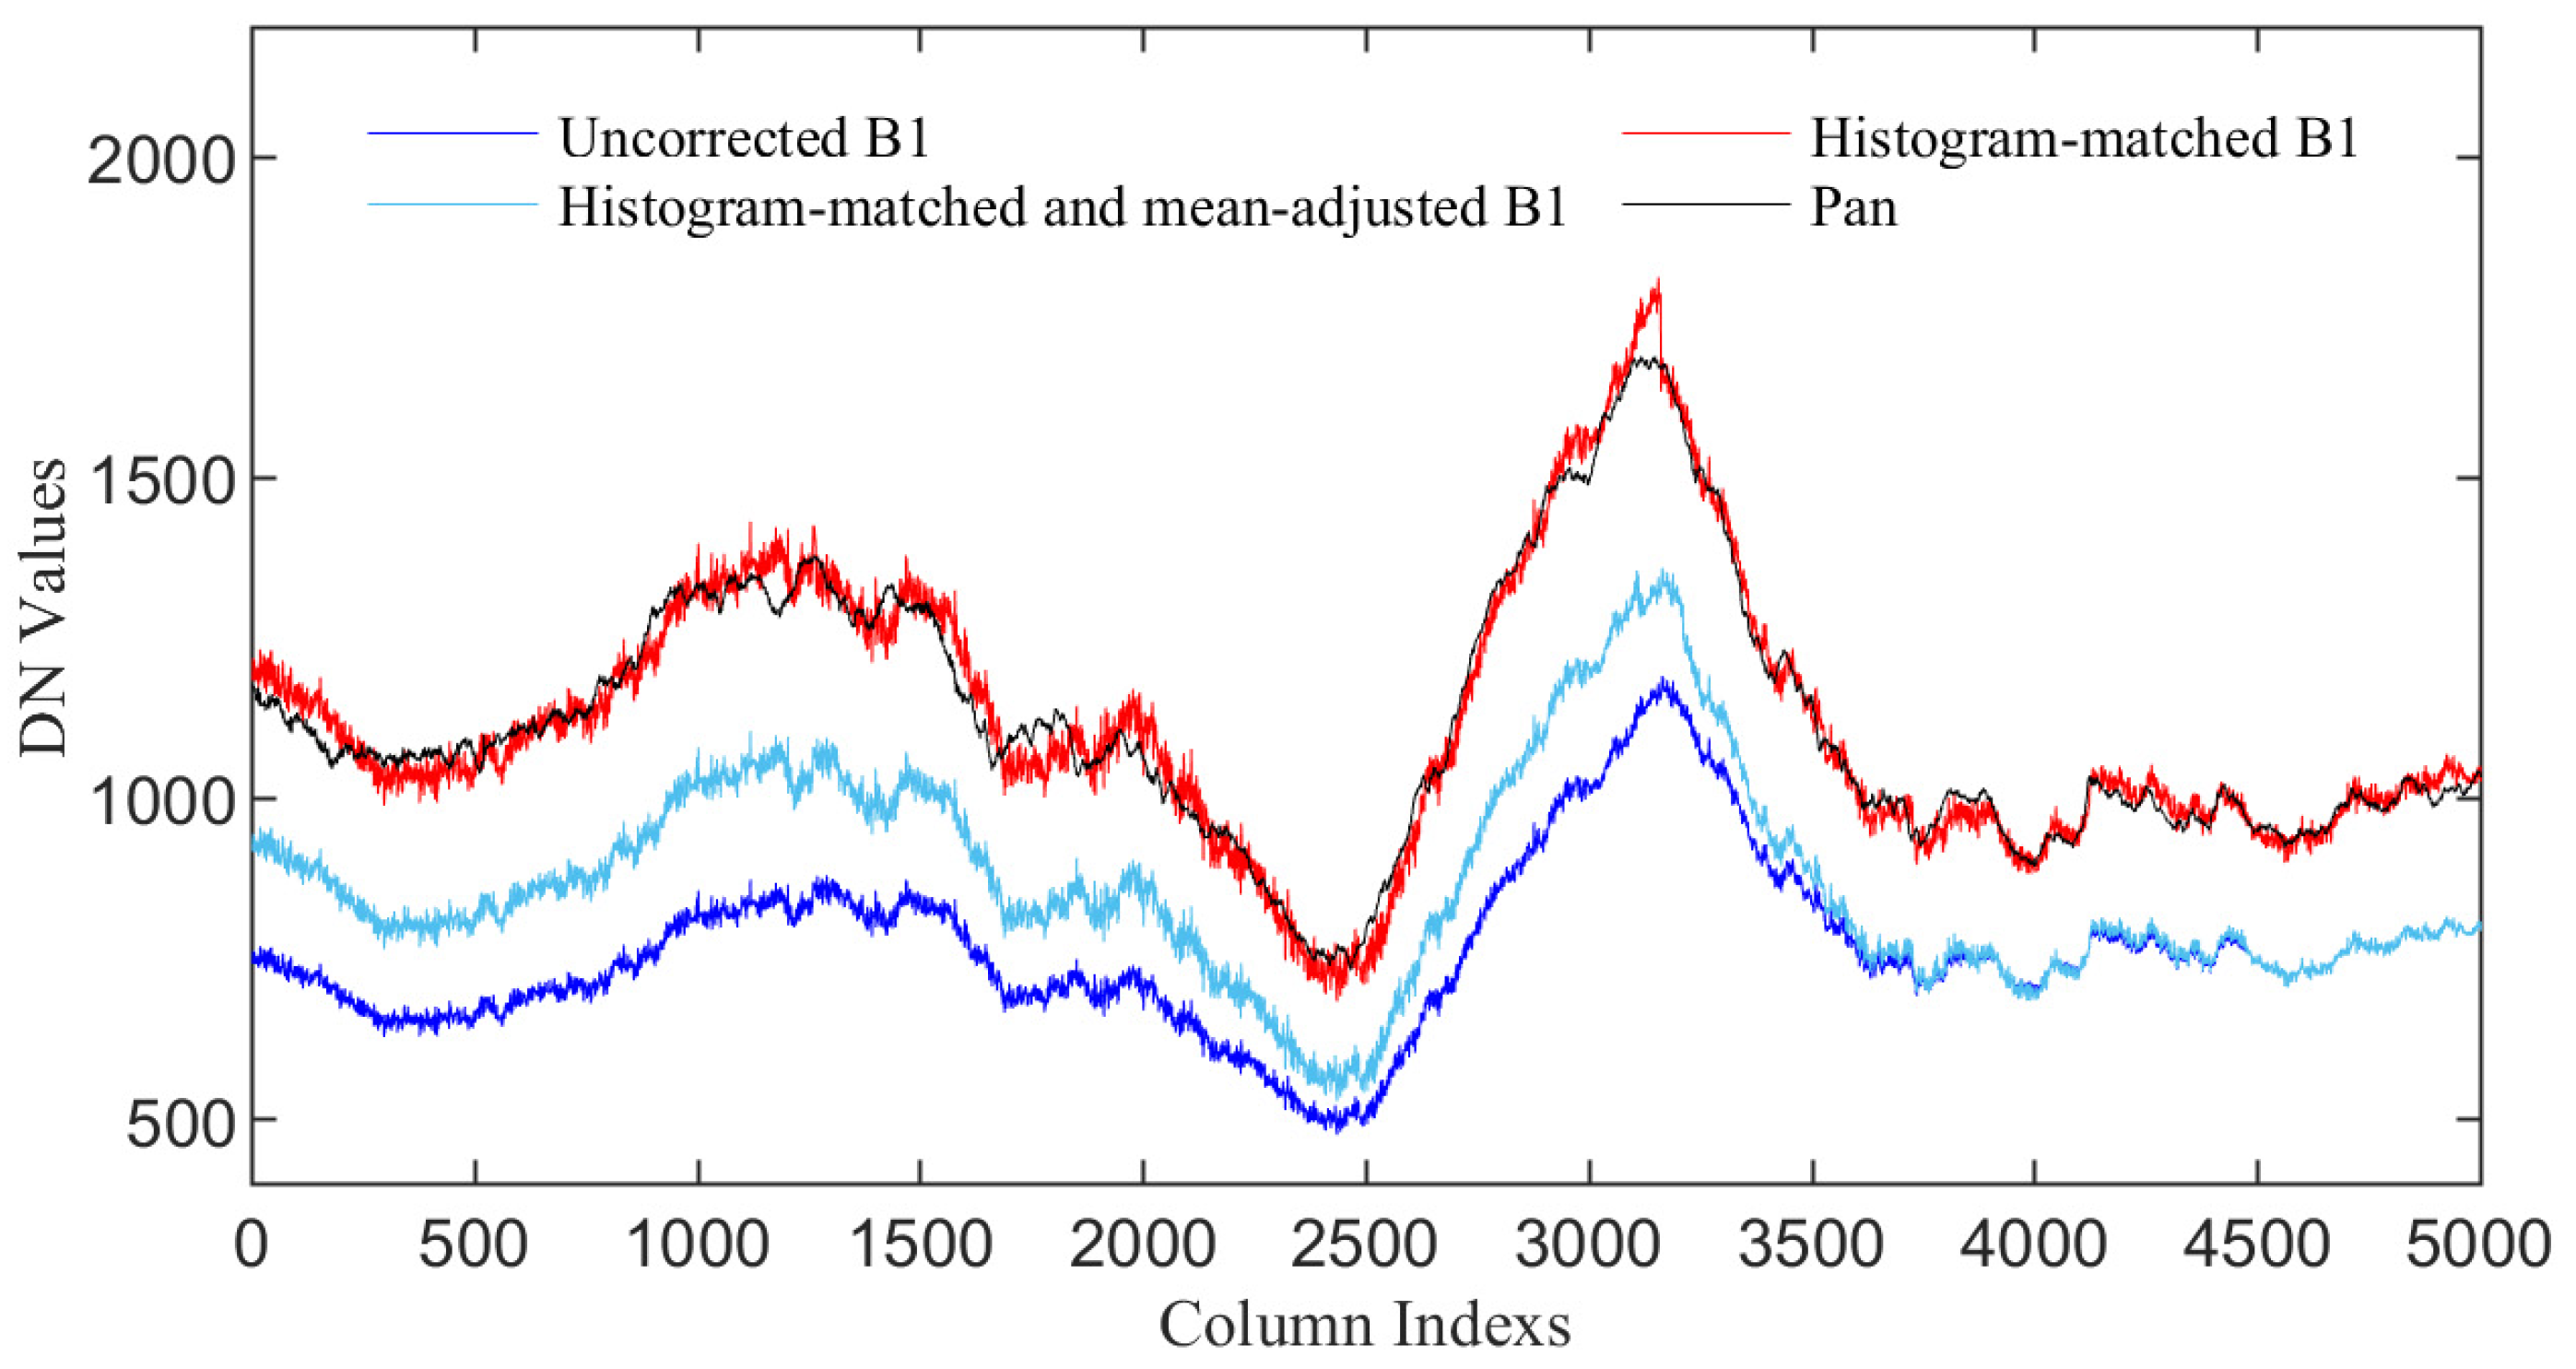
- Histogram matching
- (3)
- Mean Adjustment
- (4)
- Image stitching
3. Results
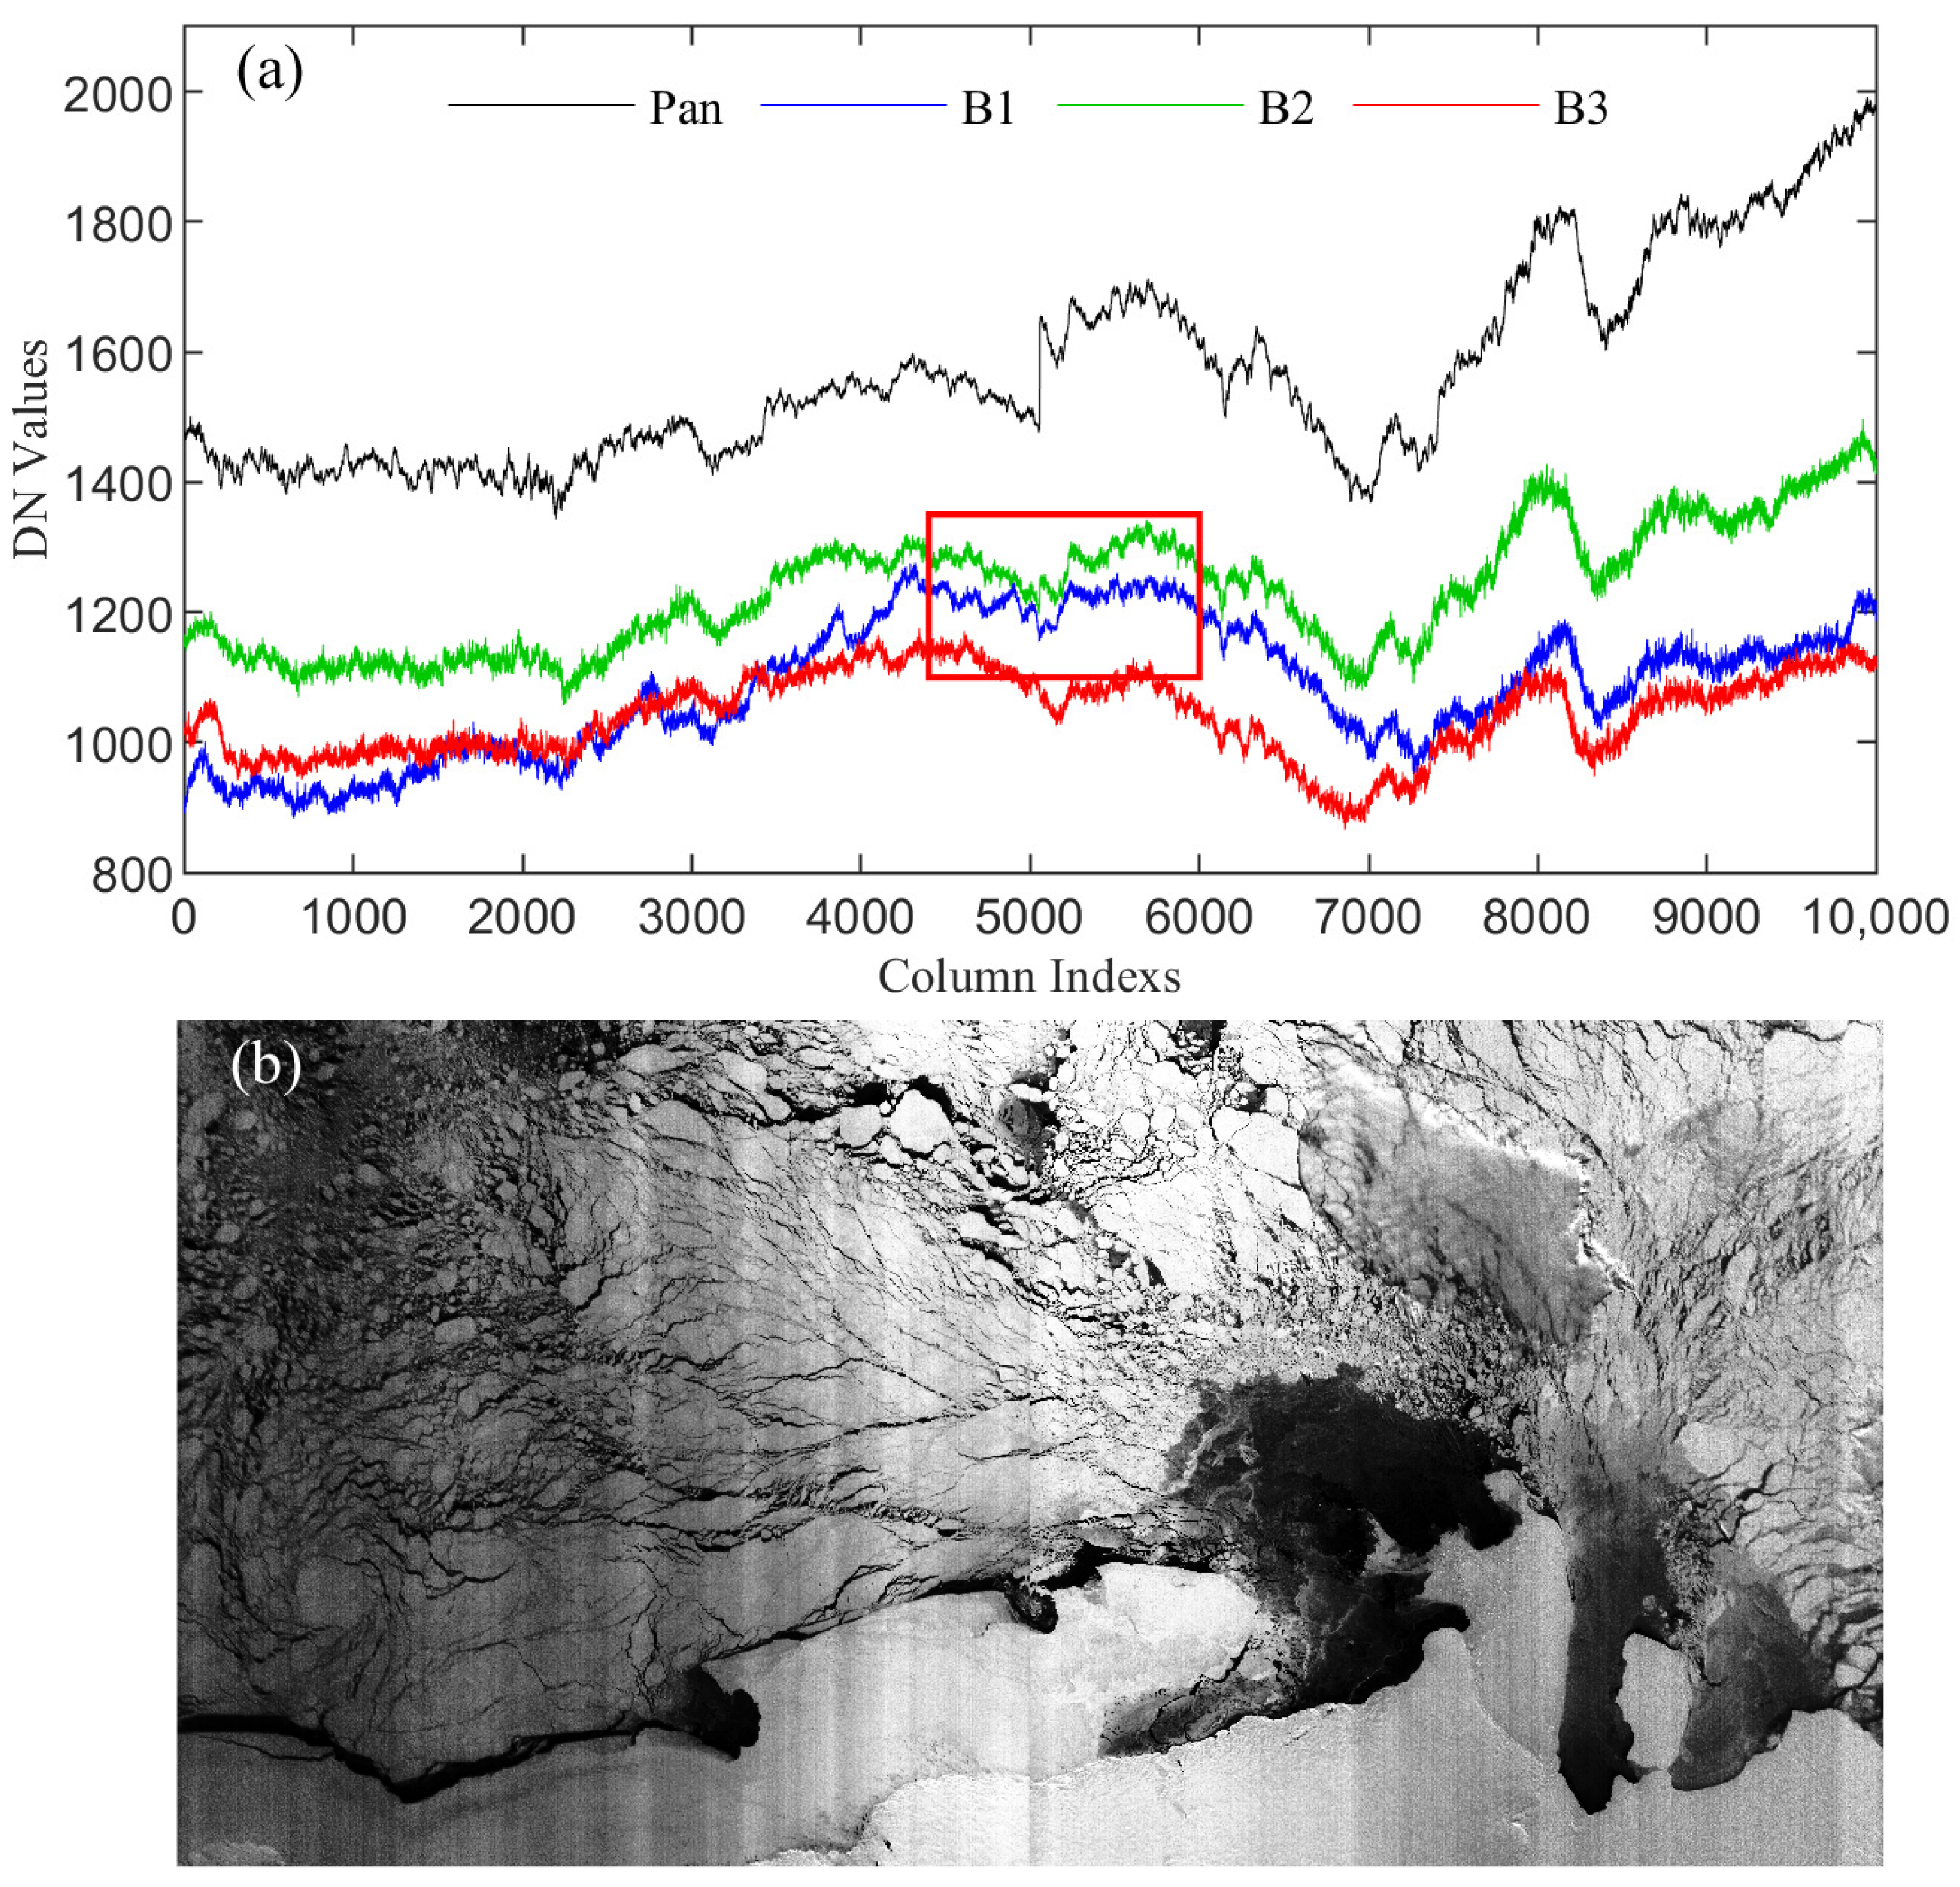
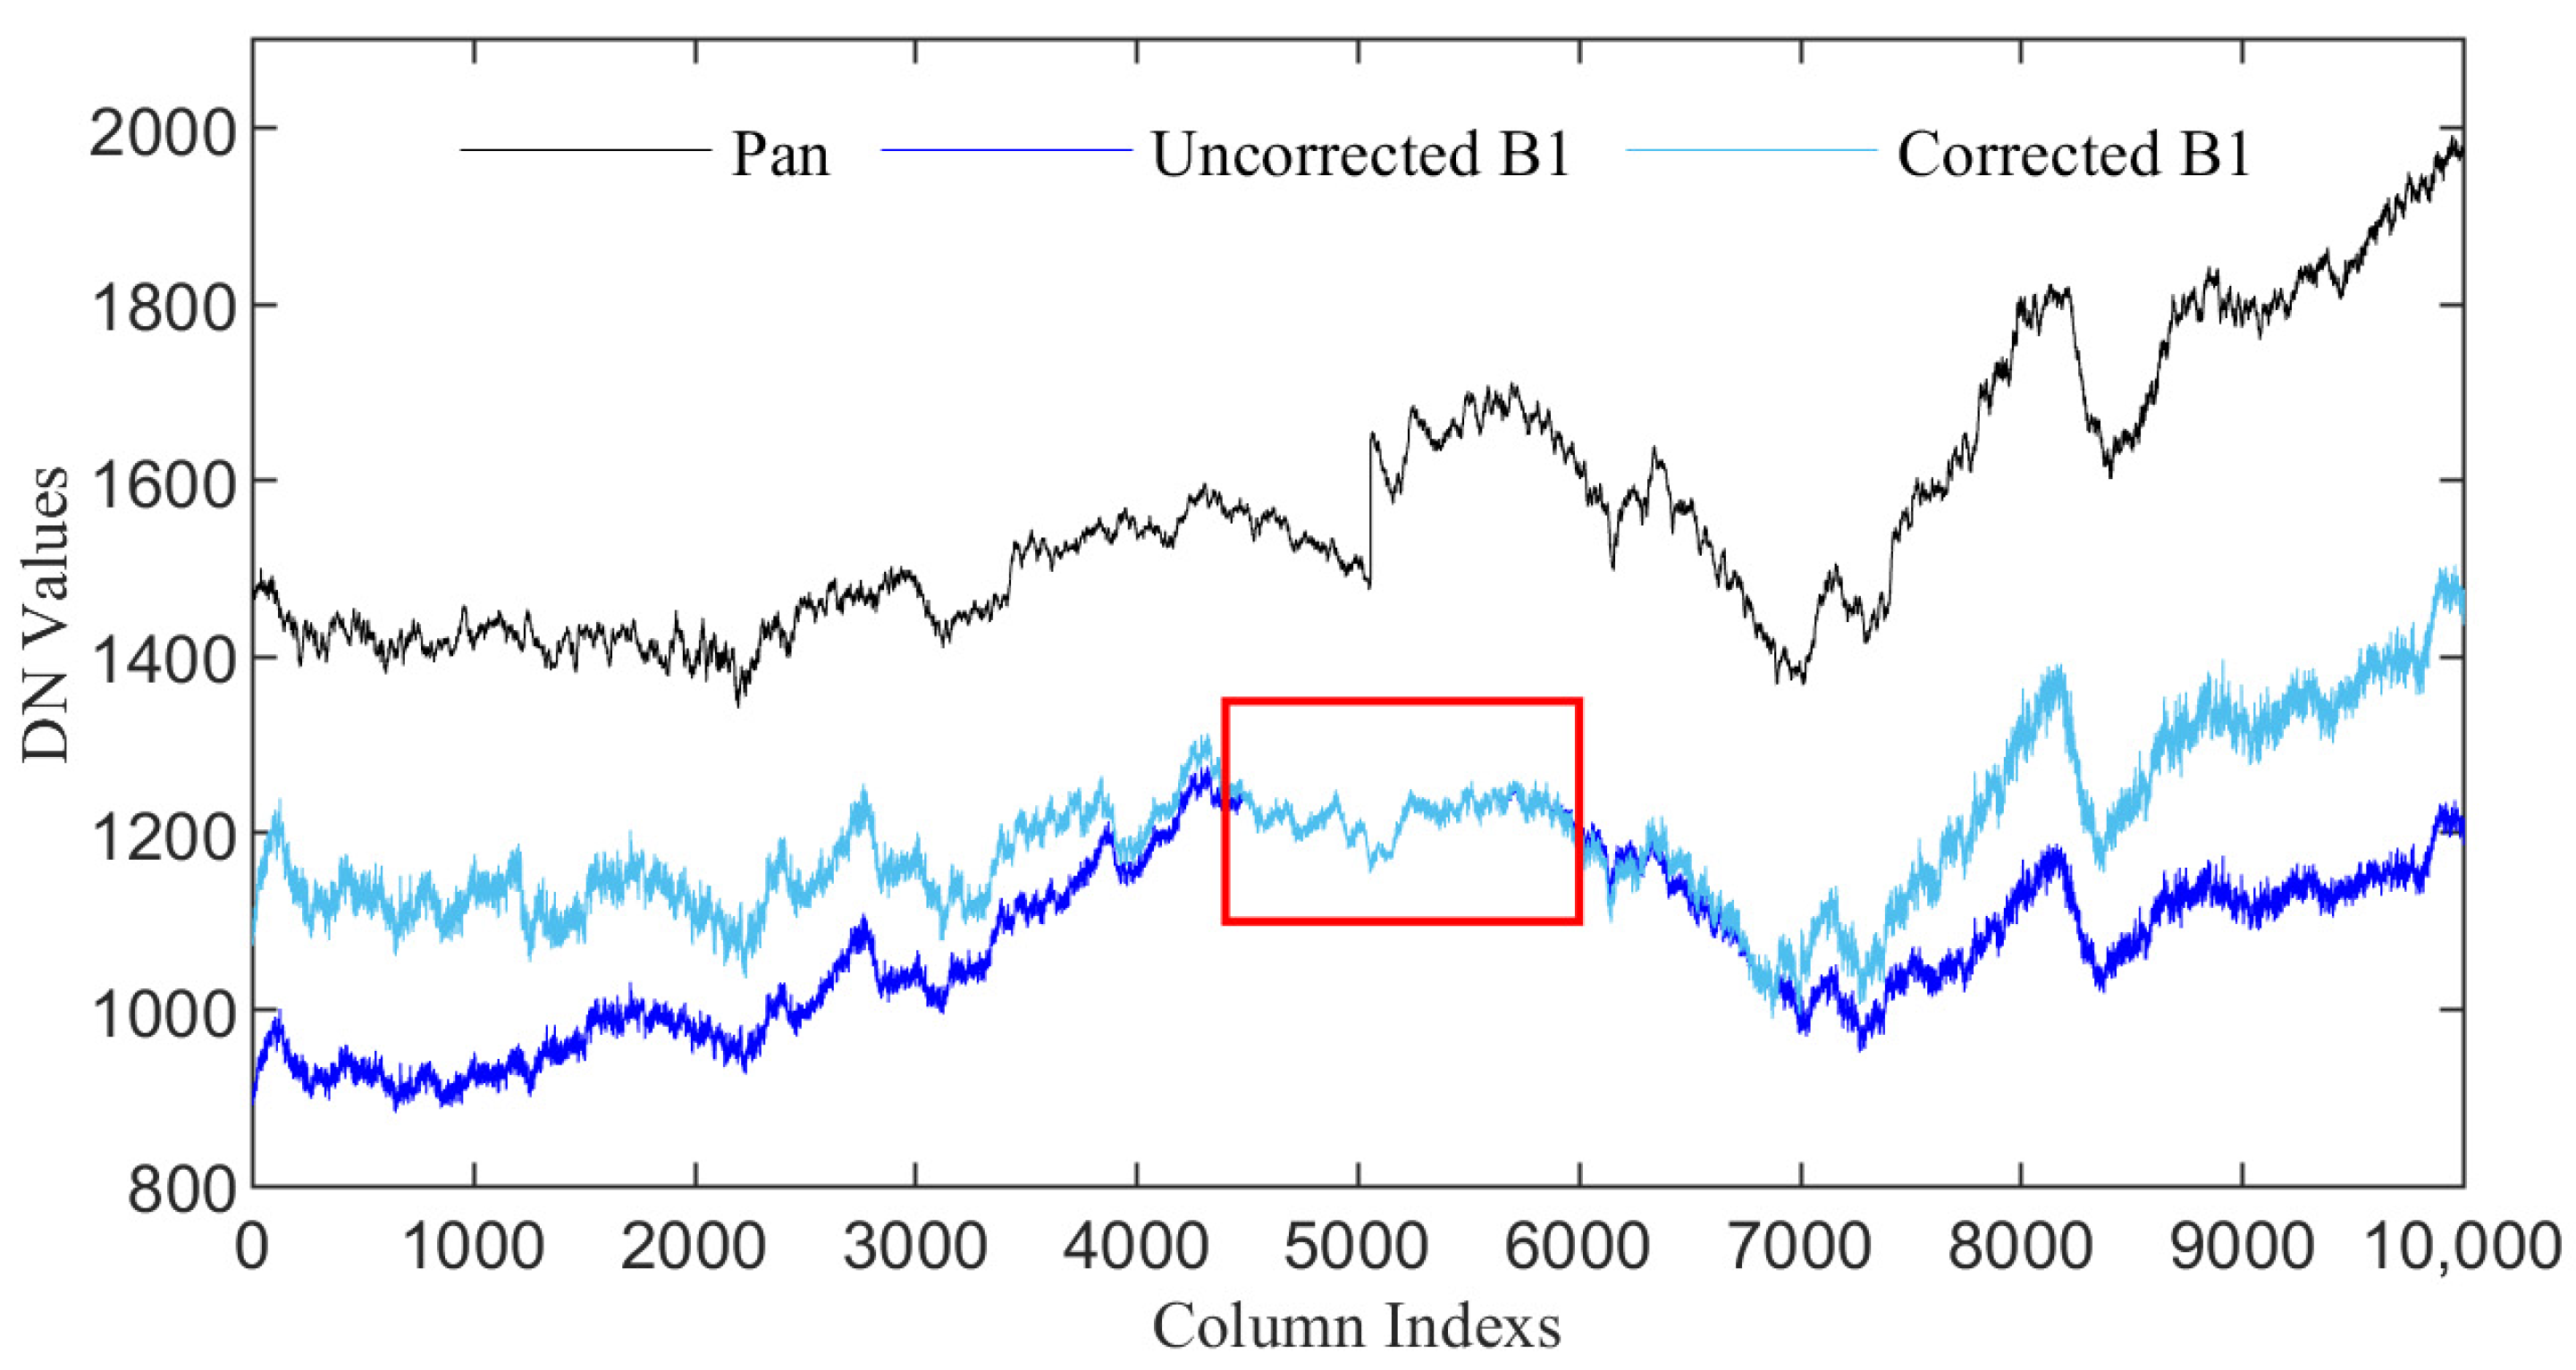
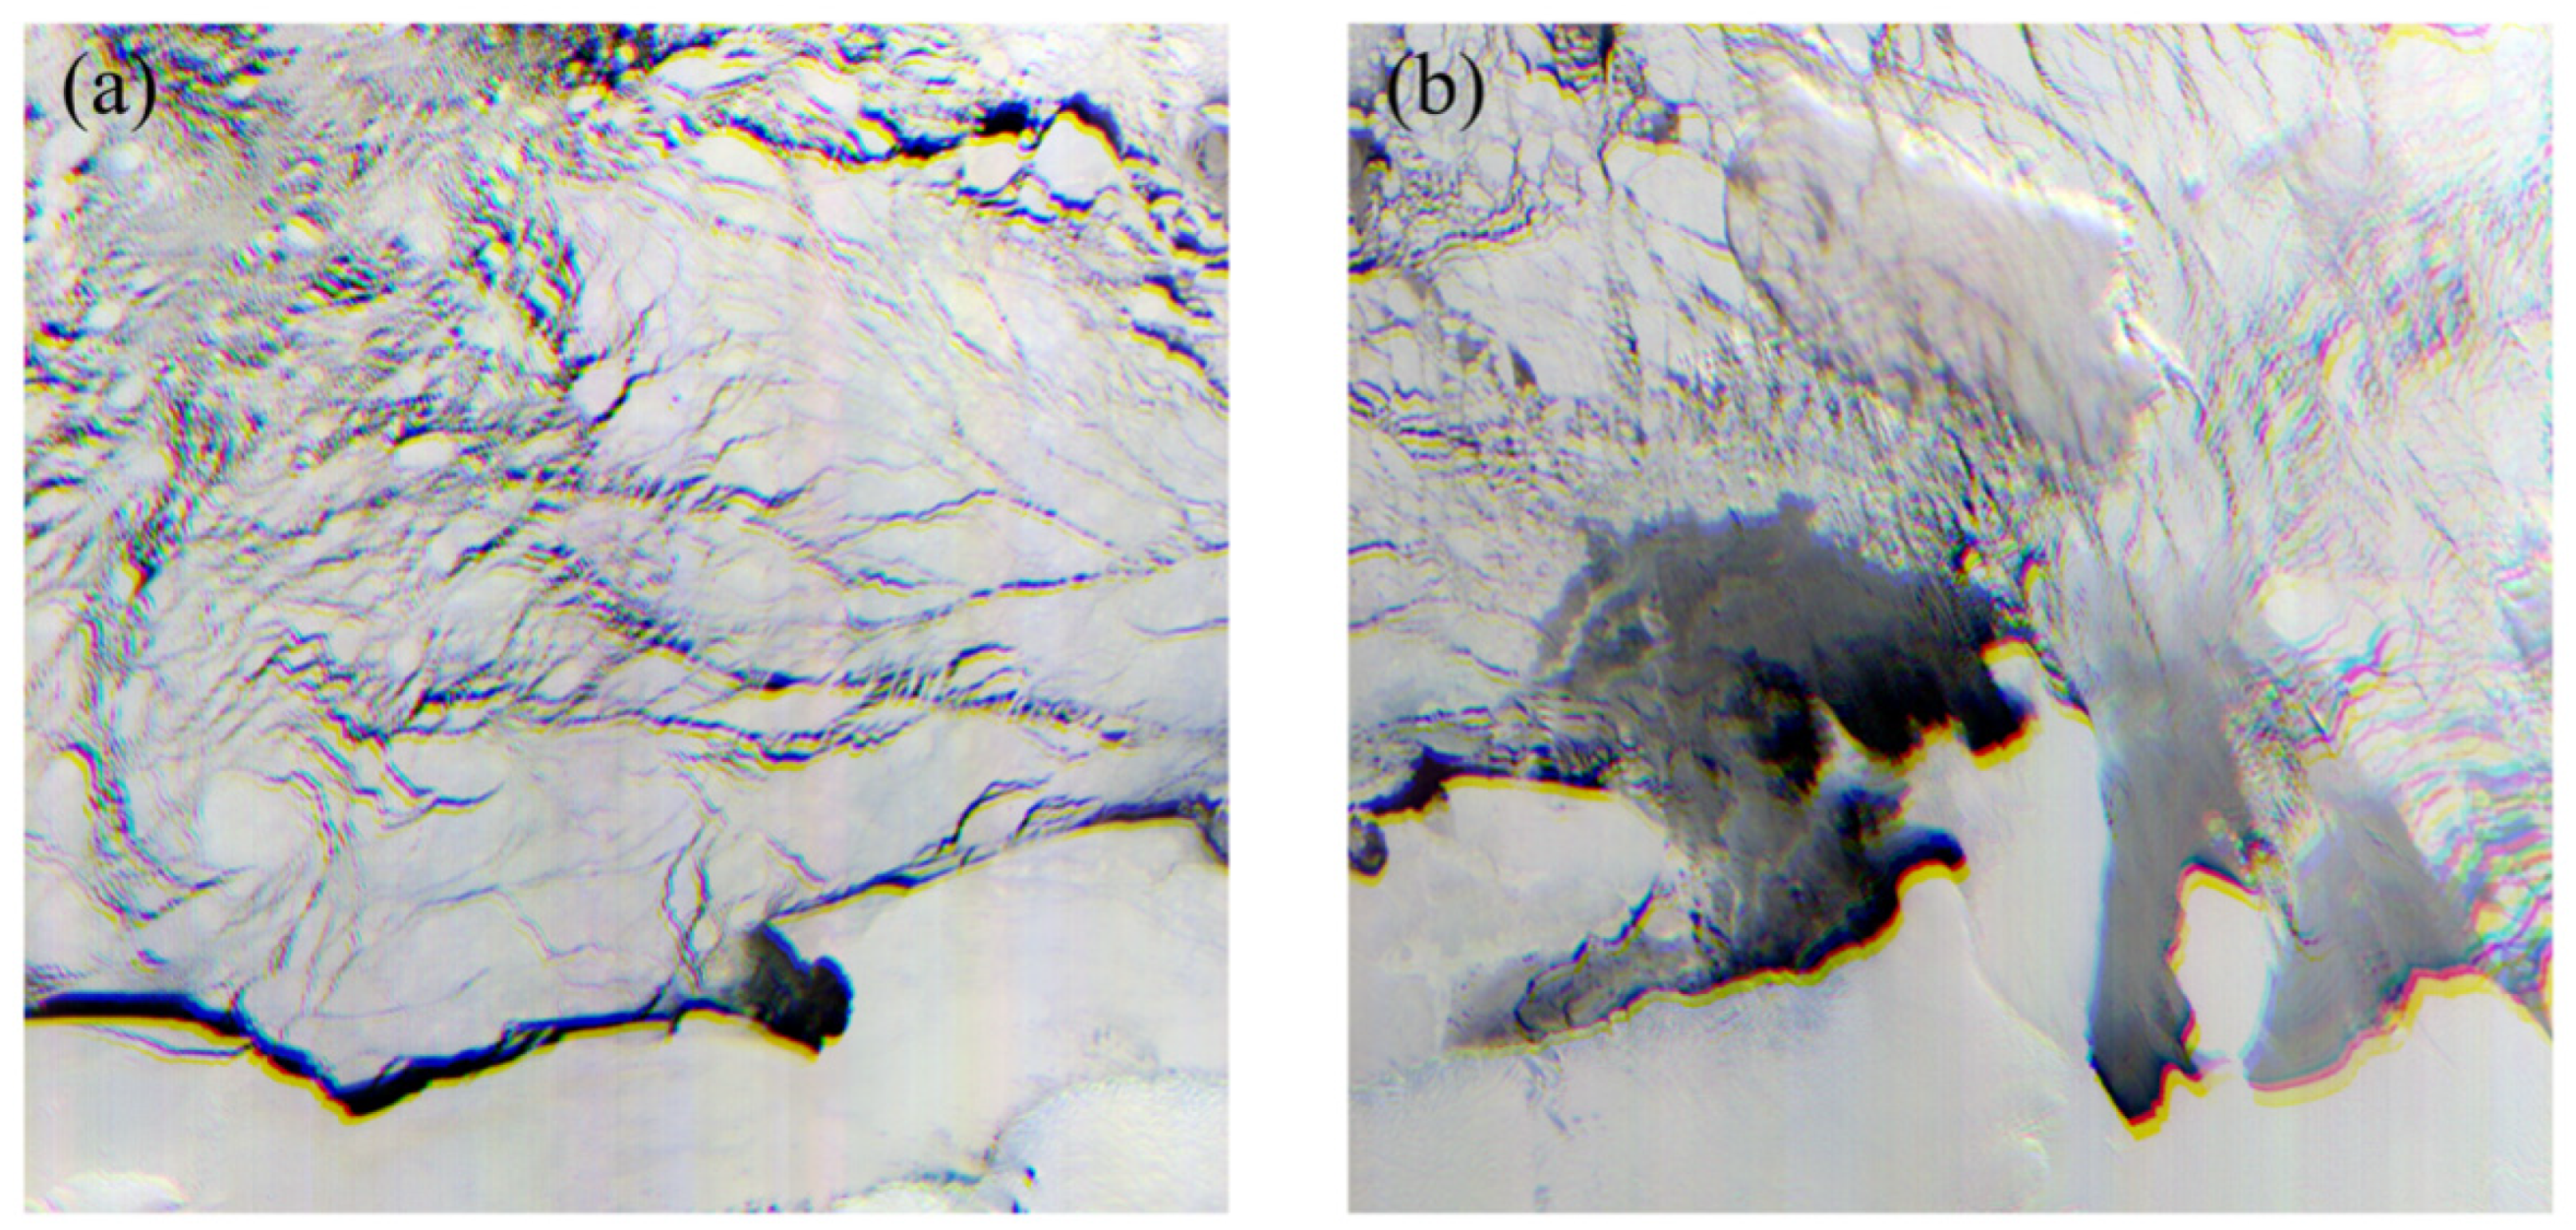
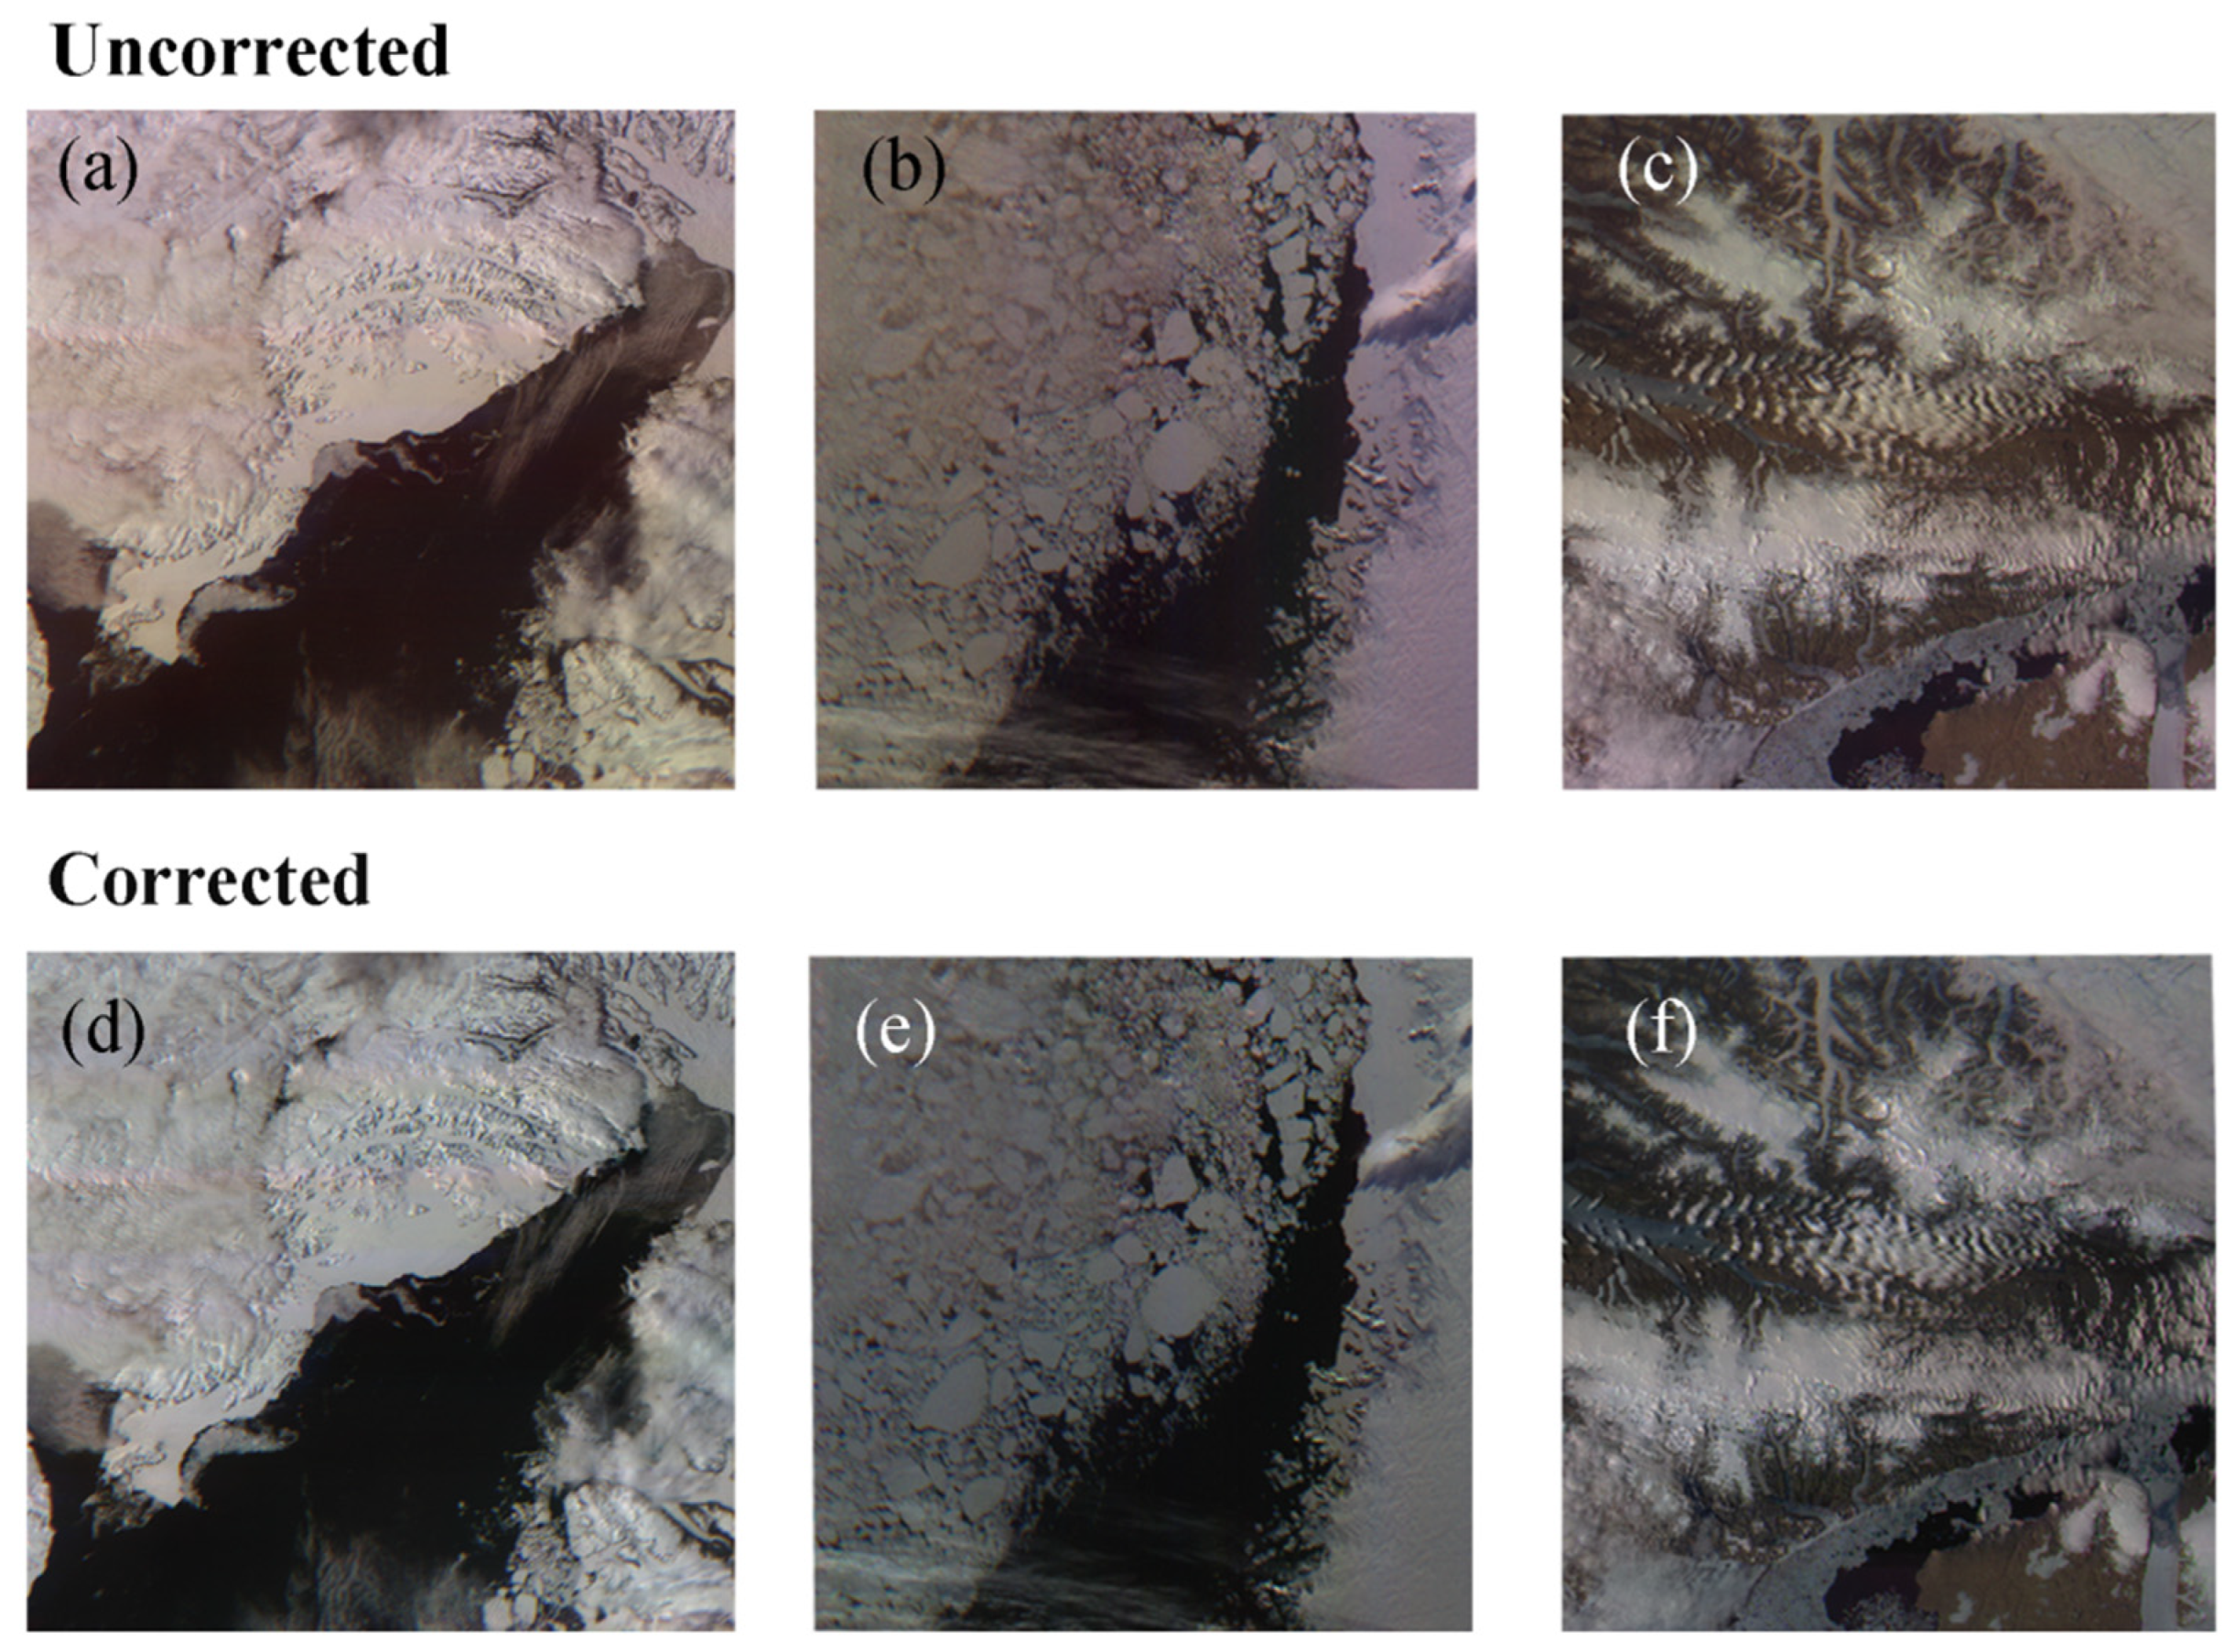
3.1. Performances of the Relative Radiometric Correction
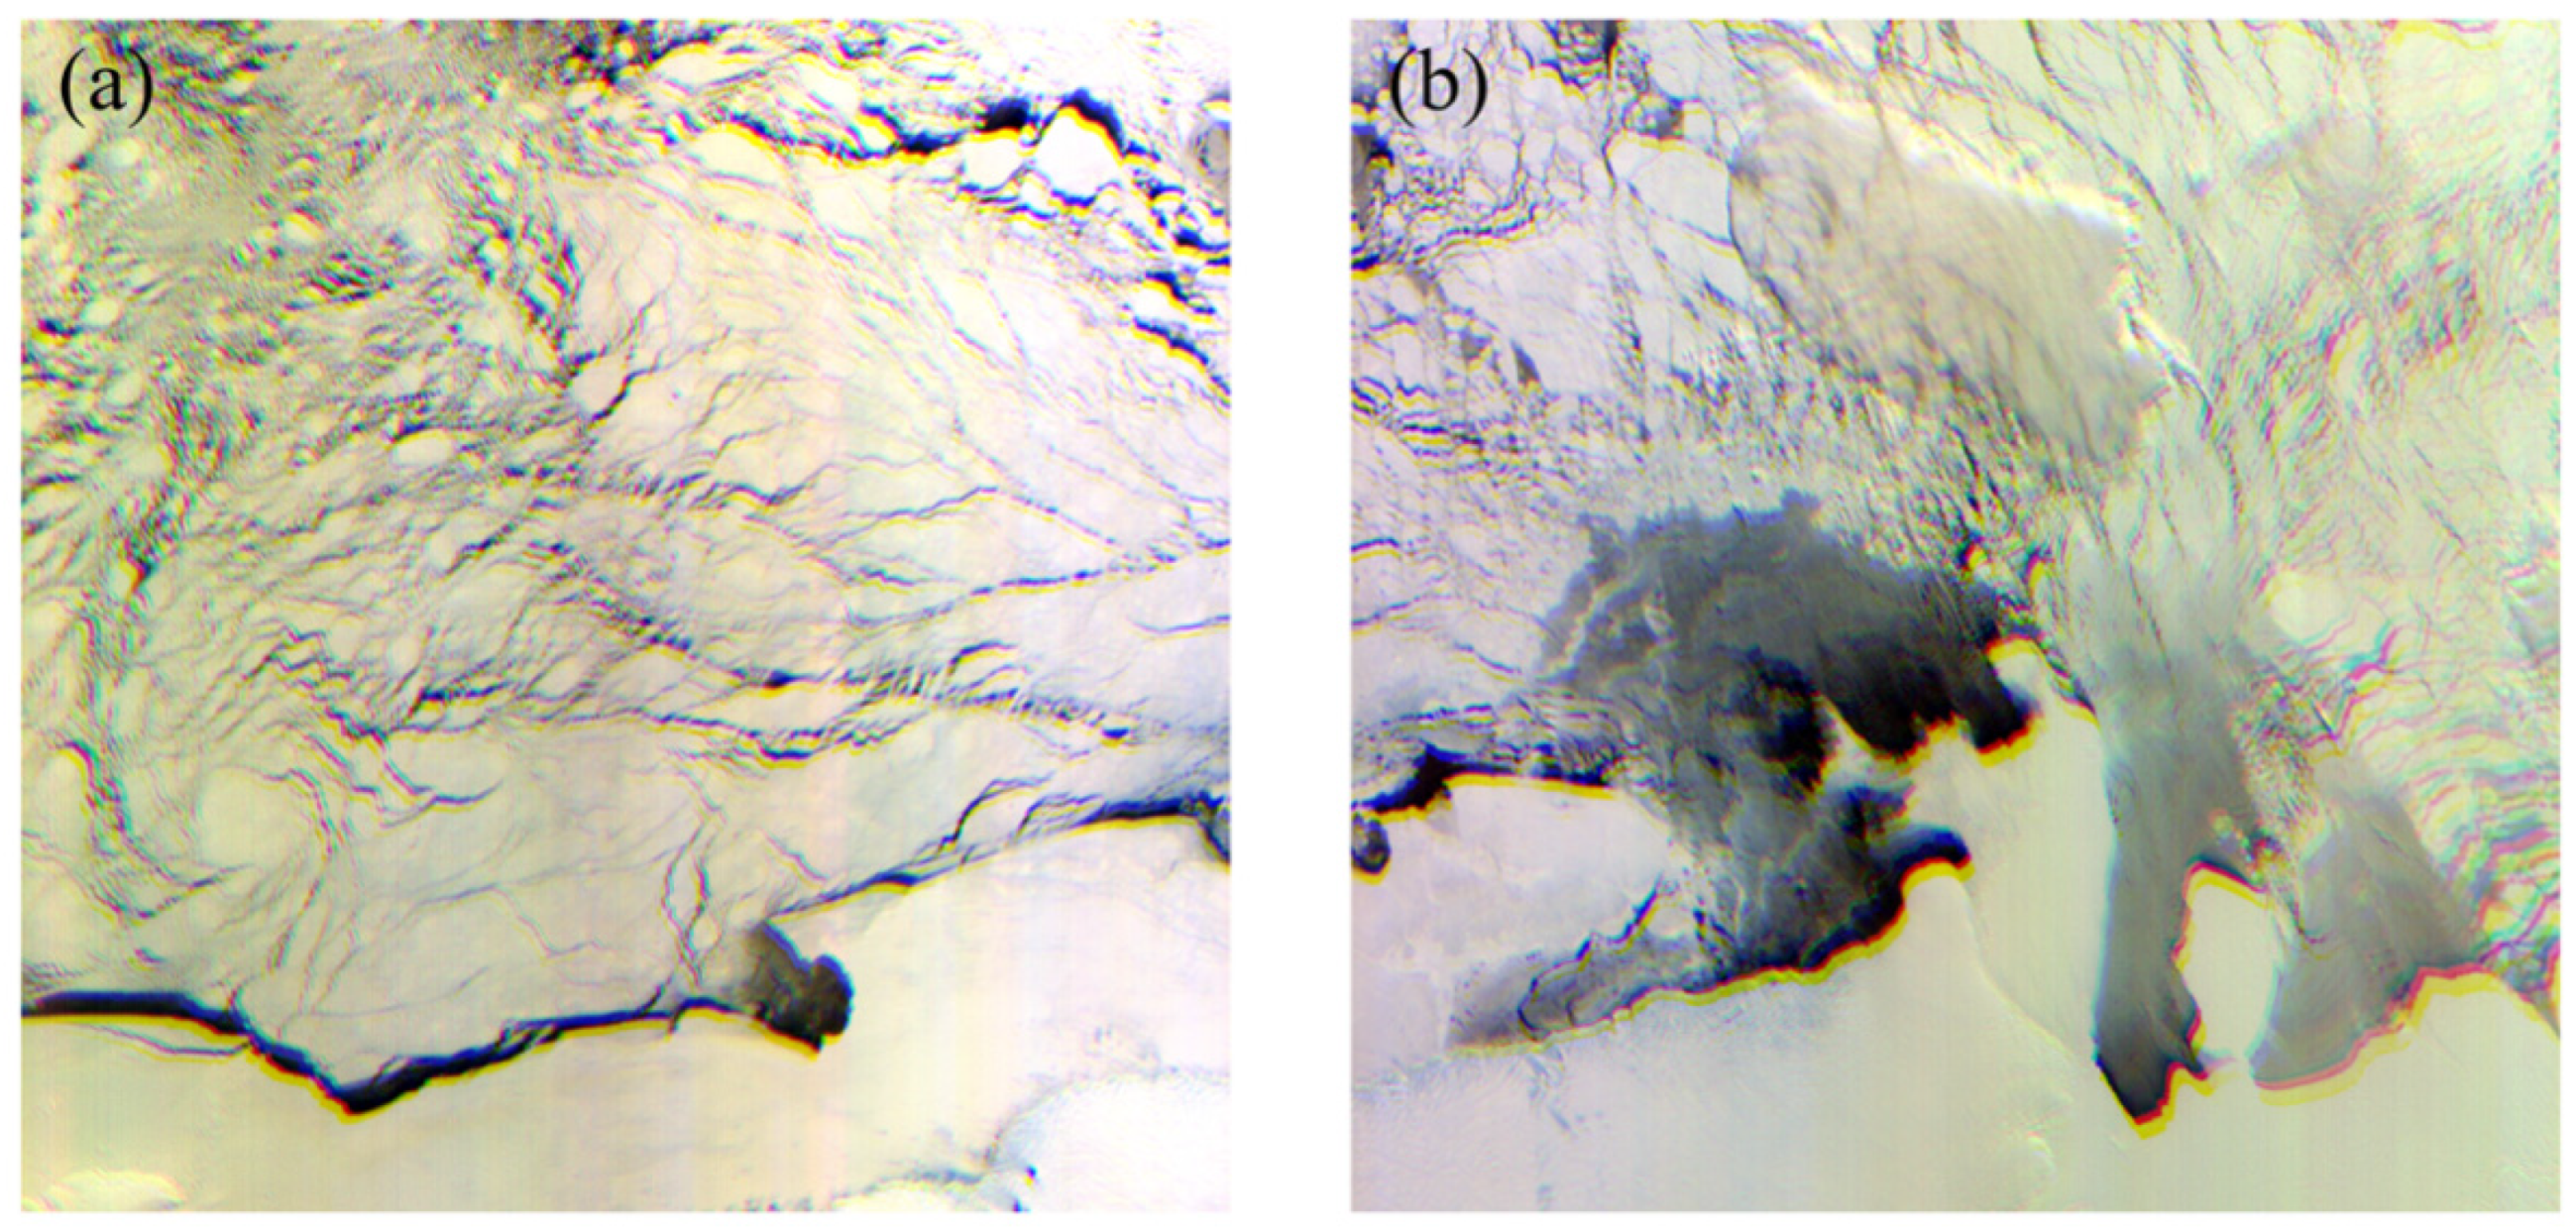
3.2. Results of the Corrected BNU-1 Images
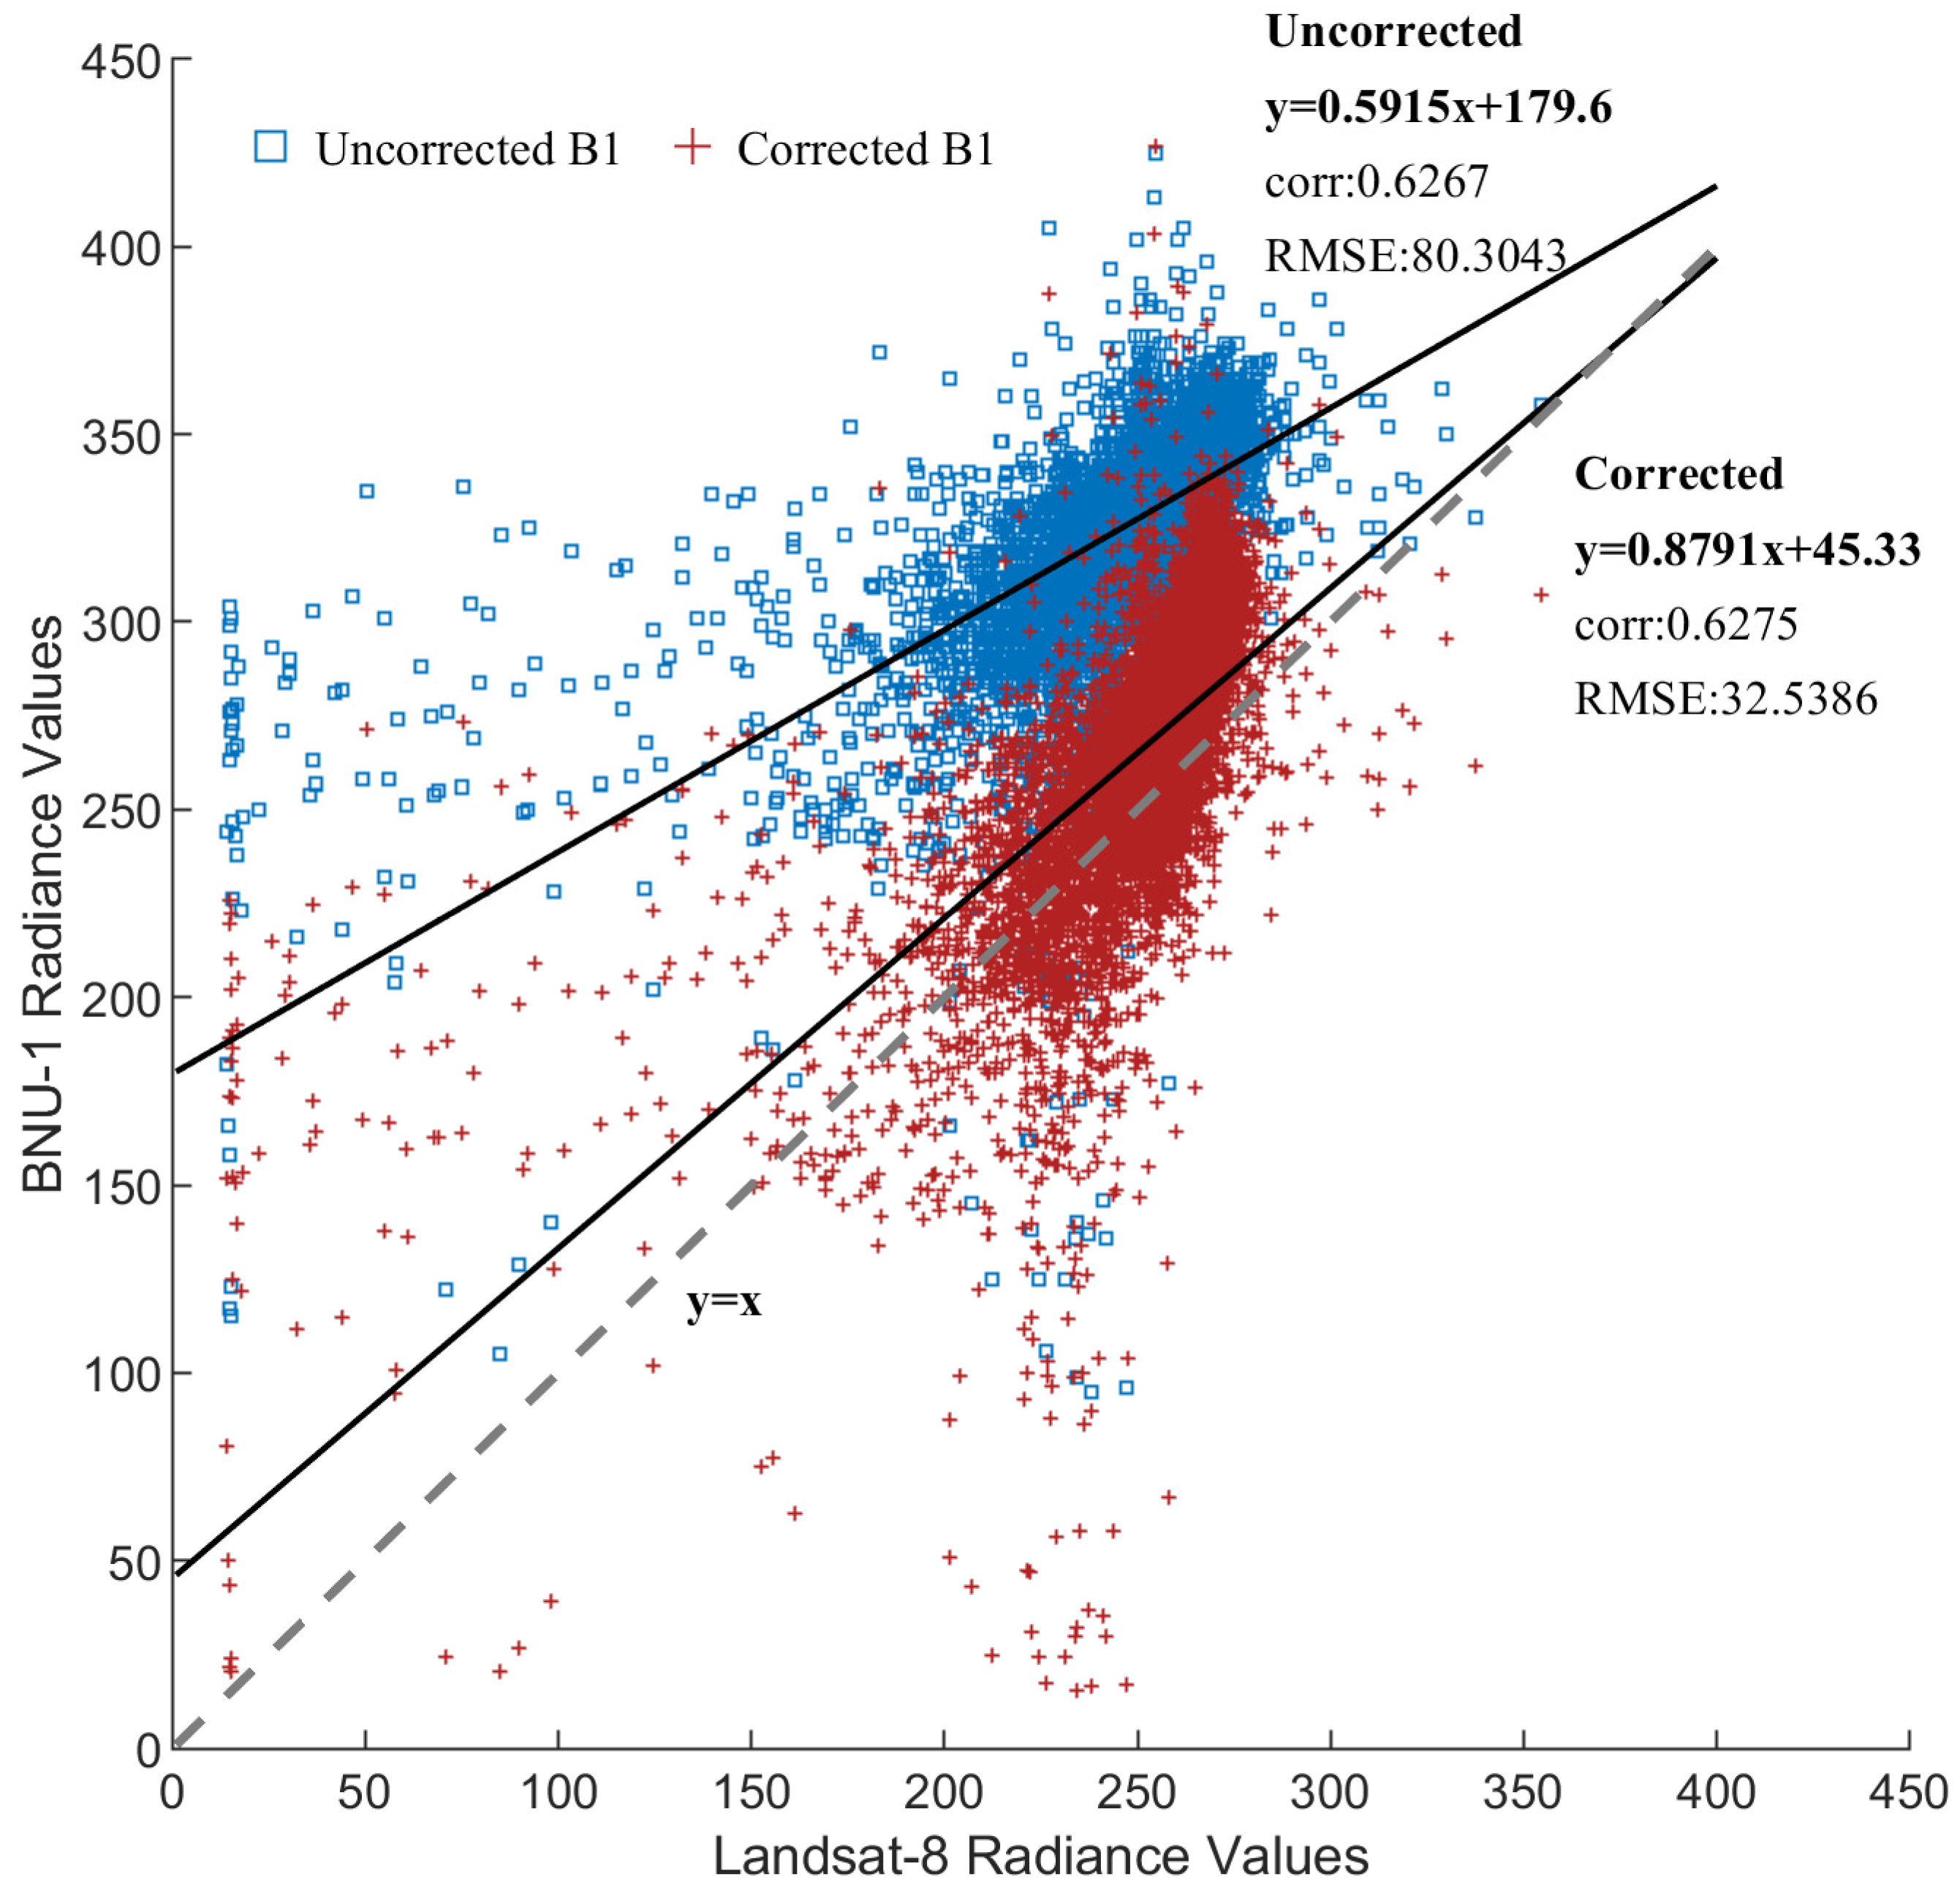
3.3. Evaluations of the Corrected BNU-1 Images
4. Discussion
5. Conclusions
Author Contributions
Funding
Data Availability Statement
Acknowledgments
Conflicts of Interest
References
- The IMBIE Team. Mass balance of the Greenland Ice Sheet from 1992 to 2018. Nature 2020, 579, 233–239. [Google Scholar] [CrossRef]
- Rignot, E.; Mouginot, J.; Scheuchl, B.; Van Den Broeke, M.; Van Wessem, M.J.; Morlighem, M. Four decades of Antarctic Ice Sheet mass balance from 1979–2017. Proc. Natl. Acad. Sci. USA 2019, 116, 1095–1103. [Google Scholar] [CrossRef]
- Massonnet, F.; Vancoppenolle, M.; Goosse, H.; Docquier, D.; Fichefet, T.; Blanchard-Wrigglesworth, E. Arctic sea-ice change tied to its mean state through thermodynamic processes. Nat. Clim. Chang. 2018, 8, 599–603. [Google Scholar] [CrossRef]
- Spreen, G.; Kaleschke, L.; Heygster, G. Sea ice remote sensing using AMSR-E 89-GHz channels. J. Geophys. Res. Ocean. 2008, 113, C02S03. [Google Scholar] [CrossRef]
- Khan, S.A.; Aschwanden, A.; Bjørk, A.A.; Wahr, J.; Kjeldsen, K.K.; Kjaer, K.H. Greenland ice sheet mass balance: A review. Rep. Prog. Phys. 2015, 78, 046801. [Google Scholar] [CrossRef]
- Friedl, P.; Weiser, F.; Fluhrer, A.; Braun, M.H. Remote sensing of glacier and ice sheet grounding lines: A review. Earth-Sci. Rev. 2020, 201, 102948. [Google Scholar] [CrossRef]
- Beamish, A.; Raynolds, M.K.; Epstein, H.; Frost, G.V.; Macander, M.J.; Bergstedt, H.; Bartsch, A.; Kruse, S.; Miles, V.; Tanis, C.M. Recent trends and remaining challenges for optical remote sensing of Arctic tundra vegetation: A review and outlook. Remote Sens. Environ. 2020, 246, 111872. [Google Scholar] [CrossRef]
- Chen, Z.; Chi, Z.; Zinglersen, K.B.; Tian, Y.; Wang, K.; Hui, F.; Cheng, X. A new image mosaic of Greenland using Landsat-8 OLI images. Sci. Bull 2020, 65, 522–524. [Google Scholar] [CrossRef]
- Dirscherl, M.; Dietz, A.J.; Dech, S.; Kuenzer, C. Remote sensing of ice motion in Antarctica—A review. Remote Sens. Environ. 2020, 237, 111595. [Google Scholar] [CrossRef]
- Zhang, Y.; Chi, Z.; Hui, F.; Li, T.; Liu, X.; Zhang, B.; Cheng, X.; Chen, Z. Accuracy evaluation on geolocation of the Chinese first polar microsatellite (ice pathfinder) imagery. Remote Sens. 2021, 13, 4278. [Google Scholar] [CrossRef]
- Fang, Y.; Wang, X.; Li, G.; Chen, Z.; Hui, F.; Cheng, X. Arctic sea ice drift fields extraction based on feature tracking to MODIS imagery. Int. J. Appl. Earth Obs. Geoinf. 2023, 120, 103353. [Google Scholar] [CrossRef]
- Hui, F.; Kang, J.; Liu, Y.; Cheng, X.; Gong, P.; Wang, F.; Li, Z.; Ye, Y.; Guo, Z. AntarcticaLC2000: The new Antarctic land cover database for the year 2000. Sci. China Earth Sci. 2017, 60, 686–696. [Google Scholar] [CrossRef]
- Itten, K.I.; Meyer, P. Geometric and radiometric correction of TM data of mountainous forested areas. IEEE Trans. Geosci. Remote Sens. 1993, 31, 764–770. [Google Scholar] [CrossRef]
- Thorne, K.; Markharn, B.; Barker, P.S.; Biggar, S. Radiometric calibration of Landsat. Photogramm. Eng. Remote Sens. 1997, 63, 853–858. [Google Scholar]
- Guo, J.; Yu, J.; Zeng, Y.; Xu, J.; Pan, Z.; Hou, M. Study on the relative radiometric correction of CBERS satellite CCD image. Sci. China Ser. E Eng. Mater. Sci. 2005, 48, 12–28. [Google Scholar] [CrossRef]
- Duan, Y.; Chen, W.; Wang, M.; Yan, L. A relative radiometric correction method for airborne image using outdoor calibration and image statistics. IEEE Trans. Geosci. Remote Sens. 2013, 52, 5164–5174. [Google Scholar] [CrossRef]
- Imai, M.; Kurihara, J.; Kouyama, T.; Kuwahara, T.; Fujita, S.; Sakamoto, Y.; Sato, Y.; Saitoh, S.-I.; Hirata, T.; Yamamoto, H. Radiometric calibration for a multispectral sensor onboard RISESAT microsatellite based on lunar observations. Sensors 2021, 21, 2429. [Google Scholar] [CrossRef]
- Kumawat, N.; Babu, K.; Pandya, M.R. On-Orbit Absolute Radiometric Calibration and Uncertainty Analysis of OCM2 Sensor onboard Oceansat-2 Satellite. Int. J. Remote Sens. 2023, 44, 1254–1279. [Google Scholar] [CrossRef]


| Payloads | Main Parameters | |
|---|---|---|
| The wide-field camera | Parameters | Panchromatic, multispectral, push broom |
| Spatial Resolution Swath Width | 73.69 m 739 km | |
| Spectral bandwidth | Panchromatic: 527 nm~769 nm Blue (B1): 471 nm~506 nm Green (B2): 560 nm~599 nm Red (B3): 638 nm~676 nm | |
| The narrow-field high-resolution camera | Image mode | Area array staring. |
| Spatial Resolution Swath Width | 8.2 m 739 km | |
| Spectral bandwidth | Bayer RGB | |
| The ship AIS receiver | Receiving frequency point | 161.975 MHz, 162.025 MHz 156.775 MHz, 156.825 MHz |
| Modulation mode | GMSK/FM | |
| Receiving sensitivity | ≤−112 dBm | |
| Stn NO. | Acquisition Time | Land Cover | The Amount for Data |
|---|---|---|---|
| P1 | 3 December 2019 | Rock | 12 spectral signatures |
| P2 | 5 December 2019 | Snow | 10 spectral signatures |
| P3 | 9 December 2019 | Rock | 10 spectral signatures |
| P4 | 9 December 2019 | Lichen | 8 spectral signatures |
| Stn NO. | Band | Original | Corrected | Landsat | Ground |
|---|---|---|---|---|---|
| P1 | P | 145.36 | 145.36 | 111.88 | 78.38 |
| Blue | 136.89 | 177.16 | 116.89 | 51.18 | |
| Green | 155.07 | 169.57 | 114.11 | 75.99 | |
| Red | 134.49 | 148.17 | 113.32 | 81 | |
| P2 | P | 230.82 | 230.82 | 229.69 | 233.63 |
| Blue | 241.23 | 313.07 | 313.46 | 288.15 | |
| Green | 229.06 | 236.46 | 253.85 | 246.95 | |
| Red | 176.39 | 198.56 | 209.92 | 200.21 | |
| P3 | P | 123.03 | 123.03 | 85.07 | 65.04 |
| Blue | 110.80 | 134.69 | 119.98 | 48.35 | |
| Green | 103.72 | 106.95 | 98.81 | 66.31 | |
| Red | 98.22 | 96.55 | 88.73 | 64.44 | |
| P4 | P | 135.31 | 135.31 | 100.86 | 23.19 |
| Blue | 116.66 | 144.39 | 126.34 | 10.86 | |
| Green | 115.75 | 121.55 | 114.66 | 21.17 | |
| Red | 105.51 | 106.61 | 98.98 | 25.7 |
Disclaimer/Publisher’s Note: The statements, opinions and data contained in all publications are solely those of the individual author(s) and contributor(s) and not of MDPI and/or the editor(s). MDPI and/or the editor(s) disclaim responsibility for any injury to people or property resulting from any ideas, methods, instructions or products referred to in the content. |
© 2023 by the authors. Licensee MDPI, Basel, Switzerland. This article is an open access article distributed under the terms and conditions of the Creative Commons Attribution (CC BY) license (https://creativecommons.org/licenses/by/4.0/).
Share and Cite
Zhang, S.; Shang, X.; Li, L.; Zhang, Y.; Wu, X.; Hui, F.; Huang, H.; Cheng, X. An On-Orbit Relative Sensor Normalization for Unbalance Images from the Ice Pathfinder Satellite (BNU-1). Remote Sens. 2023, 15, 5439. https://doi.org/10.3390/rs15235439
Zhang S, Shang X, Li L, Zhang Y, Wu X, Hui F, Huang H, Cheng X. An On-Orbit Relative Sensor Normalization for Unbalance Images from the Ice Pathfinder Satellite (BNU-1). Remote Sensing. 2023; 15(23):5439. https://doi.org/10.3390/rs15235439
Chicago/Turabian StyleZhang, Sishi, Xinyi Shang, Lanjing Li, Ying Zhang, Xiaoxu Wu, Fengming Hui, Huabing Huang, and Xiao Cheng. 2023. "An On-Orbit Relative Sensor Normalization for Unbalance Images from the Ice Pathfinder Satellite (BNU-1)" Remote Sensing 15, no. 23: 5439. https://doi.org/10.3390/rs15235439
APA StyleZhang, S., Shang, X., Li, L., Zhang, Y., Wu, X., Hui, F., Huang, H., & Cheng, X. (2023). An On-Orbit Relative Sensor Normalization for Unbalance Images from the Ice Pathfinder Satellite (BNU-1). Remote Sensing, 15(23), 5439. https://doi.org/10.3390/rs15235439