Article

Unraveling Effect of Snow Cover on Spring Vegetation Phenology across Different Vegetation Types in Northeast China

1
Heilongjiang Province Key Laboratory of Geographical Environment Monitoring and Spatial Information Service in Cold Regions, Harbin Normal University, Harbin 150025, China
2
Institute of Agricultural Remote Sensing and Information, Heilongjiang Academy of Agricultural Sciences, Harbin 150086, China
*
Author to whom correspondence should be addressed.
Remote Sens. 2023, 15(19), 4783; https://doi.org/10.3390/rs15194783
Submission received: 28 August 2023 / Revised: 23 September 2023 / Accepted: 25 September 2023 / Published: 30 September 2023
(This article belongs to the Special Issue Monitoring Cold-Region Water Cycles Using Remote Sensing Big Data)

Abstract

:
Snow cover has significantly changed due to global warming in recent decades, causing large changes in the vegetation ecosystem. However, the impact of snow cover changes on the spring phenology of different vegetation types in Northeast China remains unclear. In this study, we investigated the response of the start of the growing season (SOS) to different snow cover indicators using partial correlation analysis and stepwise regression analysis in Northeast China from 1982 to 2015 based on multiple remote sensing datasets. Furthermore, we revealed the underlying mechanisms using a structural equation model. The results show that decreased snow cover days (SCD) and an advanced snow cover end date (SCED) led to an advanced SOS in forests. Conversely, an increased SCD and a delayed SCED led to an advanced SOS in grasslands. The trends of SCD and SCED did not exhibit significant changes in rainfed cropland. The maximum snow water equivalent (SWEmax) increased in most areas. However, the proportion of the correlation between SWEmax and SOS was small. The impact of snow cover changes on the SOS varied across different vegetation types. Snow cover indicators mainly exhibited positive correlations with the SOS of forests, including deciduous broadleaf forests and deciduous coniferous forests, with positive and negative correlations of 18.61% and 2.58%, respectively. However, snow cover indicators mainly exhibited negative correlations in the SOS of grasslands and rainfed croplands, exhibiting positive and negative correlations of 4.87% and 13.06%, respectively. Snow cover impacted the SOS through the “temperature effect” in deciduous broadleaf forests, deciduous coniferous forests, and rainfed croplands, while it affected SOS through the “moisture effect” in grasslands. These results provide an enhanced understanding of the differences in snow cover changes affecting SOS in different vegetation types under climate change in Northeast China.

1. Introduction

Earth’s temperature has experienced an average increase of 0.18 °C per decade [1]. Meanwhile, the warming trend in China was measured at 0.21 ± 0.02 °C per decade from 1951 to 2010 [2], and this warming trend continues at an even faster pace [3]. Northeast China is located in the northernmost region, and its annual average surface temperature change rate is much higher than the national average [4,5]. Climate change has significantly altered the timing of phenological events, including the widely reported advancement in the growing season [6,7,8]. With the backdrop of climate change, these significant phenological changes have major impacts on community structures and ecosystem functions [9,10,11]. Phenological changes induced by warming are also a major cause of the recent increase in plant activity and carbon uptake [12].
The start of the growing season (SOS) in China’s temperate ecosystems displays distinct spatial patterns across vegetation types, spatial gradients, and decadal variations. Previous studies indicate that the SOS in temperate ecosystems in China significantly advanced from 1982 to 2010, with a maximum rate of 0.79 days yr−1 [8,13]. In comparison, the changes in SOS are even more pronounced in high-latitude regions. In Northeast China, the SOS exhibited a significant trend of advancement in deciduous coniferous forests (1.3 days yr−1), deciduous broadleaf forests (0.88 days yr−1), and grasslands (0.79 days yr−1) [14,15], while the SOS of rainfed cropland was significantly delayed (>30 days) [16].
In most ecosystems, precipitation, temperature, and photoperiod significantly impact vegetation distribution, phenology, and biomass [17,18,19,20]. However, at high latitudes and elevations, snow cover is another key factor affecting vegetation phenology [21]. Snow cover is considered a crucial element within the northern climate system. It affects vegetation growth both directly and indirectly [22]. For example, the presence or absence of snow cover affects the surface energy balance [23], thereby affecting the subsurface thermal conditions. Snow cover also affects optical reflectance, thus influencing the greening trend. For example, declining snow cover decreases the surface spectral reflectance, partially explaining the higher normalized difference vegetation index (NDVI) values [24,25]. Snow cover inhibits efficient vegetation photosynthesis by blocking incoming radiation, leading to a delay in the SOS and a shorter length of the growing season [26,27,28]. The SOS is clearly impacted by advancing or delaying the snow cover end date (SCED) [29]. The SCED is determined by both spring temperatures and the depth of snow cover [30]. The impacts of snowmelt on vegetation phenology are largely driven by synergistic changes in soil water content and soil temperature induced by snowmelt. As snowmelt begins, the infiltrated snowmelt water and the insulation of the remaining snow cover stimulate vegetation activities below the snow [31].
Northeast China is situated within the high-latitude region of the country, with a maximum latitude of 53°33′N. It is the second-largest stable snow-covered region of China [32] and an important production base for agriculture, forestry, and husbandry. Many studies have focused on the response of SOS to climate factors such as temperature, precipitation, and radiation [15,31,33,34,35], and some studies have also considered the response of SOS to other factors such as percent tree cover, urbanization, and cropland expansion [14,16,36], but they have not considered the effect of snow cover. Some studies have explored the impact of snow cover on SOS and they centered their attention on how snow phenology affects SOS, but they did not pay enough attention to the effect of snow characteristics, such as snow water equivalent (SWE) [37,38]. Furthermore, the differences in how snow cover affects SOS in different vegetation types have received less attention. The understanding of the pathways, including the pathways of water and temperature, by which snow cover impacts SOS remains unclear.
In this study, we focused on the relation between SOS and snow cover changes using remote sensing datasets from 1982 to 2015 in Northeast China to reveal the interaction between snow cover and SOS. The primary objectives of our study were (1) to analyze the spatiotemporal changes in SOS and snow cover indicators, (2) to quantify the impact of snow cover indicators on SOS in different vegetation types, and (3) to reveal the mechanisms by which snow cover affects SOS in different vegetation types. These findings are expected to provide new insight into how the SOS responds to snow cover changes and improve the predictions of the response of vegetation to changing climate conditions in Northeast China.

2. Datasets and Methods
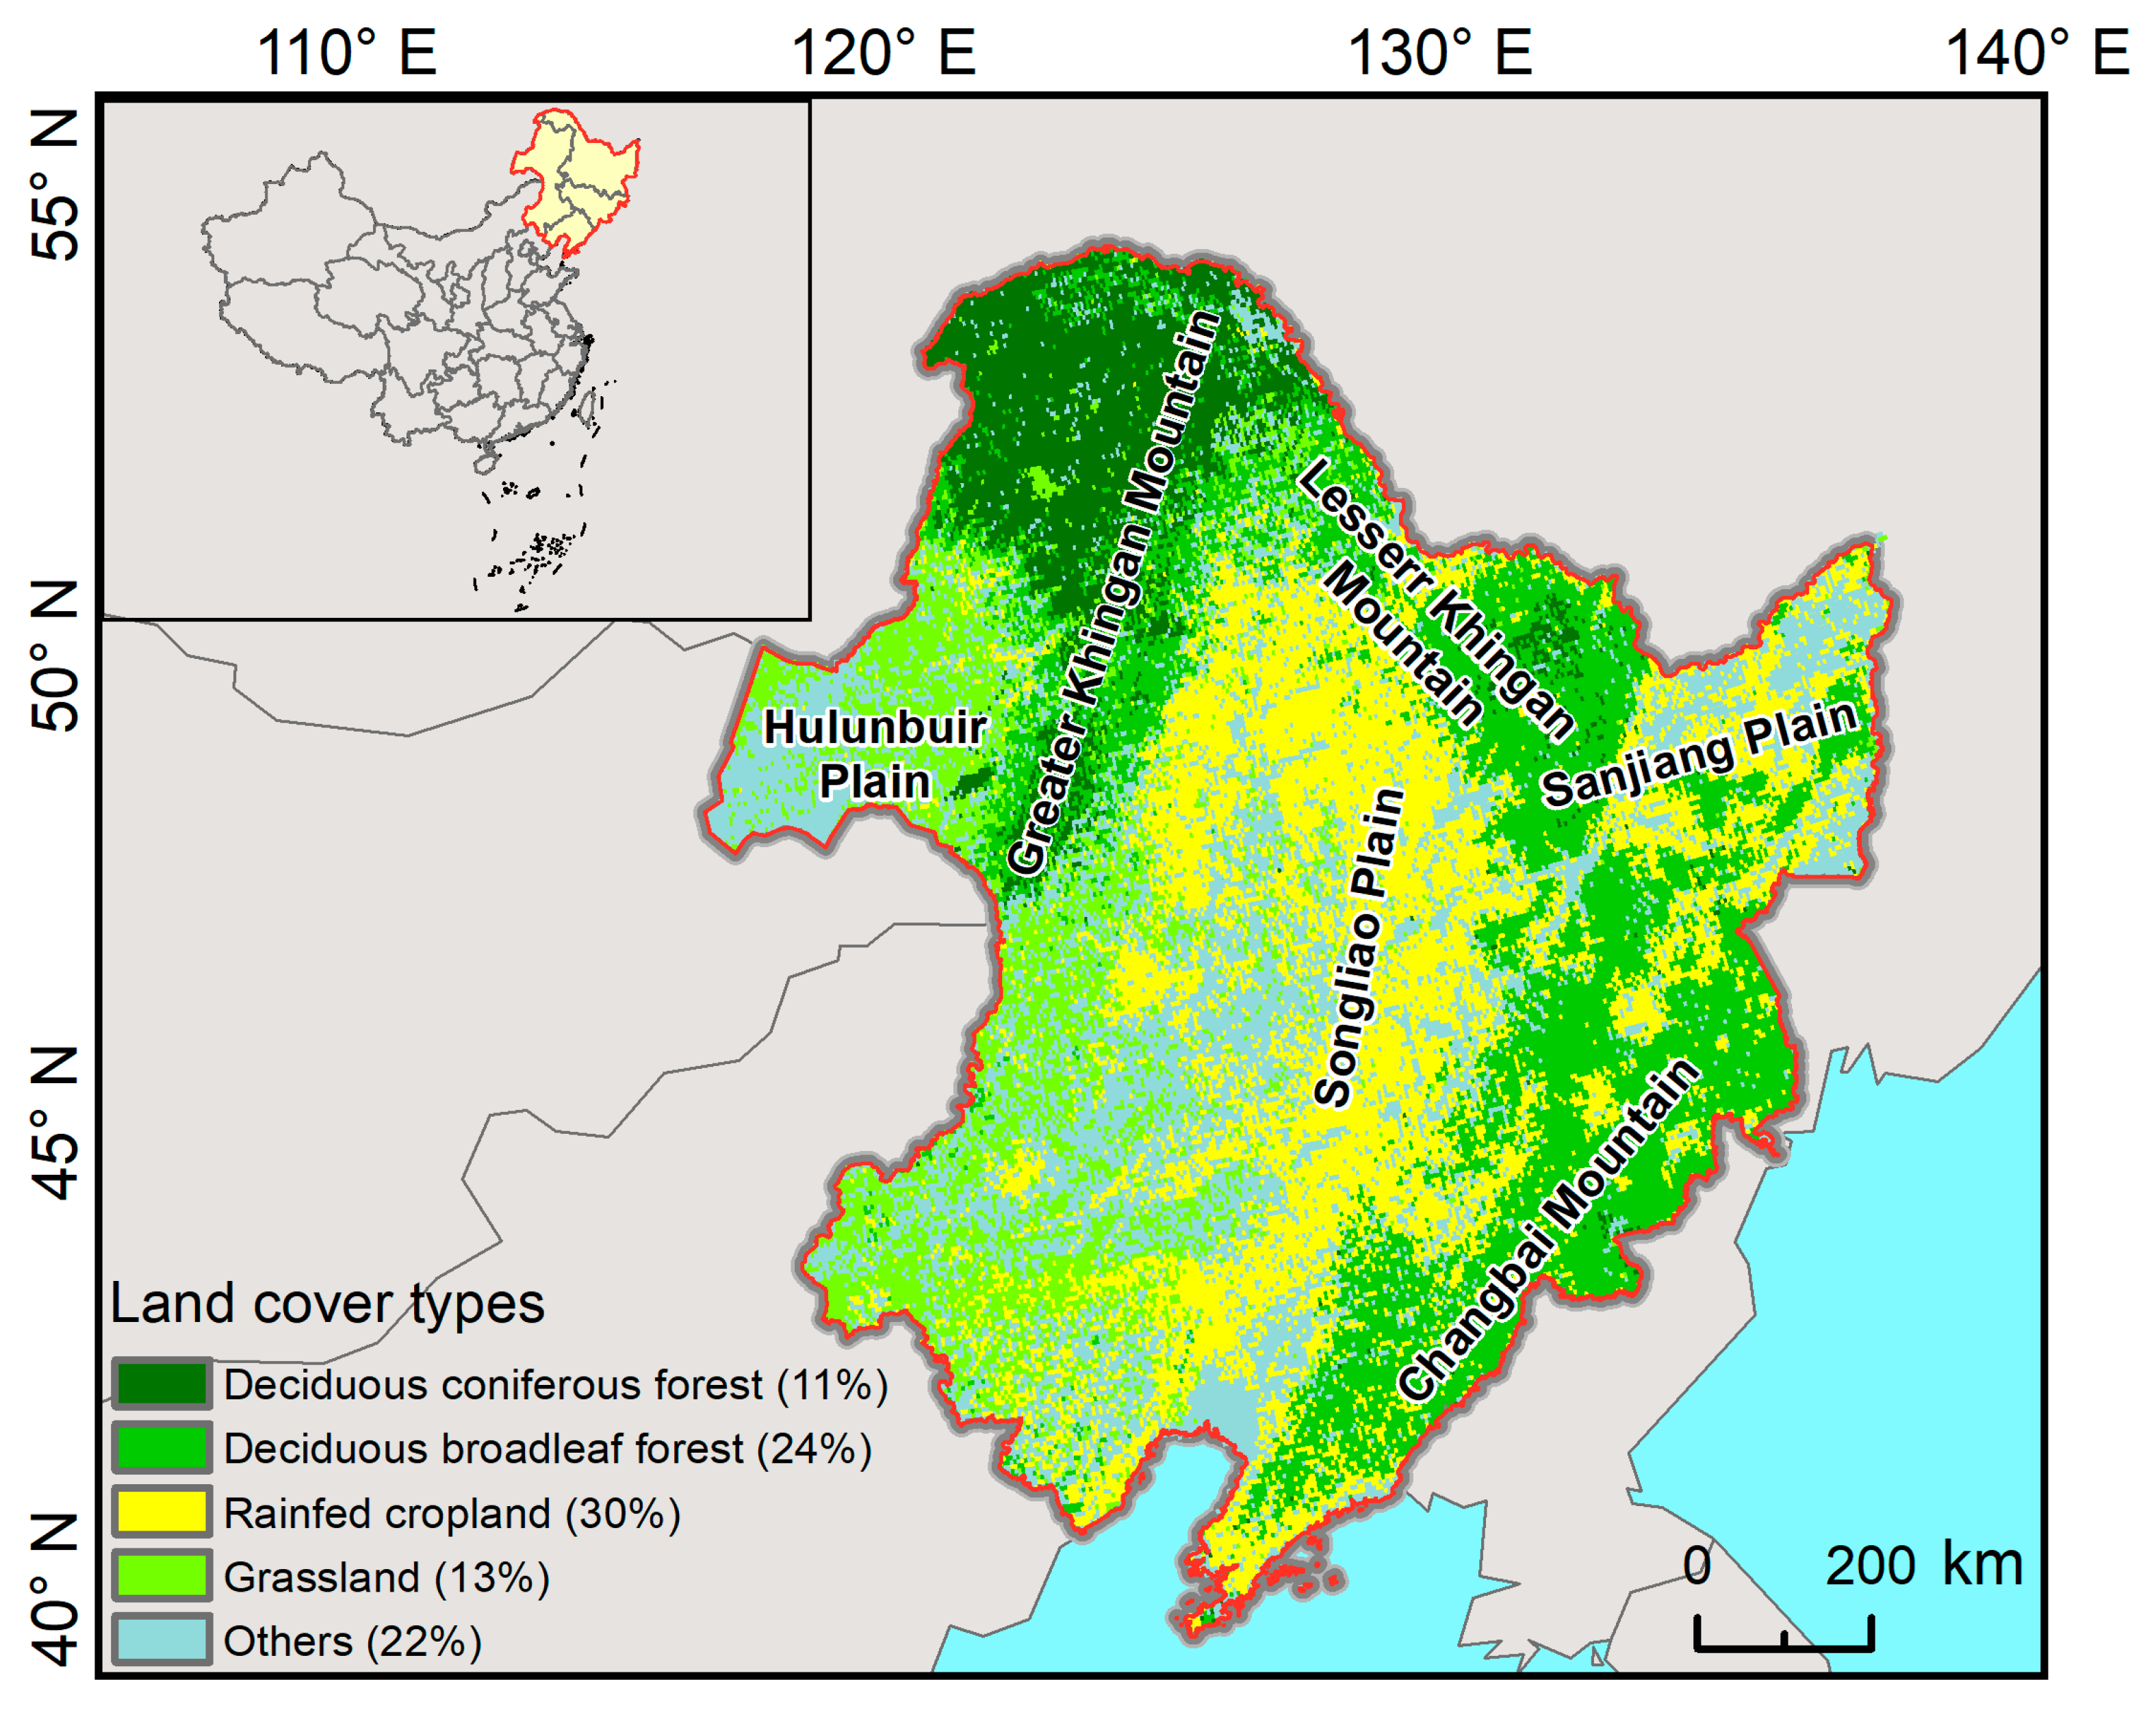
2.1. Study Area

Northeast China serves as the study area (Figure 1). The region exhibits a relatively large latitudinal gradient (38°–53°) and elevational gradient (0–2691 m). The length of seasonal snow cover varies across the region, and it is characterized by a variety of vegetation types. These diverse vegetation types can be used to explore the varied impacts of snow cover changes on vegetation.
The vegetation map was derived from the Climate Change Initiative Land Cover (CCI LC) project. The land cover data at a spatial resolution of 300 m were provided by the European Space Agency [39]. Our emphasis was on pixels where the land cover types remained unchanged, and we selected the main vegetation categories, including deciduous broadleaf forests, deciduous coniferous forests, grasslands, and rainfed croplands. Croplands included dryland croplands and irrigated fields. We excluded irrigated fields because they are significantly disturbed through human management. Moreover, the majority of the dryland in Northeast China comprises rainfed croplands, which rely on natural rainfall without irrigation and thrive under the prevailing climate conditions [40,41]. Forests included deciduous forests and evergreen forests. Evergreen forests were also excluded from the analysis since their bud burst was a challenge to detect [42].

2.2. Observational Datasets

Snow cover phenology data at a spatial resolution of 5 km from 1982 to 2015 and SWE data of 25 km from 1982 to 2015 were provided by National Cryosphere Desert Data Center [43,44]. The satellite-derived NDVI commonly represents vegetation greenness [45]. It is used to interpret the SOS through the extraction of land surface phenology [13]. We utilized the GIMMS NDVI3g dataset, which offers a spatial resolution of 1/12° from 1982 to 2015. Moreover, the GIMMS NDVI3g dataset has undergone rigorous correction processes, including calibration, solar geometry, significant aerosol presence, cloud effects, and various non-vegetation-related elements [46]. As the most extended and uninterrupted dataset to capture worldwide vegetation dynamics, GIMMS NDVI3g stands out as the optimal selection for conducting long-term analysis of vegetation trends [47,48].
Daily temperature, precipitation, solar shortwave radiation, soil temperature (ST), and soil moisture (SM) were sourced from the European Centre for Medium-Range Weather Forecasts ERA-5 land dataset [49]. This dataset is the most up-to-date reanalysis dataset, with a long temporal resolution (1979~) and a high spatial resolution of 0.25°, and it is widely used in climatic and ecological studies [50].
Given the diverse timeframes covered by the datasets mentioned, we limited our analysis to the years 1982–2015 to coincide with the NDVI series. Furthermore, to match the resolution of the snow cover dataset, all datasets were interpolated to a spatial resolution of 5 km. This was achieved using the nearest neighbor resampling method, eschewing any inconsistencies in resolution.

2.3. Snow Cover Indicators and SOS Determination

Using the seasonal snow cover cycle as a reference, the hydrological year is delineated as commencing on September 1st of a given year and concluding on August 31st of the subsequent year. SCD is determined by summing up the count of days with recorded snow cover throughout a hydrological year [44]. SCED, on the other hand, marks the date of the final occurrence of a continuous five-day snow cover period within the same hydrological year [51]. Additionally, SWEmax is characterized as the highest value of SWE observed during a hydrological year [52].
Snowmelt may complicate the derivation of SOS [53,54]. Therefore, before extracting the SOS, we undertook the procedure of substituting NDVI values affected by snow with the average of NDVI values during the dormant periods [55]. This replacement was executed on a per-pixel basis, utilizing the snow flag information derived from the GIMMSNDVI3g quality field [56]. Then, the Savitzky–Golay filter was applied to significantly enhance smoothness and reduce noise [57].
There are two steps involved in the SOS extraction method [58]. First, the double logistic function is employed to fit the NDVI time-series dataset, as it has demonstrated better suitability than other algorithms, especially in regions with persistent snow cover at high latitudes [59].
y ( t ) = a + b ( 1 1 + e c ( t d ) + 1 1 + e e ( t f ) )
where a represents the initial background NDVI value; b is the maximum NDVI value; t is the time in days; y(t) is the NDVI value at time t; and c, d, e, and f are parameters that need to be set.
Second, we employ two commonly used methods to determine the SOS from NDVI dataset, i.e., the inflection point detection method and dynamic threshold method [60,61]. In the inflection point detection method, we identify the inflection point in the reconstructed NDVI time-series curve. The SOS is determined as the date corresponding to the maximum first derivative of the fitted curve [62,63]. In the dynamic threshold method, a fixed percentage of the annual maximum is used to compare the smoothed fitted NDVI time series. The SOS is then determined as the date when the threshold of the NDVIday is exceeded, representing the first day of the growing season [64].
N D V I r a t i o = N D V I d a y N D V I m i n N D V I m a x N D V I m i n
where NDVIratio represents the ratio of the annual amplitude of NDVI on a specific day, and we set the threshold of NDVIratio as 0.5; NDVIday refers to the fitted NDVI value on a particular day, while NDVImax and NDVImin are the maximum and minimum NDVI values observed each year, respectively [65]. Additionally, we refined the selection of suitable SOS dates, narrowing them down to fall within the range of 1 to 200 days of the year (DOY). We specifically retained the pixels where SOS could be determined consistently across all 34 years. To mitigate potential uncertainty stemming from methodological disparities, we employed a dual approach, incorporating both methods and subsequently averaging their outcomes to ascertain the ultimate SOS value.

2.4. Statistical Analyses

Theil–Sen method [66] was utilized to calculate the slopes between all pairs of points. The resulting median slope was then utilized to determine the magnitude and direction of the temporal trend for both SOS and snow cover indicators. The trends were calculated by adopting the improved Mann–Kendall test [67], which has been widely applied for evaluating time-series trends due to its ability to simplify calculations and effectively handle autocorrelation in the data.
Considering the influence of other climatic factors, we conducted partial correlation analysis to investigate the impact of SCD, SCED, and SWEmax on the SOS. In this analysis, we controlled for the impact of total precipitation and mean air temperature in the pre-growing season (March and April), as well as the mean solar shortwave radiation during the same period. Because of the multicollinearity among snow indicators, we conducted stepwise regression to eliminate confounding factors and pinpoint the primary snow indicators that influence SOS on a per-pixel basis. Furthermore, we conducted a stepwise regression method to extract the main snow indicators influencing SOS based on the determination coefficients for each pixel. This is an effective method that can solve the multicollinearity of different snow indicators, and has been widely used in ecological studies [52,68,69]
Structural equation modeling (SEM) is a robust multivariate technique that is increasingly prevalent in scientific research for testing and evaluating multivariate causality [70]. It allows for the examination of both direct and indirect effects on predetermined causal relations. Partial least squares path modeling (PLS-PM) was employed to investigate the mechanisms through which snow cover impacts SOS. PLS-PM is a component-based, also known as variance-based, approach to SEM [71]. It demonstrates an improved ability to manage limited sample sizes and non-normal data.
We included the subsequent variables into the theoretical path model connecting snow cover factors to SOS, drawing from prior recognition and data availability: snow (including SCD, SCED, and SWEmax), SM, ST, and SOS [72,73]. Schematic path diagram shows how snow cover impacts SOS through changes in SM and ST (Figure 2). Two primary pathways were identified. The initial one is denoted as the “moisture effect”, in which snow cover affects SOS through changes in SM. The second is recognized as the “temperature effect”, in which snow cover affects SOS through changes in ST. Notably, in the “moisture effect”, the effect of ST on SM is also taken into consideration.
In the PLS-PM analysis, the path coefficients indicate the magnitude and direction of the direct effect between two variables. A positive path coefficient indicates that when the explanatory variable increases, the response variable also increases, and vice versa. To evaluate the quality of the path model and assess its effectiveness, we used the goodness-of-fit index (GOF), which is a global measurement. A GOF value higher than 0.36 indicates that the modeling results are reliable [74]. We conducted separate PLS-PM analyses for each geographical zone, and before performing the path analysis, all variable data were normalized.

3. Results

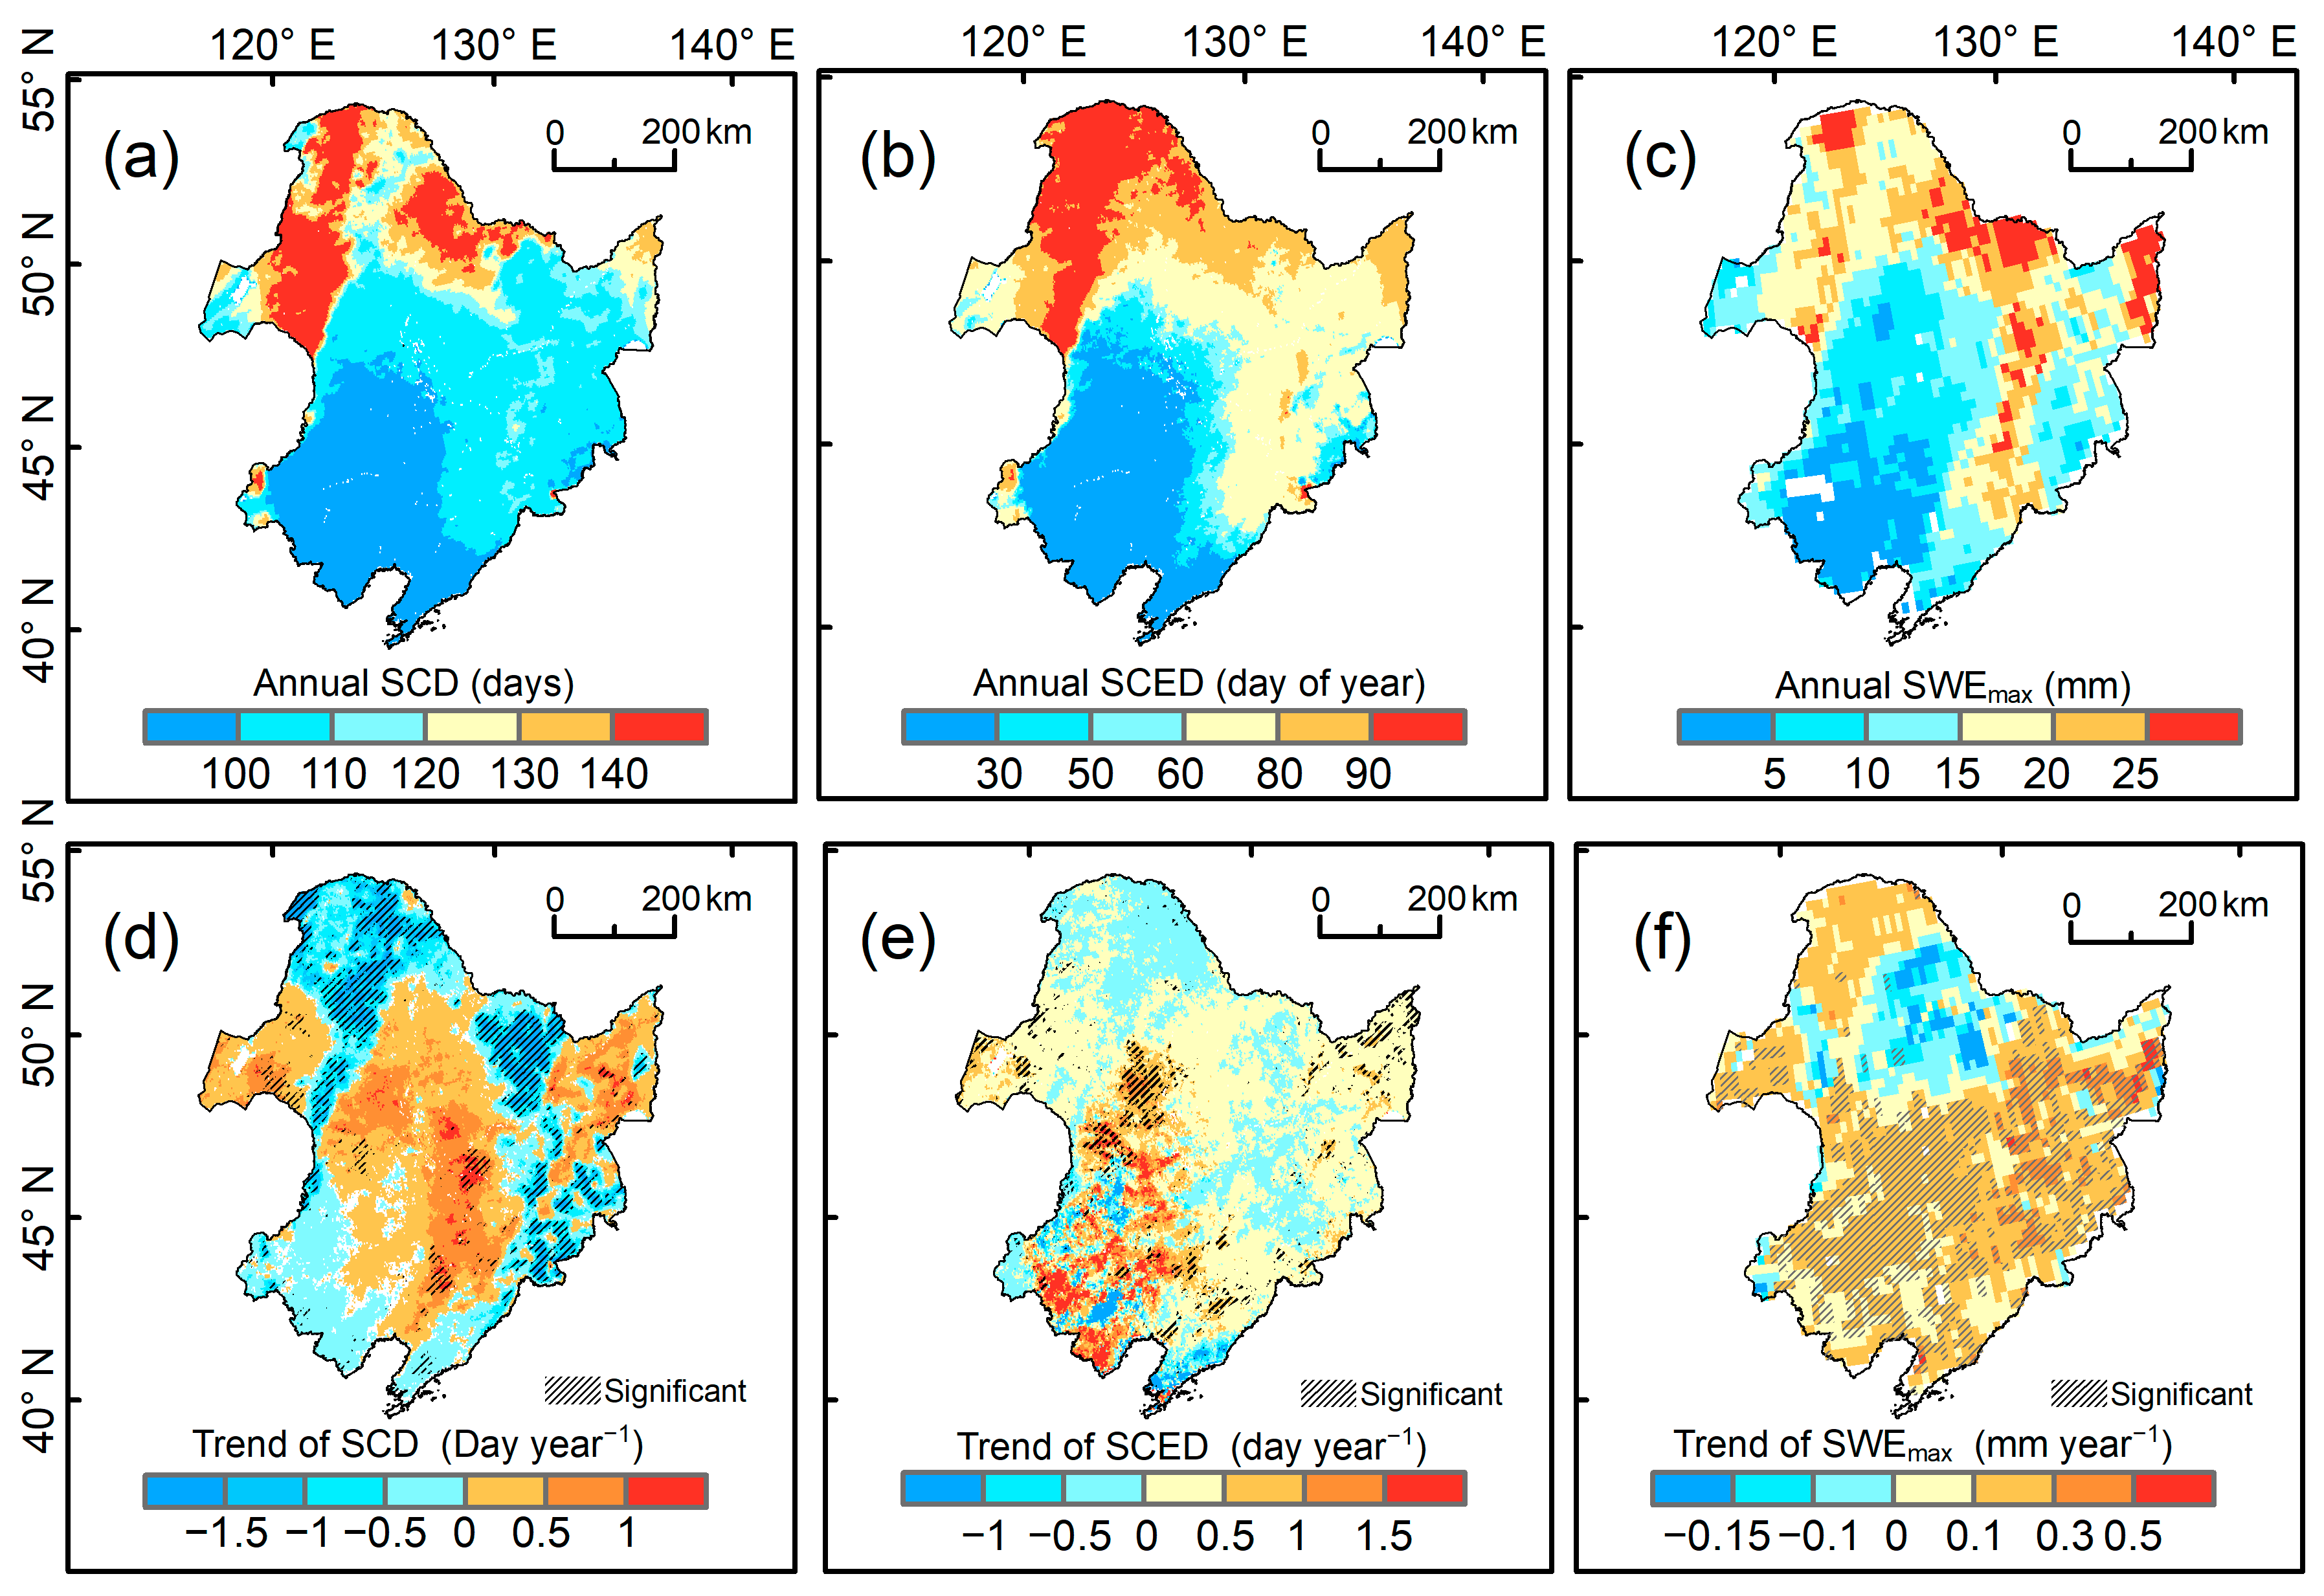
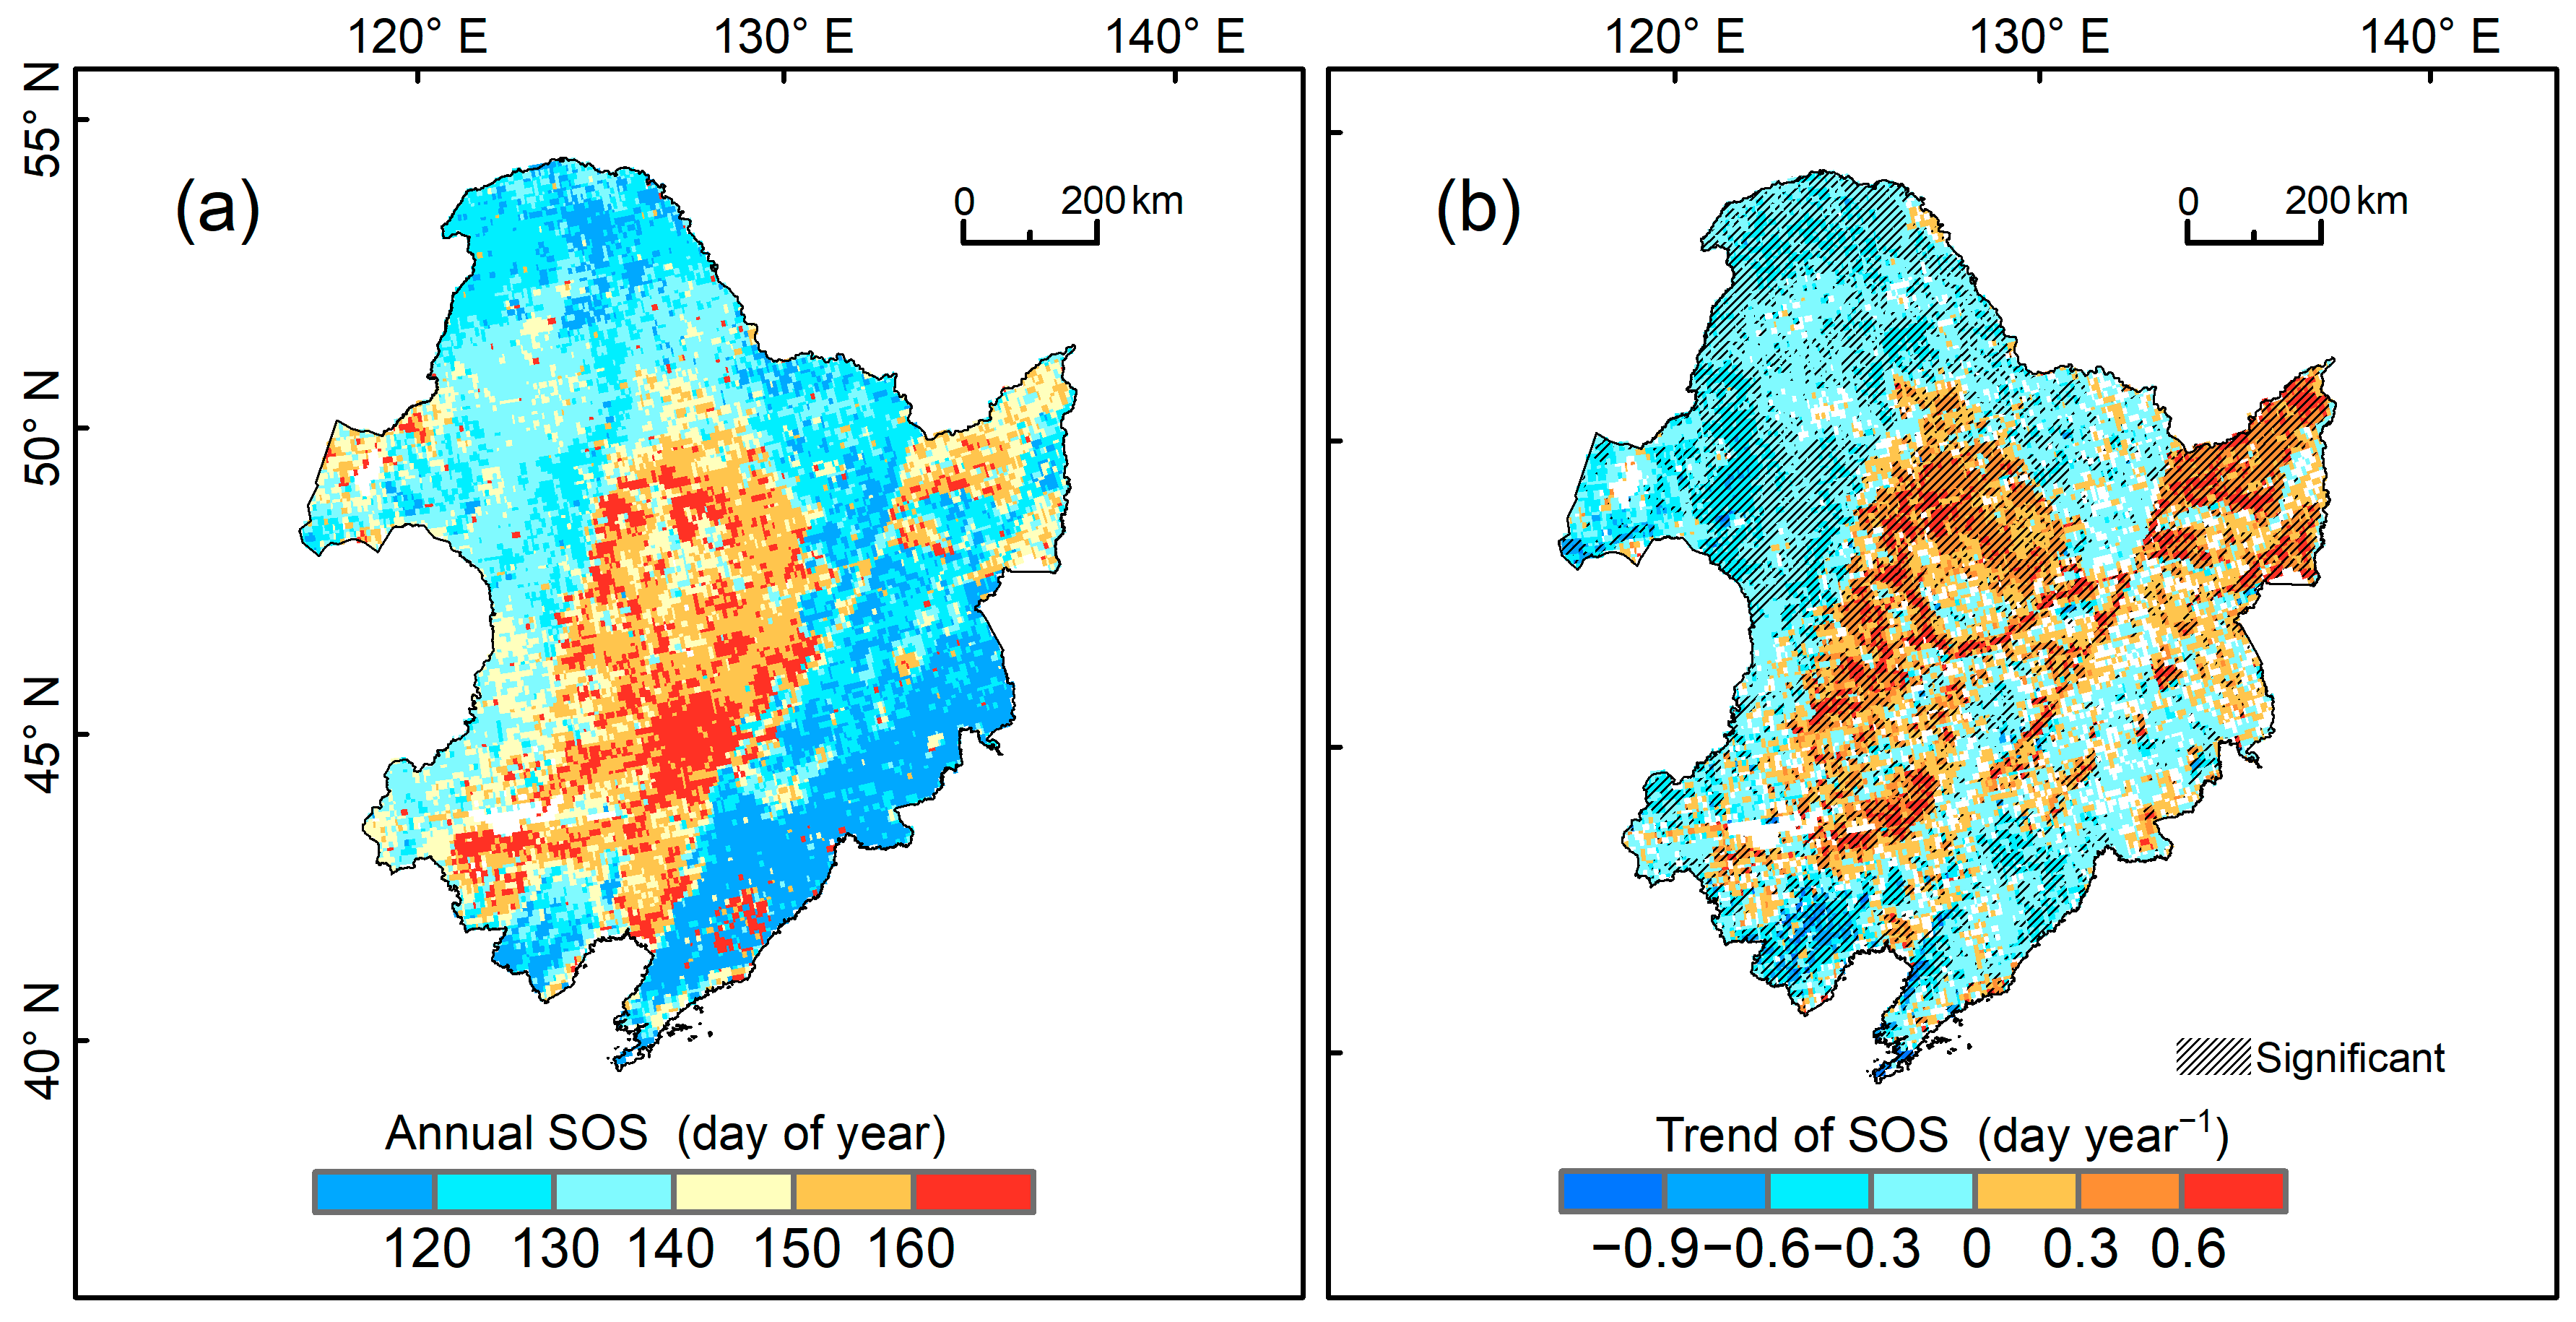
3.1. Spatiotemporal Dynamics of Snow Cover and SOS

The spatiotemporal changes in snow cover indicators (SCD, SCED, and SWEmax) and SOS from 1982 to 2015 in Northeast China are depicted in Figure 3 and Figure 4, respectively. The annual means of snow cover indicators exhibit similar spatial patterns, gradually increasing with higher latitudes. High values of SCD and SCED are observed in the Greater Khingan Mountains and Lesser Khingan Mountains (days > 145 and DOY > 94). High values of SWEmax are observed in high-altitude mountains and in the easternmost plain, with the maximum value exceeding 32 mm (Figure 3a–c).
SCD shows a significant decrease in the Greater Khingan Mountains, Lesser Khingan Mountains, and Changbai Mountains (Figure 3d). The range of SCED variation is relatively small, and significant delays are observed in certain regions of the Hulunbuir Plain, Songliao Plain, and Sanjiang Plain (Figure 3e). The SWEmax exhibits a significant increasing trend, except in the northern and central regions (Figure 3f).
The annual means of SOS exhibit a consistent spatial distribution and trends. An earlier SOS is observed in the Greater Khingan Mountains, Lesser Khingan Mountains, Changbai Mountains (average elevation >1000 m), and Hulunbuir Plain (average elevation of 550–700 m), where SOS predominantly exhibits a significant advancing trend. Conversely, a later SOS mainly occurs in the Songliao Plain and Sanjiang Plain (average elevation <200 m), where SOS shows a pronounced delayed trend (Figure 4).

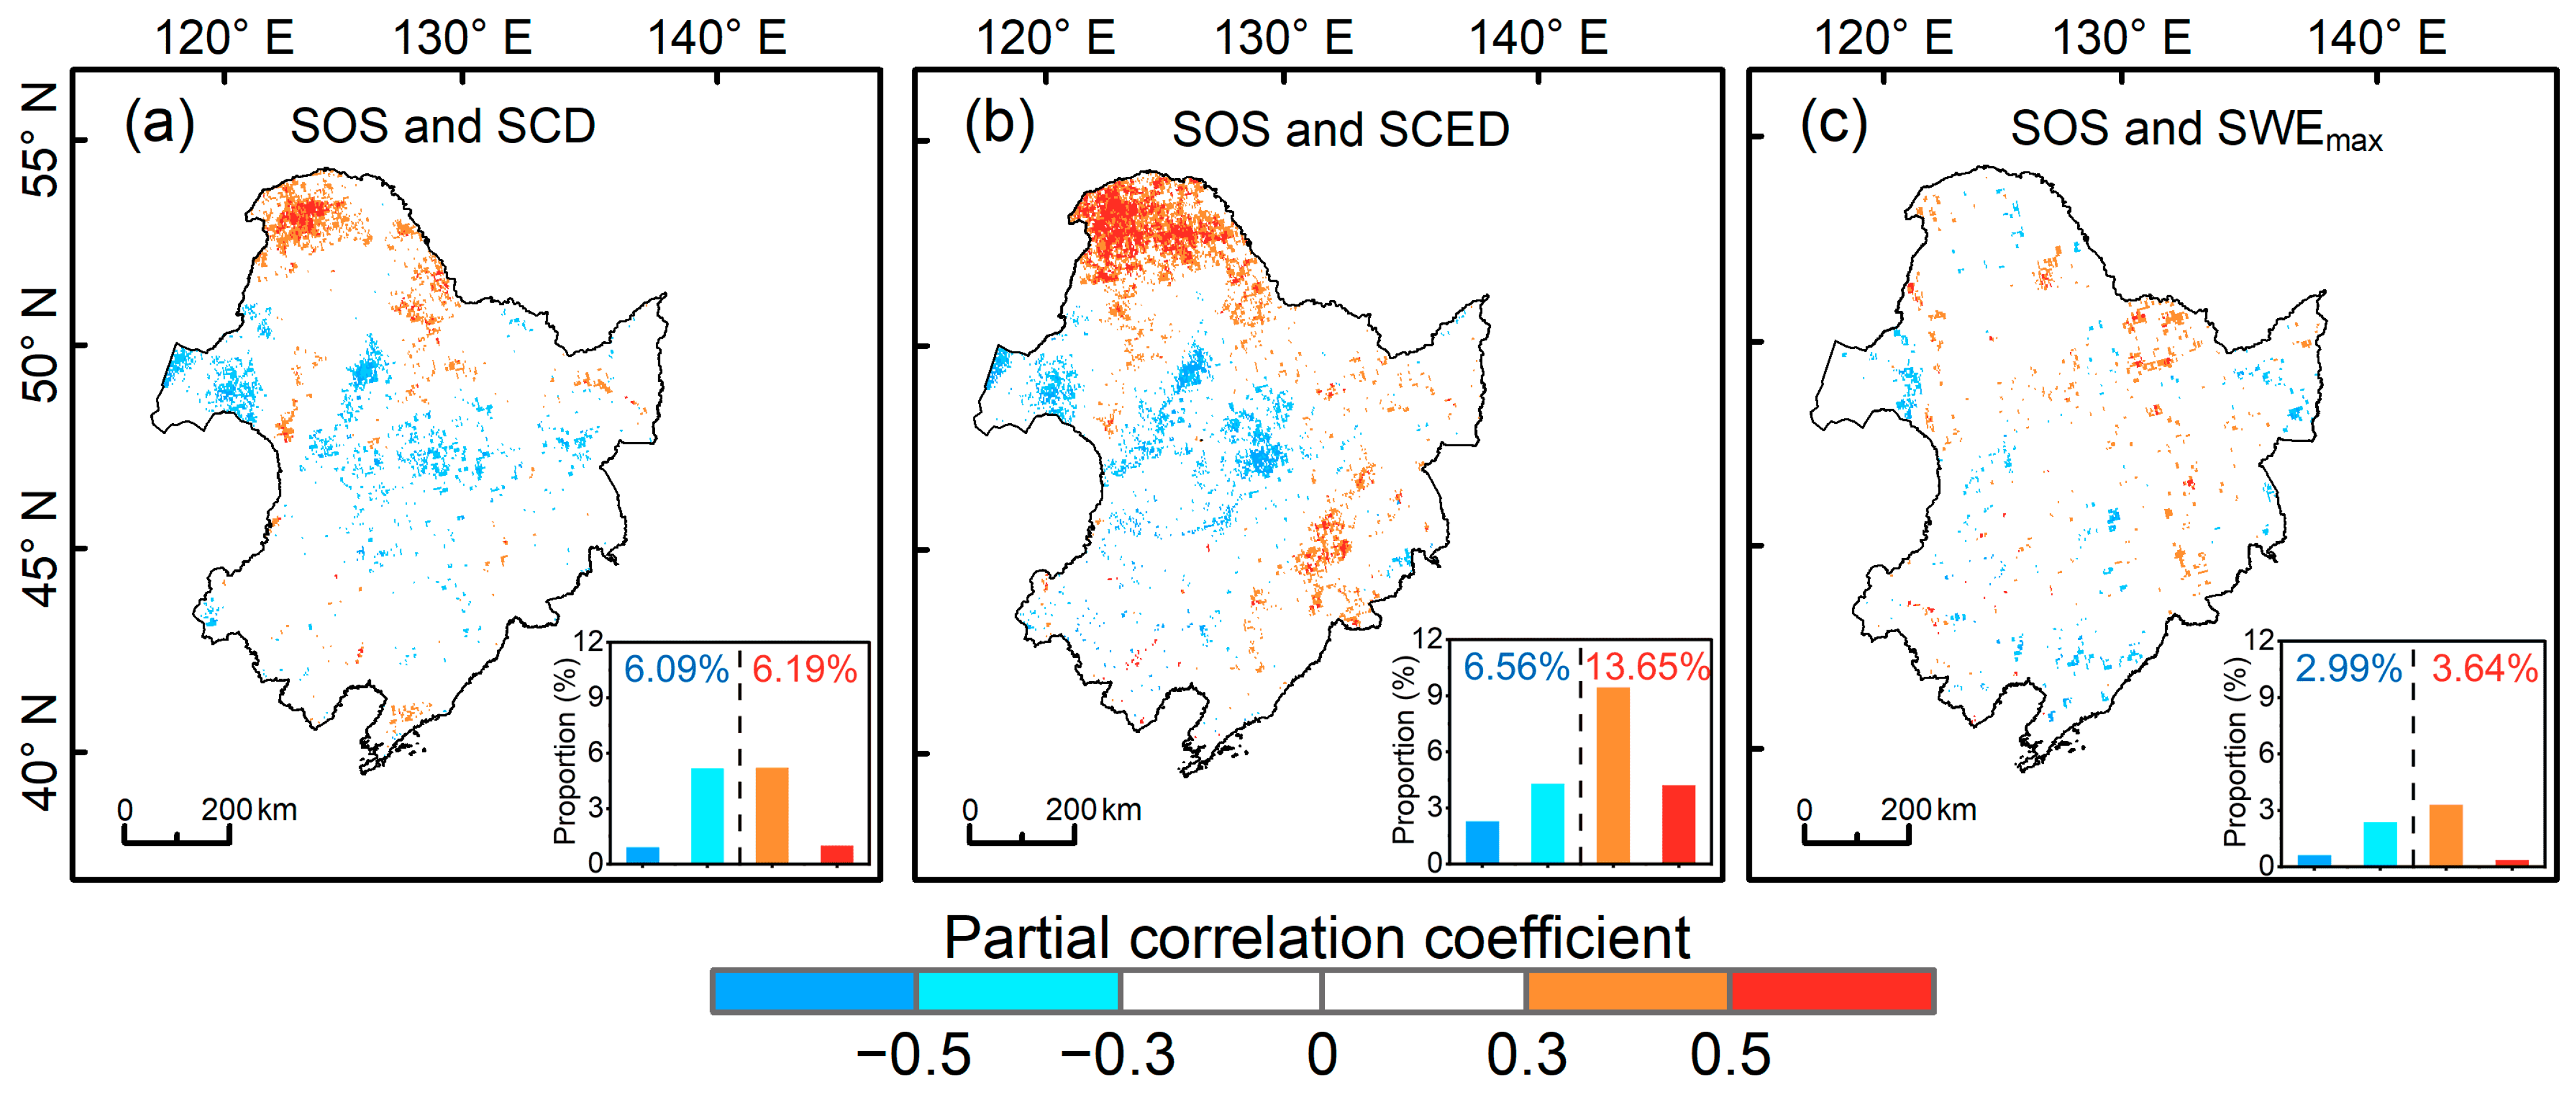
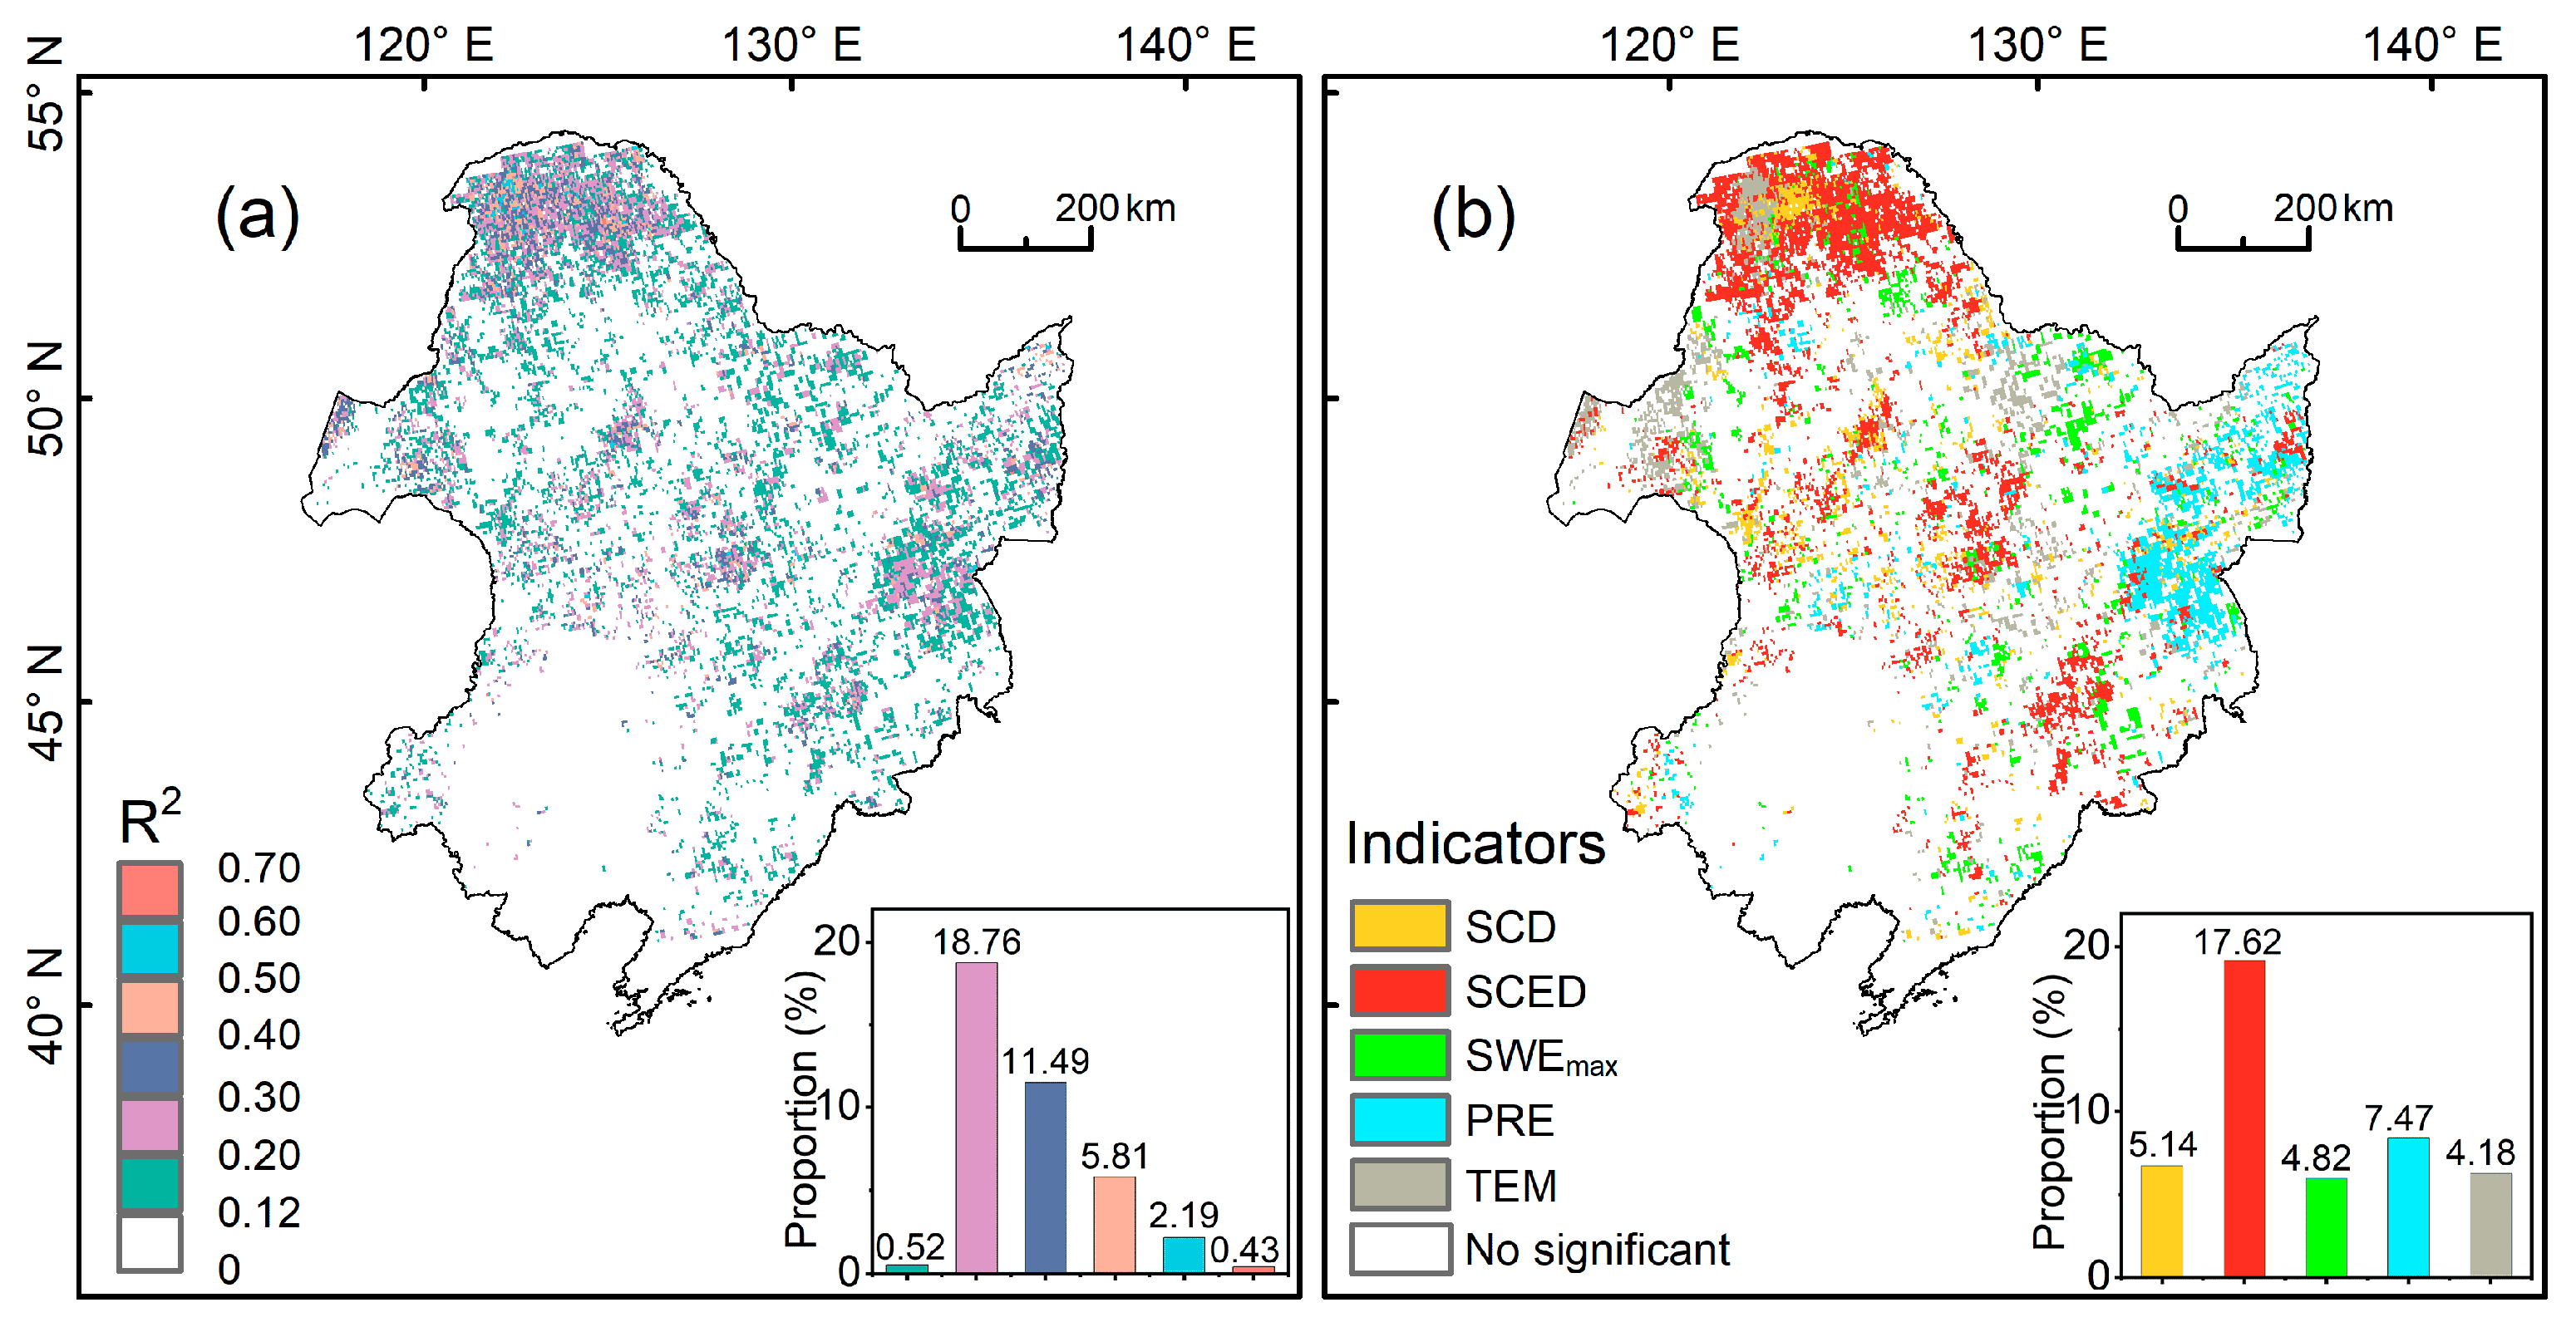
3.2. Impact of Snow Cover Changes on SOS

Partial correlation analysis was conducted to investigate the relation between snow cover and SOS after excluding the impact of precipitation, air temperature, and solar shortwave radiation. Overall, snow cover shows a positive correlation with the SOS in the mountains, whereas the relation is opposite in the plains (Figure 5). SCED has the most significant impact on SOS, accounting for 20.21% of the whole area. The later SCED likely delays the SOS in the Greater Khingan Mountains, Lesser Khingan Mountains, and Changbai Mountains. Conversely, in the Hulunbuir Plain and Songliao Plain, the delay in the SCED likely advances the SOS (Figure 5b). SCD also has a significant impact on SOS, accounting for 12.28% of the whole area, which is lower than the proportion of SCED. Spatially, the relation between SCD and SOS is similar to that between SCED and SOS (Figure 5a). However, the proportion of the correlation between SWEmax and SOS is relatively small, accounting for 6% of the whole area (Figure 5c).
We calculated the proportion of significant correlations among different vegetation types (Table 1). The vegetation region showing a significant positive correlation between snow cover and SOS is found to be larger than the region with significant negative correlations. SCED has the most significant impact on SOS in different vegetation types, especially in deciduous coniferous forests, where the proportion of significant positive correlation pixels is highest at 8.04% compared to non-significant pixels at 9.03%. The impact of SCD on deciduous coniferous forests is also significant, with a proportion of 3.40% for a significant positive correlation and 14.71% for a non-significant positive correlation. However, the impact of snow cover on different vegetation types exhibits significant heterogeneity. Significant positive correlations are dominant in deciduous broadleaf forests, with a total proportion of 6.71% for positive correlations and 1.71% for negative correlations. Similarly, in deciduous coniferous forests, the total proportion is 11.90% for positive correlations and 0.87% for negative correlations, suggesting that an increase in snow cover could delay the SOS of forests. Conversely, correlations are mainly significantly negative for grasslands, with a total proportion of 1.76% for positive correlations and 6.09% for negative correlations. Similarly, in rainfed croplands, the total proportion is 3.11% for positive correlations and 6.97% for negative correlations, indicating that more snow cover might result in an advancement in the SOS in these areas.
We conducted a quantitative analysis to assess the significance of snow cover on the SOS of vegetation in Northeast China. In the Greater Khingan Mountains, Songliao Plain, and parts of the Changbai Mountains and Lesser Khingan Mountains, snow cover variability (SCD, SCED, and SWEmax) together explained the SOS variation, accounting for 31.86% of the whole region. SCED was the most significant influencing factor, solely explaining the SOS variation and accounting for 17.62% of the variation in the whole region. On the Sanjiang Plain, precipitation was identified as the primary factor influencing SOS, explaining 7.47% of the whole region. In the Hulunbuir Plain, temperature was considered a significant influencing factor, explaining 4.18% of the whole region (Figure 6).
The impact of snow cover and climate factors on SOS in different vegetation types shows distinct patterns. SCED has a predominant effect on the SOS of all vegetation types in Northeast China. Furthermore, SCD has a significant impact on deciduous coniferous forests (1.35%). Precipitation plays a significant role in the SOS of deciduous broadleaf forests (3.21%) and rainfed croplands (3.54%), while temperature notably influences the SOS of grasslands (1.86%). In contrast, SWEmax contributes the least among all factors (Table 2).

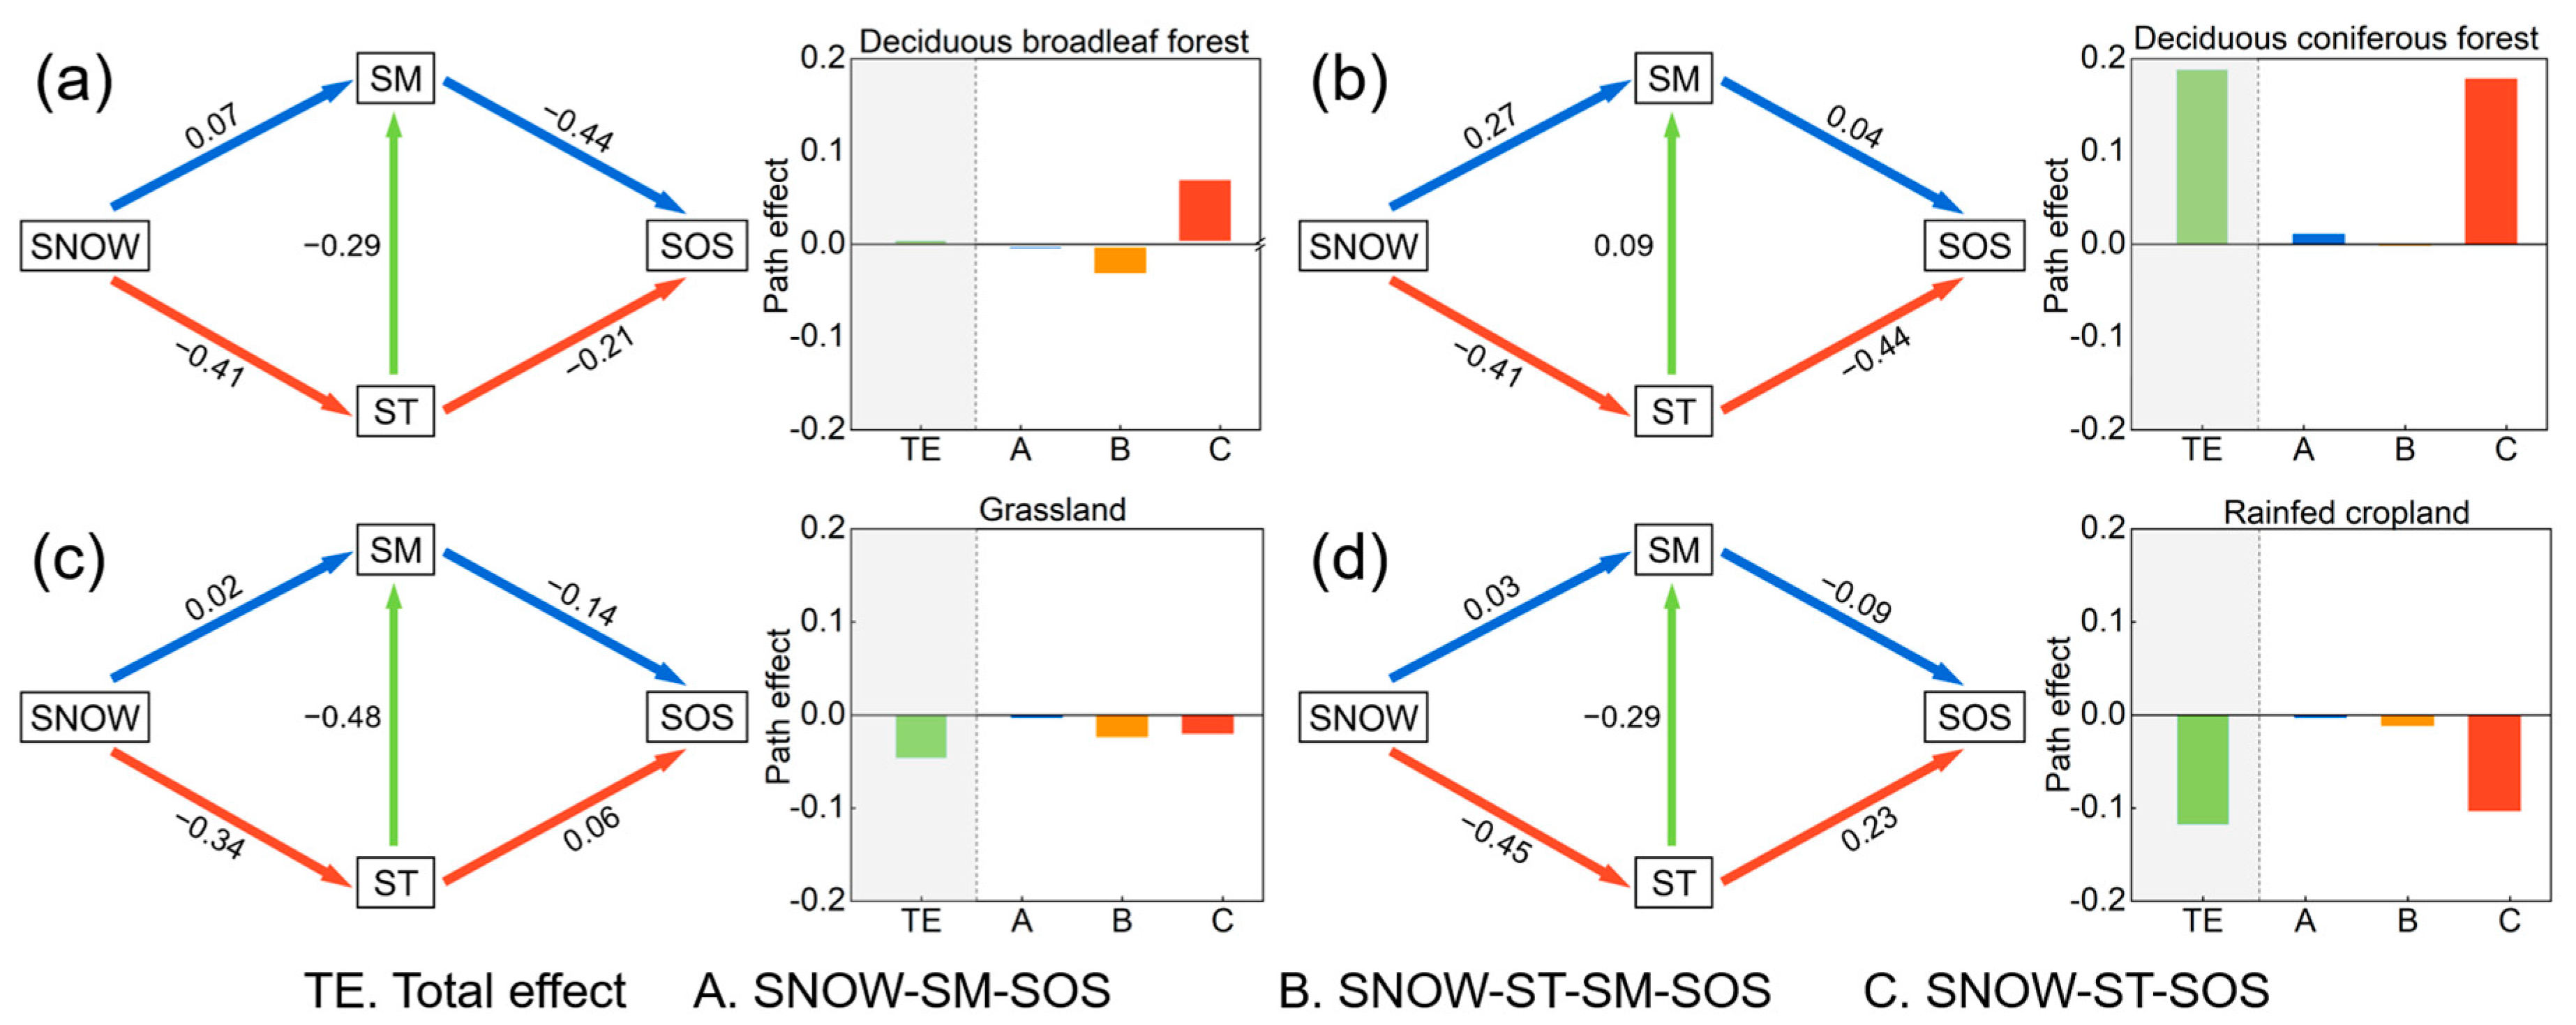
3.3. Underlying Mechanism in Different Vegetation Types

We quantified the relative importance of the two main processes (“moisture effect” and “temperature effect”) contributing to the snow cover–SOS correlation based on the path analysis. In all regions, GOF values are higher than 0.36, indicating that the model can effectively explain the mechanism of snow cover changes affecting SOS. We found that the “temperature effect” of snow cover plays a dominant role in deciduous broadleaf forests, deciduous coniferous forests, and rainfed croplands; however, the “moisture effect” of snow cover has a greater impact on grasslands. The path effects vary in different vegetation types (Figure 7).
Snow cover has a positive total effect on SOS (that is, earlier SOS under less snow) for deciduous coniferous forests and deciduous broadleaf forests. In deciduous coniferous forests, the most pronounced pathway affecting SOS is the “temperature effect” (Snow → ST → SOS), with the “moisture effect” being very weak, suggesting that a decrease in snow cover advances SOS mainly through an increase in ST. Snow cover also has a positive total effect on SOS in deciduous broadleaf forests, but the “temperature effect” is weaker than that in deciduous coniferous forests while having a certain “moisture effect”. This result suggests that the impact of snow cover on deciduous broadleaf forest is also dominated by the “temperature effect”. In contrast, snow cover for grassland has a negative total effect on SOS (that is, earlier SOS under more snow cover), and the negative “moisture effect” is stronger than the negative “temperature effect”. This suggests that the delay in snow cover could advance SOS due to a water–thermal synergistic effect dominated by the “moisture effect”. Snow cover in rainfed croplands also has a negative total effect on SOS, but the “temperature effect” is stronger than the “moisture effect”. This result suggests that the impact of snow cover on rainfed croplands is dominated by the “temperature effect”.
Additionally, the calculated path coefficients in the path analysis encompass the impact of one variable’s trend on another variable. For instance, there was an advanced trend in grassland SOS (Figure 4b) but a delayed trend in snow cover indicators (Figure 3) over the past 34 years. The negative correlation between SOS and snow cover was consistent with the path analysis exploring that the total path coefficient linking snow cover indicators and SOS was –0.05. There was an advanced trend of SOS in deciduous coniferous forests (Figure 4b) and an advanced trend of snow cover indicators in the past 34 years. The positive correlation was also confirmed by the positive path coefficient (0.19). We calculated the path coefficients linking the variables to determine which coupling mainly contributed to the pattern in different vegetation types. We found that the relatively high “temperature effect” in deciduous coniferous forests was mainly contributed by the high path coefficients relating ST to the SOS (–0.44). The “moisture effect” was found in grasslands due to the relatively high coupling coefficients between ST and SM (–0.48), as well as between SM and SOS (–0.14).

4. Discussion

4.1. Spatial Differences in Snow Cover Affecting SOS

Over the past few decades, shifts in SOS driven by the changing climate have been extensively investigated [10]. We found that the SOS demonstrates an advanced trend in the Greater Khingan Mountains, Lesser Khingan Mountains, Changbai Mountains, and Hulunbuir Plain. Conversely, there is a delayed trend in the Songliao Plain and Sanjiang Plain. We observed that the changes in SOS correspond with satellite-derived SOS variations [16,75]. The results show that regions where SOS is advancing are mainly covered by natural vegetation such as forests and grasslands, while regions where SOS is delayed are primarily covered by rainfed cropland. Furthermore, we found that SCD decreases in forested areas, and SCED experiences delays in grasslands and rainfed croplands. Additionally, increases in SWEmax were observed in regions beyond the northern forest area.
This study showed that the impact of changes in snow cover on SOS varies in different vegetation types. Specifically, the SOS of forests shows a positive correlation with snow cover indicators, while the SOS of grasslands exhibits a negative correlation with snow cover indicators. This may be attributed to the simpler vegetation structure in grasslands compared to forests. In grasslands, the snow cover tends to melt immediately due to strong solar radiation [76,77], leading to an earlier SOS. The response of SOS in rainfed cropland to snow cover changes is similar to that in grasslands. In contrast, solar radiation is blocked by the canopy in forests. The melting process of forest snow cover may last for up to one month [78], which leads to prolonged lower temperatures during the early growing season and may result in a delay in the SOS. Furthermore, grasslands are sensitive to frost. More snow cover will prevent grasslands from being exposed to cold air temperatures too early in spring, protecting plant buds from frost damage [79,80,81]. Moderate snow cover can also effectively alleviate pest and rodent damage, which benefits the advanced SOS of grasslands.

4.2. Different Mechanisms of Snow Cover Affecting SOS

We have revealed the mechanism by which snow cover influences SOS. We found that the “temperature effect” is the dominant effect on SOS in Northeast China. However, the effect of snow cover varies among forests, grasslands, and rainfed croplands. This difference is consistent with previous studies that have indicated how the response of vegetation phenology to changes in snow cover is influenced. Specifically, it is influenced by the underlying surface conditions and different ecosystems [51,82].
In deciduous coniferous forests, the most pronounced pathway affecting the SOS is a positive “temperature effect”, suggesting that less snow advances the SOS mainly by reducing the optical reflectance and accumulating heat from solar radiation in the soil. Being located in severely cold regions at high latitudes and high elevations appears to be a primary factor for the “temperature effect”. Snow cover does not have a clear “moisture effect” in deciduous coniferous forests, which is consistent with previous studies that areas with excessive water are situated in high-latitude northern regions above 50°N, where water availability is not a limiting factor but energy is [83]. The snow cover effect in deciduous broadleaf forests is similar to that in deciduous coniferous forests, but the positive “temperature effect” is weaker, while it has a certain negative “moisture effect”, which may also be attributed to the different canopy characteristics of the forests in terms of solar radiation interception [84].
However, increased snow cover advances the SOS of grasslands through the “moisture effect”. Compared to forests, grasslands have a simpler vegetation structure [85,86]. This suggests that they can rapidly accumulate heat from solar radiation at the soil surface and increase available water for SOS. Grasslands are mainly located in semi-arid regions where water is a crucial limiting factor for vegetation [87]. Grasslands also exhibit a certain “temperature effect” and advance the SOS of grasslands through water–heat synergy. In addition, it may also be related to soil nutrient elements under the snow cover. Snow depth has a significant impact on nitrogen mineralization [88]. Moderate snow depths can foster a favorable blend of moist and warm soil conditions, resulting in a significant augmentation of total soil nitrogen buildup [89]. In rainfed croplands, the most significant pathway affecting the SOS is a positive “temperature effect”, which is consistent with previous studies showing that the SOS of agroecosystems exhibits a much higher temperature requirement for SOS than natural ecosystems [16].

4.3. Implications

Our study reveals that SOS is most correlated with SCED, compared to other snow cover indicators, and that there are large differences in the response of SOS to SCED in different vegetation types. For example, an advanced SCED leads to an advanced SOS in forests, but leads to a delayed SOS in grasslands. If SCED continues to advance, the difference between the SOS of forests and grasslands will become more pronounced in the future. In this sense, advancing SOS generally causes an increase in the length of the growing season in forests, which in turn increases water stress later in the growing season. In comparison, grasslands will be subjected to more water stress early in the growing season. This understanding can be more constructive for developing a better climate mitigation strategy or adaptation policy for different vegetation types.
Moreover, the analysis of SOS in response to changes in snow cover holds broader ecological implications. The SOS marks the beginning of spring and the return of growth in many plant species, making it a crucial event in the annual cycle of ecosystems. The timing of SOS is linked to various phenological phases of plant species, including flowering, leaf emergence, and fruiting. As a result, it becomes essential to consider the impacts of snow cover changes when investigating and assessing the broader ecological processes associated with these phenological events.

4.4. Uncertainties and Future Perspectives

It should be emphasized that the NDVI-based SOS derived from satellite data represents the average SOS of ecosystems within pixels. However, it may show differences compared to the data obtained from ground-based observations [90]]. Therefore, we focus on whether the trends in SOS derived from satellite extraction are consistent with the data obtained from ground-based observations. Apart from the influence of snow cover indicators and climate factors, human management might also play a contributing role in rainfed cropland, such as cultivar and sowing date [16,91,92]. The mechanisms of the differences in the SOS between agroecosystems and natural vegetation under anthropogenic management measures may be very complex, and revealing these underlying mechanisms can be the main purpose of future studies.
In this study, due to the constraints of available data, we did not consider additional factors when constructing the SEM. Some of these factors may have impacts on SOS, such as the total nitrogen (N) in the soil [89]. Including the Snow-N-SOS pathway could potentially provide a clearer understanding of the mechanisms through which snow cover influences SOS. Furthermore, in addition to the previously mentioned influencing factors, there are some potential drivers that have not received sufficient attention affecting SOS in Northeast China, such as land cover changes [93,94,95]. This will also be a direction for further research. We provided a comprehensive understanding of how snow cover influences SOS in Northeast China based on low-spatial-resolution remote sensing data. In the future, it will be necessary to further utilize high-spatial-resolution data and conduct long-term in situ observations to investigate the relation between snow cover and SOS at a finer scale.

5. Conclusions

In this study, we analyzed the SOS and its response to snow cover changes from 1982 to 2015 in Northeast China based on multiple satellite data products and climate datasets. Overall, in the mountains covered by forests and the plains covered by grasslands, the SOS exhibited a significant advancing trend. However, the plains covered by rainfed cropland exhibited a significant delayed trend. The results showed that snow cover had a significant impact on SOS. A reduction in snow cover led to an advancement in the SOS in forests, while an increase in snow cover resulted in an earlier SOS for grasslands and croplands. The results revealed that the impact of snow cover changes on SOS varied across different vegetation types. Furthermore, we revealed that snow cover changes affected the SOS of forests and rainfed croplands through the “temperature effect”, while they impacted the SOS of grasslands through the “moisture effect”.

Author Contributions

Conceptualization, C.R.; methodology, C.R.; formal analysis, C.R. and B.F.; writing—original draft preparation, C.R.; writing—review and editing, L.Z.; visualization, B.F.; funding acquisition, L.Z. All authors have read and agreed to the published version of the manuscript.

Funding

This research was funded by the National Natural Science Foundation of China, grant number (42271136).

Data Availability Statement

All datasets and materials used in this study are freely available online. The snow phenology dataset was downloaded from https://www.doi.org/10.12072/ncdc.I-SNOW.db0010.2021, accessed on 17 November 2021. The SWE dataset was downloaded from https://cstr.cn/CSTR:11738.11.ncdc.I-SNOW.2020.6, accessed on 15 July2022. The GIMMS NDVI3g dataset was obtained from https://iridl.ldeo.columbia.edu/SOURCES/.NASA/.ARC/.ECOCAST/.GIMMS/.NDVI3g/.v1p0/, accessed on 9 May 2019. The temperature, precipitation, and radiation data were collected from the ECMWF ERA-5 dataset from https://cds.climate.copernicus.eu/cdsapp#!/dataset/reanalysis-era5-single-levels?tab=overview, accessed on 18 April 2019. The CCI LC Land Cover Type Product was downloaded from http://maps.elie.ucl.ac.be/CCI/viewer/download.php, accessed on 10 April 2017.

Acknowledgments

All authors would like to thank the editors and anonymous reviewers for their valuable comments and suggestions that improved the quality of the manuscript.

Conflicts of Interest

The authors declare no conflict of interest.

References

  1. Lindsey, R.; Dahlman, L. Climate Change: Global Temperature. Available online: https://www.climate.gov/news-features/understanding-climate/climate-change-global-temperature (accessed on 18 January 2023).
  2. Ge, Q.; Wang, F.; Luterbacher, J. Improved estimation of average warming trend of China from 1951–2010 based on satellite observed land-use data. Clim. Chang. 2013, 121, 365–379. [Google Scholar] [CrossRef]
  3. Fu, Y.-H.; Lu, R.-Y.; Guo, D. Changes in surface air temperature over China under the 1.5 and 2.0 c global warming targets. Adv. Clim. Chang. Res. 2018, 9, 112–119. [Google Scholar] [CrossRef]
  4. Shaowu, W.; Yong, L.; Zongci, Z.; Xinyu, W.; Jianbin, H. How long will the pause of global warming stay again? Adv. Clim. Chang. Res. 2014, 10, 465. [Google Scholar]
  5. Yang, L.; Wu, B. Interdecadal variations of the east Asian winter surface air temperature and possible causes. Chin. Sci. Bull. 2013, 58, 3969–3977. [Google Scholar] [CrossRef]
  6. Gill, A.L.; Gallinat, A.S.; Sanders-DeMott, R.; Rigden, A.J.; Short Gianotti, D.J.; Mantooth, J.A.; Templer, P.H. Changes in autumn senescence in northern hemisphere deciduous trees: A meta-analysis of autumn phenology studies. Ann. Bbotany 2015, 116, 875–888. [Google Scholar] [CrossRef] [PubMed]
  7. Jeong, S.J.; HO, C.H.; GIM, H.J.; Brown, M.E. Phenology shifts at start vs. end of growing season in temperate vegetation over the Northern Hemisphere for the period 1982–2008. Glob. Chang. Biol. 2011, 17, 2385–2399. [Google Scholar] [CrossRef]
  8. Piao, S.; Fang, J.; Zhou, L.; Ciais, P.; Zhu, B. Variations in satellite-derived phenology in China’s temperate vegetation. Glob. Chang. Bbiology 2006, 12, 672–685. [Google Scholar] [CrossRef]
  9. Ernakovich, J.G.; Hopping, K.A.; Berdanier, A.B.; Simpson, R.T.; Kachergis, E.J.; Steltzer, H.; Wallenstein, M.D. Predicted responses of arctic and alpine ecosystems to altered seasonality under climate change. Glob. Chang. Biol. 2014, 20, 3256–3269. [Google Scholar] [CrossRef]
  10. Piao, S.; Liu, Q.; Chen, A.; Janssens, I.A.; Fu, Y.; Dai, J.; Liu, L.; Lian, X.; Shen, M.; Zhu, X. Plant phenology and global climate change: Current progresses and challenges. Glob. Chang. Biol. 2019, 25, 1922–1940. [Google Scholar] [CrossRef]
  11. Yang, L.H.; Rudolf, V. Phenology, ontogeny and the effects of climate change on the timing of species interactions. Ecol. Lett. 2010, 13, 1–10. [Google Scholar] [CrossRef]
  12. Piao, S.; Liu, Z.; Wang, T.; Peng, S.; Ciais, P.; Huang, M.; Ahlstrom, A.; Burkhart, J.F.; Chevallier, F.; Janssens, I.A. Weakening temperature control on the interannual variations of spring carbon uptake across northern lands. Nat. Clim. Chang. 2017, 7, 359–363. [Google Scholar] [CrossRef]
  13. Cong, N.; Wang, T.; Nan, H.; Ma, Y.; Wang, X.; Myneni, R.B.; Piao, S. Changes in satellite-derived spring vegetation green-up date and its linkage to climate in China from 1982 to 2010: A multimethod analysis. Glob. Chang. Biol. 2013, 19, 881–891. [Google Scholar] [CrossRef] [PubMed]
  14. Ding, C.; Huang, W.; Zhao, S.; Zhang, B.; Li, Y.; Huang, F.; Meng, Y. Greenup dates change across a temperate forest-grassland ecotone in northeastern China driven by spring temperature and tree cover. Agric. For. Meteorol. 2022, 314, 108780. [Google Scholar] [CrossRef]
  15. Qiao, D.; Zhou, J.; Liang, S.; Fu, X. Combined effects of precipitation and temperature on the responses of forest spring phenology to winter snow cover dynamics in Northeast China. IEEE Access 2019, 7, 138950–138962. [Google Scholar] [CrossRef]
  16. Zhao, G.; Dong, J.; Yang, J.; Wang, H.; Dai, J.; Zhou, Y.; Cui, Y.; Ge, Q. Cropland expansion delays vegetation spring phenology according to satellite and in situ observations. Agric. Ecosyst. Environ. 2023, 356, 108651. [Google Scholar] [CrossRef]
  17. Ackerman, D.E.; Griffin, D.; Hobbie, S.E.; Popham, K.; Jones, E.; Finlay, J.C. Uniform shrub growth response to June temperature across the North Slope of Alaska. Environ. Res. Lett. 2018, 13, 044013. [Google Scholar] [CrossRef]
  18. Epstein, H.E.; Walker, D.A.; Raynolds, M.K.; Jia, G.J.; Kelley, A.M. Phytomass patterns across a temperature gradient of the North American arctic tundra. J. Geophys. Res. Biogeosci. 2008, 113. [Google Scholar] [CrossRef]
  19. Flynn, D.; Wolkovich, E. Temperature and photoperiod drive spring phenology across all species in a temperate forest community. New Phytol. 2018, 219, 1353–1362. [Google Scholar] [CrossRef]
  20. Körner, C. Significance of temperature in plant life. Plant Growth Clim. Chang. 2006, 48–69. [Google Scholar] [CrossRef]
  21. Chen, X.; Liang, S.; Cao, Y.; He, T.; Wang, D. Observed contrast changes in snow cover phenology in northern middle and high latitudes from 2001–2014. Sci. Rep. 2015, 5, 16820. [Google Scholar] [CrossRef]
  22. Cooper, E.J. Warmer shorter winters disrupt arctic terrestrial ecosystems. Annu. Rev. Ecol. Evol. Syst. 2014, 45, 271–295. [Google Scholar] [CrossRef]
  23. Stiegler, C.; Lund, M.; Christensen, T.R.; Mastepanov, M.; Lindroth, A. Two years with extreme and little snowfall: Effects on energy partitioning and surface energy exchange in a high-Arctic tundra ecosystem. Cryosphere 2016, 10, 1395–1413. [Google Scholar] [CrossRef]
  24. Delbart, N.; Kergoat, L.; Le Toan, T.; Lhermitte, J.; Picard, G. Determination of phenological dates in boreal regions using normalized difference water index. Remote Sens. Environ. 2005, 97, 26–38. [Google Scholar] [CrossRef]
  25. Dye, D.G.; Tucker, C.J. Seasonality and trends of snow-cover, vegetation index, and temperature in northern Eurasia. Geophys. Res. Lett. 2003, 30. [Google Scholar] [CrossRef]
  26. Buus-Hinkler, J.; Hansen, B.U.; Tamstorf, M.P.; Pedersen, S.B. Snow-vegetation relations in a High Arctic ecosystem: Inter-annual variability inferred from new monitoring and modeling concepts. Remote Sens. Environ. 2006, 105, 237–247. [Google Scholar] [CrossRef]
  27. Jonas, T.; Rixen, C.; Sturm, M.; Stoeckli, V. How alpine plant growth is linked to snow cover and climate variability. J. Geophys. Res. Biogeosci. 2008, 113. [Google Scholar] [CrossRef]
  28. Wang, K.; Zhang, L.; Qiu, Y.; Ji, L.; Tian, F.; Wang, C.; Wang, Z. Snow effects on alpine vegetation in the Qinghai-Tibetan plateau. Int. J. Digit. Earth 2015, 8, 58–75. [Google Scholar] [CrossRef]
  29. Wipf, S. Phenology, growth, and fecundity of eight subarctic tundra species in response to snowmelt manipulations. Plant Ecology 2010, 207, 53–66. [Google Scholar] [CrossRef]
  30. Richardson, A.D.; Keenan, T.F.; Migliavacca, M.; Ryu, Y.; Sonnentag, O.; Toomey, M. Climate change, phenology, and phenological control of vegetation feedbacks to the climate system. Agric. For. Meteorol. 2013, 169, 156–173. [Google Scholar] [CrossRef]
  31. Zhang, J.; Chen, S.; Wu, Z.; Fu, Y.H. Review of vegetation phenology trends in China in a changing climate. Prog. Phys. Geogr. Earth Environ. 2022, 46, 829–845. [Google Scholar] [CrossRef]
  32. Che, T.; Li, X. Spatial distribution and temporal variation of snow water resources in China during 1993–2002. J. Glaciol. Geocryol. 2005, 27, 64–67. [Google Scholar]
  33. Yuan, M.; Zhao, L.; Lin, A.; Wang, L.; Li, Q.; She, D.; Qu, S. Impacts of preseason drought on vegetation spring phenology across the Northeast China transect. Sci. Total Environ. 2020, 738, 140297. [Google Scholar] [CrossRef] [PubMed]
  34. Xin, M.; Zhang, Z.; Han, Y.; Feng, L.; Lei, Y.; Li, X.; Wu, F.; Wang, J.; Wang, Z.; Li, Y. Soybean phenological changes in response to climate warming in three northeastern provinces of China. Field Crops Res. 2023, 302, 109082. [Google Scholar] [CrossRef]
  35. Wu, C.; Hou, X.; Peng, D.; Gonsamo, A.; Xu, S. Land surface phenology of China’s temperate ecosystems over 1999–2013: Spatial–temporal patterns, interaction effects, covariation with climate and implications for productivity. Agric. For. Meteorol. 2016, 216, 177–187. [Google Scholar] [CrossRef]
  36. Yao, R.; Wang, L.; Huang, X.; Guo, X.; Niu, Z.; Liu, H. Investigation of urbanization effects on land surface phenology in Northeast China during 2001–2015. Remote Sens. 2017, 9, 66. [Google Scholar] [CrossRef]
  37. Qiao, D.; Wang, N. Relationship between winter snow cover dynamics, climate and spring grassland vegetation phenology in inner Mongolia, China. ISPRS Int. J. Geo-Inf. 2019, 8, 42. [Google Scholar] [CrossRef]
  38. Sa, C.; Meng, F.; Luo, M.; Li, C.; Wang, M.; Adiya, S.; Bao, Y. Spatiotemporal variation in snow cover and its effects on grassland phenology on the Mongolian Plateau. J. Arid. Land 2021, 13, 332–349. [Google Scholar] [CrossRef]
  39. ESA. Land Cover CCI Product User Guide Version 2. Tech. Rep. 2017. Available online: https://maps.elie.ucl.ac.be/CCI/viewer/download/ESACCI-LC-Ph2-PUGv2_2.0.pdf (accessed on 10 April 2017).
  40. Liu, J.; Kuang, W.; Zhang, Z.; Xu, X.; Qin, Y.; Ning, J.; Zhou, W.; Zhang, S.; Li, R.; Yan, C. Spatiotemporal characteristics, patterns, and causes of land-use changes in China since the late 1980s. J. Geogr. Sci. 2014, 24, 195–210. [Google Scholar] [CrossRef]
  41. Yu, L.; Liu, Y.; Yang, J.; Liu, T.; Bu, K.; Li, G.; Jiao, Y.; Zhang, S. Asymmetric daytime and nighttime surface temperature feedback induced by crop greening across Northeast China. Agric. For. Meteorol. 2022, 325, 109136. [Google Scholar] [CrossRef]
  42. Picard, G.; Quegan, S.; Delbart, N.; Lomas, M.R.; Le Toan, T.; Woodward, F.I. Bud-burst modelling in Siberia and its impact on quantifying the carbon budget. Glob. Chang. Biol. 2005, 11, 2164–2176. [Google Scholar] [CrossRef]
  43. Jiang, L.; Yang, J.; Zhang, C.; Wu, S.; Li, Z.; Dai, L.; Li, X.; Qiu, Y. Daily snow water equivalent product with SMMR, SSM/I and SSMIS from 1980 to 2020 over China. Big Earth Data 2022, 6, 420–434. [Google Scholar]
  44. Hao, X.; Zhao, Q.; Ji, W.; Wang, J.; Li, H. AVHRR-based Snow Phenology Dataset for China (1980–2020). China Sci. Data 2022, 7, 50–59. [Google Scholar]
  45. Gao, B.-C.; Li, R.-R. Quantitative improvement in the estimates of NDVI values from remotely sensed data by correcting thin cirrus scattering effects. Remote Sens. Environ. 2000, 74, 494–502. [Google Scholar] [CrossRef]
  46. Pinzon, J.E.; Tucker, C.J. A non-stationary 1981–2012 AVHRR NDVI3g time series. Remote Sens. 2014, 6, 6929–6960. [Google Scholar]
  47. Jiang, N.; Zhu, W.; Zheng, Z.; Chen, G.; Fan, D. A comparative analysis between GIMMS NDVIg and NDVI3g for monitoring vegetation activity change in the northern hemisphere during 1982–2008. Remote Sens. 2013, 5, 4031–4044. [Google Scholar]
  48. Tian, F.; Fensholt, R.; Verbesselt, J.; Grogan, K.; Horion, S.; Wang, Y. Evaluating temporal consistency of long-term global NDVI datasets for trend analysis. Remote Sens. Environ. 2015, 163, 326–340. [Google Scholar]
  49. Hersbach, H.; Bell, B.; Berrisford, P.; Hirahara, S.; Horányi, A.; Muñoz-Sabater, J. The ERA5 global reanalysis. Q. J. R. Meteorol. Soc. 2020, 146, 1999–2049. [Google Scholar]
  50. Muñoz-Sabater, J.; Dutra, E.; Agustí-Panareda, A.; Albergel, C.; Arduini, G.; Balsamo, G.; Boussetta, S.; Choulga, M.; Harrigan, S.; Hersbach, H. Era5-land: A state-of-the-art global reanalysis dataset for land applications. Earth Syst. Sci. Data 2021, 13, 4349–4383. [Google Scholar]
  51. Wang, X.; Wang, T.; Guo, H.; Liu, D.; Zhao, Y.; Zhang, T.; Liu, Q.; Piao, S. Disentangling the mechanisms behind winter snow impact on vegetation activity in northern ecosystems. Glob. Chang. Biol. 2018, 24, 1651–1662. [Google Scholar]
  52. Wu, Y.; Xiao, P.; Zhang, X.; Liu, H.; Dong, Y.; Feng, L. Effects of snow cover on spring vegetation phenology vary with temperature gradient across the pan-arctic. J. Geophys. Res. Biogeosci. 2023, 128, e2022JG007183. [Google Scholar]
  53. Delbart, N.; Le Toan, T.; Kergoat, L.; Fedotova, V. Remote sensing of spring phenology in boreal regions: A free of snow-effect method using NOAA-AVHRR and Spot-VGT data (1982–2004). Remote Sens. Environ. 2006, 101, 52–62. [Google Scholar] [CrossRef]
  54. Huete, A.; Didan, K.; Miura, T.; Rodriguez, E.P.; Gao, X.; Ferreira, L.G. Overview of the radiometric and biophysical performance of the Modis vegetation indices. Remote Sens. Environ. 2002, 83, 195–213. [Google Scholar] [CrossRef]
  55. Zhang, X. Reconstruction of a complete global time series of daily vegetation index trajectory from long-term AVHRR data. Remote Sens. Environ. 2015, 156, 457–472. [Google Scholar] [CrossRef]
  56. Shen, M.; Zhang, G.; Cong, N.; Wang, S.; Kong, W.; Piao, S. Increasing altitudinal gradient of spring vegetation phenology during the last decade on the Qinghai–Tibetan plateau. Agric. For. Meteorol. 2014, 189, 71–80. [Google Scholar] [CrossRef]
  57. Chen, J.; Jönsson, P.; Tamura, M.; Gu, Z.; Matsushita, B.; Eklundh, L. A simple method for reconstructing a high-quality NDVI time-series dataset based on the Savitzky–Golay filter. Remote Sens. Environ. 2004, 91, 332–344. [Google Scholar] [CrossRef]
  58. Zeng, L.; Wardlow, B.D.; Xiang, D.; Hu, S.; Li, D. A review of vegetation phenological metrics extraction using time-series, multispectral satellite data. Remote Sens. Environ. 2020, 237, 111511. [Google Scholar]
  59. Beck, P.S.; Atzberger, C.; Høgda, K.A.; Johansen, B.; Skidmore, A.K. Improved monitoring of vegetation dynamics at very high latitudes: A new method using MODIS NDVI. Remote Sens. Environ. 2006, 100, 321–334. [Google Scholar] [CrossRef]
  60. Wang, J.; Liu, D.; Ciais, P.; Peñuelas, J. Decreasing rainfall frequency contributes to earlier leaf onset in northern ecosystems. Nat. Clim. Chang. 2022, 12, 386–392. [Google Scholar] [CrossRef]
  61. Wu, C.; Wang, J.; Ciais, P.; Peñuelas, J.; Zhang, X.; Sonnentag, O.; Tian, F.; Wang, X.; Wang, H.; Liu, R. Widespread decline in winds delayed autumn foliar senescence over high latitudes. Proc. Natl. Acad. Sci. USA 2021, 118, e2015821118. [Google Scholar] [CrossRef]
  62. Balzter, H.; Gerard, F.; George, C.; Weedon, G.; Grey, W.; Combal, B.; Bartholomé, E.; Bartalev, S.; Los, S. Coupling of vegetation growing season anomalies and fire activity with hemispheric and regional-scale climate patterns in central and east Siberia. J. Clim. 2007, 20, 3713–3729. [Google Scholar] [CrossRef]
  63. White, M.A.; Thornton, P.E.; Running, S.W. A continental phenology model for monitoring vegetation responses to interannual climatic variability. Glob. Biogeochem. Cycles 1997, 11, 217–234. [Google Scholar] [CrossRef]
  64. Jonsson, P.; Eklundh, L. Seasonality extraction by function fitting to time-series of satellite sensor data. IEEE Trans. Geosci. Remote Sens. 2002, 40, 1824–1832. [Google Scholar] [CrossRef]
  65. Descals, A.; Verger, A.; Yin, G.; Peñuelas, J. Improved estimates of arctic land surface phenology using Sentinel-2 time series. Remote Sens. 2020, 12, 3738. [Google Scholar] [CrossRef]
  66. Theil, H. A rank-invariant method of linear and polynomial regression analysis. Indag. Math. 1950, 12, 173. [Google Scholar]
  67. Hamed, K.H.; Rao, A.R. A modified Mann-Kendall trend test for autocorrelated data. J. Hydrol. 1998, 204, 182–196. [Google Scholar] [CrossRef]
  68. Hu, Y.; Zhang, F.; Luo, Z.; Badreldin, N.; Benoy, G.; Xing, Z. Soil and water conservation effects of different types of vegetation cover on runoff and erosion driven by climate and underlying surface conditions. Catena 2023, 231, 107347. [Google Scholar] [CrossRef]
  69. Wei, W.; Yao, X.; Zhang, Y.; Zhen, Q.; Qin, M.; Tang, Z.; Oosthuizen, M.K.; Zhang, W. Vegetation restoration measures: Increasing plant height suppresses population densities of plateau pikas. Land Degrad. Dev. 2023, 34, 2201–2213. [Google Scholar] [CrossRef]
  70. Fan, Y.; Chen, J.; Shirkey, G.; John, R.; Wu, S.R.; Park, H.; Shao, C. Applications of structural equation modeling (SEM) in ecological studies: An updated review. Ecol. Process. 2016, 5, 19. [Google Scholar] [CrossRef]
  71. Cho, G.; Choi, J.Y. An empirical comparison of generalized structured component analysis and partial least squares path modeling under variance-based structural equation models. Behaviormetrika 2020, 47, 243–272. [Google Scholar] [CrossRef]
  72. Choler, P. Growth response of temperate mountain grasslands to interannual variations in snow cover duration. Biogeosciences 2015, 12, 3885–3897. [Google Scholar] [CrossRef]
  73. Shen, M.; Wang, S.; Jiang, N.; Sun, J.; Cao, R.; Ling, X.; Fang, B.; Zhang, L.; Zhang, L.; Xu, X. Plant phenology changes and drivers on the Qinghai–Tibetan plateau. Nat. Rev. Earth Environ. 2022, 3, 633–651. [Google Scholar] [CrossRef]
  74. Wetzels, M.; Odekerken-Schröder, G.; Van Oppen, C. Using PLS path modeling for assessing hierarchical construct models: Guidelines and Empirical Illustration. MIS Q. 2009, 33, 177–195. [Google Scholar] [CrossRef]
  75. Guo, J.; Hu, Y. Spatiotemporal variations in satellite-derived vegetation phenological parameters in Northeast China. Remote Sens. 2022, 14, 705. [Google Scholar] [CrossRef]
  76. Guo, W.; Liu, H.; Anenkhonov, O.A.; Shangguan, H.; Sandanov, D.V.; Korolyuk, A.Y.; Hu, G.; Wu, X. Vegetation can strongly regulate permafrost degradation at its southern edge through changing surface freeze-thaw processes. Agric. For. Meteorol. 2018, 252, 10–17. [Google Scholar] [CrossRef]
  77. Winkler, R.; Moore, R. Variability in snow accumulation patterns within forest stands on the interior plateau of British Columbia, Canada. Hydrol. Process. 2006, 20, 3683–3695. [Google Scholar] [CrossRef]
  78. Molotch, N.P.; Brooks, P.D.; Burns, S.P.; Litvak, M.; Monson, R.K.; McConnell, J.R.; Musselman, K. Ecohydrological controls on snowmelt partitioning in mixed-conifer sub-alpine forests. Ecohydrology: Ecosystems, Land and Water Process Interactions. Ecohydrogeomorphology 2009, 2, 129–142. [Google Scholar] [CrossRef]
  79. Inouye, D.W. Effects of climate change on phenology, frost damage, and floral abundance of montane wildflowers. Ecology 2008, 89, 353–362. [Google Scholar] [CrossRef]
  80. Bokhorst, S.; Bjerke, J.W.; Street, L.; Callaghan, T.V.; Phoenix, G.K. Impacts of multiple extreme winter warming events on sub-Arctic heathland: Phenology, reproduction, growth, and co2 flux responses. Glob. Chang. Biol. 2011, 17, 2817–2830. [Google Scholar] [CrossRef]
  81. Wipf, S.; Rixen, C.; Mulder, C.P. Advanced snowmelt causes shift towards positive neighbour interactions in a subarctic tundra community. Glob. Chang. Biol. 2006, 12, 1496–1506. [Google Scholar] [CrossRef]
  82. Bjorkman, A.D.; Elmendorf, S.C.; Beamish, A.L.; Vellend, M.; Henry, G.H. Contrasting effects of warming and increased snowfall on arctic tundra plant phenology over the past two decades. Glob. Chang. Biol. 2015, 21, 4651–4661. [Google Scholar] [CrossRef]
  83. Jiao, W.; Wang, L.; Smith, W.K.; Chang, Q.; Wang, H.; D’Odorico, P. Observed increasing water constraint on vegetation growth over the last three decades. Nat. Commun. 2021, 12, 3777. [Google Scholar] [CrossRef]
  84. Olpenda, A.S.; Stereńczak, K.; Będkowski, K. Modeling solar radiation in the forest using remote sensing data: A review of approaches and opportunities. Remote Sensing 2018, 10, 694. [Google Scholar] [CrossRef]
  85. Qi, Y.; Wang, H.; Ma, X.; Zhang, J.; Yang, R. Relationship between vegetation phenology and snow cover changes during 2001–2018 in the Qilian mountains. Ecol. Indic. 2021, 133, 108351. [Google Scholar] [CrossRef]
  86. Zheng, J.; Jia, G.; Xu, X. Earlier snowmelt predominates advanced spring vegetation greenup in Alaska. Agric. For. Meteorol. 2022, 315, 108828. [Google Scholar] [CrossRef]
  87. Fu, Y.; Li, X.; Zhou, X.; Geng, X.; Guo, Y.; Zhang, Y. Progress in plant phenology modeling under global climate change. Sci. China Earth Sci. 2020, 63, 1237–1247. [Google Scholar] [CrossRef]
  88. Borner, A.P.; Kielland, K.; Walker, M.D. Effects of simulated climate change on plant phenology and nitrogen mineralization in Alaskan arctic tundra. Arct. Antarct. Alp. Res. 2008, 40, 27–38. [Google Scholar] [CrossRef]
  89. Magnani, A.; Viglietti, D.; Godone, D.; Williams, M.W.; Balestrini, R.; Freppaz, M. Interannual variability of soil n and c forms in response to snow—Cover duration and pedoclimatic conditions in alpine tundra, northwest Italy. Arct. Antarct. Alp. Res. 2017, 49, 227–242. [Google Scholar] [CrossRef]
  90. Doktor, D.; Bondeau, A.; Koslowski, D.; Badeck, F.-W. Influence of heterogeneous landscapes on computed green-up dates based on daily AVHRR NDVI observations. Remote Sens. Environ. 2009, 113, 2618–2632. [Google Scholar] [CrossRef]
  91. Yang, Y.; Ren, W.; Tao, B.; Ji, L.; Liang, L.; Ruane, A.C.; Fisher, J.B.; Liu, J.; Sama, M.; Li, Z. Characterizing spatiotemporal patterns of crop phenology across North America during 2000–2016 using satellite imagery and agricultural survey data. ISPRS J. Photogramm. Remote Sens. 2020, 170, 156–173. [Google Scholar] [CrossRef]
  92. Shen, Y.; Zhang, X.; Yang, Z. Mapping corn and soybean phenometrics at field scales over the United States Corn Belt by fusing time series of Landsat 8 and Sentinel-2 data with VIIRS data. ISPRS J. Photogramm. Remote Sens. 2022, 186, 55–69. [Google Scholar] [CrossRef]
  93. Pan, Y.; Peng, D.; Chen, J.M.; Myneni, R.B.; Zhang, X.; Huete, A.R.; Fu, Y.H.; Zheng, S.; Yan, K.; Yu, L. Climate-driven land surface phenology advance is overestimated due to ignoring land cover changes. Environ. Res. Lett. 2023, 18, 044045. [Google Scholar] [CrossRef]
  94. Zhang, X.; Liu, L.; Henebry, G.M. Impacts of land cover and land use change on long-term trend of land surface phenology: A case study in agricultural ecosystems. Environ. Res. Lett. 2019, 14, 044020. [Google Scholar] [CrossRef]
  95. Wang, J.; Zhang, X.; Rodman, K. Land cover composition, climate, and topography drive land surface phenology in a recently burned landscape: An application of machine learning in phenological modeling. Agric. For. Meteorol. 2021, 304, 108432. [Google Scholar] [CrossRef]
Figure 1. Location of Northeast China and the spatial distribution of mountains, plains, and the four major vegetation types, i.e., deciduous broadleaf forest, deciduous coniferous forest, grassland, and rainfed cropland.
Remotesensing 15 04783 g001
Figure 2. Schematic diagram of the effect path of snow cover on SOS, i.e., ① Snow → SM → SOS (“moisture effect”), ② Snow → ST → SOS (“temperature effect”), and ③ Snow → ST → SM → SOS (“moisture effect”). SNOW, as a latent variable, includes three manifest variables: SCD, SCED, and SWEmax; SM is soil moisture; and ST is soil temperature.
Remotesensing 15 04783 g002
Figure 3. Spatial distributions of the annual mean and trends of snow indicators from 1982 to 2015 across Northeast China. First row: spatial distributions of the annual mean in (a) SCD, (b) SCED, and (c) SWEmax; second row: spatial distributions of annual trends in (d) SCD, (e) SCED, and (f) SWEmax.
Remotesensing 15 04783 g003
Figure 4. Spatial distributions of the annual mean (a) and trend (b) of SOS from 1982 to 2015 across Northeast China.
Remotesensing 15 04783 g004
Figure 5. Partial correlation coefficient between SCD and SOS (a), SCED and SOS (b), and SCD and SWEmax (c) in Northeast China. Only the pixels where p values were less than 0.05 were retained.
Remotesensing 15 04783 g005
Figure 6. Importance of snow cover indicators and climate factors affecting SOS variations. (a) Spatial distribution of determination coefficients (R2), and (b) spatial distribution of the most important snow cover indicators influencing SOS. Only the pixels where p values were less than 0.05 were retained. PRE refers to precipitation and TEM refers to temperature. The bar plot indicates the distribution of R2 intervals across various factors.
Remotesensing 15 04783 g006
Figure 7. Path diagrams and path effects in (a) deciduous broadleaf forest, (b) deciduous coniferous forest, (c) grassland, and (d) rainfed cropland.
Remotesensing 15 04783 g007
Table 1. Proportion of area significantly correlated with snow cover indicators and SOS in different vegetation types (p < 0.05); the proportion of pixels with p values greater than 0.05 are in parentheses.
Snow CoverSCD (%)SCED (%)SWEmax (%)
Vegetations PositiveNegativePositiveNegativePositiveNegative
Deciduous broadleaf forest1.43 (17.09)0.58 (19.08)3.64 (23.89)0.44 (10.17)1.64 (20.91)0.69 (13.90)
Deciduous coniferousforest3.40 (14.71)0.27 (3.00)8.04 (9.03)0.24 (4.06)0.46 (9.64)0.36 (10.06)
Grassland0.43 (7.52)2.45 (13.13)0.77 (7.31)2.63 (12.78)0.56 (10.25)1.01 (11.10)
Rainfed cropland0.93 (14.28)2.79 (22.65)1.20 (16.55)3.25 (19.53)0.98 (20.23)0.93 (17.77)
Table 2. The proportion of the area significantly affected by snow cover indicators and climate factors on SOS in different vegetation types. Only the pixels where p values were less than 0.05 were retained.
Impact FactorsSCD (%)SCED (%)SWEmax (%)PRE (%)TEM (%)
Vegetations
Deciduous broadleaf forest1.173.972.123.210.81
Deciduous coniferous forest1.358.430.210.340.10
Grassland0.911.850.980.381.42
Rainfed cropland1.703.361.513.541.86
Total5.1417.624.827.474.18
Disclaimer/Publisher’s Note: The statements, opinions and data contained in all publications are solely those of the individual author(s) and contributor(s) and not of MDPI and/or the editor(s). MDPI and/or the editor(s) disclaim responsibility for any injury to people or property resulting from any ideas, methods, instructions or products referred to in the content.

